

Study on the Mass Concentration Distributions of Marine Microplastics in Estuaries and Coastal Areas

Abstract
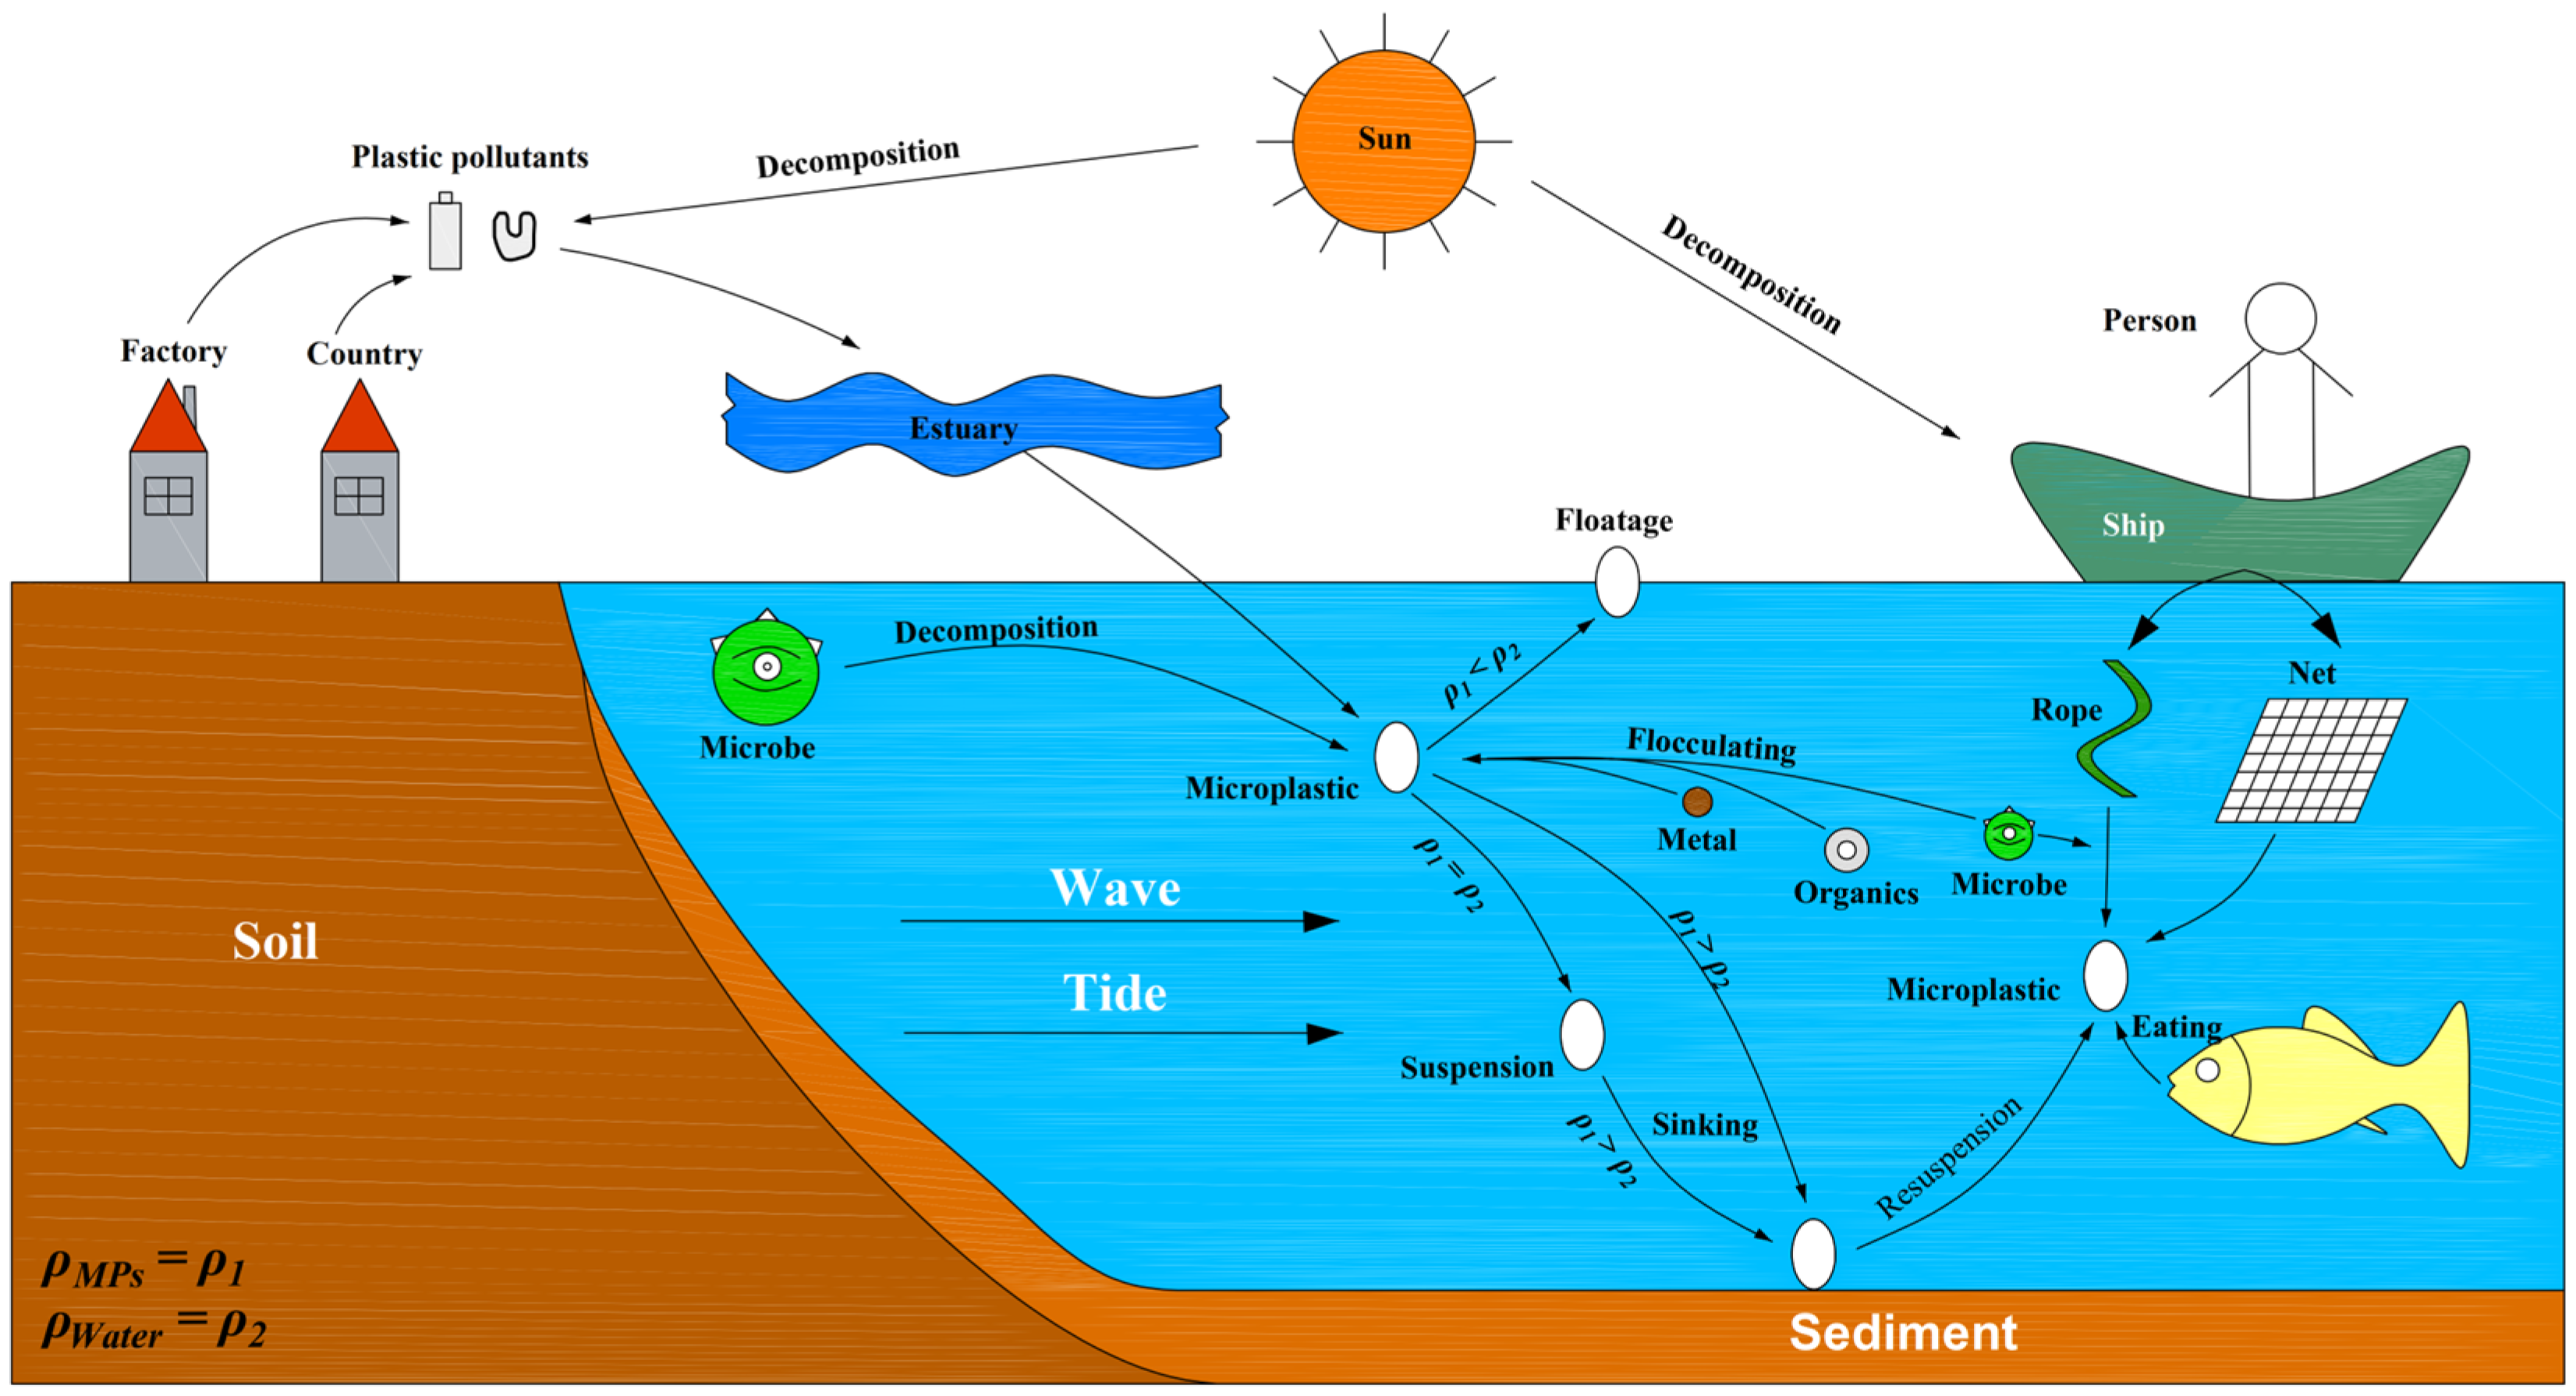
1. Introduction
2. Data Collection and Calculation Methods
3. Mass Concentration Distributions of Marine Microplastics
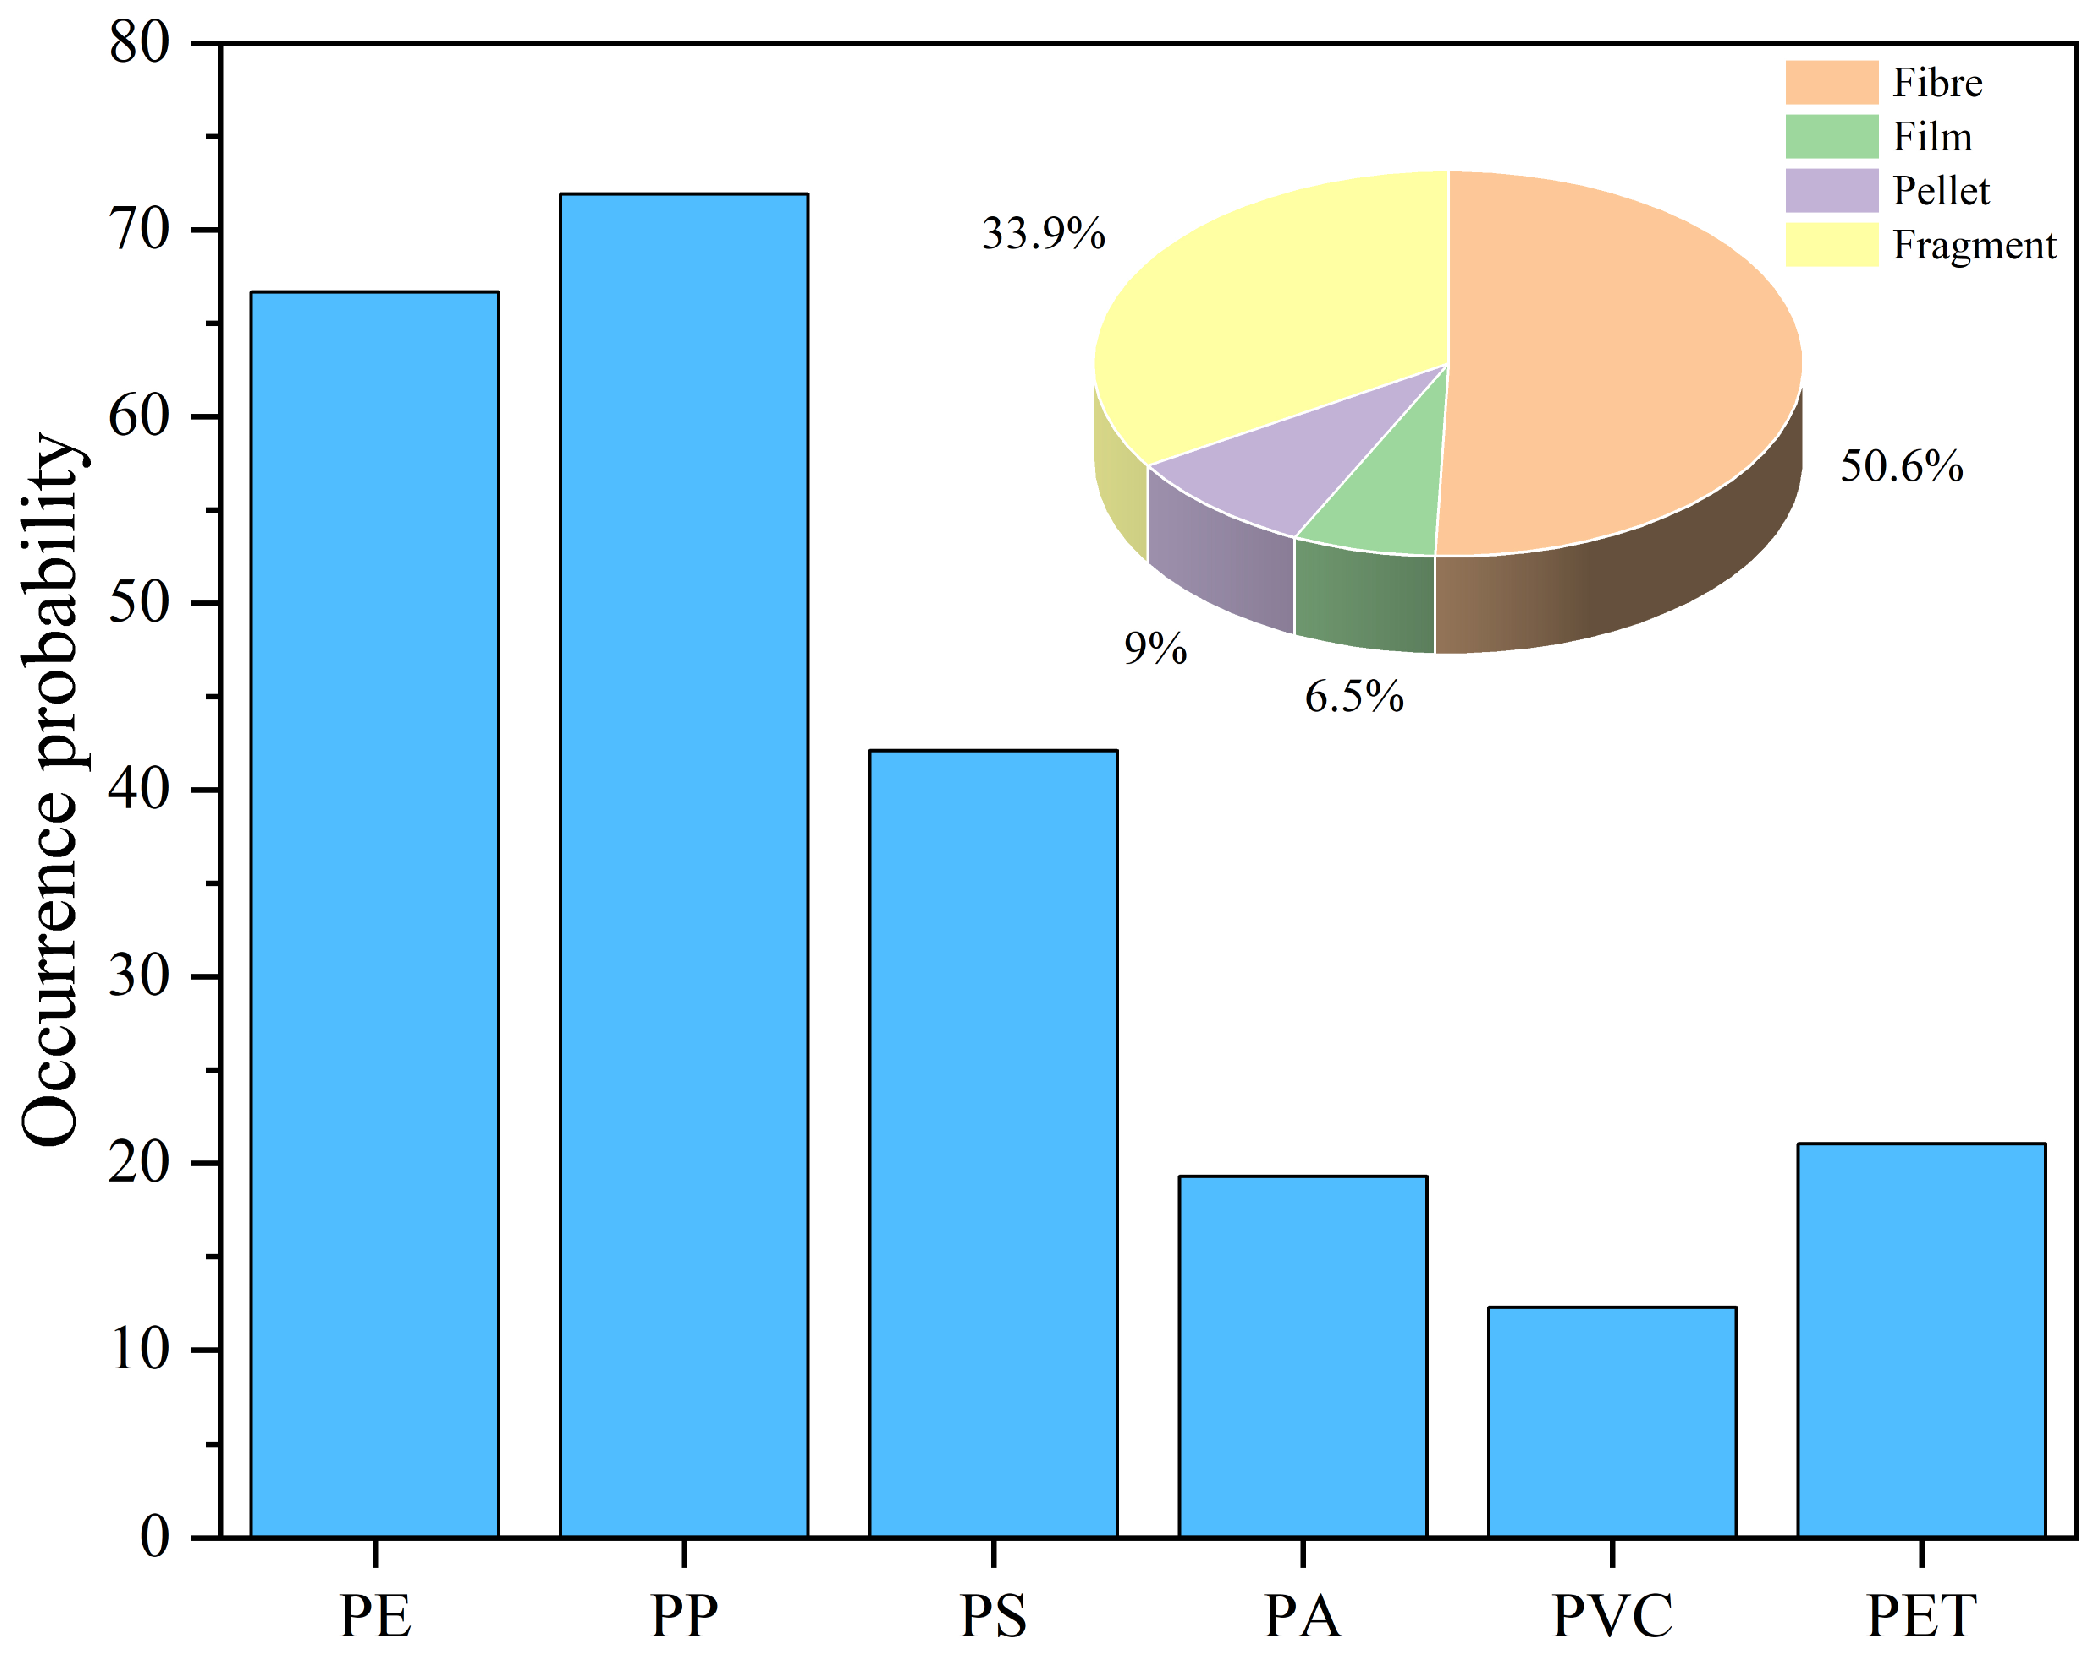
3.1. Shapes of Marine Microplastics
3.2. Material Compositions of Marine Microplastics
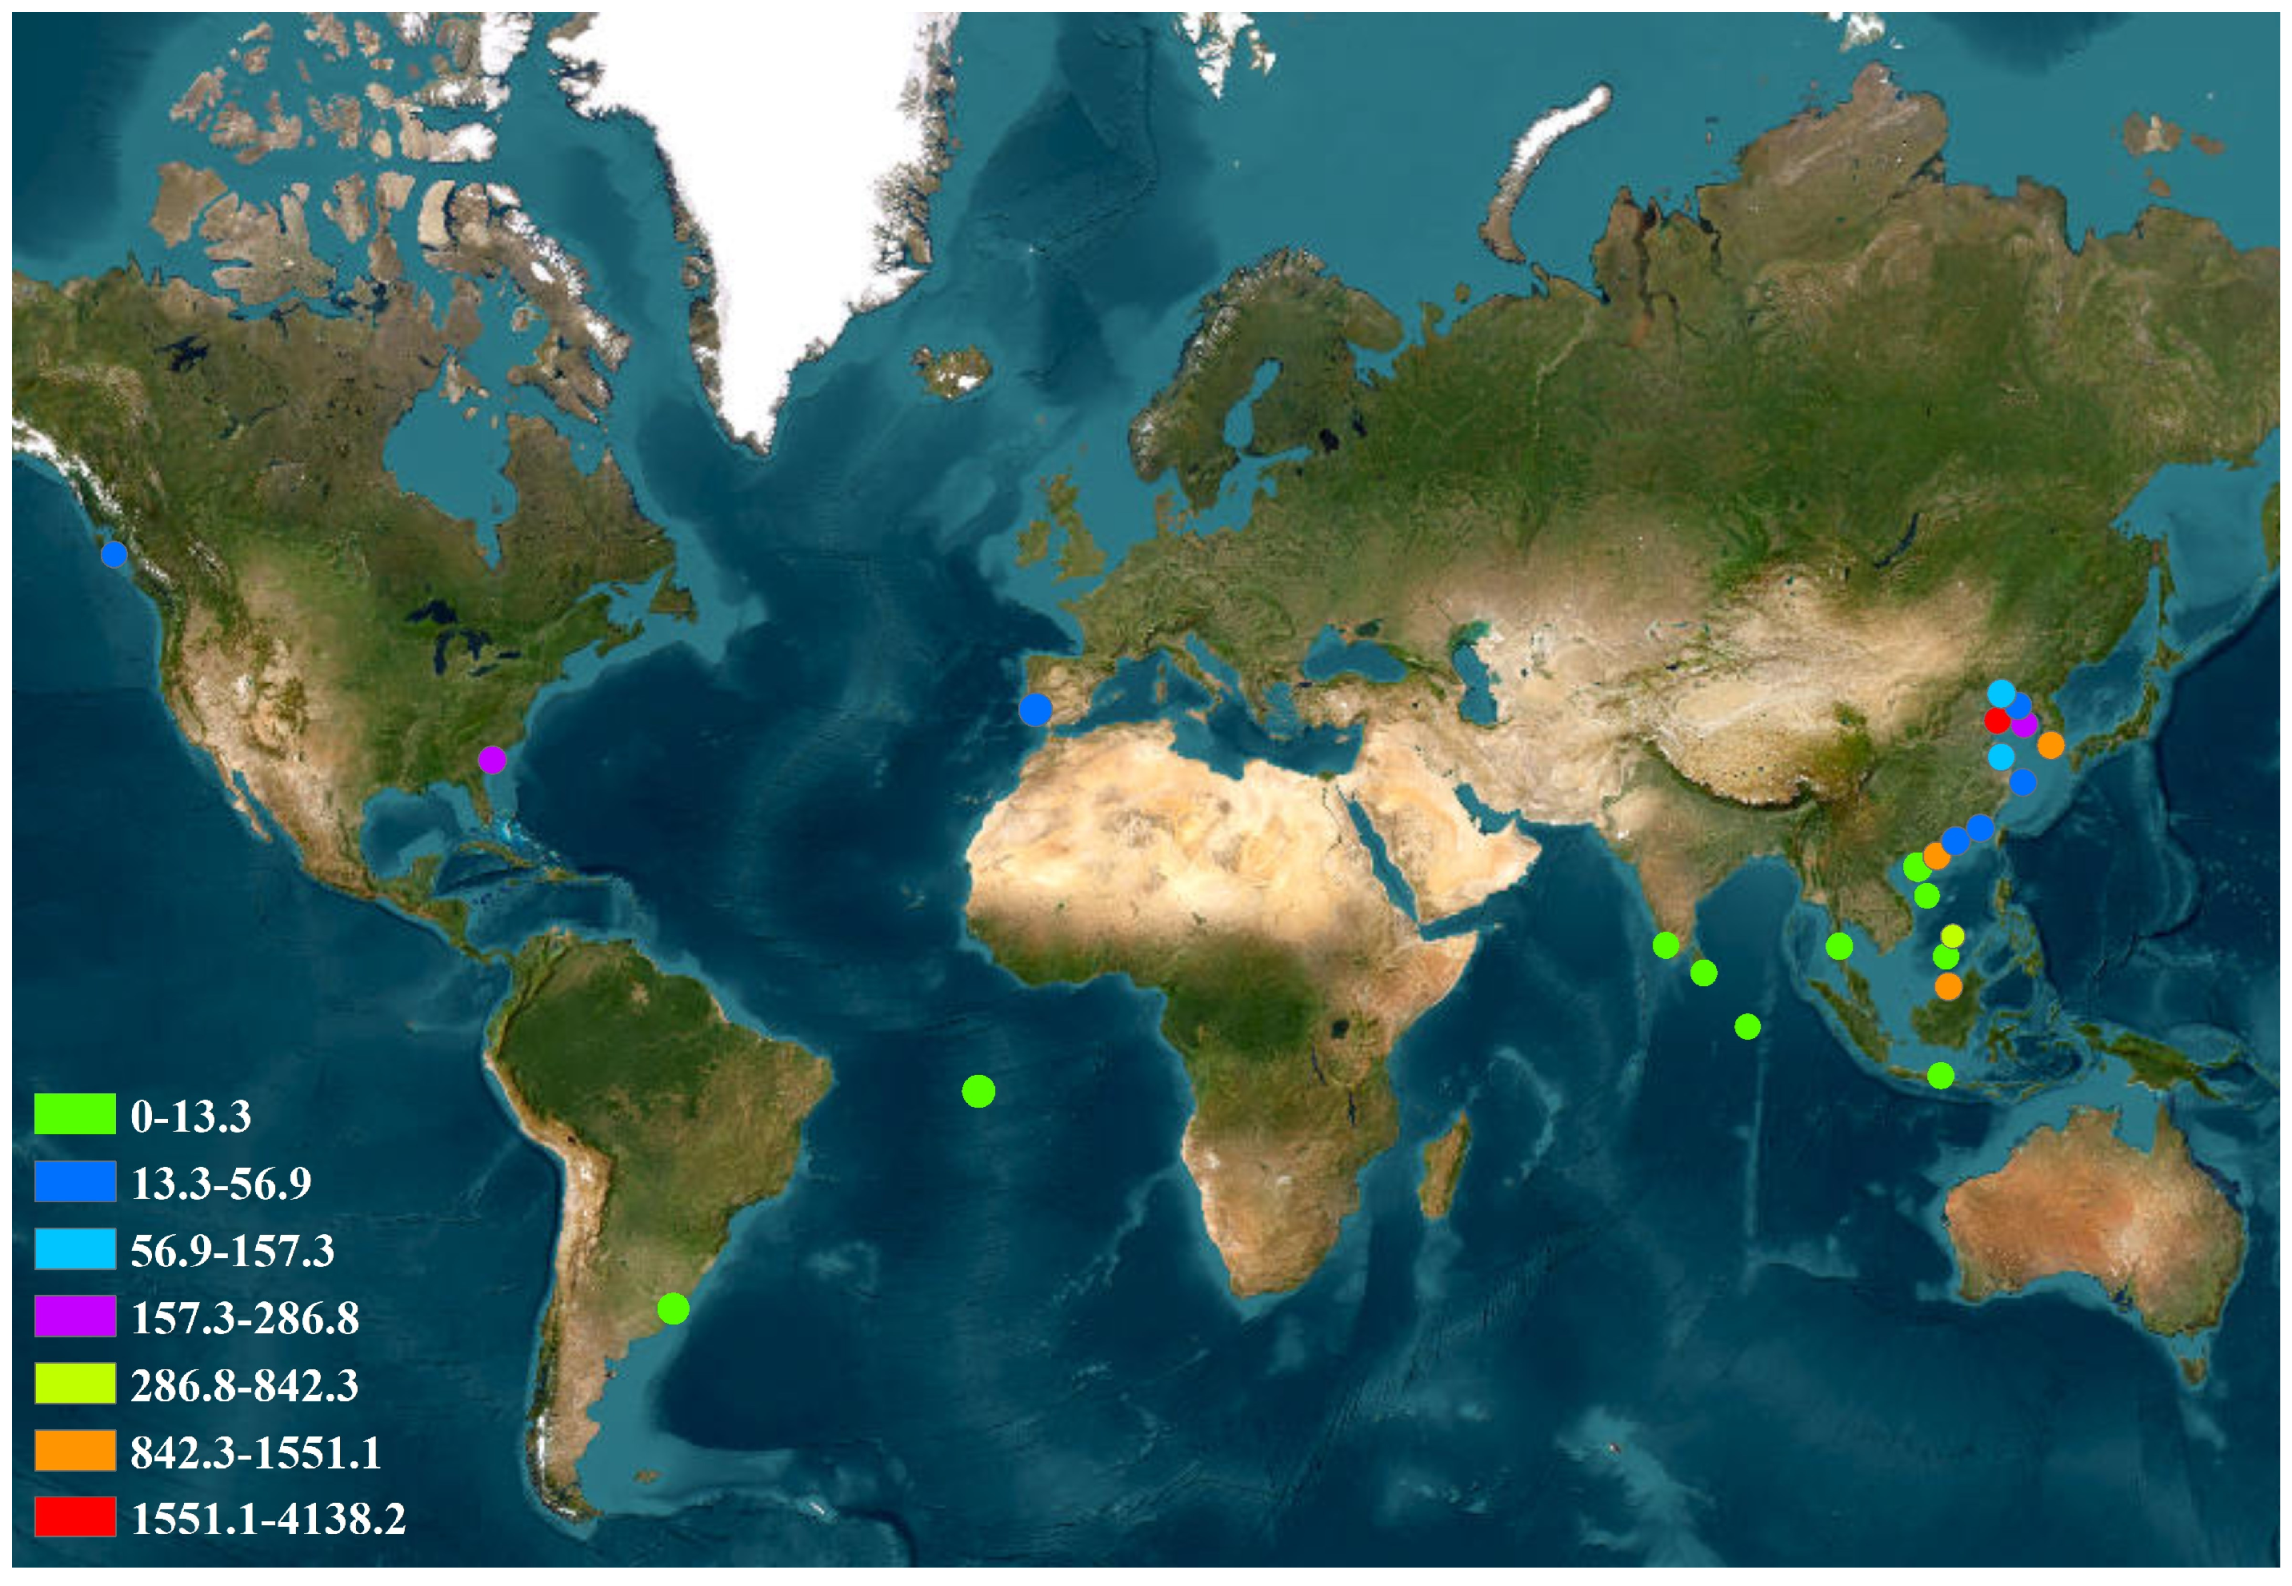
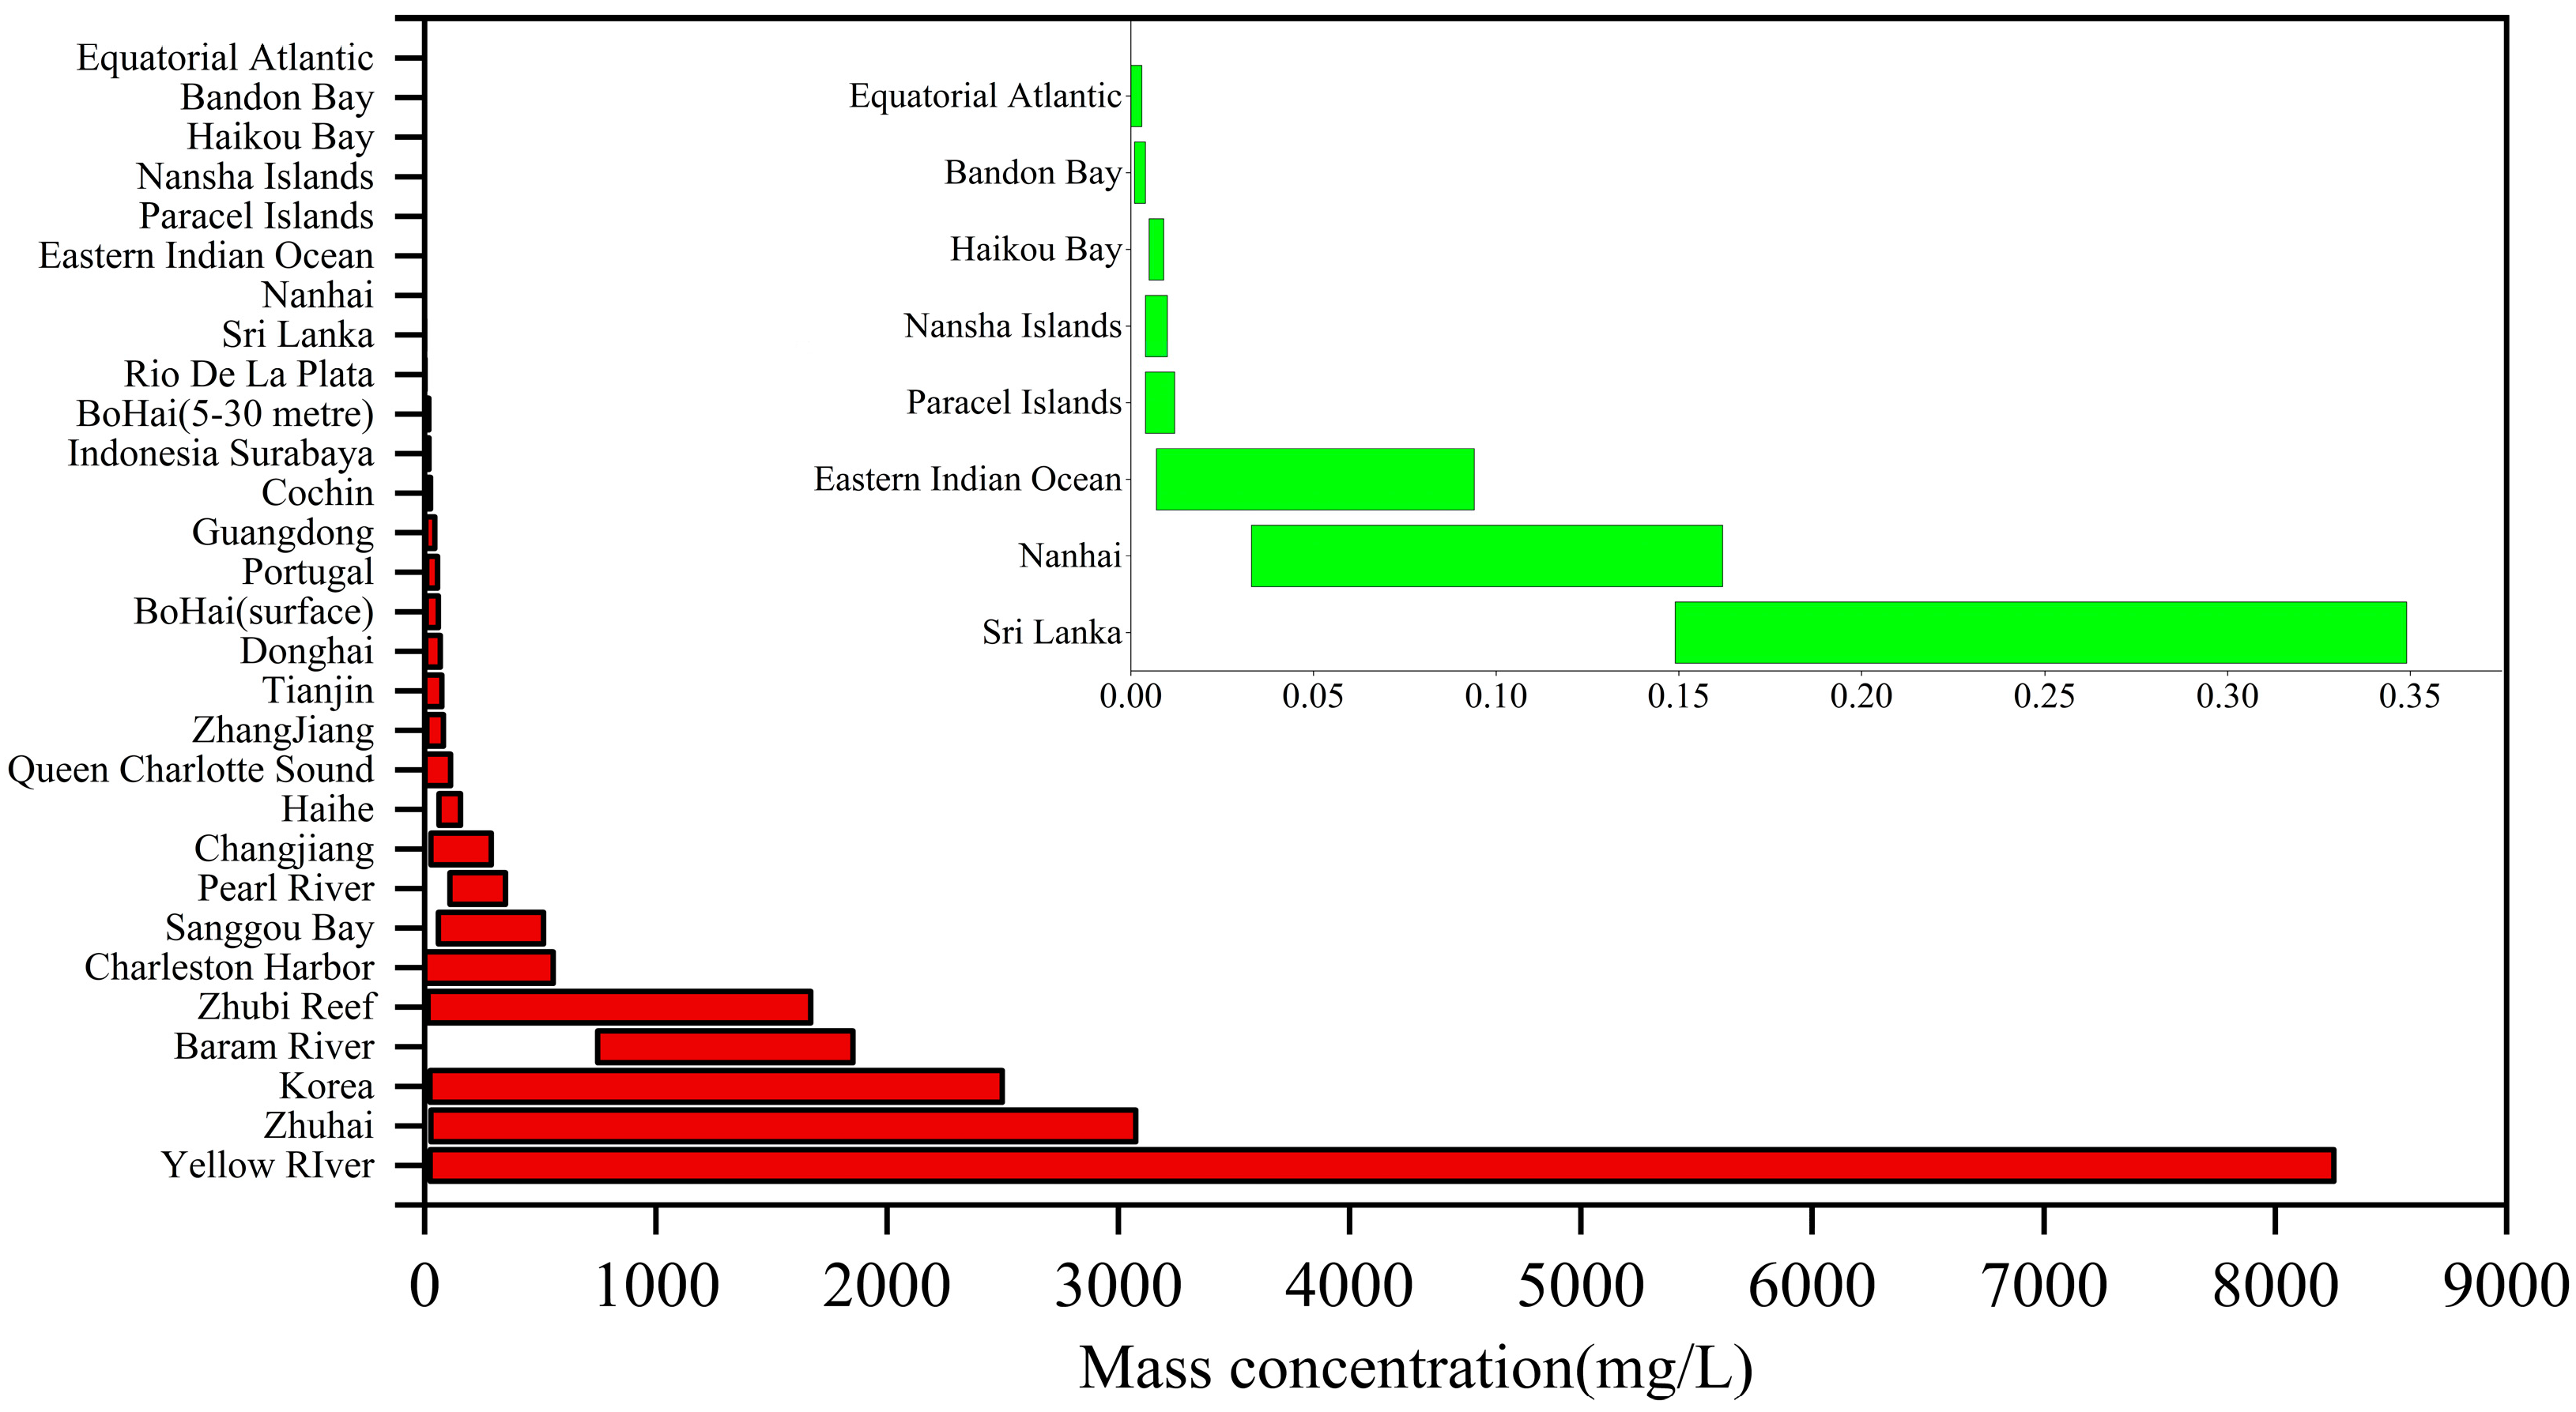
3.3. Mass Concentrations of Marine Microplastics
4. Discussion
5. Conclusions
Author Contributions
Funding
Data Availability Statement
Conflicts of Interest
References
- Jambeck, J.R.; Geyer, R.; Wilcox, C.; Siegler, T.R.; Perryman, M.; Andrady, A.; Narayan, R.; Law, K.L. Plastic waste inputs from land into the ocean. Science 2015, 347, 768–771. [Google Scholar] [CrossRef] [PubMed]
- Lu, Y.; Zhang, Y.; Deng, Y.; Jiang, W.; Zhao, Y.; Geng, J.; Ding, L.; Ren, H.-Q. Uptake and Accumulation of Polystyrene Microplastics in Zebrafish (Danio rerio) and Toxic Effects in Liver. Environ. Sci. Technol. 2016, 50, 4054–4060. [Google Scholar] [CrossRef] [PubMed]
- Guzzetti, E.; Sureda, A.; Tejada, S.; Faggio, C. Microplastic in marine organism: Environmental and toxicological effects. Environ. Toxicol. Pharmacol. 2018, 64, 164–171. [Google Scholar] [CrossRef] [PubMed]
- Wang, W.; Gao, H.; Jin, S.; Li, R.; Na, G. The ecotoxicological effects of microplastics on aquatic food web, from primary producer to human: A review. Ecotoxicol. Environ. Saf. 2019, 173, 110–117. [Google Scholar] [CrossRef]
- Abbasi, S.; Moore, F.; Keshavarzi, B.; Hopke, P.K.; Naidu, R.; Rahman, M.M.; Oleszczuk, P.; Karimi, J. PET-microplastics as a vector for heavy metals in a simulated plant rhizosphere zone. Sci. Total Environ. 2020, 744, 140984. [Google Scholar] [CrossRef]
- Carbery, M.; O’Connor, W.; Palanisami, T. Trophic transfer of microplastics and mixed contaminants in the marine food web and implications for human health. Environ. Int. 2018, 115, 400–409. [Google Scholar] [CrossRef]
- Andrady, A.L. Microplastics in the marine environment. Mar. Pollut. Bull. 2011, 62, 1596–1605. [Google Scholar] [CrossRef]
- Choy, C.A.; Robison, B.H.; Gagne, T.O.; Erwin, B.; Firl, E.; Halden, R.U.; Hamilton, J.A.; Katija, K.; Lisin, S.E.; Rolsky, C.; et al. The vertical distribution and biological transport of marine microplastics across the epipelagic and mesopelagic water column. Sci. Rep. 2019, 9, 7843. [Google Scholar] [CrossRef]
- Zhao, S.; Zhu, L.; Wang, T.; Li, D. Suspended microplastics in the surface water of the Yangtze Estuary System, China: First observations on occurrence, distribution. Mar. Pollut. Bull. 2014, 86, 562–568. [Google Scholar] [CrossRef]
- Zhao, S.; Zhu, L.; Li, D. Microplastic in three urban estuaries, China. Environ. Pollut. 2015, 206, 597–604. [Google Scholar] [CrossRef]
- Han, M.; Niu, X.; Tang, M.; Zhang, B.-T.; Wang, G.; Yue, W.; Kong, X.; Zhu, J. Distribution of microplastics in surface water of the lower Yellow River near estuary. Sci. Total Environ. 2020, 707, 135601. [Google Scholar] [CrossRef] [PubMed]
- Yan, M.; Nie, H.; Xu, K.; He, Y.; Hu, Y.; Huang, Y.; Wang, J. Microplastic abundance, distribution and composition in the Pearl River along Guangzhou city and Pearl River estuary, China. Chemosphere 2019, 217, 879–886. [Google Scholar] [CrossRef] [PubMed]
- Wu, N.; Zhang, Y.; Zhang, X.; Zhao, Z.; He, J.; Li, W.; Ma, Y.; Niu, Z. Occurrence and distribution of microplastics in the surface water and sediment of two typical estuaries in Bohai Bay, China. Environ. Sci. Process. Impacts 2019, 21, 1143–1152. [Google Scholar] [CrossRef] [PubMed]
- Hitchcock, J.N.; Mitrovic, S.M. Microplastic pollution in estuaries across a gradient of human impact. Environ. Pollut. 2019, 247, 457–466. [Google Scholar] [CrossRef]
- Choong, W.S.; Hadibarata, T.; Yuniarto, A.; Tang, K.H.D.; Abdullah, F.; Syafrudin, M.; Al Farraj, D.A.; Al-Mohaimeed, A.M. Characterization of microplastics in the water and sediment of Baram River estuary, Borneo Island. Mar. Pollut. Bull. 2021, 172, 112880. [Google Scholar] [CrossRef]
- Taha, Z.D.; Amin, R.M.; Anuar, S.T.; Nasser, A.A.A.; Sohaimi, E.S. Microplastics in seawater and zooplankton: A case study from Terengganu estuary and offshore waters, Malaysia. Sci. Total Environ. 2021, 786, 147466. [Google Scholar] [CrossRef]
- Bai, L.; Liu, X.; Chen, Y.; Tu, J.; Chen, H. Current status of microplastics pollution in Tianjin coastal waters. Environ. Chem. 2020, 39, 1161–1168. [Google Scholar] [CrossRef]
- Tang, G.; Liu, M.; Zhou, Q.; He, H.; Chen, K.; Zhang, H.; Hu, J.; Huang, Q.; Luo, Y.; Ke, H.; et al. Microplastics and polycyclic aromatic hydrocarbons (PAHs) in Xiamen coastal areas: Implications for anthropogenic impacts. Sci. Total Environ. 2018, 634, 811–820. [Google Scholar] [CrossRef]
- Zhang, C.; Wang, S.; Sun, D.; Pan, Z.; Zhou, A.; Xie, S.; Wang, J.; Zou, J. Microplastic pollution in surface water from east coastal areas of Guangdong, South China and preliminary study on microplastics biomonitoring using two marine fish. Chemosphere 2020, 256, 127202. [Google Scholar] [CrossRef]
- Song, Y.K.; Hong, S.H.; Jang, M.; Kang, J.-H.; Kwon, O.Y.; Han, G.M.; Shim, W.J. Large Accumulation of Micro-sized Synthetic Polymer Particles in the Sea Surface Microlayer. Environ. Sci. Technol. 2014, 48, 9014–9021. [Google Scholar] [CrossRef]
- Rodrigues, S.; Almeida, C.M.R.; Ramos, S. Microplastics contamination along the coastal waters of NW Portugal. Case Stud. Chem. Environ. Eng. 2020, 2, 100056. [Google Scholar] [CrossRef]
- Li, C. A Study on the Distribution, Source to Sink and Ecological Risk Assessment of Microplastics in Water Bodies of the South China Sea and Eastern Indian Ocean; East China Normal University: Shanghai, China, 2022. [Google Scholar]
- Ivar do Sul, J.A.; Costa, M.F.; Barletta, M.; Cysneiros, F. Pelagic microplastics around an archipelago of the Equatorial Atlantic. Mar. Pollut. Bull. 2013, 75, 305–309. [Google Scholar] [CrossRef] [PubMed]
- Isobe, A.; Uchiyama-Matsumoto, K.; Uchida, K.; Tokai, T. Microplastics in the Southern Ocean. Mar. Pollut. Bull. 2017, 114, 623–626. [Google Scholar] [CrossRef] [PubMed]
- Liu, M.; Ding, Y.; Huang, P.; Zheng, H.; Wang, W.; Ke, H.; Chen, F.; Liu, L.; Cai, M. Microplastics in the western Pacific and South China Sea: Spatial variations reveal the impact of Kuroshio intrusion. Environ. Pollut. 2021, 288, 117745. [Google Scholar] [CrossRef]
- Sun, C.; Ding, J.; Gao, F. Methods for microplastic sampling and analysis in the seawater and fresh water environment. Methods Enzymol. 2021, 648, 27–45. [Google Scholar] [CrossRef]
- Cózar, A.; Echevarría, F.; González-Gordillo, J.I.; Irigoien, X.; Úbeda, B.; Hernández-León, S.; Palma, Á.T.; Navarro, S.; García-De-Lomas, J.; Ruiz, A.; et al. Plastic debris in the open ocean. Proc. Natl. Acad. Sci. USA 2014, 111, 10239–10244. [Google Scholar] [CrossRef]
- Simon, M.; van Alst, N.; Vollertsen, J. Quantification of microplastic mass and removal rates at wastewater treatment plants applying Focal Plane Array (FPA)-based Fourier Transform Infrared (FT-IR) imaging. Water Res. 2018, 142, 1–9. [Google Scholar] [CrossRef]
- Isobe, A.; Iwasaki, S.; Uchida, K.; Tokai, T. Abundance of non-conservative microplastics in the upper ocean from 1957 to 2066. Nat. Commun. 2019, 10, 417. [Google Scholar] [CrossRef]
- Leusch, F.D.; Ziajahromi, S. Converting mg/L to Particles/L: Reconciling the Occurrence and Toxicity Literature on Microplastics. Environ. Sci. Technol. 2021, 55, 11470–11472. [Google Scholar] [CrossRef]
- Chen, Q.; Yang, Y.; Qi, H.; Su, L.; Zuo, C.; Shen, X.; Chu, W.; Li, F.; Shi, H. Rapid Mass Conversion for Environmental Microplastics of Diverse Shapes. Environ. Sci. Technol. 2023, 58, 10776–10785. [Google Scholar] [CrossRef]
- Dai, Z. The Distribution of Microplastics in the Bohai Sea and Its Influencing Factors; University of Chinese Academy of Sciences: Yantai, China, 2018. [Google Scholar]
- Xia, B.; Sui, Q.; Sun, X.; Zhu, L.; Wang, R.; Cai, M.; Chen, B.; Qu, K. Microplastic pollution in surface seawater of Sanggou Bay, China: Occurrence, source and inventory. Mar. Pollut. Bull. 2021, 162, 111899. [Google Scholar] [CrossRef] [PubMed]
- Cai, M.; He, H.; Liu, M.; Li, S.; Tang, G.; Wang, W.; Huang, P.; Wei, G.; Lin, Y.; Chen, B.; et al. Lost but can’t be neglected: Huge quantities of small microplastics hide in the South China Sea. Sci. Total Environ. 2018, 633, 1206–1216. [Google Scholar] [CrossRef] [PubMed]
- Pan, Z.; Sun, Y.; Liu, Q.; Lin, C.; Sun, X.; He, Q.; Zhou, K.; Lin, H. Riverine microplastic pollution matters: A case study in the Zhangjiang River of Southeastern China. Mar. Pollut. Bull. 2020, 159, 111516. [Google Scholar] [CrossRef] [PubMed]
- Wang, D.; Su, L.; Ruan, H.D.; Chen, J.; Lu, J.; Lee, C.-H.; Jiang, S.Y. Quantitative and qualitative determination of microplastics in oyster, seawater and sediment from the coastal areas in Zhuhai, China. Mar. Pollut. Bull. 2021, 164, 112000. [Google Scholar] [CrossRef]
- Luo, W.; Su, L.; Craig, N.J.; Du, F.; Wu, C.; Shi, H. Comparison of microplastic pollution in different water bodies from urban creeks to coastal waters. Environ. Pollut. 2019, 246, 174–182. [Google Scholar] [CrossRef]
- Li, C.; Wang, X.; Liu, K.; Zhu, L.; Wei, N.; Zong, C.; Li, D. Pelagic microplastics in surface water of the Eastern Indian Ocean during monsoon transition period: Abundance, distribution, and characteristics. Sci. Total Environ. 2021, 755, 142629. [Google Scholar] [CrossRef]
- Li, C.; Zhu, L.; Wang, X.; Liu, K.; Li, D. Cross-oceanic distribution and origin of microplastics in the subsurface water of the South China Sea and Eastern Indian Ocean. Sci. Total Environ. 2022, 805, 150243. [Google Scholar] [CrossRef]
- Tsang, Y.; Mak, C.; Liebich, C.; Lam, S.; Sze, E.T.-P.; Chan, K. Microplastic pollution in the marine waters and sediments of Hong Kong. Mar. Pollut. Bull. 2017, 115, 20–28. [Google Scholar] [CrossRef]
- Huang, Y.; Yan, M.; Xu, K.; Nie, H.; Gong, H.; Wang, J. Distribution characteristics of microplastics in Zhubi Reef from South China Sea. Environ. Pollut. 2019, 255, 113133. [Google Scholar] [CrossRef]
- Qi, H.; Fu, D.; Wang, Z.; Gao, M.; Peng, L. Microplastics occurrence and spatial distribution in seawater and sediment of Haikou Bay in the northern South China Sea. Estuar. Coast. Shelf Sci. 2020, 239, 106757. [Google Scholar] [CrossRef]
- Nie, H.; Wang, J.; Xu, K.; Huang, Y.; Yan, M. Microplastic pollution in water and fish samples around Nanxun Reef in Nansha Islands, South China Sea. Sci. Total Environ. 2019, 696, 134022. [Google Scholar] [CrossRef] [PubMed]
- Huang, L.; Li, Q.; Xu, X.; Yuan, X.; Lin, L.; Li, H. Composition and distribution of microplastics in the surface seawater of Xisha Islands. Chin. Sci. Bull. 2020, 65, 2627–2635. [Google Scholar] [CrossRef]
- Tan, F.; Yang, H.; Xu, X.; Fang, Z.; Xu, H.; Shi, Q.; Zhang, X.; Wang, G.; Lin, L.; Zhou, S.; et al. Microplastic pollution around remote uninhabited coral reefs of Nansha Islands, South China Sea. Sci. Total Environ. 2020, 725, 138383. [Google Scholar] [CrossRef]
- Sun, X.; Liang, J.; Zhu, M.; Zhao, Y.; Zhang, B. Microplastics in seawater and zooplankton from the Yellow Sea. Environ. Pollut. 2018, 242, 585–595. [Google Scholar] [CrossRef]
- Lechner, A.; Keckeis, H.; Lumesberger-Loisl, F.; Zens, B.; Krusch, R.; Tritthart, M.; Glas, M.; Schludermann, E. The Danube so colourful: A potpourri of plastic litter outnumbers fish larvae in Europe’s second largest river. Environ. Pollut. 2014, 188, 177–181. [Google Scholar] [CrossRef]
- Sadri, S.S.; Thompson, R.C. On the quantity and composition of floating plastic debris entering and leaving the Tamar Estuary, Southwest England. Mar. Pollut. Bull. 2014, 81, 55–60. [Google Scholar] [CrossRef]
- Lima, A.; Costa, M.; Barletta, M. Distribution patterns of microplastics within the plankton of a tropical estuary. Environ. Res. 2014, 132, 146–155. [Google Scholar] [CrossRef]
- Collignon, A.; Hecq, J.-H.; Galgani, F.; Collard, F.; Goffart, A. Annual variation in neustonic micro- and meso-plastic particles and zooplankton in the Bay of Calvi (Mediterranean–Corsica). Mar. Pollut. Bull. 2014, 79, 293–298. [Google Scholar] [CrossRef]
- van der Hal, N.; Ariel, A.; Angel, D.L. Exceptionally high abundances of microplastics in the oligotrophic Israeli Mediterranean coastal waters. Mar. Pollut. Bull. 2017, 116, 151–155. [Google Scholar] [CrossRef]
- Collignon, A.; Hecq, J.-H.; Glagani, F.; Voisin, P.; Collard, F.; Goffart, A. Neustonic microplastic and zooplankton in the North Western Mediterranean Sea. Mar. Pollut. Bull. 2012, 64, 861–864. [Google Scholar] [CrossRef]
- Dubaish, F.; Liebezeit, G. Suspended Microplastics and Black Carbon Particles in the Jade System, Southern North Sea. Water Air Soil Pollut. 2013, 224, 1352. [Google Scholar] [CrossRef]
- Desforges, J.-P.W.; Galbraith, M.; Dangerfield, N.; Ross, P.S. Widespread distribution of microplastics in subsurface seawater in the NE Pacific Ocean. Mar. Pollut. Bull. 2014, 79, 94–99. [Google Scholar] [CrossRef] [PubMed]
- Cole, M.; Webb, H.; Lindeque, P.K.; Fileman, E.S.; Halsband, C.; Galloway, T.S. Isolation of microplastics in biota-rich seawater samples and marine organisms. Sci. Rep. 2014, 4, 4528. [Google Scholar] [CrossRef] [PubMed]
- de Lucia, G.A.; Caliani, I.; Marra, S.; Camedda, A.; Coppa, S.; Alcaro, L.; Campani, T.; Giannetti, M.; Coppola, D.; Cicero, A.M.; et al. Amount and distribution of neustonic micro-plastic off the western Sardinian coast (Central-Western Mediterranean Sea). Mar. Environ. Res. 2014, 100, 10–16. [Google Scholar] [CrossRef]
- Fossi, M.C.; Panti, C.; Guerranti, C.; Coppola, D.; Giannetti, M.; Marsili, L.; Minutoli, R. Are baleen whales exposed to the threat of microplastics? A case study of the Mediterranean fin whale (Balaenoptera physalus). Mar. Pollut. Bull. 2012, 64, 2374–2379. [Google Scholar] [CrossRef]
- Frias, J.P.G.L.; Otero, V.; Sobral, P. Evidence of microplastics in samples of zooplankton from Portuguese coastal waters. Mar. Environ. Res. 2014, 95, 89–95. [Google Scholar] [CrossRef]
- Frère, L.; Paul-Pont, I.; Rinnert, E.; Petton, S.; Jaffré, J.; Bihannic, I.; Soudant, P.; Lambert, C.; Huvet, A. Influence of environmental and anthropogenic factors on the composition, concentration and spatial distribution of microplastics: A case study of the Bay of Brest (Brittany, France). Environ. Pollut. 2017, 225, 211–222. [Google Scholar] [CrossRef]
- Carpenter, E.J.; Anderson, S.J.; Harvey, G.R.; Miklas, H.P.; Peck, B.B. Polystyrene Spherules in Coastal Waters. Science 1972, 178, 749–750. [Google Scholar] [CrossRef]
- Gray, A.D.; Wertz, H.; Leads, R.R.; Weinstein, J.E. Microplastic in two South Carolina Estuaries: Occurrence, distribution, and composition. Mar. Pollut. Bull. 2018, 128, 223–233. [Google Scholar] [CrossRef]
- López, A.F.; Truchet, D.; Rimondino, G.; Maisano, L.; Spetter, C.; Buzzi, N.; Nazzarro, M.; Malanca, F.; Furlong, O.; Severini, F. Microplastics and suspended particles in a strongly impacted coastal environment: Composition, abundance, surface texture, and interaction with metal ions. Sci. Total Environ. 2021, 754, 142413. [Google Scholar] [CrossRef]
- Ta, A.T.; Babel, S. Microplastics pollution with heavy metals in the aquaculture zone of the Chao Phraya River Estuary, Thailand. Mar. Pollut. Bull. 2020, 161, 111747. [Google Scholar] [CrossRef] [PubMed]
- Cordova, M.R.; Purwiyanto, A.I.S.; Suteja, Y. Abundance and characteristics of microplastics in the northern coastal waters of Surabaya, Indonesia. Mar. Pollut. Bull. 2019, 142, 183–188. [Google Scholar] [CrossRef] [PubMed]
- McEachern, K.; Alegria, H.; Kalagher, A.L.; Hansen, C.; Morrison, S.; Hastings, D. Microplastics in Tampa Bay, Florida: Abundance and variability in estuarine waters and sediments. Mar. Pollut. Bull. 2019, 148, 97–106. [Google Scholar] [CrossRef] [PubMed]
- Chinfak, N.; Sompongchaiyakul, P.; Charoenpong, C.; Shi, H.; Yeemin, T.; Zhang, J. Abundance, composition, and fate of microplastics in water, sediment, and shellfish in the Tapi-Phumduang River system and Bandon Bay, Thailand. Sci. Total Environ. 2021, 781, 146700. [Google Scholar] [CrossRef]
- Nel, H.A.; Froneman, P.W. A quantitative analysis of microplastic pollution along the south-eastern coastline of South Africa. Mar. Pollut. Bull. 2015, 101, 274–279. [Google Scholar] [CrossRef]
- Pazos, R.S.; Amalvy, J.; Cochero, J.; Pecile, A.; Gómez, N. Temporal patterns in the abundance, type and composition of microplastics on the coast of the Río de la Plata estuary. Mar. Pollut. Bull. 2021, 168, 112382. [Google Scholar] [CrossRef]
- Mu, J.; Zhang, S.; Qu, L.; Jin, F.; Fang, C.; Ma, X.; Zhang, W.; Wang, J. Microplastics abundance and characteristics in surface waters from the Northwest Pacific, the Bering Sea, and the Chukchi Sea. Mar. Pollut. Bull. 2019, 143, 58–65. [Google Scholar] [CrossRef]
- Saliu, F.; Montano, S.; Garavaglia, M.G.; Lasagni, M.; Seveso, D.; Galli, P. Microplastic and charred microplastic in the Faafu Atoll, Maldives. Mar. Pollut. Bull. 2018, 136, 464–471. [Google Scholar] [CrossRef]
- Sul, J.A.I.D.; Costa, M.F.; Fillmann, G. Microplastics in the pelagic environment around oceanic islands of the Western Tropical Atlantic Ocean. Water Air, Soil Pollut. 2014, 225, 2004. [Google Scholar] [CrossRef]
- Suresh, A.; Vijayaraghavan, G.S. Microplastics distribution and contamination from the Cochin coastal zone, India. Reg. Stud. Mar. Sci. 2020, 40, 101533. [Google Scholar] [CrossRef]
- Hosseini, R.; Sayadi, M.H.; Aazami, J.; Savabieasfehani, M. Accumulation and distribution of microplastics in the sediment and coastal water samples of Chabahar Bay in the Oman Sea, Iran. Mar. Pollut. Bull. 2020, 160, 111682. [Google Scholar] [CrossRef] [PubMed]
- Athapaththu, A.; Thushari, G.; Dias, P.; Abeygunawardena, A.; Egodauyana, K.; Liyanage, N.; Pitawala, H.; Senevirathna, J. Plastics in surface water of southern coastal belt of Sri Lanka (Northern Indian Ocean): Distribution and characterization by FTIR. Mar. Pollut. Bull. 2020, 161, 111750. [Google Scholar] [CrossRef] [PubMed]
- Wang, T.-T.; Tang, W.-Q.; Wu, D.-H.; Yu, X.-R.; Wang, G.-Y.; Cai, X.-W.; Shao, S.; Wang, S.; Mo, L.; Liu, Y.-S.; et al. Abundance and characteristics of microplastics in the Wanquan River estuary, Hainan Island. Mar. Pollut. Bull. 2023, 189, 114810. [Google Scholar] [CrossRef] [PubMed]
- Gunaalan, K.; Almeda, R.; Lorenz, C.; Vianello, A.; Iordachescu, L.; Papacharalampos, K.; Kiær, C.M.R.; Vollertsen, J.; Nielsen, T.G. Abundance and distribution of microplastics in surface waters of the Kattegat/ Skagerrak (Denmark). Environ. Pollut. 2023, 318, 120853. [Google Scholar] [CrossRef]
- Mladinich, K.; Holohan, B.A.; Shumway, S.E.; Ward, J.E. Abundance of microplastics at and near a shellfish aquaculture farm: An eastern oyster (Crassostrea virginica) transplant study. Mar. Environ. Res. 2024, 199, 106606. [Google Scholar] [CrossRef]
- Nugawela, N.; Mahaliyana, A.; Abhiram, G.; Abeygunawardena, A. A meta-analytic review of microplastic pollution in the Indian Ocean: Ecological health and seafood safety risk implications. Mar. Pollut. Bull. 2023, 193, 115213. [Google Scholar] [CrossRef]
- Sunil, M.; Mithun, N.; Kalthur, G.; Nair, M.P.; Gopinath, A.; Chidangil, S.; Kumar, S.; Lukose, J. Analysis of microplastics in the estuary lying along the coastal belt of the Arabian Sea. Case Stud. Chem. Environ. Eng. 2024, 10, 100804. [Google Scholar] [CrossRef]
- Phan, N.-T.; Thao, L.X.T.; Do, V.M.; Nguyen, D.D. Assessment of microplastic presence in coastal environments and organisms of Da Nang, Vietnam. Mar. Pollut. Bull. 2024, 204, 116516. [Google Scholar] [CrossRef]
- Velmurugan, P.; Vijayaprabhakaran, K.; Devika, P. Baseline study on identification, characterization, distribution and abundance of microplastics in surface water from Ennore to Kovalam along the east coast of India. Phys. Chem. Earth Parts A/B/C 2023, 130, 103391. [Google Scholar] [CrossRef]
- Zhu, Z.; Hossain, K.B.; Wei, H.; Jia, R.; Gao, X.; Jin, H.; Cai, M. Distribution and sources of microplastics in the Beibu Gulf using in-situ filtration technique. Mar. Pollut. Bull. 2023, 188, 114614. [Google Scholar] [CrossRef]
- Al Nahian, S.; Rakib, R.J.; Kumar, R.; Haider, S.M.B.; Sharma, P.; Idris, A.M. Distribution, characteristics, and risk assessments analysis of microplastics in shore sediments and surface water of Moheshkhali channel of Bay of Bengal, Bangladesh. Sci. Total Environ. 2023, 855, 158892. [Google Scholar] [CrossRef] [PubMed]
- Alam, J.; Shammi, M.; Tareq, S.M. Distribution of microplastics in shoreline water and sediment of the Ganges River Basin to Meghna Estuary in Bangladesh. Ecotoxicol. Environ. Saf. 2023, 266, 115537. [Google Scholar] [CrossRef] [PubMed]
- Valsan, G.; Warrier, A.K.; Amrutha, K.; Anusree, S.; Rangel-Buitrago, N. Exploring the presence and distribution of microplastics in subterranean estuaries from southwest India. Mar. Pollut. Bull. 2023, 190, 114820. [Google Scholar] [CrossRef] [PubMed]
- Bouadil, O.; Benomar, M.; El Ouarghi, H.; Aboulhassan, M.A.; Benbrahim, S. Identification and quantification of microplastics in surface water of a southwestern Mediterranean Bay (Al Hoceima, Morocco). Waste Manag. Bull. 2024, 2, 142–151. [Google Scholar] [CrossRef]
- García-Regalado, A.; Herrera, A.; Almeda, R. Microplastic and mesoplastic pollution in surface waters and beaches of the Canary Islands: A review. Mar. Pollut. Bull. 2024, 201, 116230. [Google Scholar] [CrossRef]
- Nitzberg, E.J.; Parmar, S.; Arbuckle-Keil, G.; Saba, G.K.; Chant, R.J.; Fahrenfeld, N. Microplastic concentration, characterization, and size distribution in the Delaware Bay estuary. Chemosphere 2024, 361, 142523. [Google Scholar] [CrossRef]
- Samuels, W.; Awe, A.; Sparks, C. Microplastic pollution and risk assessment in surface water and sediments of the Zandvlei Catchment and estuary, Cape Town, South Africa. Environ. Pollut. 2024, 342, 122987. [Google Scholar] [CrossRef]
- Higgins, C.; Turner, A. Microplastics in surface coastal waters around Plymouth, UK, and the contribution of boating and shipping activities. Sci. Total Environ. 2023, 893, 164695. [Google Scholar] [CrossRef]
- Hossain, M.B.; Yu, J.; Nur, A.-A.U.; Banik, P.; Jolly, Y.N.; Mamun, A.; Arai, T.; Albeshr, M.F. Microplastics in surface water from a mighty subtropical estuary: First observations on occurrence, characterization, and contamination assessment. Environ. Res. 2023, 226, 115594. [Google Scholar] [CrossRef]
- Trindade, L.d.S.; Gloaguen, T.V.; Benevides, T.d.S.F.; Valentim, A.C.S.; Bomfim, M.R.; Santos, J.A.G. Microplastics in surface waters of tropical estuaries around a densely populated Brazilian bay. Environ. Pollut. 2023, 323, 121224. [Google Scholar] [CrossRef]
- Hansen, J.; Hildebrandt, L.; Zimmermann, T.; El Gareb, F.; Fischer, E.K.; Pröfrock, D. Quantification and characterization of microplastics in surface water samples from the Northeast Atlantic Ocean using laser direct infrared imaging. Mar. Pollut. Bull. 2023, 190, 114880. [Google Scholar] [CrossRef] [PubMed]
- Kelly, N.E. Spatial distribution and risk assessment of microplastics in surface waters of the St. Lawrence Estuary. Sci. Total Environ. 2024, 946, 174324. [Google Scholar] [CrossRef] [PubMed]
- Antacli, J.; Di Mauro, R.; Rimondino, G.; Alurralde, G.; Schloss, I.; González, G.; Morales, S.; Ottero, A.; Vodopivez, C. Microplastic pollution in waters of the Antarctic coastal environment of Potter Cove (25 de Mayo Island/King George Island, South Shetlands). Sci. Total Environ. 2024, 915, 170155. [Google Scholar] [CrossRef] [PubMed]
- Deakin, K.; Savage, G.; Jones, J.S.; Porter, A.; Muñoz-Pérez, J.P.; Santillo, D.; Lewis, C. Sea surface microplastics in the Galapagos: Grab samples reveal high concentrations of particles <200 μm in size. Sci. Total Environ. 2024, 923, 171428. [Google Scholar] [CrossRef]
- Wu, F.; Reding, L.; Starkenburg, M.; Leistenschneider, C.; Primpke, S.; Vianello, A.; Zonneveld, K.A.; Huserbråten, M.B.; Versteegh, G.J.; Gerdts, G. Spatial distribution of small microplastics in the Norwegian Coastal Current. Sci. Total Environ. 2024, 942, 173808. [Google Scholar] [CrossRef]
- Leistenschneider, C.; Wu, F.; Primpke, S.; Gerdts, G.; Burkhardt-Holm, P. Unveiling high concentrations of small microplastics (11–500 μm) in surface water samples from the southern Weddell Sea off Antarctica. Sci. Total Environ. 2024, 927, 172124. [Google Scholar] [CrossRef]
- Luo, Y. Pollution and Management of Microplastics in Marine and Coastal Environment; Science Press: Beijing, China, 2019. [Google Scholar]
- Chen, Q.; Wang, Q.; Zhang, C.; Zhang, J.; Dong, Z.; Xu, Q. Aging simulation of thin-film plastics in different environments to examine the formation of microplastic. Water Res. 2021, 202, 117462. [Google Scholar] [CrossRef]
- Zhu, Z.; Hossain, K.B.; Wei, H.; Chen, J.; Jia, R.; Gao, X.; Jin, H.; Cai, M. Fate and mass budget of microplastic in the Beibu Gulf, the northern South China sea. Mar. Environ. Res. 2024, 202, 106797. [Google Scholar] [CrossRef]
- Liu, Y.; You, X.; Liao, C.; Gao, F. Research Progress on Microplastic Pollution and Mitigation Methods. In Proceedings of the Beijing-Tianjin-Hebei Eco-Environmental Technology Industry Financial Coordinated Development Conference, Shijiazhuang, China, 2 April 2024. [Google Scholar]

| Plastics Class | Products and Typical Origin |
|---|---|
| PP | Rope, bottle caps, and netting |
| PS | Plastic utensils and food containers |
| PA | Netting and traps |
| PET | Plastic beverage bottles |
| PVC | Plastic film, bottles, and cups |
| Survey Area | Sampling Location | Mesh Type | Size Range | Material Composition | Number Concentration | Reference | |
|---|---|---|---|---|---|---|---|
| Changjiang estuary | Surface | 32 µm steel | 0.5–5 mm | / | 4137.3 ± 2461.5 n/m3 | [9] | |
| Donghai coast | Surface | 333 µm manta | 0.5–5 mm | / | 0.167 ± 0.138 n/m3 | [9] | |
| Jiaojiang estuary | Subsurface | 333 µm manta | 0.333–5 mm | PP, PE, PVC | 955.6 ± 848.7 n/m3 | [10] | |
| Oujiang estuary | Subsurface | 333 µm manta | 0.333–5 mm | PP, PE, PVC | 680.0 ± 284.6 n/m3 | [10] | |
| Minjiang estuary | Subsurface | 333 µm manta | 0.333–5 mm | PP, PE, PVC | 1245.8 ± 531.5 n/m3 | [10] | |
| Bohai Sea | Surface | 20 µm nylon | 0.02–5 mm | PP, PE, PET | 2000–4200 n/m3 | [32] | |
| Yellow River estuary (wet season) | Surface | 50 µm steel | 50–200 µm | PE, PP, PS | 654,000 n/m3 | [11] | |
| Yellow River estuary (dry season) | Surface | 50 µm steel | 50–200 µm | PET, PP | 930,200 n/m3 | [11] | |
| Pearl River estuary | Surface | 50 µm steel | 50–500 µm | PA | 8902 n/m3 | [12] | |
| Haihe estuary | Surface | 48 µm steel | 48–5000 µm | PP, PE, PS, PVC | 1485.7 ± 819.9 n/m3 | [13] | |
| Yonding River estuary | Surface | 48 µm steel | 48–5000 µm | PP, PE, PS, PVC | 788.0 ± 464.2 n/m3 | [13] | |
| Tianjin coastal areas | Surface | 125 µm steel | 125–5000 µm | PP, PE, PET | 210–1170 n/m3 | [17] | |
| Sanggou Bay | Surface | 30 µm steel | 30–5000 µm | PE, PS, PP, CE | 20,060 ± 4730 n/m3 | [33] | |
| South China sea | Surface | 20 µm nylon | 20–300 µm | AK, PCL, PEA | 2569 ± 1770 n/m3 | [34] | |
| Xiamen coastal areas | Surface | 330 µm manta | 330–5000 µm | PE, PP | 103–2017 n/m3 | [18] | |
| Zhangjiang estuary | Surface | 300 µm manta | 330–5000 µm | PP, PE, PS | 50–725 n/m3 | [35] | |
| East of Guangdong coast | Surface | 50 µm steel | / | / | 3000–19,000 n/m3 | [19] | |
| Zhuhai coastal areas | Surface | 2.7 µm fiber | 1–5000 µm | PE, PP, PS | 16,610 ± 4280 n/m3 | [36] | |
| Donghai coastal areas | Surface | 20 µm nylon | 20–5000 µm | PP, PET, PES | 900 n/m3 | [37] | |
| Eastern Indian Ocean | Surface | 330 µm manta | 0–5000 µm | PP, PE | 0.34 ± 0.80 n/m3 | [38] | |
| South China Sea | Subsurface | 330 µm Plankton | 0–5810 µm | PET, PP, PE | 0.52 ± 0.42 n/m3 | [39] | |
| Eastern Indian Ocean | Subsurface | 330 µm Plankton | 0–5660 µm | PET, PP, PE | 0.27 ± 0.19 n/m3 | [39] | |
| South China Sea | Surface | 330 µm manta | 140–5080 µm | PP, PE | 0.61 ± 0.87 n/m3 | [22] | |
| South China Sea | Column | 60 µm Filter | 70–4720 µm | PET, PP, PE, AR | 50 m | 1.00 ± 0.43 n/m3 | [22] |
| 200 m | 0.63 ± 0.25 n/m3 | ||||||
| 500 m | 0.30 n/m3 | ||||||
| 800 m | 0.30 n/m3 | ||||||
| 1000 m | 0.20 n/m3 | ||||||
| Hong Kong | Surface | 153 µm Plankton | 30–4960 µm | PP, HDPE, LDPE | 0.51–279.09 n/m3 | [40] | |
| Zhubi reef | Surface | 50 µm steel | 0–5000 µm | PP, PA, PS, PVC | 4933 ± 1369 n/m3 | [41] | |
| Haikou Bay | Surface | 333 µm Neuston | 0–4900 µm | PE, Rayon | 0.44 ± 0.21 n/m3 | [42] | |
| Nanxun reef | Surface | 48 µm steel | 0–5000 µm | PVC, PA, PE | 1733 n/m3 | [43] | |
| Paracel Islands | Surface | 20 µm nylon | 20–5000 µm | PET, PP | 54.7 n/m3 | [44] | |
| Nansha Island remote coral reefs | Surface | 333 µm neuston | 209–4917 µm | PP, PE, PPC | 0.0556 ± 0.0355 n/m3 | [45] | |
| Yellow Sea | Surface | 500 µm bongo nets | 350–44,990 µm | PE, PP | 0.13 ± 0.20 n/m3 | [46] | |
| Danube | Surface | 500 µm mesh | <20 mm | / | 0.32 ± 4.67 n/m3 | [47] | |
| Tamar estuary | Surface | 300 µm manta | Including more than 5 mm | PE, PS, PP | 0.03 n/m3 | [48] | |
| Goiana estuary | Surface/bottom | 300 µm plankton | <5 mm | / | 0.26 n/m3 | [49] | |
| Calvi Bay | Surface | 200 µm mesh | 0.2–10 mm | PS | 0.06 n/m3 | [50] | |
| Israeli Mediterranean coast | Surface | 300 µm manta | 0.3–5 mm | / | 7.68 ± 2.38 n/m3 | [51] | |
| Northwestern Mediterranean Sea | Surface | 333 µm manta | 0.3–5 mm | PS | 0.12 n/m2 | [52] | |
| Jade system (Southern North Sea) | Surface | 40 µm steel | <5 mm | / | 64,000 ± 194,000 n/m3 | [53] | |
| Queen Charlotte Sound | Subsurface | 62.5 µm copper | 398 ± 376 µm | / | 7630 ± 1410 n/m3 | [54] | |
| Strait of Georgia | Subsurface | 62.5 µm copper | 513 ± 494 µm | / | 3210 ± 628 n/m3 | [54] | |
| West coast of Vancouver Island | Subsurface | 62.5 µm copper | 558 ± 521 µm | / | 1710 ± 1110 n/m3 | [54] | |
| Western English Channel | Surface | 200 µm plankton | <5 mm | PA, PP | 0.27 n/m3 | [55] | |
| Western Sardinian coast | Surface | 500 µm manta | 0.5–5 mm | PS | 0.15 n/m3 | [56] | |
| Ligurian Sea and Sardinian Sea | Surface | 200 µm mesh | <5 mm | / | 0–10 n/m3 | [57] | |
| Portuguese coastal waters | / | 180 µm mesh | <5 mm | PE, PP | 0.002–0.036 n/m3 | [58] | |
| Brest Bay | Surface | 335 µm manta | <5 mm | PE, PP, PS | 0.24 ± 0.35 n/m3 | [59] | |
| South coast of Korea | Surface | 50 µm mesh | <50 µm | PS, PP, PE | 103,000 ± 59,000 n/m3 | [20] | |
| 50–100 µm | 69,000 ± 41,000 n/m3 | ||||||
| 100–200 µm | 23,000 ± 20,000 n/m3 | ||||||
| 200–500 µm | 11,000 ± 11,000 n/m3 | ||||||
| 500–1000 µm | 2900 ± 3400 n/m3 | ||||||
| >1000 µm | 2100 ± 2900 n/m3 | ||||||
| West coast of the North Atlantic | / | 333 µm manta | 0.333–5 mm | PS | 0.01–14.1 n/m3 | [60] | |
| Northwest coast of Portugal | Subsurface | 30 µm mesh | 30–5000 µm | PE, PP | 651 ± 1660 n/m3 | [21] | |
| Charleston harbor | Surface | 63 µm mesh | 63–5000 µm | PS, PA, PE | 6600 ± 1300 n/m3 | [61] | |
| Wanyah Bay | Surface | 63 µm mesh | 63–5000 µm | PS, PA, PE | 30,800 ± 12,100 n/m3 | [61] | |
| Bega estuary | Surface | 45 µm mesh | / | / | 80–906 n/m3 | [14] | |
| Clyde estuary | Surface | 45 µm mesh | / | / | 23–198 n/m3 | [14] | |
| Hunter estuary | 0–4 m | 37 µm mesh | / | / | 431–1892 n/m3 | [14] | |
| Blanca estuary | Surface | / | / | PA, CE | 6500 ± 4010 n/m3 | [62] | |
| Chao Phraya River estuary | Surface | 300 µm manta | / | PP, PE | 48 ± 8 n/m3 | [63] | |
| Baram River | Surface | 300 µm steel | 300–5000 µm | PE, PET, PS | 9300–18,000 n/m3 | [15] | |
| North coast of Indonesia Surabaya | Surface | 200 µm filter | 200–5000 µm | PS, PE, PP | 380–610 n/m3 | [64] | |
| Tampa Bay | Surface | 1.2 µm fiber | / | / | 250–7000 n/m3 | [65] | |
| Bandon Bay | Surface | 5 µm nylon | / | RN, PP, PE | 630 ± 130 n/m3 | [66] | |
| Southeastern coastline of South Africa | Surface | 65 µm mesh | 65–5000 µm | PS | 257.9–1215 n/m3 | [67] | |
| Rio De La Plata | Subsurface | 36 µm plankton | 36–5000 µm | PE, PP | 5–110 n/m3 | [68] | |
| Chukchi Sea | Surface | 330 µm manta | >333 µm | PET, PP, PE | 0.23 ± 0.07 n/m3 | [69] | |
| Northwest Pacific | Surface | 330 µm manta | >333 µm | PET, PP, PA | 0.030 ± 0.017 n/m3 | [69] | |
| Bering Sea | Surface | 330 µm manta | >333 µm | PET, PP, PA | 0.091 ± 0.094 n/m3 | [69] | |
| Maldives | Surface | 200 µm neuston | / | PE, PP | 0.26 n/m3 | [70] | |
| Equatorial Atlantic | Surface | 300 µm plankton | 0–5000 µm | / | 0.01 n/m3 | [23] | |
| Terengganu estuary | Surface | 200 µm mesh | / | PA, PE, PP | 1687 n/m3 | [16] | |
| Offshore waters of Malaysia | Surface | 200 µm mesh | / | PA, PE, PP | 1900 n/m3 | [16] | |
| Western tropical Atlantic Ocean | Surface | 300 µm manta | 0–5000 µm | / | 0.03 n/m3 | [71] | |
| Southern Ocean | Surface | 350 µm neuston | 0–5500 µm | PE, PP, PS | 0.031 n/m3 | [24] | |
| Coast of Cochin | Surface | 250 µm steel | 250–5000 µm | CE, PS, PE | 751.7 ± 452.21 n/m3 | [72] | |
| Western Pacific | Surface | 330 µm manta | / | ER, PP, PESPMA | 0.06 ± 0.03 n/m3 | [25] | |
| Chabahar Bay | Surface | 0.45 µm fiber | / | PE, PET, Nylon | 86,000–362,000 n/m3 | [73] | |
| Sri Lanka | Surface | 380 µm neuston | 0–5000 µm | HDPEPP, PS | 17.45 ± 3.35 n/m3 | [74] | |
| Wanquan River estuary | Surface | 335 µm steel | 335–5000 µm | APPs | 6573 ± 2569 n/m3 | [75] | |
| Kattegat/Skagerrak | Surface | 10 µm–300 µm UFO | 10–300 µm | PLY, PP | 39 ± 23 n/m3 | [76] | |
| Niantic Bay | - | 5 µm silver filter | >5 µm | PLY/PET | 180 ± 100 n/m3 | [77] | |
| Indian Ocean | Surface | - | 0–5000 µm | PE | 0.01–372,000 n/m3 | [78] | |
| Azhikkal estuary | Surface | Filter paper | 0–1000 µm | PS | 12,000–640,000 n/m3 | [79] | |
| Da Nang, Vietnam | Surface | 0.45 µm filter paper | 0.45–50 µm | Nylon, PTFE | 111,000–304,000 n/m3 | [80] | |
| Ennore to Kovalam | Surface | 150 µm plankton net | 150–2000 µm | PE, PP | 6–30 n/Location | [81] | |
| Beibu Gulf | Surface | 300 µm plankton pump | 330–5000 µm | CE, PP, PE | 0.25 ± 0.05 n/m3 | [82] | |
| Moheshkhali channel | Surface | 180 µm manta | 250–5000 µm | PP, PE | 0–0.1 n/m3 | [83] | |
| Ganges River basin to the Meghna estuary | Surface | 0.45 µm filter paper | 0–5000 µm | LDPE, PS, PA | 55,260 ± 25,400 n/m3 | [84] | |
| Karnataka | Surface | 300 µm steel | 300–5000 µm | LDPE, PES | 114 ± 68.93 n/m3 | [85] | |
| Al Hoceima Bay | Surface | 335 µm manta | 150–5000 µm | PE, PP | 4.70 ± 4.50 n/m3 | [86] | |
| Canary archipelago | Surface | 200 µm manta | 200–5000 µm | PE | 10 ± 31 n/m3 | [87] | |
| Delaware Bay estuary | Surface | 80/153/20 µm plankton | 500–5000 µm | PE, PP | 0.34 ± 0.80 n/m3 | [88] | |
| Zandvlei estuary (and its catchment) | Surface | 250 µm sieve | <5 mm | PE, PP | 2620 ± 410 n/m3 | [89] | |
| Plymouth coast | Surface | 53 µm plankton | >53 µm | PP, Rayon | 0.26–0.68 n/m3 | [90] | |
| Meghna estuary | Surface | 300 µm plankton | 0–5000 µm | PE, PS | 128.89 ± 67.94 n/m3 | [91] | |
| Brazilian bay | Surface | 53 µm sieve | 50–5000 µm | - | 5180 n/m3 | [92] | |
| Northeast Atlantic Ocean | Surface | 10/300 µm filters | 20–500 µm | PET | 500 ± 700 n/m3 | [93] | |
| St. Lawrence estuary | Surface | 63/150/250/500/1000 µm sieves | 50–3200 µm | PET, regenerated cellulose, PE, | 120 ± 42 n/m3 | [94] | |
| Potter Cove | Surface | 45 µm microfilter | 110–3630 µm | CM, PET | 390 ± 440 n/m3 | [95] | |
| Galapagos | Surface | 200 µm plankton | >50 µm | PE, PP | 2.56 ± 0.78 n/m3 | [96] | |
| Norwegian | Surface | 15 µm filter | <300 µm | CPE, PP, PEST | 189 n/m3 | [97] | |
| Southern Weddell Sea off Antarctica | Surface | 10 µm filter | 11–500 µm | PP, PA | 43.5 ± 83.8 n/m3 | [98] | |
| Volume | Original shape | Assumed shape |
| Fiber | Cylinder | |
| Fragment | Cylinder | |
| Film | Cylinder | |
| Pellet | Sphere | |
| Thickness | Frament | One-tenth of the statistical microplastic size |
| Film | 5–100 µm [100], average thickness of 50 µm | |
| Density | 850–1410 kg/m3 [99], average density of 1040 kg/m3 [7] | |
| Amount concentration | A |
| Film thickness | H |
| Ceiling and floor of microplastic size | Li |
| Mesh size | D |
| Proportion of microplastics with different shapes | P* |
| Proportion of each microplastic size interval with the same shape | pi |
| Survey Area | Location | Mesh Tape | Size Range (µm) | Proportion of Each Shape (%) | Mass Concentration (mg/L) | Reference | |||
|---|---|---|---|---|---|---|---|---|---|
| Fiber | Film | Pellet | Fragment | 0–5 mm | |||||
| Changjiang estuary | Surface | 32 µm steel | 500–5000 | 79.10 | 9.10 | 11.80 | 0.00 | 26.808–287.886 | [9] |
| Bohai Sea | Surface | 20 µm nylon | 20–5000 | 75.00 | 0.00 | 0.45 | 24.55 | 6.579–59.398 | [32] |
| Bohai Sea | 5–30 m | 20 µm nylon | 20–5000 | 93.20 | 0.18 | 0.27 | 6.35 | 5.475–17.972 | [32] |
| Yellow River estuary | Surface | 50 µm steel | 50–5000 | 93.12 | 0.00 | 4.74 | 2.14 | 23.682–8252.771 | [11] |
| Pearl River estuary | Surface | 50 µm steel | 50–4000 | 9.00 | 43.00 | 48.00 | 0.00 | 109.288–349.84 | [12] |
| Haihe estuary | Surface | 48 µm steel | 48–5000 | 54.46 | 6.77 | 10.09 | 28.67 | 62.11–154.818 | [13] |
| Tianjin coastal areas | Surface | 125 µm steel | 125–5000 | 52.10 | 2.60 | 0.00 | 46.80 | 0.833–74.568 | [17] |
| Sanggou Bay | Surface | 30 µm steel | 30–5000 | 29.56 | 21.84 | 48.60 | 0.00 | 59.165–514.501 | [33] |
| Zhangjiang estuary | Surface | 300 µm manta | 330–5000 | 32.29 | 0.00 | 17.62 | 42.90 | 9.713–81.41 | [35] |
| East of Guangdong coast | Surface | 50 µm steel | 50–2000 | 24.00 | 5.00 | 1.00 | 70.00 | 4.842–44.111 | [19] |
| Zhuhai coastal areas | Surface | 2.7 µm fiber | 1–5000 | 53.01 | 3.73 | 5.94 | 37.32 | 27.089–3075.263 | [36] |
| Donghai coastal areas | Surface | 20 µm nylon | 20–5000 | 37.00 | 4.00 | 2.00 | 57.00 | 4.318–67.4 | [37] |
| Eastern Indian Ocean | Surface | 330 µm manta | 0–5000 | 24.34 | 0.55 | 6.75 | 68.36 | 0.007–0.094 | [22] |
| South China Sea | Surface | 330 µm manta | 140–5080 | 9.81 | 0.78 | 0 | 85.94 | 0.033–0.162 | [22] |
| Zhubi Reef | Surface | 50 µm steel | 0–5000 | 44 | 2 | 48 | 6 | 14.894–1669.800 | [41] |
| Haikou Bay | Surface | 333 µm nylon | 0–4900 | 88.22 | 2.16 | 0 | 3.83 | 0.005–0.009 | [42] |
| Paracel Islands | Surface | 20 µm nylon | 20–5000 | 99 | 1 | 0 | 0 | 0.004–0.012 | [44] |
| Survey Area | Location | Mesh Tape | Size Range (µm) | Proportion in Each Shape (%) | Mass Concentration (mg/L) | Reference | |||
| Fiber | Film | Pellet | Fragment | <5 mm | |||||
| Nansha Island remote coral reefs | Surface | 333 µm neuston | 209–4917 | 32.7 | 8.9 | 0 | 58.4 | 0.004–0.010 | [45] |
| Queen Charlotte Sound | Subsurface | 62.5 µm copper | 62–5000 | 75.00 | 0.00 | 0.00 | 25.00 | 1.725–112.082 | [54] |
| South coast of Korea | Surface | 50 µm mesh | 1–5000 | 2.10 | 0.00 | 2.90 | 95.00 | 23.254–2497.663 | [20] |
| Northwest coast of Portugal | Subsurface | 30 µm mesh | 30–5000 | 39.00 | 39.00 | 0.00 | 22.00 | 8.985–55.573 | [21] |
| Charleston harbor | Surface | 63 µm mesh | 63–5000 | 56.00 | 0.00 | 2.50 | 26.40 | 0.813–555.675 | [61] |
| Baram River | Surface | 300 µm steel | 300–5000 | 21.51 | 11.38 | 0.71 | 66.41 | 748.298–1852.417 | [15] |
| North coast of Indonesia Surabaya | Coastal | 200 µm filter | 200–5000 | 3.32 | 0.00 | 3.73 | 34.51 | 0.336–18.748 | [64] |
| Bandon Bay | Surface | 5 µm nylon | 5–5000 | 100 | 0.00 | 0.00 | 0.00 | 0.001–0.004 | [66] |
| Rio De La Plata estuary | Subsurface | 36 µm plankton | 36–5000 | 55.05 | 21.60 | 1.39 | 21.95 | 0.717–1.742 | [68] |
| Equatorial Atlantic | Surface | 300 µm plankton | 0–5000 | 22.54 | 0 | 0 | 70.42 | 0.00004–0.003 | [23] |
| Coast of Cochin | Surface | 250 µm steel | 250–5000 | 53.77 | 30.53 | 0.00 | 8.79 | 1.518–25.101 | [72] |
| Sri Lanka | Surface | 380 µm neuston | 0–5000 | 99.5 | 0.25 | 0 | 0.25 | 0.149–0.349 | [74] |
Disclaimer/Publisher’s Note: The statements, opinions and data contained in all publications are solely those of the individual author(s) and contributor(s) and not of MDPI and/or the editor(s). MDPI and/or the editor(s) disclaim responsibility for any injury to people or property resulting from any ideas, methods, instructions or products referred to in the content. |
© 2025 by the authors. Licensee MDPI, Basel, Switzerland. This article is an open access article distributed under the terms and conditions of the Creative Commons Attribution (CC BY) license (https://creativecommons.org/licenses/by/4.0/).
Share and Cite
Zhang, J.; Li, Z.; Liang, J.; Liu, G.; Luo, Y.; Zhang, Q. Study on the Mass Concentration Distributions of Marine Microplastics in Estuaries and Coastal Areas. Water 2025, 17, 1136. https://doi.org/10.3390/w17081136
Zhang J, Li Z, Liang J, Liu G, Luo Y, Zhang Q. Study on the Mass Concentration Distributions of Marine Microplastics in Estuaries and Coastal Areas. Water. 2025; 17(8):1136. https://doi.org/10.3390/w17081136
Chicago/Turabian StyleZhang, Jinfeng, Zhengqi Li, Jiaxiong Liang, Guangwei Liu, Yongming Luo, and Qinghe Zhang. 2025. "Study on the Mass Concentration Distributions of Marine Microplastics in Estuaries and Coastal Areas" Water 17, no. 8: 1136. https://doi.org/10.3390/w17081136
APA StyleZhang, J., Li, Z., Liang, J., Liu, G., Luo, Y., & Zhang, Q. (2025). Study on the Mass Concentration Distributions of Marine Microplastics in Estuaries and Coastal Areas. Water, 17(8), 1136. https://doi.org/10.3390/w17081136