
Assembly Processes of Waterbird Communities Across Different Types of Wetlands in the Middle Reaches of the Huaihe River Basin


Abstract
1. Introduction
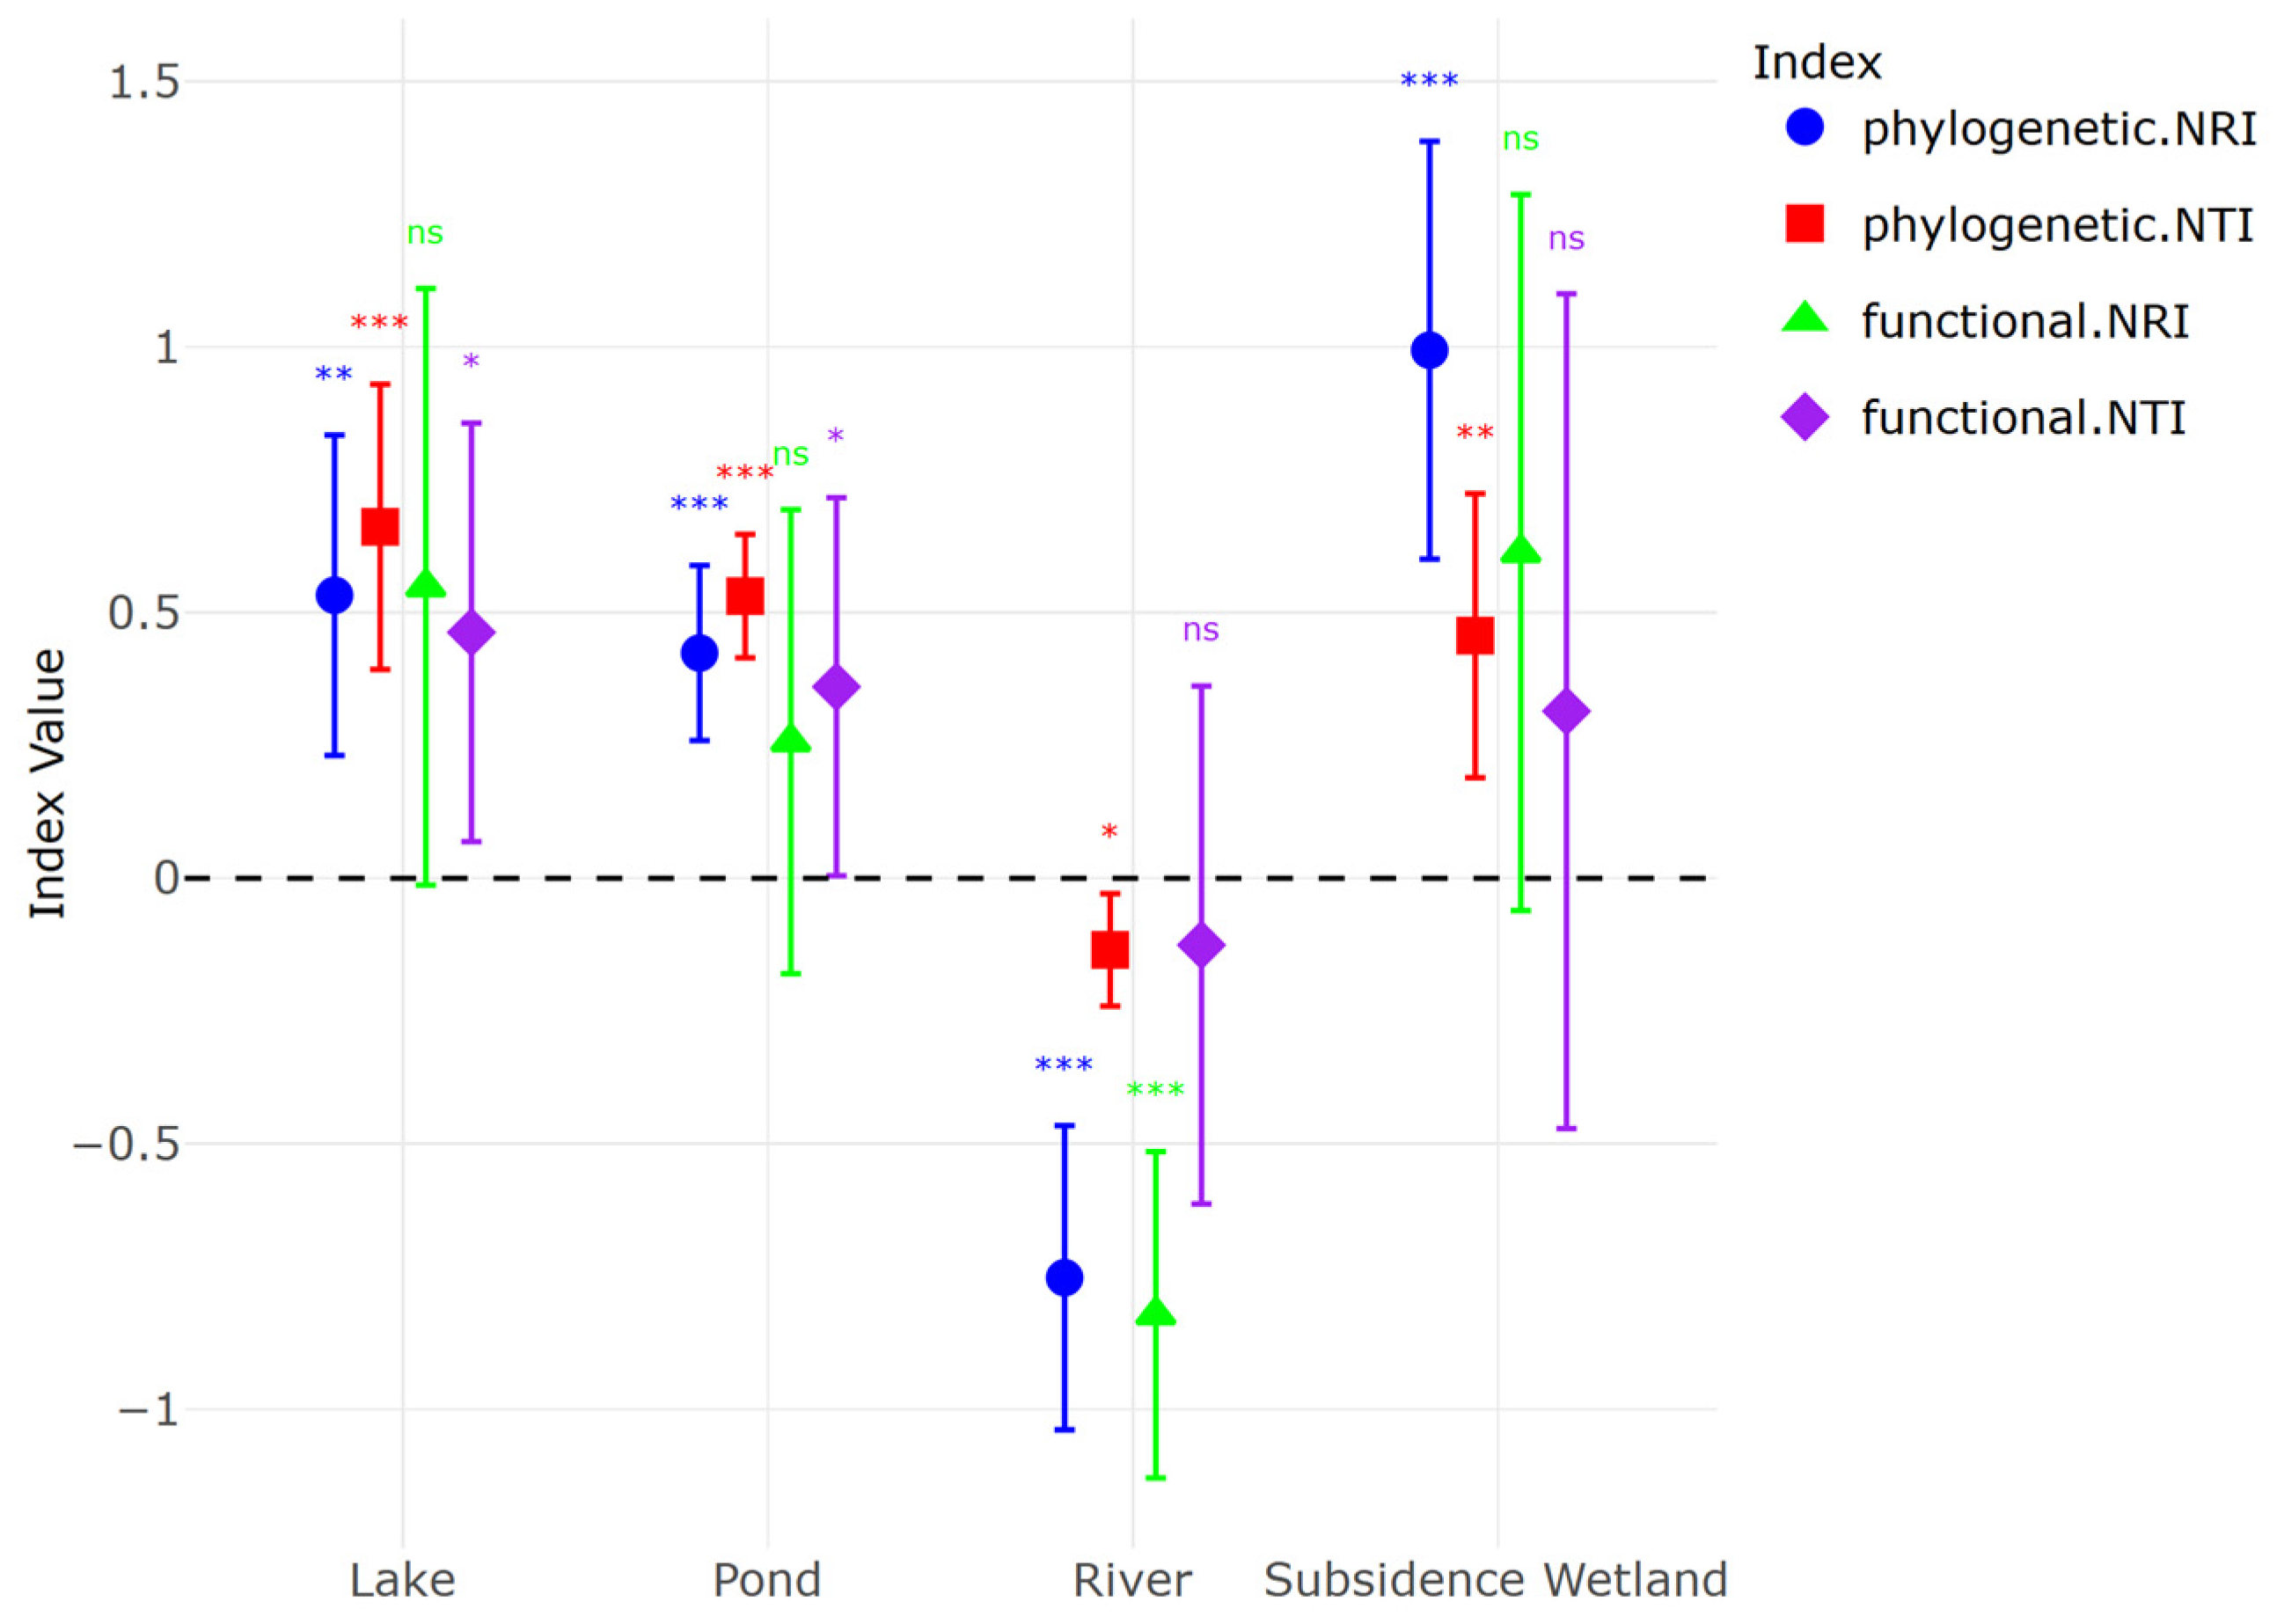
- (1)
- Habitats such as lakes, ponds, and subsidence areas, primarily shaped by environmental filtering due to their homogenous open water characteristics, contrast with river wetlands, where the presence of diverse microhabitats (open water, mudflats, reed marshes, and forests) is more likely to lead to structuring through competitive exclusion;
- (2)
- The stronger influence of environmental variables on functional dimensions rather than phylogenetic dimensions likely arises because functional traits are more directly shaped by environmental filtering processes;
- (3)
- As habitat diversity increases, communities tend to shift from functional or phylogenetic clustering to overdispersion, as heterogeneous habitats provide a broader range of ecological niches, thereby facilitating species differentiation.
2. Methods
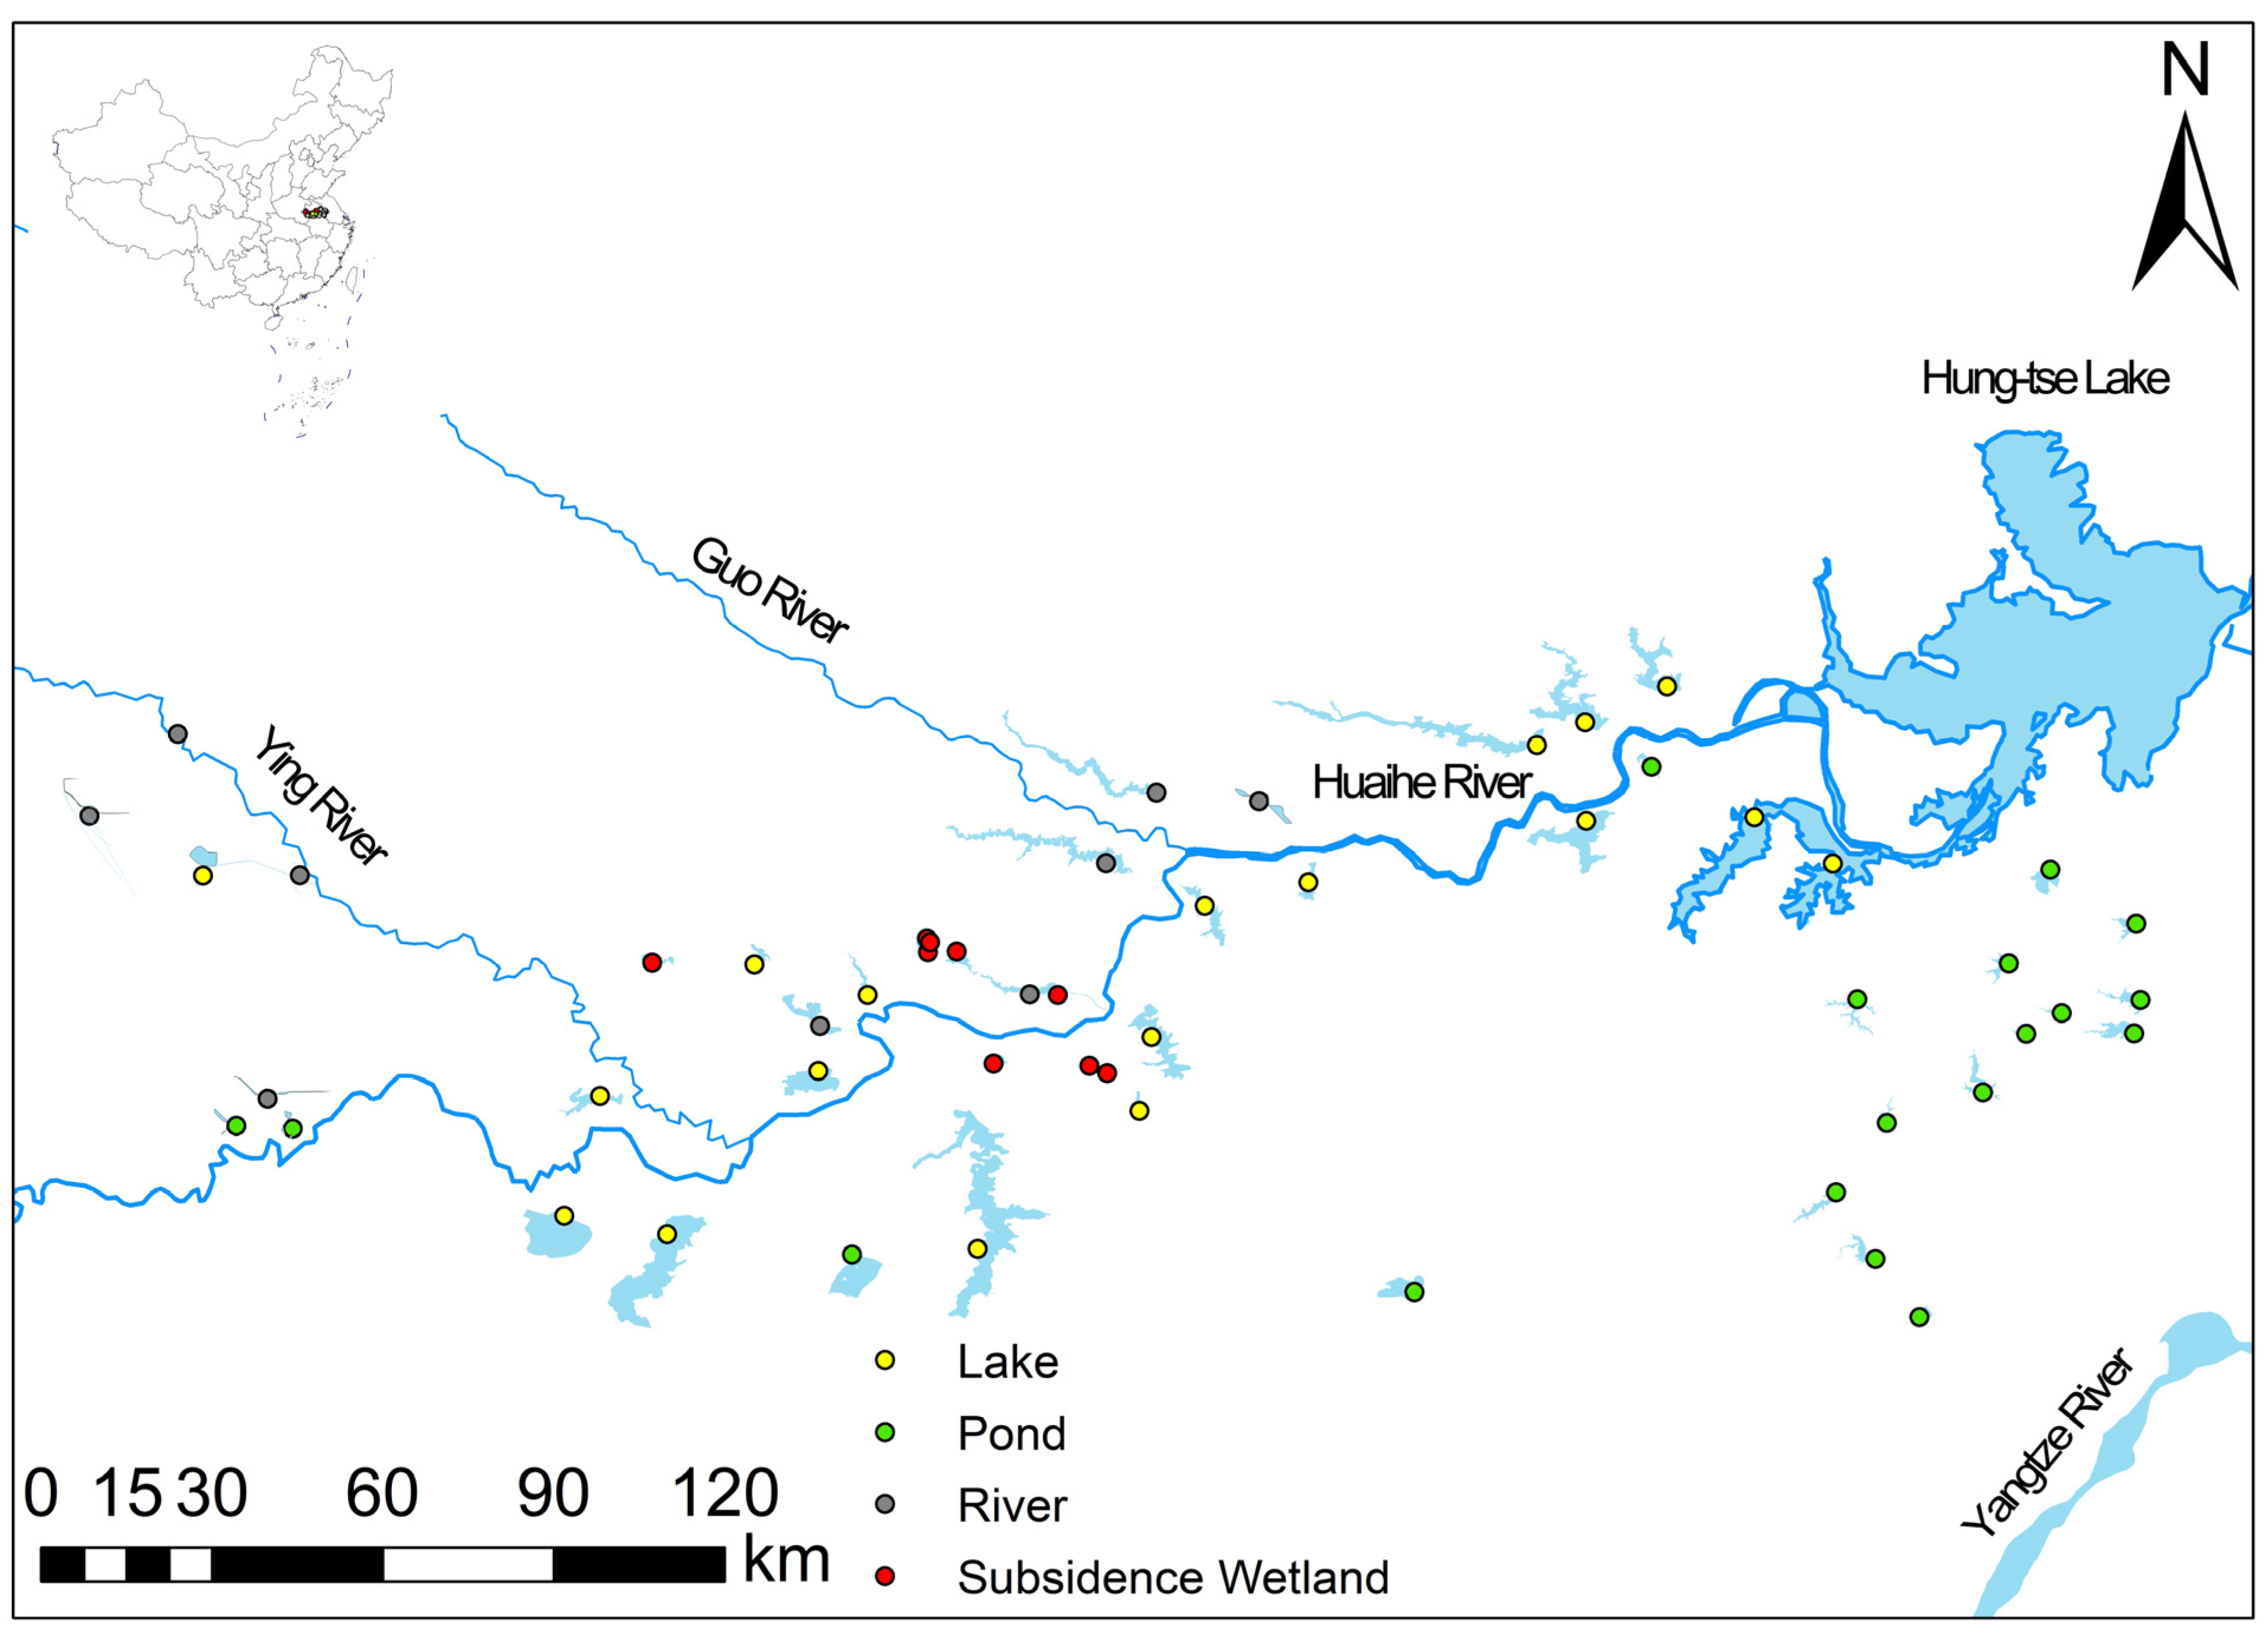
2.1. Study Area
2.2. Bird Survey
2.3. Habitat Variables
2.4. Functional Traits
2.5. Biodiversity Metrics
2.6. Phylogenetic Signal
2.7. Statistical Analyses
3. Results
4. Discussion
Author Contributions
Funding
Data Availability Statement
Acknowledgments
Conflicts of Interest
Abbreviations
| FD | Functional Diversity |
| PD | Phylogenetic Diversity |
| SR | Species Richness |
| TD | Taxonomic Diversity |
| MPD | Mean Pairwise Distance |
| MNTD | Mean Nearest Taxon Distance |
| NRI | Nearest Relative Index |
| NTI | Nearest Taxon Index |
References
- Rosindell, J.; Hubbell, S.P.; Etienne, R.S. The unified neutral theory of biodiversity and biogeography at age ten. Trends Ecol. Evol. 2011, 26, 340–348. [Google Scholar] [CrossRef] [PubMed]
- Swenson, N.G. Functional and Phylogenetic Ecology in R; Springer: Berlin/Heidelberg, Germany, 2014. [Google Scholar] [CrossRef]
- Hawkins, C.P.; Hogue, J.N.; Decker, L.M.; Feminella, J.W. Channel morphology, water temperature, and assemblage structure of stream insects. J. N. Am. Benthol. Soc. 1997, 16, 728–749. [Google Scholar] [CrossRef]
- Connor, E.F.; Simberloff, D. The assembly of species communities: Chance or competition? Ecology 1979, 60, 1132–1140. [Google Scholar] [CrossRef]
- Martin, R.A.; Pfennig, D.W. Disruptive selection in natural populations: The roles of ecological specialization and resource competition. Am. Nat. 2009, 174, 268–281. [Google Scholar] [CrossRef]
- Hubbell, S.P. Of sowbugs and systems: The ecological bioenergetics of a terrestrial isopod. In Systems Analysis and Simulation in Ecology; Patten, B.C., Ed.; Academic Press: Cambridge, MA, USA, 1971; Volume 1, pp. 269–324. [Google Scholar]
- Weir, J.T.; Schluter, D. The latitudinal gradient in recent speciation and extinction rates of birds and mammals. Science 2007, 315, 1574–1576. [Google Scholar] [CrossRef]
- Condamine, F.L.; Sperling, F.A.H.; Wahlberg, N.; Rasplus, J.-Y.; Kergoat, G.J. What causes latitudinal gradients in species diversity? Evolutionary processes and ecological constraints on swallowtail biodiversity. Ecol. Lett. 2012, 15, 267–277. [Google Scholar] [CrossRef]
- Fine, P.V.A.; Ree, R.H. Evidence for a time-integrated species-area effect on the latitudinal gradient in tree diversity. Am. Nat. 2006, 168, 796–804. [Google Scholar] [CrossRef]
- Jetz, W.; Fine, P.V.A. Global gradients in vertebrate diversity predicted by historical area-productivity dynamics and contemporary environment. PLoS Biol. 2012, 10, e1001292. [Google Scholar] [CrossRef]
- MacArthur, R.; Levins, R. The limiting similarity, convergence, and divergence of coexisting species. Am. Nat. 1967, 101, 377–385. [Google Scholar] [CrossRef]
- Chesson, P. Mechanisms of maintenance of species diversity. Annu. Rev. Ecol. Syst. 2000, 31, 343–366. [Google Scholar] [CrossRef]
- Cornwell, W.K.; Schwilk, D.W.; Ackerly, D.D. A trait-based test for habitat filtering: Convex hull volume. Ecology 2006, 87, 1465–1471. [Google Scholar] [CrossRef] [PubMed]
- Mouchet, M.A.; Villéger, S.; Mason, N.W.H.; Mouillot, D. Functional diversity measures: An overview of their redundancy and their ability to discriminate community assembly rules. Funct. Ecol. 2010, 24, 867–876. [Google Scholar] [CrossRef]
- Sodhi, N.S.; Ehrlich, P.R. Conservation Biology for All; Oxford University Press: Oxford, UK, 2010. [Google Scholar]
- Tscharntke, T.; Tylianakis, J.M.; Rand, T.A.; Didham, R.K.; Fahrig, L.; Batáry, P.; Bengtsson, J.; Clough, Y.; Crist, T.O.; Dormann, C.F.; et al. Landscape moderation of biodiversity patterns and processes—Eight hypotheses. Biol. Rev. 2012, 87, 661–685. [Google Scholar] [CrossRef] [PubMed]
- Srivastava, D.S.; Cadotte, M.W.; MacDonald, A.A.M.; Marushia, R.G.; Mirotchnick, N. Phylogenetic diversity and the functioning of ecosystems. Ecol. Lett. 2012, 15, 637–648. [Google Scholar] [CrossRef]
- Tucker, C.M.; Cadotte, M.W.; Carvalho, S.B.; Davies, T.J.; Ferrier, S.; Fritz, S.A.; Grenyer, R.; Helmus, M.R.; Jin, L.S.; Mooers, A.O.; et al. A guide to phylogenetic metrics for conservation, community ecology and macroecology. Biol. Rev. 2017, 92, 698–715. [Google Scholar] [CrossRef]
- Cadotte, M.; Albert, C.H.; Walker, S.C. The ecology of differences: Assessing community assembly with trait and evolutionary distances. Ecol. Lett. 2013, 16, 1234–1244. [Google Scholar] [CrossRef]
- Pavoine, S.; Bonsall, M.B. Measuring biodiversity to explain community assembly: A unified approach. Biol. Rev. 2011, 86, 792–812. [Google Scholar] [CrossRef]
- Evans, B.S.; Reitsma, R.; Hurlbert, A.H.; Marra, P.P. Environmental filtering of avian communities along a rural-to-urban gradient in Greater Washington, DC, USA. Ecosphere 2018, 9, e02402. [Google Scholar] [CrossRef]
- García-Navas, V.; Sattler, T.; Schmid, H.; Schmid, H.; Ozgul, A. Temporal homogenization of functional and beta diversity in bird communities of the Swiss Alps. Divers. Distrib. 2020, 26, 900–911. [Google Scholar] [CrossRef]
- Leveau, L.M. Consistency in bird community assembly over medium-term along rural-urban gradients in Argentina. Ecol. Process. 2021, 10, 8. [Google Scholar] [CrossRef]
- Jia, Y.; Zeng, Q.; Wang, Y.; Saintilan, N.; Lei, G.; Wen, L. Processes shaping wintering waterbird communities in an intensive modified landscape: Neutral assembly with dispersal limitation and localized competition. Ecol. Indic. 2020, 114, 106330. [Google Scholar] [CrossRef]
- He, X.; Brown, C.; Lin, L. Relative importance of deterministic and stochastic processes for beta diversity of bird assemblages in Yunnan, China. Ecosphere 2021, 12, e03545. [Google Scholar] [CrossRef]
- Li, B.; Liang, C.; Song, P.; Zhang, J.; Liu, D.; Gu, H.; Jiang, F.; Gao, H.; Cai, Z.; Zhang, T. Environmental filtering unveils differences in bird diversity patterns and underlying mechanisms in the Qilian Mountains. Ecol. Indic. 2024, 166, 112289. [Google Scholar] [CrossRef]
- Zhang, Y.; Cheng, L.; Li, K.; Zhang, L.; Cai, Y.; Wang, X.; Heino, J. Nutrient enrichment homogenizes taxonomic and functional diversity of benthic macroinvertebrate assemblages in shallow lakes. Limnol. Oceanogr. 2018, 64, 1047–1058. [Google Scholar] [CrossRef]
- Zhang, Y.; Gao, W.; Li, Y.; Jiang, Y.; Chen, X.; Yao, Y.; Messyasz, B.; Yin, K.; He, W.; Chen, Y. Characteristics of the phytoplankton community structure and water quality evaluation in autumn in the Huaihe River (China). Int. J. Environ. Res. Public Health 2021, 18, 12092. [Google Scholar] [CrossRef]
- Liu, H.; Qu, X.; Xia, W.; Chen, Y. Taxonomic, functional, and phylogenetic diversity patterns reveal different processes shaping river fish assemblages in the Eastern Huai River Basin, China. Water Biol. Secur. 2023, 2, 100078. [Google Scholar] [CrossRef]
- Wu, Y.; Zhong, P.; Xu, B.; Zhu, F.; Ma, B. Changing of flood risk due to climate and development in Huaihe River basin, China. Stoch. Environ. Res. Risk Assess. 2017, 31, 935–948. [Google Scholar] [CrossRef]
- Green, A.J.; Elmberg, J. Ecosystem services provided by waterbirds. Biol. Rev. 2014, 89, 105–122. [Google Scholar] [CrossRef]
- You, M.; Zou, Z.; Zhao, W.; Zhang, W.; Fu, C. Study on land use and landscape pattern change in the Huaihe River ecological and economic zone from 2000 to 2020. Heliyon 2023, 9, e13430. [Google Scholar] [CrossRef]
- Delany, S. Guidelines for Participants in the International Waterbird Census (IWC); Wetlands International: Wageningen, The Netherlands, 2005. [Google Scholar]
- Jetz, W.; Thomas, G.H.; Joy, J.B.; Hartmann, K.; Mooers, A.O. The global diversity of birds in space and time. Nature 2012, 491, 444–448. [Google Scholar] [CrossRef]
- Gardner, R.C.; Davidson, N.C. The Ramsar convention. In Wetlands: Integrating Multidisciplinary Concepts; LePage, B.A., Ed.; Springer: Berlin/Heidelberg, Germany, 2011; pp. 189–203. [Google Scholar]
- Simpson, E.H. Measurement of diversity. Nature 1949, 163, 688. [Google Scholar] [CrossRef]
- Wetzel, R.G. Limnology; W.B. Saunders Company: Philadelphia, PA, USA, 1975; pp. xii + 743. [Google Scholar]
- Petchey, O.L.; Evans, K.L.; Fishburn, I.S.; Gaston, K.J. Low functional diversity and no redundancy in British avian assemblages. J. Anim. Ecol. 2007, 76, 977–985. [Google Scholar] [CrossRef]
- del Hoyo, J.; Elliott, A.; Sargatal, J. Handbook of the Birds of the World; Lynx Edicions: Barcelona, Spain, 1992; Volumes 1–7. [Google Scholar]
- del Hoyo, J.; Elliott, A.; Christie, D.A. Handbook of the Birds of the World; Lynx Edicions: Barcelona, Spain, 2004; Volumes 9–16. [Google Scholar]
- BTO Database. Available online: https://www.bto.org/understanding-birds/welcome-birdfacts (accessed on 11 April 2024).
- Kembel, S.W.; Cowan, P.D.; Helmus, M.R.; Cornwell, W.K.; Morlon, H.; Ackerly, D.D.; Blomberg, S.P.; Webb, C.O. Picante: R tools for integrating phylogenies and ecology. Bioinformatics 2010, 26, 1463–1464. [Google Scholar] [CrossRef]
- Paradis, E.; Schliep, K. ape 5.0: An environment for modern phylogenetics and evolutionary analyses in R. Bioinformatics 2019, 35, 526–528. [Google Scholar] [CrossRef]
- Li, C.; Zhang, Y.; Zha, D.; Yang, S.; Huang, Z.Y.X.; de Boer, W.F. Assembly processes of waterbird communities across subsidence wetlands in China: A functional and phylogenetic approach. Divers. Distrib. 2019, 25, 1118–1129. [Google Scholar] [CrossRef]
- Botta-Dukat, Z. Rao’s quadratic entropy as a measure of func-tional diversity based on multiple traits. J. Veg. Sci. 2005, 16, 533–540. [Google Scholar] [CrossRef]
- Rao, C.R. Diversity and dissimilarity coefficients: A unified approach. Theor. Popul. Biol. 1982, 21, 24–43. [Google Scholar] [CrossRef]
- Hackett, S.J.; Kimball, R.T.; Reddy, S.; Bowie, R.C.K.; Braun, E.L.; Braun, M.J.; Chojnowski, J.L.; Cox, W.A.; Han, K.-L.; Harshman, J.; et al. A phylogenomic study of birds reveals their evo-lutionary history. Science 2008, 320, 1763–1768. [Google Scholar] [CrossRef]
- Bouckaert, R.; Vaughan, T.G.; Barido-Sottani, J.; Duchêne, S.; Fourment, M.; Gavryushkina, A.; Heled, J.; Jones, G.; Kühnert, D.; De Maio, N.; et al. BEAST 2.5: An advanced software platform for Bayesian evolutionary analysis. PLoS Comput. Biol. 2019, 15, e1006650. [Google Scholar] [CrossRef]
- Webb, C.O. Exploring the phylogenetic structure of ecolog-ical communities: An example for rain forest trees. Am. Nat. 2000, 156, 145–155. [Google Scholar] [CrossRef]
- Gómez, J.P.; Bravo, G.A.; Brumfield, R.T.; Tello, J.G.; Cadena, C.D. A phylogenetic approach to disentangling the role of com-petition and habitat filtering in community assembly of Neotropical forest birds. J. Anim. Ecol. 2010, 79, 1181–1192. [Google Scholar] [CrossRef] [PubMed]
- Gotelli, N.J.; Entsminger, G.L. Swap and fill algorithms in null model analysis: Rethinking the knight’s tour. Oecologia 2001, 129, 281–291. [Google Scholar] [CrossRef] [PubMed]
- Revell, L.J.; Harmon, L.J.; Collar, D.C. Phylogenetic signal, evolutionary process, and rate. Syst. Biol. 2008, 57, 591–601. [Google Scholar] [CrossRef]
- Fritz, S.A.; Purvis, A. Selectivity in mammalian extinction risk and threat types: A new measure of phylogenetic signal strength in binary traits. Conserv. Biol. 2010, 24, 1042–1051. [Google Scholar] [CrossRef]
- Freckleton, R.P.; Harvey, P.H.; Pagel, M. Phylogenetic analysis and comparative data: A test and review of evidence. Am. Nat. 2002, 160, 712–726. [Google Scholar] [CrossRef]
- Pagel, M. Inferring the historical patterns of biological evolution. Nature 1999, 401, 877–884. [Google Scholar] [CrossRef]
- Orme, D.; Freckleton, R.; Thomas, G.; Petzoldt, T.; Fritz, S.; Isaac, N.; Pearse, W. Caper: Comparative Analyses of Phylogenetics and Evolution in R. R Package, Version 1.0.1. 2018. Available online: https://CRAN.R-project.org/package=caper (accessed on 8 March 2025).
- Chevan, A.; Sutherland, M. Hierarchical partitioning. Am. Stat. 1991, 45, 90–96. [Google Scholar] [CrossRef]
- MacNally, R. Multiple regression and inference in ecology and conservation biology: Further comments on identifying important predictor variables. Biodivers. Conserv. 2002, 11, 1397–1401. [Google Scholar] [CrossRef]
- Lai, J.; Zou, Y.; Zhang, S.; Zhang, X.; Mao, L. glmm.hp: An R package for computing individual effect of predictors in generalized linear mixed models. J. Plant Ecol. 2022, 15, 1302–1307. [Google Scholar] [CrossRef]
- Lai, J.; Zhu, W.; Cui, D.; Mao, L. Extension of the glmm.hp package to zero-inflated generalized linear mixed models and multiple regression. J. Plant Ecol. 2023, 16, rtad038. [Google Scholar] [CrossRef]
- Nava-Díaz, R.; Zuria, I.; Pineda-López, R. Taxonomic, phylogenetic and functional diversity of bird assemblages in urban green spaces: Null model analyses, temporal variation and ecological drivers. Front. Ecol. Evol. 2022, 9, 795913. [Google Scholar] [CrossRef]
- Freeman, B.G.; Weeks, T.; Schluter, D.; Tobias, J.A. The latitudinal gradient in rates of evolution for bird beaks, a species interaction trait. Ecol. Lett. 2022, 25, 635–646. [Google Scholar] [CrossRef] [PubMed]
- Diamond, J.M. Assembly of species communities. In Ecology and Evolution of Communities; Cody, M.L., Diamond, J.M., Eds.; Harvard University Press: London, UK, 1975; pp. 342–444. [Google Scholar]
- Keddy, P.A. Assembly and response rules: Two goals for predictive community ecology. J. Veg. Sci. 1992, 3, 157–164. [Google Scholar] [CrossRef]
- Sinha, A.; Menzies, R.K.; Chatterjee, N.; Rao, M.; Naniwadekar, R. Drivers of taxonomic, phylogenetic, and functional beta diversity of Himalayan riverine birds. Front. Ecol. Evol. 2022, 10, 788184. [Google Scholar] [CrossRef]
- Tozer, D.C.; Nol, E.; Abraham, K.F. Effects of local and landscape-scale habitat variables on abundance and reproductive success of wetland birds. Wetl. Ecol. Manag. 2010, 18, 679–693. [Google Scholar] [CrossRef]
- Hamza, F.; Selmi, S. Diversity of waterbirds wintering in Douz wetlands (South Tunisia): Factors affecting wetland occupancy and species richness. Ecol. Res. 2018, 33, 917–925. [Google Scholar] [CrossRef]
- Almeida, B.D.A.; Green, A.J.; Sebastián-González, E.; dos Anjos, L. Comparing species richness, functional diversity and functional composition of waterbird communities along environmental gradients in the neotropics. PLoS ONE 2018, 13, e0200959. [Google Scholar] [CrossRef]
- Hamza, F.; Abdi, M.; Chokri, M.-A.; Yacoubi, L.; Dlensi, H.; Hammouda, N.; Ghlis, A.; Jemaa, B.; Elghoul, M.; Hedhili, A.; et al. Landscape context and wetland attributes influence wintering waterbirds in important bird and biodiversity areas: Implications for conservation and management. Landsc. Ecol. 2024, 39, 151. [Google Scholar] [CrossRef]
- Gao, B.; Gong, P.; Zhang, W.; Yang, J.; Si, Y. Multiscale effects of habitat and surrounding matrices on waterbird diversity in the Yangtze River Floodplain. Landsc. Ecol. 2021, 36, 179–190. [Google Scholar] [CrossRef]
- Fernández, C.; Acosta, F.J.; Abellá, G.; López, F.; Díaz, M. Complex edge effect fields as additive processes in patches of ecological systems. Ecol. Model. 2002, 149, 273–283. [Google Scholar] [CrossRef]
- Che, X.; Zhang, M.; Zhao, Y.; Zhang, Q.; Quan, Q.; Møller, A.; Zou, F. Phylogenetic and functional structure of wintering waterbird communities associated with ecological differences. Sci. Rep. 2018, 8, 1232. [Google Scholar] [CrossRef] [PubMed]


| Habitat Variable | Definition |
|---|---|
| SEW (ha) | The spatial extent of each wetland |
| EOW (ha) | Extent of open water in each wetland |
| HD | Habitat diversity within each wetland |
| TA (ha) | Total area of wetland (>1 ha) within a 5 km buffer zone surrounding each wetland |
| SW | Wetzel’s (1975) [37] shape index of wetlands. SW = Perimeter/circumference of a circle of equal area: L/2 (L: wetland perimeter, A: wetland area) |
| Boating Index | Defined by the frequency of boat traffic within the water body |
| Human Activity Index | Defined by the occurrence rate of fishermen and tourists within the study area |
| Trait Types | Traits | Value Type | Phylogentic Signal | PBrownian | Prandom |
|---|---|---|---|---|---|
| Resource quantity | Body mass | Continuous | λ = 0.905 ** | 0.008 ** | |
| Main food type | Vertebrates | Binary | D = 0.164 (N = 31) | 0.319 | <0.001 *** |
| Invertebrates | Binary | D = 0.020 (N = 57) | 0.496 | <0.001 *** | |
| Plants | Binary | D = −0.153 (N = 35) | 0.638 | <0.001 *** | |
| Main foraging method(s) | Pursuit | Binary | D = 0.123 (N = 17) | 0.373 | <0.001 *** |
| Gleaning | Binary | D = 0.820 (N = 8) | 0.030 | 0.212 | |
| Pouncing | Binary | D = −0.015 (N = 23) | 0.552 | <0.001 *** | |
| Grazing | Binary | D = −0.516 (N = 12) | 0.901 | <0.001 *** | |
| Digging | Binary | D = 0.017 (N = 6) | 0.537 | 0.004 ** | |
| Scavening | Binary | D = 0.456 (N = 5) | 0.225 | 0.06 | |
| Probing | Binary | D = −0.031 (N = 35) | 0.527 | <0.001 *** | |
| Main foraging substrate(s) | Water | Binary | D = −0.054 (N = 50) | 0.589 | <0.01 ** |
| Mud | Binary | D = −0.376 (N = 15) | 0.861 | <0.01 ** | |
| Vegetation | Binary | D = 0.137 (N = 16) | 0.359 | <0.001 *** |
| Habitat | Diversity Metrics | R2 | SEW | EOW | HD | TA | SW | BI | HAI |
|---|---|---|---|---|---|---|---|---|---|
| lake | Phylogenetic NRI | 0.550 | 21.87 | −21.07 | −4.51 | −4.49 | 7.22 | −15.98 | 24.87 |
| Phylogenetic NTI | 0.433 | −16.31 | 17.95 | −33.45 | −2.86 | 4.78 | 22.64 | −2.01 | |
| Functional NRI | 0.487 | 10.3 | −9.01 | −15.94 | −24.18 | 3.14 | −28.06 | 9.37 | |
| Functional NTI | 0.786 | 16.97 * | −18.06 ** | −32.54 ** | −4.59 | −3.64 | −18.12 | 6.08 | |
| River | Phylogenetic NRI | 0.941 | 8.59 | −15.51 | −5.14 | −12.63 | −5.41 | 7.21 | 45.51 |
| Phylogenetic NTI | 0.837 | −22.17 | 9.29 | 4.79 | 5.36 | −44.66 | 10.97 | 2.76 | |
| Functional NRI | 0.919 | 22 | −37.32 | −2.98 | 4.47 | −24.62 | −2.3 | −6.32 | |
| Functional NTI | 0.999 | 13.43 * | −14.11 | −6.75 | −21.14 * | −9.4 * | −22.26 | 12.92 | |
| Pond | Phylogenetic NRI | 0.266 | 15.14 | −15.66 | −7.25 | 5.15 | 32.68 | −11.98 | −12.13 |
| Phylogenetic NTI | 0.151 | 29.72 | −25.02 | −17.94 | 3.84 | −3.57 | −8.93 | −10.99 | |
| Functional NRI | 0.468 | −16.71 | 17.29 | 19.8 | 8.11 | 5.35 | −30.67 | −1.9 | |
| Functional NTI | 0.723 | −9.76 | −11.02 | −7.67 | 3.58 | −2.46 | −57.64 ** | −7.87 | |
| Subsidence Wetland | Phylogenetic NRI | 0.999 | 17.03 * | −16.50 * | −20.16 * | 24.97 * | −8.53 * | 5.73 | 7.08 * |
| Phylogenetic NTI | 0.747 | 32.54 | −31.35 | −13.25 | −12.85 | 3.18 | −4.23 | 2.59 | |
| Functional NRI | 0.967 | 29.59 | −28.70 | −16.15 | 6.82 | −12.47 | −3.29 | 2.98 | |
| Functional NTI | 0.926 | 17.68 | −16.78 | −15.89 | 13.80 | −10.18 | −17.11 | 8.56 |
Disclaimer/Publisher’s Note: The statements, opinions and data contained in all publications are solely those of the individual author(s) and contributor(s) and not of MDPI and/or the editor(s). MDPI and/or the editor(s) disclaim responsibility for any injury to people or property resulting from any ideas, methods, instructions or products referred to in the content. |
© 2025 by the authors. Licensee MDPI, Basel, Switzerland. This article is an open access article distributed under the terms and conditions of the Creative Commons Attribution (CC BY) license (https://creativecommons.org/licenses/by/4.0/).
Share and Cite
Li, Y.; Wang, X.; Yong, X.; Wu, Y.; Wu, C.; Hu, W. Assembly Processes of Waterbird Communities Across Different Types of Wetlands in the Middle Reaches of the Huaihe River Basin. Water 2025, 17, 1118. https://doi.org/10.3390/w17081118
Li Y, Wang X, Yong X, Wu Y, Wu C, Hu W. Assembly Processes of Waterbird Communities Across Different Types of Wetlands in the Middle Reaches of the Huaihe River Basin. Water. 2025; 17(8):1118. https://doi.org/10.3390/w17081118
Chicago/Turabian StyleLi, Yongmin, Xiaoyu Wang, Xu Yong, Yatao Wu, Chuansheng Wu, and Wenfeng Hu. 2025. "Assembly Processes of Waterbird Communities Across Different Types of Wetlands in the Middle Reaches of the Huaihe River Basin" Water 17, no. 8: 1118. https://doi.org/10.3390/w17081118
APA StyleLi, Y., Wang, X., Yong, X., Wu, Y., Wu, C., & Hu, W. (2025). Assembly Processes of Waterbird Communities Across Different Types of Wetlands in the Middle Reaches of the Huaihe River Basin. Water, 17(8), 1118. https://doi.org/10.3390/w17081118