Article

Accumulation Patterns and Numerical Simulation of Nitrate-N in Layered Soils of the Vadose Zone in Cotton Fields

by
Feng Li
1,
Shihong Yang
2,
Xiyun Jiao
2 and
Zewei Jiang
2,3,*
1
College of Hydraulic Engineering, Zhejiang Tongji Vocational College of Science and Technology, Hangzhou 311231, China
2
College of Agricultural Engineering, Hohai University, Nanjing 210098, China
3
College of Soil and Water Conservation, Hohai University, Nanjing 210098, China
*
Author to whom correspondence should be addressed.
Water 2025, 17(8), 1117; https://doi.org/10.3390/w17081117
Submission received: 27 February 2025 / Revised: 20 March 2025 / Accepted: 20 March 2025 / Published: 9 April 2025
(This article belongs to the Section Soil and Water)

Abstract

:
Excessive nitrogen fertilizer in cotton cultivation boosts yields but causes groundwater pollution via nitrate-N (NO3-N) accumulation. This study combined field experiments and HYDRUS-1D modeling to analyze water and NO3-N dynamics in the vadose zone of cotton fields in Nanpi, Hebei Province, North China, under deep groundwater conditions. Monitoring during a 184-day growth period revealed that NO3-N accumulation increased from 11.4 to 21.2 g m−3 under conventional flood irrigation and pre-sowing fertilization. Soil texture critically influenced peak NO3-N accumulation depth, while rainfall, moisture, and crop uptake affected migration patterns. The HYDRUS-1D model was employed to numerically simulate the accumulation and migration of water and N in the cotton vadose zone. The HYDRUS-1D simulations closely matched the observed data, demonstrating effectiveness at modeling water–nitrogen transport patterns in the cotton vadose zone under deep groundwater conditions. Various factors, including rainfall, soil texture, soil moisture content, and crops, influenced the accumulation in the soil vadose zone. Notably, the location of the nitrate-N accumulation peak in the soil vadose zone was influenced by soil texture. This study highlights the environmental risks of current practices and provides insights for optimizing fertilizer management in arid agricultural zones.

1. Introduction

Cotton is one of the major economic and widely cultivated crops in the north of the Yangtze River. Over the years, several major cotton-producing regions have been established nationwide. In recent years, cotton farmers have increasingly applied N fertilizer to boost yields. However, the excessive use of this fertilizer has led to the volatilization of a significant portion of N or its retention in the soil, which, in turn, can leach into shallow groundwater along with soil moisture. This results in serious environmental consequences, such as soil acidification and contamination of groundwater resources, which pose significant challenges for sustainable agriculture and environmental management.
The transformation pathways of N in soil primarily encompass mineralization–fixation, nitrification–denitrification, and adsorption and desorption processes, which are all interconnected and influence each other. Consequently, the distribution of soil N results in a myriad of combined effects. Among the various forms of nitrogen in soil, ammonium (NH4+) and nitrate (NO3) are the two primary forms directly utilized by plants. Ammonium N has limited mobility within the soil, whereas nitrate-N, owing to its resistance to soil adsorption and its high mobility, is a primary cause of N loss and water pollution [1]. Studies indicate that intense nitrification in dryland soil is predominantly due to nitrate-N [2], resulting in a more pronounced accumulation and leaching of nitrate-N in dry lands compared with paddy fields. In recent years, numerous scholars have investigated the impact of N application rates, planting methods, irrigation quotas, precipitation, soil texture, and groundwater on the accumulation and leaching of nitrate-N in soil [3,4,5,6,7,8,9]. However, most research has been centered around food crops and vegetables, focusing on the transport and transformation of nitrate-N within the crop root zone or the leaching patterns in shallow groundwater areas. There is a notable lack of studies addressing the accumulation and transport of nitrate in the aeration zone of cotton fields under deep groundwater conditions, especially in the arid and semi-arid regions of northern China. This gap in research is particularly concerning as the unique soil properties, irrigation practices, and environmental conditions of cotton fields could result in different nitrate dynamics compared with other agricultural systems.
In the past few decades, the extent of farmland irrigated with groundwater has significantly expanded. This ongoing extraction of groundwater has resulted in a severe depletion of water resources, a gradual decline in water levels, and the thickening of the aeration zone [10,11]. The North China Plain (NCP) is one of China’s main granaries and also serves as a vital region for grain and cotton production [12,13]. Given that a field experiment is expensive and laborious, mathematical models might be a potential method to effectively describe the transport and transformation of water and nutrients in the soil. Existing models, such as SWAP, DSSAT, EPIC, and HYDRUS, have been widely used to estimate soil moisture dynamics [14,15]. However, among those famous process-based models, HYDRUS is good at combining processes in the vadose zone and groundwater [16]. Therefore, this study used the HYDRUS-1D model for the numerical simulation. The HYDRUS 5.01 model software was successfully developed by the U.S. Salinity Laboratory in 1991. It simulates the transport of saturated–unsaturated soil water, heat, and various solutes based on the principles of the LEACHM model. It is widely used in research regarding soil moisture and pollutant transport and transformation [17,18,19,20].
The objectives of this study were as follows: (1) to construct a localized water and N transport model based on real geological soil conditions and in situ field test data; (2) to explore the model’s applicability in simulating the accumulation and migration of water and N in the cotton vadose zone; (3) to explore optimized irrigation and fertilization practices used for cotton in the NCP. Furthermore, it provides data support for the current status of N accumulation in the vadose zone of cotton fields in northern cotton production areas from the study of the accumulation patterns of nitrate-N under conventional planting patterns as well as positive guiding significance for effectively reducing N fertilizer pollution.

2. Materials and Methods

2.1. Overview of the Test Area

The experiment was conducted in Nanpi County, Cangzhou City, Hebei Province, where cotton is the primary crop (Figure 1). Most of the soil is desalinized fluvo-aquic soil. Before irrigation, the soil dry bulk density within 1 m of the soil layer at the test site was measured to be 1.42 g cm−3. Before initiating the experiment, the soil texture of the layered soil profile was determined by the collection and analysis of three samples based on soil layer divisions, as outlined in Table 1. The annual precipitation in this region is 400–550 mm. Influenced by the monsoon climate, rainfall is predominantly concentrated in summer (July and August), with summer precipitation accounting for 73% of the annual total in this area. The region boasts abundant light resources, with water evaporation ranging from 1900 to 2200 mm per year. Nanpi County also experiences severe groundwater overexploitation, with groundwater buried at a considerable depth of 5–7 m. Figure 2 presents the details of the groundwater fluctuations measured in the field during the experiment. The irrigation water source utilized was groundwater extracted from a pump well. A groundwater quality analysis revealed that the water had been largely desalinized under current conditions, with a total salt content of 1.0 g L−1. The conventional irrigation and fertilization method was derived from consulting the planting practices of local cotton farmers. Before sowing, 1044 m3 ha−1 of soil moisture was irrigated, followed by a 4-day drying period, with 750 kg ha−1 of compound fertilizer (containing 15% each of N, P, and K) as a base fertilizer. The field was then manually sown and covered with mulching film (90 cm wide).

2.2. Test Design

The experiment was divided into the following two parts: field and indoor experiments. The field experiment was the dynamic monitoring of soil moisture and the extraction of the soil solution. The indoor experiment analyzed the soil solution chemical indexes in the laboratory. During the experiment, the precipitation from July to August during the cotton growth period was relatively large, so there was no additional irrigation.

2.2.1. Field Test Layout Scheme

The test area was ~319.9 m2 and the field size was 16.7 m × 19.5 m. Groundwater and fertilizer monitoring wells were set up in the center of the test area to monitor the dynamic change in the groundwater level and the longitudinal distribution of soil water and fertilizer. Soil moisture sensors (TDRs, or time domain reflectometers) and soil solution extractors were horizontally buried at different depths of soil layers in the wells. The burial depths of the TDRs were 20, 60, 120, 160, 200, 250, 300, 350, 400, and 450 cm. The buried depths of the soil solution extractors were 60, 120, 180, 250, 300, 350, 400, 450, and 500 cm.
Soil moisture was observed every 6 days and the soil solution was extracted every 14 days. Additional measurements were conducted after rainfall, with the frequency depending on the amount of rain. The monitoring time was 9:00 a.m. In addition, the groundwater level and local hydrometeorological data were observed at the same time using a well.

2.2.2. Indoor Test Items and Methods

The laboratory tests primarily involved the chemical analysis of various indicators in soil and soil aqueous solutions. The specific testing methods for the soil solutions followed the previous literature [21].
(1) The EC and pH values in the soil solutions were measured. Portable pH and conductivity meters (D-210C-S, HORIBA Co., Kyoto, Japan) were used.
(2) The NO3-N in the soil solutions was measured. The phenol disulfonic acid spectrophotometric method was employed for this measurement.
(3) A soil particle size analysis was conducted. A SEDIMAT 4–12 particle size analyzer (UGT, Göttingen, Germany) was utilized, employing the pipette method for the analysis.

3. Establishment of HYDRUS-1D Model

3.1. Model Description

The HYDRUS-1D model (version 3.00) [22,23] was applied in this study because it is easy to obtain, has a user-friendly input interface, and has been proven by hundreds of articles to be suitable for simulating groundwater transport and nitrogen. In addition, the model has compensatory root water absorption characteristics, where a portion of the reduced root water absorption due to water or salt stress in the root region is fully or partially compensated for by the non-stressed part of the root zone. In terms of water movement, the HYDRUS model numerically solves the Richards equations for saturated and unsaturated water flow [24]. The convection dispersion equation is used to simulate the transport/motion of heat and solutes.

3.2. Basic Equation

3.2.1. Soil Water Movement Equation

The basic motion equation of soil water movement adopts the modified Richards model [25].
θ t = x k h x + cos α s
where θ is the volumetric moisture content, t is time (d), h is the pressure head (cm), x is the spatial step size (cm), s is the root absorption term (cm3·cm−3·d−1), α is the angle between the flow and vertical directions (vertical flow α = 0; horizontal flow α = 90°), and k is the unsaturated hydraulic conductivity, expressed here as
K h , x = K s ( x ) K r ( h , x )
where Ks is the saturated hydraulic conductivity (cm·d−1) and Kr is the relative hydraulic conductivity.
The Feddes model is used for root absorption term parameters, which is based on the water potential difference, and the formula is as follows:
S h , h , x = α h , h , x b x T p
where s is the actual root water absorption function of crops, α is an empirical function related to the soil water potential, h is the pressure head, b is the standard distribution function of the root water uptake, hφ is the seepage head related to the soil solution concentration, and Tp is the crop evapotranspiration.

3.2.2. Basic Equation of Soil Solute Transport

The soil solute transport model utilizes the classical CDE equation for a description.
θ c t = x θ D w c x q c x
where c is the solute concentration in the liquid phase, Dw is the hydrodynamic dispersion coefficient, q is the water flux obtained through the flow field, and S is the source–sink interaction during solute transport (complex physicochemical and biochemical processes in soil).
As the transformation process of N in soil is very complex, only mineralization, root absorption, biological fixation, and denitrification were considered in this study’s calculations. The main component of leaching in northern dry lands is considered to be nitrate-N.
S = S c r μ θ c μ θ c + γ θ
where Cr is the concentration of N absorbed by roots; μ and μ′ are the first-order kinetic parameters representing biological fixation and denitrification, respectively; and γ is the zero-order kinetic parameter of mineralization.

3.3. Initial and Boundary Conditions

3.3.1. Initial and Boundary Conditions of Soil Water Movement

θ x , 0 = θ i x Initial   conditions
K h x + cos α = q 0 t second - type   boundary   condition h l , 0 = 0 lower   boundary   condition
where x is the spatial step size (cm); h is the pressure head (cm); q0 is the net infiltration rate, which is the difference between rainfall and evaporation; and l is the buried depth of groundwater (cm).
The upper boundary is the boundary condition that allows surface ponding, i.e., the surface water height increases with rainfall and decreases with infiltration and evaporation. As the simulation object was the entire aeration zone, the groundwater fluctuation level was considered to be in the lower boundary condition and the time-varying head boundary condition was selected.

3.3.2. Initial and Boundary Conditions of Soil Solute Transport

The initial and boundary conditions of solute transport mainly consider the effects of precipitation, irrigation, evaporation, and groundwater levels.
θ x , 0 = θ i x Initial   conditions
θ D c x + q c = q 0 c 0 upper   boundary   condition c x , t x = l = c d lower   boundary   condition
where c is the solute concentration of the soil solution in g cm−3; D is the hydrodynamic dispersion coefficient in cm2 d−1; x is the spatial coordinate, where the origin is on the surface and downward is positive in cm; c0 is the initial profile of the solute concentration distribution in g cm−3; cd is the salinity of the groundwater in g cm−3; and l is the buried depth of the groundwater in cm.

3.4. Model Parameters

Soil water movement and solute transport parameters are important for soil water and fertilizer simulations. The initial soil water movement parameters were determined based on the particle composition of each soil layer using the FTPs method in the HYDRUS-1D model. The parameters were optimized using the numerical inversion method. According to the literature [26], among the many parameters of soil water movement, the saturated water content and saturated hydraulic conductivity of soil are the most sensitive, so only these two parameters were used for the numerical inversion calculation. The obtained parameter values are shown in Table 2. The initial parameters of nitrate-N transport in soil were determined according to literature reports [27,28,29,30,31,32], and the parameters were optimized and calibrated according to the measured test data. The results are shown in Table 3.
As crop transpiration and inter-tree evaporation need to be considered, the empirical formula from Ceres [33] was used to estimate the inter-tree evaporation (Ep) according to the crop leaf area coefficient (LAI).
E p = E T p 1 0.43 LAI     LAI 1.0
E p = E T p 1.1 e 0.4 LAI             LAI 1.0
Then, the potential transpiration (Tp) of the plant is
T p = E T p E p
where ETp is crop evapotranspiration, which is calculated from the reference crop evapotranspiration (ET0) and crop coefficient (KC), while ET0 is based on the Penman–Monteith formula [34].

3.5. Unit Division and Time Step

The simulation area was set as the farmland from the soil surface to the groundwater surface. According to the soil texture distribution of the farmland, it was divided into eight layers, and observation points were set at depths of 60, 120, 180, 250, 300, 350, 400, and 450 cm. The unit of time dispersion was d, and the simulation time was 184 days. The initial, minimum, and maximum time steps were 0.001, 0.001, and 1 d, respectively [35,36].

4. Results and Analysis

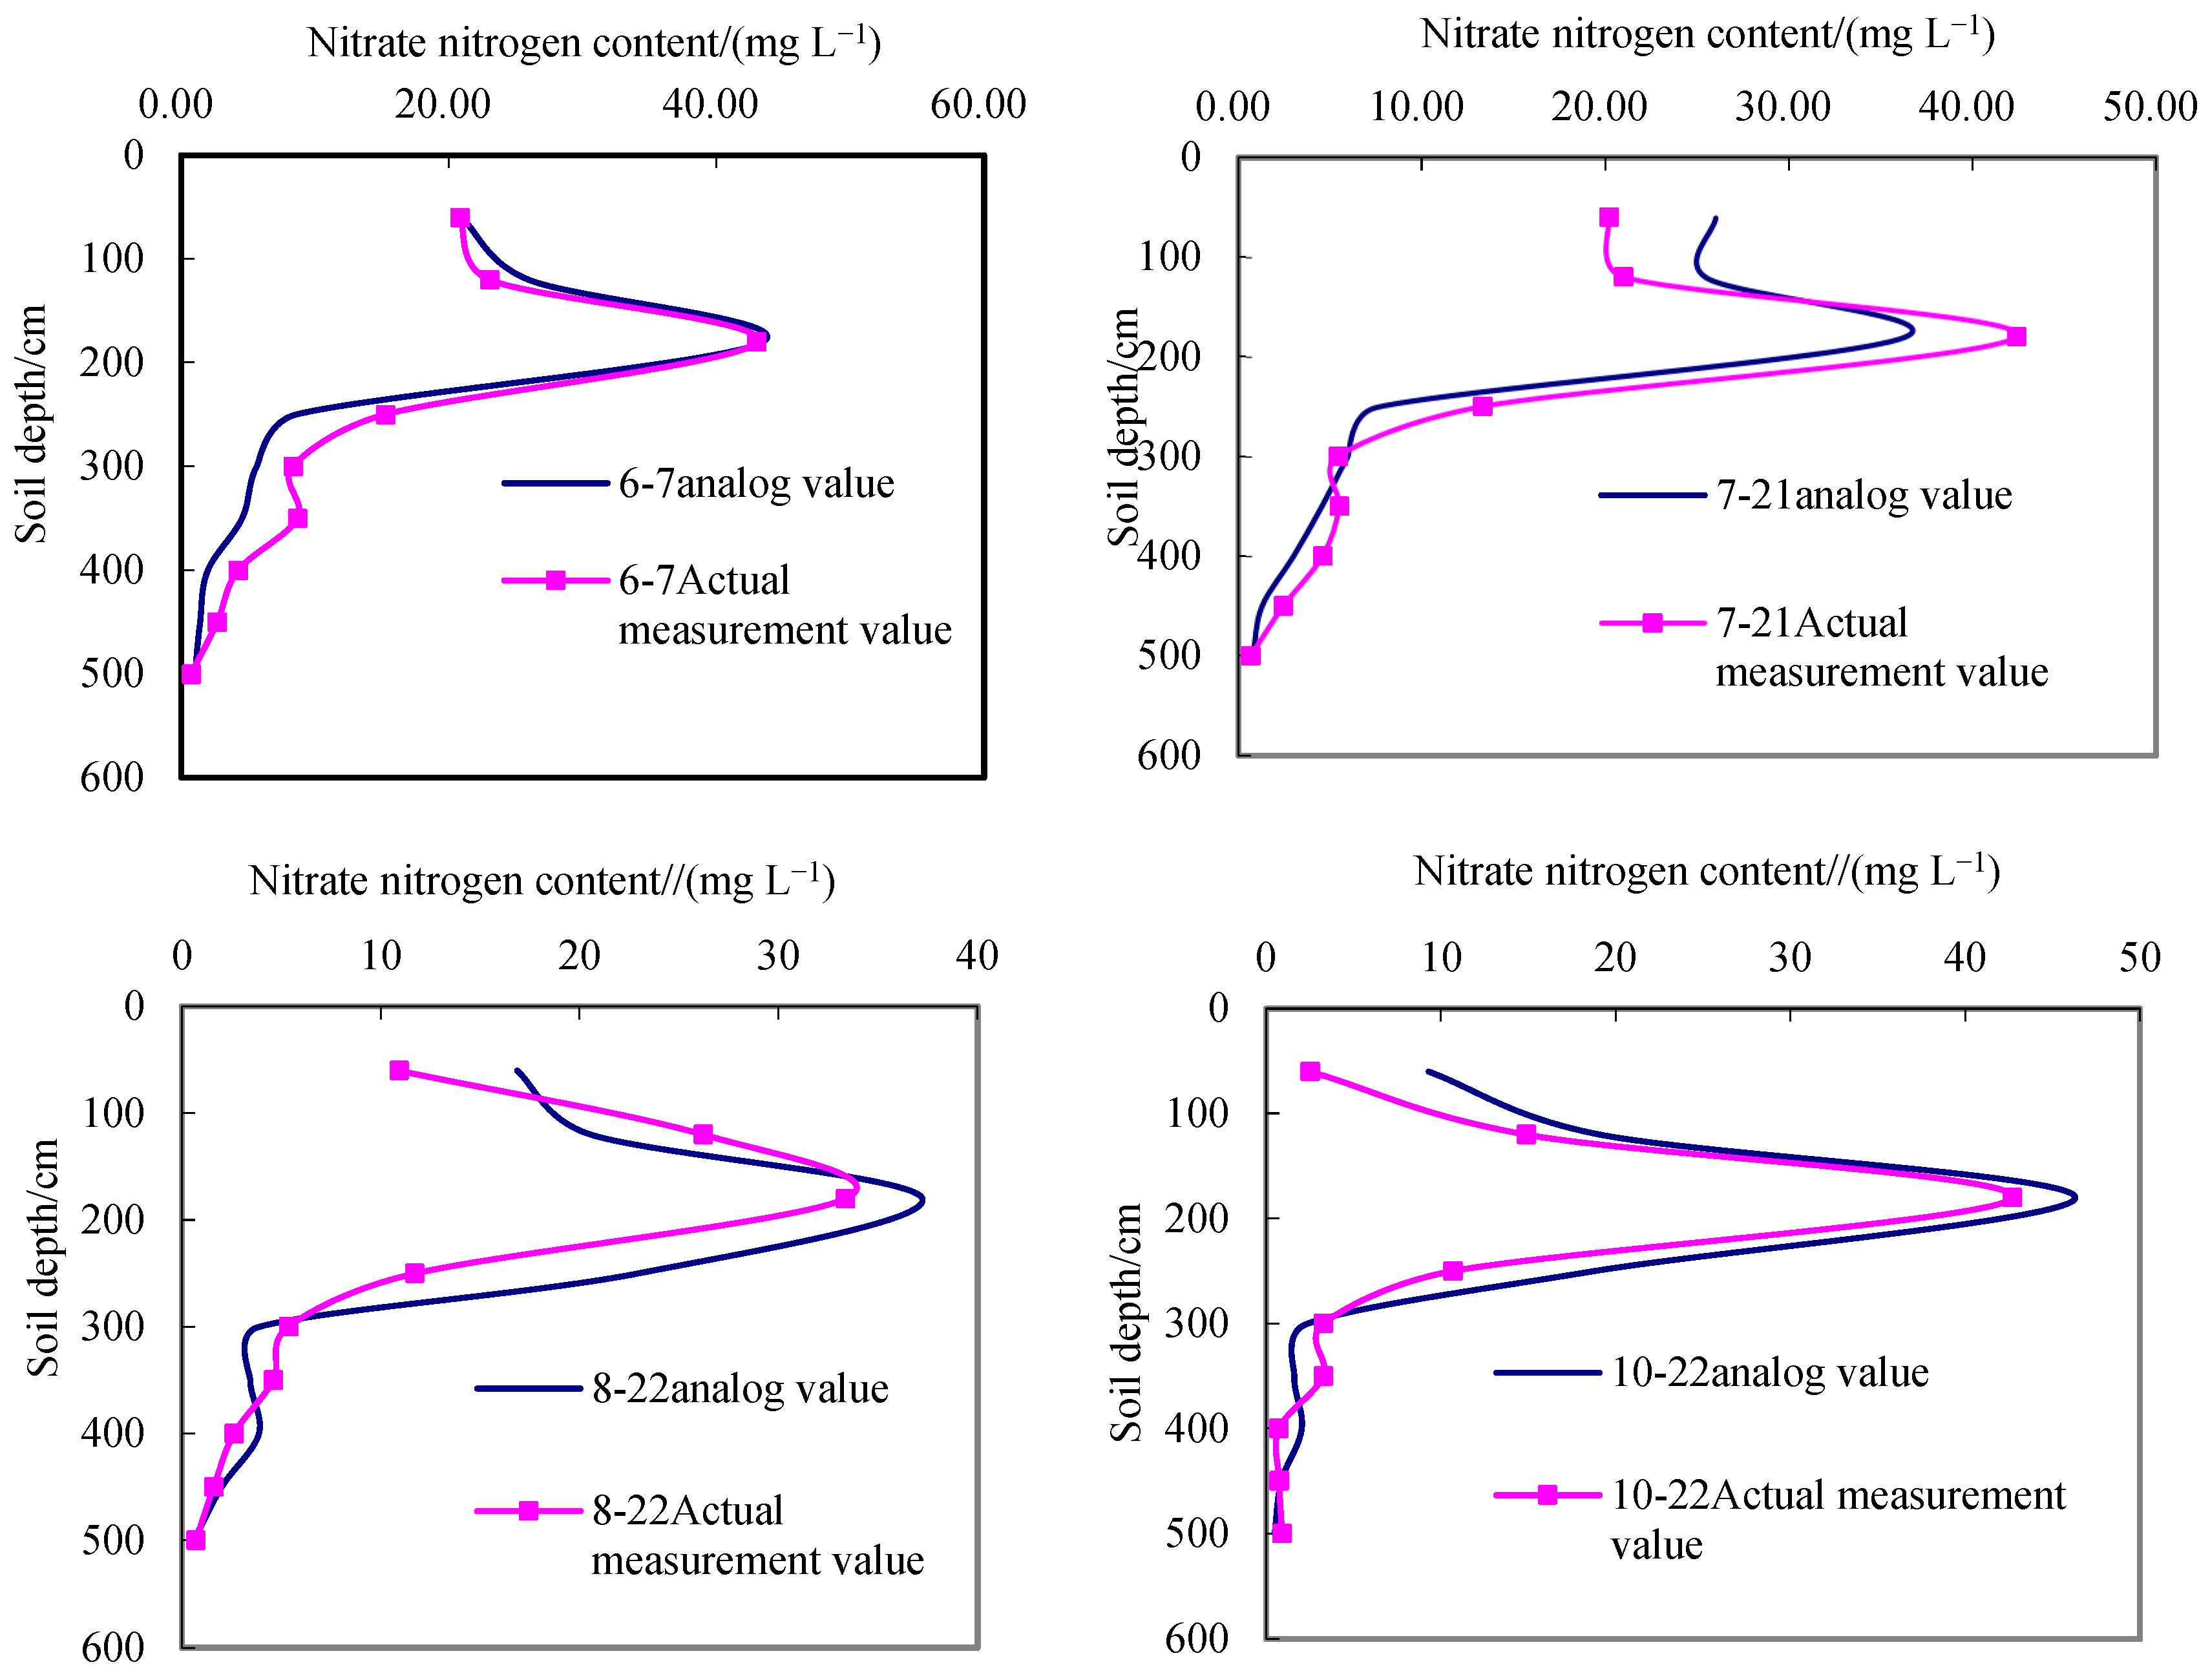
4.1. Model Validation

The simulation results were validated based on the field-measured soil moisture content and nitrate-N concentration. During the cotton growth period, the measured values of the soil moisture content (on 7 June, 30 June, 30 July, and 31 August) and nitrate-N concentration (on 7 June, 21 July, 22 August, and 22 October) in the vadose zone were compared with the simulated values on four randomly selected days based on age. The simulation results are shown in Figure 3 and Figure 4, showing that the overall simulation trend of the soil moisture content and nitrate-N content in the vadose zone was good, with the simulation trend of nitrate-N in deep soil (below 200 cm) being better than that in the root zone soil.
This study evaluated the simulation accuracy using the determination coefficient (R2), root mean square error (RMSE), and mean absolute error (MAE). The threshold value of R2 ranges from 0 to 1, with a higher R2 indicating better simulation performance. The RMSE and MAE values range from 0 to infinity, with smaller values indicating better simulation performance [37]. The evaluation results are shown in Table 4 and Table 5. The model obtained R2, RMSE, and MAE values of 0.71–0.97, 0.05–4.6, and 0.04–3.0, respectively, indicating the model’s good simulation performance, consistent with the actual situation. The RMSE and MAE values showed that the model’s RMSE for simulating soil water movement in the vadose zone was better than that for simulating nitrate-N in the vadose zone. The R2 values indicated that the fitting effect of the longitudinal nitrate-N distribution curve in the vadose zone was better than that of the water content distribution curve. The simulation results of soil moisture and nitrate-N in August were slightly worse than those in other periods. August is during the boll-filling stage of cotton, when crop roots vigorously absorb water and weather conditions are variable, indicating that reasonable boundary conditions and parameter selections had a significant impact on model accuracy. Overall, the simulated data of this model were consistent with the measured data. The model could be used to simulate water and N transport in the vadose zone of cotton under deep groundwater conditions.

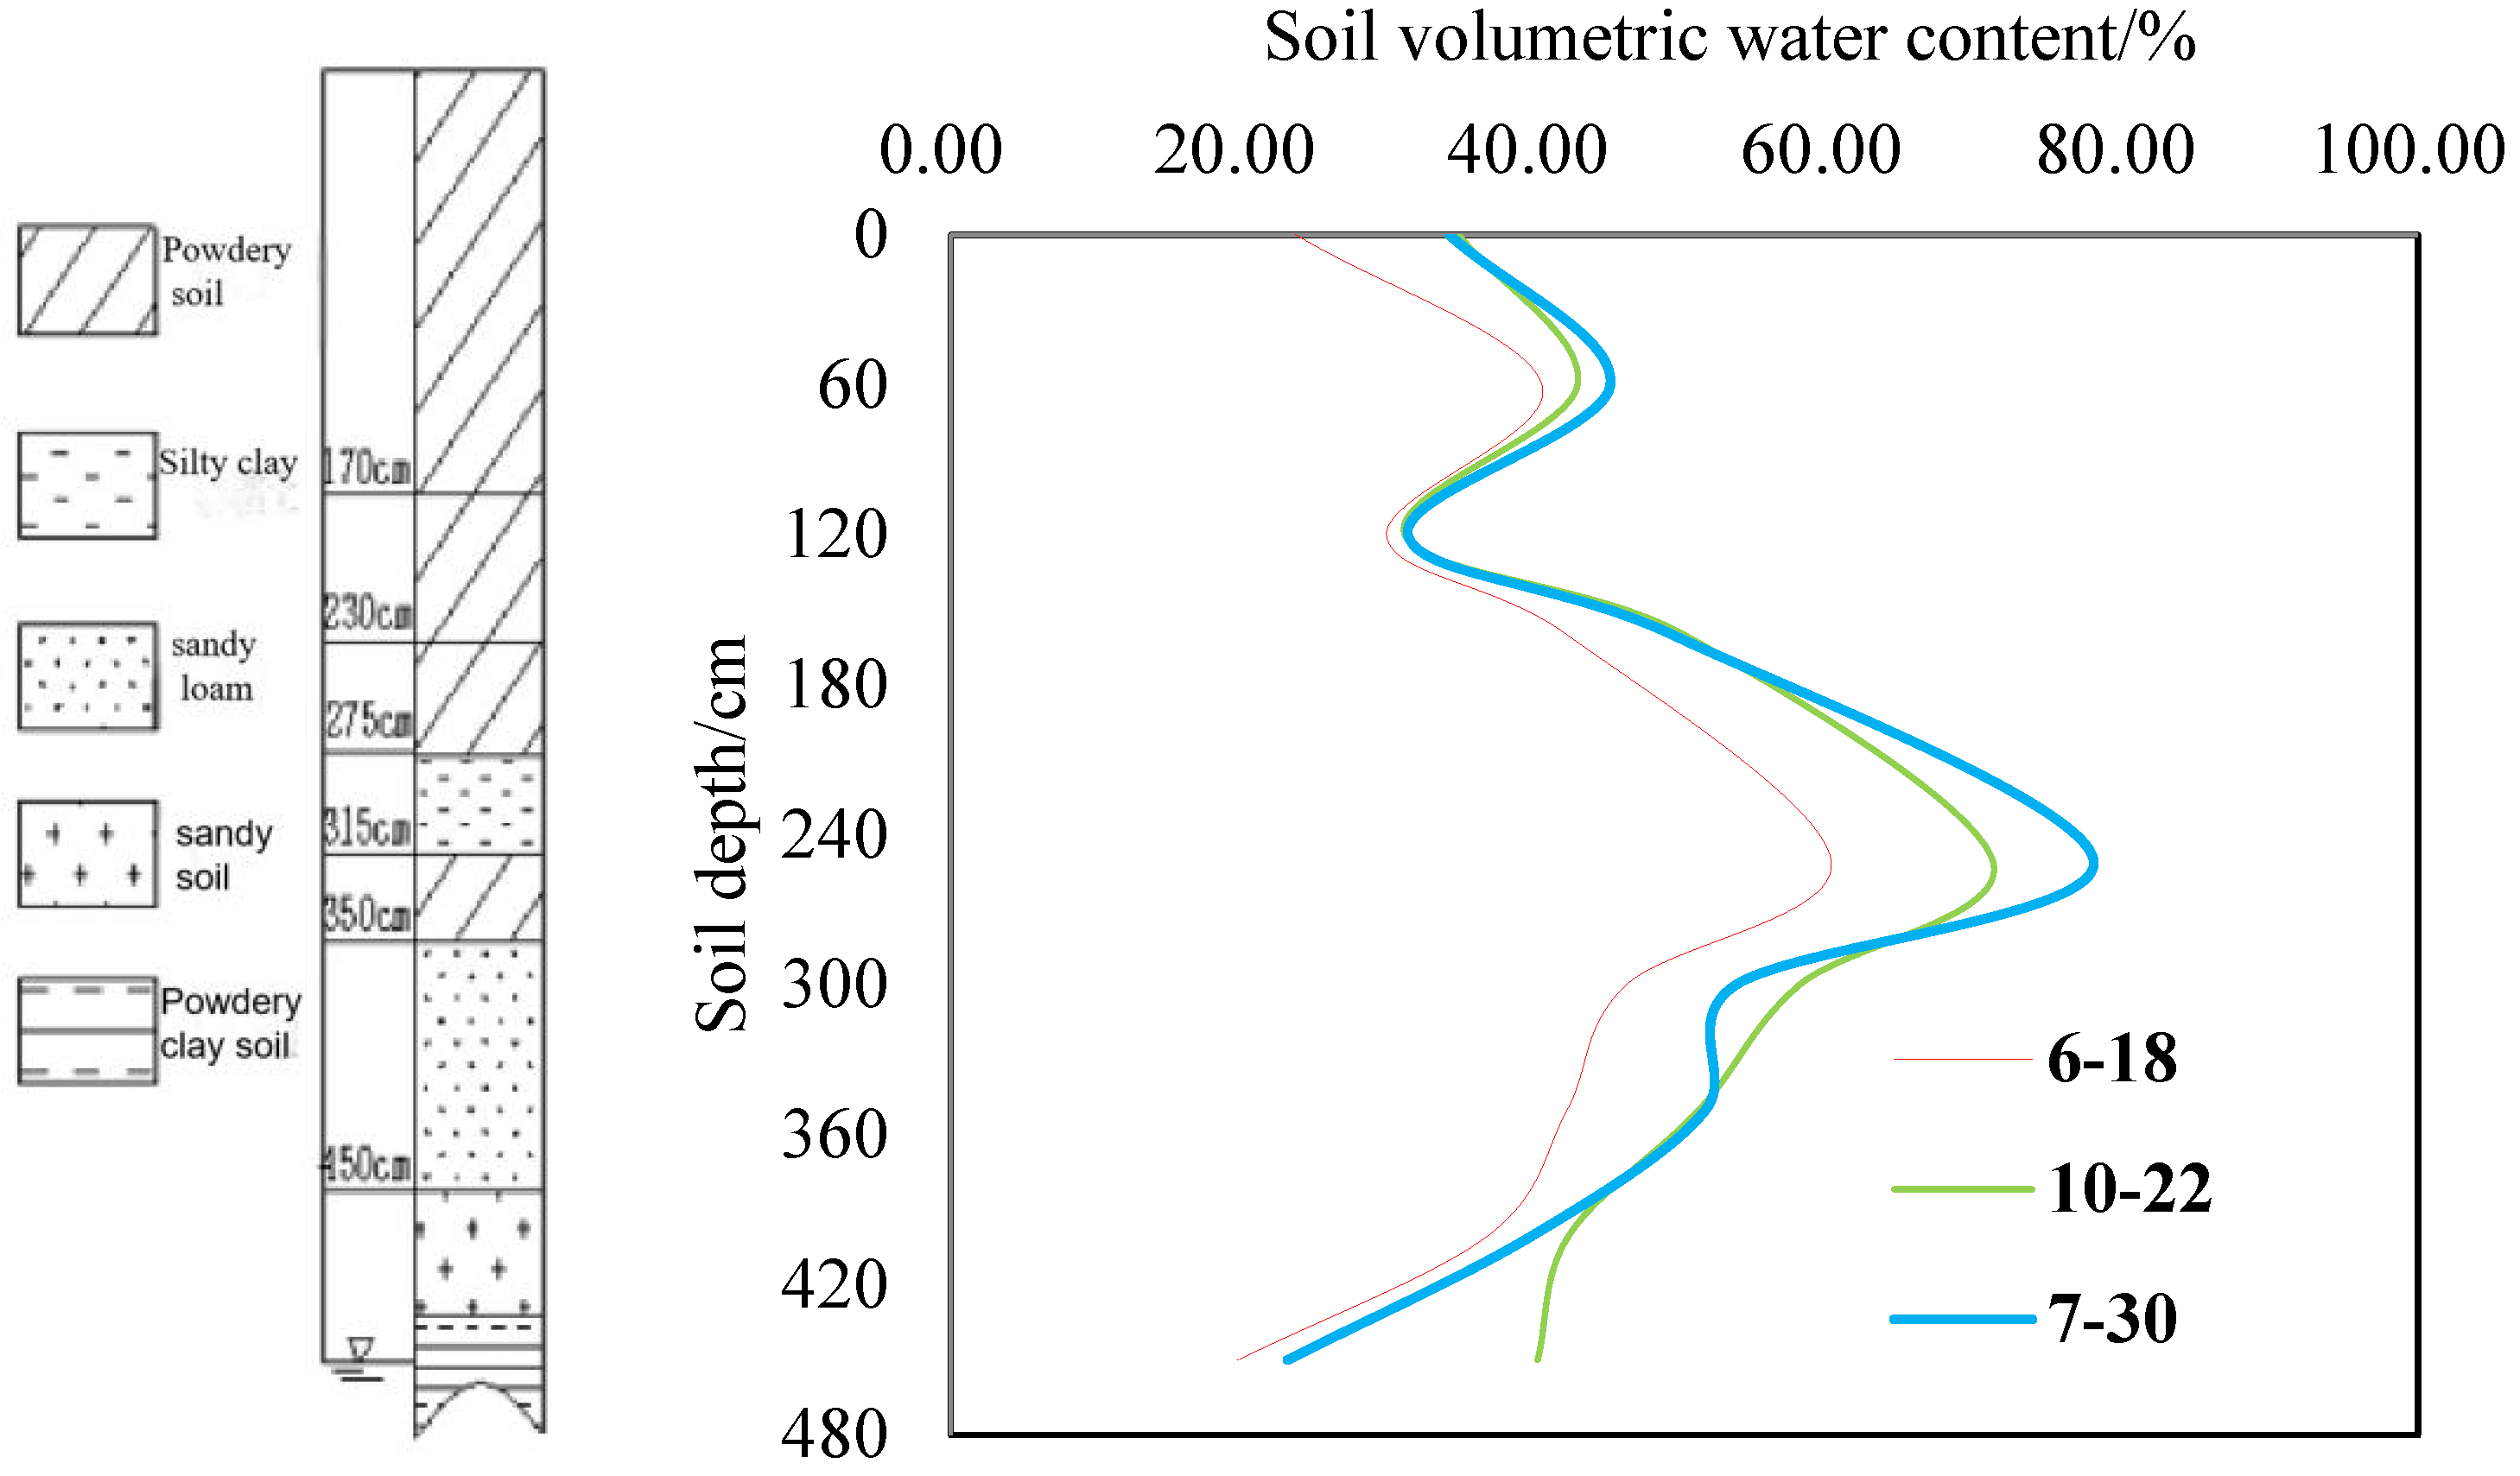
4.2. Basic Physicochemical Properties of Soil in the Vadose Zone

The soil texture of a soil aeration zone affects the function of this zone and the accumulation and migration of nitrate-N. The measured soil moisture content values on certain days in June, July, and October during the experiment were compared with the soil texture (Figure 5). The soil particles were sorted according to the clay content as follows: silty clay > silty loam > sandy loam > sandy soil. During the experiment, the soil moisture content at different depths of the soil profile was continuously monitored. The soil depth of 0–160 cm was an area where the moisture content changed relatively frequently, influenced by atmospheric precipitation, evaporation, and transpiration. The soil moisture content at a soil depth of 160–400 cm was greatly affected by the soil texture, with a higher moisture content at a soil depth of 250–300 cm, where a silty clay layer was distributed. The moisture content decreased at a soil depth of 350–400 cm, where sandy loam and sandy soil layers were distributed. The moisture content in the 450 cm soil layer was also affected by fluctuations in the groundwater level. In the later stages of the experiment, the groundwater level rose from 5.62 m at the beginning of the experiment to 4.68 m. Thus, the moisture content measured at 450 cm on 22 October was much higher than that measured on 18 June.

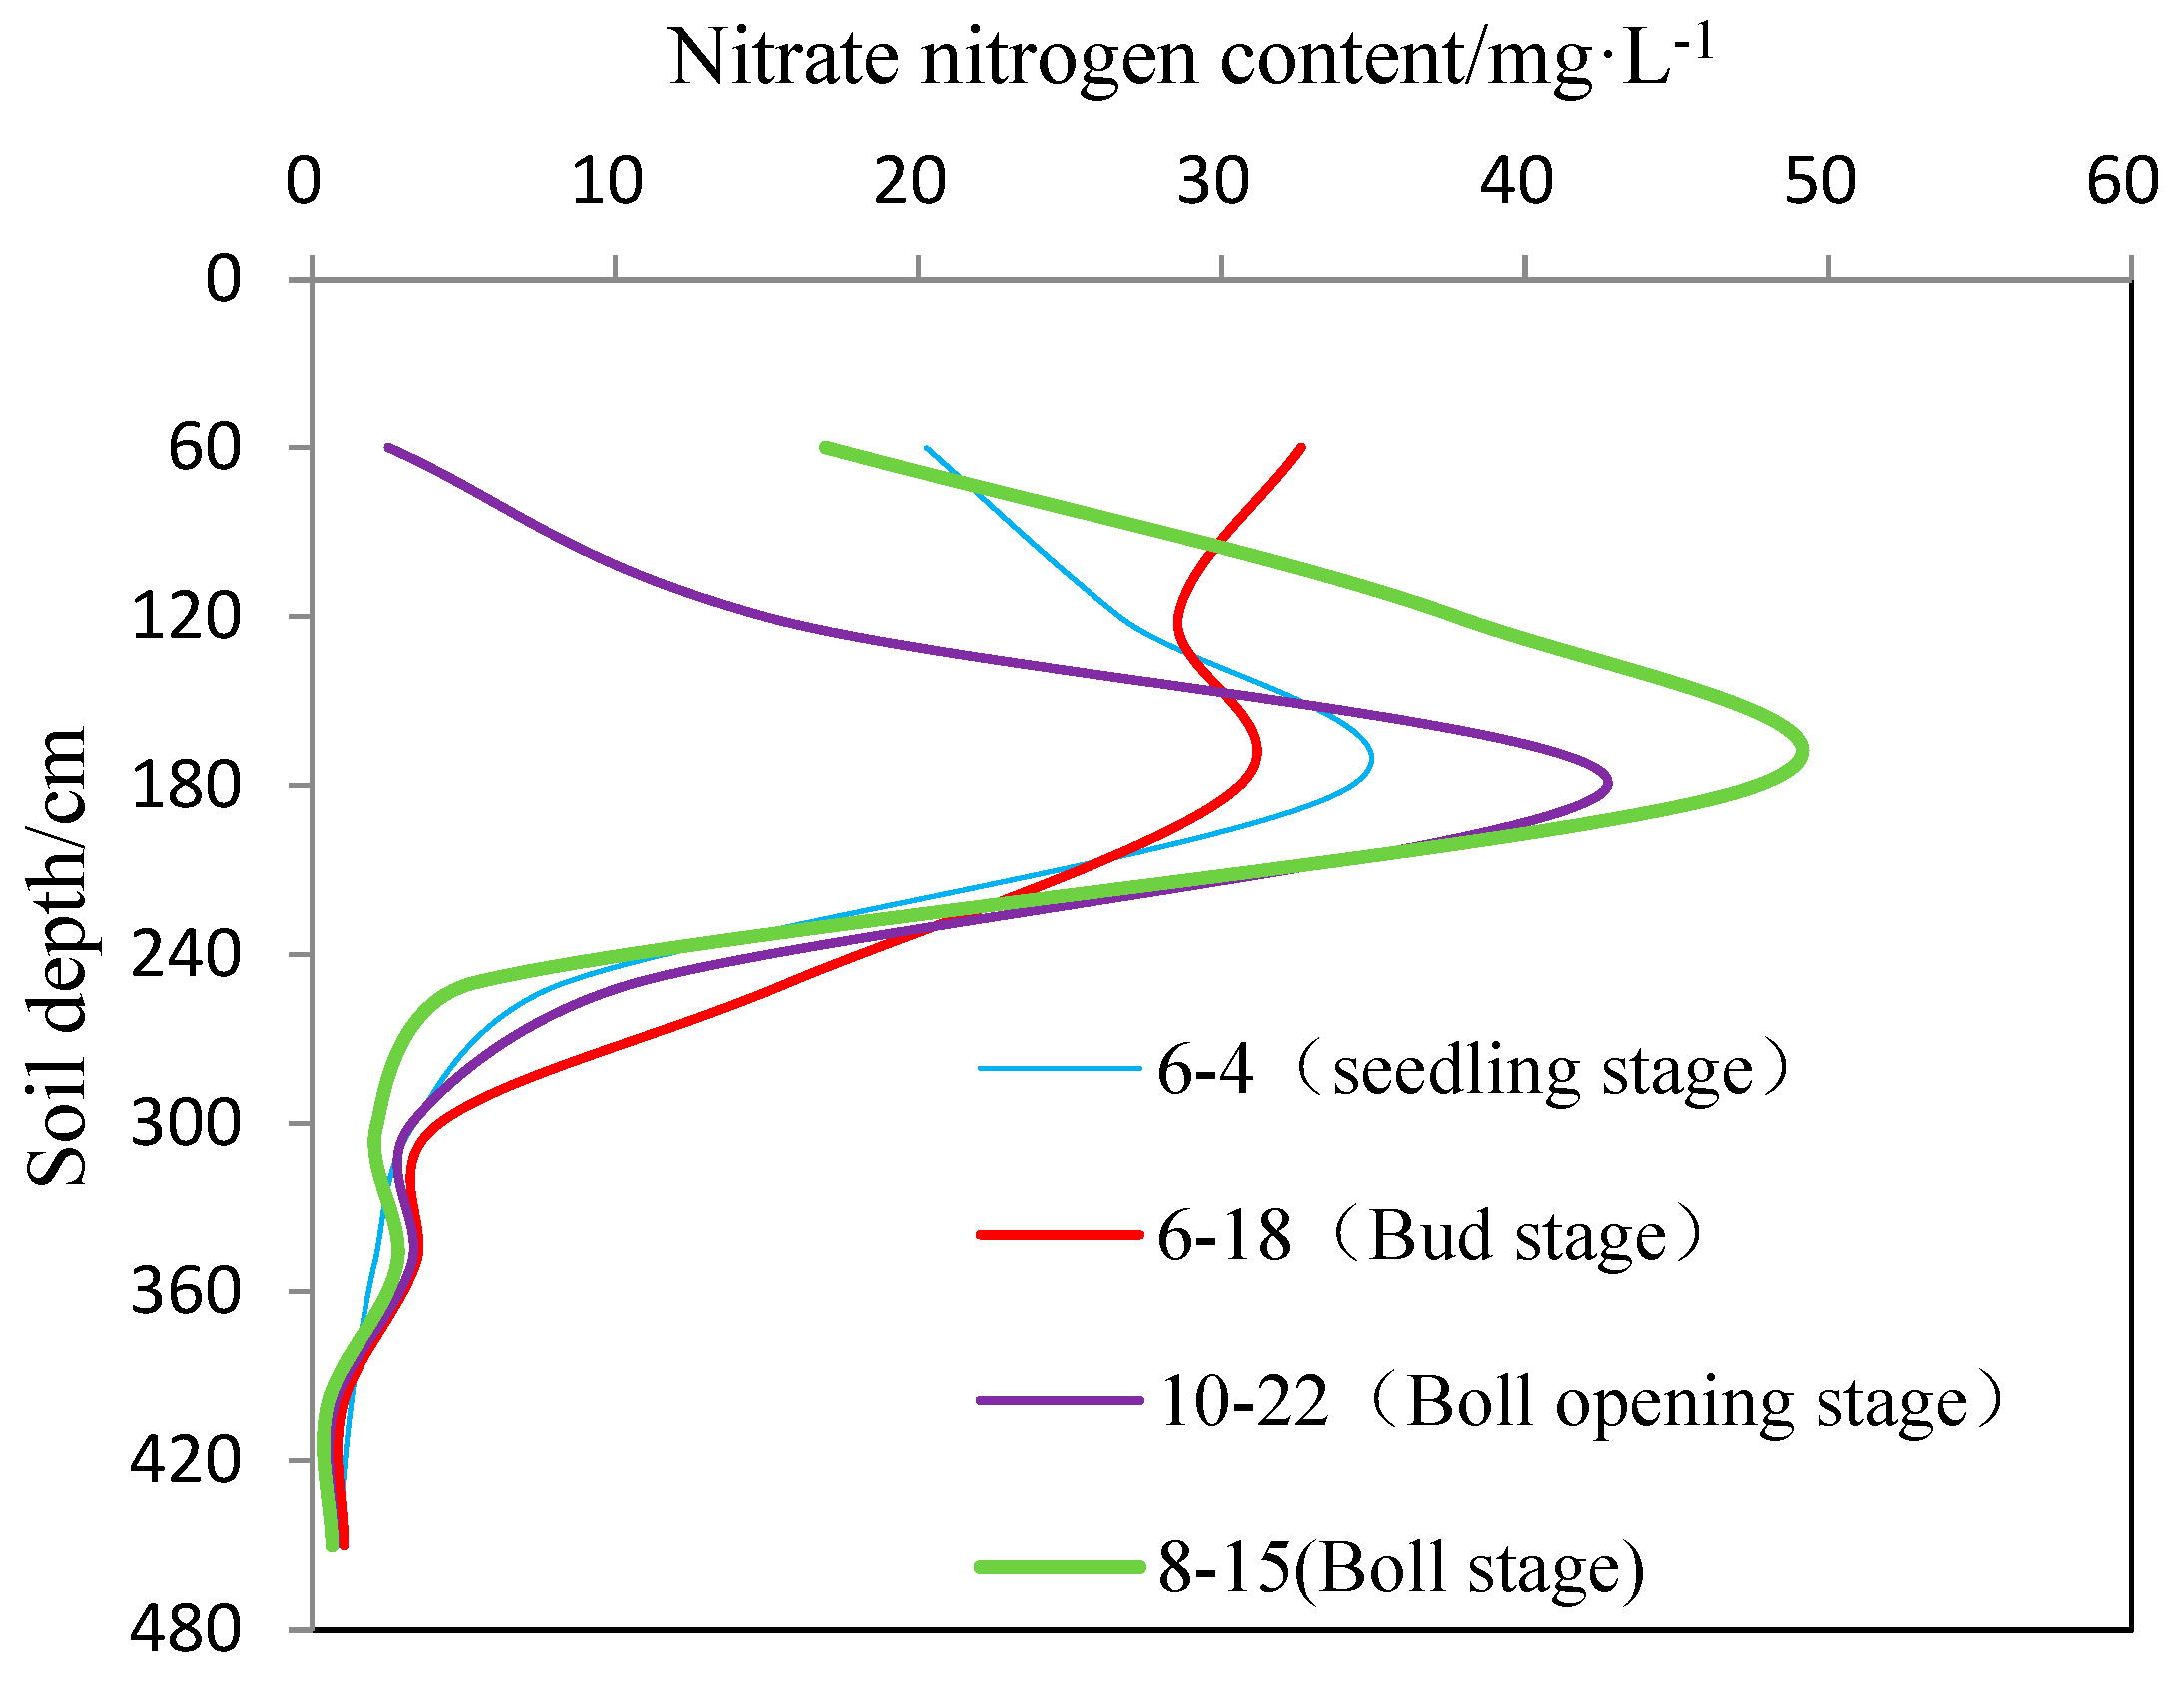
4.3. Accumulation and Migration Characteristics of Nitrate-N in Stratified Soil Profiles

Through monitoring, it was discovered that nitrate-N accumulation had occurred in the current soil vadose zone, primarily within the depth range of 120–250 cm, with a peak at around 180 cm. Compared with the soil texture, a silty clay layer was present at 250–315 cm. Consequently, the soil profile above 300 cm exhibited a particle distribution state that was coarse above and fine below. The silty clay layer effectively hindered the migration of nitrate-N to the lower soil layers. Research findings indicate that nitrate-N tends to accumulate in silty loam [38], and the nitrate-N accumulation peak in the experimental area was also in the same layer. The nitrate-N content of soil water in the soil layer between 300 cm and the groundwater surface was not high. This was because there were sandy loam and sandy soil layers within the depth range of 350–500 cm, close to the groundwater table (the range of the shallow groundwater depth during the experimental period was 4.68–5.62 m). Therefore, nitrate-N in the soil entered the groundwater relatively easily. Figure 6 displays the variation curves of the soil water nitrate-N concentration and the soil depth during the different stages of cotton growth. It was found that the nitrate-N concentration dramatically changed above the 120 cm soil layer. During the boll-filling stage, the nitrate-N concentration within the 60 cm root layer rapidly decreased. By the end of the boll-filling stage, the nitrate-N concentration within the 60 cm range dropped to its lowest point. Apart from the significant absorption of N during the boll-filling and boll-opening stages of cotton, the leaching effect of atmospheric precipitation was another important reason. Compared with the meteorological data during the experimental period, precipitation significantly increased after June. From 18 June to 15 August, there were 17 rainy days and the cumulative 24 h precipitation during those 17 days reached 340 mm. Therefore, a large amount of nitrate-N was washed into the lower soil layers by rainwater. Figure 6 shows that the distribution of the nitrate-N concentration in the soil was roughly consistent with the distribution of the water content.

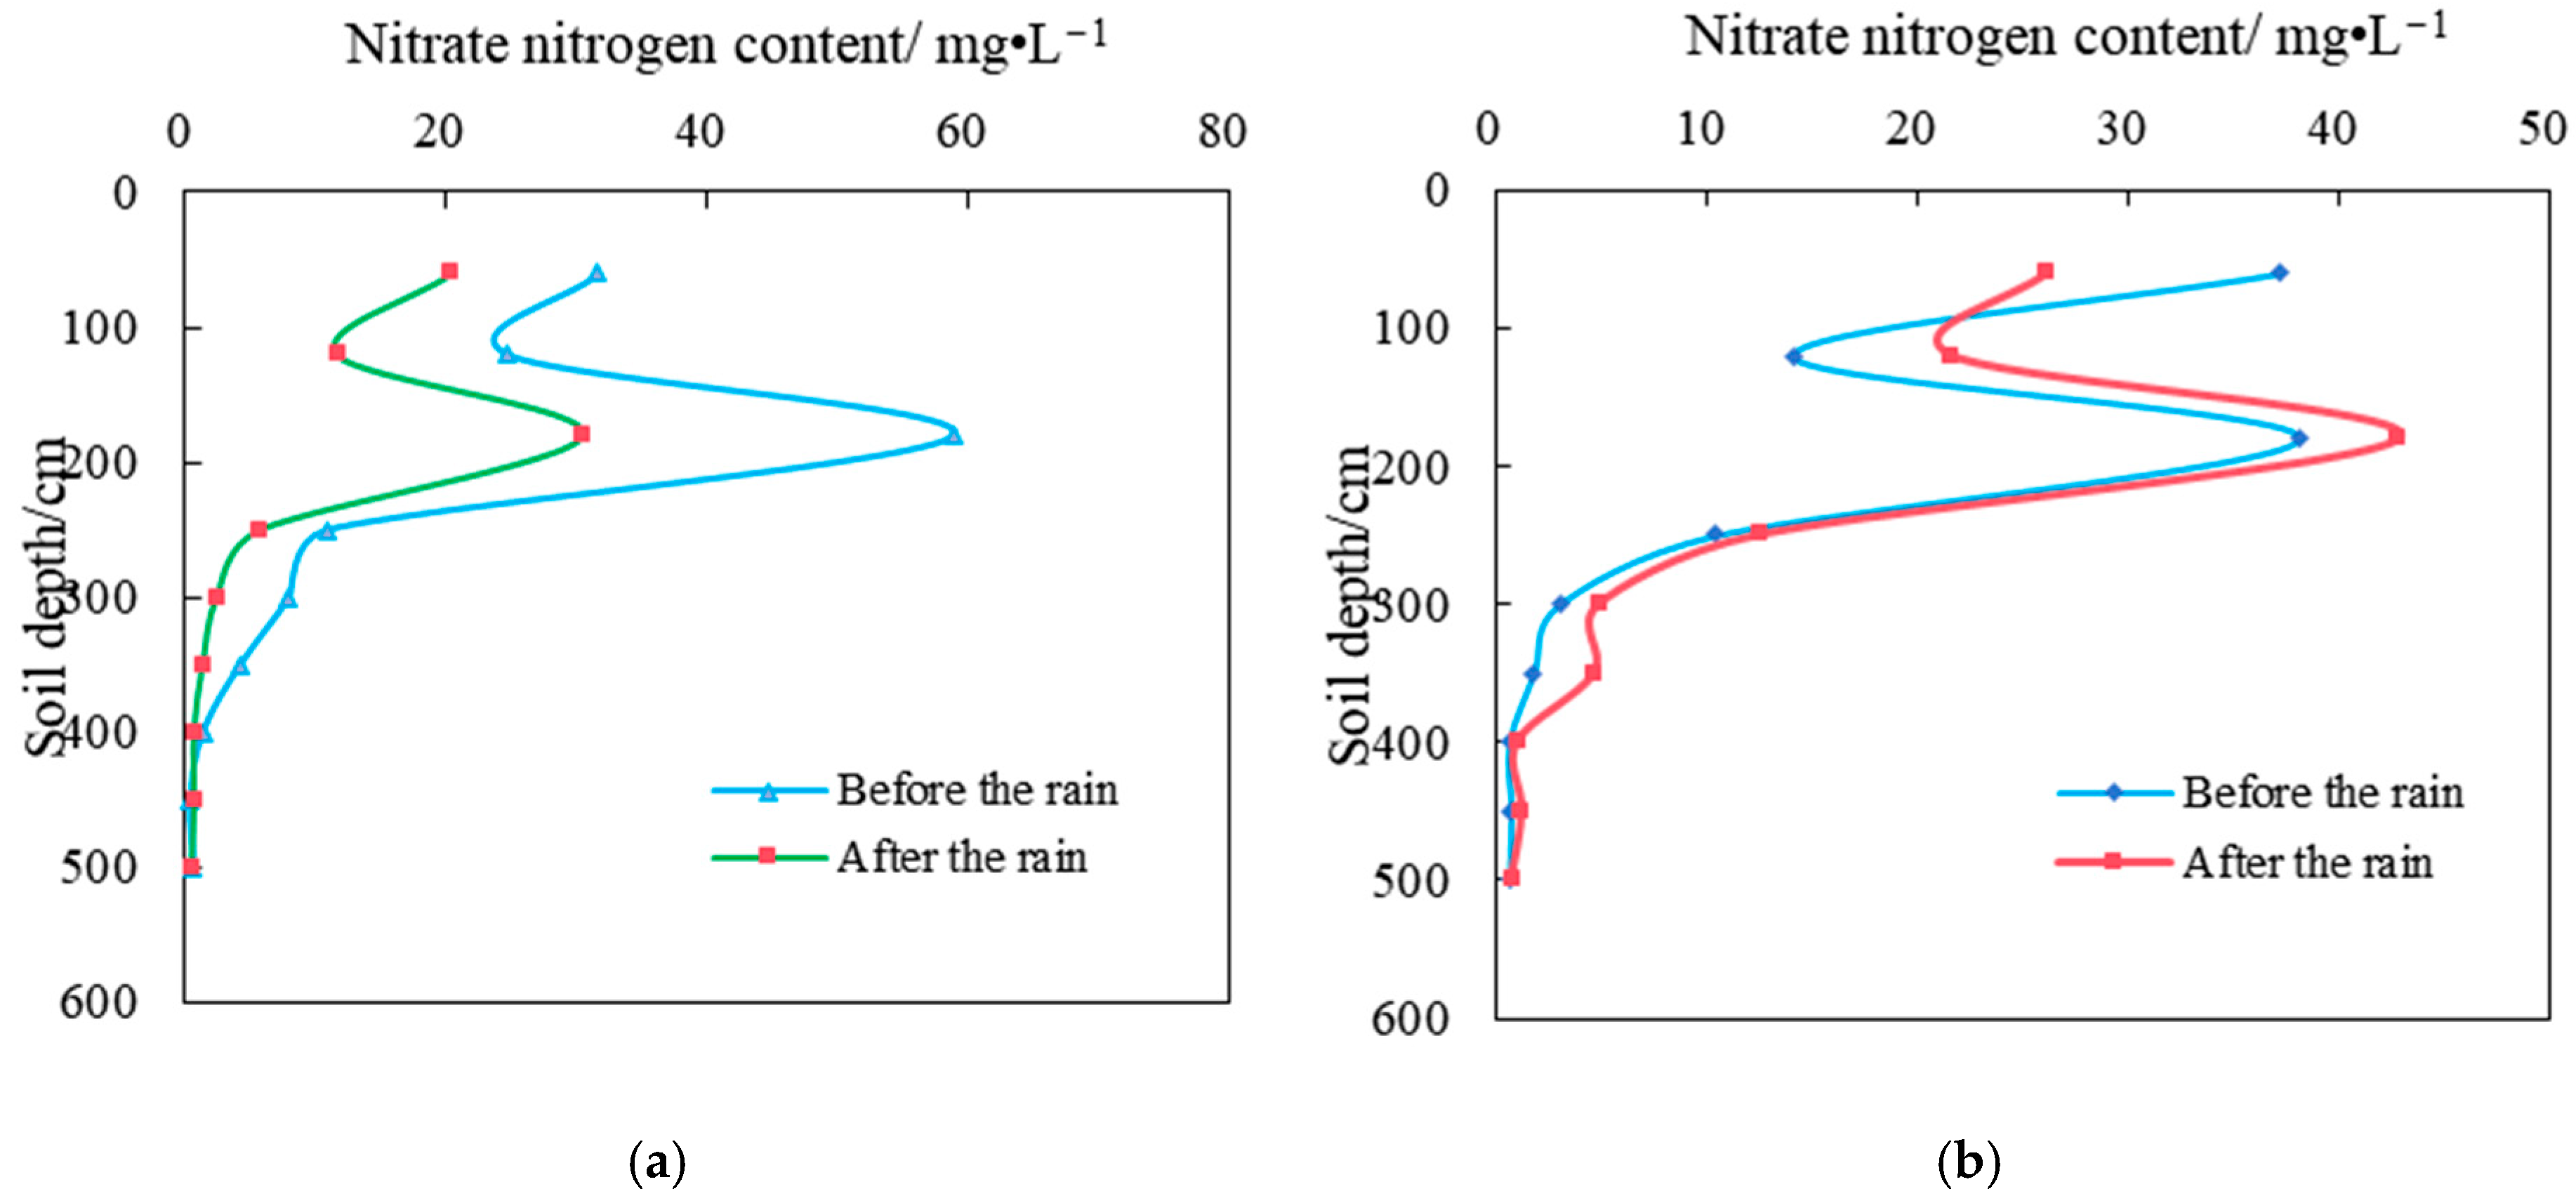
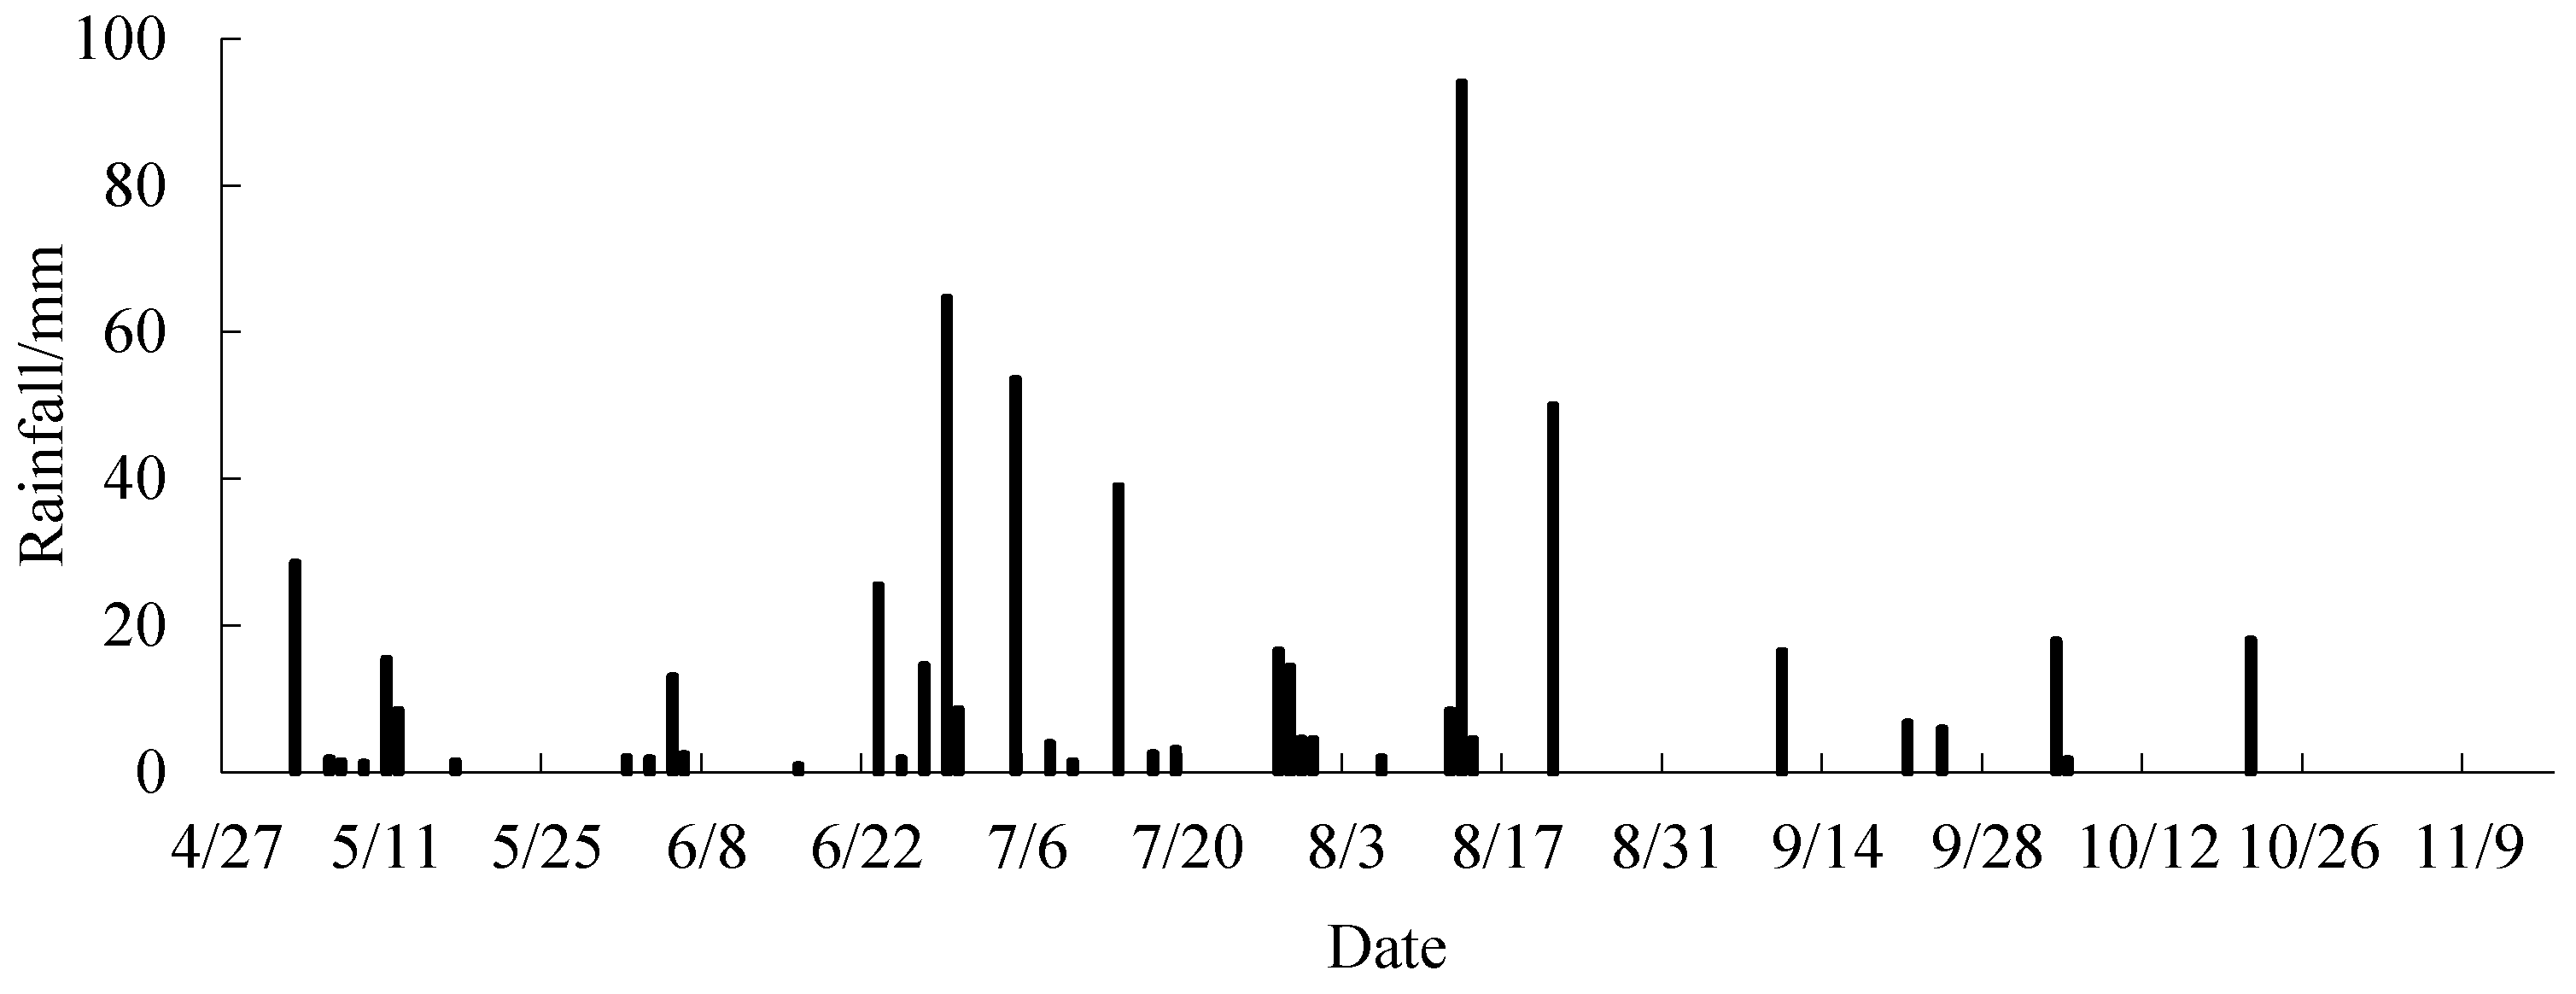
4.4. Vertical Distribution Pattern of Nitrate-N in the Soil Vadose Zone Under the Influence of Short-Term Precipitation

Rainfall magnitude directly affects the leaching range of nitrate-N. Therefore, the vertical distribution of the nitrate-N concentration in the soil profile under two different rainfall conditions was analyzed, as shown in Figure 7.
Figure 7a shows that after a short-term heavy rainfall, the nitrate-N concentration near the 450 cm water table increased from 0.42 mg L−1 before the rain to 0.8 mg L−1 after the rain. The nitrate-N concentration at different depths within the 450 cm profile decreased, with a more significant decrease occurring at soil depths of 200 cm and above. As the leaching peak moved, the leached nitrate-N eventually entered the groundwater, affecting a depth of up to 4.5 m. Heavy rainfall can lead to nitrogen loss in soils due to enhanced nitrate leaching and fluctuations in groundwater levels. Intense precipitation accelerates the downward movement of soil moisture, causing the rapid leaching of nitrate nitrogen accumulated in the aeration zone, particularly in the cultivated layer. Simultaneously, water infiltration may dissolve and activate soil-adsorbed nitrate nitrogen, promoting its migration to groundwater. This process contributes to groundwater contamination, posing environmental and health risks. When the rainfall intensity is not sufficient, the upper nitrate-N leaches into the lower soil layers. Figure 7b shows the distribution of the nitrate-N concentration in the soil profile before and after a short-term rainfall of 39 mm. It indicates that the nitrate-N concentration at a depth of 60 cm decreased from 37.29 mg L−1 before the rainfall to 26.14 mg L−1 after the rain. In contrast, the nitrate-N concentration at a depth of 120 cm increased from 14.09 mg L−1 before the rain to 21.65 mg L−1 after the rain, clearly indicating the movement of the nitrate-N leaching peak.

4.5. Accumulation Characteristics of Nitrate-N Below the Cotton Root System Layer

Generally, in dryland farming systems, a root layer of 100 cm is considered to be the leaching interface. Nitrate-N above this interface has the potential to be further utilized by crop roots, whereas that below the interface is leached [39]. The root range of cotton planted at the experimental site was primarily between 60 and 100 cm. Therefore, the soil aeration zone was divided into a root layer and a leaching layer, with a boundary of 100 cm. It is currently widely believed that nitrate-N in the leaching layer is a potential source of pollution. As shown in Figure 8, there were significant differences in the concentration of nitrate-N in each layer of the soil profile. During the entire cotton growth period, the concentration of nitrate-N at 120–180 cm dramatically changed with time. The maximum concentration of nitrate-N in soil water at 120 cm was 59.87 mg L−1, the minimum was 8.56 mg L−1, and the average was 29.6 mg L−1. The maximum concentration of nitrate-N in soil water at 180 cm was 68.18 mg L−1, the minimum was 29.35 mg L−1, and the average was 40.6 mg L−1. The concentration of nitrate-N in soil water at 300–450 cm did not significantly change. When comparing Figure 8 and Figure 9, it was found that June–August was a period of frequent rainfall, which corresponded with a significant fluctuation in the nitrate-N concentration of the 120–180 cm soil layer. This indicated that rainfall was one of the important factors affecting the accumulation and migration of nitrate-N in the soil aeration zone. Figure 7 shows that by the end of the cotton growth period, the concentration of nitrate-N in the 120 cm soil layer had fallen to a lower level, while the concentration at 180 cm remained at a higher level, becoming a highly concentrated area of nitrate-N in the soil profile. When the concentration of nitrate-N in soil water was converted into the content of nitrate-N per unit of soil water, the content of nitrate-N at 180 cm in the soil increased from 11.4 to 21.2 g m−3, an increase of nearly 100% throughout the cotton growth period. This indicated that, under conventional planting conditions, nitrate-N accumulation occurred in the cotton fields and that the accumulation layer was located below the leaching layer, becoming a potential source of pollution for groundwater.

5. Conclusions

From in situ field experiments that monitored the accumulation and migration of water and fertilizer in the soil vadose zone during the cotton growth period as well as numerical simulations using the HYDRUS-1D model, it was found that the simulation results of the HYDRUS-1D model closely aligned with the measured results. This consistency indicated that the model could effectively simulate the patterns of soil water and N accumulation and migration in this region. In the current soil vadose zone of the experimental area, an accumulation layer of nitrate nitrogen had appeared. The accumulation layer was between 120 and 250 cm, with the accumulation peak occurring at 180 cm in the leaching layer below the root zone, becoming a potential source of groundwater pollution. After the cotton growth cycle, the peak value of nitrate-N accumulation in the soil layer increased. This indicated that conventional irrigation and fertilization practices used for cotton caused nitrate-N to migrate below the leaching interface, leading to a loss of N fertilizer. The nitrate-N concentration in the soil layer above 250 cm frequently fluctuated with time and was greatly affected by rainfall. The vertical distribution of nitrate-N in the entire soil vadose zone was related to comprehensive factors such as crops, soil texture, precipitation, and irrigation, and the location of the nitrate-N accumulation peak was related to soil texture. Therefore, exploring optimized irrigation and fertilization practices for cotton is particularly important to reduce nitrate-N accumulation in soil.

Author Contributions

Conceptualization: F.L. and Z.J.; methodology: F.L.; software: F.L.; validation: F.L., S.Y., and Z.J.; formal analysis: F.L.; investigation: F.L.; resources: F.L.; data curation: F.L. and Z.J.; writing—original draft preparation: F.L.; writing—review and editing: S.Y., X.J., and Z.J.; visualization: F.L. and Z.J.; supervision: S.Y. and X.J.; project administration: S.Y. and X.J.; funding acquisition: F.L., S.Y., and Z.J. All authors have read and agreed to the published version of the manuscript.

Funding

This work was supported by the Key Research and Development Plan of Jiangsu Province (BE2022390), the National Natural Science Foundation of China (51879076, 52379038, 52400053), and the Fundamental Research Funds for the Central Universities (B250201073, B210204016).

Data Availability Statement

The data presented in this study are available on request from the corresponding author. The data are not publicly available due to privacy.

Conflicts of Interest

The authors declare no conflicts of interest.

References

  1. Ascott, M.J.; Gooddy, D.C.; Wang, L.; Stuart, M.E.; Lewis, M.A.; Ward, R.S.; Binley, A.M. Global patterns of nitrate storage in the vadose zone. Nat. Commun. 2017, 8, 153–226. [Google Scholar] [CrossRef] [PubMed]
  2. Zhou, J.; Gu, B.; Schlesinger, W.H.; Ju, X. Significant accumulation of nitrate in Chinese semi-humid croplands. Sci. Rep. 2016, 6, 25088. [Google Scholar] [CrossRef] [PubMed]
  3. Wang, Y.H.; Tang, L. Progress in Research on Influencing Factors and Control Measures of Nitrate-Nitrogen Leaching Losses in Farmland. J. North China Univ. Water Conserv. Electr. Power 2020, 41, 58–64. [Google Scholar]
  4. Lu, B.; Zhang, X.P.; Liang, A.Z.; Jia, S.X.; Chen, X.W.; Chen, S.L.; Liu, S.Y. Overview of N2O Emission Processes and Nitrate Leaching Losses in Agricultural Soils. Soil Crop Sci. 2015, 4, 168–175. [Google Scholar]
  5. Zhang, Q.Z.; Chen, X.; Shen, S.M. Progress in research on nitrate accumulation and leaching in farmland soil. Chin. J. Appl. Ecol. 2002, 13, 233–238. [Google Scholar]
  6. Yuan, X.M.; Tong, Y.A.; Yang, X.Y.; Li, X.L.; Zhang, F.S. Impact of irrigation and precipitation on soil NO3-N accumulation. J. Soil Water Conserv. 2000, 14, 71–74. [Google Scholar]
  7. Zhang, X.J.; Zhao, G.F.; Zhu, W.Q.; Chen, X.Q.; Wang, L.M.; Wu, L.S.; Hu, C.X. Advances in research on nitrogen leaching loss in vegetable field soil and its control measures. Ecol. Environ. 2004, 13, 105–108. [Google Scholar]
  8. Zhang, X.K.; BaiJ, Y.; Yan, H.X. Impact of irrigation volume and nitrogen application rate on nitrate transport in different types of soils. Water-Sav. Irrig. 2020, 2, 83–87. [Google Scholar]
  9. He, Y.P.; Zhang, Z.Y.; Xu, J.Z.; Yang, S.H.; Hong, D.L. Control of groundwater level to reduce nitrogen leaching loss in water-saving irrigated paddy fields. J. Chin. Soc. Agric. Eng. 2014, 30, 121–127. [Google Scholar]
  10. Liu, M.; Min, L.; Wu, L.; Pei, H.; Shen, Y. Evaluating nitrate transport and accumulation in the deep vadose zone of the intensive agricultural region, North China Plain. Sci. Total Environ. 2022, 825, 153894. [Google Scholar] [CrossRef]
  11. de Graaf, I.E.; Gleeson, T.; Van Beek, L.P.H.; Sutanudjaja, E.H.; Bierkens, M.F. Environmental flow limits to global groundwater pumping. Nature 2019, 574, 90–94. [Google Scholar] [CrossRef] [PubMed]
  12. Liu, Y.; Wu, G.; Ma, B.; Wu, T.; Wang, X.; Wu, Q. Revealing climatic and groundwater impacts on the spatiotemporal variations in vegetation coverage in marine sedimentary basins of the North China Plain, China. Sci. Rep. 2024, 14, 10085. [Google Scholar] [CrossRef] [PubMed]
  13. Yuan, Z.; Shen, Y. Estimation of agricultural water consumption from meteorological and yield data: A case study of Hebei, North China. PLoS ONE 2013, 8, e58685. [Google Scholar] [CrossRef]
  14. Han, M.; Zhao, C.; Šimůnek, J.; Feng, G. Evaluating the impact of groundwater on cotton growth and root zone water balance using Hydrus-1D coupled with a crop growth model. Agric. Water Manag. 2015, 160, 64–75. [Google Scholar] [CrossRef]
  15. Jones, J.W.; Hoogenboom, G.; Porter, C.H.; Boote, K.J.; Batchelor, W.D.; Hunt, L.A.; Wilkens, P.W.; Singh, U.; Gijsman, A.J.; Ritchie, J.T. The DSSAT cropping system model. Eur. J. Agron. 2003, 18, 235–265. [Google Scholar] [CrossRef]
  16. Twarakavi, N.K.C.; Šimůnek, J.; Seo, S. Evaluating interactions between groundwater and vadose zone using the HYDRUS-based flow package for MODFLOW. Vadose Zone J. 2008, 7, 757–768. [Google Scholar] [CrossRef]
  17. Radcliffde, D.E.; Simunek, J. Soil Physics with HYDRUS: Modeling and Applications; CRC Press: Bocs Raton, FL, USA, 2010. [Google Scholar]
  18. Zhang, S.; Li, B.; Wang, X.H.; Sun, N.N. Study on solute transport in Va-dose zone based on Hydrus-1D model. Arid Environ. Monit. 2021, 35, 97–102. [Google Scholar]
  19. Fan, Y.W.; Huang, N.; Ma, X.Y.; Bi, G.Q.; Zhao, W.J. Simulation of infiltration characteristics in soil with sand interlayer using HYDRUS-1D. Soils 2016, 48, 193–200. [Google Scholar]
  20. Li, B.B.; Wang, Y.Q.; Li, Z. Applicability of HYDRUS-1D model for simulating soil moisture in deep profiles of Weibei dryland. Chin. J. Appl. Ecol. 2019, 30, 398–404. [Google Scholar]
  21. Jin, Y.; Xia, J.; Zhang, Z. Comparative analysis on the treatment of ammonia nitrogen in industrial wastewater. Ind. Water Treat. 2013, 33, 5–10. (In Chinese) [Google Scholar]
  22. Simunek, J.; Van Genuchten, M.T.; Sejna, M. The HYDRUS-1D Software Package for Simulating the One-Dimensional Movement of Water, Heat, and Multiple Solutes in Variably-Saturated Media; University of California Riverside: Riverside, CA, USA, 2005; Volume 3, pp. 1–240. [Google Scholar]
  23. Šimůnek, J.; van Genuchten, M.T.; Šejna, M. Development and applications of the HYDRUS and STANMOD software packages and related codes. Vadose Zone J. 2008, 7, 587–600. [Google Scholar] [CrossRef]
  24. Shouse, P.J.; Ayars, J.E.; Šimůnek, J. Simulating root water uptake from a shallow saline groundwater resource. Agric. Water Manag. 2011, 98, 784–790. [Google Scholar] [CrossRef]
  25. Šimůnek, J.; Angulo-Jaramillo, R.; Schaap, M.G.; Vandervaere, J.-P.; Van Genuchten, M.T. Using an inverse method to estimate the hydraulic properties of crusted soils from tension-disc infiltrometer data. Geoderma 1998, 86, 61–81. [Google Scholar] [CrossRef]
  26. Meng, J.L. Simulation Study on Water-Salt and Drainage Systems. Master’s Thesis, Xinjiang Agricultural University, Ürümqi, China, 2004; pp. 34–37. [Google Scholar]
  27. Myrold, D.D.; Tiedje, J.M. Simultaneous estimation of several nitrogen cycle rates using 15’N: Theory and application. Soil Biol. Bioehem. 1956, 15, 559–568. [Google Scholar]
  28. Stenger, R.; Priesack, E.; Beese, F. Rates of nitrogen mineralization in disturbed and undlsturbed soils. Plant Soil 1995, 171, 323–332. [Google Scholar] [CrossRef]
  29. Kersebaum, K.C.; Richter, J. Modelling nitrogen dynamics in a Plant-soil system with a simple model for advisory purposes. Nutr. Cycl. Agroecosyst. 1991, 27, 273–281. [Google Scholar]
  30. Hu, K.L.; Li, B.G.; Chen, D.L.; White, R.E. Spatial variability of soil moisture and salinity in farmland and their collaborative Kriging estimation. Adv. Water Sci. 2001, 12, 460–466. [Google Scholar]
  31. Hu, K.L.; Li, B.G.; Lin, Q.M.; Li, G.T.; Chen, D.L. Spatial variability characteristics of soil nutrients in farmland. J. Chin. Soc. Agric. Eng. 1999, 15, 33–38. [Google Scholar]
  32. Cao, Q.H.; Gong, Y.S. Simulation and analysis of water and nitrogen transport characteristics in winter wheat fields using the Hydrus-Id model. J. Plant Nutr. Fertil. Sci. 2003, 9, 139–145. [Google Scholar]
  33. Jones, C.A. CERES-Maize: A Simulation Model of Maize Growth and Development; TEXAS A and M university Press: College Station, TX, USA, 1986; pp. 79–90. [Google Scholar]
  34. Chiew, F.H.S.; Kamaladasa, N.N.; Malano, H.M.; McMahon, T.A. Penman-Monteith, FAO-24 reference crop evapotranspiration and class-A pan data in Australia. Agric. Water Manag. 1995, 28, 9–21. [Google Scholar] [CrossRef]
  35. Wang, G.S.; Shi, H.B.; Li, X.Y.; Yan, J.W.; Miao, Q.F.; Chen, N.; Wang, W.G. Simulation and evaluation of water and salt transport in desert oases based on the HYDRUS-1D model. J. Chin. Soc. Agric. Eng. 2021, 37, 87–98. [Google Scholar]
  36. Ma, Y.; Feng, S.; Song, X. Evaluation of optimal irrigation scheduling and groundwater recharge at representative sites in the North China Plain with SWAP model and field experiments. Comput. Electron. Agric. 2015, 116, 125–136. [Google Scholar] [CrossRef]
  37. Wang, W.; Lu, Y. Analysis of the mean absolute error (MAE)and the root mean square error (RMSE) in assessing rounding model. IOP Conf. Ser. Mater. Sci. Eng. 2018, 324, 012049. [Google Scholar] [CrossRef]
  38. Liang, H.Y.; Wang, S.Q.; Wei, S.C. Distribution and accumulation patterns of nitrate-N in typical thick vadose zones of the piedmont plain in North China. Soil 2017, 49, 1179–1186. [Google Scholar]
  39. Zhu, Z.; Chen, D. Nitrogen fertilizer use in China—Contributions to food production, impacts on the environment and best management strategies. Nutr. Cycl. Agroecosyst. 2002, 63, 117–127. [Google Scholar] [CrossRef]
Figure 1. Location of Nanpi experimental station.
Water 17 01117 g001
Figure 2. Variation trend of groundwater depth during the cotton growth period.
Water 17 01117 g002
Figure 3. Model validation of soil moisture content in the vadose zone during the crop growth period.
Water 17 01117 g003
Figure 4. Testing of the nitrate-N model in the vadose zone during the crop growth period.
Water 17 01117 g004
Figure 5. Distribution map of soil texture and moisture content in the experimental area. Note: 6−18, 10−22, 7−30 are dates, representing 18 June, 22 October, and 30 July, respectively.
Water 17 01117 g005
Figure 6. Nitrate-N accumulation curves of the soil profile. Note: 6–4, 6–18, 10–22, 8–15 are dates, representing 4 June, 18 June, 22 October, and 15 August, respectively.
Water 17 01117 g006
Figure 7. Distribution diagram of the nitrate-N concentration in the soil profile before and after rainfall. (a) Heavy rainfall of 57.6 mm. (b) Rainfall of 39 mm.
Water 17 01117 g007
Figure 8. Dynamic changes in nitrate-N at different depths below the leaching layer of soil profiles.
Water 17 01117 g008
Figure 9. Time series diagram of rainfall volume and duration.
Water 17 01117 g009
Table 1. Classification of soil texture.
Soil Depth/cmSand Content/%Silt Content/%Clay Content/%Soil Texture
0–170126622Silty soil
170–23035569Silty soil
230–25077815Silty soil
250–31515544Silty clay
315–350146719Silty clay
350–45065287Sandy loam
450–50086104Sandy soil
500–54066034Silty clayey soil
540–59036829Silty clayey soil
590–600355610Silty clay
Note: American classification standard is adopted.
Table 2. Hydraulic parameters of each soil layer after calibration.
Soil Layer/cmQr (10−2)Qs (10−2)a (10−2)nKs
0–1707.5644.880.551.6210.26
170–2304.5241.500.521.6542.00
230–2756.8150.330.591.6510.15
275–31510.4055.251.251.402.55
315–3507.0444.350.501.6510.23
350–4503.6239.003.161.4145.02
450–5004.3338.383.942.08119.22
500–5409.1748.070.871.5010.08
Note: Qr: residual water content; Qs: saturated water content; Ks: saturated hydraulic conductivity; a and n: model parameters.
Table 3. Nitrate-N transport and transformation parameters in different soil layers.
Soil Layer/cm B D /g·cm−3DW/cm2·d−1D γ /10−2mg·kg−1·d−1 μ /10−2 d−1 μ /10−2 d−1
0–1701.402.144.50100.002.000.50
170–2301.372.144.0050.001.000.30
230–2751.502.143.000.050.500.50
275–3151.602.142.700.030.401.00
315–3501.502.143.500.030.401.00
350–4501.332.144.500.020.200.80
450–5001.202.145.200.020.200.80
500–5401.502.143.600.010.100.60
Note: BD: density; DW: hydrodynamic dispersion coefficient in free water; D: dispersion coefficient; γ: zero-order kinetic parameter of mineralization; μ: biological retention rate; μ′: denitrification rate.
Table 4. Evaluation results of soil profile moisture content simulated by the model under different calibration conditions.
Date CalibrationEvaluation
R2RMSEMAE
6.70.730.050.04
6.300.720.050.05
7.300.710.050.04
8.310.860.060.05
Table 5. Evaluation results of soil profile nitrate-N simulated by the model under different calibration conditions.
Date CalibrationEvaluation
R2RMSEMAE
7 June0.973.102.30
21 July0.913.803.00
22 August0.854.603.00
22 October0.954.103.00
Disclaimer/Publisher’s Note: The statements, opinions and data contained in all publications are solely those of the individual author(s) and contributor(s) and not of MDPI and/or the editor(s). MDPI and/or the editor(s) disclaim responsibility for any injury to people or property resulting from any ideas, methods, instructions or products referred to in the content.

