Article

Spatio-Temporal Dynamics of the Lanalhue Lake Basin in South-Central Chile

by
Lien Rodríguez-López
1,*,
Patricio Fuentes-Aguilera
1,
Lisandra Bravo Alvarez
2,
Rebeca Martínez-Retureta
3,
Iongel Duran-Llacer
4,5,
Luc Bourrel
6,
Frederic Frappart
7 and
Roberto Urrutia
8
1
Facultad de Ingeniería, Universidad San Sebastián, Lientur 1457, Concepción 4030000, Chile
2
Department of Electrical Engineering, Universidad de Concepción, Edmundo Larenas 219, Concepción 4030000, Chile
3
Departamento de Ciencias Ambientales, Facultad de Recursos Naturales, Universidad Católica de Temuco, Rudecindo Ortega 02950, Temuco 4780000, Chile
4
Escuela de Ingeniería en Medio Ambiente y Sustentabilidad y Escuela de Ingeniería Forestal, Facultad de Ciencias, Ingeniería y Tecnología, Universidad Mayor, Camino La Pirámide 5750, Santiago 8580745, Chile
5
Hémera Centro de Observación de la Tierra, Facultad de Ciencias, Ingeniería y Tecnología, Universidad Mayor, Camino La Pirámide 5750, Santiago 8580745, Chile
6
Géosciences Environnement Toulouse, UMR 5563, Université de Toulouse, CNRS-IRD-OMP-CNES, 31400 Toulouse, France
7
ISPA, UMR 1391 INRAE, Bordeaux Sciences Agro, UMR 1391, 33140 Villenave-d’Ornon, France
8
Facultad de Ciencias Ambientales, Universidad de Concepción, Concepción 4030000, Chile
*
Author to whom correspondence should be addressed.
Water 2025, 17(8), 1114; https://doi.org/10.3390/w17081114
Submission received: 12 March 2025 / Revised: 4 April 2025 / Accepted: 7 April 2025 / Published: 8 April 2025
(This article belongs to the Section Water Quality and Contamination)

Abstract

:
Monitoring the evolution of freshwater lakes is critical for understanding and mitigating eutrophication, a major environmental issue driven by excessive nutrient inputs, primarily nitrogen and phosphorus. This study focuses on Lake Lanalhue, where rising frequencies and intensities of algal blooms highlight significant ecological imbalances. By evaluating spatio-temporal variations in water quality and quantity parameters, meteorological conditions, and land use changes, we aim to uncover the drivers of eutrophication and their complex interactions. Nutrient concentrations, dissolved oxygen levels, and phytoplankton biomass are analyzed alongside hydrological parameters such as water level, volume, and surface area. The influence of meteorological factors, including temperature, precipitation, and wind speed, is assessed to determine their role in stratification, mixing, and nutrient cycling. Additionally, land use changes in the watershed, such as urbanization and agricultural practices, are examined to understand external nutrient inputs. This integrative approach provides a comprehensive understanding of the mechanisms driving changes in Lake Lanalhue, offering critical insights into the development of sustainable management strategies to mitigate eutrophication and its ecological and socio-economic impacts.

1. Introduction

Monitoring the evolution of freshwater lakes is essential for understanding and addressing the eutrophication process, a significant environmental challenge caused by excess nutrient inputs, primarily nitrogen and phosphorus [1]. Tracking changes in lake conditions over time allows researchers to identify key drivers of eutrophication, such as agricultural runoff, wastewater discharge, and climate change [2]. By analyzing temporal and spatial variations in water quality parameters, including nutrient concentrations, dissolved oxygen levels, and phytoplankton biomass, scientists can assess the severity of eutrophication and predict its ecological impacts [3]. This knowledge is critical for developing effective management strategies to mitigate eutrophication, restore aquatic ecosystems, and ensure the long-term sustainability of freshwater resources [4,5].
Furthermore, studying meteorological conditions is crucial for understanding their impact on the water quality of lakes, as these conditions play a pivotal role in driving physical, chemical, and biological processes within aquatic ecosystems [6]. Factors such as temperature, precipitation, wind patterns, and solar radiation influence stratification, mixing, and nutrient cycling, which are key determinants of water quality [7]. Higher temperatures can intensify thermal stratification, reducing oxygen levels in deeper layers and exacerbating issues like hypoxia and algal blooms [8,9]. Additionally, precipitation and storm events can lead to increased runoff, introducing sediments, pollutants, and nutrients into lakes, further affecting their ecological balance [10]. By integrating meteorological data into lake studies, researchers can better predict water quality changes, assess vulnerability to climate variability, and design effective management strategies to protect these critical ecosystems [11].
On the other hand, the analysis of parameters related to water quantity, such as water level, volume, and surface area, is essential to complement the previously mentioned set of environmental variables [12]. These hydrological parameters provide valuable insights into the physical state of the lake and its response to climatic variations, seasonal changes, and human activities [13]. Understanding these dynamics is fundamental to assessing the lake’s ecological stability and predicting potential shifts in its behavior under different scenarios [14]. Another critical factor influencing lake conditions is the change in land use within the surrounding watershed [15]. The nutrient input to the lake is closely linked to human activities in the area, such as urban development, agriculture, and forestry [16]. Phosphorus from untreated or poorly treated sewage discharges and nitrogen from agricultural runoff are significant contributors to nutrient loading, which can exacerbate eutrophication [17]. This nutrient enrichment has likely accelerated the natural aging process of Lake Lanalhue, leading to an increase in primary productivity and triggering adverse ecological effects [18].
In recent years, the frequency and intensity of algal bloom events in Lake Lanalhue have risen, posing significant challenges to water quality, aquatic biodiversity, and local communities that rely on the lake for recreation and livelihoods. These blooms often indicate a critical imbalance in the lake’s ecosystem, driven by the interplay of autochthonous factors, such as internal nutrient recycling, and allochthonous inputs from external sources [19]. Given the complexity of these interactions, this study aims to evaluate the spatio-temporal variation of the combined autochthonous and allochthonous factors affecting the lake basin [20]. By integrating water quality and quantity data, meteorological and land use data, this research seeks to provide a holistic understanding of the mechanisms driving changes in Lake Lanalhue and to contribute to the development of effective management strategies to mitigate eutrophication and its associated impacts.

2. Materials and Methods

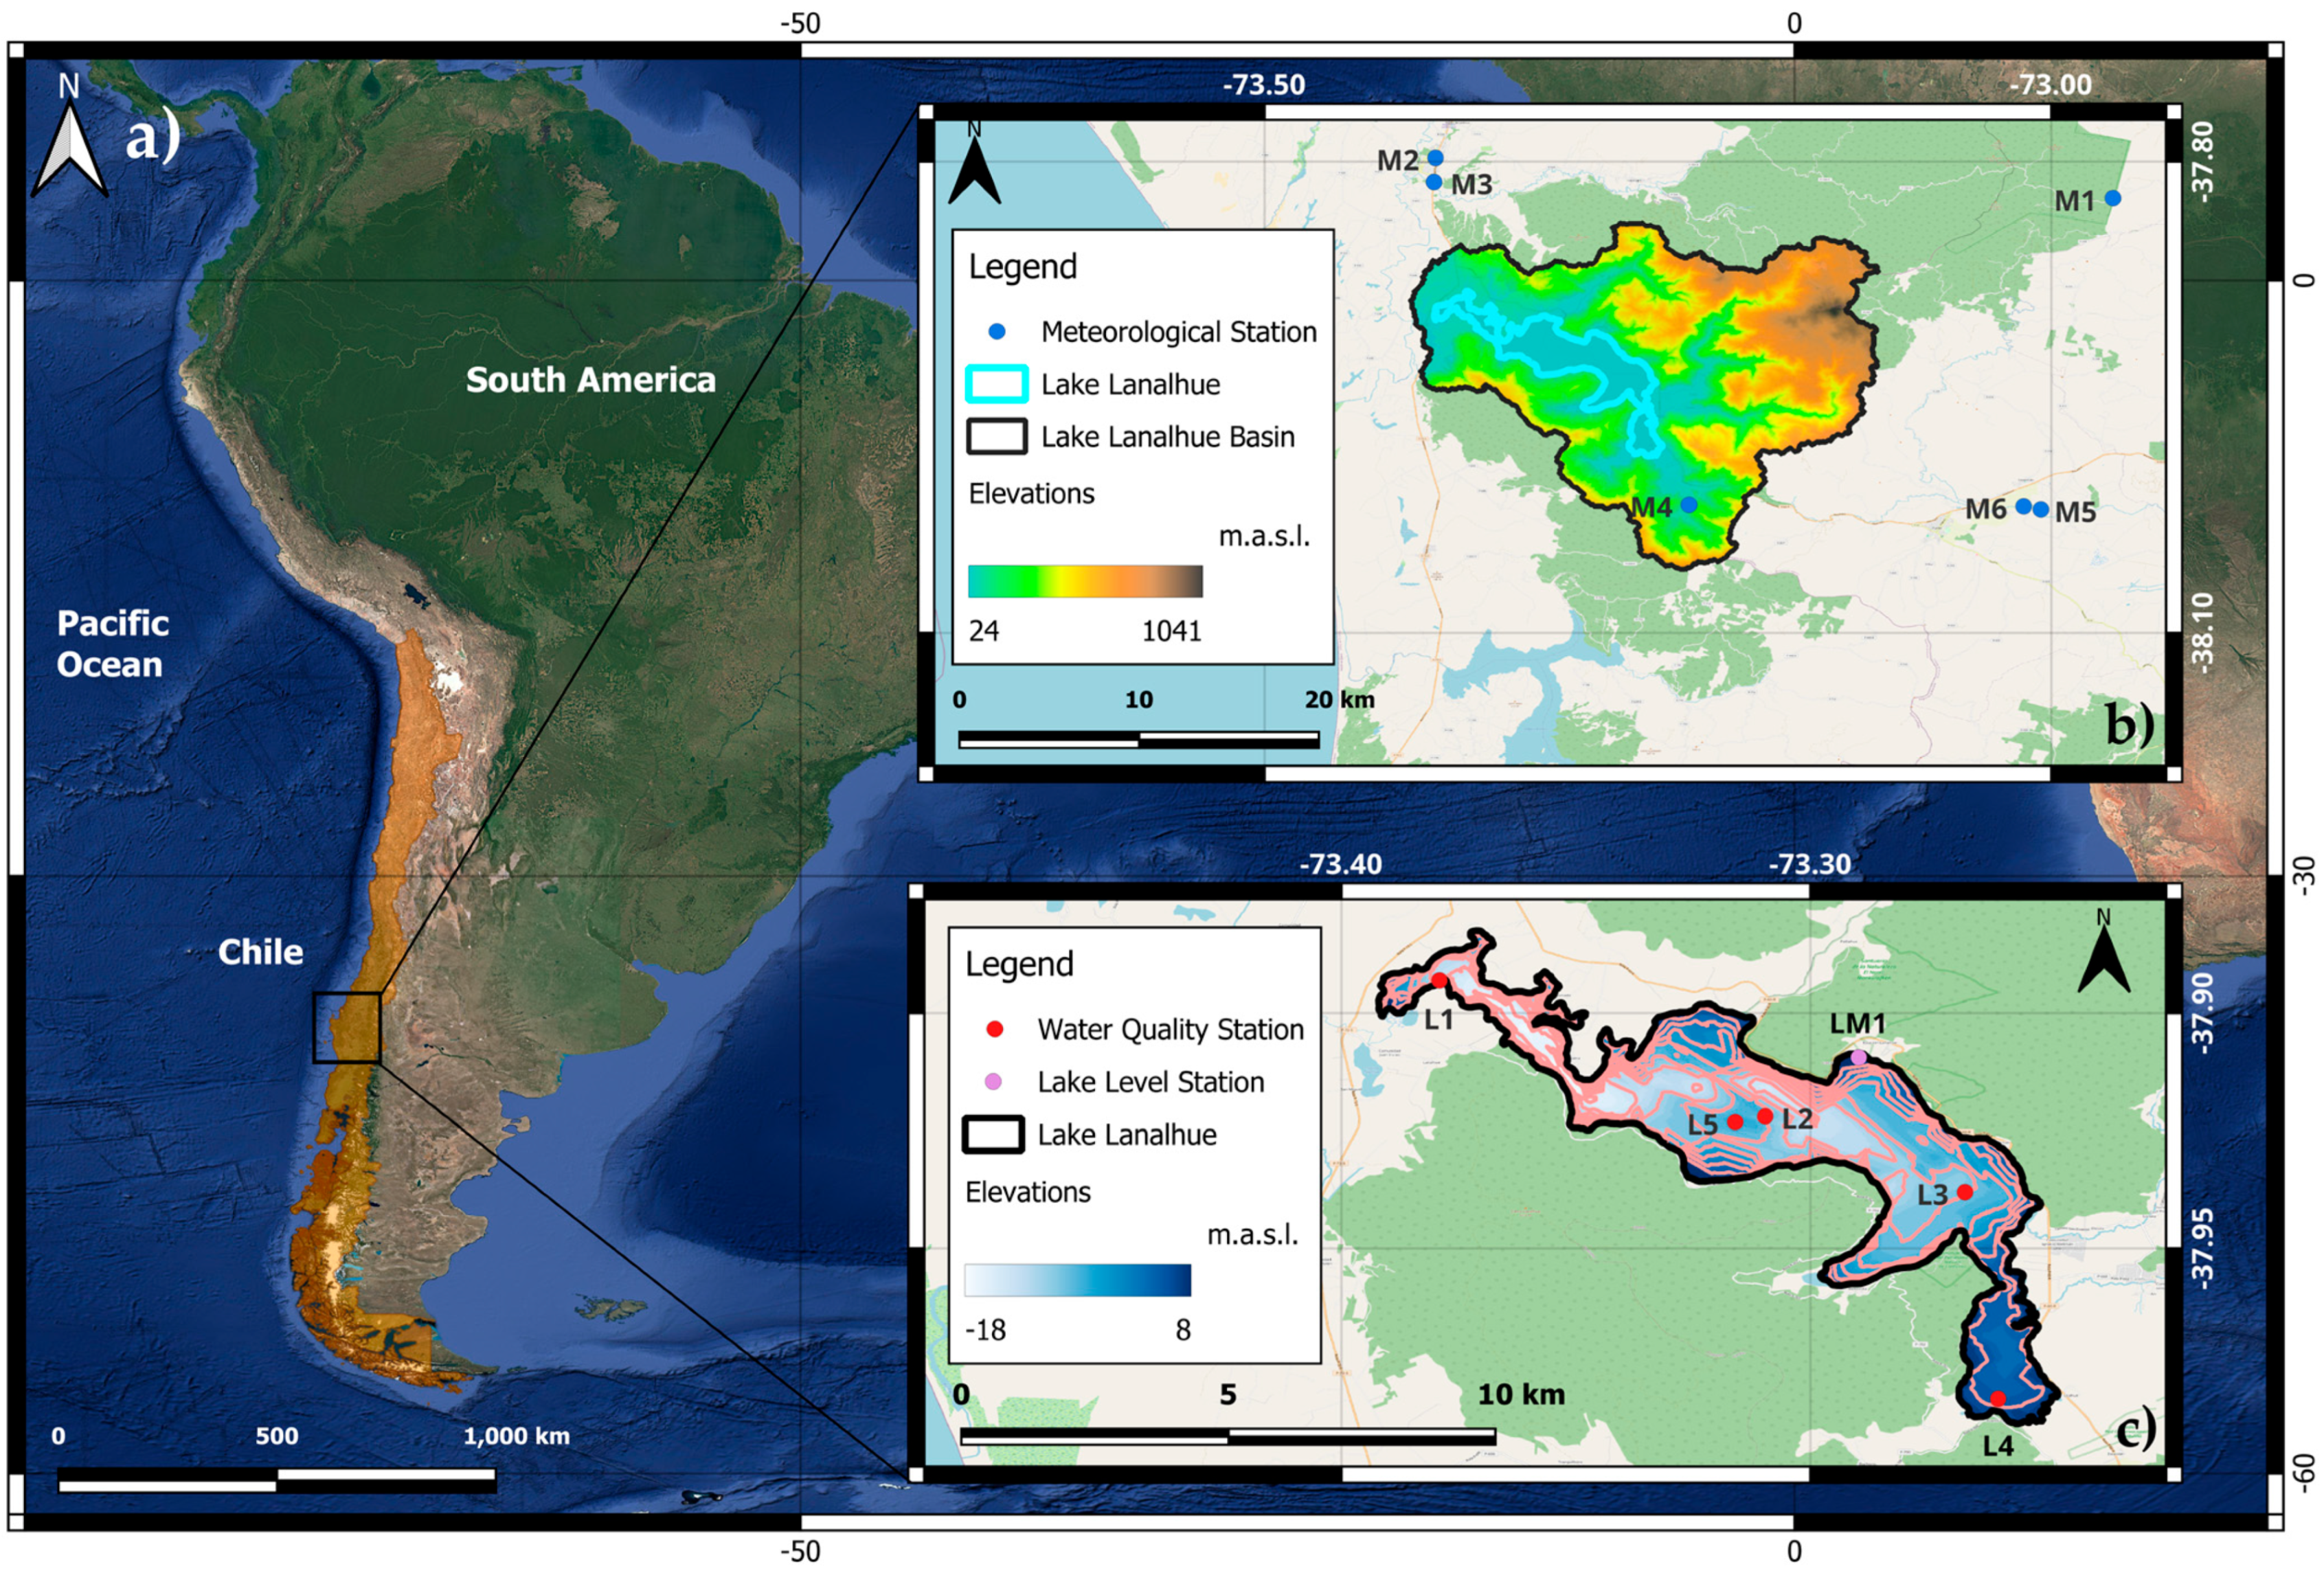
2.1. Lake Lanalhue Characteristics

Lake Lanalhue is located at 37° 55′ South latitude and 73° 19′ West longitude (see Figure 1), in the Biobío Region, in southern Chile, nestled in a picturesque valley between the Coastal Mountain Range (Nahuelbuta), near the towns of Cañete and Contulmo [21]. The basin has an area of 365.4 km2, while the lake area is approximately 32 km2. It is one of the most outstanding lakes in the region, known for its elongated shape of about 9 km in length [18]. The lake is relatively shallow, with an average depth of about 10 m, which makes it sensitive to environmental changes and seasonal variations. Surrounded by lush native forests and agricultural land, Lake Lanalhue is ecologically rich and culturally significant, as it is close to indigenous Mapuche communities. It is home to a varied aquatic and terrestrial biodiversity, including endemic fish species, migratory birds, and abundant flora.

2.1.1. Land Cover

To generate the land cover maps every 5 years in the Lake Lanalhue basin from 2000 to 2022, the cartographic base of the MapBiomas Chile Project-Collection 1 of the Annual Maps of Land Cover and Use in Chile was used, which was accessed on 30 November 2024 through the following link: https://plataforma.chile.mapbiomas.org/ accessed on 5 December 2024. All the downloaded annual maps of land cover and land use from MapBiomas Chile are produced from the pixel-by-pixel classification of images from the Landsat satellite. The entire process was carried out on the Google Earth Engine platform. Subsequently, to build the transition maps, it was divided according to the identified soil classes and a transition matrix was made to evaluate the loss or gain of each cover in the study period (see Figure 2).

2.2. In Situ and Meteorological Data

We collected in situ data through monitoring campaigns conducted by the Dirección General de Aguas (DGA, Water Directorate, Santiago, Chile) database (accessed on 16 September 2024) from 1989 to 2018 at five stations in the lake and in the four seasons of the year (see Figure 1), and in situ measured data between 2021 and 2022 were obtained through field campaigns conducted by PRELA (Program for the Recovery of Environmental Services of the Ecosystems of the Arauco Province, Arauco, Chile). Additionally, five meteorological stations (see Figure 1) with monthly precipitation (mm), air temperature (°C), relative humidity (%) and wind speed (m/s) information near the study area were considered, with information from the Dirección Meteorológica de Chile DMC (accessed on 20 November 2024).

2.3. Radar Altimetry Data

Mission Sentinel-3A was used for this analysis. This mission was selected because their orbit passed over Lanalhue Lake. This mission was launched on 16 February 2016 as part of the EU Copernicus Programmed [22]. It is in orbit at a 814.5 km altitude and a heliosynchronous orbit of 98.65° inclination with a repetition cycle of 27 days [23] and an equatorial separation of about 105 km [24], composed of SRAL (SAR Radar Altimeter, Maastricht, The Netherlands), and a dual-frequency SAR altimeter (Ku-band at 13.575 GHz and C-band at 5.41 GHz), and a dual-frequency SAR at 5.41 GHz [25]. Sentinel-3A possesses great potential in monitoring water levels of inland water bodies [26].

Water Level from Altimetry

Satellite altimetry is a technique initially used to topography the oceans [27], achieving over time its use in inland water bodies, where the time series have been completed or supplemented the missing information within the lake level databases in various areas of the world [28,29]. The parameters used to determine the water surface levels of Lake Lanalhue include the satellite’s altitude relative to a reference ellipsoid (H), and the distance between the satellite and the Earth’s surface ( R 0 ). While the satellite’s altitude can be estimated with the centimeter-level precision using advanced orbit determination techniques, the range is calculated based on the travel time ( Δ t ) of an electromagnetic wave emitted by a sensor. This calculation assumes a propagation speed equal to the speed of light in a vacuum (c) and is expressed mathematically in Equation (1):
R 0 = c Δ t 2      
To improve the measurement accuracy, geophysical and atmospheric corrections need to be performed [26,30,31]. The height of the reflected surface is calculated as follows:
h = H R 0 + Δ R g e o p h y s c a l + Δ R a t m o s f e r i c
The Altimetry Time Series (AlTiS) software version 2.2.9, developed by the Centre de Topographie des Océans et de l’Hydrosphére (CTOH), was used to obtain the levels of the Lake Lanalhue. This Python 2.2.9-based Graphical User Interface (GUI) processes data from various satellite missions using Geophysical Data Records (GRD). Additionally, it allows for the manual elimination of outliers and the generation of time series for the level of inland water bodies [31].

2.4. Statistical Analysis

We used a set of in situ, meteorological and land cover data during the study period and performed a correlation matrix using Pearson’s r. The in situ data set includes five physicochemical parameters related to lake water quality (Chl-a, NTU, SD, TP and TN), measured at three sampling stations; the meteorological data set contemplated the parameters air temperature, precipitation and wind speed, while all land cover classes described in Section 2.1.1 were used.
The results obtained using satellite altimetry will be compared with the in situ data from the DGA, employing different statistics described below:

2.4.1. Nash–Sutcliffe Efficiency (NSE)

The Nash–Sutcliffe Efficiency (NSE) determines the relative magnitude of the residual variance, compared to the variance of the observer data [32]. This is one of the most used performance measures in hydrology and is focused on model error at high values, underestimating model performance during low-flow conditions [33]. It can be calculated with Equation (3):
N S E = 1 i = 1 n W L s i m i W L i n s i t u i 2 i = 1 n W L i n s i t u i W L i n s i t u ¯ 2
where W L s i m i , W L i n s i t u i and W L i n s i t u ¯ are the simulated, observed and the average of the observed data, respectively, while n is the length of the time series. NSE values vary between 1 and − , with 1 being the optimum value [34]. The threshold for a model to be considered suitable is NSE = 0.6 [35].

2.4.2. Kling–Gupta Efficiency (KGE)

The KGE index corresponds to the Nash–Sutcliffe efficiency decomposition (NSE) and focuses on evaluating the correlation, variance and variability of the estimated data. The KGE index is focused on equitably assessing the correlation, deviation, and variability of the simulated data [36]. It can be calculated through Equation (4):
K G E = 1 r 1 + α 1 + β 1    
where r is the coefficient of linear correlation between the estimated and the observed data, α is a measure of the variability of the data values, and β is the average of the estimated data over the average of the observed data. In the literature, the threshold value for a model to be considered suitable is KGE = 0.6 [37].

2.4.3. Index of Agreement (d)

The Agreement Index is a standardized metric used to evaluate the accuracy of data estimations. It is calculated as the ratio of the mean square error to the potential error, providing insight into the fidelity of a model’s predictions. Equation (5) shows the formula of the Index of Agreement:
d = 1 i = 1 n W L i n   s i t u W L a l t i m e t r y 2 i = 1 n W L a l t i m e t r y W L i n   s i t u ¯ + W L i n   s i t u W L i n   s i t u ¯ 2
This index ranges from 0 to 1, where 1 indicates a perfect match between predicted and actual values and 0 reflects no observable correspondence. It offers a concise measure of the model’s performance [38].

2.5. Calculation of the Surface Area and Volume of the Lake

The calculation of the surface area and the volume of Lake Lanalhue is based on the methodology used by [39]. After validating the Sentinel-3A data, the surface area and volume of Lake Lanalhue were calculated. To achieve this, we use the curves shown in Figure 6 and Figure 7. They were constructed using the topo-bathymetric information of Lake Lanalhue (Figure 1c). This approach ensures precision in calculations and understanding of the lake’s dynamics.

3. Results

3.1. Water Quality Parameter

Table 1 summarizes seasonal variations in several water quality parameters, including Secchi Depth (SD), temperature (T), turbidity (NTU), total nitrogen concentration (TN), chlorophyll-a (Chl-a), and total phosphorus (TP) across five locations in Lake Lanalhue (L1 to L5). Secchi Depth (SD) shows greater clarity during summer (average ~3.8 m) but declines across other seasons, particularly in winter and autumn. Temperature (T) decreases from maximus in summer (~22 °C) to minimum in winter (~11 °C) before rising in spring (~15–16 °C). Turbidity (NTU) peaks in autumn and winter, indicating higher water column disturbance or particulate matter, with some extreme values in certain locations (e.g., up to 40 NTU). Total nitrogen (TN) concentrations vary widely, peaking in winter and autumn, with averages up to 488 µg/L, but show significant deviations and variability between sites. Chlorophyll-a (Chl-a), an indicator of algal biomass, peaks in autumn (~9.6 µg/L) and spring (~6 µg/L), suggesting increased productivity, while being minimal in winter (~1.2 µg/L). Finally, total phosphorus (TP), a critical nutrient, exhibits high variability with maximum values (200 µg/L) primarily in spring and notable seasonal fluctuations across sites. Overall, the data reflect clear seasonal and spatial dynamics influenced by temperature, nutrient loading, and other environmental factors.

3.2. Meteorological Conditions

Figure 3 shows a climatological analysis that combines monthly rainfall, temperature and wind direction. The average air temperature around Lanalhue Lake varies seasonally, with warmer months (December to February) averaging between 15 °C and 25 °C, and cooler months (June to August) ranging from 5 °C to 15 °C. Summer temperatures may peak at 28 °C, while winter lows can dip close to freezing. The region experiences moderate to high relative humidity, especially in winter months when precipitation is frequent, often reaching above 80%. In the summer, humidity levels are generally lower, averaging around 60–70%, though it can vary with daily temperature fluctuations. Precipitation at Lanalhue Lake is highest in winter, primarily between May and August, where monthly averages can reach up to 200 mm. Summers are drier, with occasional rainfall and an average monthly precipitation closer to 20–50 mm. Wind speeds are generally mild, with average speeds around 2–4 m/s, influenced by local topography. During certain periods, winds may increase slightly, especially in spring and fall, with gusts occasionally reaching above 5 m/s.

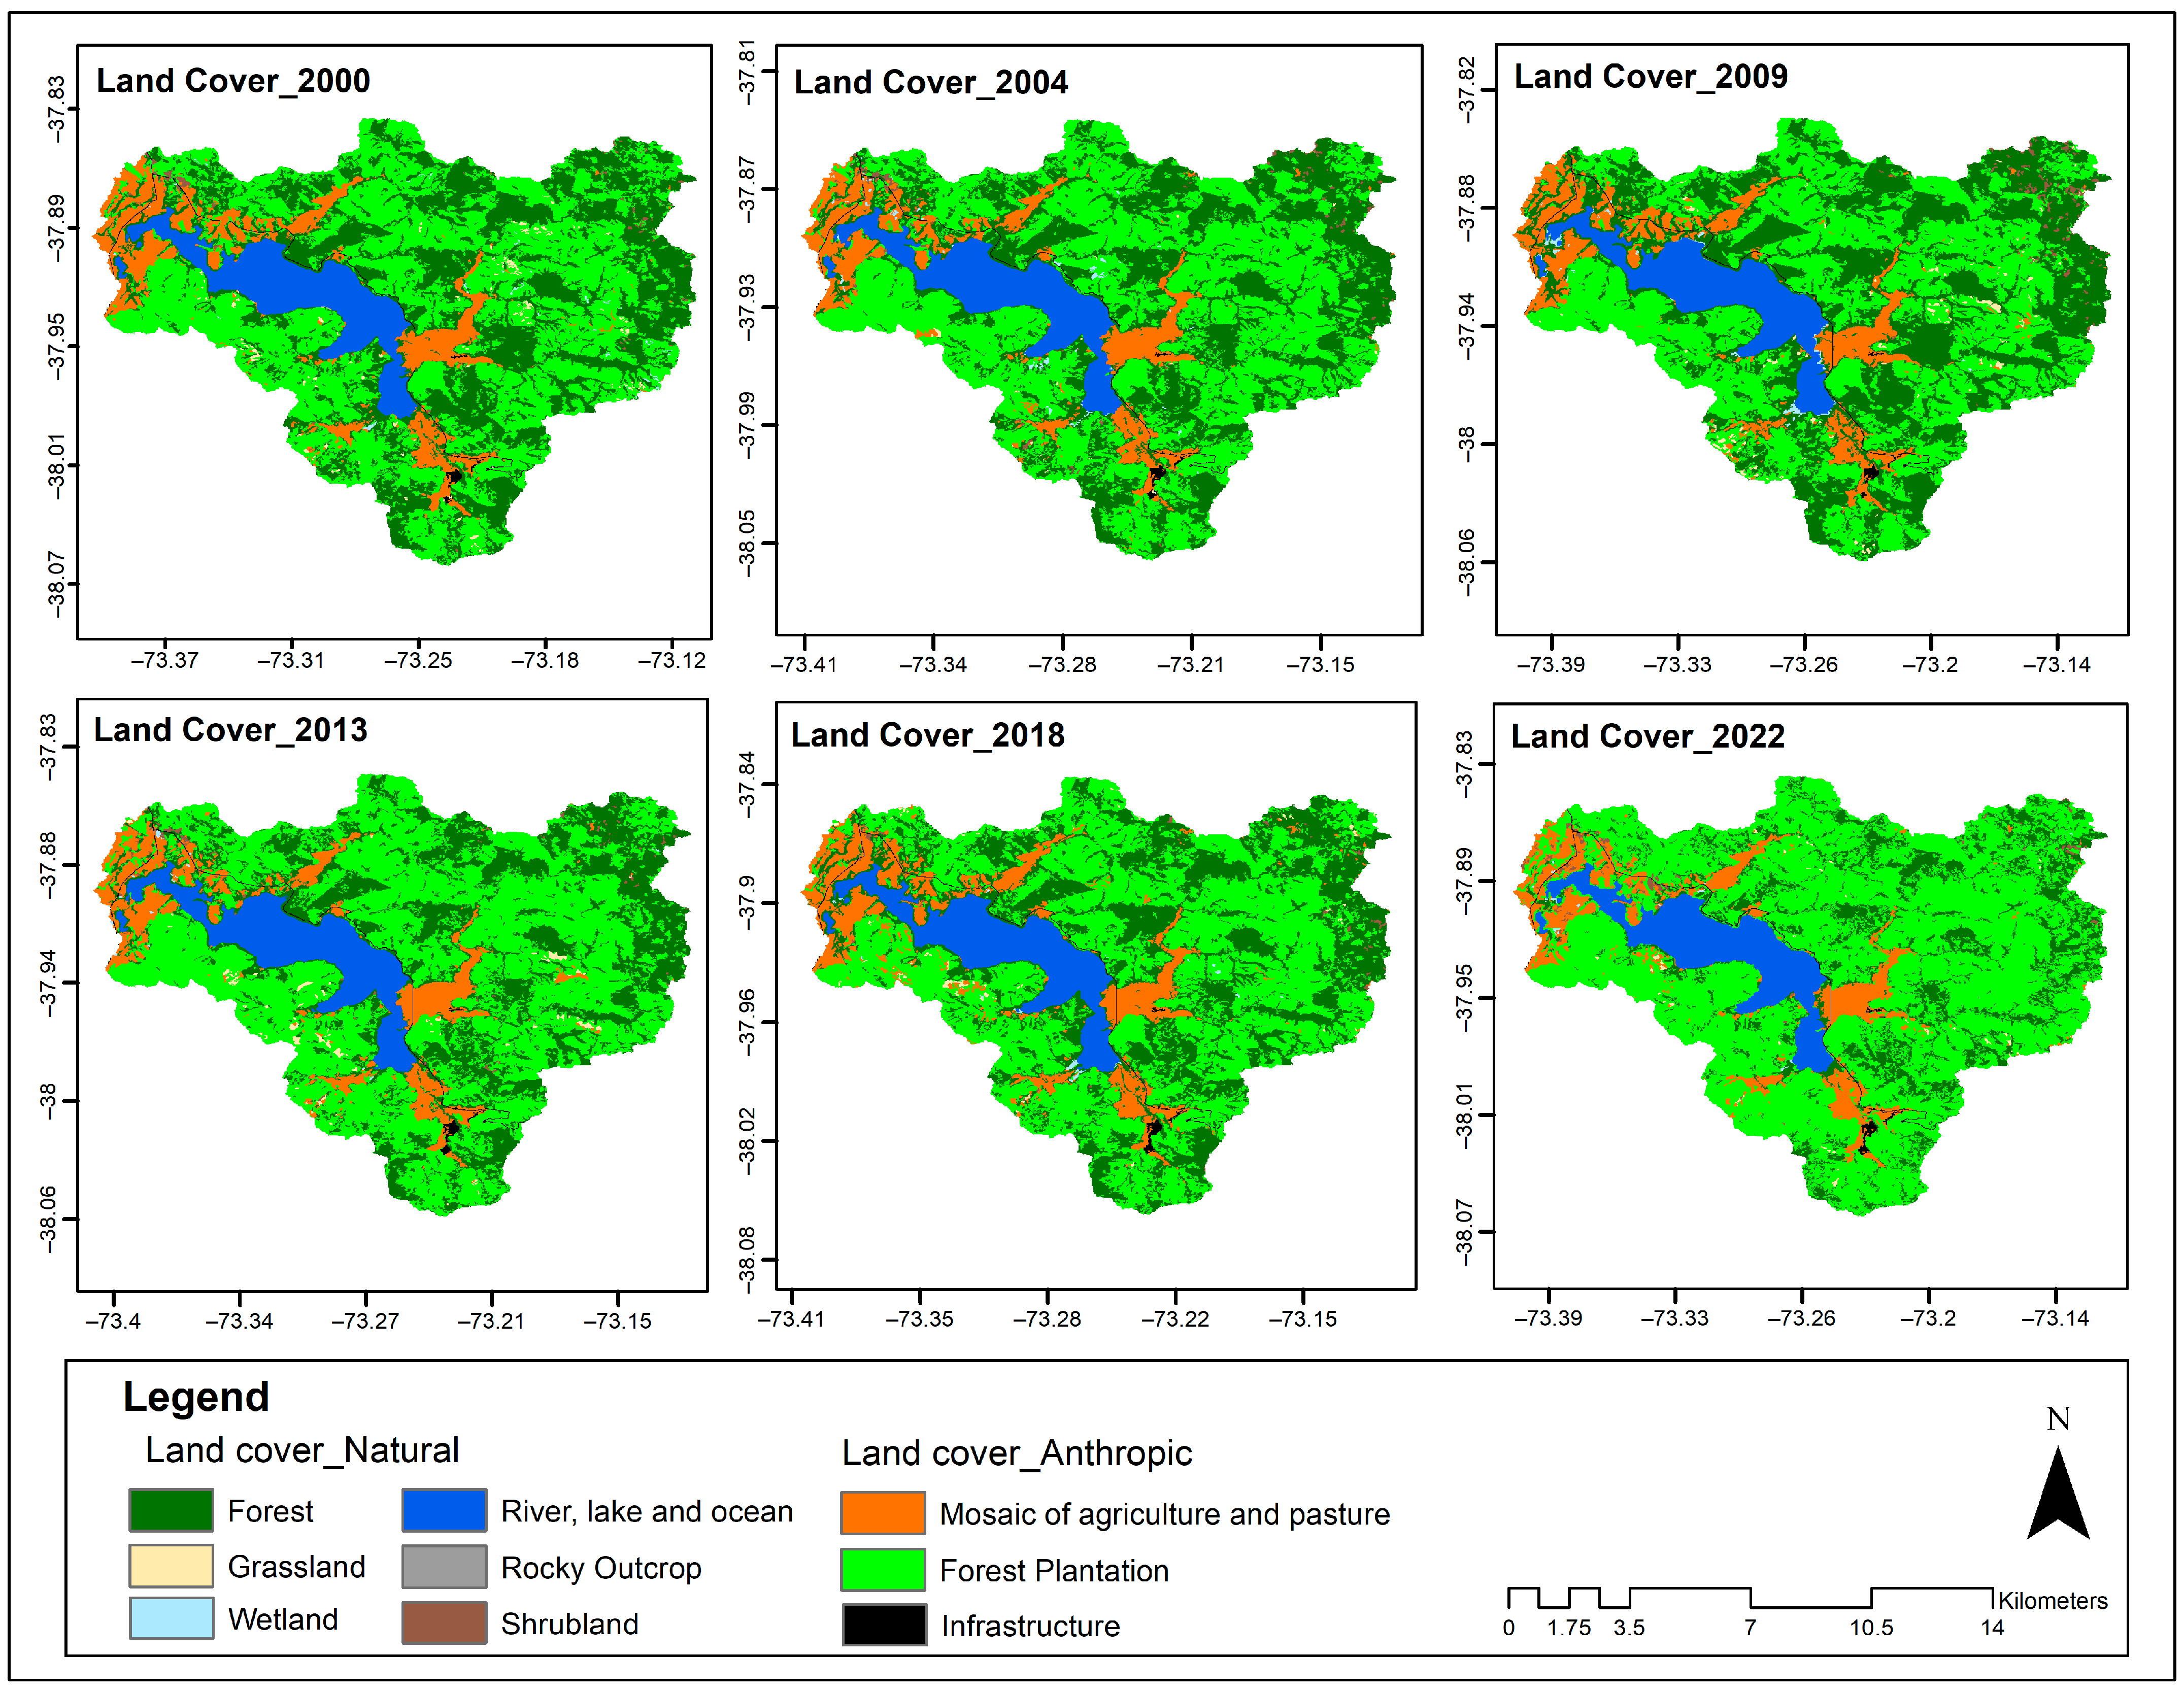
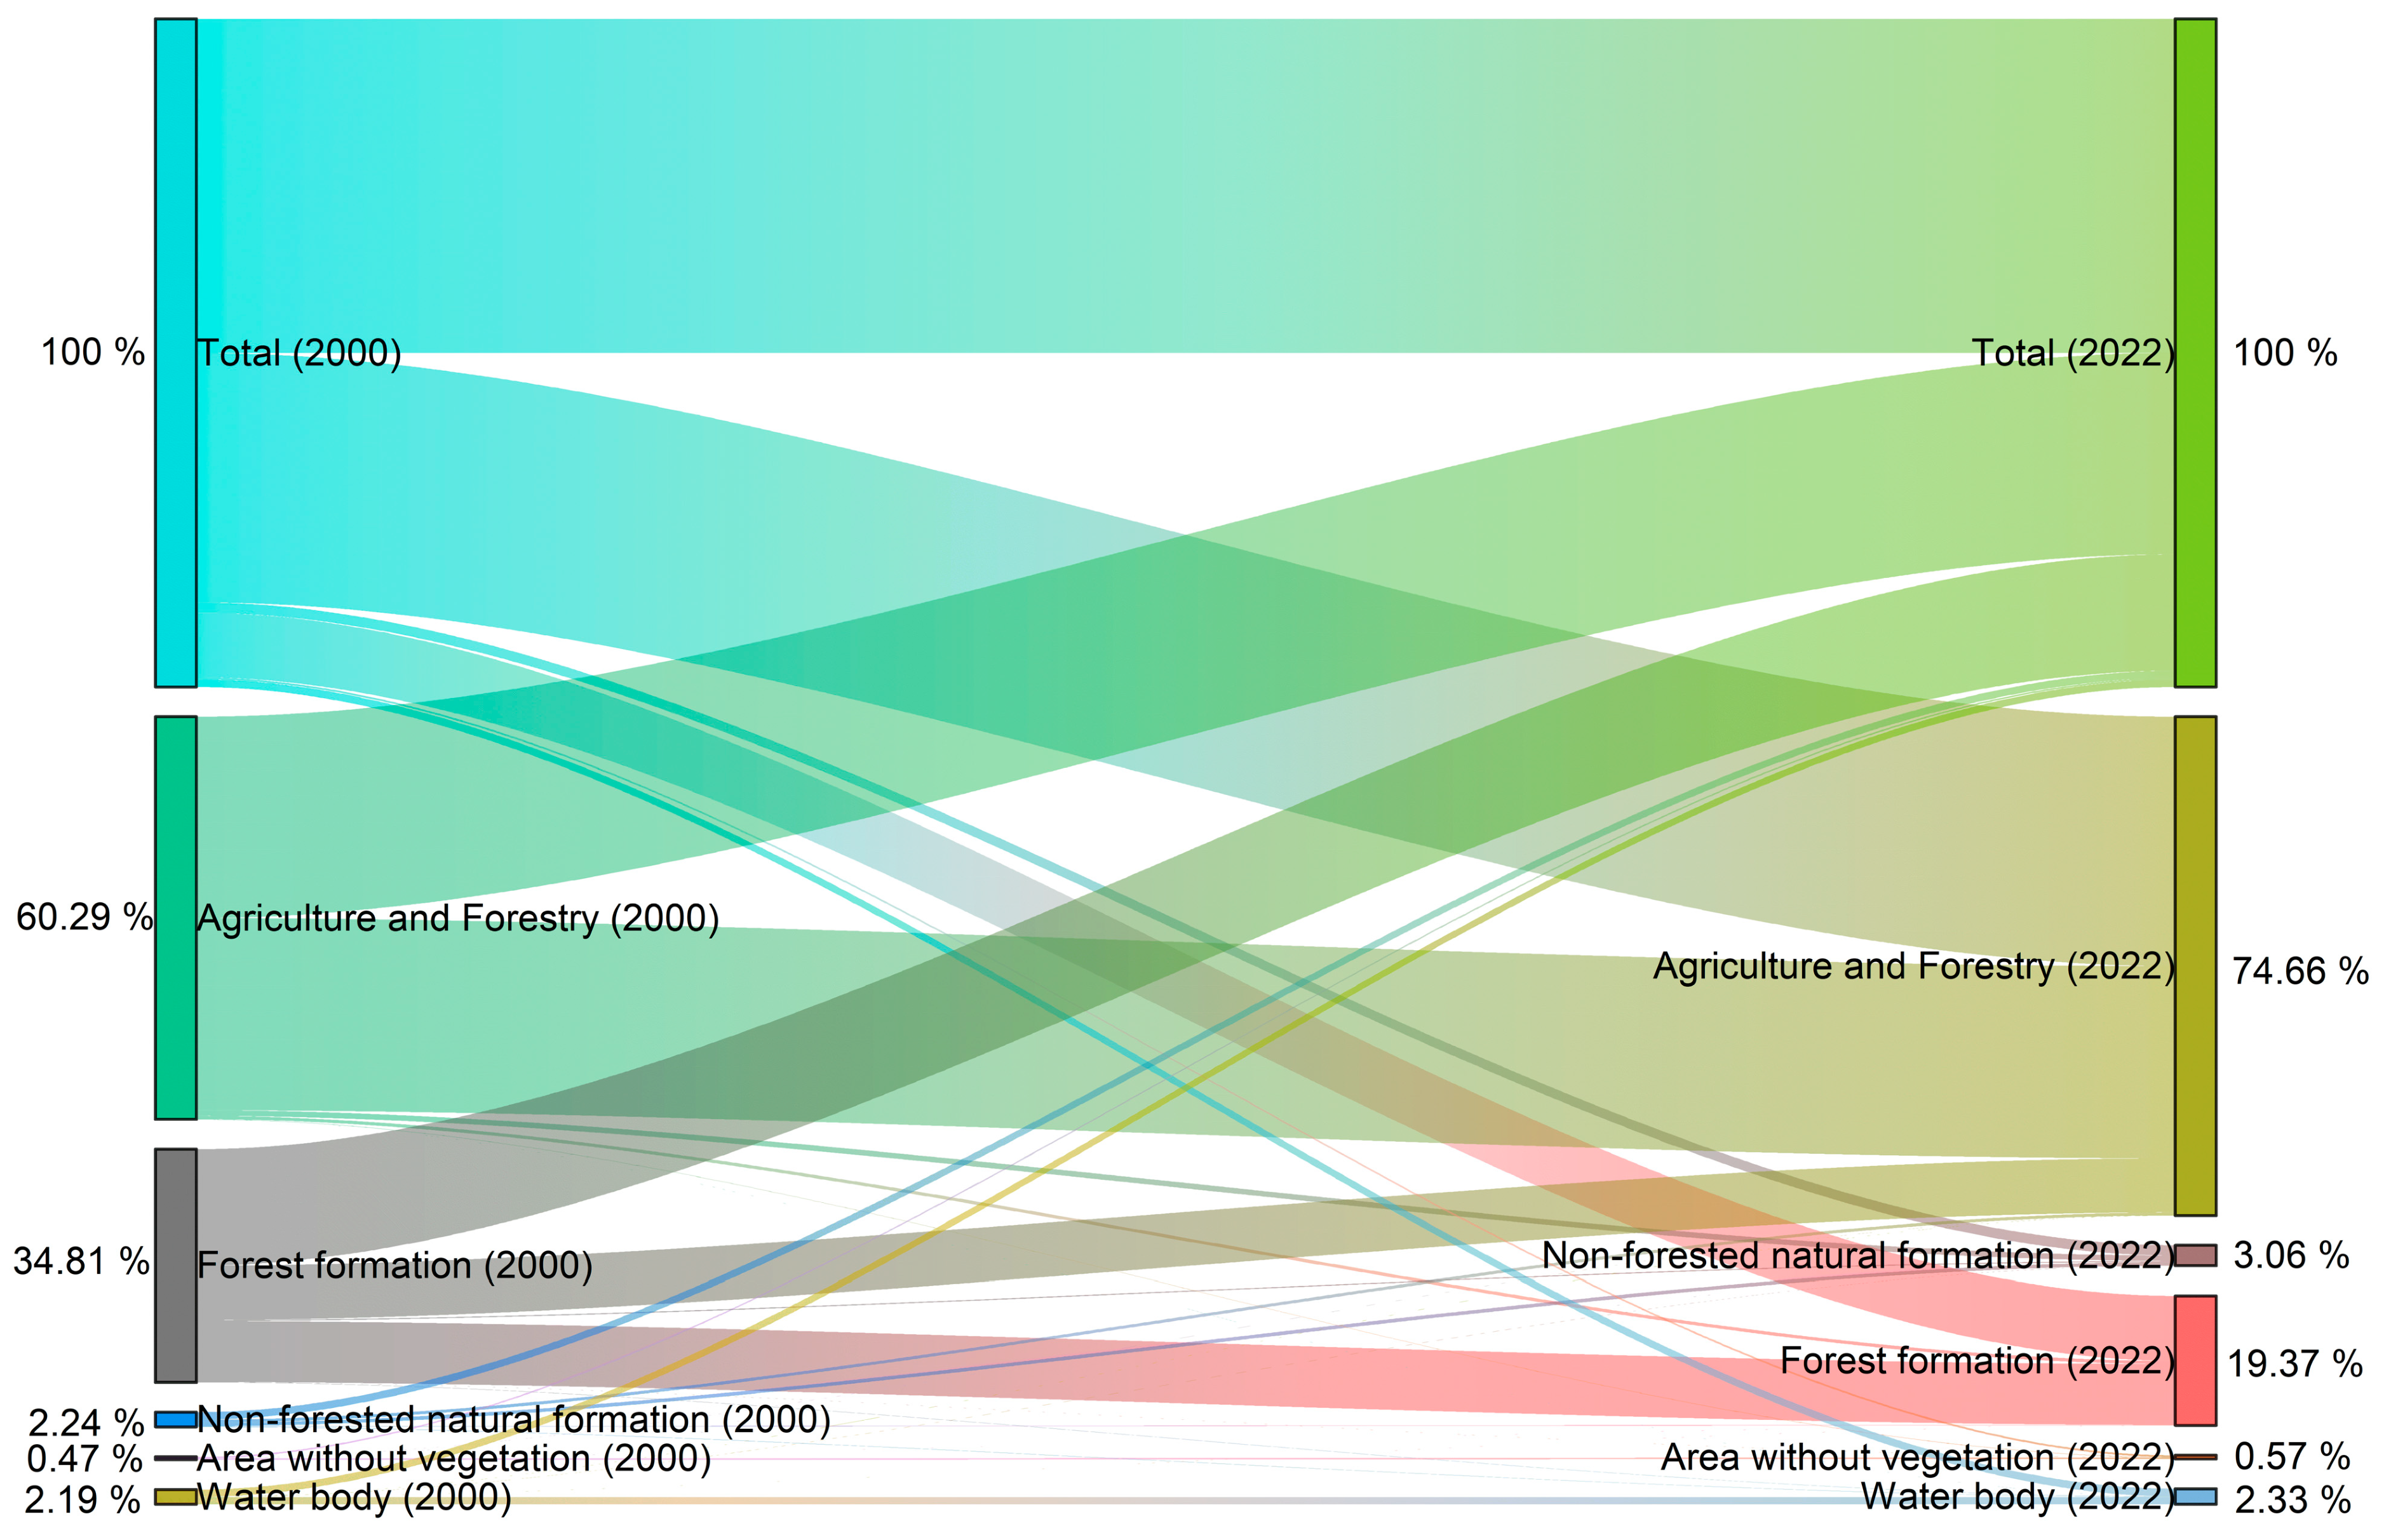
3.3. Land Cover Evolution

In Table 2, we show the land cover in Lanalhue Lake basin during 2000–2022 using data from the Mapbiomas Project.
The table presents land cover changes across various classes from 2000 to 2022 in Lanalhue Lake basin, divided into natural and anthropic categories. Natural land covers include forests, which showed a significant decrease from 37,902.29 ha in 2000 to 21,096.52 ha in 2022, and grasslands and wetlands, both of which fluctuated with minor changes overall. Water bodies, encompassing rivers, lakes, and oceans, experienced slight increases and decreases, stabilizing at 2540.36 ha in 2022. Rocky outcrops and shrublands displayed varying trends, with shrublands notably increasing from 334.78 ha in 2000 to 1595.85 ha in 2022. Among anthropic covers, the mosaic of agriculture and pasture diminished steadily, while forest plantations expanded significantly, from 36,863.05 ha in 2000 to 58,695.44 ha in 2022, marking a notable human-driven transformation. Infrastructure remained relatively stable but saw a gradual increase to 619.53 ha in 2022. These changes underscore the interplay between natural dynamics and anthropogenic activities over two decades.
Figure 4 shows a Sankey plot representing changes in land cover between 2000 and 2022. It shows the transitions between the different land use categories over time, expressed in percentages. In 2000, agriculture and forestry covered 60.29% of the area, a percentage that will increase to 74.66% in 2022. Forest formations, initially at 34.81%, decreased significantly to 19.37%. Non-forest natural formations also increased slightly, from 2.24% to 3.06%, while non-vegetated areas remained relatively constant at 0.47% in 2000 and 0.57% in 2022. Water bodies experienced a marginal increase from 2.19% to 2.33%. The diagram effectively illustrates the dominant expansion of agricultural and forested land at the expense of forested formations, highlighting significant changes in land use patterns over the 22-year period.

3.4. Altimetry-Based Time Series of Water Levels

The series of water levels between 2016 and 2024 obtained from de DGA database and derived from the Sentinel-3A altimetry measurements are shown in Figure 5 when analyzing both data sets. It is possible to note the good level of fit between both data sets, which is also reflected in the results of the statistics with NSE = 0.83, KGE = 0.81 and d = 0.95. Well-behaved models as described in the literature are obtained for all the proposed objective functions [37,38].
Figure 6 depicts the temporal variation in the surface area of a lake, measured in square kilometers, from 1988 to 2025. The data are represented as a black line connecting individual data points, showing fluctuations in the lake area over time. The surface area ranges from approximately 21 km2 to 28 km2, with notable peaks and troughs throughout the series. Periodic spikes suggest potential seasonal or climatic influences on the lake’s surface area. The data set demonstrates a general variability without a clear long-term increasing or decreasing trend, indicating dynamic changes likely influenced by hydrological or environmental factors. while Figure 7 shows the temporal variability of the lake’s volume, measured in cubic kilometers, from 1988 to 2025. The lake volume fluctuates between approximately 0.16 km3 and 0.28 km3, exhibiting regular peaks and troughs, likely reflecting seasonal or climatic influences.
Figure 6. Lake area of Lanalhue during the period 1990–2024.
Water 17 01114 g006
Figure 7. Variation in volume (km3) in Lake Lanalhue through the study period based on bathymetry and water level based on Sentinel-3A.
Water 17 01114 g007

3.5. Correlation Matrix

In Figure 8, we explore the r Peason correlation between all parameters employed in this study to find the more accurate relations.
Based on the Pearson correlation matrix (Figure 8), the strongest positive correlations (near 1) are observed between water level (WL) and volume (V), as well as between surface area (A) and these two variables, highlighting a strong interdependence among these hydrological features. Similarly, a near-perfect correlation exists between temperature (T) and Secchi Depth (SD), suggesting a direct relationship. On the other hand, chlorophyll-a (Chl-a) shows a strong positive correlation with phosphorus total (TP), underlining the nutrient dependency of algal growth. Conversely, notable negative correlations (approaching-1) are observed between temperature (T) and turbidity (Tur), indicating that higher water temperatures might coincide with clearer water conditions. The matrix also reveals strong positive correlations between land cover variables (LC1 to LC10), reflecting interconnected patterns among land use classifications.

3.6. Behavior of Phosporous

Phosphorus was described in previous work from DGA as a limiting nutrient in Lanalhue Lake [40]. We wanted to explore the annual behavior of phosphorus and the influence of precipitation and lake level.
Figure 9 presents a comparative analysis of precipitation, water level and TP (phosphorus concentration) by taking monthly averages for each parameter. Precipitation shows higher values during the wet season, particularly from June to October. The water level reflects the seasonal trends of precipitation, reaching its maximum during the same months. TP levels vary throughout the year but are not strongly correlated with precipitation or water level, indicating possible external influences or distinct seasonal patterns.

4. Discussion

Lakes are complex continental aquatic ecosystems that show great variability in their temporal evolution due to a wide range of factors. These include their morphological structure, physicochemical properties and biological dynamics, as well as the influence exerted by the surrounding watershed and other external elements. To fully understand the behavior and characteristics of these ecosystems, it is essential to carry out continuous and systematic studies. These investigations can be carried out through in situ measurements or remote monitoring techniques, and it is essential to capture data throughout all seasons of the year to account for seasonal variations.
In Chile, the responsibility for monitoring lake water resources lies with the Dirección General de Aguas (DGA). Despite its efforts, the resources allocated to this task remain insufficient, resulting in a critical gap in the comprehensive monitoring of lakes. Currently, less than 5% of the country’s lake ecosystems are systematically monitored. However, monitoring initiatives undertaken by the DGA have provided valuable data on the dynamics of some lakes. For example, data collected between 1989 and 2008 cover all seasons, while monitoring efforts since 2009 have focused mainly on the summer and spring seasons, as seen in the case of Lake Lanalhue.
In this study, we aimed to assess the dynamics of Lake Lanalhue by analyzing the records obtained from these monitoring efforts. To enhance our understanding, we integrated these in situ records with satellite-derived information from sources such as Landsat and Sentinel imagery. This combination of ground-based and remote sensing data provides a comprehensive approach to evaluate the temporal and spatial changes in the lake’s ecosystem, offering critical insights into its behavior and underlying processes.
We analyzed a comprehensive set of variables to evaluate the dynamics of Lake Lanalhue, focusing on both water quality and quantity. Water quality was assessed through five key variables: transparency, temperature, nutrients (nitrogen and total phosphorus), chlorophyll-a, and turbidity following previous work in other lakes such as Villarrica [41,42], Maihue [43] and Ranco [44]. Transparency, measured in meters using a Secchi disk, serves as an indicator of water clarity, which can be affected by suspended particles, phytoplankton abundance, and dissolved substances. During summer, the Secchi Depth (SD) shows greater clarity, with an average of ~3.8 m, while it declines in other seasons, particularly in winter and autumn. This could be related to low precipitation in the summer months and higher precipitation in winter and autumn. High transparency typically suggests low turbidity and minimal algal activity, while reduced clarity may signal sedimentation or nutrient enrichment. Temperature, recorded in degrees Celsius, is another critical parameter as it governs the metabolic processes of aquatic organisms, influences gas solubility (such as oxygen), and causes partial thermal stratification of the lake; being a monomictic lake, it stratifies once a year in the summer season. Temperature decreases from a maximum of ~22 °C in summer to a minimum of ~11 °C in winter, before rising again in spring to ~15–16 °C. Nutrient levels, specifically nitrogen and total phosphorus, play a pivotal role in determining the lake’s trophic status. Total nitrogen (TN) concentrations vary widely, peaking in winter and autumn with averages up to 488 µg/L, and show significant site-to-site variability months in which precipitation is higher, and therefore the runoff from the basin provides high nutrients from agricultural and forestry activities, especially in the southern part of the lake. Total phosphorus (TP) also exhibits high variability, with maximum values reaching 200 µg/L, primarily in spring, and notable seasonal fluctuations across sites. This parameter has been identified by the Direccion General de Aguas as the limiting factor of this lake body. Excessive nutrient input can lead to eutrophication, resulting in algal blooms, oxygen depletion, and adverse impacts on aquatic life. To assess biological productivity, we included chlorophyll-a, a pigment present in phytoplankton, as a proxy for biomass and photosynthetic activity. Chlorophyll-a peaks in autumn (~9.6 µg/L) and spring (~6 µg/L), suggesting increased productivity, while it is minimal in winter (~1.2 µg/L). Finally, turbidity, measured as water cloudiness, reflects the concentration of suspended particles, organic matter, or plankton. Turbidity peaks in autumn and winter, with extreme values up to 40 NTU in certain locations, inhibiting light penetration and disrupting aquatic photosynthesis.
Recognizing the substantial influence of meteorological conditions on lake ecosystems, we incorporated three climate-related variables into our analysis: ambient temperature, precipitation, and wind speed. These variables have been previously used by us in other lakes in southern Chile such as Lake Maihue and Ranco showing a direct relationship with the factors associated with the water column, impacting the hydrodynamics and physical processes of the lakes [43,44]. Ambient temperature is a driving factor that influences water temperature, stratification, and biological activity. In the region surrounding Lake Lanalhue, ambient temperatures in the warmer months (December to February) average between 15 °C and 25 °C, with summer temperatures peaking at 28 °C. During cooler months (June to August), temperatures range from 5 °C to 15 °C, with winter lows dipping close to freezing. Precipitation impacts the hydrological balance by contributing to nutrient loading, sediment transport, and water levels. Precipitation is highest in winter, primarily between May and August, where monthly averages can reach up to 200 mm, while summer months are drier, with monthly averages closer to 20–50 mm. Wind speed affects mixing and stratification within the lake, redistributing heat, nutrients, and sediments. A similar behavior was observed in a previous study on Lake Villarrica [41]. However, in a study involving a larger number of lakes in southern Chile, we found that, in addition to speed, wind direction also influenced turbidity processes in these lacustrine ecosystems [45]. Wind speeds around Lake Lanalhue are generally mild, averaging 2–4 m/s, though they may increase slightly in spring and fall, with gusts occasionally reaching above 5 m/s.
In addition to water quality, understanding the physical dimensions of Lake Lanalhue is equally crucial, as these characteristics can profoundly influence its ecological dynamics. Using satellite altimetry, we included variables that describe the quantity of water in the system, i.e., lake level, volume, and surface area, following the methodology used in [39]. The surface area of the lake fluctuates between approximately 21 km2 and 28 km2, with notable peaks and troughs throughout the series, suggesting potential seasonal or climatic influences on the lake’s extent. Lake level provides insight into vertical water fluctuations, which reflect hydrological balance and can indicate responses to climatic changes or human activities such as water extraction. Volume, which fluctuates between approximately 0.16 km3 and 0.28 km3, quantifies the total water storage in the lake, essential for assessing its ecological and human utility, and exhibits regular peaks and troughs, likely reflecting seasonal or climatic influences. Surface area, on the other hand, is a measure of the extent of the lake, offering insights into habitat availability for aquatic and riparian species. By integrating in situ measurements with remote sensing data from sources such as Landsat and Sentinel, this study provides a holistic view of Lake Lanalhue’s behavior and its response to environmental and anthropogenic pressures. This combined approach enables a more nuanced understanding of the interplay between water quality, quantity, and climatic factors, contributing to more effective management strategies for the preservation of this critical ecosystem.
In Table 2, we present land cover changes across various classes from 2000 to 2022 in the Lanalhue Lake basin, divided into natural and anthropic categories. Natural land covers include forests, which showed a significant decrease from 37,902.29 ha in 2000 to 21,096.52 ha in 2022, and grasslands and wetlands, both of which fluctuated with minor changes overall. Water bodies, encompassing rivers, lakes, and oceans, experienced slight increases and decreases, stabilizing at 2540.36 ha in 2022. Rocky outcrops and shrublands displayed varying trends, with shrublands notably increasing from 334.78 ha in 2000 to 1595.85 ha in 2022. Among anthropic covers, the mosaic of agriculture and pasture diminished steadily, while forest plantations expanded significantly, from 36,863.05 ha in 2000 to 58,695.44 ha in 2022, marking a notable human-driven transformation. Infrastructure remained relatively stable but saw a gradual increase to 619.53 ha in 2022. These changes underscore the interplay between natural dynamics and anthropogenic activities over two decades.
In parallel, Lake Lanalhue has experienced an increasing frequency of algal bloom events in recent years like other lakes in south-central Chile [42,46,47], a phenomenon likely driven by the combined effects of climate change and anthropogenic activities. Rising temperatures, with summer air temperatures peaking at 28 °C and the lake temperature reaching a maximum of ~22 °C, exacerbate favorable conditions for algal growth by promoting thermal stratification and increasing metabolic rates of phytoplankton. In parallel, intensifying land use changes in the surrounding watershed have contributed to increased nutrient loads, which further fuel these blooms. Changes in land use, such as agricultural expansion, deforestation, and urban development, often lead to increased runoff that transports sediment, fertilizers, and organic matter into aquatic systems. Precipitation patterns, particularly the highest rainfall between May and August (averaging up to 200 mm monthly), contribute to nutrient loading, with spring and autumn typically showing higher levels of chlorophyll-a (~9.6 µg/L in autumn). To better capture and understand these dynamics, this study incorporated an analysis of land cover evolution within the Lake Lanalhue watershed. By examining historical land cover transitions, such as the shift from forest to agriculture or natural vegetation to urban land, our goal was to identify patterns of change that may contribute to nutrient loading and hydrological alterations. This integrative approach allows for a broader contextualization of current lake conditions, highlighting potential drivers of ecological change, including the impact of land cover transformations and climatic factors on algal blooms and overall lake health.
In addition, previous reports from the Dirección General de Aguas (DGA) have characterized Lake Lanalhue as a phosphorus-limited system. In such systems, phosphorus availability directly regulates primary productivity, with increased inputs often triggering algal blooms and accelerating eutrophication. To investigate these dynamics, we included an analysis of phosphorus behavior in relation to precipitation events during the study period. Precipitation can significantly increase nutrient input to the lake through surface runoff, particularly in watersheds with altered or poorly managed land cover. This runoff transports phosphorus-rich sediments and agricultural fertilizers into the lake, intensifying nutrient enrichment and promoting eutrophic conditions.
By integrating analysis of land cover evolution and the interaction between phosphorus and precipitation, this study provides a more complete understanding of the factors driving recent ecological changes in Lake Lanalhue. This holistic approach not only sheds light on the lake’s susceptibility to algal blooms, but also underscores the importance of managing both climate-related impacts and land use practices in its watershed. This knowledge is critical for developing effective mitigation strategies aimed at preserving the ecological balance and water quality of Lake Lanalhue in the face of continuing environmental and anthropogenic pressures.

5. Conclusions

By integrating multiple sources of in situ data from monitoring by the DGA of Chile, meteorological data from the DMC, and Landsat satellite imagery for land cover, alongside altimeter data to assess the level, volume, and area of Lake Lanalhue, this study successfully analyzed the dynamics and evolution of this lake ecosystem over recent decades. The water quality parameters analyzed in this study showed that the blooms that have appeared in recent years may be related to the increase in nutrients nitrogen and total phosphorus, where maximum concentrations of 390 and 200 µg/L, respectively, were found due to land use change and intensification of agriculture, especially in the southern sector of the lake. On the other hand, these events can be influenced by the increases in water temperature that we observed; except for the winter month that reaches up to 13 °C, the rest of the seasons of the year maintain maximums between 19 and 20 °C, which stimulates the photosynthetic process of the algae. Continuous monitoring of both the quality and quantity of water in the lake is crucial, especially given the anthropogenic pressures from intensive agricultural and forestry activities within the basin, compounded by the direct effects of climate change. These factors have contributed to an increase in algal blooms in Lake Lanalhue. Future research will focus on enhancing the remote detection of algal bloom events, characterizing algal groups, and identifying bloom-forming species.

Author Contributions

Conceptualization, L.R.-L.; methodology, L.R.-L., P.F.-A. and R.M.-R.; software, L.R.-L., L.B., R.M.-R. and P.F.-A.; validation, L.R.-L., P.F.-A., L.B.A. and R.U.; formal analysis, L.R.-L.; investigation, L.R.-L.; resources, R.U.; data curation, L.B.; writing—original draft preparation, L.R.-L.; writing—review and editing, P.F.-A., L.B.A., I.D.-L., L.B and F.F.; visualization, L.B.A., R.M.-R. and P.F.-A.; supervision, R.U.; project administration, L.R.-L.; funding acquisition, L.B. All authors have read and agreed to the published version of the manuscript.

Funding

Project ANID/Fondecyt Iniciación 2025/11250177.

Data Availability Statement

The original data presented in the study are openly available in Website of Dirección General de Aguas del Gobierno de Chile (DGA) at http://www.dga.cl/Paginas/Default.aspx (accessed on 10 March 2025).

Acknowledgments

L.R.-L. thanks to (Project ANID/Fondecyt Iniciación 2025/11250177) and Project ANID/FOVI 240030. L.R.-L. gives thanks to Vicerrectoría de Investigación y Doctorados de la Universidad San Sebastián. L.R.-L. and R.U. is grateful to the Centro de Recursos Hídricos para la Agricultura y la Minería (CRHIAM) (Project ANID/FONDAP/15130015 and ANID/FONDAP/1523A0001).

Conflicts of Interest

The authors declare no conflicts of interest.

References

  1. Hei, P.; Yang, T.; Huang, L.; Liu, Y.; Yang, J.; Shang, Y.; Feng, L.; Huang, G. Unraveling Eutrophication Controversies: Innovative Strategies and Holistic Perspectives. Crit. Rev. Environ. Sci. Technol. 2024, 55, 147–168. [Google Scholar] [CrossRef]
  2. Suresh, K.; Tang, T.; Van Vliet, M.T.H.; Bierkens, M.F.P.; Strokal, M.; Sorger-Domenigg, F.; Wada, Y. Recent Advancement in Water Quality Indicators for Eutrophication in Global Freshwater Lakes. Environ. Res. Lett. 2023, 18, 063004. [Google Scholar] [CrossRef]
  3. Li, M.; Dong, J.; Zhang, Y.; Yang, H.; Van Zwieten, L.; Lu, H.; Alshameri, A.; Zhan, Z.; Chen, X.; Jiang, X.; et al. A Critical Review of Methods for Analyzing Freshwater Eutrophication. Water 2021, 13, 225. [Google Scholar] [CrossRef]
  4. Bănăduc, D.; Simić, V.; Cianfaglione, K.; Barinova, S.; Afanasyev, S.; Öktener, A.; McCall, G.; Simić, S.; Curtean-Bănăduc, A. Freshwater as a Sustainable Resource and Generator of Secondary Resources in the 21st Century: Stressors, Threats, Risks, Management and Protection Strategies, and Conservation Approaches. Int. J. Environ. Res. Public. Health 2022, 19, 16570. [Google Scholar] [CrossRef] [PubMed]
  5. Ahmed, S.F.; Kumar, P.S.; Kabir, M.; Zuhara, F.T.; Mehjabin, A.; Tasannum, N.; Hoang, A.T.; Kabir, Z.; Mofijur, M. Threats, Challenges and Sustainable Conservation Strategies for Freshwater Biodiversity. Environ. Res. 2022, 214, 113808. [Google Scholar] [CrossRef]
  6. Sun, Q.; Yan, Z.; Wang, J.; Chen, J.A.; Li, X.; Shi, W.; Liu, J.; Li, S.L. Evaluating Impacts of Climate and Management on Reservoir Water Quality Using Environmental Fluid Dynamics Code. Sci. Total Environ. 2024, 947, 174608. [Google Scholar] [CrossRef]
  7. Neale, P.J.; Williamson, C.E.; Banaszak, A.T.; Häder, D.P.; Hylander, S.; Ossola, R.; Rose, K.C.; Wängberg, S.; Zepp, R. The Response of Aquatic Ecosystems to the Interactive Effects of Stratospheric Ozone Depletion, UV Radiation, and Climate Change. Photochem. Photobiol. Sci. 2023, 22, 1093–1127. [Google Scholar] [CrossRef]
  8. Lakshmikandan, M.; Li, M.; Pan, B. Cyanobacterial Blooms in Environmental Water: Causes and Solutions. Curr. Pollut. Rep. 2024, 10, 606–627. [Google Scholar] [CrossRef]
  9. Zhang, Y.; Shen, J.; He, L.; Feng, J.; Chi, L.; Wang, X. Challenge to Lake Ecosystems: Changes in Thermal Structure Triggered by Climate Change. Water 2024, 16, 888. [Google Scholar] [CrossRef]
  10. Singh, P.K.; Kumar, U.; Kumar, I.; Dwivedi, A.; Singh, P.; Mishra, S.; Seth, C.S.; Sharma, R.K. Critical Review on Toxic Contaminants in Surface Water Ecosystem: Sources, Monitoring, and Its Impact on Human Health. Environ. Sci. Pollut. Res. 2024, 31, 56428–56462. [Google Scholar] [CrossRef]
  11. Carey, C.C.; Woelmer, W.M.; Lofton, M.E.; Figueiredo, R.J.; Bookout, B.J.; Corrigan, R.S.; Daneshmand, V.; Hounshell, A.G.; Howard, D.W.; Lewis, A.S.L.; et al. Advancing Lake and Reservoir Water Quality Management with Near-Term, Iterative Ecological Forecasting. Inland. Waters 2022, 12, 107–120. [Google Scholar] [CrossRef]
  12. Papa, F.; Crétaux, J.F.; Grippa, M.; Robert, E.; Trigg, M.; Tshimanga, R.M.; Kitambo, B.; Paris, A.; Carr, A.; Fleischmann, A.S.; et al. Water Resources in Africa under Global Change: Monitoring Surface Waters from Space. Surv. Geophys. 2023, 44, 43–93. [Google Scholar] [CrossRef] [PubMed]
  13. Oleksy, I.A.; Jones, S.E.; Solomon, C.T. Hydrologic Setting Dictates the Sensitivity of Ecosystem Metabolism to Climate Variability in Lakes. Ecosystems 2022, 25, 1328–1345. [Google Scholar] [CrossRef]
  14. Kuhlmann Andersen, T.; Nielsen, A.; Jeppesen, E.; Hu, F.; Bolding, K.; Liu, Z.; Søndergaard, M.; Johansson, L.S.; Trolle, D.; Andersen, C.; et al. Predicting Ecosystem State Changes in Shallow Lakes Using an Aquatic Ecosystem Model: Lake Hinge, Denmark, an Example. Ecol. Appl. 2020, 30, e02160. [Google Scholar] [CrossRef]
  15. Yan, Z.; Feng, C.; Jin, X.; Qiao, Y.; Wang, J.; Huang, N.; Bai, Y. Unbalanced Pollution and Ecological Risk of Organophosphate Esters in Chinese Surface Water and Land Use Under Multiple Driving Factors. Rev. Environ. Contam. Toxicol. 2023, 261, 18. [Google Scholar] [CrossRef]
  16. Njagi, D.M.; Routh, J.; Odhiambo, M.; Luo, C.; Basapuram, L.G.; Olago, D.; Klump, V.; Stager, C. A Century of Human-Induced Environmental Changes and the Combined Roles of Nutrients and Land Use in Lake Victoria Catchment on Eutrophication. Sci. Total Environ. 2022, 835, 155425. [Google Scholar] [CrossRef]
  17. Lukhele, T.; Msagati, T.A.M. Eutrophication of Inland Surface Waters in South Africa: An Overview. Int. J. Environ. Res. 2024, 18, 27. [Google Scholar] [CrossRef]
  18. Alaniz, A.J.; Abarzúa, A.M.; Martel-Cea, A.; Jarpa, L.; Hernández, M.; Aquino-López, M.A.; Smith-Ramírez, C. Linking Sedimentological and Spatial Analysis to Assess the Impact of the Forestry Industry on Soil Loss: The Case of Lanalhue Basin, Chile. Catena 2021, 207, 105660. [Google Scholar] [CrossRef]
  19. Tang, F.; Li, J.; Ma, X.; Li, Y.; Yang, H.; Huang, C.; Huang, T. Temporal Patterns and Driving Factors of Sediment Carbon, Nitrogen, and Phosphorus Stoichiometry in a Eutrophication Plateau Lake. Sci. Total Environ. 2024, 915, 170016. [Google Scholar] [CrossRef]
  20. Sánchez Valdivia, A.; De Stefano, L.G.; Ferraro, G.; Gianello, D.; Ferral, A.; Dogliotti, A.I.; Reissig, M.; Gerea, M.; Queimaliños, C.; Pérez, G.L. Characterizing Chromophoric Dissolved Organic Matter Spatio-Temporal Variability in North Andean Patagonian Lakes Using Remote Sensing Information and Environmental Analysis. Remote Sens. 2024, 16, 4063. [Google Scholar] [CrossRef]
  21. Barraza-Moraga, F.; Alcayaga, H.; Pizarro, A.; Félez-Bernal, J.; Urrutia, R. Estimation of Chlorophyll-a Concentrations in Lanalhue Lake Using Sentinel-2 MSI Satellite Images. Remote Sens. 2022, 14, 5647. [Google Scholar] [CrossRef]
  22. Heslop, E.E.; Sánchez-Román, A.; Pascual, A.; Rodríguez, D.; Reeve, K.A.; Faugère, Y.; Raynal, M. Sentinel-3A Views Ocean Variability More Accurately at Finer Resolution. Geophys. Res. Lett. 2017, 44, 12367–12374. [Google Scholar] [CrossRef]
  23. Yang, J.; Zhang, J. Validation of Sentinel-3A/3B Satellite Altimetry Wave Heights with Buoy and Jason-3 Data. Sensors 2019, 19, 2914. [Google Scholar] [CrossRef] [PubMed]
  24. Donlon, C.; Berruti, B.; Buongiorno, A.; Ferreira, M.H.; Féménias, P.; Frerick, J.; Goryl, P.; Klein, U.; Laur, H.; Mavrocordatos, C.; et al. The Global Monitoring for Environment and Security (GMES) Sentinel-3 Mission. Remote Sens. Environ. 2012, 120, 37–57. [Google Scholar] [CrossRef]
  25. Roy, Y.L.; Deschaux-Beaume, M.; Mavrocordatos, C.; Aguirre, M.; Heliere, F. SRAL SAR Radar Altimeter for Sentinel-3 Mission. In Proceedings of the 2007 IEEE International Geoscience and Remote Sensing Symposium, Barcelona, Spain, 23–28 July 2007; pp. 219–222. [Google Scholar]
  26. Halicki, M.; Niedzielski, T. The Accuracy of the Sentinel-3A Altimetry over Polish Rivers. J. Hydrol. 2022, 606, 127355. [Google Scholar] [CrossRef]
  27. Benveniste, J. Radar Altimetry: Past, Present and Future. In Coastal Altimetry; Springer: Berlin/Heidelberg, Germany, 2011; pp. 1–17. ISBN 9783642127953. [Google Scholar]
  28. Biancamaria, S.; Frappart, F.; Leleu, A.S.; Marieu, V.; Blumstein, D.; Desjonquères, J.D.; Boy, F.; Sottolichio, A.; Valle-Levinson, A. Satellite Radar Altimetry Water Elevations Performance over a 200 m Wide River: Evaluation over the Garonne River. Adv. Space Res. 2017, 59, 128–146. [Google Scholar] [CrossRef]
  29. Pham-Duc, B.; Frappart, F.; Tran-Anh, Q.; Si, S.T.; Phan, H.; Quoc, S.N.; Le, A.P.; Viet, B. Do Monitoring Lake Volume Variation from Space Using Satellite Observations—A Case Study in Thac Mo Reservoir (Vietnam). Remote Sens. 2022, 14, 4023. [Google Scholar] [CrossRef]
  30. Oularé, S.; Sokeng, V.C.J.; Kouamé, K.F.; Komenan, C.A.K.; Danumah, J.H.; Mertens, B.; Akpa, Y.L.; Catry, T.; Pillot, B. Contribution of Sentinel-3A Radar Altimetry Data to the Study of the Water Level Variations in Lake Buyo (West of Côte d’Ivoire). Remote Sens. 2022, 14, 5602. [Google Scholar] [CrossRef]
  31. Frappart, F.; Blarel, F.; Fayad, I.; Bergé-Nguyen, M.; Crétaux, J.F.; Shu, S.; Schregenberger, J.; Baghdadi, N. Evaluation of the Performances of Radar and Lidar Altimetry Missions for Water Level Retrievals in Mountainous Environment: The Case of the Swiss Lakes. Remote Sens. 2021, 13, 2196. [Google Scholar] [CrossRef]
  32. Nash, J.E.; Sutcliffe, J. V River Flow Forecasting through Conceptual Models Part I—A Discussion of Principles. J. Hydrol. 1970, 10, 282–290. [Google Scholar] [CrossRef]
  33. Guse, B.; Pfannerstill, M.; Gafurov, A.; Kiesel, J.; Lehr, C.; Fohrer, N. Identifying the Connective Strength between Model Parameters and Performance Criteria. Hydrol. Earth Syst. Sci. 2017, 21, 5663–5679. [Google Scholar] [CrossRef]
  34. Medina, Y.; Muñoz, E. Estimation of Annual Maximum and Minimum Flow Trends in a Data-Scarce Basin. Case Study of the Allipen River Watershed, Chile. Water 2020, 12, 162. [Google Scholar] [CrossRef]
  35. Moriasi, D.N.; Arnold, J.G.; Liew, M.W.V.; Bingner, R.L.; Harmel, R.D.; Veith, T.L. Model Evaluation Guidelines For Systematic Quantification of Accuracy in Watershed Simulations. Trans. ASABE 2007, 50, 885–900. [Google Scholar] [CrossRef]
  36. Gupta, H.V.; Kling, H.; Yilmaz, K.K.; Martinez, G.F. Decomposition of the Mean Squared Error and NSE Performance Criteria: Implications for Improving Hydrological Modelling. J. Hydrol. 2009, 377, 80–91. [Google Scholar] [CrossRef]
  37. Patil, S.D.; Stieglitz, M. Comparing Spatial and Temporal Transferability of Hydrological Model Parameters. J. Hydrol. 2015, 525, 409–417. [Google Scholar] [CrossRef]
  38. Willmott, C.J.; Robeson, S.M.; Matsuura, K. A Refined Index of Model Performance. Int. J. Climatol. 2012, 32, 2088–2094. [Google Scholar] [CrossRef]
  39. Fuentes-Aguilera, P.; Rodríguez-López, L.; Bourrel, L.; Frappart, F. Recovery of Time Series of Water Volume in Lake Ranco (South Chile) through Satellite Altimetry and Its Relationship with Climatic Phenomena. Water 2024, 16, 1997. [Google Scholar] [CrossRef]
  40. Dga Evaluación de la Condición Trófica de la Red de Control de Lagos de la dga; Water Directorate of Chile: Santiago, Chile, 2014.
  41. Rodríguez-López, L.; González-Rodríguez, L.; Duran-Llacer, I.; García, W.; Cardenas, R.; Urrutia, R. Assessment of the Diffuse Attenuation Coefficient of Photosynthetically Active Radiation in a Chilean Lake. Remote Sens. 2022, 14, 4568. [Google Scholar] [CrossRef]
  42. Rodríguez-López, L.; Duran-Llacer, I.; Bravo Alvarez, L.; Lami, A.; Urrutia, R. Recovery of Water Quality and Detection of Algal Blooms in Lake Villarrica through Landsat Satellite Images and Monitoring Data. Remote Sens. 2023, 15, 1929. [Google Scholar] [CrossRef]
  43. Rodríguez-López, L.; Alvarez, D.; Bustos Usta, D.; Duran-Llacer, I.; Bravo Alvarez, L.; Fagel, N.; Bourrel, L.; Frappart, F.; Urrutia, R. Chlorophyll-a Detection Algorithms at Different Depths Using In Situ, Meteorological, and Remote Sensing Data in a Chilean Lake. Remote Sens. 2024, 16, 647. [Google Scholar] [CrossRef]
  44. Rodríguez-López, L.; Bravo Alvarez, L.; Duran-Llacer, I.; Ruíz-Guirola, D.E.; Montejo-Sánchez, S.; Martínez-Retureta, R.; López-Morales, E.; Bourrel, L.; Frappart, F.; Urrutia, R. Leveraging Machine Learning and Remote Sensing for Water Quality Analysis in Lake Ranco, Southern Chile. Remote Sens. 2024, 16, 3401. [Google Scholar] [CrossRef]
  45. Rodríguez-López, L.; Duran-Llacer, I.; González-Rodríguez, L.; Cardenas, R.; Urrutia, R. Retrieving water turbidity in araucanian lakes (South-central chile) based on multispectral landsat imagery. Remote Sens. 2021, 13, 3133. [Google Scholar] [CrossRef]
  46. Yépez, S.; Velásquez, G.; Torres, D.; Saavedra-Passache, R.; Pincheira, M.; Cid, H.; Rodríguez-López, L.; Contreras, A.; Frappart, F.; Cristóbal, J.; et al. Spatiotemporal Variations in Biophysical Water Quality Parameters: An Integrated In Situ and Remote Sensing Analysis of an Urban Lake in Chile. Remote Sens. 2024, 16, 427. [Google Scholar] [CrossRef]
  47. Rodríguez-López, L.; Lami, A.; El Ouahabi, M.; Fagel, N.; Álvarez, D.; González-Rodríguez, L.; Schmidt, S.; Urrutia, R. Fossil Pigments and Environmental Conditions in the Oligotrophic Laja Lake in the Chilean Andes. Anthropocene 2022, 37, 100321. [Google Scholar] [CrossRef]
Figure 1. (a) Chile in Latinoamerica, (b) Lanalhue lake basin and meteorological stations (M1–M6) and (c) Lake Lanalhue Bathymetry and water monitoring stations (L1–L5, LM 1).
Water 17 01114 g001
Figure 2. Land cover in Lanalhue Lake basin during 2000–2022.
Water 17 01114 g002
Figure 3. Meteorological conditions in Lake Lanalhue during the studied period.
Water 17 01114 g003
Figure 4. Sankey diagram of transition of land cover during 2000–2022.
Water 17 01114 g004
Figure 5. Lake-level fluctuations [m] between 2017 and 2023 from the DGA In-Line Hydrometeorological System (blue line) and derived from Sentinel-3A altimetry measurements (red dots).
Water 17 01114 g005
Figure 8. Pearson correlation matrix between all parameters.
Water 17 01114 g008
Figure 9. Monthly behavior of phosphorus, precipitation and water level.
Water 17 01114 g009
Table 1. Behavior of water quality parameters in Lake Lanalhue.
SummerAutumnWinterSpring
L1L2L3L4L5L1L2L3L4L5L1L2L3L4L5L1L2L3L4L5
SD (m)Av3.83.23.03.23.22.52.52.42.12.72.92.92.21.42.22.52.52.42.12.7
Max6.55.04.55.04.84.04.03.6174.58.58.54.73.55.04.04.03.6174.5
Min3.00.00.00.00.00.00.00.00.00.00.00.00.00.00.00.00.00.00.00.0
DV1.41.21.11.21.11.41.41.23.91.41.81.81.30.91.21.41.41.23.91.4
CV
(%)
38363736355656481852626258635356564918552
N61515151520202120208191922192020212020
T (°C)Av2222222221161615141611111111111615151416
Max2323232323191920191913131313131919201919
Min212021212012121212129.29.29.38.49.31212121212
DV0.61.01.01.00.82.12.12.32.02.20.80.80.91.00.82.12.12.322.2
CV
(%)
2.64.44.34.33.614141514147.57.57.89.47.01414151414
N715151514202021202019191922192020212020
NTUAv2.21.74.64.61.63.73.73.4114.04.34.36.28.26.53.93.93.552.1
Max2.24.120204.67.07.07.2407.015151621144.84.85.8144.3
Min2.20.50.30.30.20.90.90.43.92.80.20.20.21.30.32.72.71.210.2
DV0.01.07.57.51.11.71.71.97.81.43.53.54.36.13.80.90.91.741.6
CV
(%)
0.06316216273474755693581807074592323499376
N8156615202021202019191922191717171717
TN (µg/L)Av0.218830265265374376366488354343343315349484216216184315255
Max0.222740227127138038045177370390390354435559245245237359318
Min0.21702032622623483481101232551991992220.0230129129145194209
DV0.0271004.24.27.87.8147193246868541691135252267237
CV
(%)
0.014341.61.62.12.140406.820191748232423142314
N91531515202021202019191922191717171717
Chl-a (µg/L)Av3.12.03.42.02.04.74.75.29.64.71.21.71.30.60.92.62.63.062.4
Max117.79.85.65.6131315179.81.42.91.71.31.47.57.58.11513
Min1.50.30.80.70.71.51.51.82.41.90.41.40.60.20.40.90.90.830.5
DV4.01.82.91.21.22.82.83.34.22.30.40.50.40.40.51.71.72.243.1
CV
(%)
129928457586161624448322932695267677359126
N1015111515202021202020191922191717171617
TP (µg/L)Av0.011517189.5121212110101013219.91918182819.1
Max0.01308485345452144462221242921200200200200200
Min0.010.00.00.00.02.82.84.46.32.42.52.55.00.02.62.52.52.58.44.8
DV0.011.52427.39.09.05.614106.46.45.89.26.94647464647
CV
(%)
0.07513713777737353671026161434469253253252162244
N1115111115202021202019191922191717171717
Table 2. Natural and Anthropic land cover in Lanalhue Lake basin.
LAND COVERCLASSE (ha) 2000 2004 2009 2013 2018 2022
NATURAL Forest37,902.2932,007.1133,469.1430,117.1233,405.4821,096.52
Grassland148.01204.59214.50154.59221.67141.22
Wetland276.24152.481088.08199.78115.99459.99
River, lake and ocean2389.782623.453796.373218.783251.732540.36
Rocky outcrop1679.79830.00267.7871.86382.131134.48
Shrubland334.78406.33905.601126.45574.801595.85
ANTHROPIC Mosaic of agriculture and pasture28,781.8029,705.0929,571.6625,965.7628,145.4122,599.71
Forest plantation36,863.0541,881.3239,017.2546,797.1642,039.1858,695.44
Infrastructure504.32492.89541.16588.44573.17619.53
Disclaimer/Publisher’s Note: The statements, opinions and data contained in all publications are solely those of the individual author(s) and contributor(s) and not of MDPI and/or the editor(s). MDPI and/or the editor(s) disclaim responsibility for any injury to people or property resulting from any ideas, methods, instructions or products referred to in the content.

