Abstract
Limited by water and heat conditions, the southwest alpine valley area has a dry climate, complex terrain, low vegetation coverage, and a very fragile ecological environment. The runoff plots of different slope gradients (10°, 15°, and 20°), slope lengths (2, 5, and 10 m) and reverse slope terrace (RST) in the Lancang River arid valley were taken as the objects. Through in situ observation of the slope runoff and sediment yield of six natural erosive rainfalls, the contribution rate of different factors was quantified, and the effect mechanism was revealed. The main results were as follows: (1) Sediment yields of different rainfalls were closely correlated with rainfall type and duration. Under the conditions of heavy rain (rain II and III), there was a critical slope gradient, and the maximum sediment yield was achieved when the slope gradient was 15°. (2) The runoff and sediment reduction benefits of horizontal terraces were 24.88% and 46.25%, and these benefits were increased by 1.47 times and 1.30 times after setting the RST, and the sediment reduction benefits increased significantly with the increase in the number of RSTs (p < 0.05). (3) In this study, rainfall intensity contributed the most to the runoff yield rate (34.5%), followed by slope length (15.1%) and horizontal terrace (7.2%). Slope length, rain intensity, and horizontal terrace order contributed 25.9%, 18.0%, and 11.4% to the sediment yield rate, respectively. (4) There was a significant linear correlation between sediment yield and runoff yield on different slopes (p < 0.05). The critical runoff yield rate decreased with the increase in slope length, the RST significantly increased the critical runoff yield rate (2.91 times), and it increased with the increase in RST numbers. This study can provide a scientific basis and reference for the prevention and control of soil and water loss and ecological restoration on the slope of the arid valley in the southwest alpine and canyon area.
1. Introduction
An arid valley is a special landscape type formed under the comprehensive action of complex terrain and climate conditions in southwest China, and it is also one of the key areas of water and soil imbalance in the upper reaches of the Changjiang River. Limited by water and heat conditions, the arid valley has a dry climate, complex terrain, low vegetation coverage, and a very fragile ecological environment [1,2,3,4]. The valley and its transition zone are also the center of gravity of society, economy, and culture in southwest China. The continuous development of society and economy has had an increasingly prominent impact on the ecological environment of the valley, especially the extensive agricultural cultivation mode in the multi-ethnic catchment area leading to increasingly serious soil and water loss in the area, making it the main source of river sediment [5,6].
According to regional differentiation, water and climate status, the vertical zone of mountain vegetation and utilization direction, the arid valley can be divided into four types: dry–hot valley, dry–warm valley, dry–mild valley and dry–cool valley [7]. Rainfall in the arid valley is concentrated and dominated by heavy rainfall, which can account for more than 40% of the annual precipitation in extreme years [8,9]. Rainfall is the main driving factor of soil erosion, and rainfall characteristics such as rainfall intensity, rainfall type, and rainfall duration will affect the accumulation of overland runoff and the process of sediment production and loss [10,11,12]. The change in the slope gradient changes the soil erosion status of the slope by affecting the infiltration flow, rainfall spatter erosion, runoff velocity, and so on. Under different rainfall intensities, the sediment yield on the slope increases first and then decreases with the increase in slope, and the critical slope is positively proportional to the rainfall intensity [13,14]. Due to the influence of factors such as the study area, test conditions, and research methods, there is no unified conclusion on the influence of slope lengths on slope erosion at present, but most studies believe that the slope erosion intensity first increased and then basically stabilized or decreased with the increase in slope length [15,16,17,18,19]. Effective measures can be taken to control the process of slope water and sediment yield, which is the key to solving soil and water loss in arid valley areas. Currently, the commonly used measures mainly include contour ridge tillage, horizontal step land preparation, terraces and hedgerows, etc. Different measures can reduce runoff by 25–70% and sediment loss by 40–80.7% [5,20,21,22]. As one of the control measures of horizontal terrace land preparation for soil and water conservation in sloping farmland, the reverse slope terrace (RST) has significant benefits in water storage, soil conservation, and sediment reduction and is suitable for arid areas with a severe uneven distribution of rainfall seasons [23].
The rainfall characteristics, the variation in micro-topography such as slope length, and anthropogenic disturbance are the key factors affecting the slope erosion process and intensity and have obvious erosion environmental effects [24,25,26]. At present, a large number of indoor simulation tests have been carried out on soil erosion rules in the dry–hot valley of the Jinsha River, while further research is needed on the driving mechanism of soil erosion under natural rainfall conditions, especially based on the in situ observation of runoff plots and the quantitative evaluation of the benefits of soil and water conservation measures in the arid valley of the Lancang River. To reveal the driving mechanism of soil erosion in the arid valley, this study analyzed the regularities of water and sediment yield on the different slopes of Lancang River valley under natural rainfall conditions, quantified the contribution of different factors to water and sediment yield, and provided a scientific basis and reference for soil erosion prevention and control and ecological restoration in the arid valley.
2. Materials and Methods
2.1. Study Area
The research area is located in Yingpan Town, Lanping County, Yunnan Province, in the Lancang River valley between the Nu Mountains and Xuepan Mountains. It is a tectonic erosion alpine canyon landform with an elevation of 1402~4168 m. It belongs to the Hengduan Mountains in the alpine canyon area of southwest China and the longitudinal valley area of northwest Yunnan, and the relative elevation difference is large. This region is a typical subtropical dry–hot valley climate: the climate is relatively hot, with low precipitation, an annual average temperature of 16.8 °C, an annual average precipitation of 640 mm, and an annual evaporation of 3–6 times of the annual precipitation. Dry and wet seasons are distinct, and evaporation in the dry season can reach more than 20 times the precipitation, and soil water loss, relative water storage capacity, and effective water supply rate are low. The soil types are mainly yellow–red soil, yellow–brown soil, alkaline soil, brown–red soil, red soil, purple soil, etc. The main vegetation types are arid valley scrub and sparse shrub grass.
2.2. Experimental Design
In this study, the in situ observation runoff plots (Table 1) were arranged on the slope of the valley area of Dashitang Village, Yingpan Town, Lanping County. Five groups of runoff plots with different gradients and slope lengths (width: 2 m, length: 2, 5, 10 m, slope gradient: 10°, 15°, 20°, Figure 1a) were built on the barren grass field, and three plots (width: 2 m, length: 10 m, slope gradient: 15°, Figure 1b) with different horizontal terraces (had no RST, had 1 RST, had 2 RST) were built on another slope with basically the same slope direction.

Table 1.
Basic situation of runoff plot observed in situ.
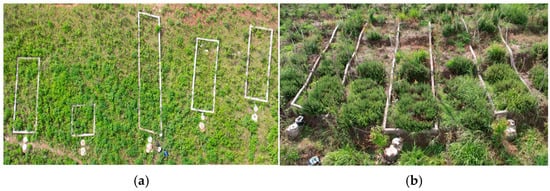
Figure 1.
Runoff plots of in situ observations. (a) Different slope gradients and slope lengths. (b) Different reverse slope terraces.
In this study, the side walls (Figure 2a) of the 8 runoff plots were built with brick along the slope, buried 20 cm underground and 20 cm above ground, and the surfaces of the side walls were smoothed with cement to prevent leakage. In order to facilitate the accumulation of runoff and sediment at the end of the slope to the middle, the baffle was used to make a 165° angle inlet on the lower side wall (Figure 2). The water outlet was set up in the middle, and the filter cover (Figure 2b) was installed at the water outlet to prevent the blockage of weeds, stones, and other debris. The diversion hose (diameter 2 cm, Figure 2c) was used to connect the water outlet of the runoff area and the diverter bucket (diameter 30 cm, height 20 cm, stainless steel cylinder, Figure 2d). The hose was plugged into the middle of the diverter bucket’s top cover, the diverter bucket was placed horizontally, and the bottom was 2 cm up. The method of 5 points was used to make 5 round holes with a diameter of 5 cm, of which 4 round holes were connected to the outer 10 cm using a diameter of 5 cm diversion hose (Figure 2e). The remaining 1 round hole was connected externally to the collector barrel (diameter 50 cm, height 60 cm, stainless steel cylinder, Figure 2f) with a hose. The collecting bucket had a cover, and the diverter hose was connected 10 cm from the middle of the collecting bucket’s top cover.
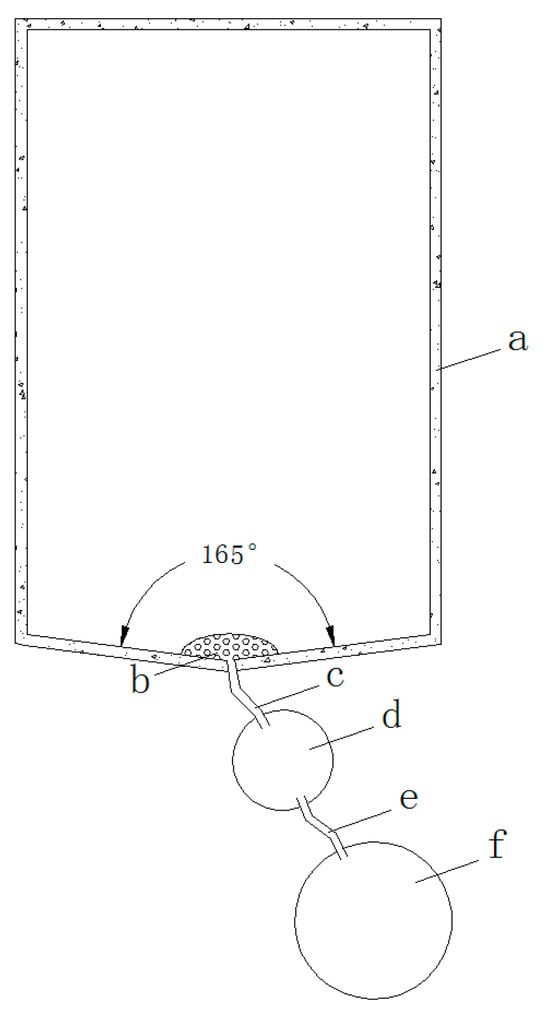
Figure 2.
Design diagram of runoff plots. Notes: (a) side wall, (b) filter cover, (c) diversion hose, (d) diverter bucket, (e) diversion hose, and (f) collector barrel.
A water drain valve was installed at the bottom of the collecting bucket to facilitate the discharge of water or cleaning after each water measurement and water sample. The construction of 8 runoff plots was completed in May 2023, and 6 effective rainfall-induced sediment depositions were observed in July–August.
2.3. Observation of Rainfall and Runoff Sediment
In this study, a tipping bucket rain gauge (S-RGA-M002) was used to observe the rainfall and rainfall duration and calculate the average rainfall intensity. After the end of the precipitation and runoff, the water in the runoff-collecting bucket was fully stirred and sampled by the manual method. The runoff volume was measured by the amount in the runoff bucket, and the amount of silt was measured by the drying–weighing method.
2.4. Data Processing and Analysis
(1) Runoff yield rate (RR, mm h−1) is the runoff yield per unit area per unit time, calculated as follows:
where Q is the total runoff produced by a single rainfall in the runoff plot, (m3); W is the width of the runoff plot, m; L is the runoff plot length, m; T is the runoff production time of a single rainfall, h.
RR = Q/(WLT) × 103
(2) Sediment yield rate (SYR, kg ha−1 h−1) is the sediment yield per unit area per unit time, which is calculated as follows:
where M is the total sediment yield of a single rainfall in the runoff plot, kg.
SYR = M/(WLT/104)
(3) Runoff coefficient (Rc) is the ratio of the runoff yield rate to rainfall intensity in the same period, which is calculated as follows:
where Ri is the rainfall intensity of the same runoff period, mm h−1.
Rc = RR/Ri
(4) The runoff reduction benefits (BRt, %) and sediment reduction benefits (BSt, %) of different forms of horizontal step are set as follows:
BRt = (RRb − RRi)/RRb × 100%
BSt = (SYRb − SYRi)/SYRb × 100%
In the formula, RRb is the runoff yield of the bare slope, and RRi is the runoff yield of the horizontal slope of different forms. SYRb is the sediment yield of the bare slope, and SYRi is the sediment yield of the horizontal step slope of different forms.
SPSS 22.0 was used for the mathematical statistical analysis of the experimental data, the difference in significance was tested by the least significant difference LSD method, the contribution rate of different factors to runoff and sediment yield on the slope was calculated by the multivariate analysis of variance, and Origin 2017 was used for mapping.
3. Results
3.1. Analysis of Natural Rainfall Characteristics
Six rainfall events were observed in the study area from July to August (Table 2). The cumulative rainfall was 393.2 mm, accounting for more than 60% of the annual average rainfall. The average rainfall duration was 15.78 h, and the average rainfall intensity was 4.15 mm/h. In the six rainfall events, the order of cumulative rainfall was as follows: rain II, III, IV, IV, I, and V. Affected by the duration of rainfall, the average rainfall intensity was as follows: rain III, II, IV, IV, V, and I. According to the classification standard of the rainfall grade of China’s meteorological department, according to the rainfall of 24 h, the rain II was heavy rainstorm (24 h rainfall of 100~250 mm), the rain III, IV, and IV rainfalls were rainstorm (24 h rainfall of 50~100 mm), and rains I and V were heavy rain (24 h rainfall of 25~50 mm), all of which were erosive rainfall [27].
Table 2.
Rainfall characteristics of different events.
By analyzing the changes in instantaneous rain intensity with the rainfall duration of different rainfall events (Figure 3), it was found that rain I lasted a long time, and there were multiple small peaks in instantaneous rain intensity during the rainfall process, with the maximum rainfall intensity reaching 48 mm/h. Rain II, III, IV, and IV all showed a sudden increase in rainfall and showed a large peak in instantaneous rainfall intensity. Among them, rain II lasted the longest (21.30 h), and after the instantaneous rainfall intensity reached the maximum at hours 9–10, a smaller peak appeared at hours 11–13, 15–16, and 18–19, respectively. And the maximum instantaneous rain intensity decreased gradually with the increase in rainfall duration. Rain III and IV lasted relatively short (9.88 h and 14.20 h), and there was a large wave peak at 7.5 h and 10 h, respectively. Rain IV lasted for 20.23 h, and a large wave peak appeared in the 18th hour after the rainfall. The duration of rain V was the shortest (11.78 h), and the rainfall intensity peaked at 15 mm/h at the beginning of the rainfall.
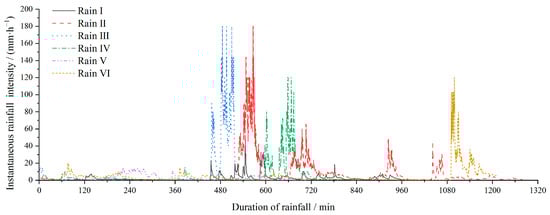
Figure 3.
Changes in instantaneous rainfall intensity with rainfall durations.
3.2. Analysis of Influencing Factors of Runoff and Sediment Yields
The runoff coefficient, runoff and sediment yield rates of eight slopes under different rainfalls are shown in Table 3. In general, they were proportional to the slope gradient and slope length. For runoff plots with the same size, the runoff and sediment yield rates decreased with the increase in the number of reverse slope terraces. Slope No. 3 (slope length was 10 m, slope gradient was 15° and had no horizontal terrace) had the highest average runoff coefficient (0.07 ± 0.02), average runoff yield rate (0.30 ± 0.17 mm h−1), and average sediment yield rate (21.14 ± 10.46 kg ha−1 h−1). Slope No. 4 (slope length was 5 m, slope gradient was 10° and had no horizontal terrace) had the smallest runoff and sediment yield rate. And the maximum runoff yield rate was 2.7 times the minimum value, and the multiple of the sediment yield rate was 5.7.
Table 3.
Statistics of sediment and runoff yields for different slopes and rainfalls.
3.2.1. Characteristics of Rainfalls
There was a significant positive correlation between runoff and sediment yield rate in different runoff plots (p < 0.05, Table 4). The runoff yield rate was significantly positively correlated with the average rainfall intensity (p < 0.01), but not significantly correlated with rainfall duration, cumulative rainfall, average rainfall intensity, and maximum instantaneous rainfall intensity (p > 0.05). The sediment yield rate was significantly positively correlated with cumulative rainfall, average rainfall intensity, and maximum instantaneous rainfall intensity (p < 0.05), with the highest correlation coefficient with average rainfall intensity (0.90), but not significantly correlated with rainfall duration (p > 0.05).
Table 4.
Correlation between runoff and sediment yield rates and rainfall characteristics.
According to Table 2, the cumulative rainfall of rain III was less than rain II, but due to the shortest duration of rainfall, the rainfall intensity was the highest. The short-term heavy rainfall of rain III resulted in a significantly higher runoff yield rate (0.30 mm/h) than rain II (0.24 mm/h), p < 0.05, Figure 4a). The average runoff yield rates of rain IV, I, and V were directly proportional to the rainfall amount, with values of 0.21, 0.15, and 0.14 mm/h, respectively. Rain IV, although its accumulated rainfall was relatively large, had a longer duration and a later peak appearance. In the early stage, there was more rainfall infiltration, mainly due to full storage and runoff, resulting in a decrease in the overall runoff yield rate to 0.11 mm/h. The cumulative rainfall of rain V was the smallest, but the peak of instantaneous rainfall intensity appeared earliest. In addition, the rainfall duration was only 11.78 h, making its runoff yield rate still higher than that of the V.
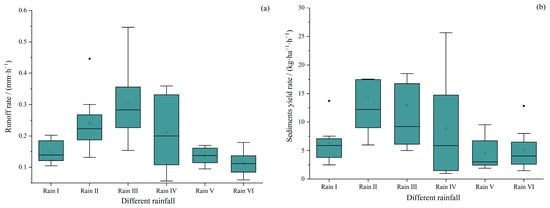
Figure 4.
Average runoff and sediment yield rates of plots under different rainfalls. (a) Runoff yield rates. (b) Sediment yield rates.
The runoff yield rate of rain II was less than rain III, but the sediment yield (14.30 kg/(ha h)) was higher than that of other rainfall events (Figure 4b), mainly due to the maximum duration and cumulative rainfall of this rainfall event, as well as the occurrence of four peaks in instantaneous rainfall intensity and multiple heavy rainfall processes, which easily led to significant soil erosion. Due to the influence of runoff yield rate, the average sediment yield on the slope surface of rain IV, I, and V was 8.86, 6.22, and 4.48 kg/(ha h), respectively. Although rain IV had the lowest runoff yield rate, the accumulated rainfall and intensity were higher, resulting in a higher sediment yield (5.08 kg/(ha h)) than rain V.
3.2.2. Slope Gradient and Slope Length
At different rainfall events with a slope of 10°, the runoff yield rate was 0.05–0.15 mm/h and the sediment yield rate was 1.00–6.25 kg/(ha h). Under heavy rain conditions (rain II and III), when the slope increased from 10° to 15°, the runoff and sediment yield rates increased by 1.50 times and 1.72 times, respectively. But when the slope increased from 15° to 20°, the runoff and sediment yield rates decreased by 7.42% and 30.39%, respectively (Figure 5). For other rainfall events with lower intensity, the runoff and sediment yield rates on the slope gradually increased with the increase in slope gradient. When the slope gradient increased from 10° to 15°, the runoff and sediment yield rates increased by 1.38 times and 1.45 times, respectively. Then, they increased by 1.82 and 2.92 times when the slope gradient increased from 15° to 20°, respectively.
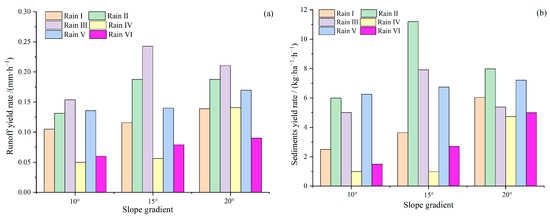
Figure 5.
Changes in runoff and sediment yield rates on slopes of different gradients. (a) Runoff yield rates. (b) Sediment yield rates.
The average runoff and sediment yields on the slope with a 2 m length were 1.41 × 10⁻² m3 and 3.40 × 10⁻² kg, respectively. When the slope length increased to 5 m, the runoff yield increased by 1.34 times and the sediment yield increased significantly by 2.06 times (Figure 6). When the slope length increased from 5 m to 10 m, the runoff yield increased by 6.1 times and the sediment yield increased by 22.91 times. The sediment yield increased more with the increase in slope length than the runoff yield.
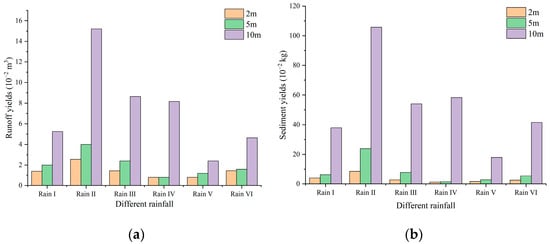
Figure 6.
Changes in runoff and sediment yields on slopes of different lengths. (a) Runoff yields. (b) Sediment yields.
The runoff and sediment yield rates were 0.23 mm/h and 5.17 kg/(ha h) of the 2 m length slope, respectively. As the slope length increased, the runoff yield rate showed a decreasing trend. The runoff yield rate of the 5 m length slope was 40–67% of the 2 m length slope (Figure 7). The sediment yield rate varied under different rainfall intensities. In rain II and III with higher intensities, the sediment yield rate of the 5 m length slope was 1.14 times higher than the 2 m length slope. In other rainfall events with lower intensities, the sediment yield rate of the 5 m length slope was 50–70% of the 2 m length slope. When the slope length was 10 m, the rate of runoff and sediment yields was 3.82 and 14.32 times higher than the 5 m length slope, which was smaller than the increase in yield of runoff and sediment.
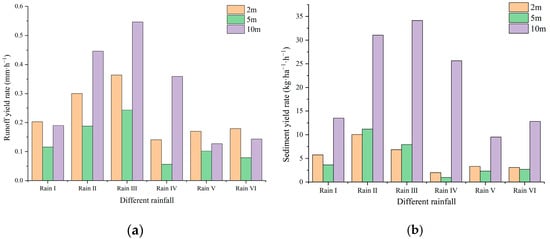
Figure 7.
Changes in runoff and sediment yield rates on slopes of different lengths. (a) Runoff yield rates. (b) Sediment yield rates.
3.2.3. Horizontal Terrace
For the same-size runoff plots, the sediment yield rates of the slopes without horizontal terrace measures were significantly higher than those with horizontal terraces under different rainfall events (p < 0.05). The average runoff yield rates of the slopes without measures were 1.30, 1.50, and 1.58 times that of the slope surfaces with horizontal terraces with no RST, 1 RST, and 2 RST, respectively. The sediment yield rate multiples were 1.86, 2.19, and 2.93, respectively (Figure 8). Especially under different rainfall conditions, the runoff and sediment yield rates of unprotected slopes were 1.40 times and 2.53 times higher than those on the slopes of different horizontal terrace slopes.
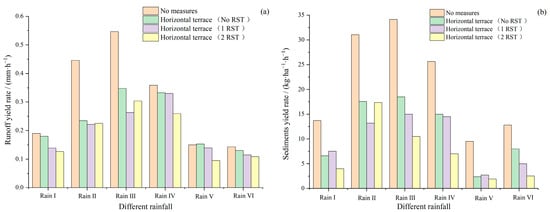
Figure 8.
Runoff and sediment yield rates of slopes with different horizontal terraces. (a) Runoff yield rates. (b) Sediment yield rates.
The average sediment reduction benefits of slopes at different horizontal terraces were significantly greater than the runoff reduction benefits (p < 0.05), with runoff reduction benefits ranging from 24.88% to 39.04% and sediment reduction benefits ranging from 46.35% to 65.87% (Figure 9). The benefits of the slope with the RST reducing runoff and sediment were significantly greater than those without RST (p < 0.05), but there was no significant difference with the different numbers of RSTs (p > 0.05). The sediment reduction benefits increased significantly with the increase in RSTs (p < 0.05). The runoff and sediment reduction benefits of 2 or 1 RSTs were 1.47 times and 1.30 times higher than those of the horizontal terrace without an RST. The effectiveness in reducing the runoff and sediment of 2 RSTs was 1.14 and 1.21 times that of the 1 RST.
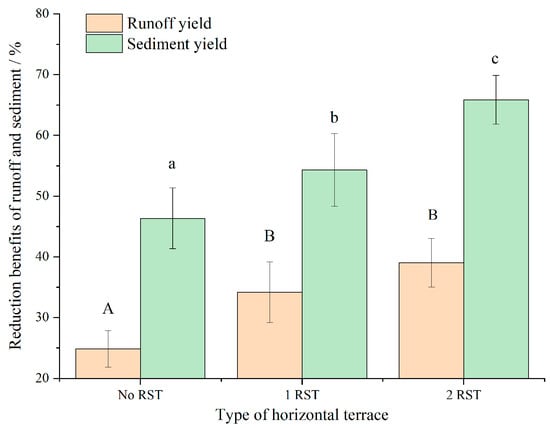
Figure 9.
Reduction benefits of runoff and sediment yields of different horizontal terraces. Note: Different capital letters indicate significant differences in runoff yields among the different numbers of RSTs at the 0.05 level, and different lowercase letters indicate significant differences in sediment yields among the different numbers of RSTs at the 0.05 level.
3.2.4. Contribution Rate of Different Factors
Through multiple factor analysis of variance (ANOVA), the impact of rainfall intensity and slope length on runoff yield rate reached a highly significant level (p < 0.01), the impact of horizontal terrace measures on runoff yield rate reached a significant level (p < 0.05), and slope had no significant effect on runoff yield rate (p > 0.05, Table 5). Rain intensity contributes the most to runoff yield rate, with a contribution rate of 34.53%, followed by slope length (with a contribution rate of 15.07%) and horizontal terrace measures (with a contribution rate of 7.16%), while slope has the smallest contribution rate, only 3.01%. Rainfall was the main driving factor for runoff yield, and the slope length determined the runoff area of the slope. The horizontal step affects the migration and infiltration process of runoff on the slope, which has a certain impact on the runoff yield rate.
Table 5.
ANOVA of significance and contribution rate of various factors affecting runoff yield rate.
In addition to slope gradient, the effects of slope length, rainfall intensity, and horizontal terrace measures on slope sediment yield reached a highly significant level (p < 0.01, Table 6). The contribution of each factor to sediment yield was different from that of runoff yield rate. Slope length had the largest contribution to slope sediment yield, at 25.93%, followed by rainfall intensity (at 18.03%) and horizontal terrace measures (at 11.36%). Slope length still had the smallest contribution, at 4.79%. The process of soil erosion on slopes mainly includes the detachment, transport, and deposition of soil particles. As the slope length increased, the transport and deposition of sediment on the slope surface changed, with significant scale effects and a significant impact on sediment yield.
Table 6.
ANOVA of significance and contribution rate of various factors affecting sediment yields.
3.3. Relationship Between Runoff and Sediment Yields
According to Table 3, the mathematical relationship between sediment yield rate and rainfall intensity and runoff yield was established for different rainfall and slope conditions (Table 7). For different rainfall intensities and slopes, the linear relationship between average sediment yield rate and rainfall intensity (R2 = 0.80) was greater than other functional relationships. The relationship between the sediment yield rate and runoff yield rate was greater than that between rainfall intensities. This was mainly due to the conversion of runoff from rainfall and was the direct driving force of sediment yield on slope. The different mathematical relationships between sediment yield rate and runoff yield rate were close, but the linear relationship was relatively good.
Table 7.
The mathematical relationship between sediment yield rate and rainfall intensity and runoff yield rate.
The linear relationships between sediment yield rate and runoff yield rate on different slopes of gradients, lengths, and measures are shown in Figure 10. When the slope was 15° and the slope length was 2 m, 5 m, and 10 m, the slopes of the fitting curve (SFC) of sediment yields and runoff yields were 27.82, 47.63, and 66.95, which increased with the increase in slope length. The intercept with the horizontal axis, that was, the critical runoff yield at the beginning of the sediment yield, was 0.04, 0.03, and 0.0091 mm/h, respectively. It decreased with increasing slope length (Figure 10a). When the slope length was 5 m and the slope gradient was 10°, 15°, and 20°, the SFCs of sediment and runoff yields were 43.95, 47.63, and 50.70, and all show an increasing trend with the increase in slope. The critical runoff yields were 0.028, 0.030, and 0.016 mm/h, respectively. The critical runoff yield rate was significantly higher than the 20° slope at the 10° and 15° slope (Figure 10b).
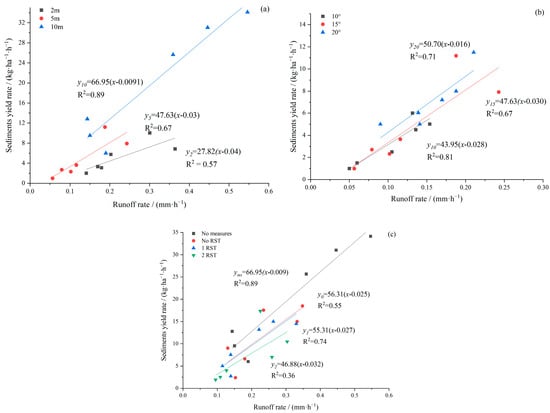
Figure 10.
Relationship between runoff and sediment yields of different slopes. (a) Different slope length. (b) Different slope gradient. (c) Different measures.
The SFCs of the sediment yield and runoff yield rates of different horizontal terrace slopes were as follows: No measures (66.95) > No RST (56.31) > 1 RST (55.31) > 2 RST (46.88) (Figure 10c). The magnitude relationship of the critical runoff yield rate was as follows: 2 RST (0.032 mm/h) > 1 RST (0.027 mm/h) > No RST (0.025 mm/h) > No measures (0.009 mm/h). Different types of horizontal terraces have significant runoff and sediment reduction benefits, and the RST increased the sediment yield of the slope face boundary by 2.91 times, which increased with the increase in the number of RSTs.
4. Discussion
Rainfall is the fundamental driving force of soil erosion, and heavy rainfall in the arid valley is the main driving factor leading to serious erosion. Yang et al. [8] found that rainfall in the Yuanmou dry–hot valley was dominated by heavy rain, which can account for more than 49.5% of annual precipitation in extreme years. Xiang et al. [14] analyzed the rainfall data of the arid valley of the Jinsha River in the past 10 years and found that the rainfall from July to August accounted for 37.9–58.4% of the annual rainfall. In this study, six erosive rainfall levels were observed in the Lancang River arid valley from July to August, and the cumulative rainfall accounted for more than 60% of the average annual rainfall in the region, which was similar to the results of previous studies. Different from the fixed duration and uniform rainfall intensity of artificial rainfall, the rainfall intensity in the natural rainfall process changed constantly with the rainfall duration, forming a wave peak with large differences in intensity and quantity, resulting in obvious differences in rainfall characteristics such as rain type, rainfall duration, and rainfall intensity, thus affecting the runoff and sediment yield process on the slope. Fu et al. [28] found that the erosive rainfall types in the arid valley of the Nujiang River mainly include three categories: 1. medium rainfall, short duration, and moderate rain intensity; 2. medium rainfall, medium duration, and light rain intensity; 3. heavy rainfall, long duration, and light rain intensity, among which the first type is the main rain type that causes soil and water loss on the slope. In this study, the third rainfall was of medium rainfall, short duration, and moderate rainfall intensity (Table 2), so the runoff and sediment yield rates were larger in different rainfall events.
The change in the sediment yield with the slope gradient was a complicated process. Under the conditions of a certain rainfall intensity, the size of the sediment yield was mainly determined by the change in rainfall intensity, raindrop spatter erosion, and the movement of sand-carrying thin-layer water flow [29]. There was a critical slope for sediment yield on the slope under rainfall, but due to the influence of rainfall characteristics, the critical slope was generally not the only value [30]. According to the simulated rainfall test, Wang et al. [13] found that the critical slope of sediment production on the slope was between 17° and 19° of moderate and light rain and gradually increased with the increase in rainfall intensity. Similarly, in situ studies have found that the sediment yield on slopes present a trend of first increasing and then decreasing with the increase in slope, but its change characteristics were different under different rainfall intensity. The critical slope was 20° under light rain and moderate rain, while the critical slope was 25° under heavy rain [14]. In this study, the critical slope of sediment yield on slope was affected by rain intensity, but due to the difference in rainfall characteristics and gradient settings, the critical slope was 15° under the condition of heavy rain intensity (rain II and III) (Figure 5), that was, the sediment yield on the slope was the largest, and the sediment yield on the downhill slope with light rain intensity showed a gradual increasing trend, but no slope critical value was found.
With the increase in slope length, the slope area and rainfall increased, and the total runoff yield increased with the increase in slope length. In this study, when the slope length increased from 2 m to 5 m, the runoff yields gradually increased, but the runoff yield rate per unit time and area decreased. This was mainly due to the fact that under natural rainfall conditions, the rainfall duration was longer, the rain intensity changed in a waveform, and the number and intensity of wave peaks were limited. With the increase in the rainfall duration, the soil infiltration increased, and the scale effect of runoff yield weakened, and the runoff yield of per unit time decreased [12]. With the increase in slope length and the increase in water quantity under the slope, the erosion intensified, but the increase in runoff sediment content resulted in the water body energy being mainly consumed by sediment load and erosion weakening. Under different conditions, the two increased and decreased together, resulting in the effect of erosion and sand slope length [31]. In this study, under the condition of heavy rain, the sediment yield increased with the increase in slope length; under the condition of light rain, when the slope length was less than 5 m, the sediment yield decreased with the increase in slope length. Similarly to this study, Yair et al. [16] found that the difficulty of runoff pooling on different slope lengths was different, and the soil erosion intensity in arid areas decreased with the increase in slope length. The slope length effect of sediment production on slope surface was stronger under light rain intensity, while it was weakened under heavy rain intensity [32].
By reducing the slope gradient, enhancing infiltration, and reducing erosion energy, horizontal gradation achieved runoff reduction, thus reducing soil erosion [33]. He et al. [22] found that soil erosion could be significantly reduced by horizontal gradation and sealing measures in irrigated grassland through collecting, sorting, and standardized analysis of runoff plot data, among which soil erosion could be reduced by more than 80%. In this study, the horizontal order runoff reduction benefits of different forms were between 24.88–39.04% and 46.35–65.87%, and the runoff reduction and sediment reduction benefits of different forms were relatively small. Different vertical cover structures of vegetation have good runoff reduction and sediment reduction (45.9–94.6%) and increased infiltration benefits (4.7–10.8%) [34,35]. In this study, the benefit of sediment reduction was significantly greater than that of runoff reduction, indicating that the ability of horizontal order to control soil loss was greater than the ability to reduce runoff yield. Using the runoff plot observation method, Tian et al. [36] found that the total amount of runoff produced on the horizontal slope of the dry and hot valley of the Jinsha River decreased by 48.8%, and the sediment yield decreased by 61.7% compared with the natural slope without any treatment, which was similar to the results of this study. Setting the RST on a horizontal terrace can not only further change hydrological connectivity and reduce runoff velocity but also form reverse slope reservoir capacity at the step surface to enable rainfall accumulation. Meanwhile, by opening the RST, the contact area between runoff and soil mass was increased, and the infiltration amount was increased [37]. In this study, by setting the RST, the benefit of sediment reduction was increased by 1.47 times and 1.30 times. With the increase in the number of RSTs, the benefit of sediment reduction was increased, and the critical yield of sediment production at the beginning of the slope surface also increased.
5. Conclusions
Through the in situ observation of sediment yield on the slope of Lancang River arid valley under natural rainfall conditions, this study analyzed the regularity of runoff and sediment yield rates in runoff plots with different slope gradients, slope lengths, and horizontal terraces and quantified the contribution of different factors. The main conclusions are as follows:
- (1)
- Sediment yield on the slope increased with the increase in rain intensity, slope gradient, and slope length, and there was a critical value of the influence of slope length on sediment yield under different rainfall conditions. The runoff reduction benefit of the horizontal slope ranged from 24.88% to 39.04%, and the sediment reduction benefit ranged from 46.35% to 65.87%. Especially, the runoff and sediment reduction benefits increased significantly after the setting of the RST and increased with the increase in the number of RSTs.
- (2)
- Rainfall was the main driving factor of runoff production on the slope, and the contribution rate of rainfall intensity was the largest (34.5%), followed by slope length (15.1%), horizontal terrace (7.2%), and slope gradient (3.0%), which affected the process of runoff yield on the slope to different degrees. The slope length contributed the most to sediment yield (25.9%), followed by rainfall intensity, horizontal terrace, and slope gradient, which contributed 18.0%, 11.4%, and 4.8%, respectively.
- (3)
- There was a significant linear correlation between sediment yield and runoff yield in different slope gradients, slope lengths, and horizontal terrace runoff plots. Under different rainfall conditions, the larger the slope length, the smaller the critical runoff yield rate, and the more easily erosion occurs. The layout of the horizontal terrace, especially the RST, can effectively improve the runoff yield at the slope face boundary and reduce the erosion risk.
Author Contributions
Conceptualization, B.S., J.L. (Jigen Liu) and J.M.; methodology, B.S. and J.L. (Jigen Liu); software, H.L., J.L. (Jianming Li) and C.L.; validation, B.S., J.M., H.L. and J.L. (Jigen Liu); formal analysis, B.S. and B.M.; investigation, B.S., J.M., B.M., B.L. and Y.L.; resources, B.S., J.M. and J.L. (Jigen Liu); data curation, B.S., B.M., J.L. (Jianming Li) and C.L.; writing—original draft preparation, B.S.; writing—review and editing, B.S., J.L. (Jigen Liu), J.M., B.M. and J.L. (Jianming Li); project administration, B.S. and J.L. (Jigen Liu); funding acquisition, B.S. All authors have read and agreed to the published version of the manuscript.
Funding
This research was funded by the National Key Research and Development Program of China (No. 2022YFF1302901 and No. 2022YFF1302905), National Natural Science Foundation of China (No. 42107352), Natural Science Foundation of Wuhan (No. 2023020201020365), the Central Public-interest Scientific Institution Basal Research Fund of China (No. CKSF2024324, No. CKSF2024304/TB).
Data Availability Statement
Data is contained within the article.
Acknowledgments
All authors thank editors and reviewers for insightful comments on the original manuscript.
Conflicts of Interest
The authors declare no conflicts of interest.
References
- Zhang, R.Z. Arid Valley in Hengduan Mountain Area; Science Press: Beijing, China, 1992; pp. 6–20. [Google Scholar]
- Cui, P.; Wang, D.J.; Wei, F.Q. Model and effect of ecological restoration of dry-hot valley: A case study of the CAS Dongchuan Debris Flow Observation Station. Sci. Soil Water Conserv. 2005, 3, 60–64. [Google Scholar]
- Bao, W.K.; Pang, X.Y.; Li, F.L.; Zhou, Z.Q. Scientific Basis for Ecological Restoration and Sustainable Management of Arid River Valleys; Science Press: Beijing, China, 2012; pp. 2–3. [Google Scholar]
- Fan, J.R.; Yang, C.; Bao, W.K.; Liu, J.L.; Li, X. Distribution scope and district statistical analysis of dry valleys in southwest China. Mt. Res. 2020, 38, 303–313. [Google Scholar]
- Rong, L.; Duan, X.W.; Zhang, G.L.; Gu, Z.J.; Feng, D.T. Impacts of tillage practices on ephemeral gully erosion in a dry-hot valley region in southwestern China. Soil Tillage Res. 2019, 187, 72–84. [Google Scholar] [CrossRef]
- Ma, S.W.; Hu, H.; Bao, W.K.; Wang, Z.L.; Yang, Y.; Hu, B.; Huang, L.; Li, F.L. Ecological benefit of native vegetation under different planting treatment of soil rock mixed slope in Minjiang arid valley. Acta Ecol. Sin. 2018, 44, 1647–1661. [Google Scholar]
- Liu, L.H. Vegetation types in Hengduan Mountain arid valley. Mt. Res. 1989, 7, 176–182. [Google Scholar]
- Yang, D.; Xiong, D.H.; Zhai, J.; Li, J.J.; Su, Z.A.; Dong, Y.F. Morphological characteristics and causes of gully in Yuanmou dry-hot valley. Sci. Soil Water Conserv. 2012, 10, 38–45. [Google Scholar]
- Wu, L.P.; Luo, M.L.; Liu, S.J.; Yang, D. Research progress and prospects on gully erosion in the arid valleys of Southwest China. J. China West Norm. Univ. (Nat. Sci.) 2024, 1–9. Available online: http://kns.cnki.net/kcms/detail/51.1699.N.20240603.1013.002.html (accessed on 4 March 2025).
- Fang, H.Y.; Cai, Q.G.; Li, Q.Y. Study on slope runoff production capacity and its influencing factors in loess hilly and gully region. Geogr. Res. 2009, 28, 583–591. [Google Scholar]
- Yan, Y.J.; Dai, Q.H.; Fu, W.B.; Peng, X.D.; Jin, L. Experimental study on the process of sediment production in karst bare slope. Acta Ecol. Sin. 2017, 37, 2067–2079. [Google Scholar]
- Wu, S.; Chen, L.; Wang, N.; Xu, S.; Ferro, V. Variable power-law scaling of hillslope Hortonian rainfall runoff processes. Hydrol. Process. 2019, 33, 2926–2938. [Google Scholar] [CrossRef]
- Wang, Y.K.; Wang, Y.Q.; Fu, B.; Wang, X.T.; Wang, D.J. Experimental study of rainfall erosion on purple soil slope. Mt. Sci. 2006, 24, 597–600. [Google Scholar]
- Xiang, Y.G.; Zhang, D.; Chen, F.; Xu, L.; He, H.Y.; Gao, J.N. Effect of rainfall and slope on runoff and sediment production of tobacco slope farmland. Southwest China J. Agric. Sci. 2021, 34, 1121–1127. [Google Scholar]
- Cai, Q.G. The role of slope length in slope erosion and sediment production. J. Sediment Res. 1989, 8, 84–91. [Google Scholar]
- Yair, A.; Yassif, N. Hydrological processes in a small arid catchment: Scale effects of rainfall and slope length. Geomorphology 2004, 61, 155–169. [Google Scholar] [CrossRef]
- Parsons, A.J.; Brazier, R.E.; Wainwright, J.; Powell, D.M. Scale relationships in hillslope runoff and erosion. Earth Surf. Process. Landf. 2010, 33, 1637–1638. [Google Scholar] [CrossRef]
- Koomson, E.; Muoni, T.; Marohn, C.; Nziguheba, G.; Cadisch, G. Critical slope length for soil loss mitigation in maize-bean cropping systems in SW Kenya. Geoderma Reg. 2020, 22, e00311. [Google Scholar] [CrossRef]
- Pan, Y.W.; Ma, W.L.; Pan, Q.B.; Han, J.Q.; Zhang, S.N. Research progress on spatial scale effects and influencing factors of erosion and sediment transport in river basins. Res. Soil Water Conserv. 2022, 29, 88–97+105. [Google Scholar]
- Gao, G.Y.; Fu, B.J.; Lv, Y.H.; Liu, Y.; Wang, S.; Zhou, J. Research progress on effects of soil and water loss on slope cover pattern in arid and semi-arid region. Acta Ecol. Sin. 2013, 33, 12–22. [Google Scholar]
- Gan, F.L.; Shi, H.L.; Gou, J.F.; Zhang, L.X.; Dai, Q.H.; Yan, Y.J. Responses of soil aggregate stability and soil erosion resistance to different bedrock strata dip and land use types in the karst trough valley of Southwest China. Int. Soil Water Conserv. Res. 2024, 12, 684–696. [Google Scholar] [CrossRef]
- He, J.M.; Zhong, R.H.; Guo, Q.K.; Duan, X.W.; Shan, Z.J. Meta-analysis of soil erosion in a hot dry valley based on runoff plots. J. Soil Water Conserv. 2023, 37, 291–297+304. [Google Scholar]
- Wang, S.B.; Wang, K.Q.; Song, Y.L.; Chen, X.; Wang, Z. Effects of reverse-slope terrace on nitrogen and phosphorus loss in sloping farmland of red loam under different rainfall patterns. Trans. Chin. Soc. Agric. Eng. 2018, 34, 160–169. [Google Scholar]
- Zhou, Y.; Shao, G.; Jiang, Y. Impact of Diverse Rainfall Patterns and Their Interaction on Soil and Water Loss in a Small Watershed within a Typical Low Hilly Region. Water 2024, 16, 372. [Google Scholar] [CrossRef]
- Ding, W.; Wang, X.; Zhang, G.; Meng, X.; Ye, Z. Impacts of Grass Coverage and Arrangement Patterns on Runoff and Sediment Yield in Slope-Gully System of the Loess Plateau, China. Water 2023, 15, 133. [Google Scholar] [CrossRef]
- Zhao, L.; Fang, Q.; Hou, R.; Wu, F. Effect of rainfall intensity and duration on soil erosion on slopes with different microrelief patterns. Geoderma 2021, 396, 115085. [Google Scholar] [CrossRef]
- Wang, W.Z. Study on the relationship between rainfall characteristics and soil loss in loess Region III—Criteria for erosive rainfall. Bull. Soil Water Conserv. 1984, 2, 58–63. [Google Scholar]
- Fu, B.; Liang, Q.Z.; Ma, J.G.; Pan, Y. Study on characteristics of erosive rainfall and sediment yield in Puxiang River Basin, western Yunnan. J. Southwest For. Univ. (Nat. Sci.) 2024, 44, 121–129. [Google Scholar]
- Moreno, M.; Nicolau, M.; Merino, L.; Merino, L.; Wilcox, B.P. Plot scale effects on runoff and erosion along a slope degradation gradient. Water Resour. Res. 2010, 46, W04503. [Google Scholar]
- He, J.J.; Cai, Q.G.; Liu, S.B. Influence of slope on sediment yield on slope under rainfall conditions. J. Appl. Ecol. 2012, 23, 1263–1268. [Google Scholar]
- Ran, H.; Deng, Q.C.; Zhang, B.; Liu, H.; Wang, L.; Luo, M.L.; Qin, F.C. Morphology and influencing factors of rills in the steep slope in Yuanmou Dry-Hot Valley (SW China). Catena 2018, 165, 54–62. [Google Scholar] [CrossRef]
- Wang, X.Y.; Liu, H.P.; Liu, B.Y. Study on the influence of slope length on runoff under variable rainfall intensity artificial rainfall. J. Soil Water Conserv. 2010, 24, 1–5. [Google Scholar]
- Xu, Y.; Yang, X.; Xu, G.; Fu, J.; Cai, S.; Mu, X.; Zhou, T.; Zhang, W.; Chen, J.; Li, L.; et al. Assessment of Integrated Soil and Water Conservation Practices on Soil Erosion Risk in a Typical Red-Beds Watershed in South China. Water 2023, 15, 2613. [Google Scholar] [CrossRef]
- Shao, Y.M.; Gao, G.Y.; Liu, J.B.; Fu, B.J. Effect of vertical cover structure of grass and shrub on reducing runoff and soil loss under natural rainfall in loess hilly region. Acta Ecol. Sin. 2022, 42, 322–331. [Google Scholar]
- He, Z.Y.; Su, Z.A.; Xiong, D.H.; Wang, Y.; Yang, S.K. Effects of agave americana on soil and water conservation of slope in Dry-Hot Valley of Jinsha river. Mt. Sci. 2018, 36, 731–739. [Google Scholar]
- Tian, B.; Chen, Q.B.; Wang, K.Q. Study on the regularity of sediment production and abortion on slopes with different treatments in dry-hot valley of Jinsha River. J. Southwest For. Coll. 2006, 26, 44–48. [Google Scholar]
- Jiang, Y.; Cheng, H.Y. Benefit Analysis of Soil and Water Conservation Engineering Measures on Thin Soil Layer Slope Farmland in Earthy-Rocky Mountain Areas of Northern China: Case Study on the Rock Ridge Reverse Slope Step Measure. J. Chang. River Sci. Res. Inst. 2024, 41, 55–62. [Google Scholar]
Disclaimer/Publisher’s Note: The statements, opinions and data contained in all publications are solely those of the individual author(s) and contributor(s) and not of MDPI and/or the editor(s). MDPI and/or the editor(s) disclaim responsibility for any injury to people or property resulting from any ideas, methods, instructions or products referred to in the content. |
© 2025 by the authors. Licensee MDPI, Basel, Switzerland. This article is an open access article distributed under the terms and conditions of the Creative Commons Attribution (CC BY) license (https://creativecommons.org/licenses/by/4.0/).