Article

A Sediment Process Simulation on the Steep Area of the Upper Yangtze River Basin Using a Hybrid Distributed Soil Erosion Model

1
Hubei Key Laboratory of Intelligent Yangtze and Hydroelectric Science, China Yangtze Power Co., Ltd., Yichang 443000, China
2
Bureau of Hydrology, Changjiang Water Resources Commission, Wuhan 430010, China
*
Authors to whom correspondence should be addressed.
Water 2025, 17(7), 996; https://doi.org/10.3390/w17070996
Submission received: 27 February 2025 / Revised: 26 March 2025 / Accepted: 26 March 2025 / Published: 28 March 2025

Abstract

:
Accurate simulation and forecast for soil processes has always been a challenge for river management and environmental conservation. However, the sediment modeling technique remains insufficient for catchments characterized by special soil erosion conditions, especially for the steep area of the upper Yangtze River basin. This study presents a framework that incorporates soil erosion and transport calculation modules into a distributed hydrological model, and customized modifications are applied to fit the catchment conditions. In addition, to accurately describe the topography (e.g., slope length and steepness) and to account for its impact on soil process simulation, the sub-basin with high sediment yield is discretized with a higher spatial resolution. The presented is validated in Heishuihe River basin in southwestern China. And the results show that the modified version of the DDRM model (i.e., DDRM-SED) model show a good simulation performance in terms of flow and sediment processes. In addition, the DDRM-SED model with multi-spatial resolution show a better simulation performance than the model with constant spatial resolution.

1. Introduction

The numerical simulation of water–sediment dynamics plays a critical role in river management and environmental conservation [1,2,3]. The world’s large rivers, such as the Yangtze, Amazon, and Mississippi, face challenges in water–sediment simulation due to variations in climate, geology, and human activities [4,5,6,7,8]. It is essential to develop accurate models for hydrodynamic sediment to mitigate the risks of natural disasters and optimize water resource utilization. The upper reaches of the Yangtze River in China have become research focuses due to their unique geographical conditions and the region’s economic development demands [9,10,11,12]. The upper reaches of the Yangtze River are characterized by steep channels, variable hydrological conditions, and localized areas subject to heavy rainfall, changes in vegetation, and water conservancy facilities (especially the Three Gorges Dam), which complicate sediment transport dynamics [13,14,15,16]. The dam’s sediment retention effect and its interaction with flood peak flow create dynamic relationships that significantly impact sediment deposition downstream [17]. Therefore, enhancing the accuracy and applicability of water–sediment transport models is crucial for supporting river basin management, disaster prevention, and sustainable development. Such advancements provide essential scientific guidance for dealing with the complexities of sediment dynamics in the upper Yangtze River and other similar areas [18,19].
In the field of sediment yield simulation, models are primarily categorized into empirical statistical models and physically based models. Early empirical models, such as the Universal Soil Loss Equation (USLE) developed in the United States, estimate soil erosion based on factors like rainfall, slope, and soil erodibility [20,21,22]. These models usually perform well for long-term soil loss estimation, but they lack the capacity to describe the temporal and spatial dynamics of water–sediment processes, limiting their application in complex and dynamic environments. With rapid advancements in computing technology, physically based models have gradually become a research focus because they can simulate the spatial and temporal variability of sediment yield processes and are more advantageous for regional transfer and cross-regional applications. In recent years, significant progress has been made internationally in the development of physically based models, particularly in the application of distributed models for basin-scale sediment transport simulations. For example, MIKE SHE and SWAT allow for a more detailed representation of the spatial heterogeneity of erosion and sediment yield processes by incorporating Geographic Information Systems (GIS) and Remote Sensing (RS) technologies. In order to be well suited for large-scale basin simulations, these models split the study region into several basic cells. This allows for more accurate simulation of water–sediment dynamics under varying terrain, climate, and land use conditions, which enhances the models’ accuracy and applicability.
In the field of sediment transport simulation, mathematical models can be categorized into one-dimensional (1D), two-dimensional (2D), and three-dimensional (3D) models based on the spatial resolution of water–sediment dynamics [23]. One-dimensional sediment transport models are widely used for long-term, large-scale simulations of river systems due to their computational efficiency. These models are particularly effective for predicting sediment transport and deposition over extended periods in large river basins. For instance, the HEC-RAS model [24], which was developed in the United States, has been extensively applied globally for water–sediment transport simulations [25] in large rivers. It is suitable for long-term historical analysis and future scenario prediction. Similarly, the ISIS model from the United Kingdom is frequently used for flood management and sediment deposition prediction [19,26]. Nevertheless, the 1D models simplify the vertical and lateral variations, which results in reduced accuracy in complex areas, such as river confluences and regions with significant riverbed structure changes. In contrast, 2D and 3D models excel in simulating smaller-scale river sections, where a detailed analysis of river bed deformation and sediment dynamics is required. These models are particularly useful for studying complex river structures, bends, or river mouths. For example, MIKE 21 and MIKE 3 models [27], which were developed in Denmark, combine 2D and 3D simulations to provide a precise analysis of localized water–sediment dynamics, which have been widely applied in port engineering and localized river management. Despite their ability to provide finer-scale simulations of water and sediment dynamics, 2D and 3D models require significant computational resources. Current computational limitations show challenges in large-scale, long-distance flood, sediment transport simulations, and real-time forecasting. Fortunately, recent advancements in big data and artificial intelligence technologies have given rise to new sediment transport models that incorporate machine learning techniques to optimize parameter calibration and improve predictive accuracy for complex sediment transport systems.
For the upper Yangtze River, large-scale geographical variation in underlying surface conditions and hydropower engineering bring multiple uncertainties into water–sediment models on a large spatial scale. Most distributed models are constructed based on the mechanisms of sediment yield and transport under natural conditions, without considering the influence of reservoirs on sediment processes [10,12,28]. As a result, their applicability is limited in the upper Yangtze River basin, which includes large multifunctional reservoirs. Furthermore, many internationally recognized sediment yield models are primarily based on the Universal Soil Loss Equation (USLE), which is suitable for environments characterized by gentle slopes and soil erosion [5,29,30]. However, the upper Yangtze River basin is predominantly mountainous, where slope gradients have a significant impact on soil erosion. It will reduce the accuracy of sediment simulation by directly applying the sediment yield module of the generalized distributed model to the upper Yangtze River. Therefore, it remains challenges in the research on distributed models for water–sediment yield and transport simulation to improve model accuracy.
To address the urgent need for research on the asynchronous propagation mechanisms of flood and sediment peaks as well as the water–sediment simulation in the upper reaches of the Yangtze River, this study presents a framework by incorporating soil erosion and transport calculation modules into a distributed hydrological model, and customized modification are applied to fit the catchment conditions. In addition, to accurately describe the topography (e.g., slope length and gradient) and to account for its impact on soil process simulation, the sub-basin with high sediment yield are discretized with a higher spatial resolution. This study aims to improve simulation performance for sediment processes for the upper Yangtze River basin and provide new insights for modeling for flow–sediment processes.

2. Study Area and Dataset
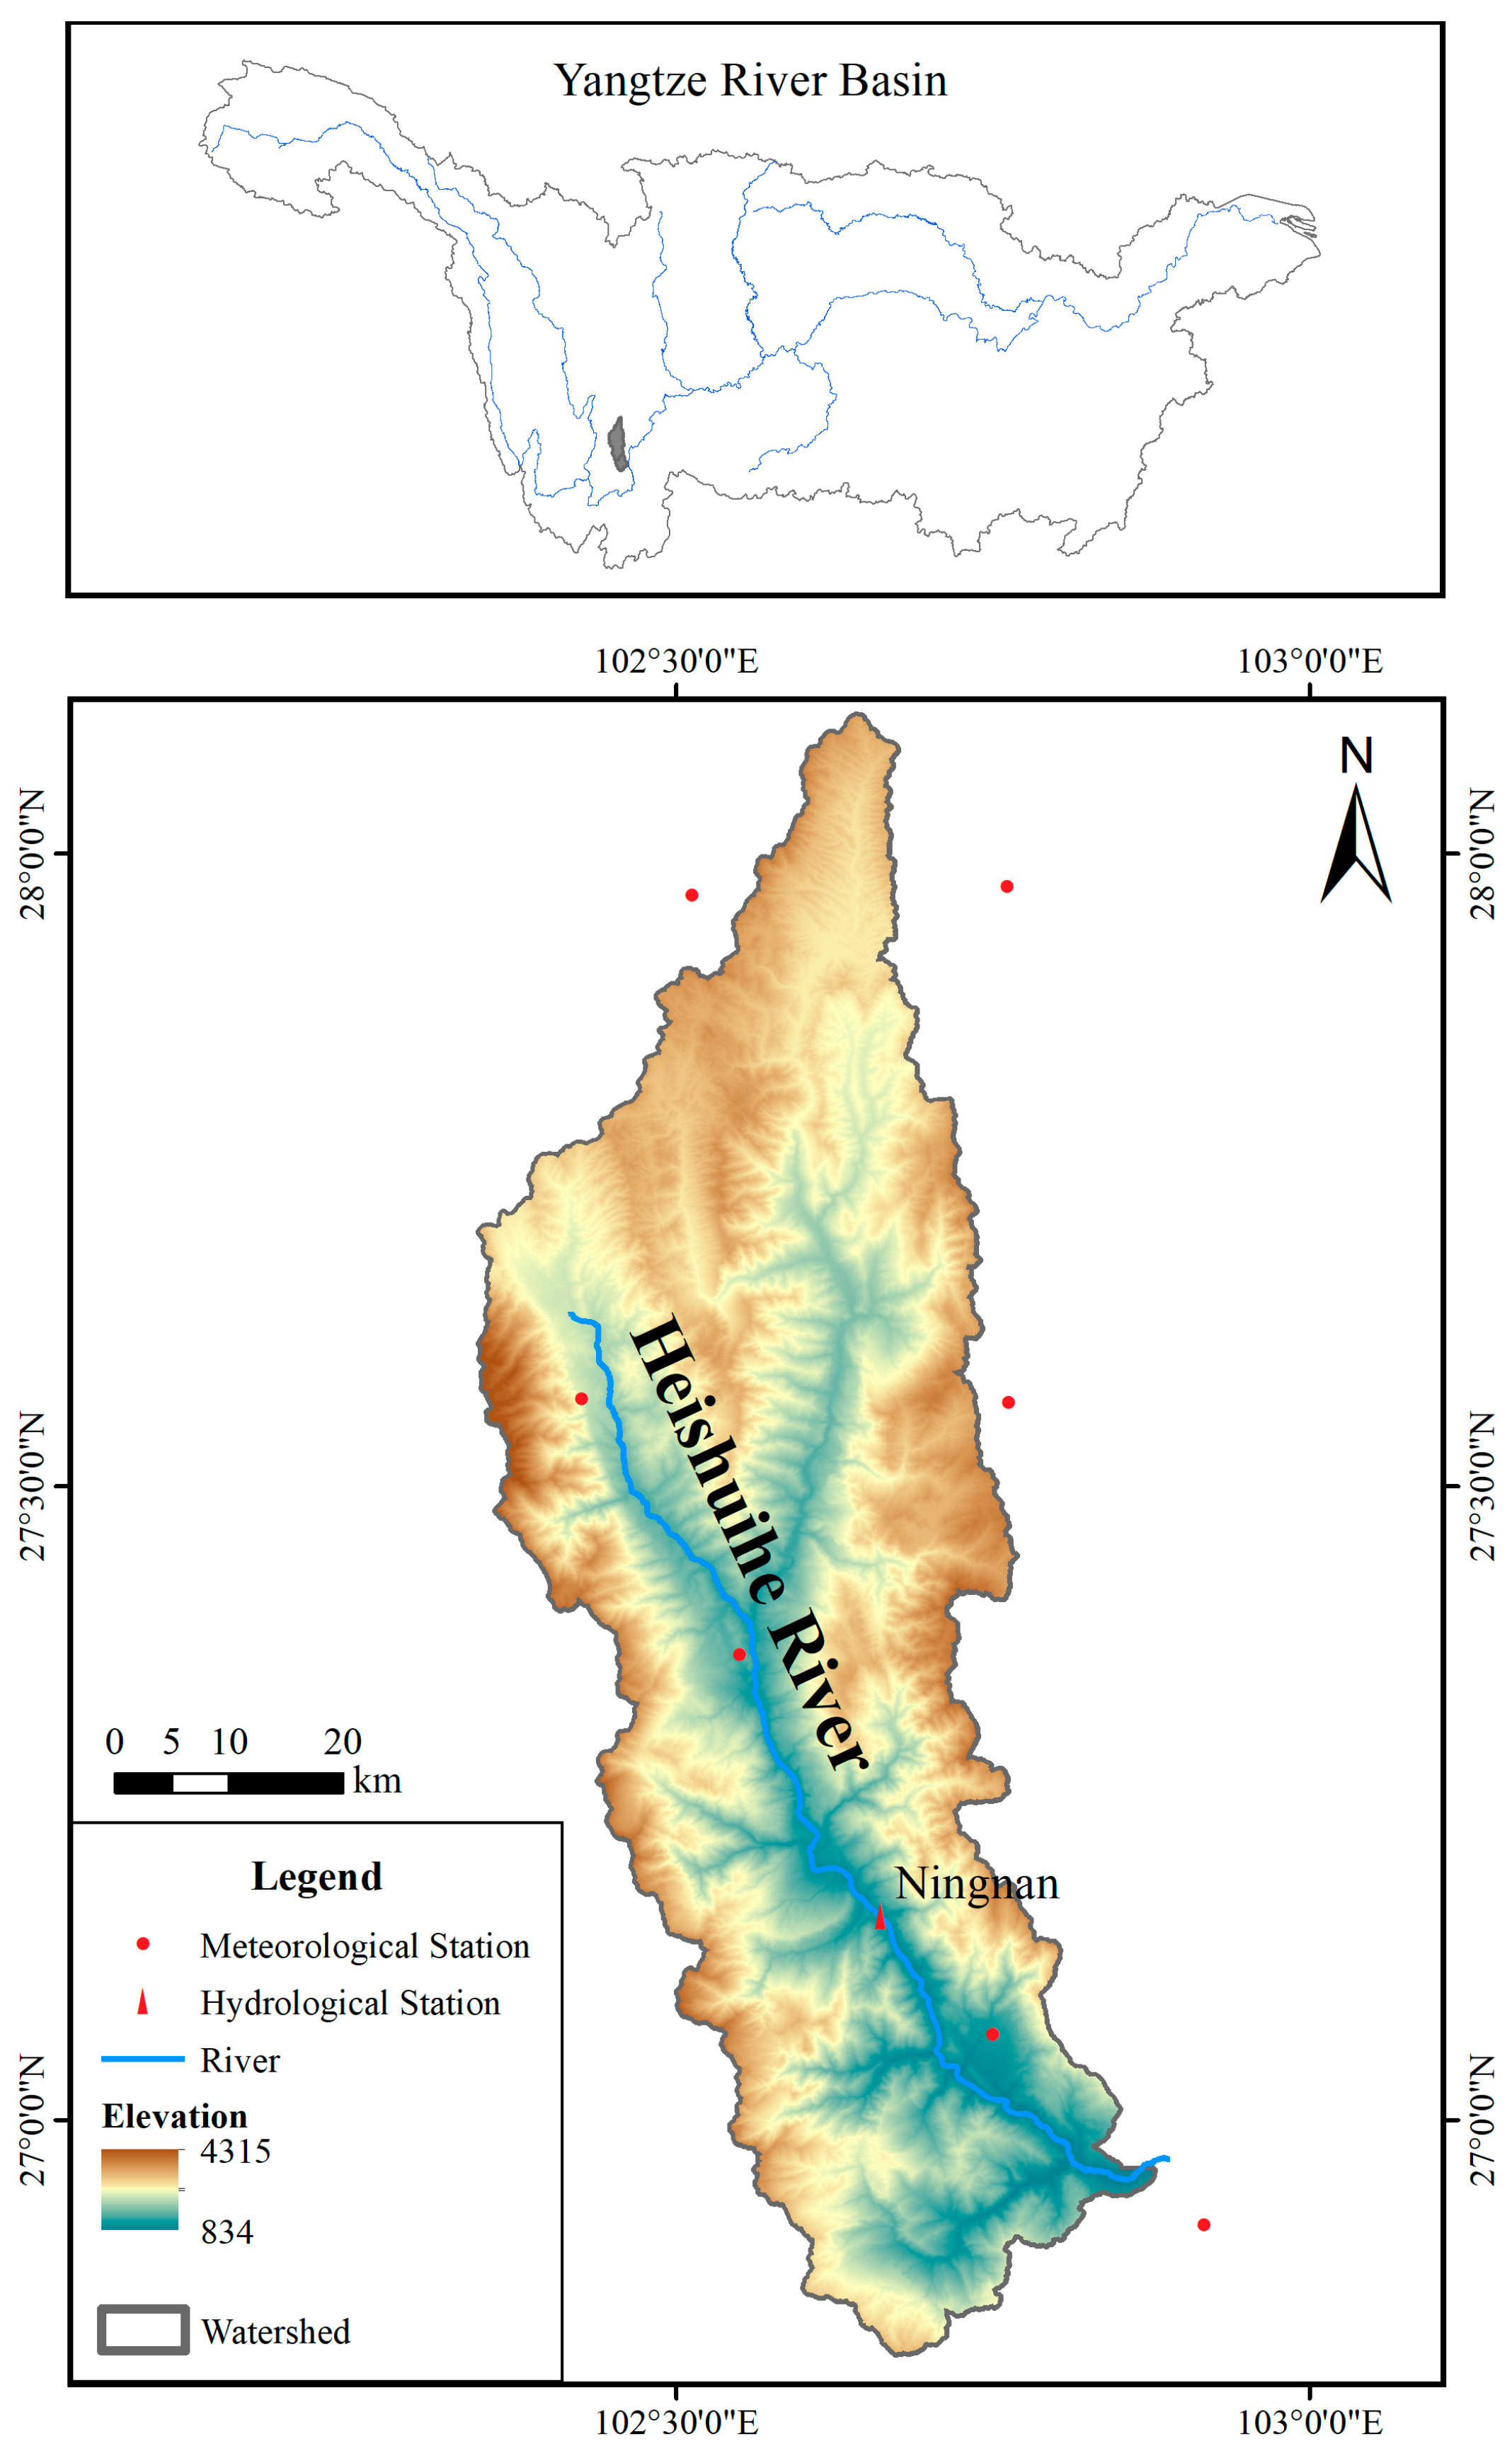
2.1. Study Area

This study was carried out in the Heishuihe River basin (above Ningnan station) in the lower reaches of Jinsha River (Figure 1). The Heishuihe River has a total length of 174 km and a basin area of 3596 km². The terrain is high in the north and low in the south, the mountains are longitudinal, the valleys are deep, the ridges are parallel to the rivers, and the water system is distributed in the shape of a feather. There are 10 tributaries with a basin area larger than 100 km², with the Yicai River being the largest. The Heishuihe River basin belongs to subtropical monsoon climate zone, with a multi-year average temperature of 13~19 °C, the highest temperature of 37.5 °C, the lowest temperature of −3.1 °C, and an annual precipitation of 800~1400 mm. The annual average flow of Ningnan Hydrology Station is 65.3 m3/s. The sediment content of the river is relatively large. According to data from 1956 to 2000, the annual average sediment transport is about 5.43 million tons, mainly concentrated in the period from May to October.

2.2. Dataset

Based on DEM data with spatial resolution of 30 m and 300 m, the digital basin information of Heishuihe River was extracted, including slope length, slope gradient, slope direction, catchment area, river network system, and topography index.
The data details are listed in Table 1. In addition to the runoff and sediment data from Ningnan hydrological station, the precipitation and temperature data from seven meteorological stations were also used. The long-term daily average precipitation, temperature, runoff, and suspended sediment transport data of the Heishui River basin were collected as the driving data of the model, respectively, and the land use types, NDVI, soil texture, soil organic carbon content, and other underlying surface data of the Heishui River basin were collected as the boundary conditions of the model. The flood season from 2011 to 2017 was selected as the parameter calibration period of the model, and the flood season from 2019 to 2020 was selected as the validation period (with the data of 2018 being missing). Limited by the available data, the simulation time step of the model was set to 1 day. The Resample Tool in Arc Toolbox 10.8 was used to process data of different spatial resolutions, thereby unifying cell data of different resolutions into data of a common resolution. Herein, the 1 km resolution was downscaled to 30 m or 300 m resolution. Each of the downscaled cell data remained consistent with the data of 1 km resolution.

3. Methodology

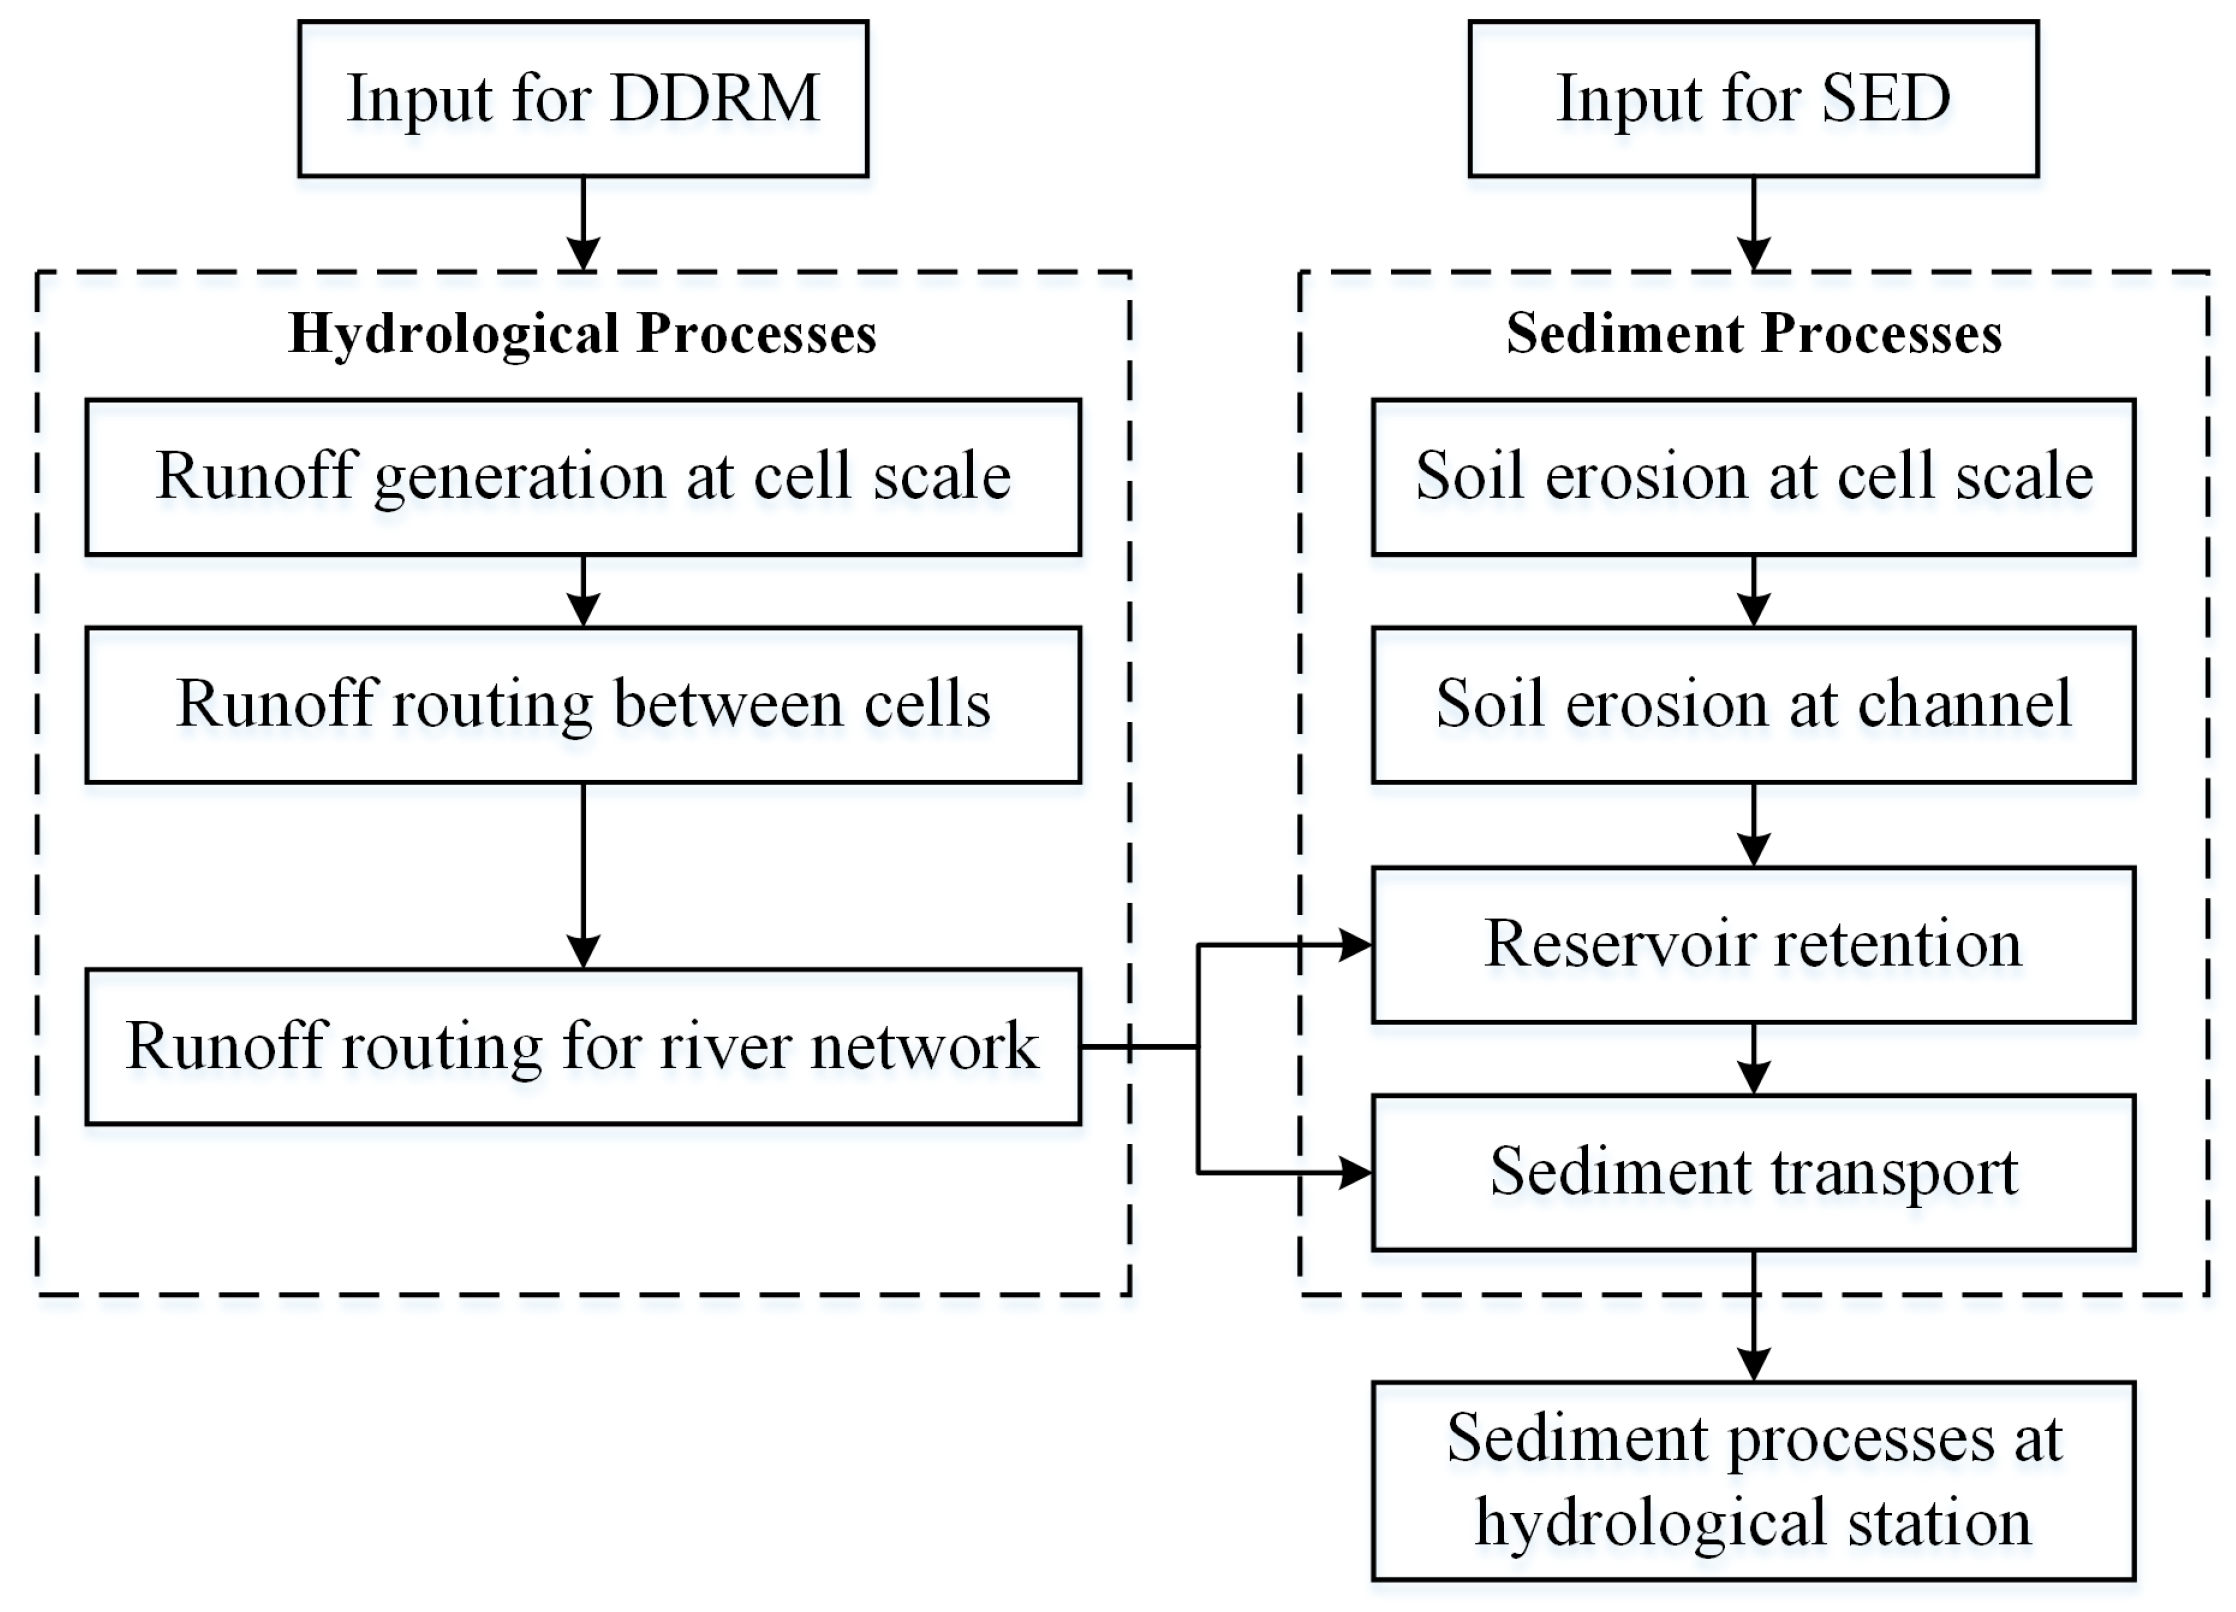
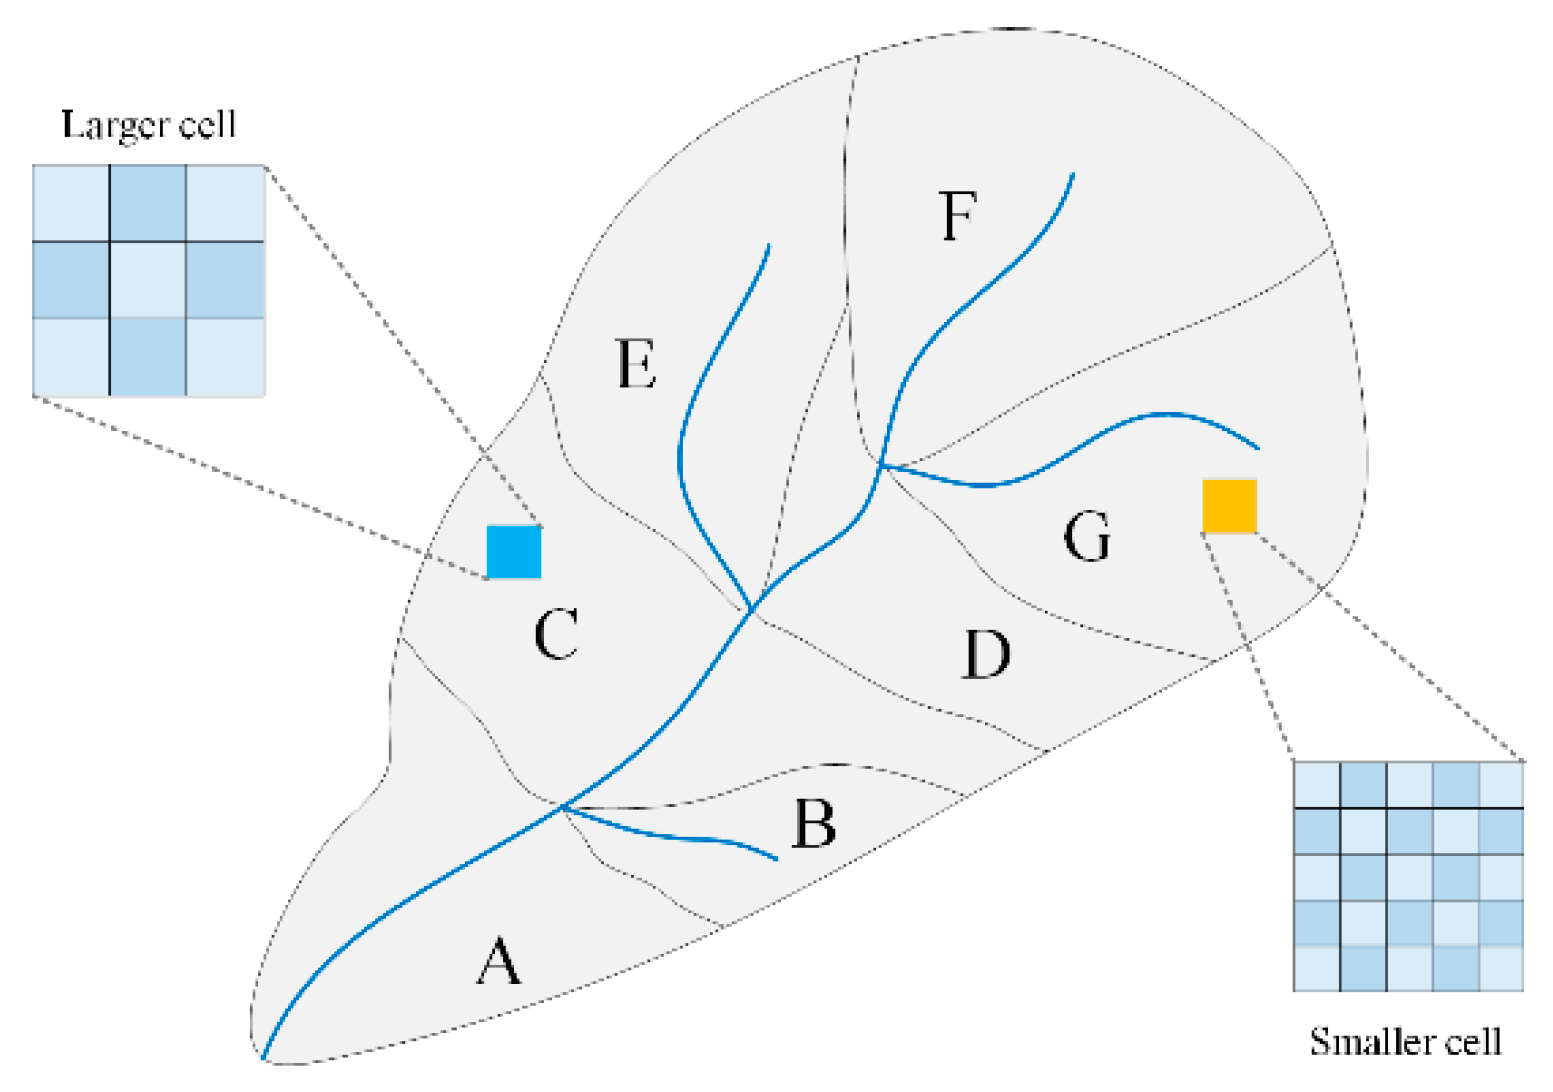
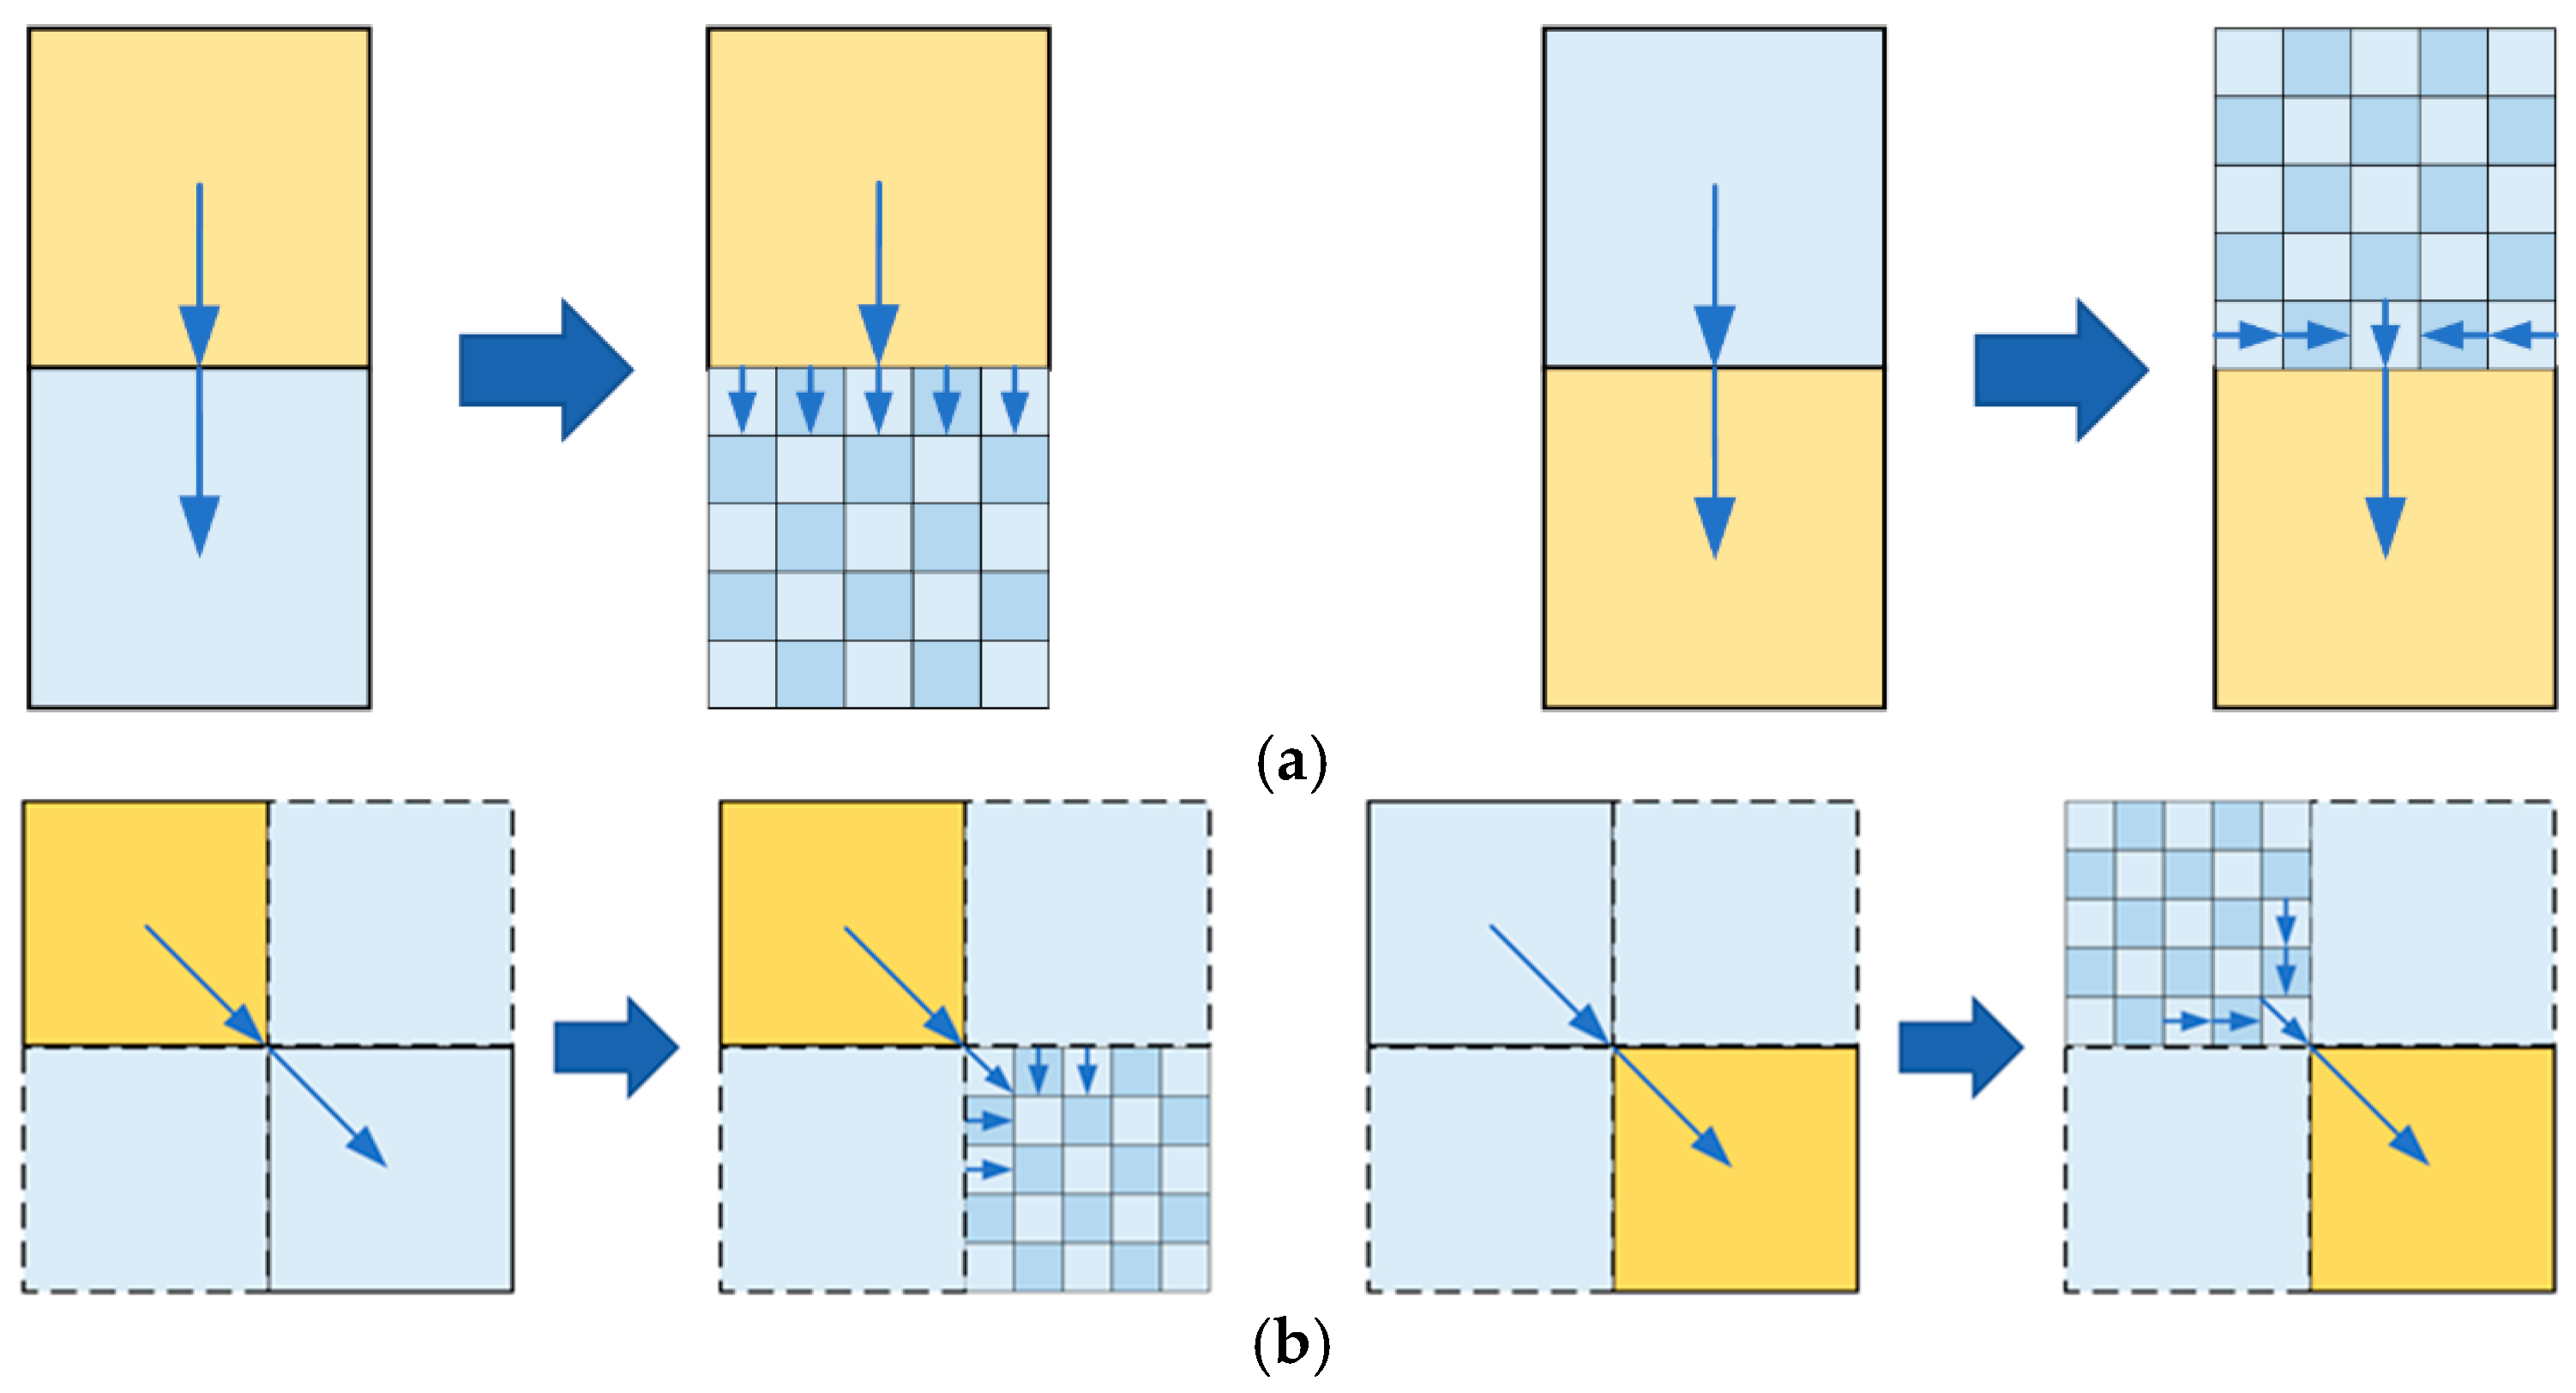
3.1. The DEM-Based Distributed Rainfall-Runoff Model

The DEM-based distributed rainfall-runoff model (DDRM) was developed by Xiong et al. and had been widely validated in several humid and semi-humid catchments of southern China. To set up DDRM, the study area (catchment) is divided into several sub-catchments that are relatively homogeneous in terms of hydrologic responses; then, each sub-catchment is further divided into an array of individual cells, which are treated as the basic hydrologic response cells. For each cell, three layers are defined to describe the hydrological processes from precipitation to runoff generation and runoff routing, including the river channel layer, surface layer, and soil layer. DDRM consists of three calculation components: runoff generation at cell scale, sub-catchment outlet flow calculation, and runoff routing through the river network. More details on DDRM model can be found in Chen et al. [31] and Xiong et al. [32].

3.2. Model Modification for Sediment Simulation

As shown in Figure 2, the original DDRM model was adopted as the basis for distributed basin water–sediment simulation model by introducing the RUSLE model for the calculation of sediment yield at cell scale. In addition, the soil erosion model and reservoir retention modules were incorporated based on recent studies. The sediment simulation module is denoted as “SED” hereafter, and the modified version of DDRM model is denoted as “DDRM-SED” model. The DDRM-SED model was ultimately applied to a specific hydrological station to simulate flow and sediment processes.

3.2.1. Soil Erosion Calculation at Cell Scale

The RUSLE model has been widely applied for soil erosion calculation by using 5 factors that are associated with climate, soil, topography, vegetation, and water–soil conservation [20,21,22] as follows:
C S E = C R C K C L S C C C P
where C S E is the amount of soil erosion for a certain period, C R is the rainfall erosivity factor, C K is the soil erodibility factor, C L S is the topography factor, C C is the vegetation cover and management factor, and C P represents the factor of the water–soil conservation.
In the DDRM-SED model, the soil erosion for each cell is calculated using a revised version of the RUSLE module to ensure the compatibility between output of the RUSLE and the original DDRM model.
The rainfall erosivity factor C R represents the erosivity caused by rainfall events of a certain location, with an increase in the intensity and amount of rainfall corresponding to a larger value of C R . In most cases the original RUSLE model is used for annual soil erosion estimation; thus, C R is usually calculated from long-term annual rainfall records. The RULSE equation is commonly used to calculate annual or seasonal sediment yield, so we modified the RULSE equation to incorporate the daily rainfall erosivity factor to calculate daily sediment yield generated during flood events. This is an existing method in recent related research. Thus, to simulate the soil erosion at a daily basis, an empirical formula reported by Shi et al. [33] was applied as follows:
C R = β 1 P D + β 2 P D 2
where C R is the daily rainfall erosivity factor, P D represents the daily rainfall (mm), and β 1 and β 2 are empirical coefficients that need to be calibrated based on the flow and sediment processes of Ningnan station. It should be noted that β 1 and β 2 are constant values throughout the entire basin because the flow and sediment process of each cell are unknown, and the coefficients cannot be calibrated separately for each cell.
The topography factor C L S is related to both slope length factor C L and steepness factor C S and is defined as a ratio of soil erosion under given conditions with the “standard” slope steepness of 9% and slope length of 22.13 m. The steeper and longer the slope is, the higher is the possibility of the erosion. There exist numerous methods for calculating C L S , mainly empirical formulas. Based the work of Liu et al. [18], the following equation was used to calculate the steepness factor C S in the study:
C L S = β 3 · sin θ · A F A · L C S 22.13 β 4
where θ is the cell slope (°) and β i ( i = 3,4 ) is the model parameter to be calibrated.

3.2.2. Soil Erosion and Transport Calculation at River Channel

According to the water–sediment coupling model proposed by Bao et al. [34], the soil erosion at river channel can be calculated by
S G = C G Q
where C G is the sediment content. The conceptual expression for C G is derived from Bagnold formula for suspended mass sediment in channel flow to obtain an expression for S G :
S G = C G M ln Q + 1 L Q B B V Q
where Q is the channel flow; C G M is the average channel sediment yield concentration; L Q B is the average value of the term ln Q + 1 for the past period; and B V is the channel parameter.
The sediment transport is based on the movement of water flow, and the sediment within the water flow can affect the flow velocity, which in turn affects the movement of water flow. Therefore, the Muskingum method can be applied to modeling sediment transport within river channel as follows:
S o u t t = C S 0 S i n t + S G , t + C S E , t + C S 1 S i n t Δ t + S G , t Δ t + C S E , t Δ t + 1 C S 0 C S 1 S o u t t Δ t
where S i n is the sediment transport rate in the upstream section of the river (i.e., S i n is the output of RUSLE from upstream cell); S o u t is the sediment transport rate in the downstream section of the river; C S 0 and C S 1 are the Muskingum parameters, which are constant values throughout the entire basin; and Δ t is the time step.
It should be noted that the model assumed that there were three different forms of water storage on each cell within the basin: river channels, underground soil, and surface. In addition, the spatial variation of parameters was not considered in this study.

3.2.3. Reservoir Retention

There are many small- and medium-size reservoirs within the upper reaches of the Yangtze River, which lead to a significant effect of sediment interception and erosion reduction. Due to the complexity of the mechanism of erosion reduction caused by reservoirs, there is a lack of theoretical basis for the physical process currently. Therefore, in DDRM-SED model, only the sediment interception role of the reservoir was considered, and an empirical formula incorporating the sediment–flow ratio was used to estimate the sediment transport rate from the reservoir to its downstream.
R S o u t = r d Q i n C i n
where R S o u t is the sediment transport rate released from the reservoir, kg/s; r d represents the sediment–flow ratio of the reservoir, which requires calibration; Q i n is the incoming flow, m3/s; and C i n is the incoming sediment content, kg/m3.

3.3. Model Setup

Slope constitutes one of the crucial factors influencing slope surface erosion. Under the identical rainfall conditions, considerable variations exist in the slope surface flow formed by different slopes, and there are also substantial differences in the extent of soil loss. The upper reaches of the Yangtze River are dominated by mountainous terrain, where soil erosion mostly occurs in steep slope regions. Conventional spatial discretization approaches for basins typically employ uniform-sized cells, partitioning the basin into a series of cells of equal area size. If the cell size is too large (such as 1 km), local highlands and depressions will be homogenized or flattened, resulting in local topographic distortion and an inability to fully reflect the sediment yield characteristics of the steep slope areas. Conversely, if the cell size is too small (such as 30 m), although it can better restore the geomorphic features of the basin, the corresponding computational load increases significantly, exerting a considerable influence on the operational efficiency of the model and real-time forecasting.
In order to balance the fineness of basin generalization as well as the efficiency of model computation operation, a spatial discretization method for basins based on multiple spatial resolutions was proposed in this study. The method firstly divided the basin into multiple sub-basins based on DEM slope orientation, inter-cell hydraulic connection, and subsurface characteristics (shown in Figure 3). The cell was the smallest cell for water–sediment yield and transportation calculation, and the sub-basin could be regarded as a collection of cells with similar geomorphic features. Except for the cell involving the river channel, the calculation of water–sediment yield and transportation in each sub-basin was independent of each other and could be processed in parallel. After the calculation of each sub-basin was completed, the calculation of confluence and sediment yield was carried out through the series-connected river network until the outlet of the basin. Subsequently, for the steep slope areas and other key sediment-producing areas to set up a more refined cell and for the gentle slope areas and other non-key sediment-producing areas that were used in a larger size of the cell, see Figure 3. The sub-basin using different sizes of the cell could take into account the accuracy of the basin portrayal and the efficiency of the computation.
Within the same sub-basin, the process of water–sediment evolution between cells of different sizes was not involved because each cell size was the same. Only at the river connection points of sub-basins with different cell sizes, there exists an evolution process from large-size cells to small-size cells (Figure 4). The spatial discretization scheme can significantly reduce the amount of computation for data exchange between different size cells, greatly improve the computational efficiency, and reduce the impact of local cell densification on the model running computation.

3.4. Model Calibration and Evaluation

The SCE-UA (Shuffled Complex Evolution Algorithm) is proposed by Duan et al. [35], which can effectively solve the common problems of multi-peak, multi-noise, discontinuity, high-dimensional, nonlinear, etc., in parameter optimization and can efficiently and rapidly search for the global optimal solution to the basin model parameters; thus, it has been widely used in hydrological model parameter optimization.
For the evaluation of the model simulation effect, the flow and sediment process was evaluated by 4 indexes: the Nash efficiency coefficient (NSE), peak relative error, peak present time error, and flood volume relative error. The sediment process was evaluated by four indexes: Nash efficiency coefficient, sediment peak volume relative error, peak present time error, and sediment transport relative error. The formula for calculating the NSE of the Nash efficiency coefficient is as follows:
N S E = 1 t = 1 T V o b s , t V s i m , t 2 t = 1 T V o b s , t V o b s ¯ 2
where T is the total length of the data series, V stands for the evaluation object (i.e., flow Q or sediment transport S S ), V o b s , t represents the moment t measured value, V s i m , t represents the moment t measured value model simulation value, and V o b s ¯ is the average value of the measured series.

4. Results

4.1. Basin Characteristics and Dataset Analysis

Table 2 gives a statistical table of the percentage of the area of terrain with different slopes in the area above Ningnan in the Heishui River basin. As can be seen from the table, there is a significant difference in the distribution of the basin topographic slope calculated from 30 m and 300 m spatial resolution DEM data. Based on the 300 m spatial resolution, the percentage of the terrain with slope 0–5° is 3.96%, while that based on the 30 m spatial resolution is only 3.51%; for the >30° slope interval, there is a big difference in the percentage of the area calculated by the two. It is obvious that different spatial resolutions of DEM data portray the topography of the basin, especially for steep slopes, and the low-resolution DEM data are more likely to lead to “terrain distortion”, which cannot truly respond to the spatial variability of topography and slope. Therefore, when constructing the distributed model, a more detailed cell should be used for steep slope areas.

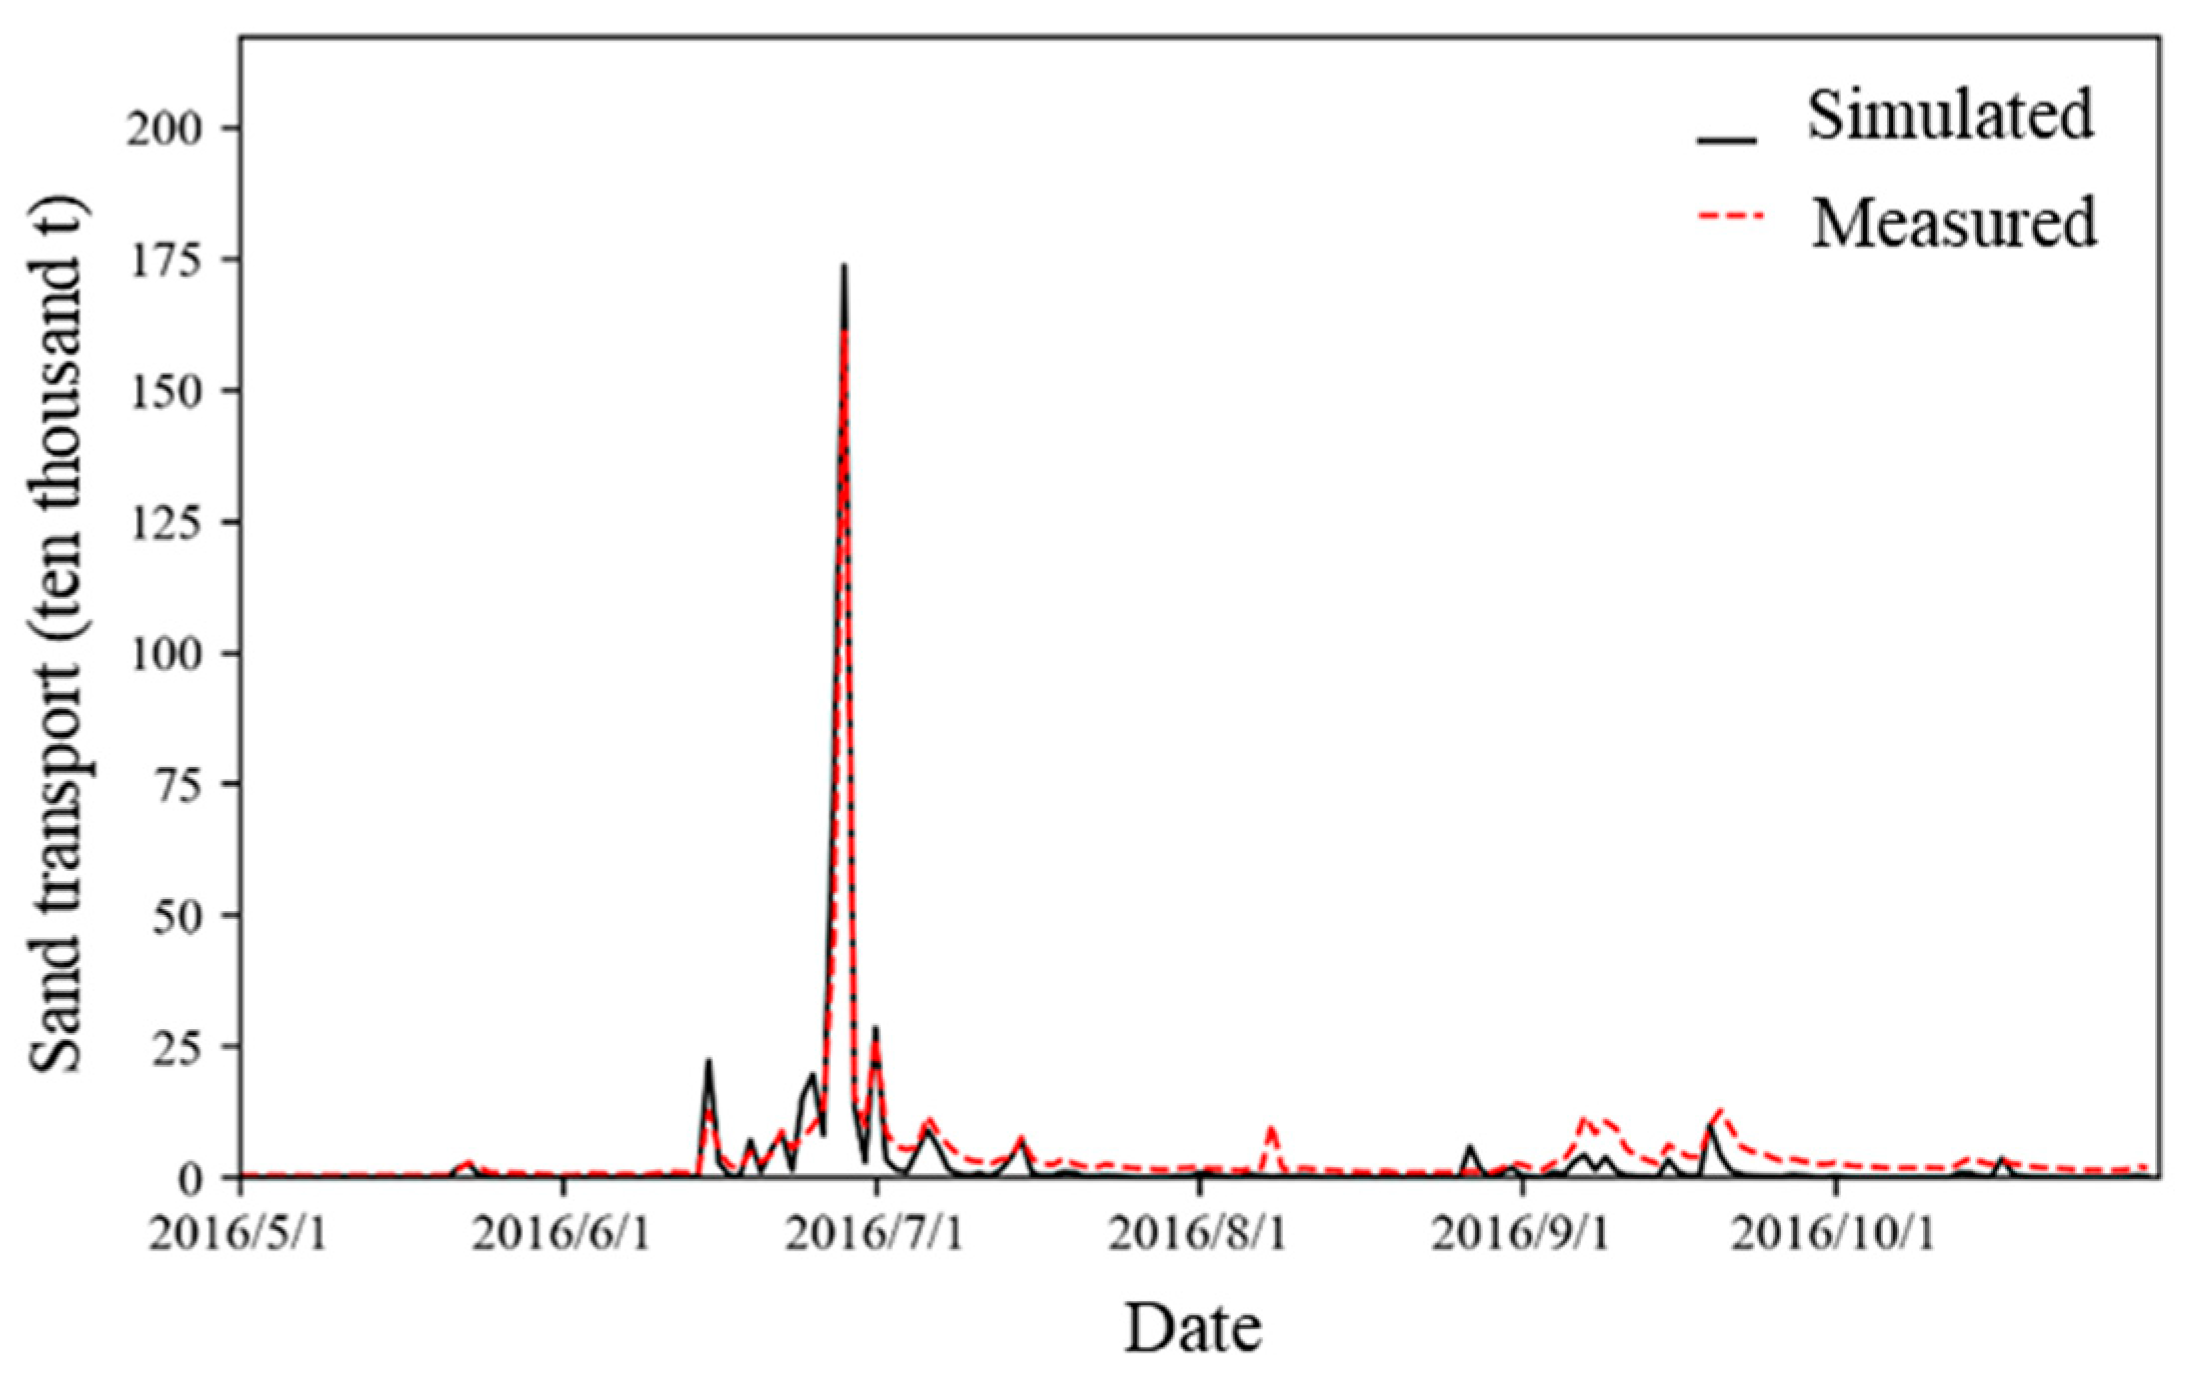
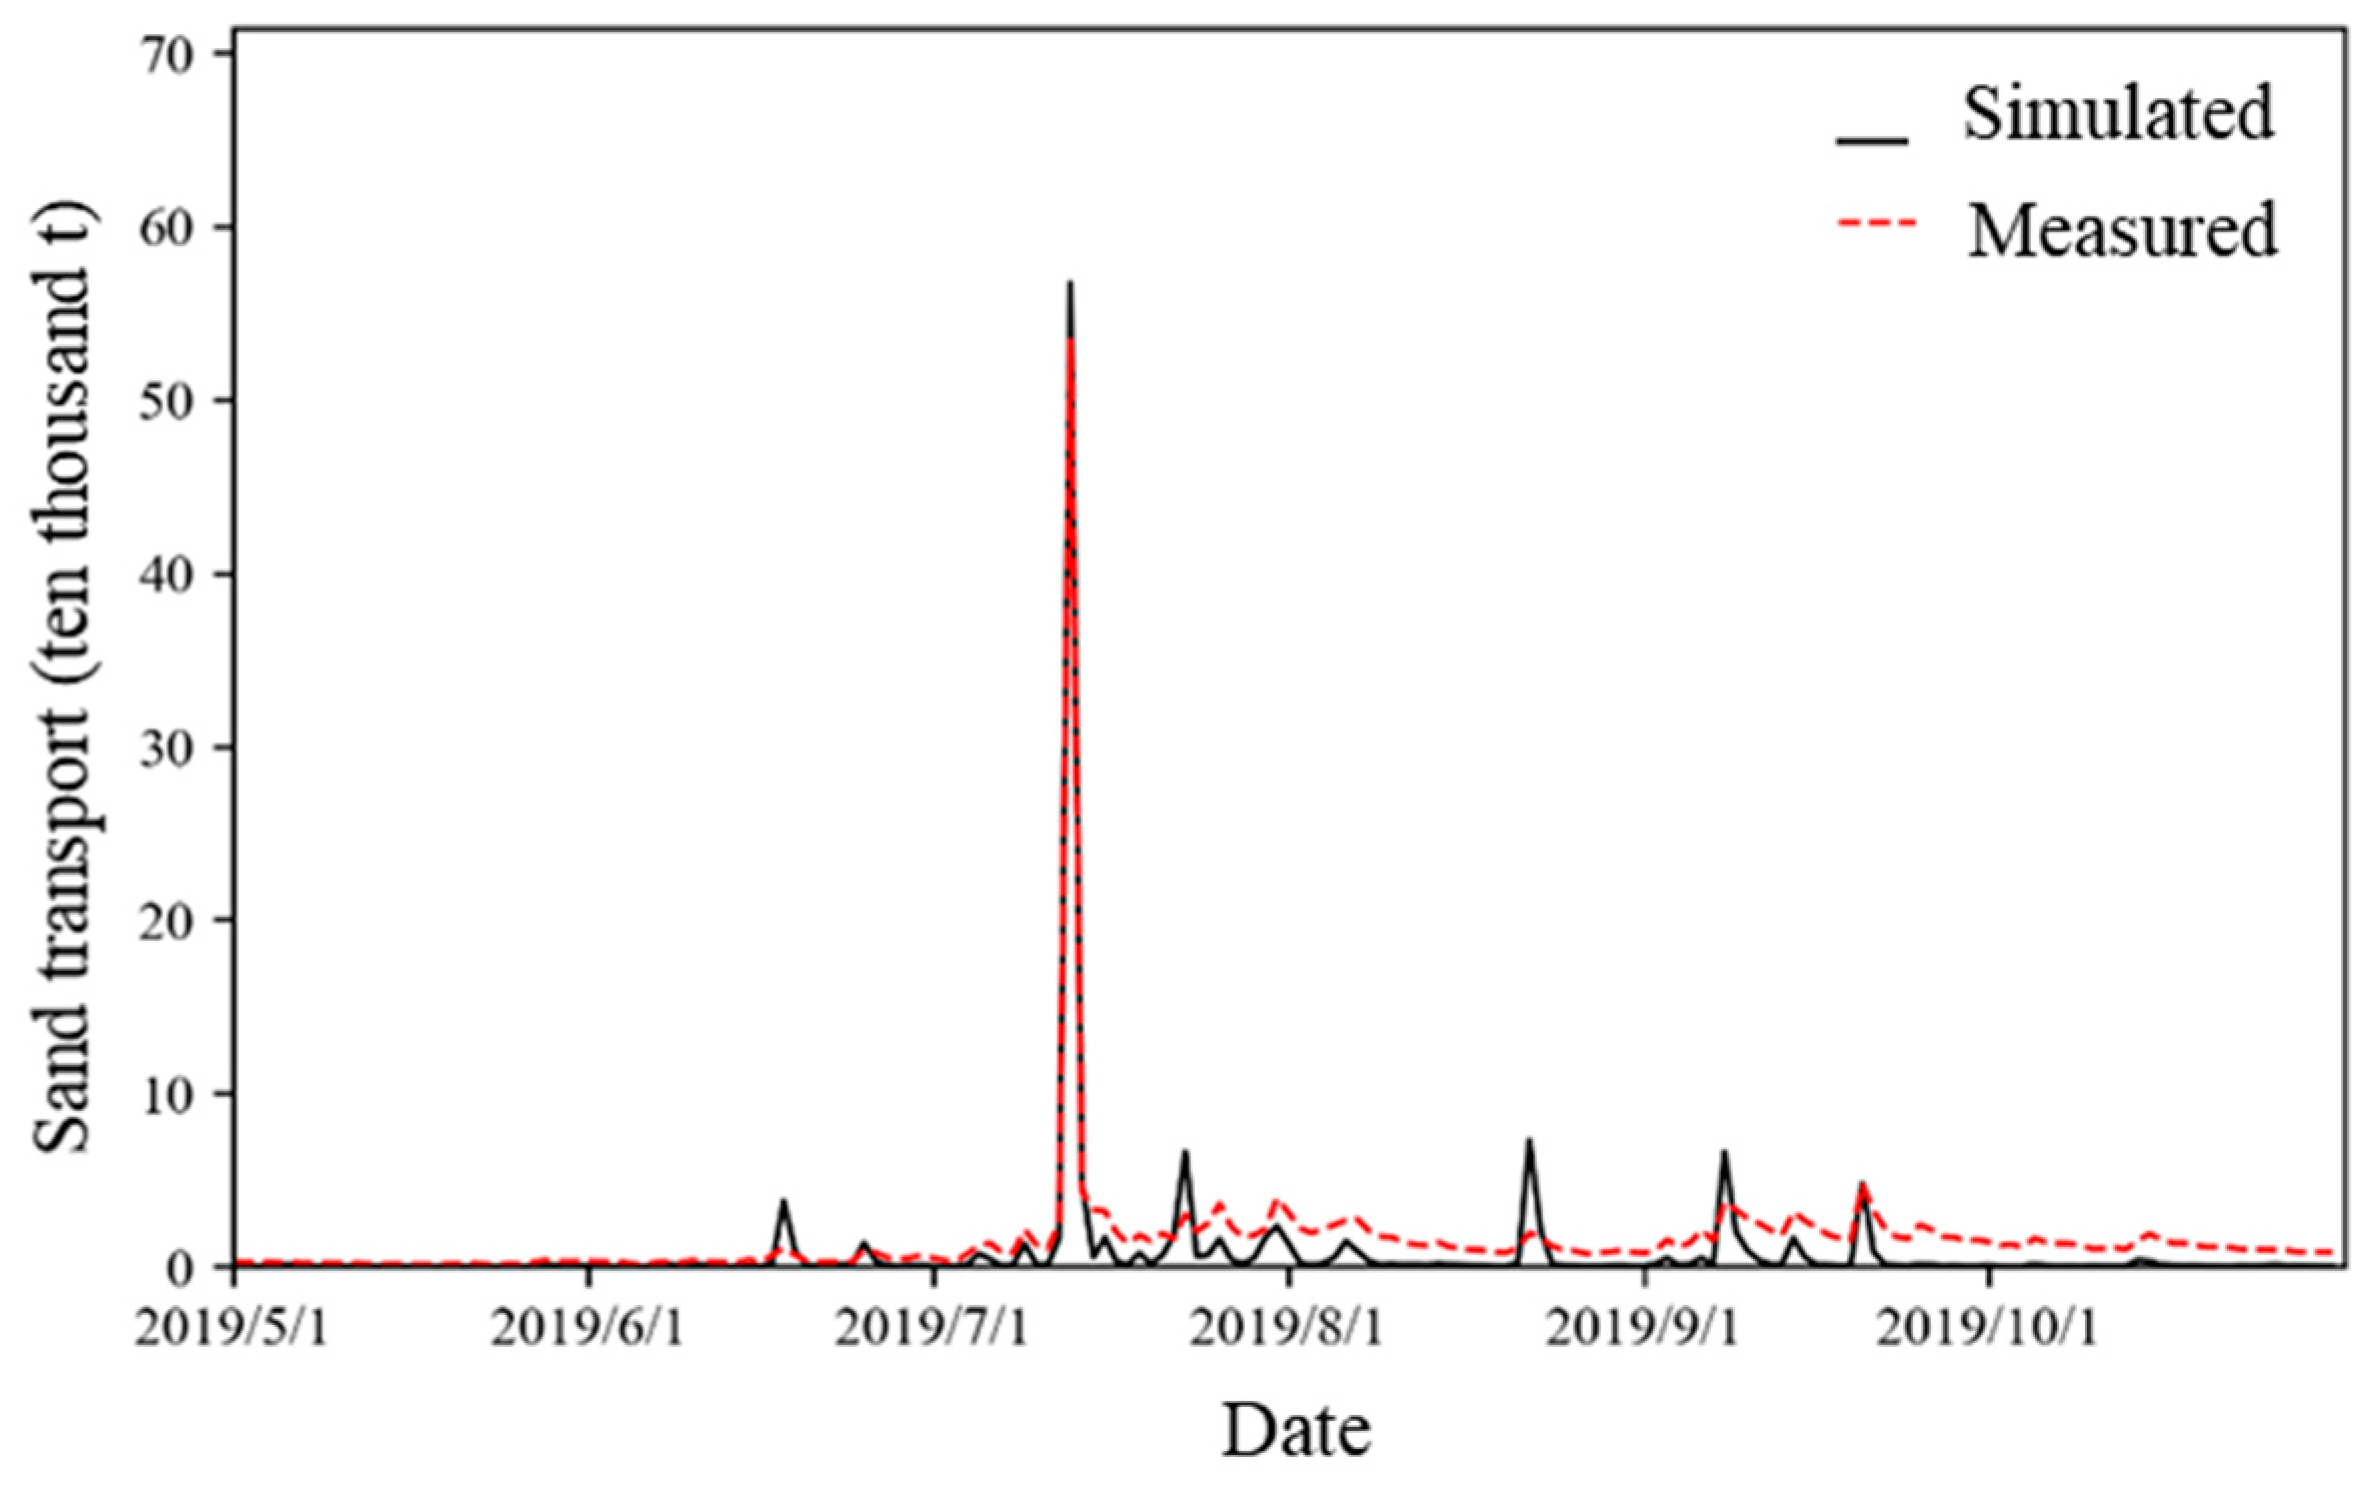
4.2. Model Performance of the DDRM-SED Model

The accuracy assessment results of the flood and sediment processes at Ningnan Station, as shown in Table 3 and Table 4, respectively. The measured and model-simulated runoff and sediment processes during the calibration period of 2016 and the validation period of 2019, as shown in Figure 5, Figure 6, Figure 7 and Figure 8. Flood No. is used to name a flood event, which is usually represented by the occurrence date of a flood event. Each flood contains at least 30 measurements, and only the peak values are shown in the tables. Peak occurrence time error indicates the number of days between the measured and the simulated occurrence date of flood/sediment peak value. As can be seen from the figures and tables, the values of the peak occurrence time error are all zero and show that the model performs well in simulating the time of peak occurrence. The Nash efficiency coefficient of the flow process during the calibration period is greater than 0.71 except for the event on 20140818. The relative error of the peak flow ranges from −15.1% to −4.8%, and the relative error of the flood volume simulation is between −14.8% and 12.5%. The Nash efficiency coefficient of the sediment transport process is greater than 0.70, and the relative error of the peak sediment transport is between −10.5% and 10.8%. During the validation period, the Nash efficiency coefficient of the flow process is greater than 0.77. The relative error of the peak flow ranges from −12.7% to 6.0%, and the relative error of the flood volume simulation is between −9.5% and 7.7%. The Nash efficiency coefficient of the sediment transport process is greater than 0.75, and the relative error of the peak sediment transport is between 5.0% and 5.2%. Overall, the simulation of the flow and sediment transport processes at Ningnan Station is generally satisfactory. The main deficiency lies in the relatively large errors in the simulation of the peak flow and peak sediment transport.

4.3. Comparison of Simulation Performance from Multi-Model

In order to compare and analyze the application effect of different models in the Heishui River basin, this study constructed the RUSLE model (Revised Universal Soil Loss Equation) and the equal-size cell distributed water–sediment yield and transport model without considering the local cell encryption in the steep-slope area (the size of the cells in the whole basin is 300 m) for the area above Ningnan, and it compared the simulation effect of the multi-size cell distributed water–sediment yield and transport model with that of the above model considering the local cell encryption in the steep-slope area; the results are detailed in Table 5. The RUSLE model can calculate the total annual sediment yield, while the total annual sediment transport volume can be measured at the hydrological station. It can be seen from Table 5 that RUSLE-simulated erosion sediment yield results have a larger error compared with the measured sediment transport volume, which may be due to the fact that RUSLE only focuses on the sediment yield process on the slope but lacks the modules of slope sediment catchment and channel sediment catchment. It cannot truly reflect the process of the movement of sediment in the basin space. Moreover, the basin is regarded as a whole, which cannot take into account the influence of topography and other subsurface conditions on soil erosion and sediment transport. In contrast, the simulation effect of the equal-size cell distributed water–sediment yield and transportation model is better in terms of the Nash efficiency coefficient, the relative error of the sediment peak sequence, and the relative error of multi-year sediment transport; the model can better reflect the process of sediment yield and transport in the basin, but the effect is slightly better than that of the multi-size cell distributed water–sediment yield and transportation model simulation. The reason may be that the equal-size cells are constructed with 300 m spatial resolution DEM data, which cannot truly reflect the topographic characteristics of the steep slope area, thus leading to the “local distortion” in the simulation of water–sediment process, and the simulation of the sediment peak process and the total amount of sediment is not as effective as that of the model.

5. Conclusions

This study presents a framework by incorporating soil erosion and transport calculation modules into a modified distributed hydrological model, and a case study is carried out in Heishuihe River basin in southwestern China. The main findings are as follows:
(1)
The modified version of the DDRM model (i.e., DDRM-SED) shows a good simulation performance in terms of flow and sediment processes. The DDRM-SED model with multi-spatial resolution shows a better simulation performance than the model with constant spatial resolution.
(2)
A spatial discretization method for basins based on multiple spatial resolutions is proposed in this study, which is able to accurately describe topography (e.g., slope length and slope gradient) and take into account its influence on soil process simulation. However, the simulation and validation using only the data from Ningnan Station cannot reflect the spatial and temporal variations of the model.
(3)
The research proposes a modification of the DDRM model, showing the performance in simulating flow and sediment processes, and by applying the modified model, a better simulation of flow and sediment processes can be obtained. It provides technical support and a theoretical basis for the simulation of the water–sediment transport process. In future studies, coupling multi-source water–sediment data and sub-basin refinement measurements can enable accurate simulation and validation of basin water–sediment processes with multiple spatial resolutions.

Author Contributions

Conceptualization, Y.W. and Y.J.; methodology, Y.W.; formal analysis, Y.W.; investigation, Y.W., Y.J. and H.B.; resources, Y.W., Y.J., H.B. and Y.R.; data curation, Y.W., Y.J., H.B. and Y.R.; writing—original draft preparation, Y.W. and Y.J.; writing—review and editing, Y.W., Y.J. and H.B.; visualization, Y.W., Y.J., H.B. and Y.R.; supervision, Y.W., Y.J., H.B. and Y.R.; project administration, H.B. and Y.R.; funding acquisition, H.B. and Y.R. All authors have read and agreed to the published version of the manuscript.

Funding

The authors declare that this study received funding from China Yangtze Power Co., Ltd. (ZZH2302021). The funder was not involved in the study design, collection, analysis, interpretation of data, the writing of this article or the decision to submit it for publication.

Data Availability Statement

Data available on request from the corresponding author due to privacy restrictions.

Acknowledgments

Sincere thanks are due to the editor and the anonymous reviewers for all the remarks and suggestions that were very helpful and constructive for improving our manuscript.

Conflicts of Interest

Authors Yibo Wang, Hongwei Bi and Yufeng Ren were employed by the company Hubei Key Laboratory of Intelligent Yangtze and Hydroelectric Science, China Yangtze Power Co., Ltd. The remaining author declares that the research was conducted in the absence of any commercial or financial relationships that could be construed as a potential conflict of interest.

References

  1. Poesen, J. Soil erosion in the Anthropocene: Research needs. Earth Surf. Process. Landf. J. Br. Geomorphol. Res. Group 2018, 43, 64–84. [Google Scholar] [CrossRef]
  2. Cheng, Y.; Xia, J.; Zhou, M.; Deng, S. Improved formula of sediment transport capacity and its application in the lower Yellow River. J. Hydrol. 2024, 631, 130812. [Google Scholar] [CrossRef]
  3. Khalid, M.A.; Ghumman, A.R.; Pasha, G.A. A Comparative Analysis of Sediment Concentration Using Artificial Intelligence and Empirical Equations. Hydrology 2024, 11, 63. [Google Scholar] [CrossRef]
  4. Xu, J. Erosion caused by hyperconcentrated flow on the Loess Plateau of China. Catena 1999, 36, 1–19. [Google Scholar]
  5. Liu, W.L.; Deng, Y.L.; Li, C.Y.; Guo, Z.Y.; Zhang, L. Progress of soil erosion forecasting modeling in the middle and upper reaches of the Yangtze River. Technol. Soil Water Conserv. 2006, 3, 29–32. [Google Scholar]
  6. Prajapati, P.; Meena, G.K.; Swarnkar, S.; Jha, S.K. Impact of Indira Sagar Dam on Water Discharge and Sediment Flow Regimes of the Narmada Basin. J. Hydrol. Eng. 2025, 30, 05025002. [Google Scholar] [CrossRef]
  7. Dong, L.; Fu, S.; Liu, B. Effects of Rock Fragment Cover on the Sediment Transport Capacity of Overland Flow. Water Resour. Res. 2025, 61, e2024WR038621. [Google Scholar] [CrossRef]
  8. Mostafazadeh, R.; Azizi, E. Determination of river flow and sediment regime changes in response to construction of regulating dams: An indicator-based approach. Environ. Earth Sci. 2025, 84, 36. [Google Scholar] [CrossRef]
  9. Chen, X.Y.; He, B.H.; Miu, C.Y.; Wu, Y. Study on Application of WEPP Model for Sloping Surface Erosion Prediction in Purple Soil. J. Soil Water Conserv. 2003, 17, 43–44, 47. [Google Scholar]
  10. Li, Q.X. Study on the Trend of Water and Sediment and the Model of Sediment Transport in Typical Drainage Area of Three Gorges Reservoir Area; Changjiang River Scientific Research Institute: Wuhan, China, 2018. [Google Scholar]
  11. Niu, Z.M.; Xie, M.S.; Sun, G.; Mcnulty, S.G. Applying ANSWERS2000 to Simulate Soil Erosion Process on Two Watersheds of Three Gorges Area. J. Soil Water Conserv. 2001, 15, 57–60. [Google Scholar]
  12. Wang, H.; Cai, Q.G.; Zhu, Y.D. Evaluation of the EUROSEM Model for predicting water erosion on steep slopeland in the Three Gorges Reservoir Area, China. Geogarhical Res. 2003, 22, 579–589. [Google Scholar]
  13. Liang, Y.Z.; Xia, Z.Y.; Niu, P.H.; Xu, W.N.; Chen, Y. Rainfall Infiltration and Characteristics of Runoff and Sediment Yield in Small Watershed of Three Gorges Reservoir Area. J. Yangtze River Sci. Res. Inst. 2016, 33, 28–32. [Google Scholar]
  14. Lu, X.P. Simulation Study on Rainfall Erosivity of Hilly area of Purple Soil; Southwest University: Chongqing, China, 2006. [Google Scholar]
  15. Zhang, R.Z.; Ran, Q.L. Sand production modeling and erosive force distribution in small and medium-sized watersheds in the upper reaches of the Yangtze River. J. Hydraul. Eng. 1992, 000, 51–56. [Google Scholar]
  16. Liu, J.G.; Zhang, P.C.; Ren, H.Y. Evolution of Soil Erosion Prediction Models in Yangtze River Basin. J. Yangtze River Sci. Res. Inst. 2007, 24, 12–14. [Google Scholar]
  17. Yang, H.F.; Yang, S.L.; Xu, K.H.; Milliman, J.D.; Wang, H.; Yang, Z.; Chen, Z.; Zhang, C.Y. Human impacts on sediment in the Yangtze River: A review and new perspectives. Glob. Planet. Change 2018, 162, 8–17. [Google Scholar] [CrossRef]
  18. Liu, B.Y.; Nearing, M.A.; Risse, L.M. Slope Gradient Effects on Soil Loss for Steep Slopes. Trans. ASAE 1994, 37, 1835–1840. [Google Scholar] [CrossRef]
  19. Bieger, K.; Hörmann, G.; Fohrer, N. Simulation of streamflow and sediment with the soil and water assessment tool in a data scarce catchment in the three gorges region, China. J. Environ. Qual. 2014, 43, 37–45. [Google Scholar] [CrossRef]
  20. Demirci, A.; Karaburun, A. Estimation of soil erosion using RUSLE in a GIS framework: A case study in the Buyukcekmece Lake watershed, northwest Turkey. Environ. Earth Sci. 2011, 66, 903–913. [Google Scholar] [CrossRef]
  21. Kebede, Y.S.; Endalamaw, T.; Sinshaw, B.G.; Atinkut, H.B. Modeling soil erosion using RUSLE and GIS at watershed level in the upper beles, Ethiopia. Environ. Chall. 2021, 1, 100009. [Google Scholar] [CrossRef]
  22. Koirala, P.; Thakuri, S.; Joshi, S.; Chauhan, R. Estimation of Soil Erosion in Nepal Using a RUSLE Modeling and Geospatial Tool. Geosciences 2019, 9, 147. [Google Scholar] [CrossRef]
  23. Konz, M.; Chiari, M.; Rimkus, S.; Turowski, J.M.; Molnar, P.; Rickenmann, D.; Burlando, P. Sediment transport modelling in a distributed physically based hydrological catchment model. Hydrol. Earth Syst. Sci. 2011, 15, 2821–2837. [Google Scholar]
  24. Wang, J.; Zhang, Z.; Greimann, B.; Huang, V.J.E.M. Application and evaluation of the HEC-RAS—Riparian vegetation simulation module to the Sacramento River. Ecol. Model. 2018, 368, 158–168. [Google Scholar] [CrossRef]
  25. Montaseri, H.; Tavakoli, K.; Evangelista, S.; Omidvar, P. Sediment transport and bed evolution in a 180 curved channel with lateral intake: Numerical simulations using Eulerian and Discrete Phase models. Int. J. Mod. Phys. C 2020, 31, 2050113. [Google Scholar]
  26. Warren, S.D.; Mitasova, H.; Hohmann, M.G.; Landsberger, S.; Iskander, F.Y.; Ruzycki, T.S.; Senseman, G.M. Validation of a 3-D enhancement of the Universal Soil Loss Equation for prediction of soil erosion and sediment deposition. Catena 2005, 64, 281–296. [Google Scholar]
  27. Ansarifard, S.; Eyvazi, M.; Kalantari, M.; Mohseni, B.; Ghorbanifard, M.; Moghaddam, H.J.; Nouri, M. Simulation of floods under the influence of effective factors in hydraulic and hydrological models using HEC-RAS and MIKE 21. Discov. Water 2024, 4, 92. [Google Scholar]
  28. Xia, Y.H.; Zhang, P.C. Study on Watershed Soil Erosion Models Based on Erosion Mechanics Mechanism—Taking Yangtze Rive Three Gorges Reservoir Area as an Example. J. Soil Water Conserv. 2003, 17, 152–154. [Google Scholar]
  29. Du, J.; Shi, C.X.; Zhou, Y.Y. Sediment Yield Pattern and Its Contralling Factors in the Upper Yangtze River. J. Mt. Sci. 2010, 6, 660–667. [Google Scholar]
  30. Wang, A.J.; Li, Z.G.; Liu, F. Spatiotemporal Distribution of Rainfall Erosivity for Water Erosion District in Upper Reaches of Yangtze River. Bull. Soil Water Conserv. 2013, 31, 9–11. [Google Scholar]
  31. Chen, S.; Xiong, L.; Zeng, L.; Kim, J.-S.; Zhang, Q.; Jiang, C. Distributed rainfall-runoff simulation for a large-scale karst catchment by incorporating landform and topography into the DDRM model parameters. J. Hydrol. 2022, 610, 127853. [Google Scholar]
  32. Xiong, L.; Zeng, L. Impacts of Introducing Remote Sensing Soil Moisture in Calibrating a Distributed Hydrological Model for Streamflow Simulation. Water 2019, 11, 666. [Google Scholar] [CrossRef]
  33. Shi, D.M.; Lu, X.P.; Jiang, G.Y. Simulation on simple algorithm of rainfall erosivity in purple hilly area. Trans. CSAE 2010, 26, 117–122. [Google Scholar]
  34. Bao, W.M. A Conceptual Modelling Study for Small Basin Sediment Yields in Loss Regions. Adv. Water Sci. 1993, 4, 45–50. [Google Scholar]
  35. Duan, Q.; Sorooshian, S.; Gupta, V.K. Optimal use of the SCE-UA global optimization method for calibrating watershed models. J. Hydrol. 1994, 158, 265–284. [Google Scholar] [CrossRef]
Figure 1. The location of the Heishuihe River basin and the Ningnan hydrological station.
Water 17 00996 g001
Figure 2. Flowchart of the DDRM-SED model.
Water 17 00996 g002
Figure 3. Schematic of multi-spatial resolution discretization of sub-basins.
Water 17 00996 g003
Figure 4. Schematic calculation of convergence between cells of different resolutions. (a) Non-diagonal direction, (b) diagonal direction.
Water 17 00996 g004
Figure 5. Comparison of measured and simulated flow processes at Ningnan Station (calibration period: 2016).
Water 17 00996 g005
Figure 6. Comparison of measured and simulated sediment transport processes at Ningnan Station (calibration period: 2016).
Water 17 00996 g006
Figure 7. Comparison of measured and simulated flow processes at Ningnan Station (validation period: 2019).
Water 17 00996 g007
Figure 8. Comparison of measured and simulated sediment transport processes at Ningnan Station (validation period: 2019).
Water 17 00996 g008
Table 1. Data list.
Table 1. Data list.
Data TypeSpatial ResolutionTemporal ResolutionPeriod
Precipitationstationdaily2011–2020
Temperaturestationdaily2011–2020
Runoffstationdaily2011–2020
Sedimentstationdaily2011–2020
DEM30 m and 300 m//
Land use1 km//
NDVI1 kmmonthly2011–2020
Soil texture1 km//
soil organic carbon content1 km//
Table 2. Statistics on the proportion of the area of terrain with different slopes in the Heishuihe River basin.
AreaCell SizePercentage of Area in Terrain with Different Slopes
0–5°5–10°10–15°15–20°20–25°25–30°30–35°35–40°40–45°>45°
Above Ningnan Station300 m6.96%18.08%24.64%23.10%15.35%8.03%3.09%0.69%0.06%0.00%
30 m3.51%7.27%13.94%18.77%18.51%15.13%11.12%6.73%3.08%1.94%
Table 3. Evaluation of runoff simulation accuracy for Ningnan Station.
PeriodFlood No.Flood Peak Flow (m3/s)Peak Occurrence Time Error (d)Flood Volume (108 m3)NSE
MeasuredSimulatedRelative ErrorMeasuredSimulatedRelative Error
Calibration period201020100710309286−7.4%00.090.08−11.1%0.76
201120110623311269−13.5%00.120.138.3%0.71
201220120705667589−11.7%00.210.2414.3%0.79
201320130912520495−4.8%00.270.23−14.8%0.71
201420140818511434−15.1%00.160.1812.5%0.68
201520150715424372−12.3%00.090.08−13.3%0.83
201620160628656598−8.8%00.440.38−13.6%0.73
201720170625431382−11.4%00.290.26−10.3%0.72
Validation period201920190713330288−12.7%00.130.147.7%0.79
202020200917583548−6.0%00.420.38−9.5%0.77
Table 4. Evaluation of sediment transport simulation accuracy for Ningnan Station.
PeriodFlood No.Sediment Peak Volume (104 t)Peak Occurrence Time Error (d)Sediment Transport Volume (104 t)NSE
MeasuredSimulatedRelative Standard DeviationMeasuredSimulatedRelative Standard Deviation
Calibration period20102010071034.9131.23−10.5%0102.7297.54−5.0%0.73
20112011062351.1548.83−4.5%070.6567.44−4.5%0.79
20122012070571.6369.55−2.9%0146.27129.33−11.6%0.83
20132013091238.3642.5210.8%069.1671.323.1%0.76
20142014081857.4555.19−3.9%075.6279.314.9%0.77
20152015071546.8943.5−7.2%050.1547.27−5.7%0.73
201620160628173.66161.02−7.3%0373.88359.18−3.9%0.86
201720170625108.86115.616.2%0298.27277.45−7.0%0.71
Validation period20192019071356.7453.41−5.9%065.3268.745.2%0.78
20202020091739.8941.514.1%0163.13171.315.0%0.75
Table 5. Multi-model comparisons of sediment yield and transport in the Heishui River basin.
ModelsEvaluation IndicatorsCalibration PeriodValidation Period
Revised Universal Soil Loss Equation RUSLE(Centralized model and distributed model)Relative error of multi-year average erosion sediment yield18.9%−13.2%
Distributed water–sediment yield and transportation model (Equal-size cell)Nash
efficiency factor
0.740.79
Relative error of sediment peak7.7%5.3%
Relative error of multi-year sediment transport21.3%−9.9%
Distributed water–sediment yield and transportation model (Multi-size cell)Nash
efficiency factor
0.790.84
Relative error of sediment peak7.9%−8.1%
Relative error of multi-year sediment transport17.0%7.7%
Disclaimer/Publisher’s Note: The statements, opinions and data contained in all publications are solely those of the individual author(s) and contributor(s) and not of MDPI and/or the editor(s). MDPI and/or the editor(s) disclaim responsibility for any injury to people or property resulting from any ideas, methods, instructions or products referred to in the content.

