
Probability Distribution Functions of Velocity Fluctuations and Quadrant Analysis on Turbulent Flow Around a Horizontal Cylinder Across a Channel Bed


Abstract
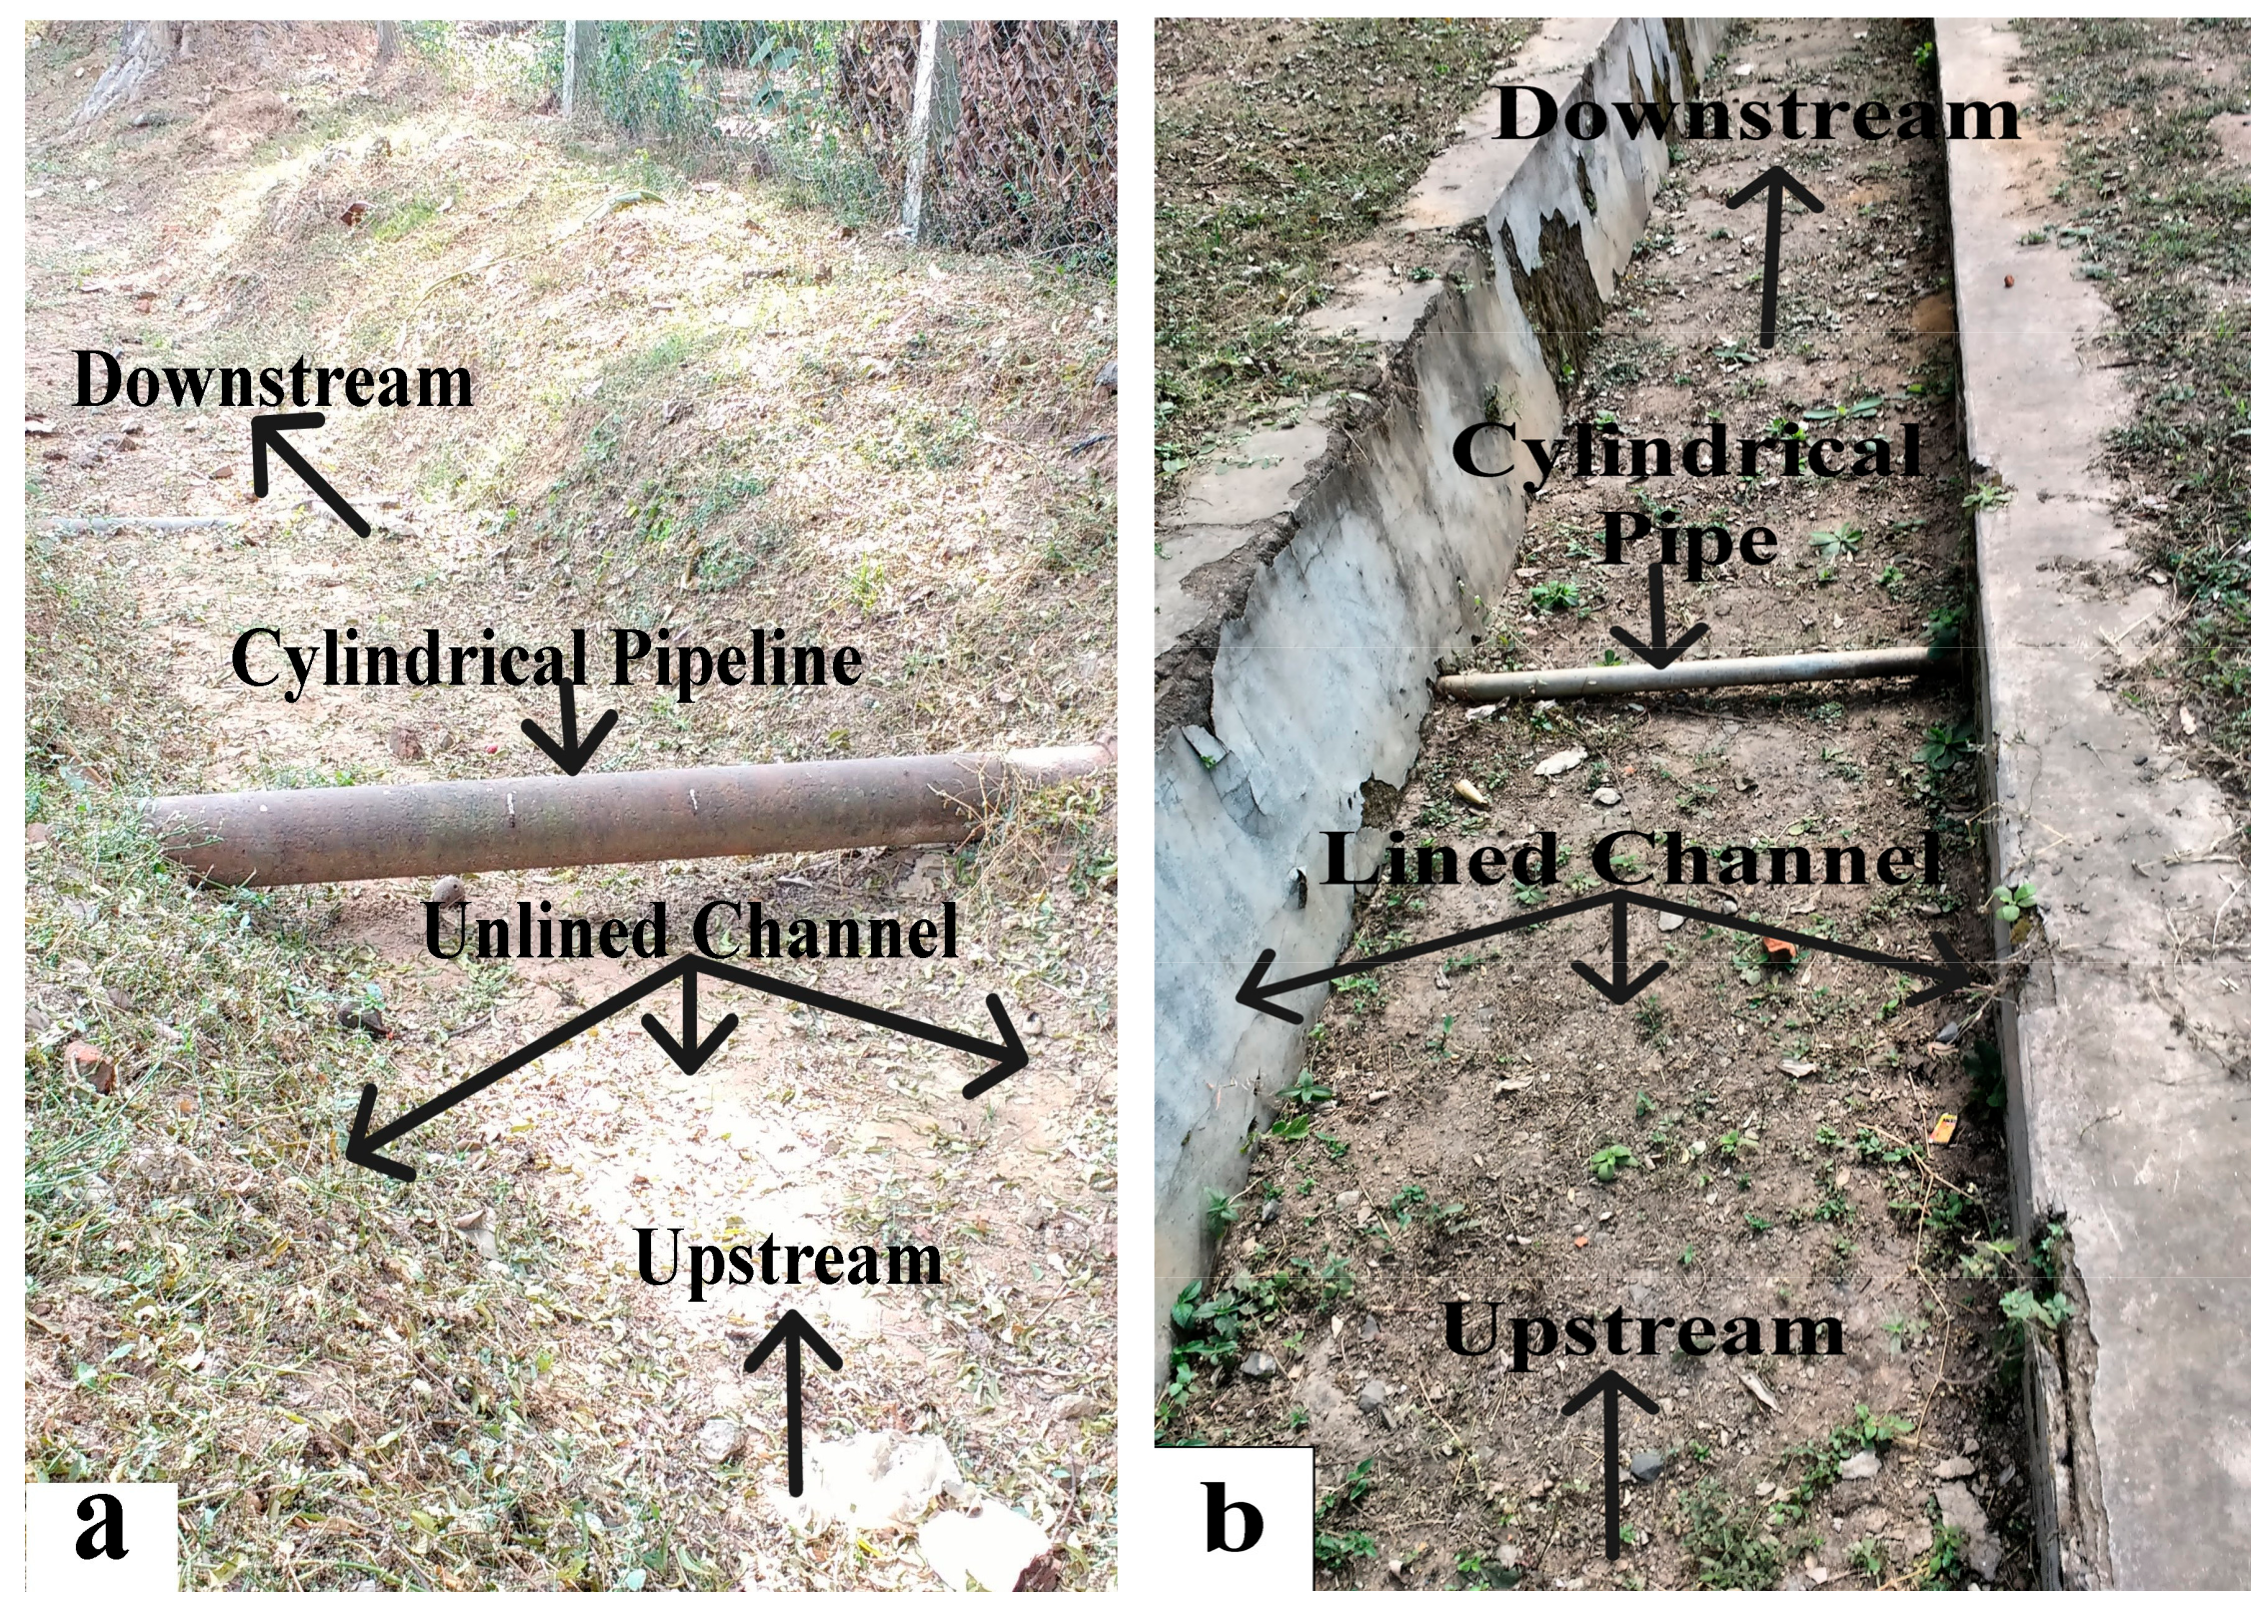
1. Introduction
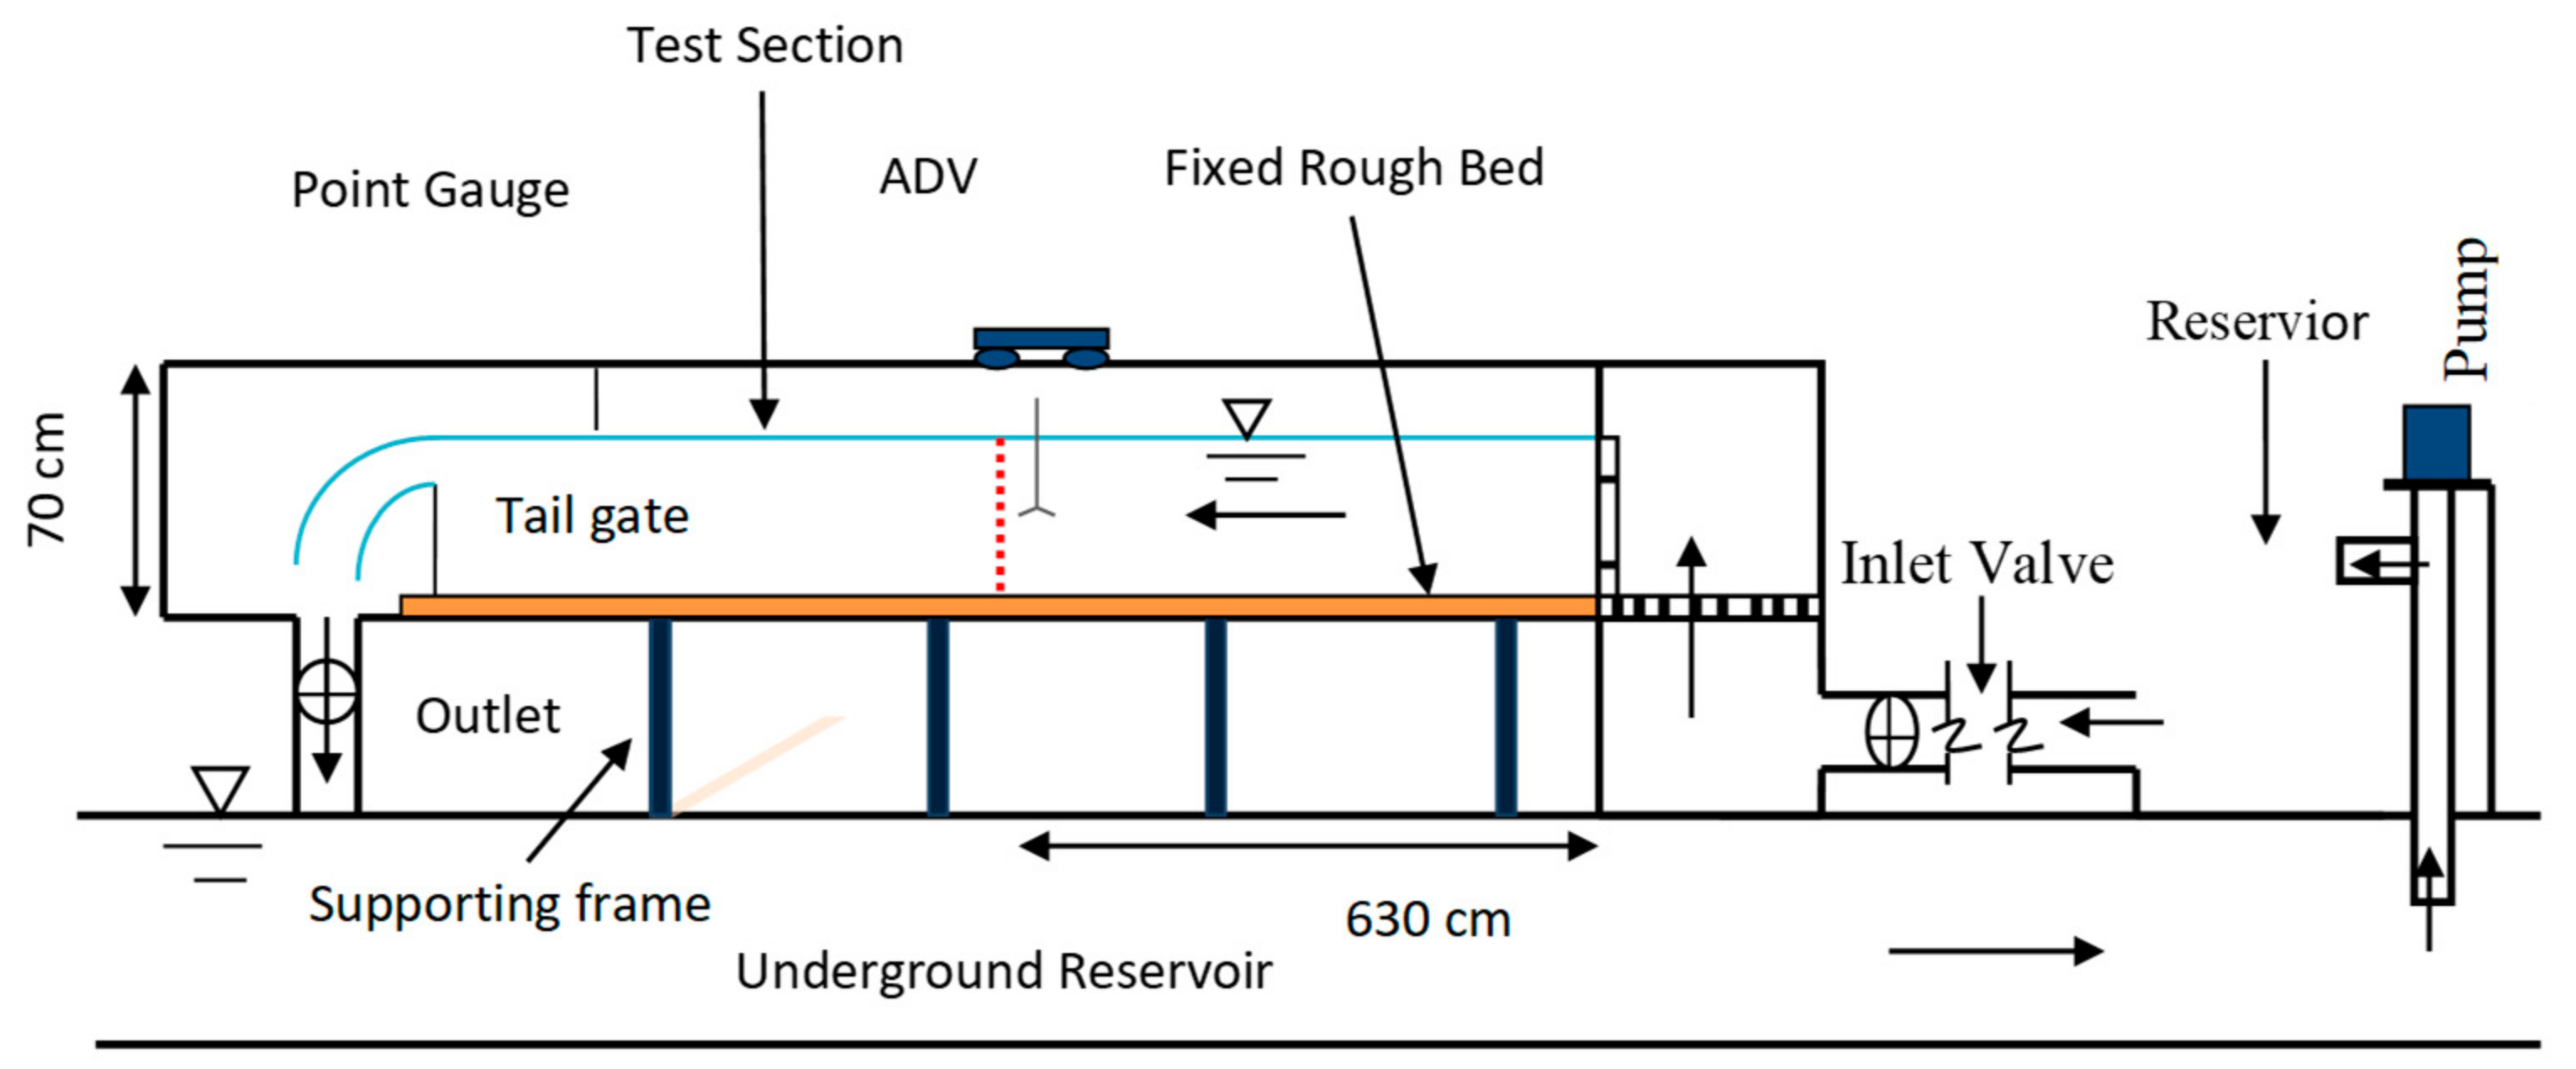
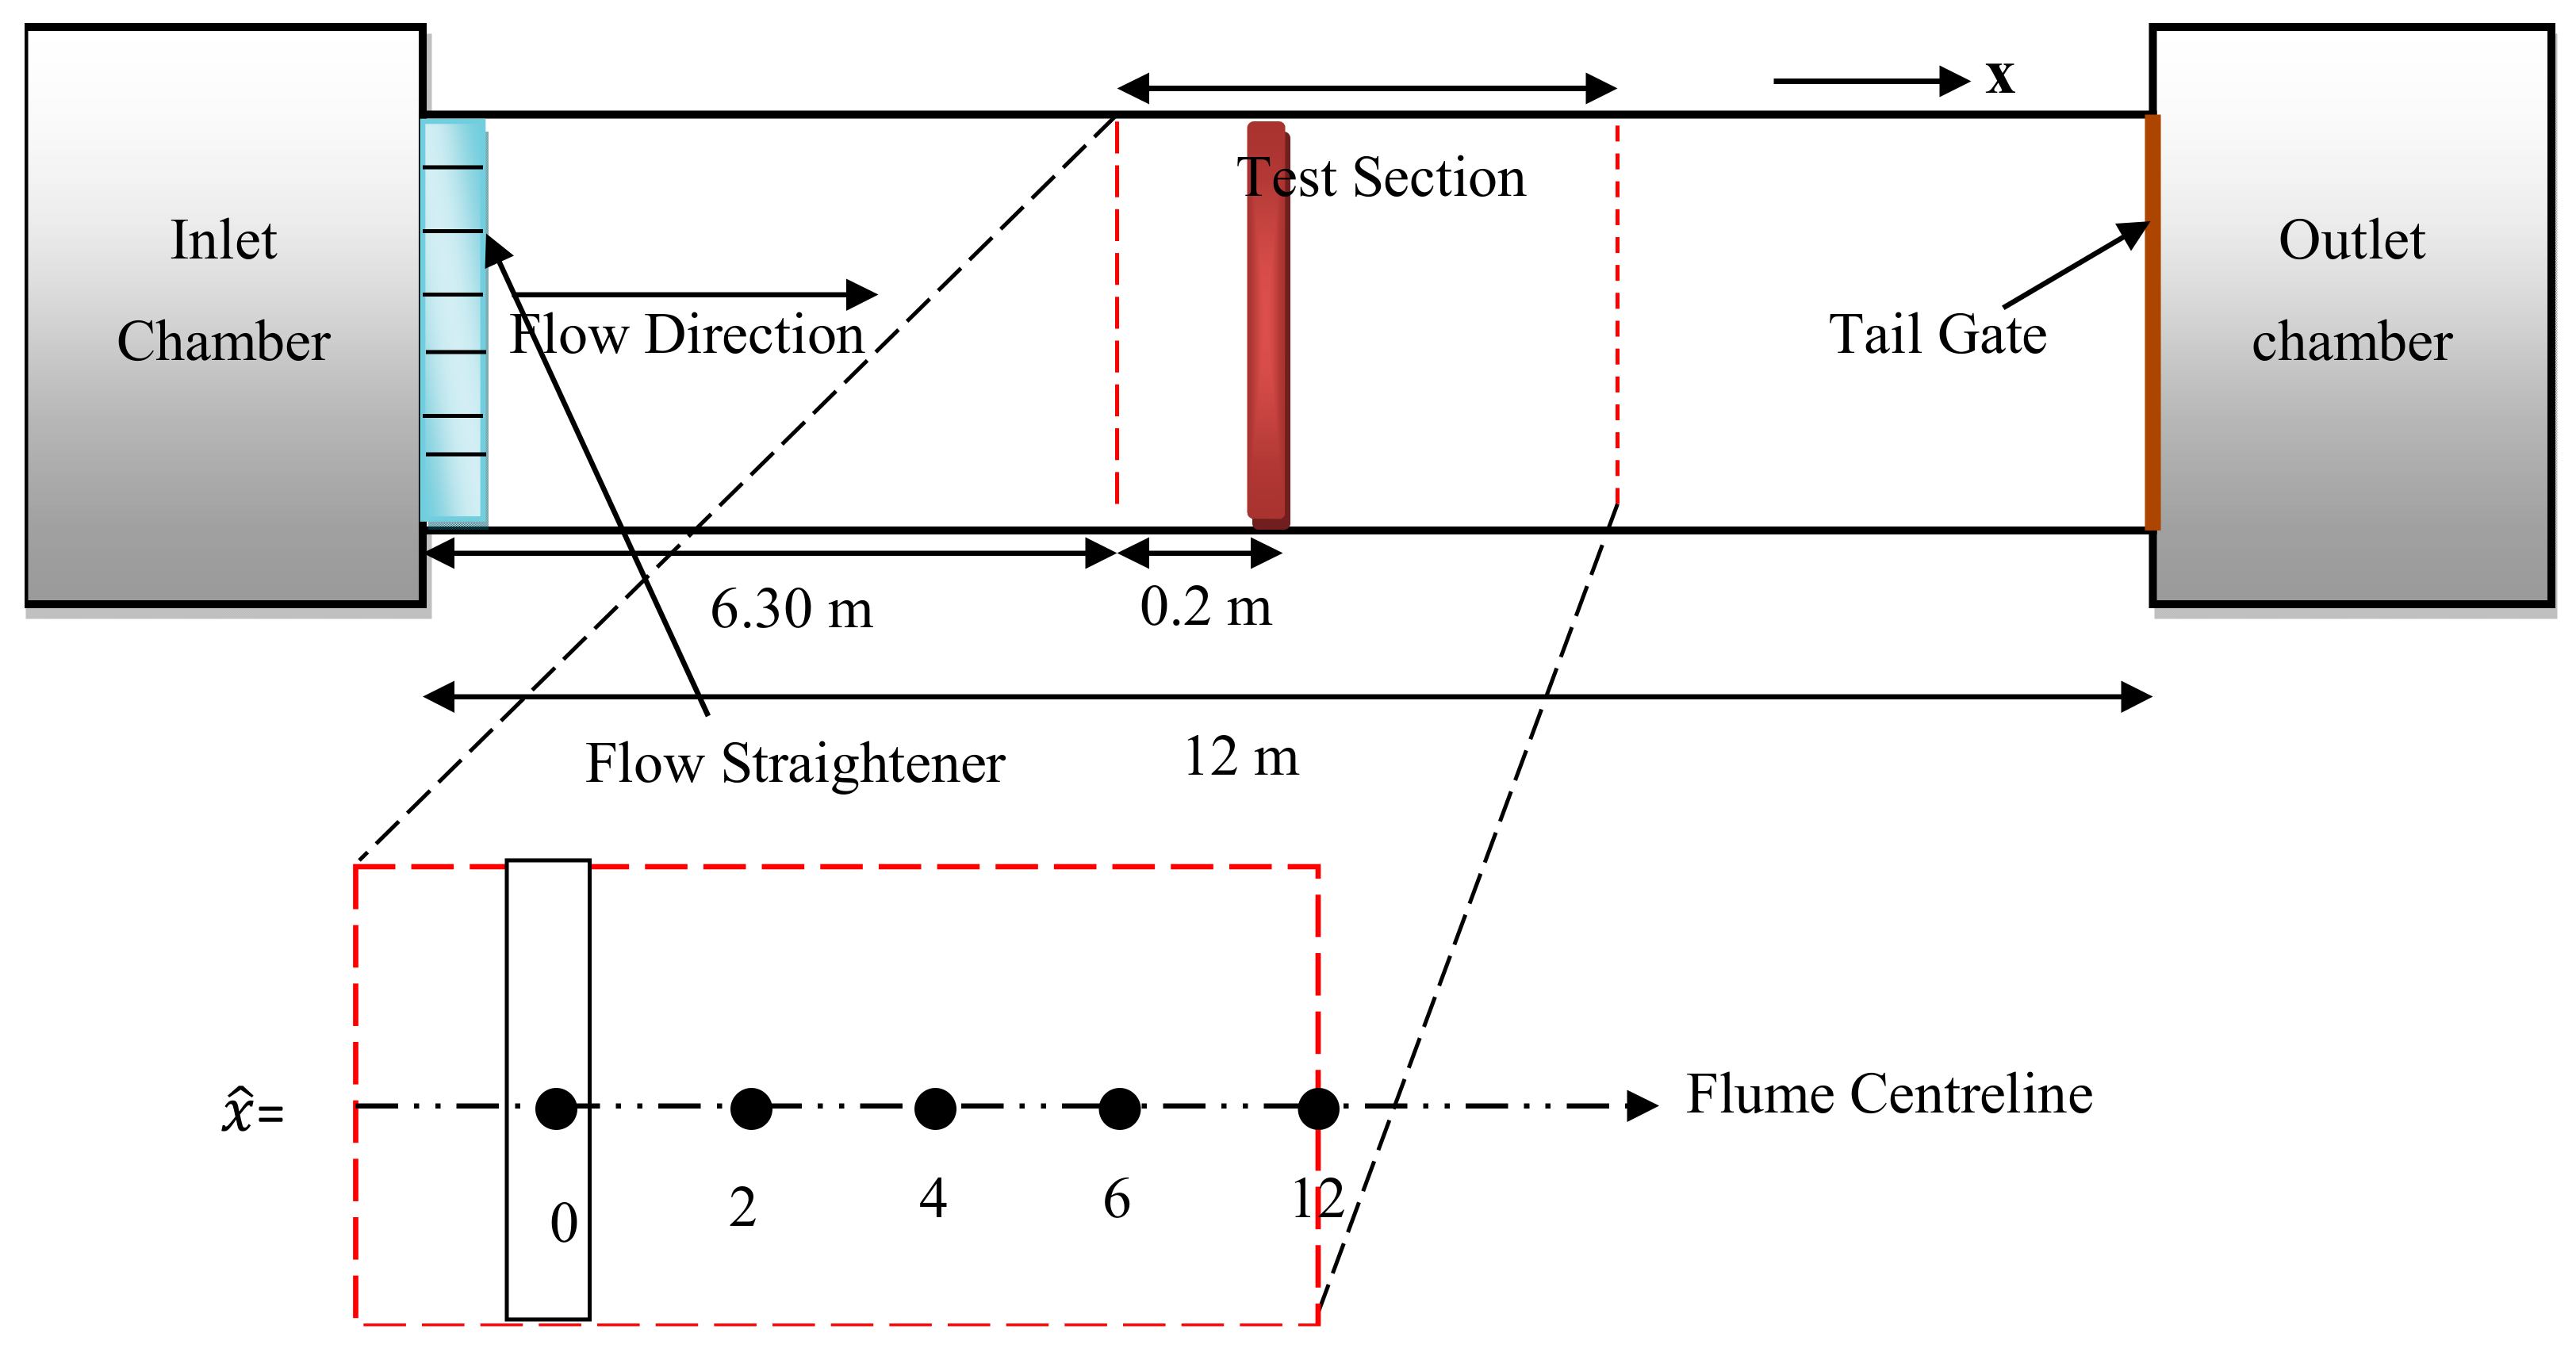
2. Experimental Procedure and Methodology
3. Theoretical Background
3.1. Probability Function for Velocity Fluctuation
3.2. Quadrant Analysis
4. Results and Discussion
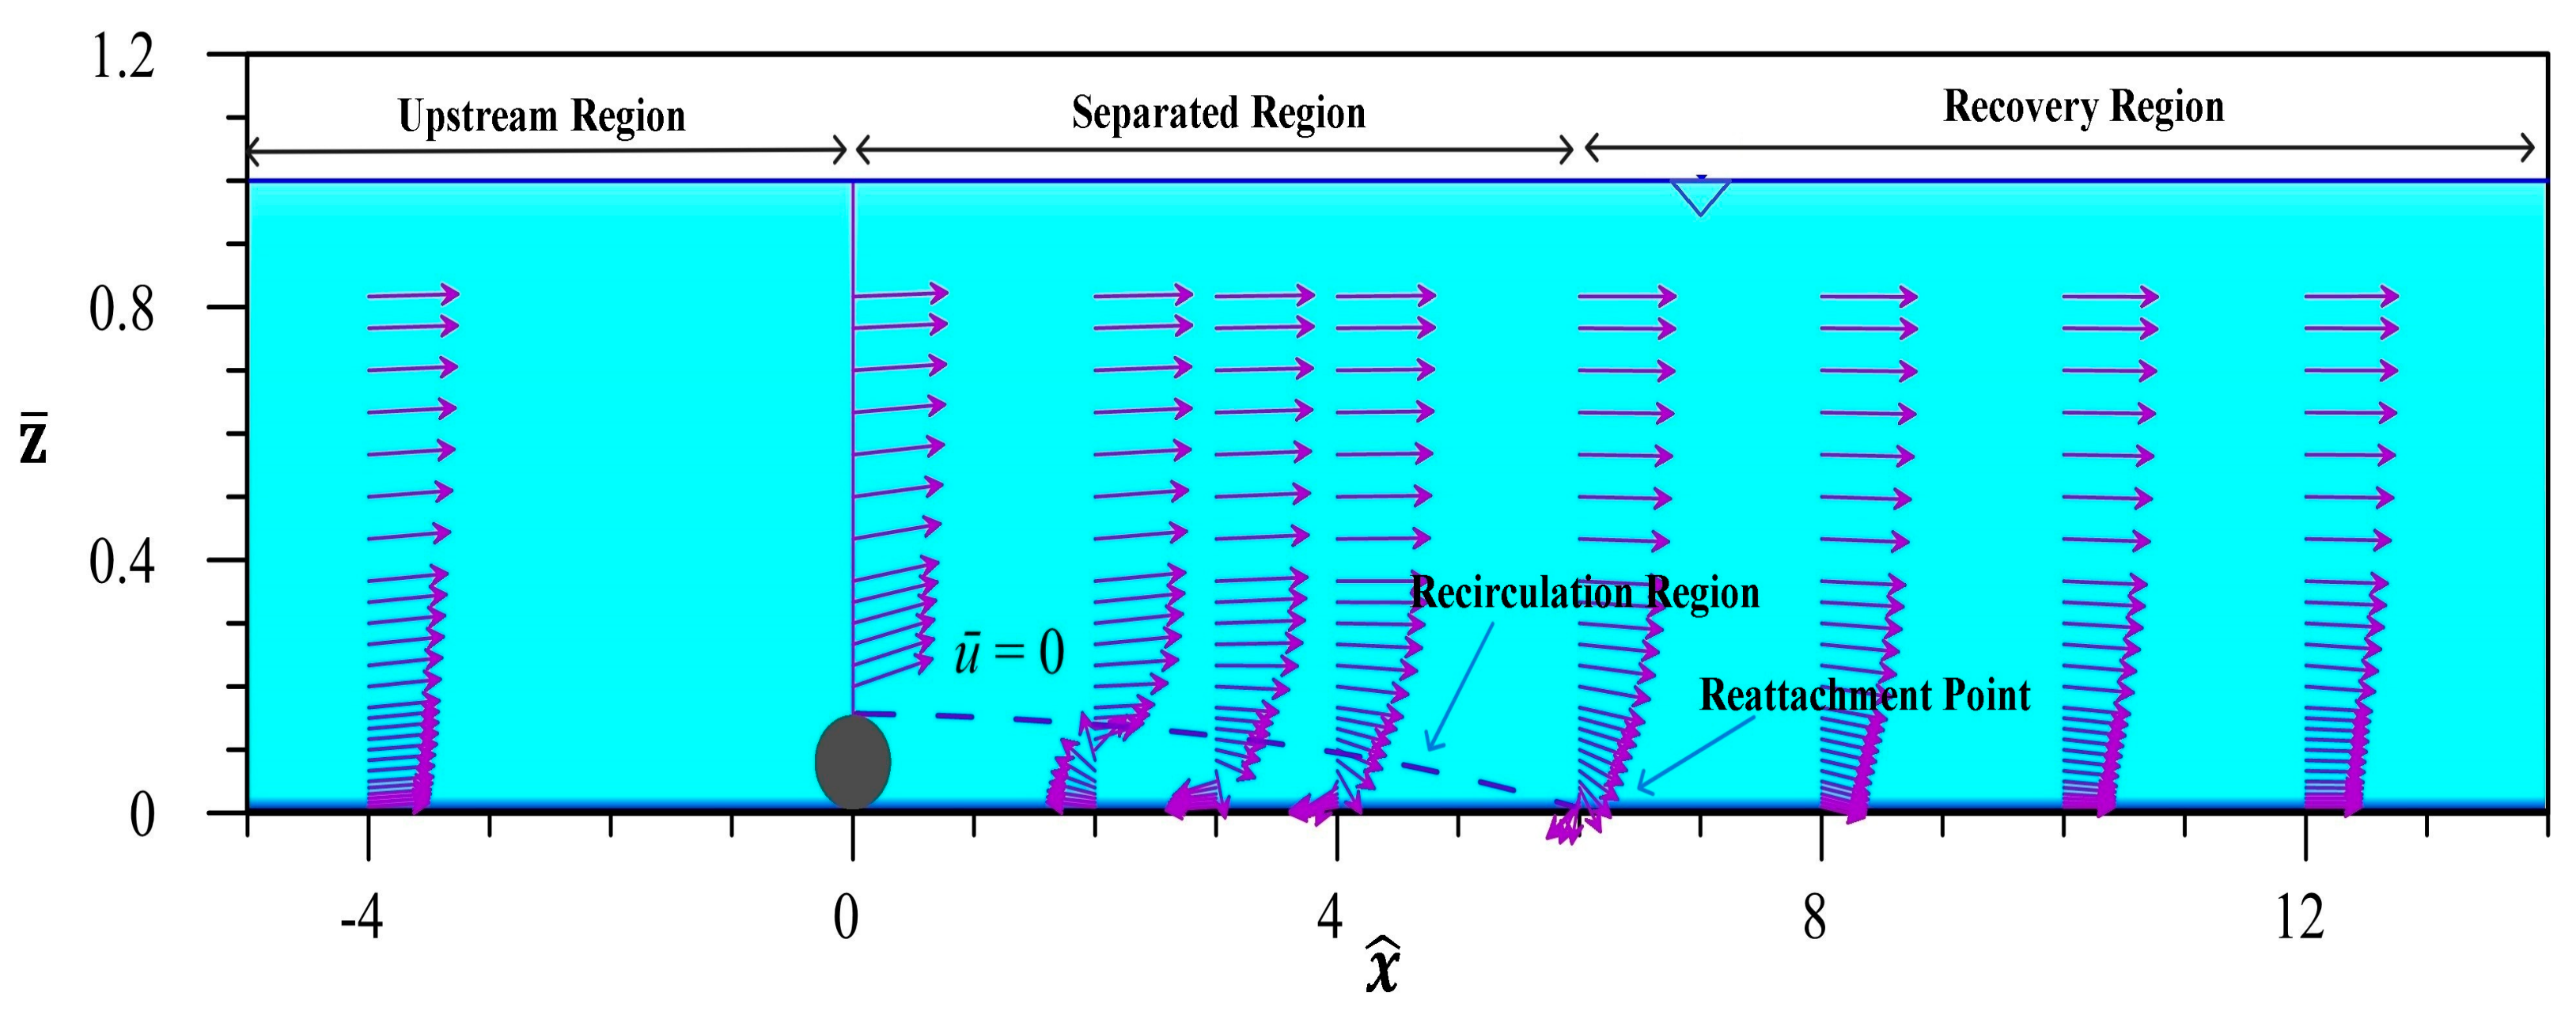
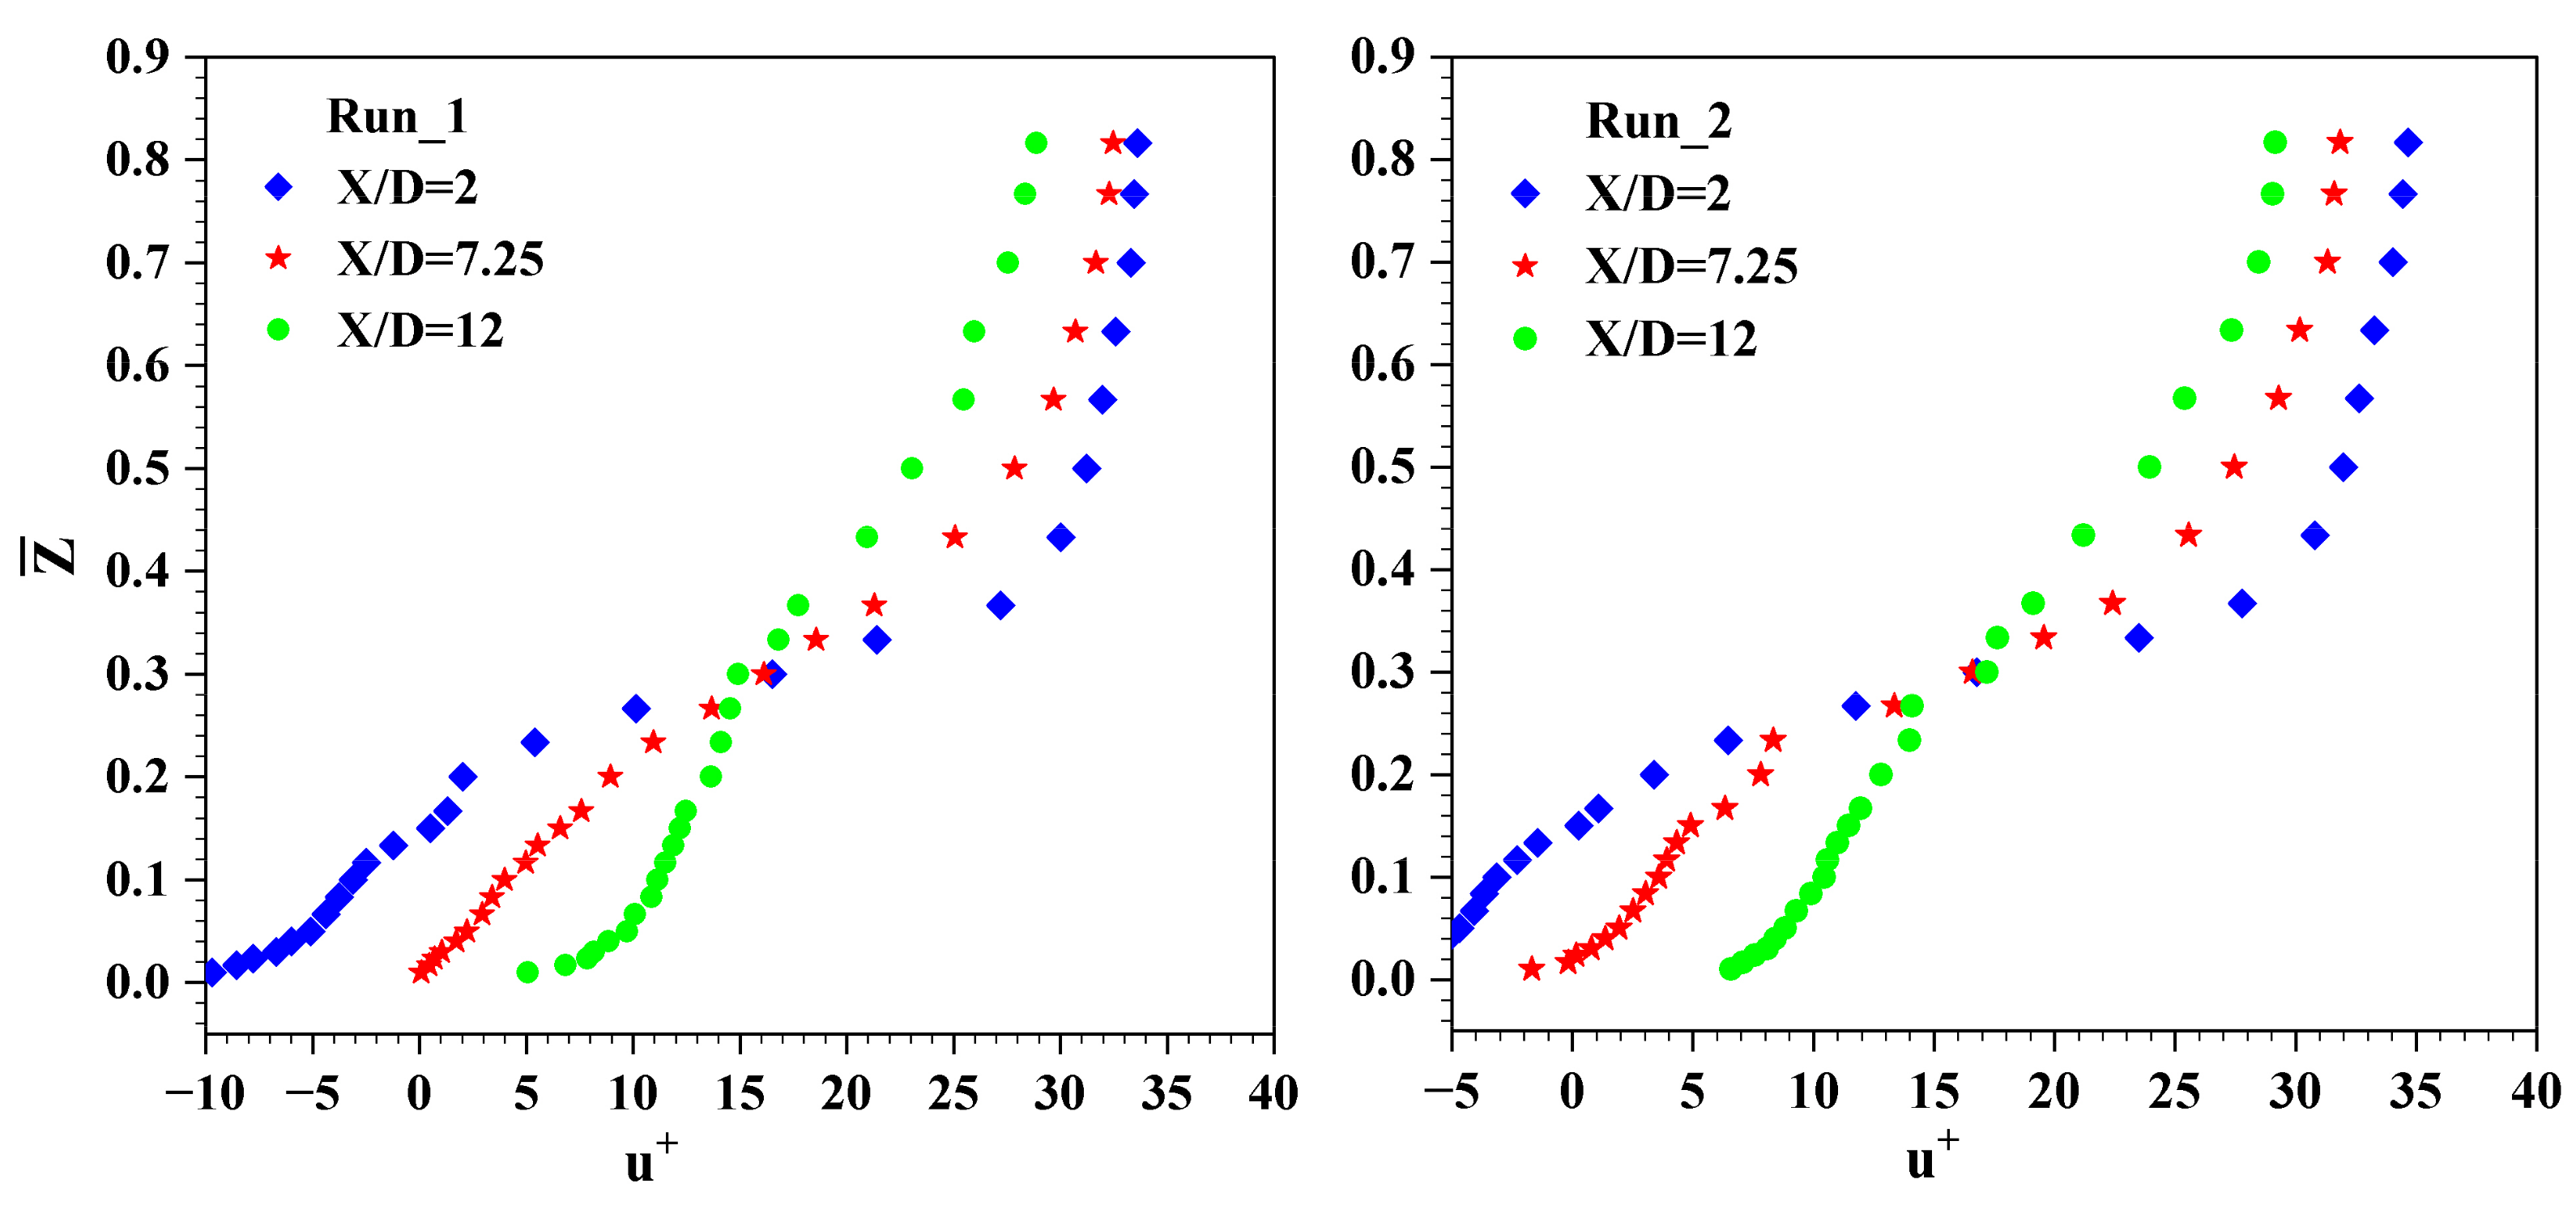
4.1. Mean Velocity
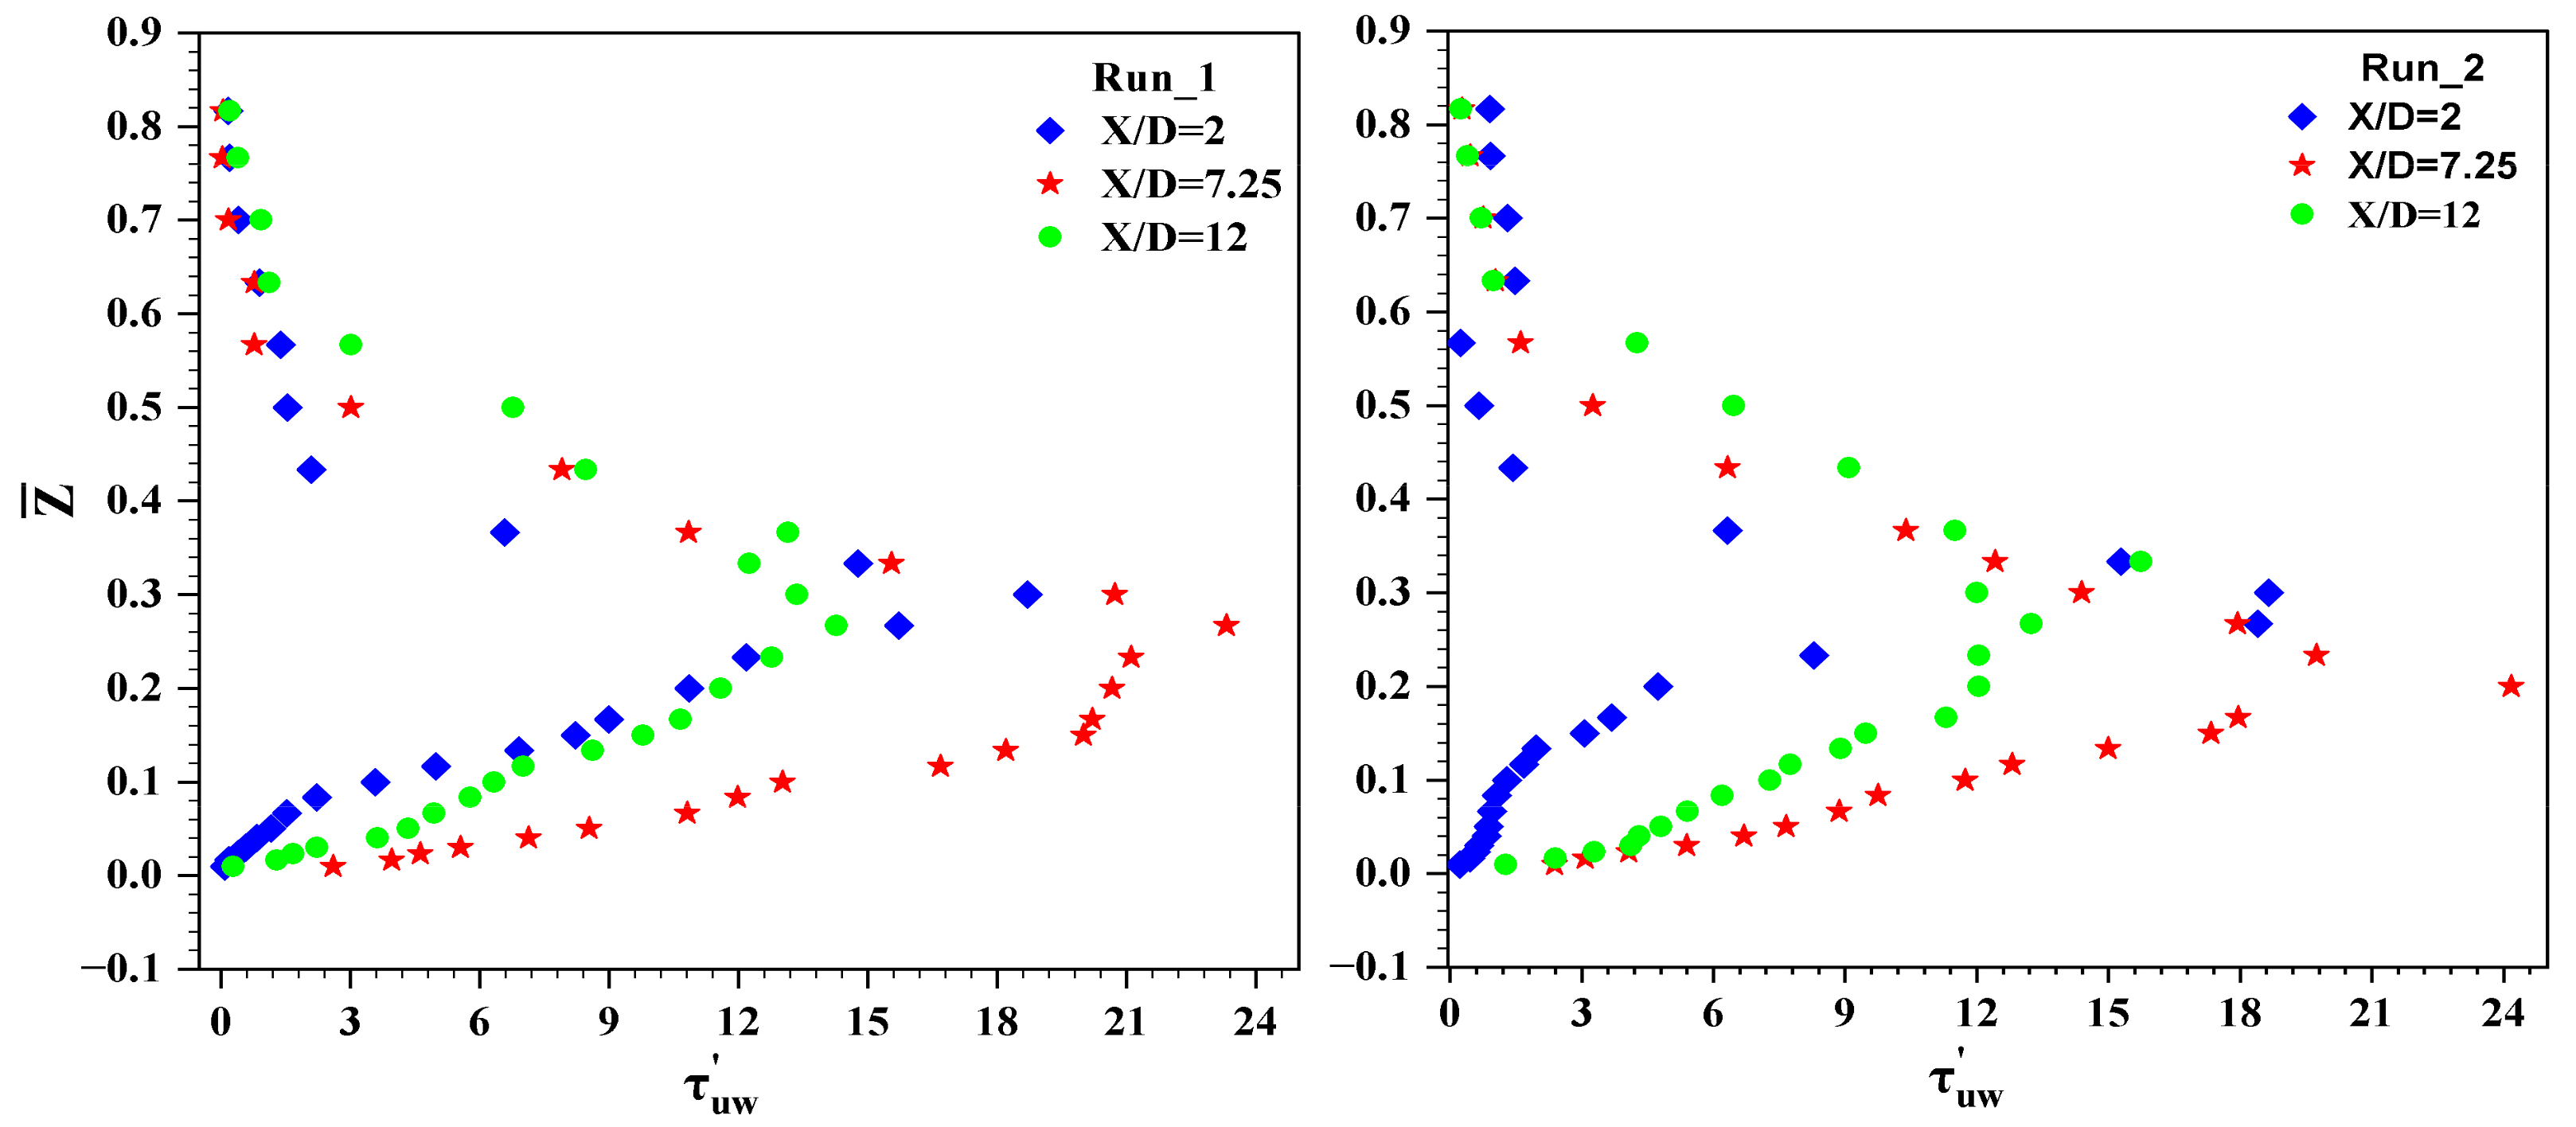
4.2. Reynolds Shear Stress (RSS)
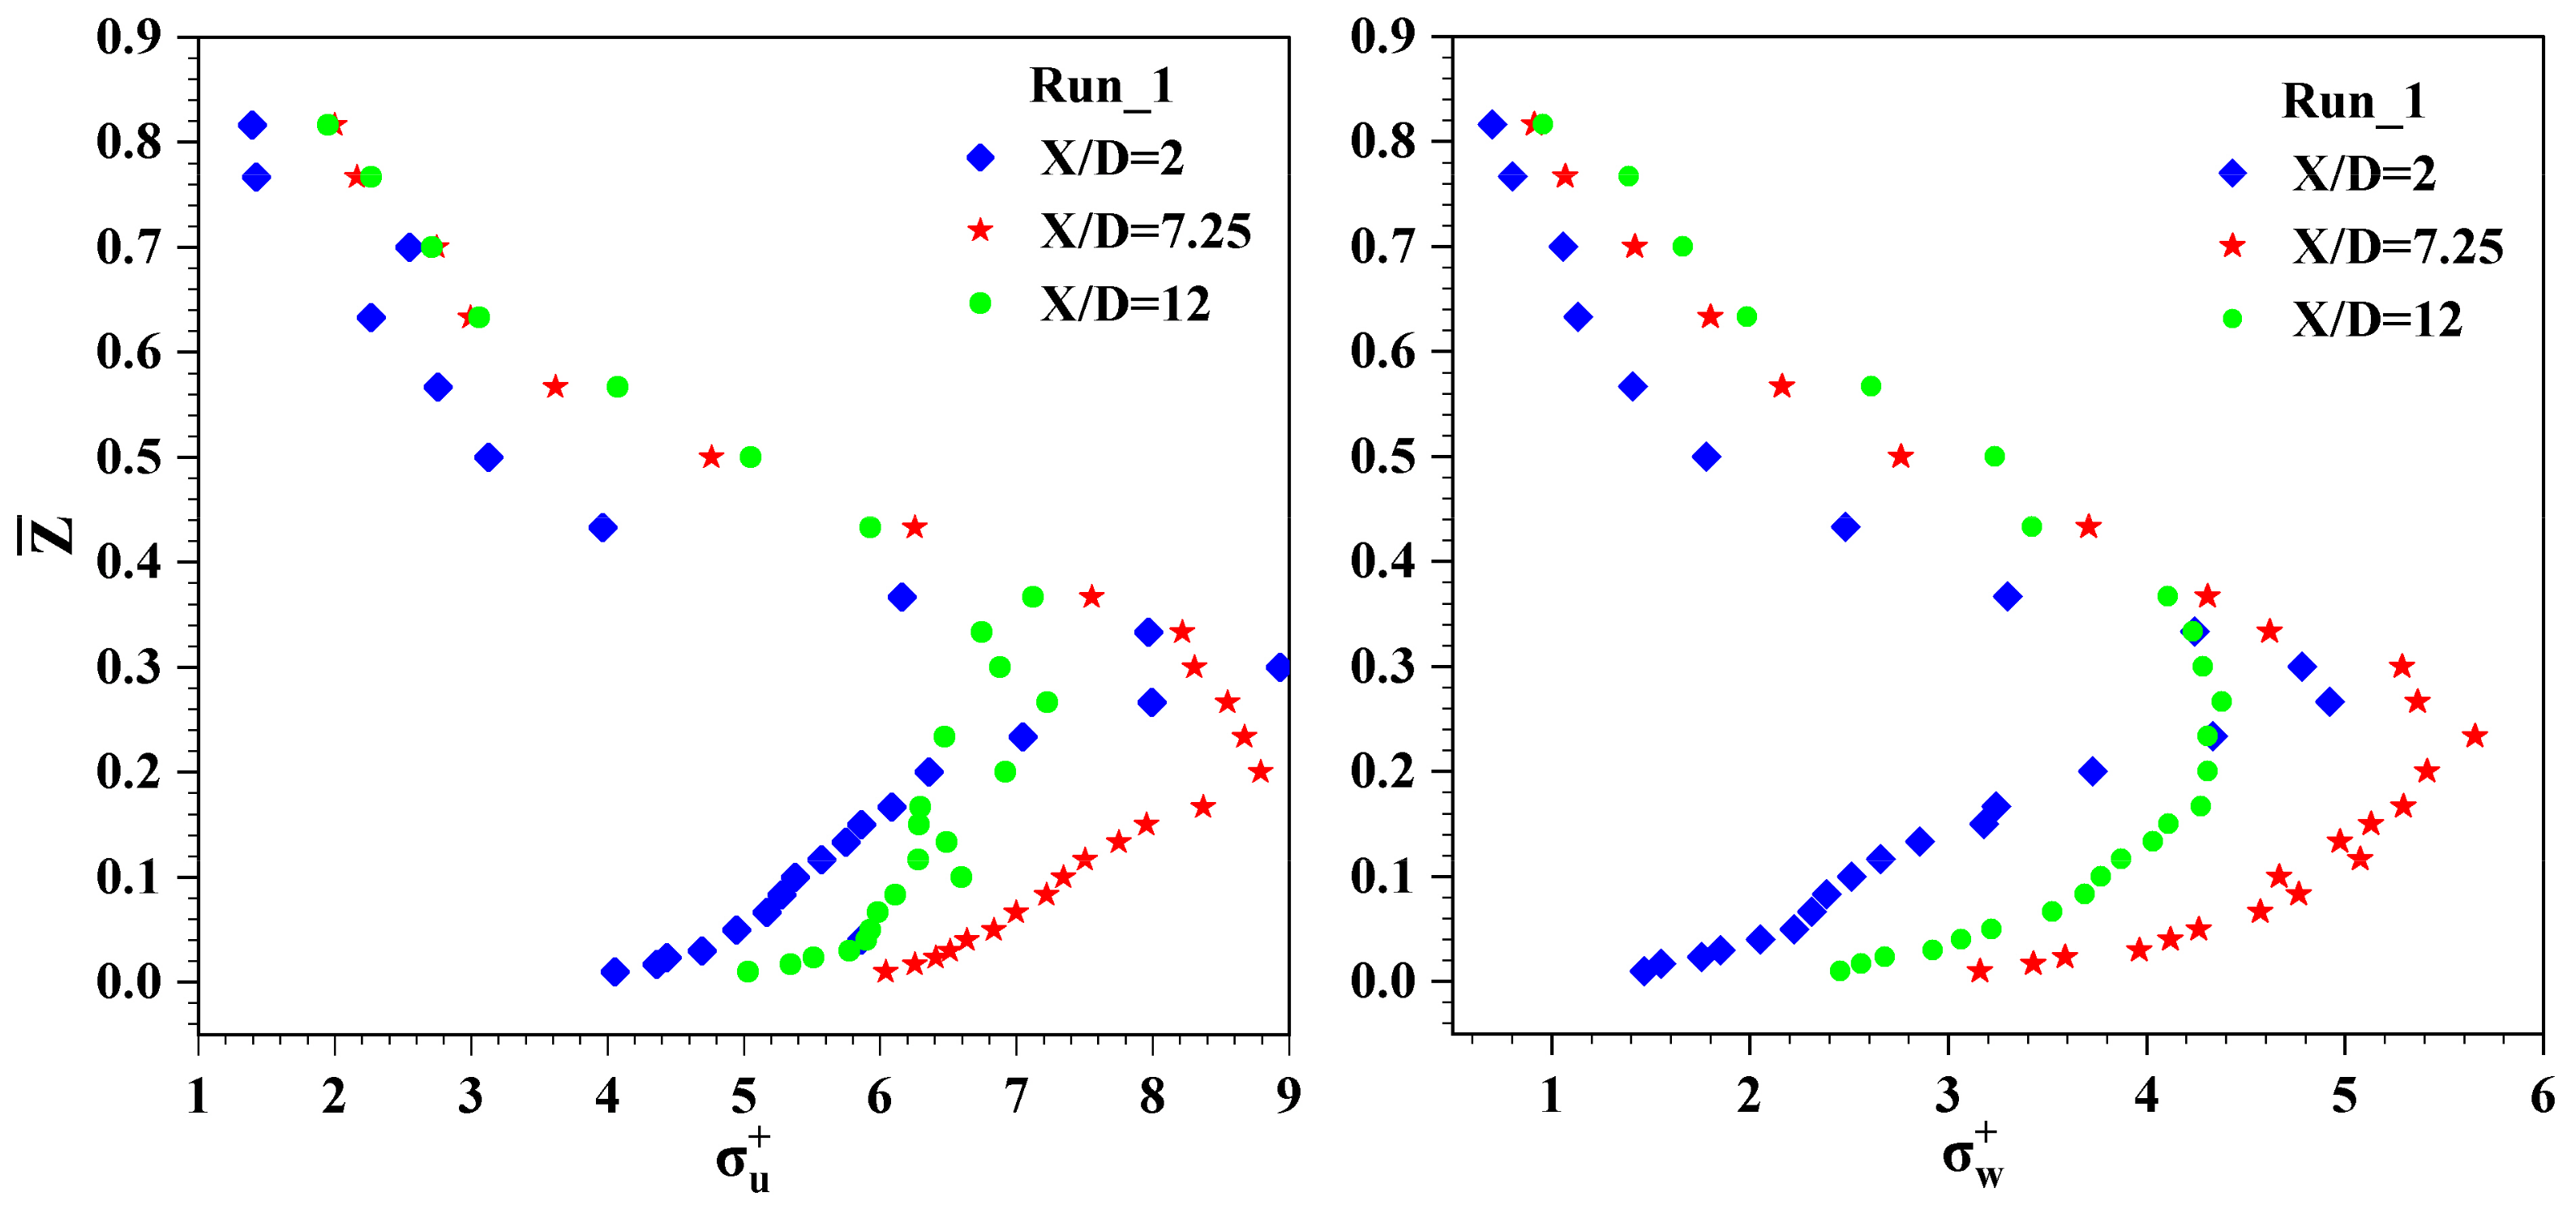
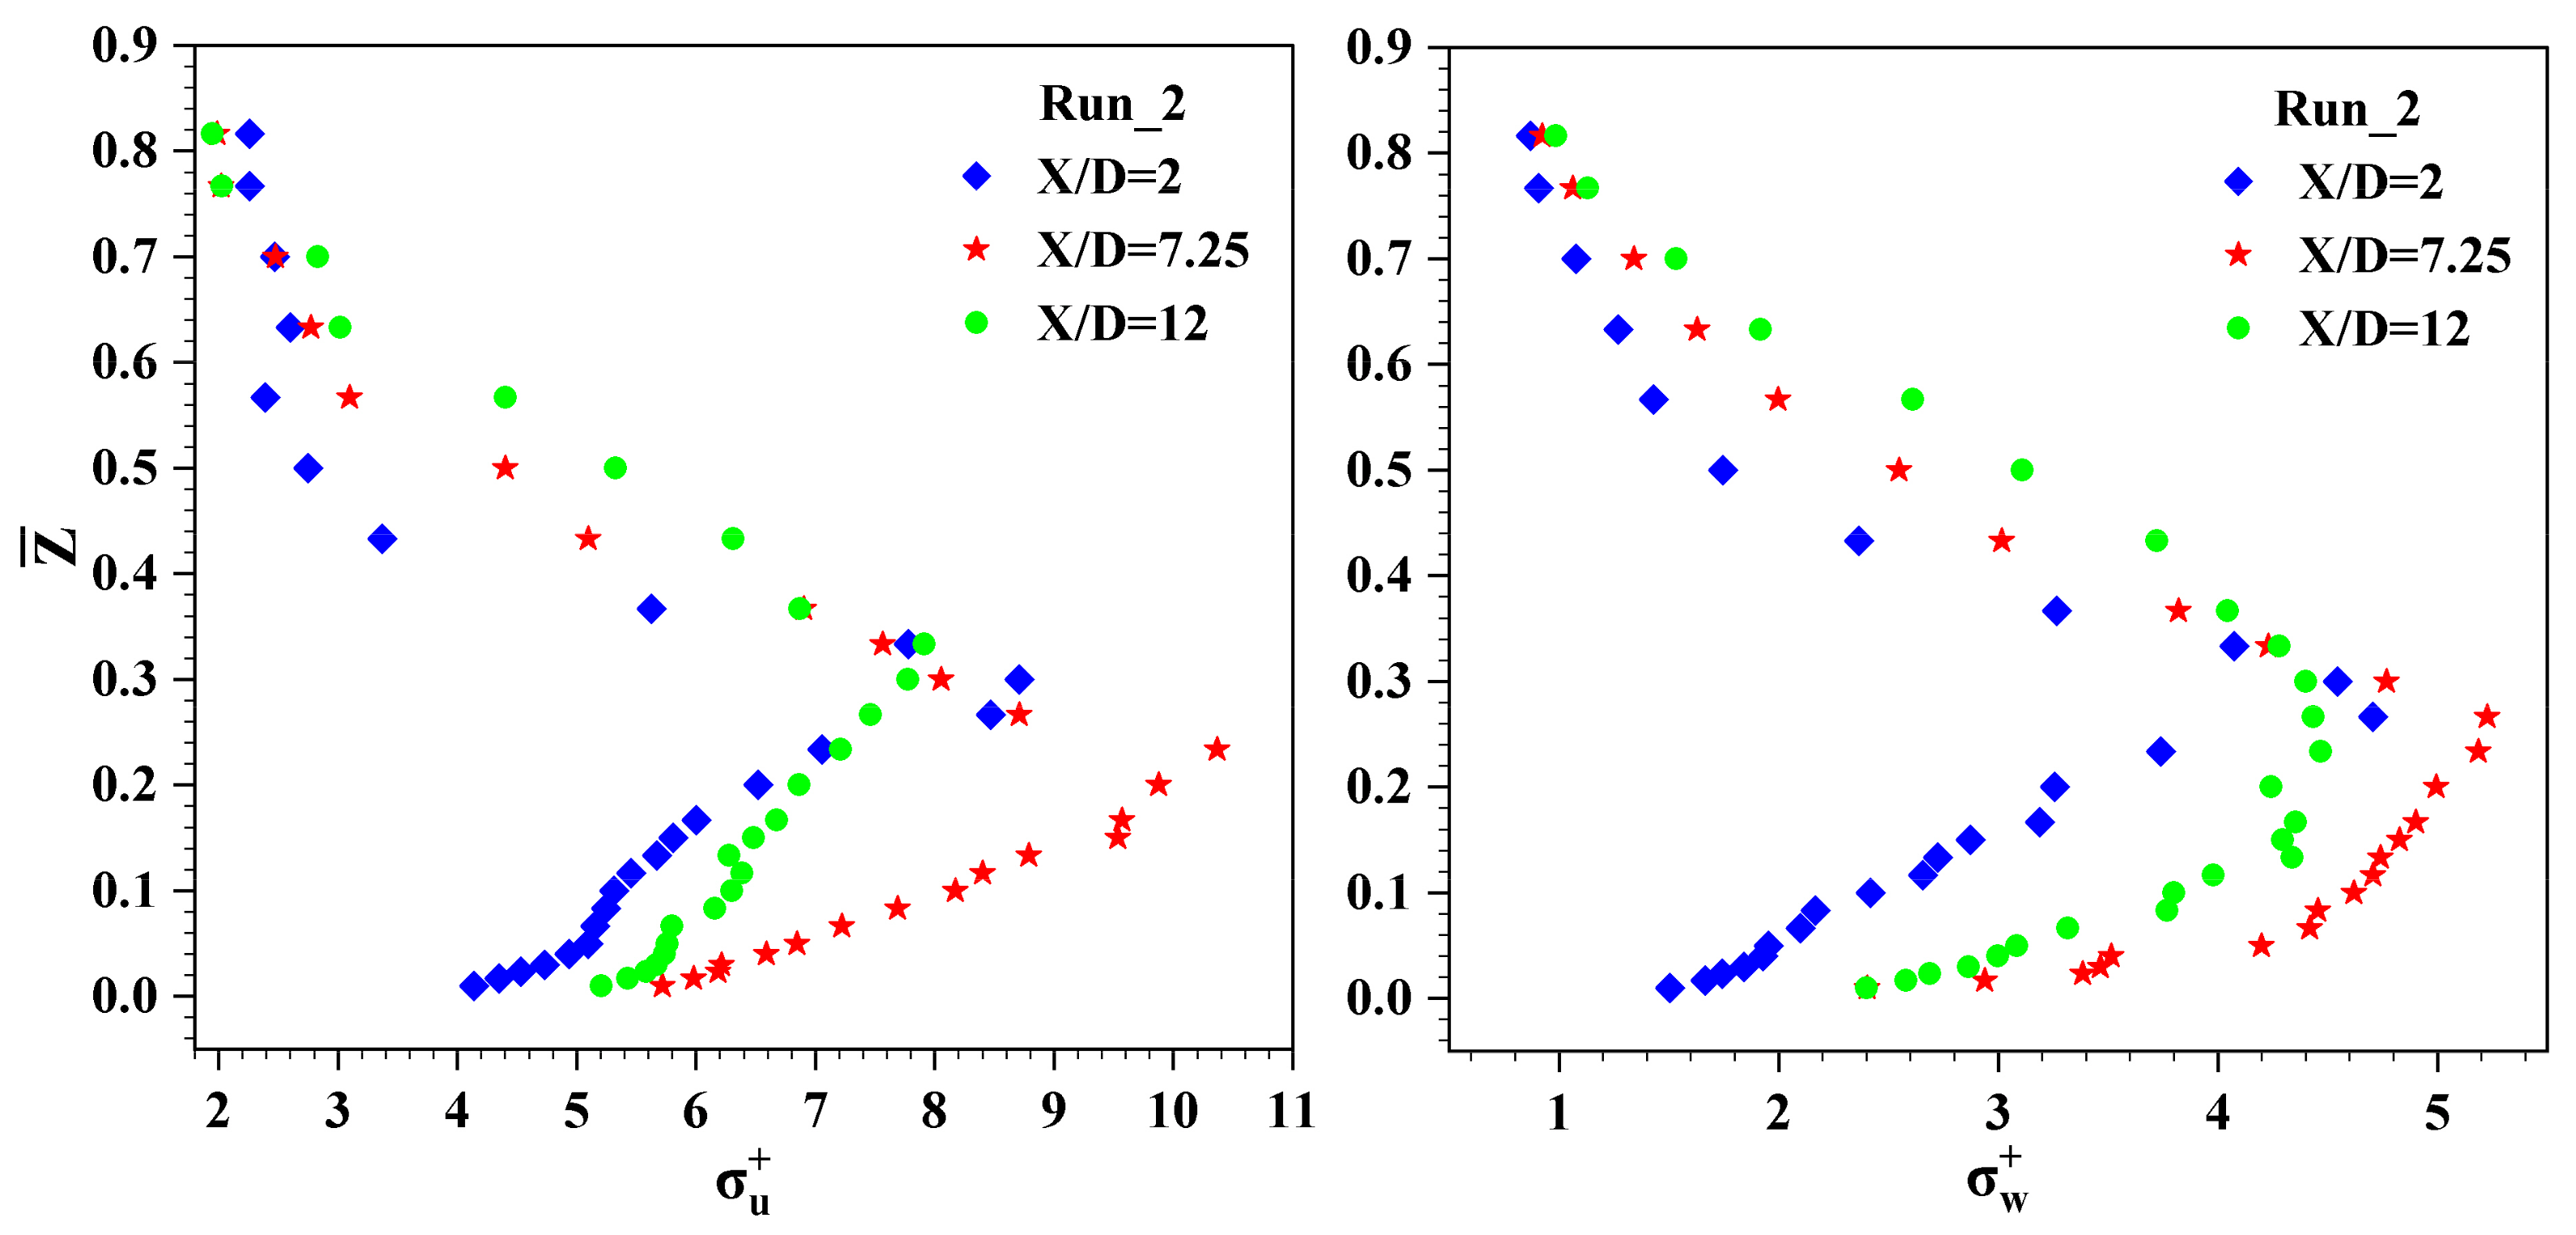
4.3. Turbulence Intensity
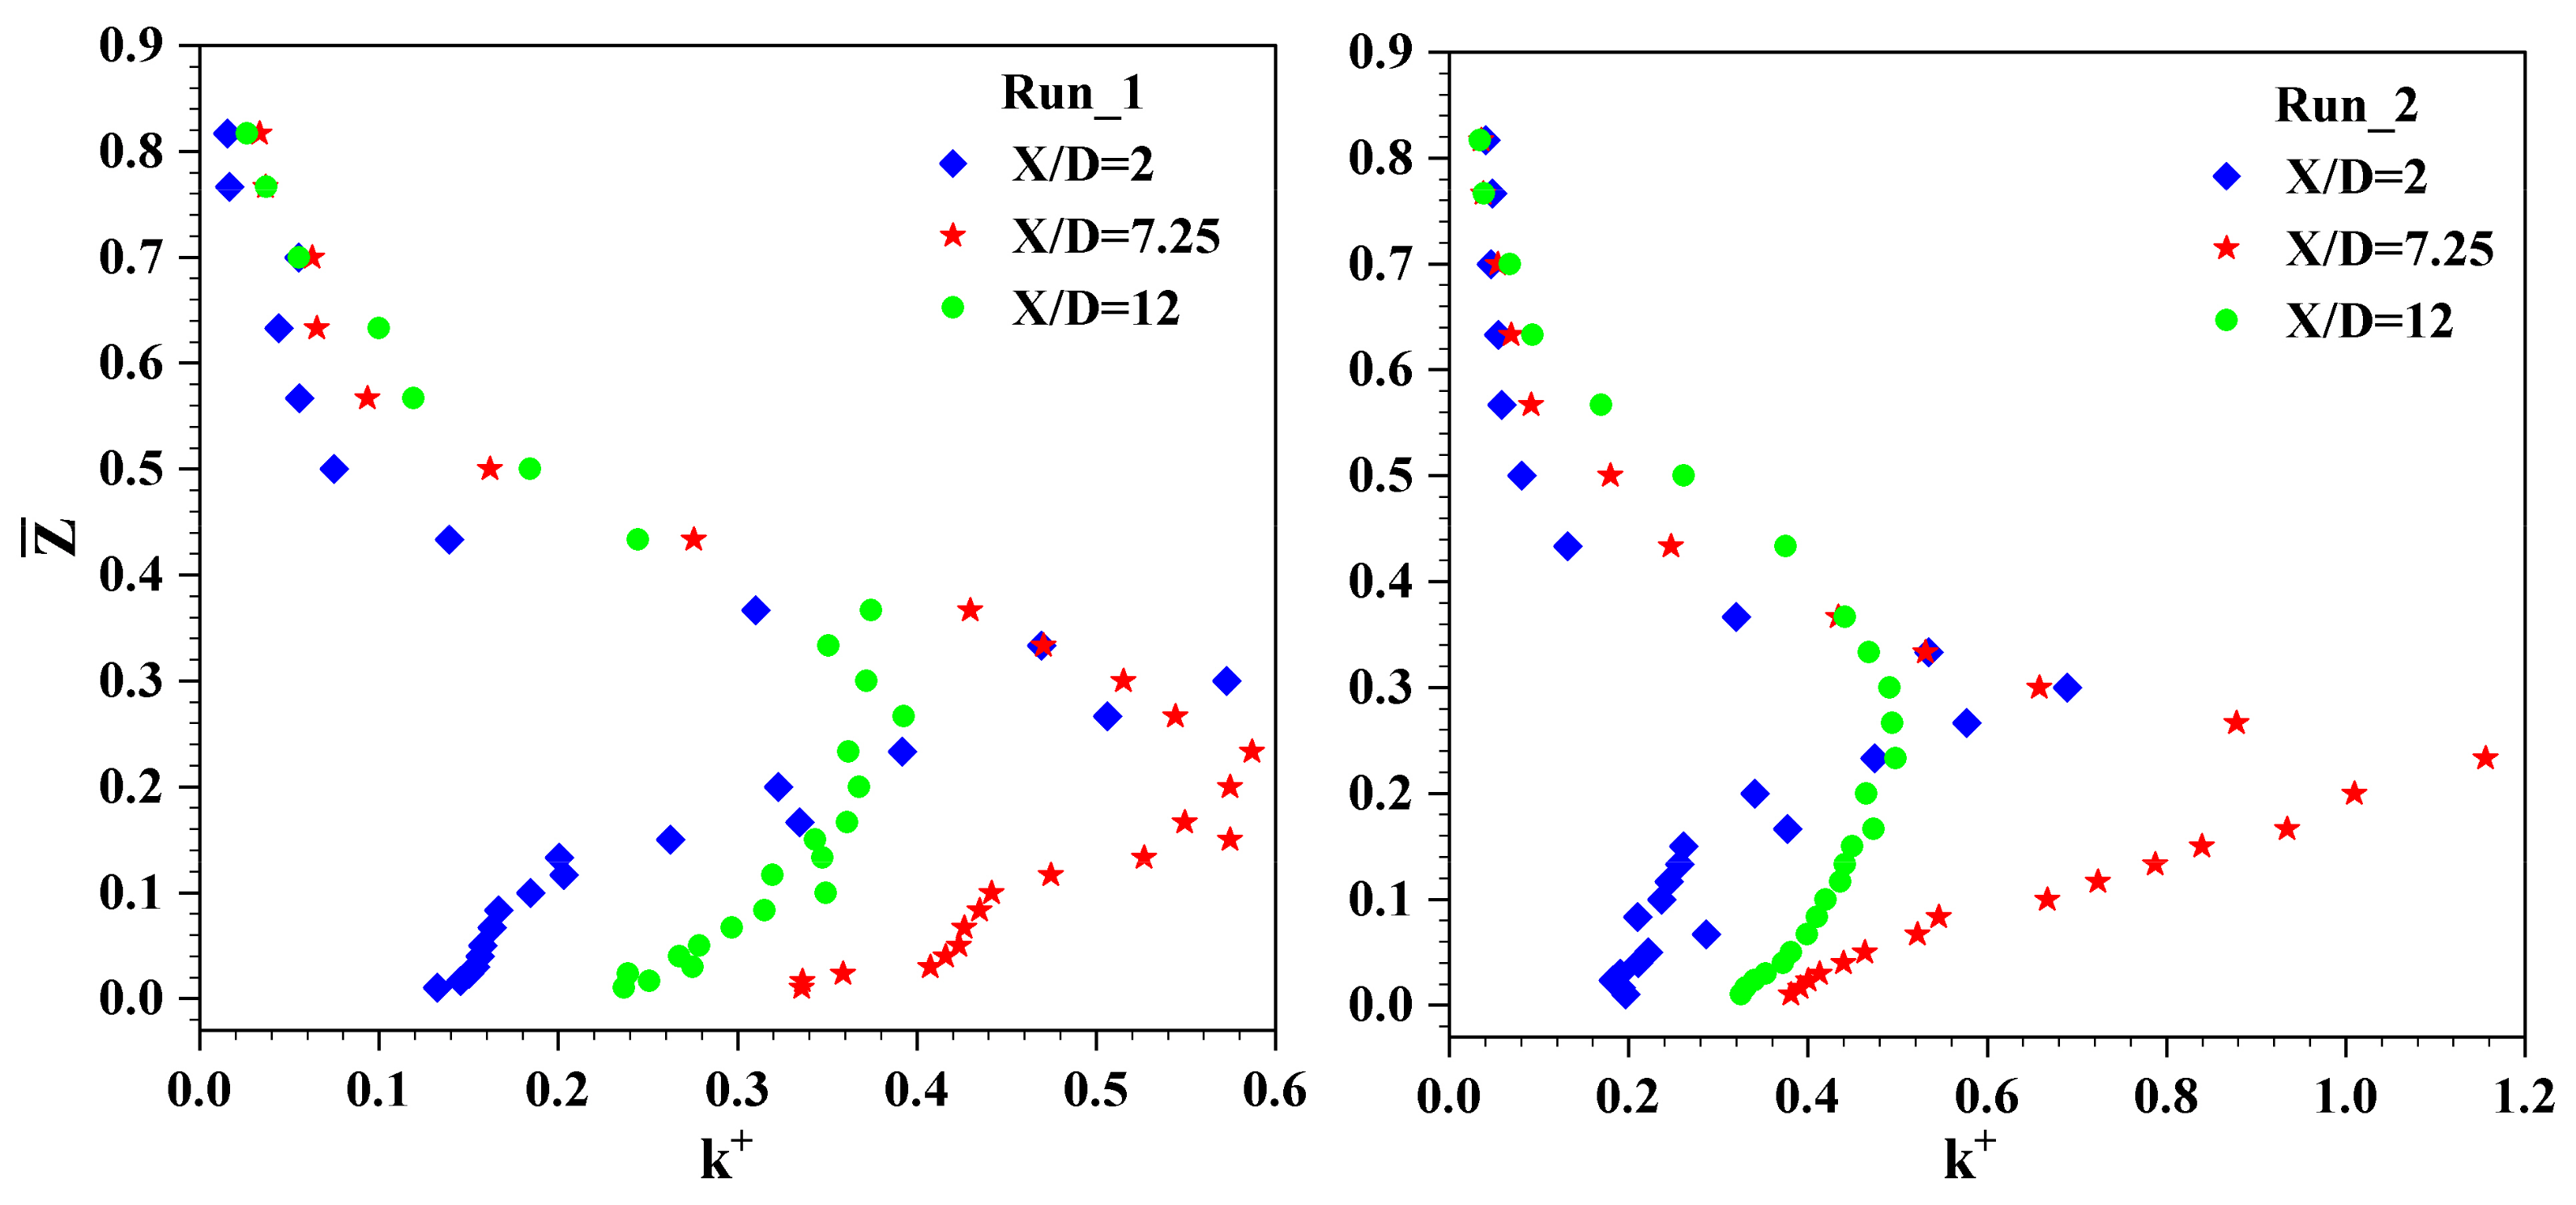
4.4. Turbulent Kinetic Energy (TKE)
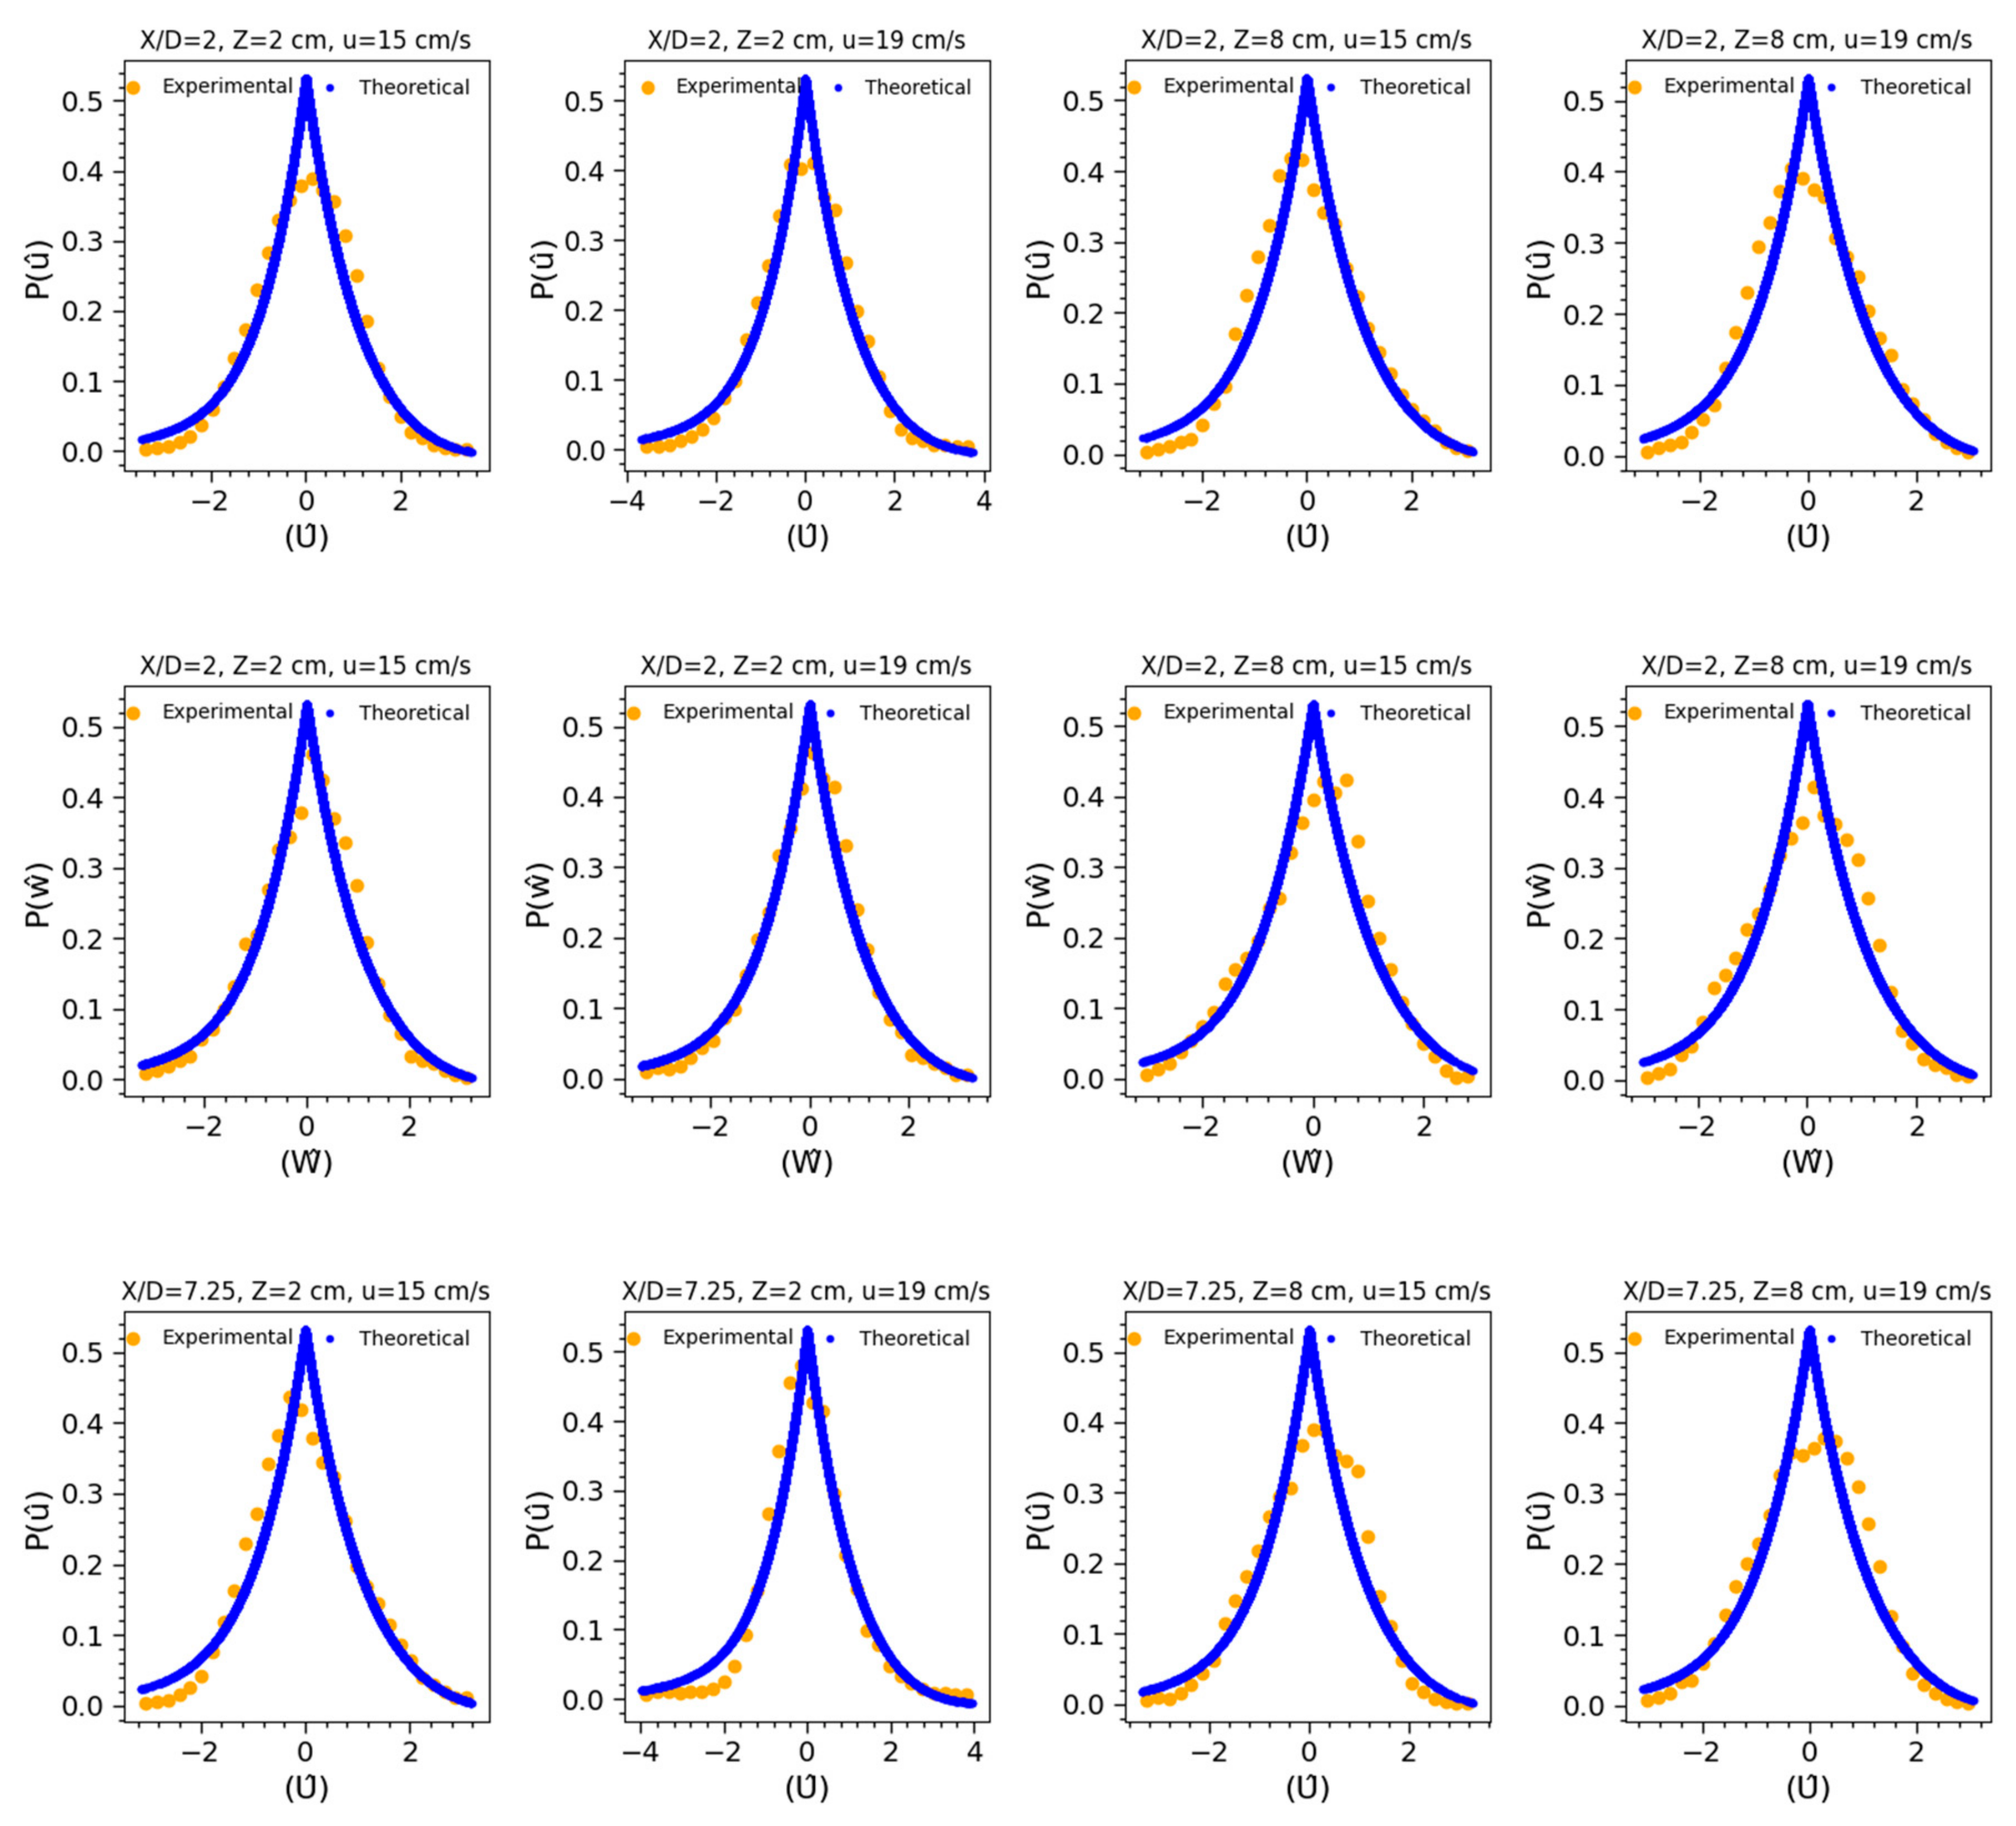
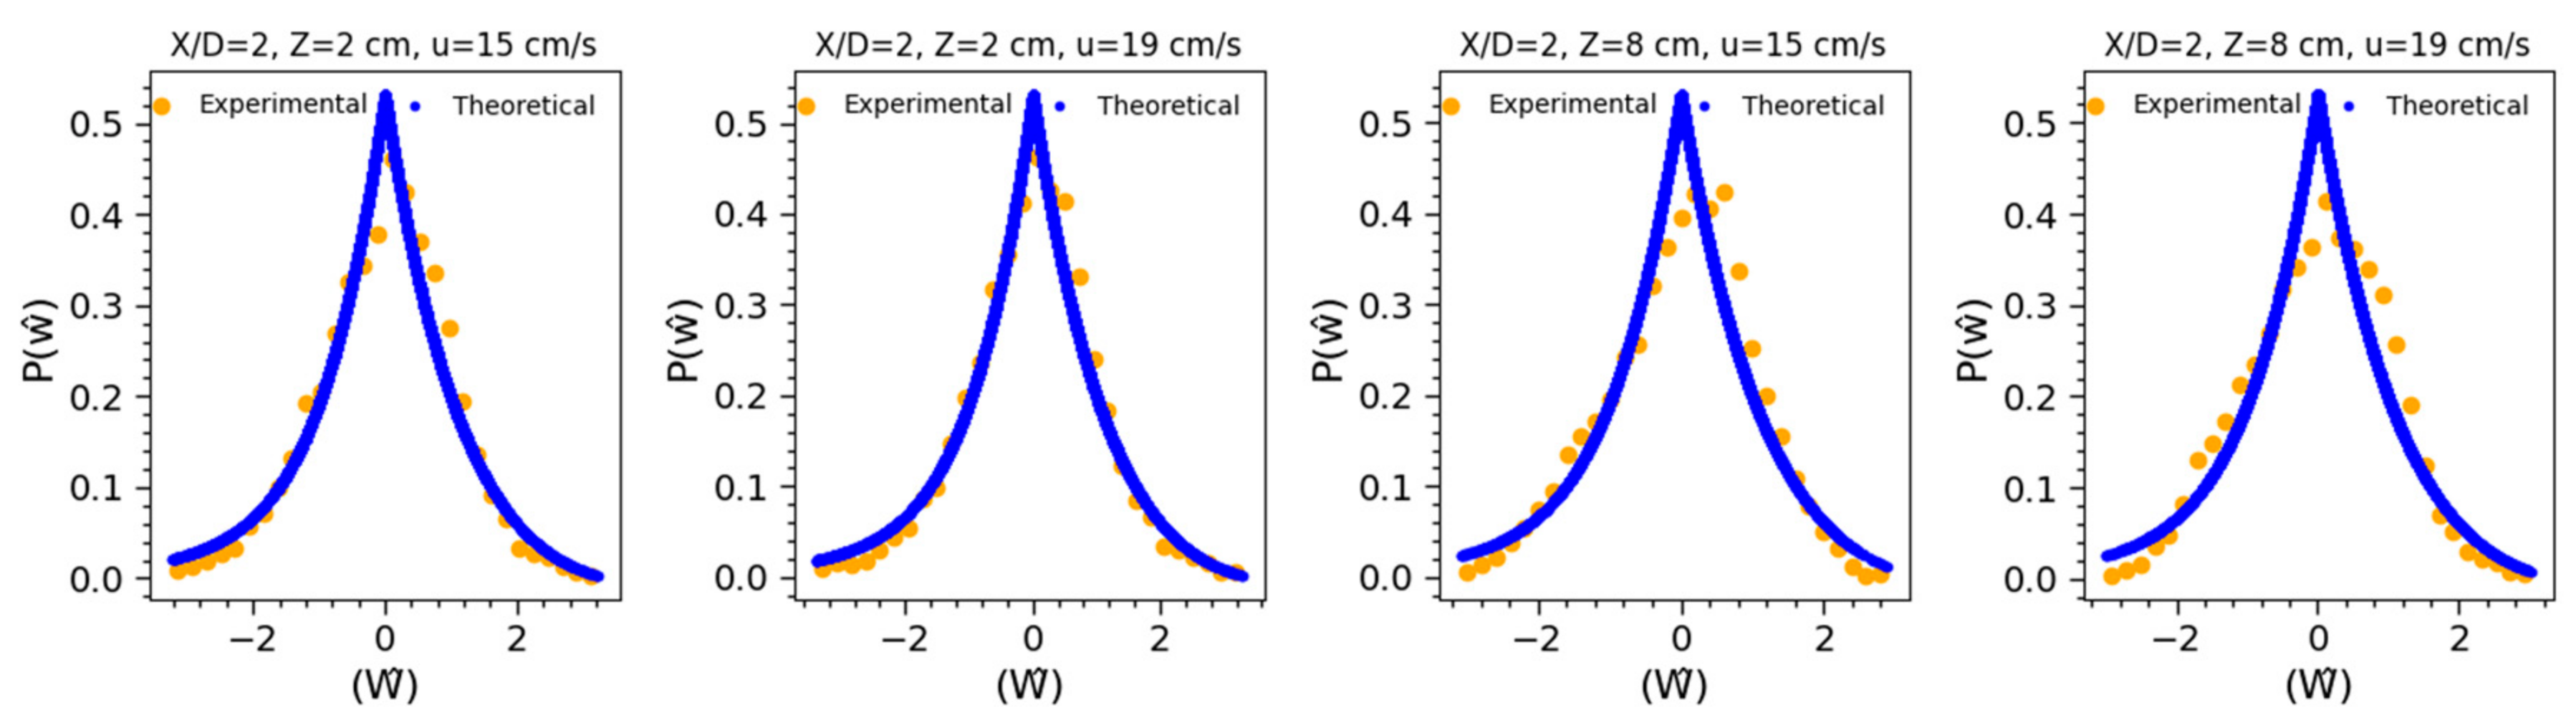
4.5. PDF of Velocity Fluctuations
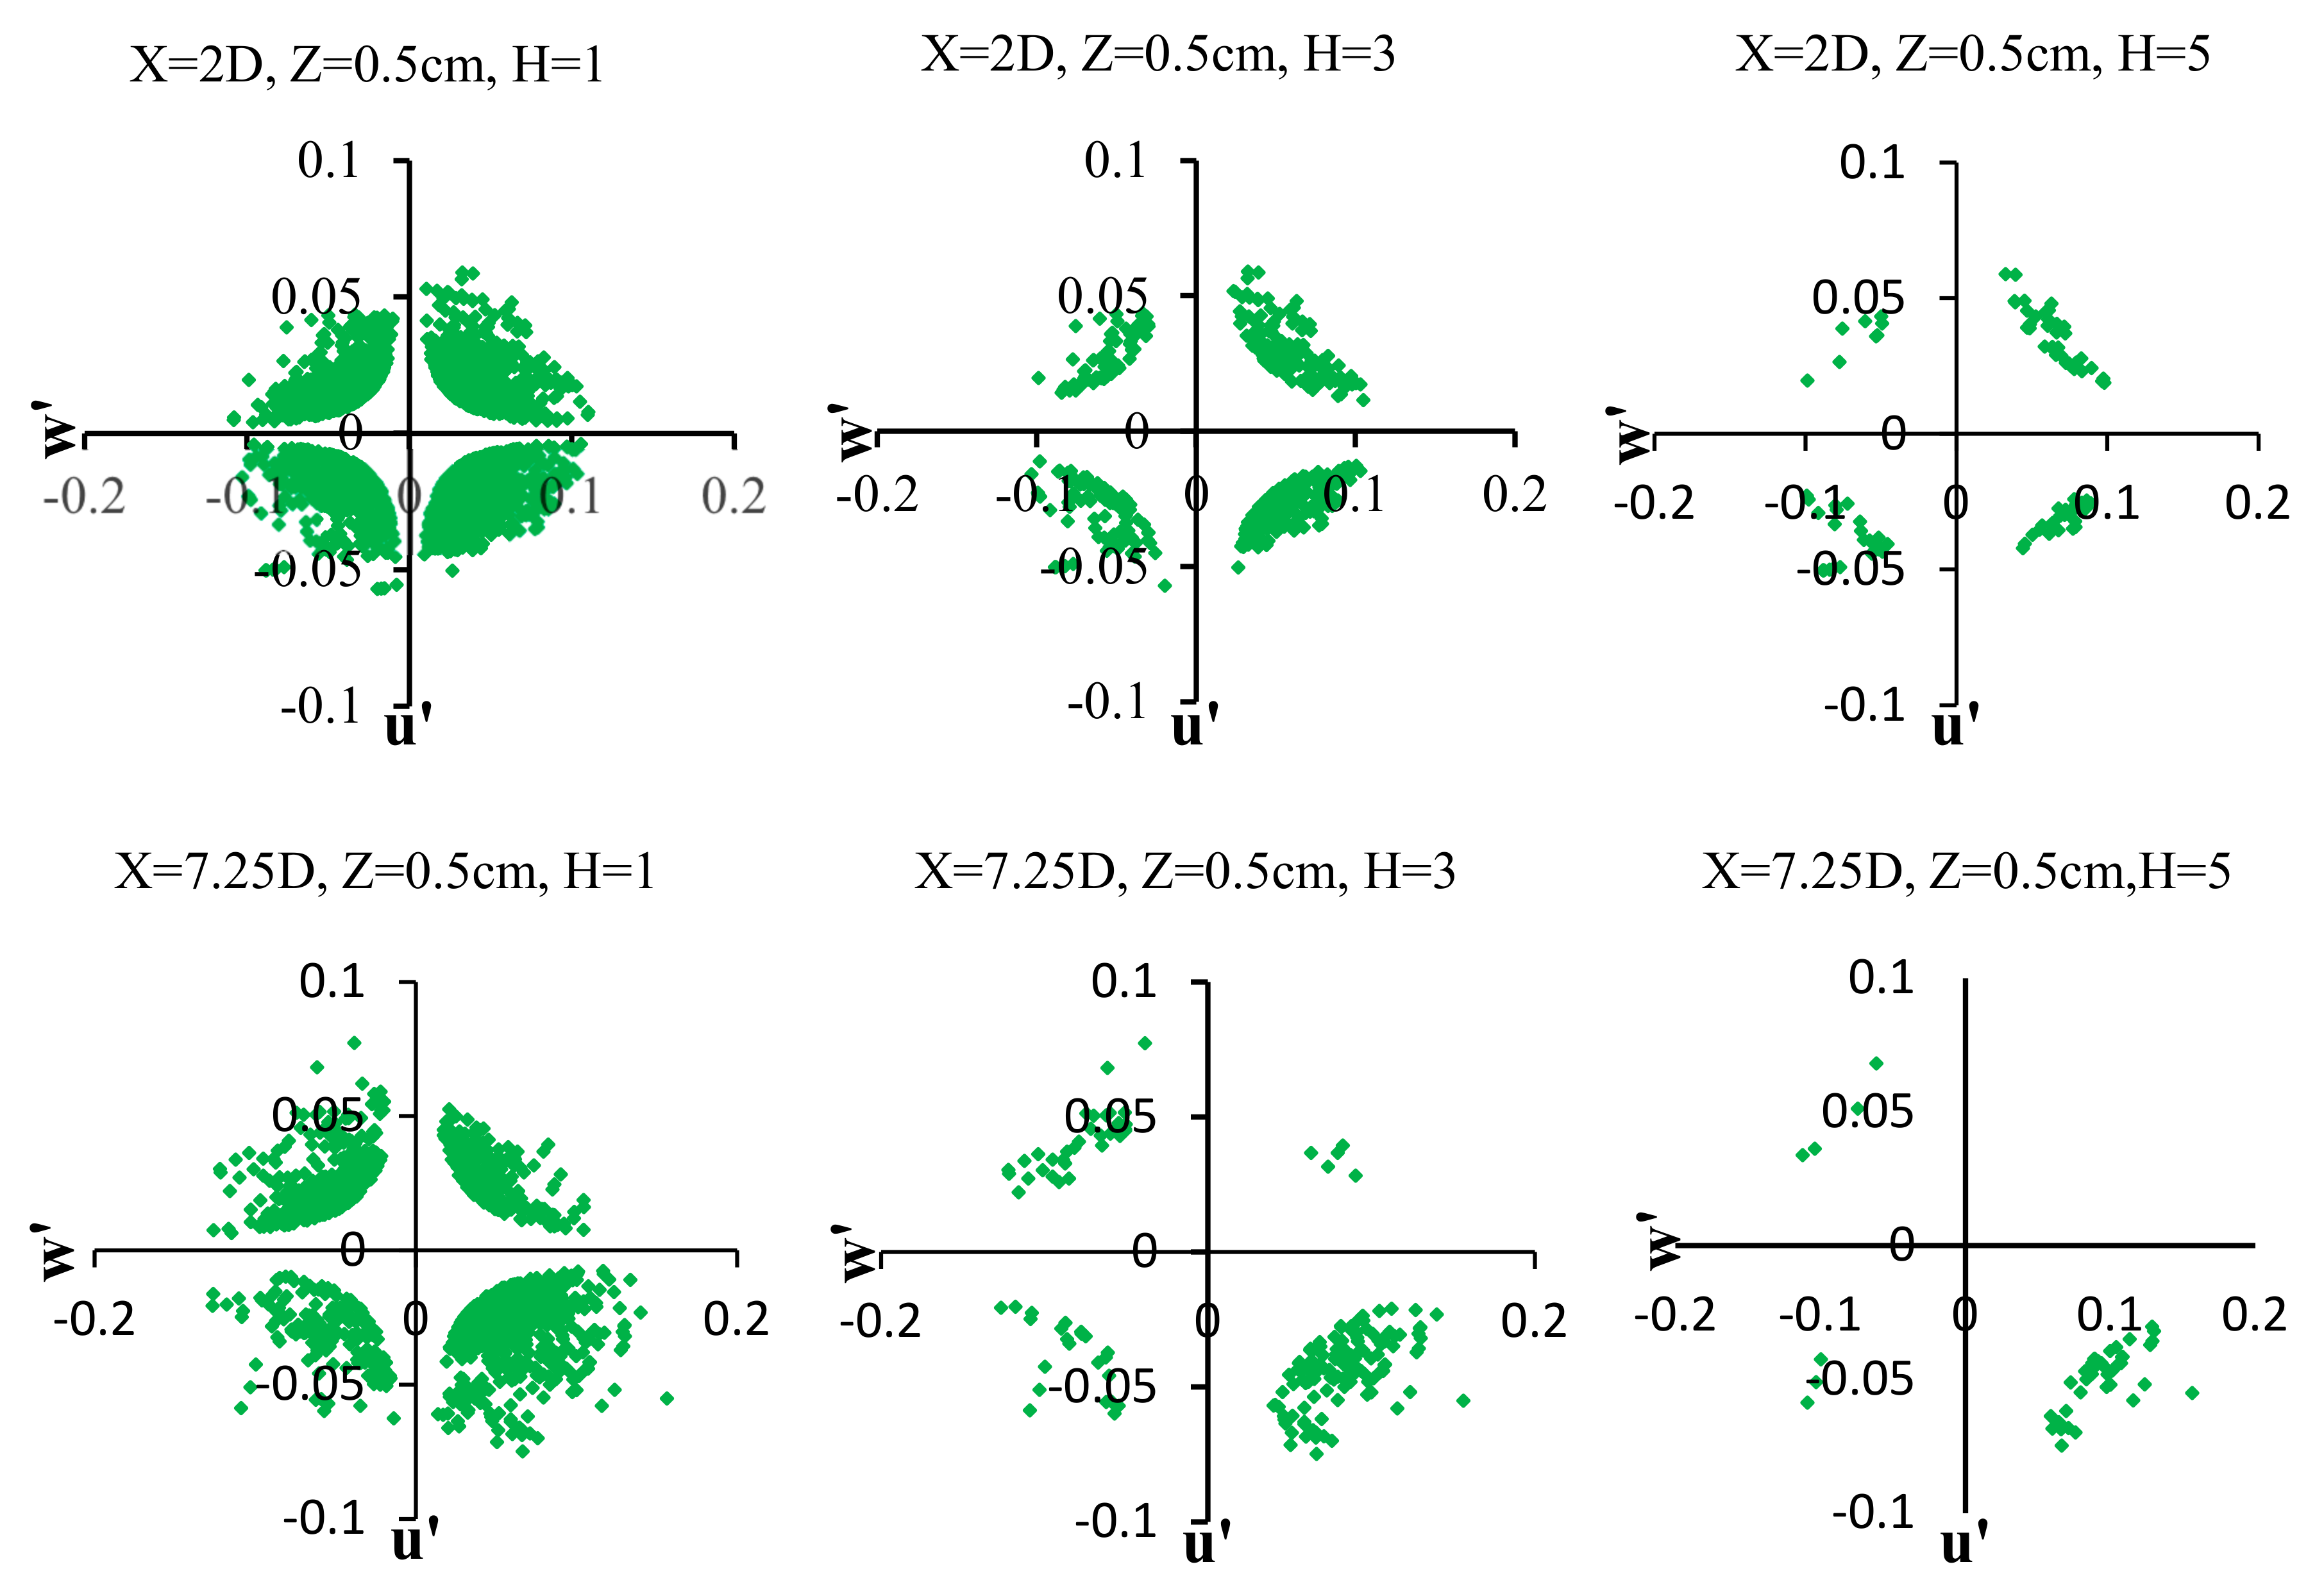
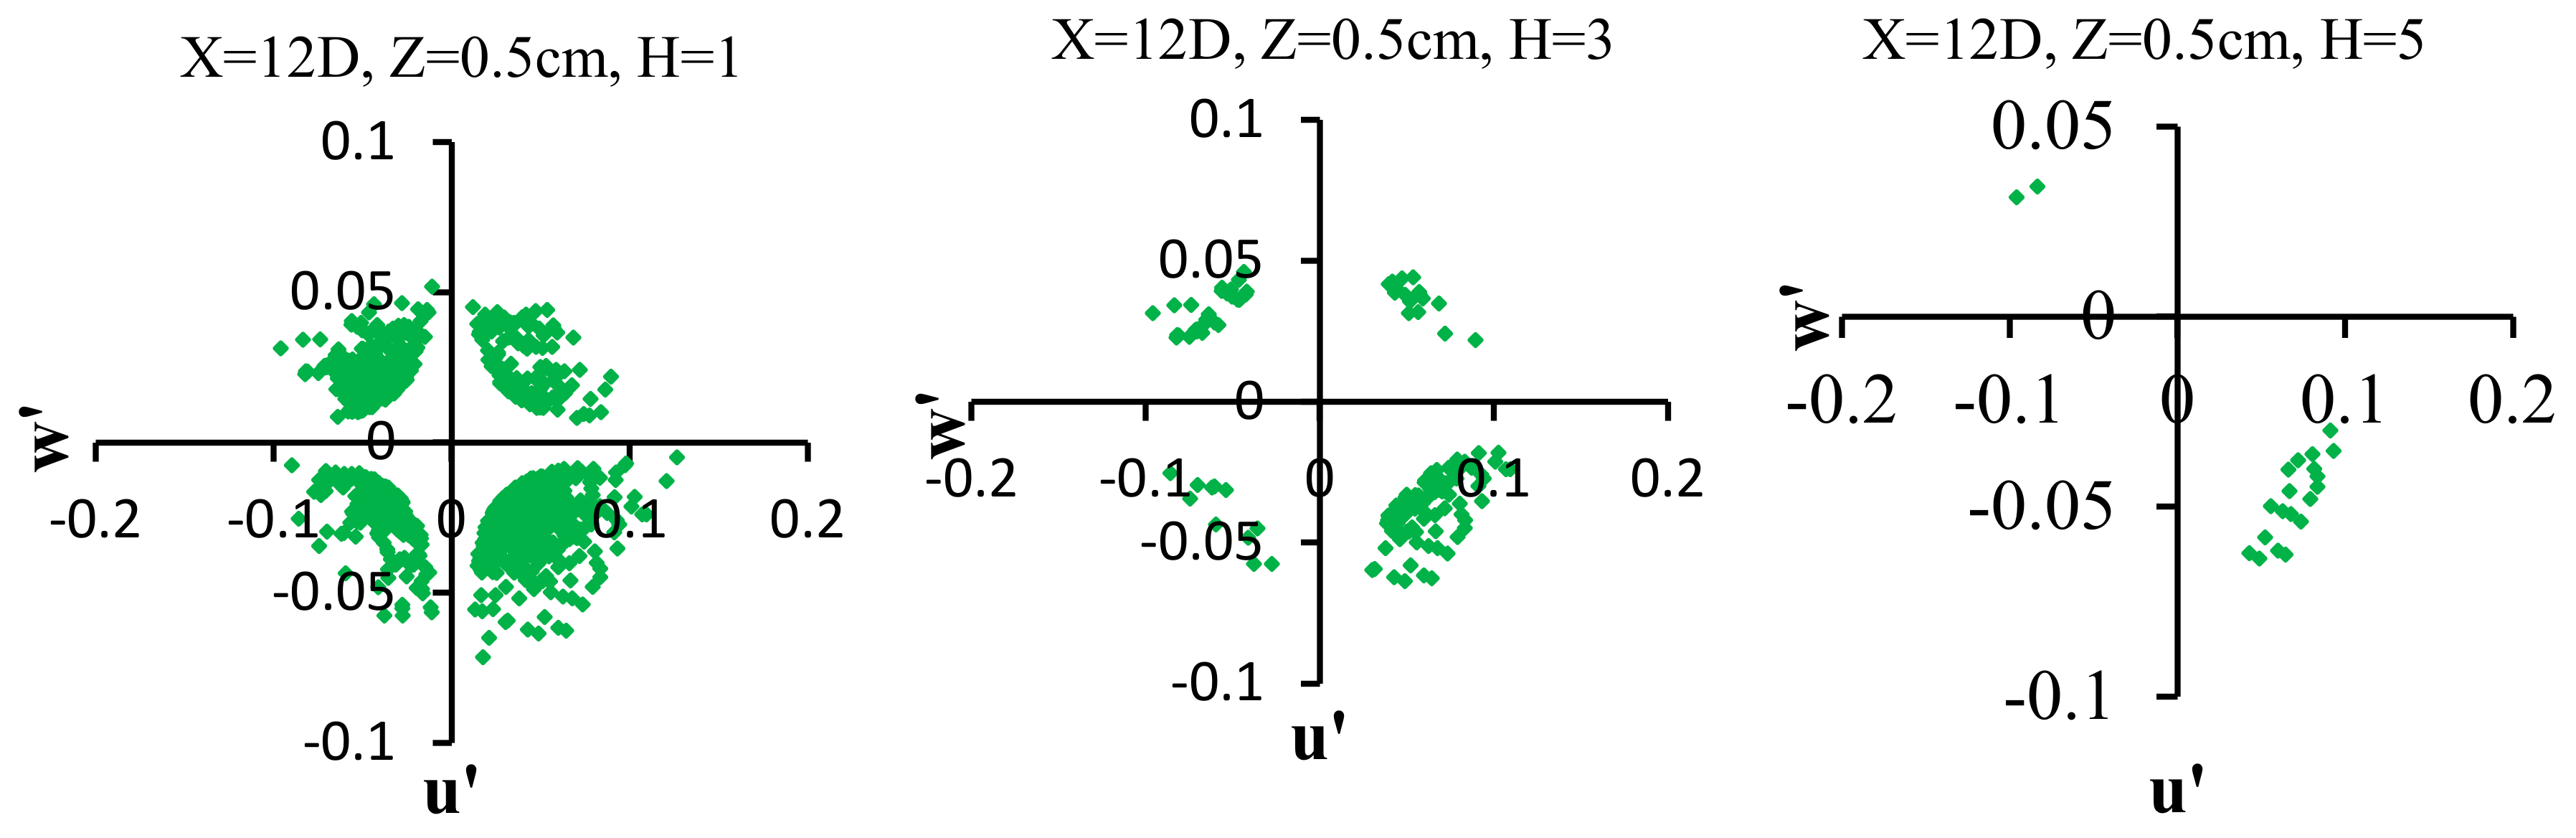
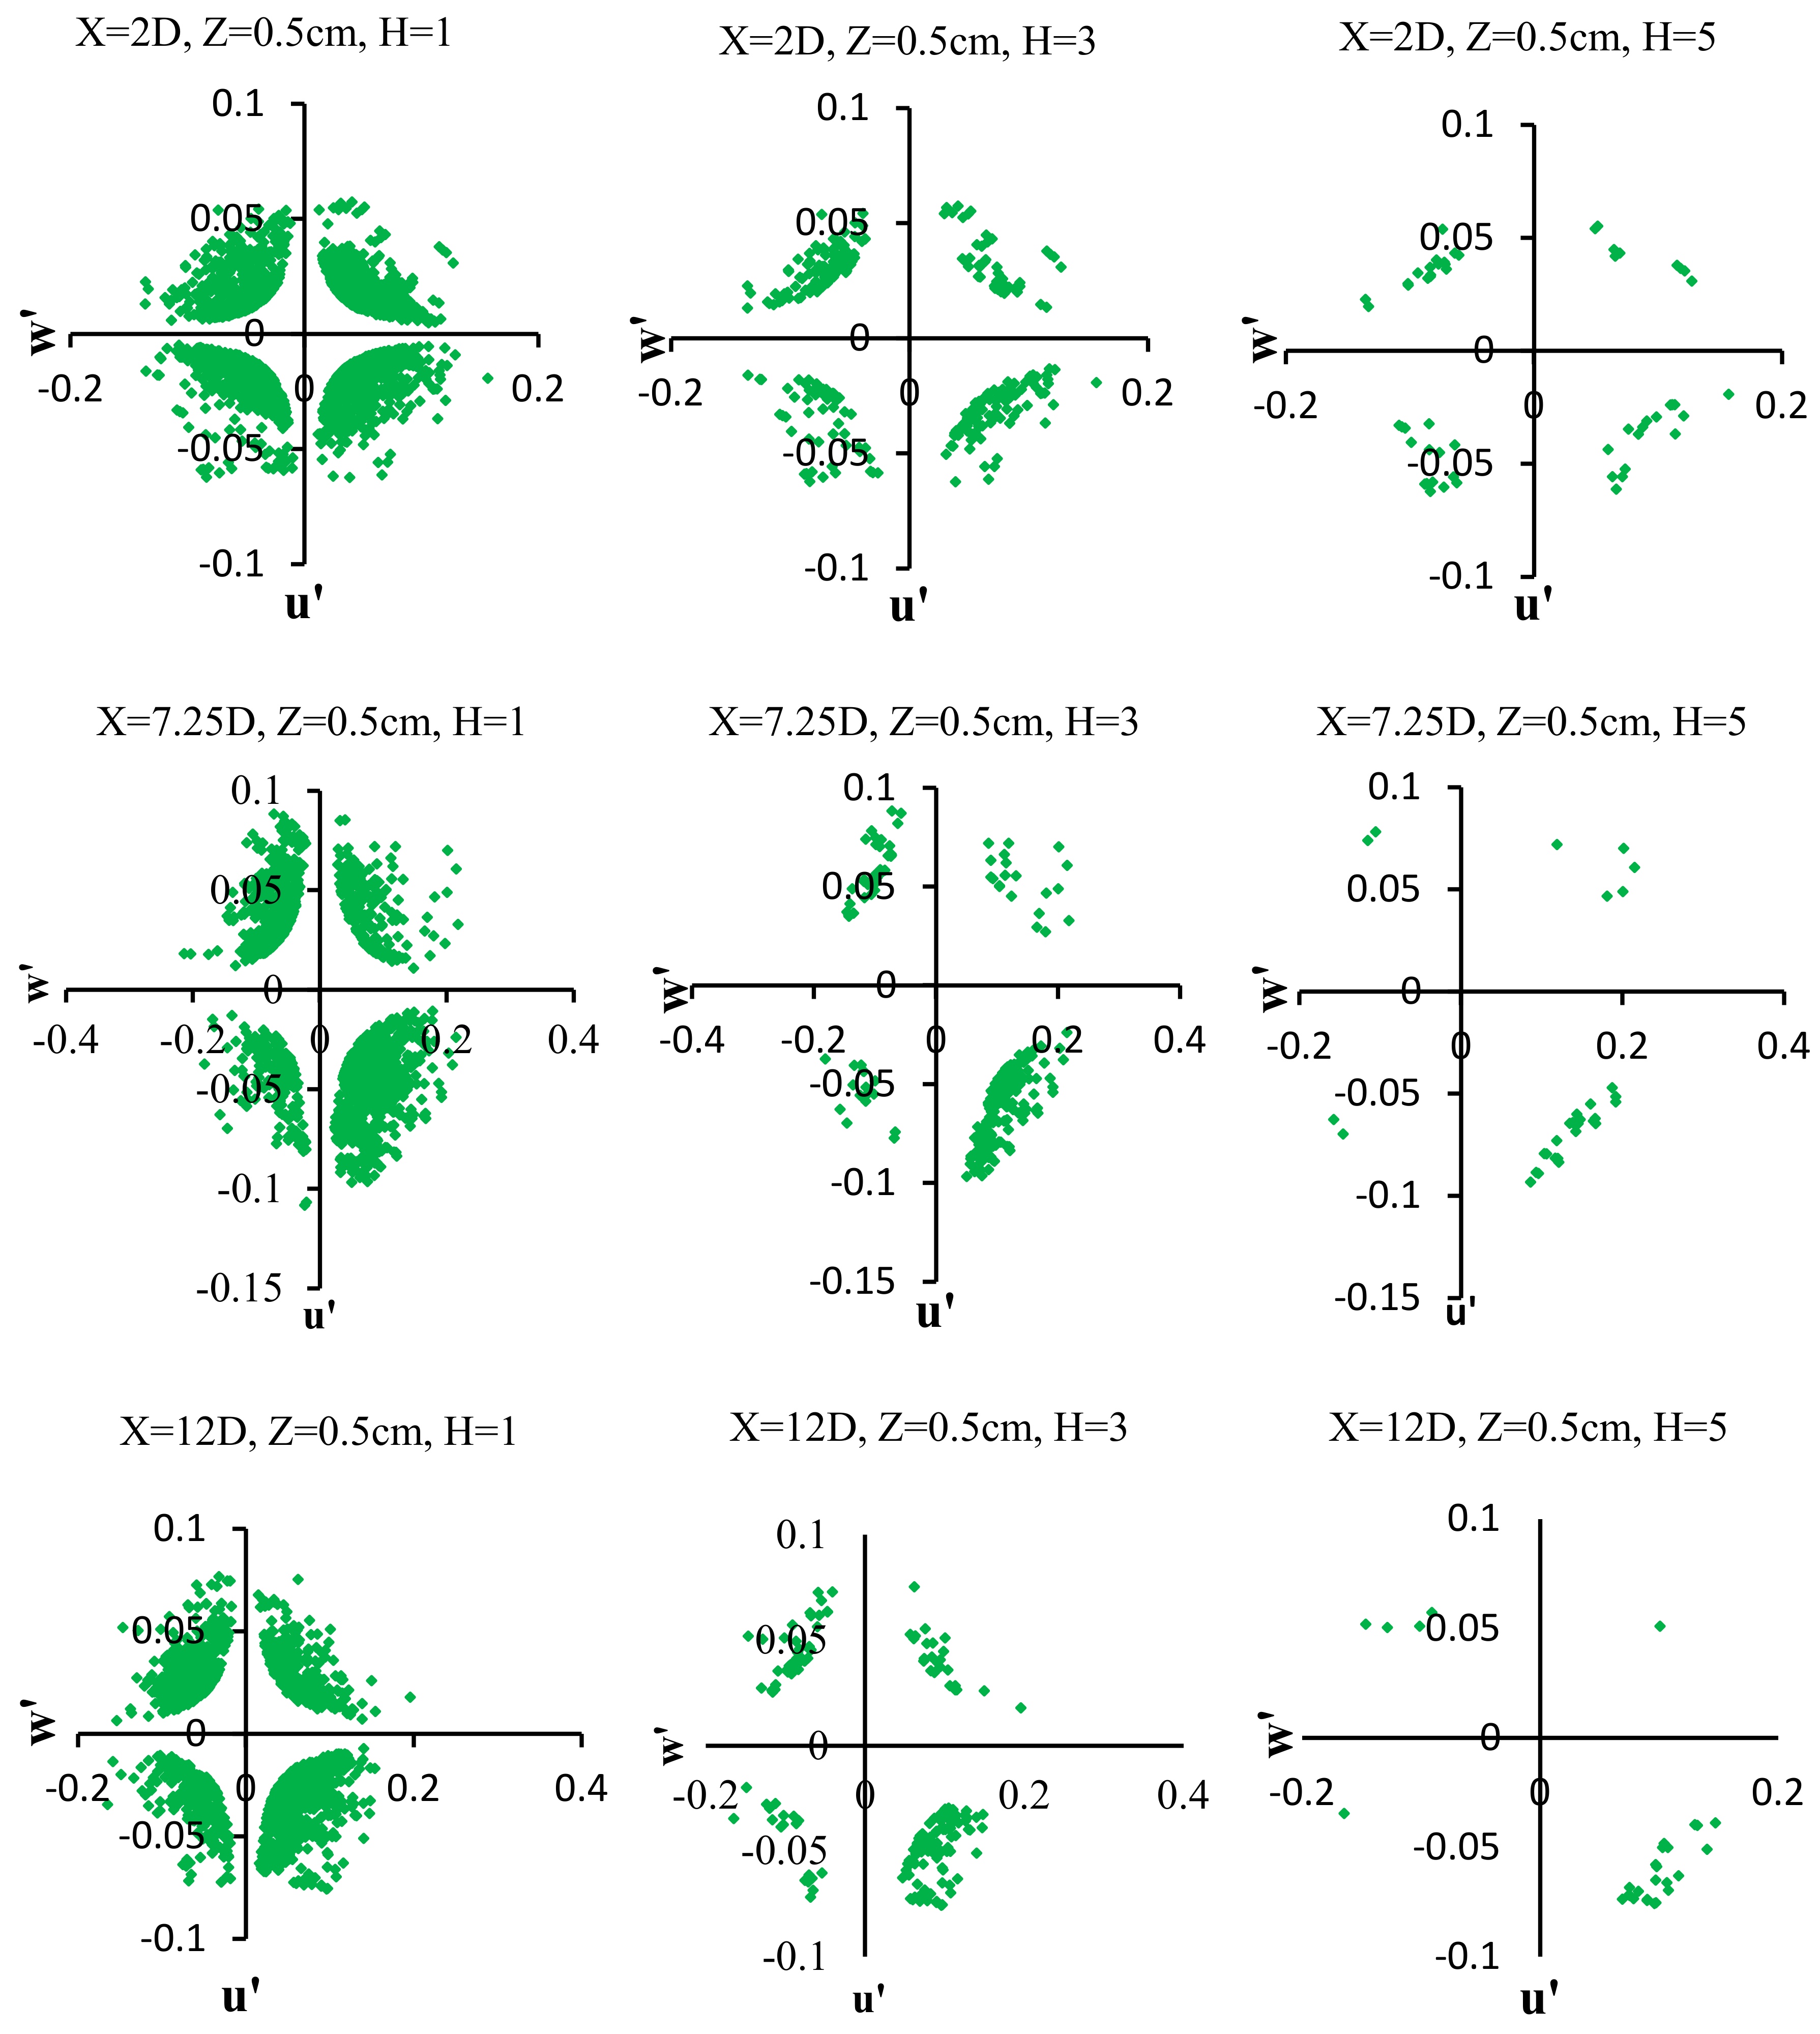
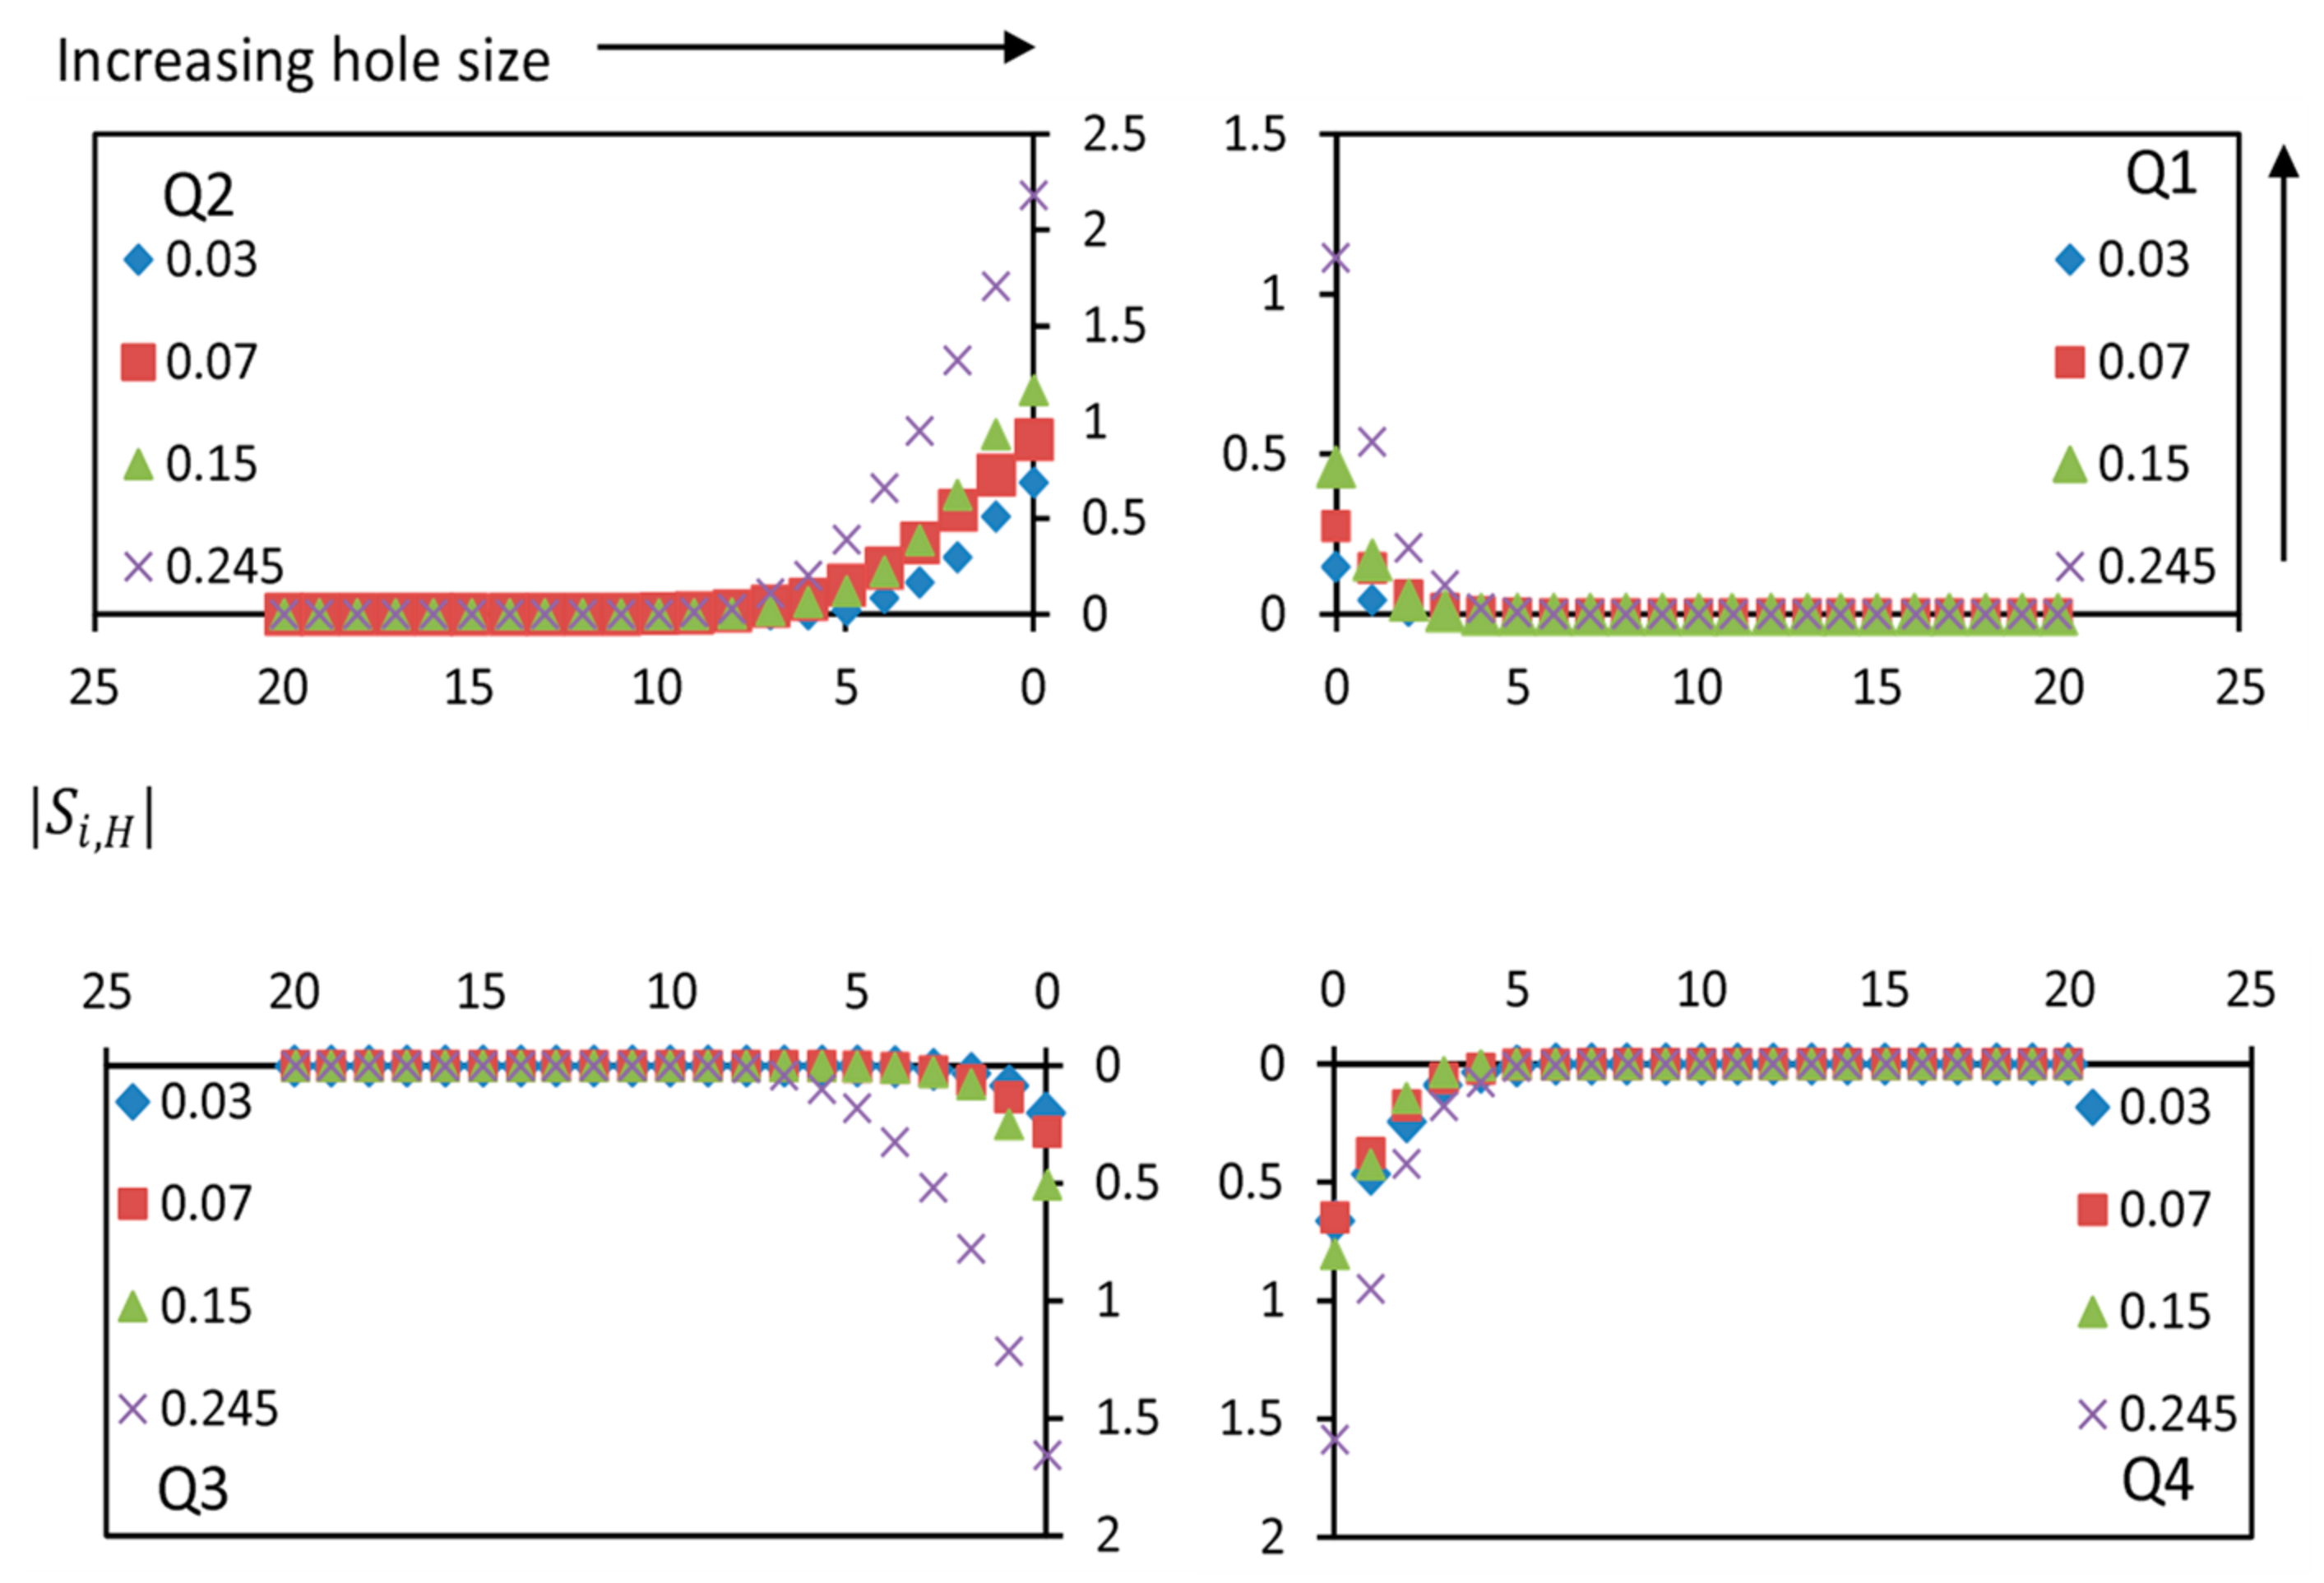
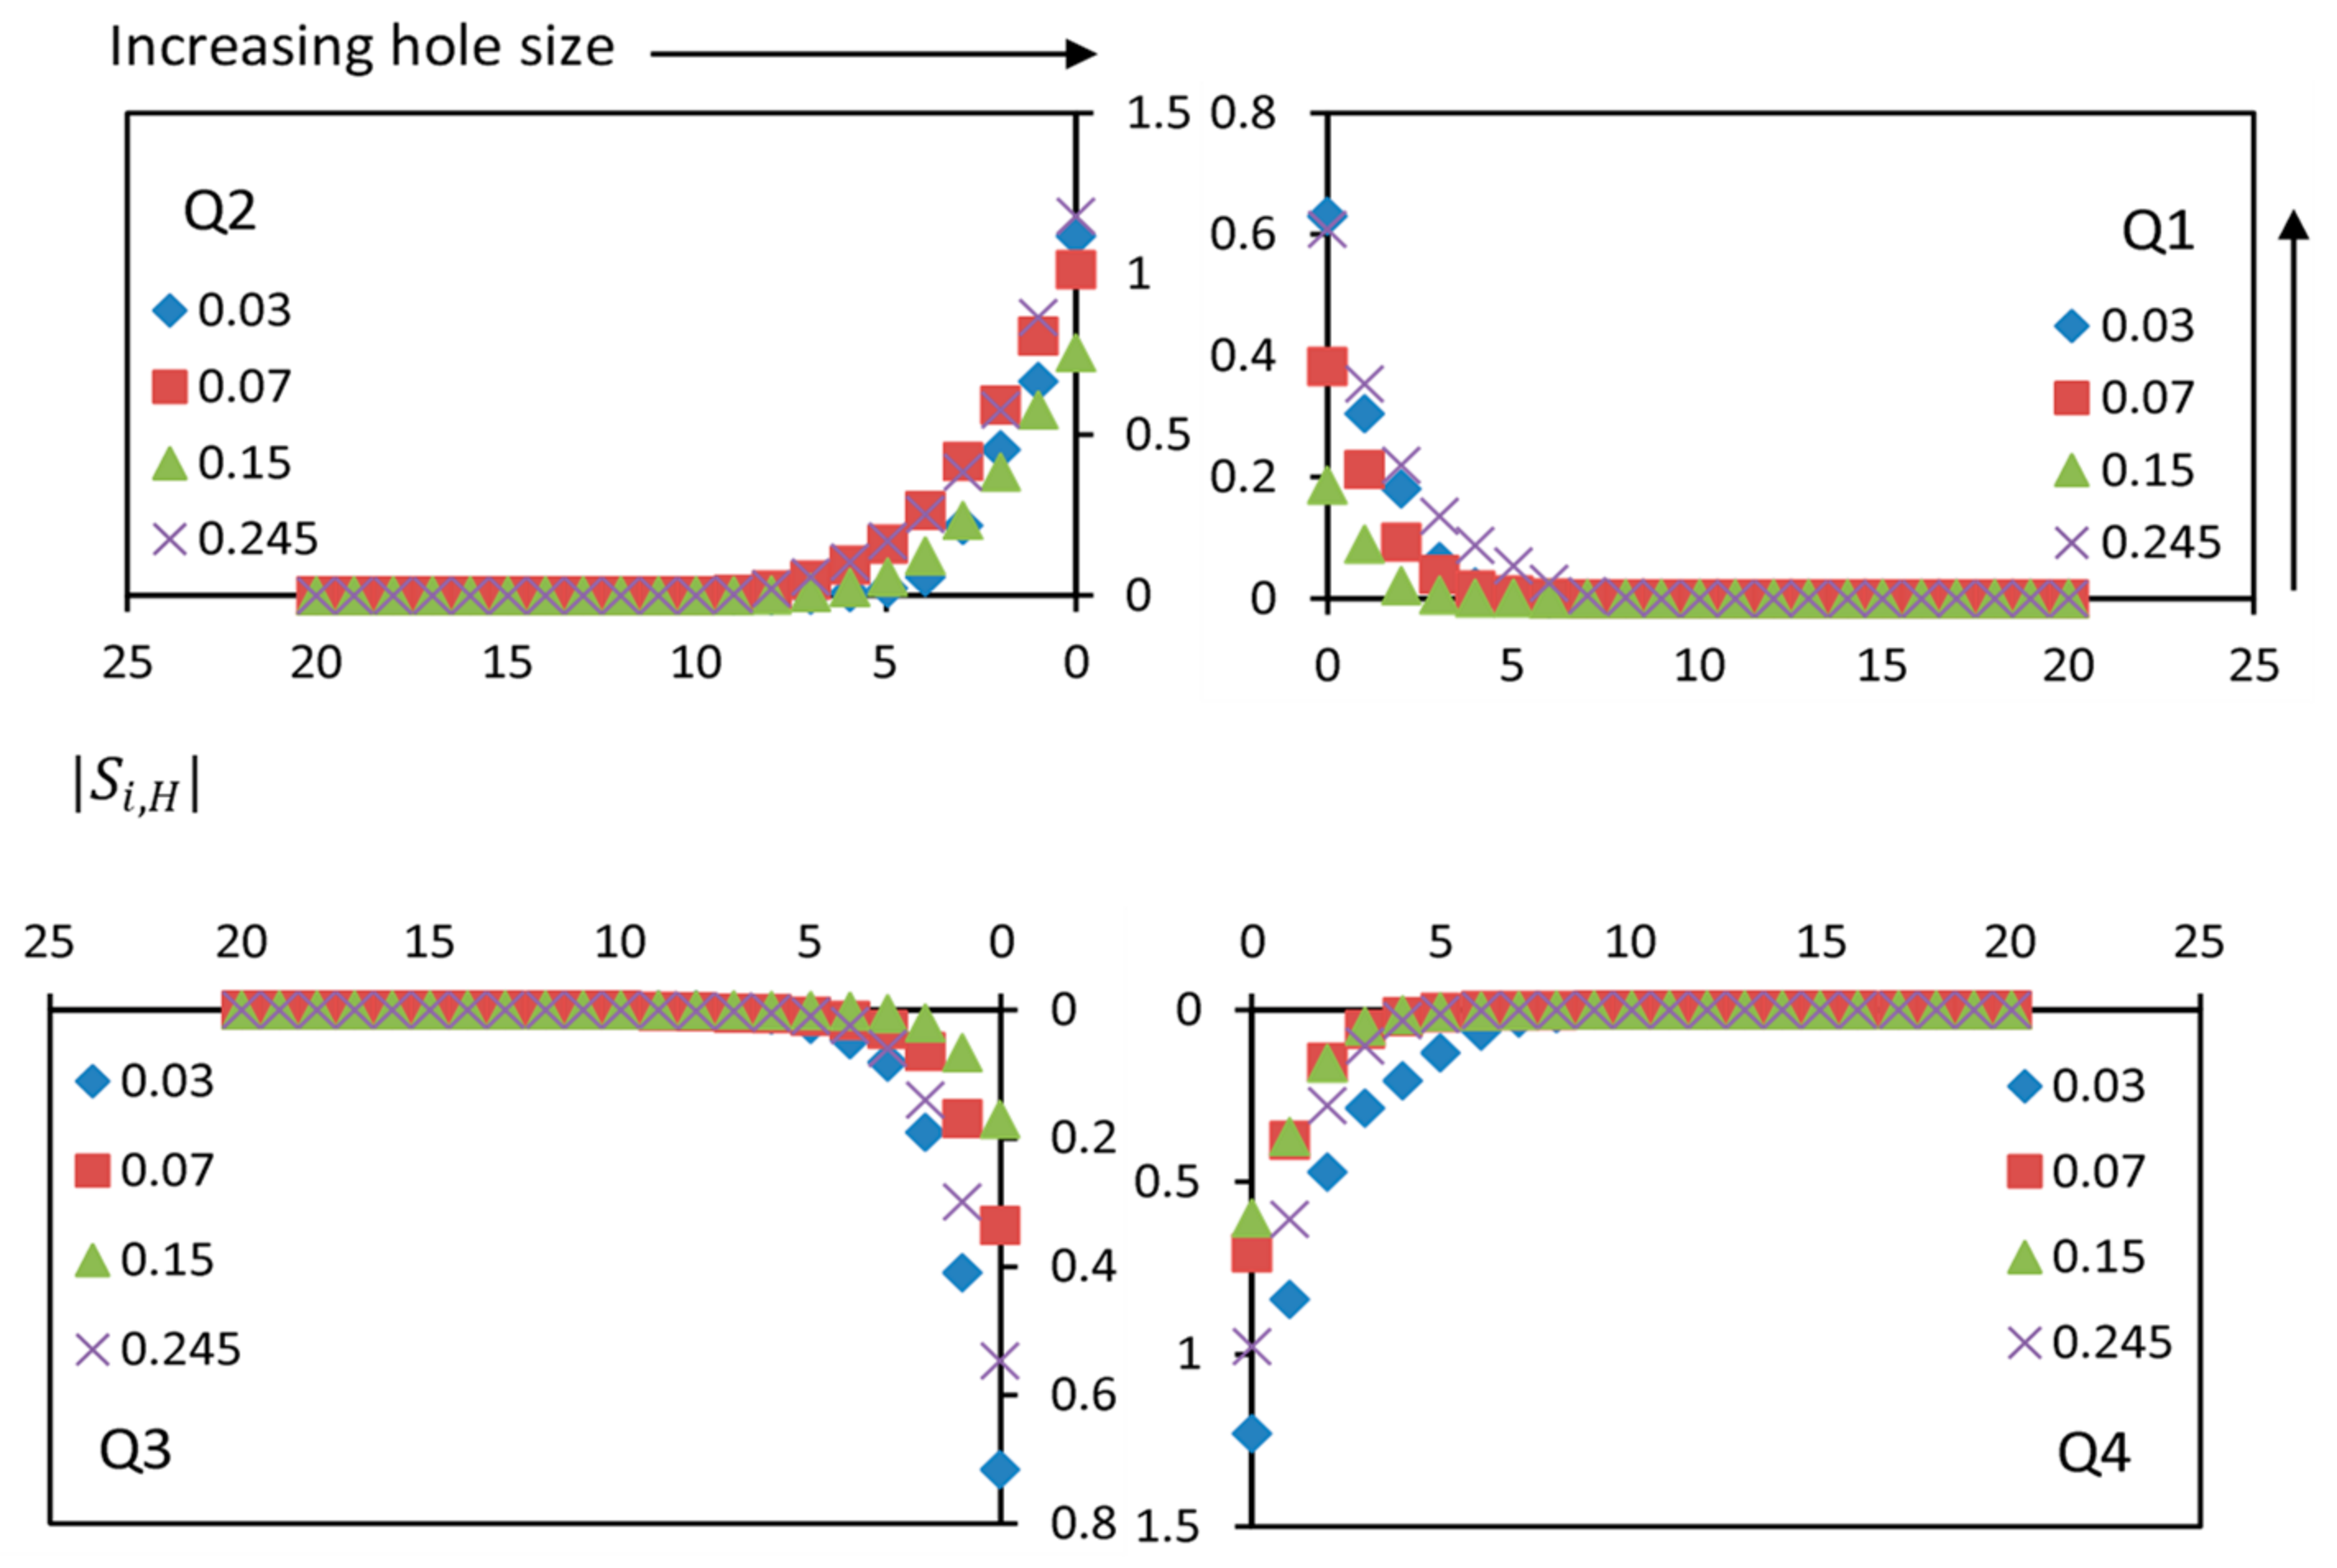
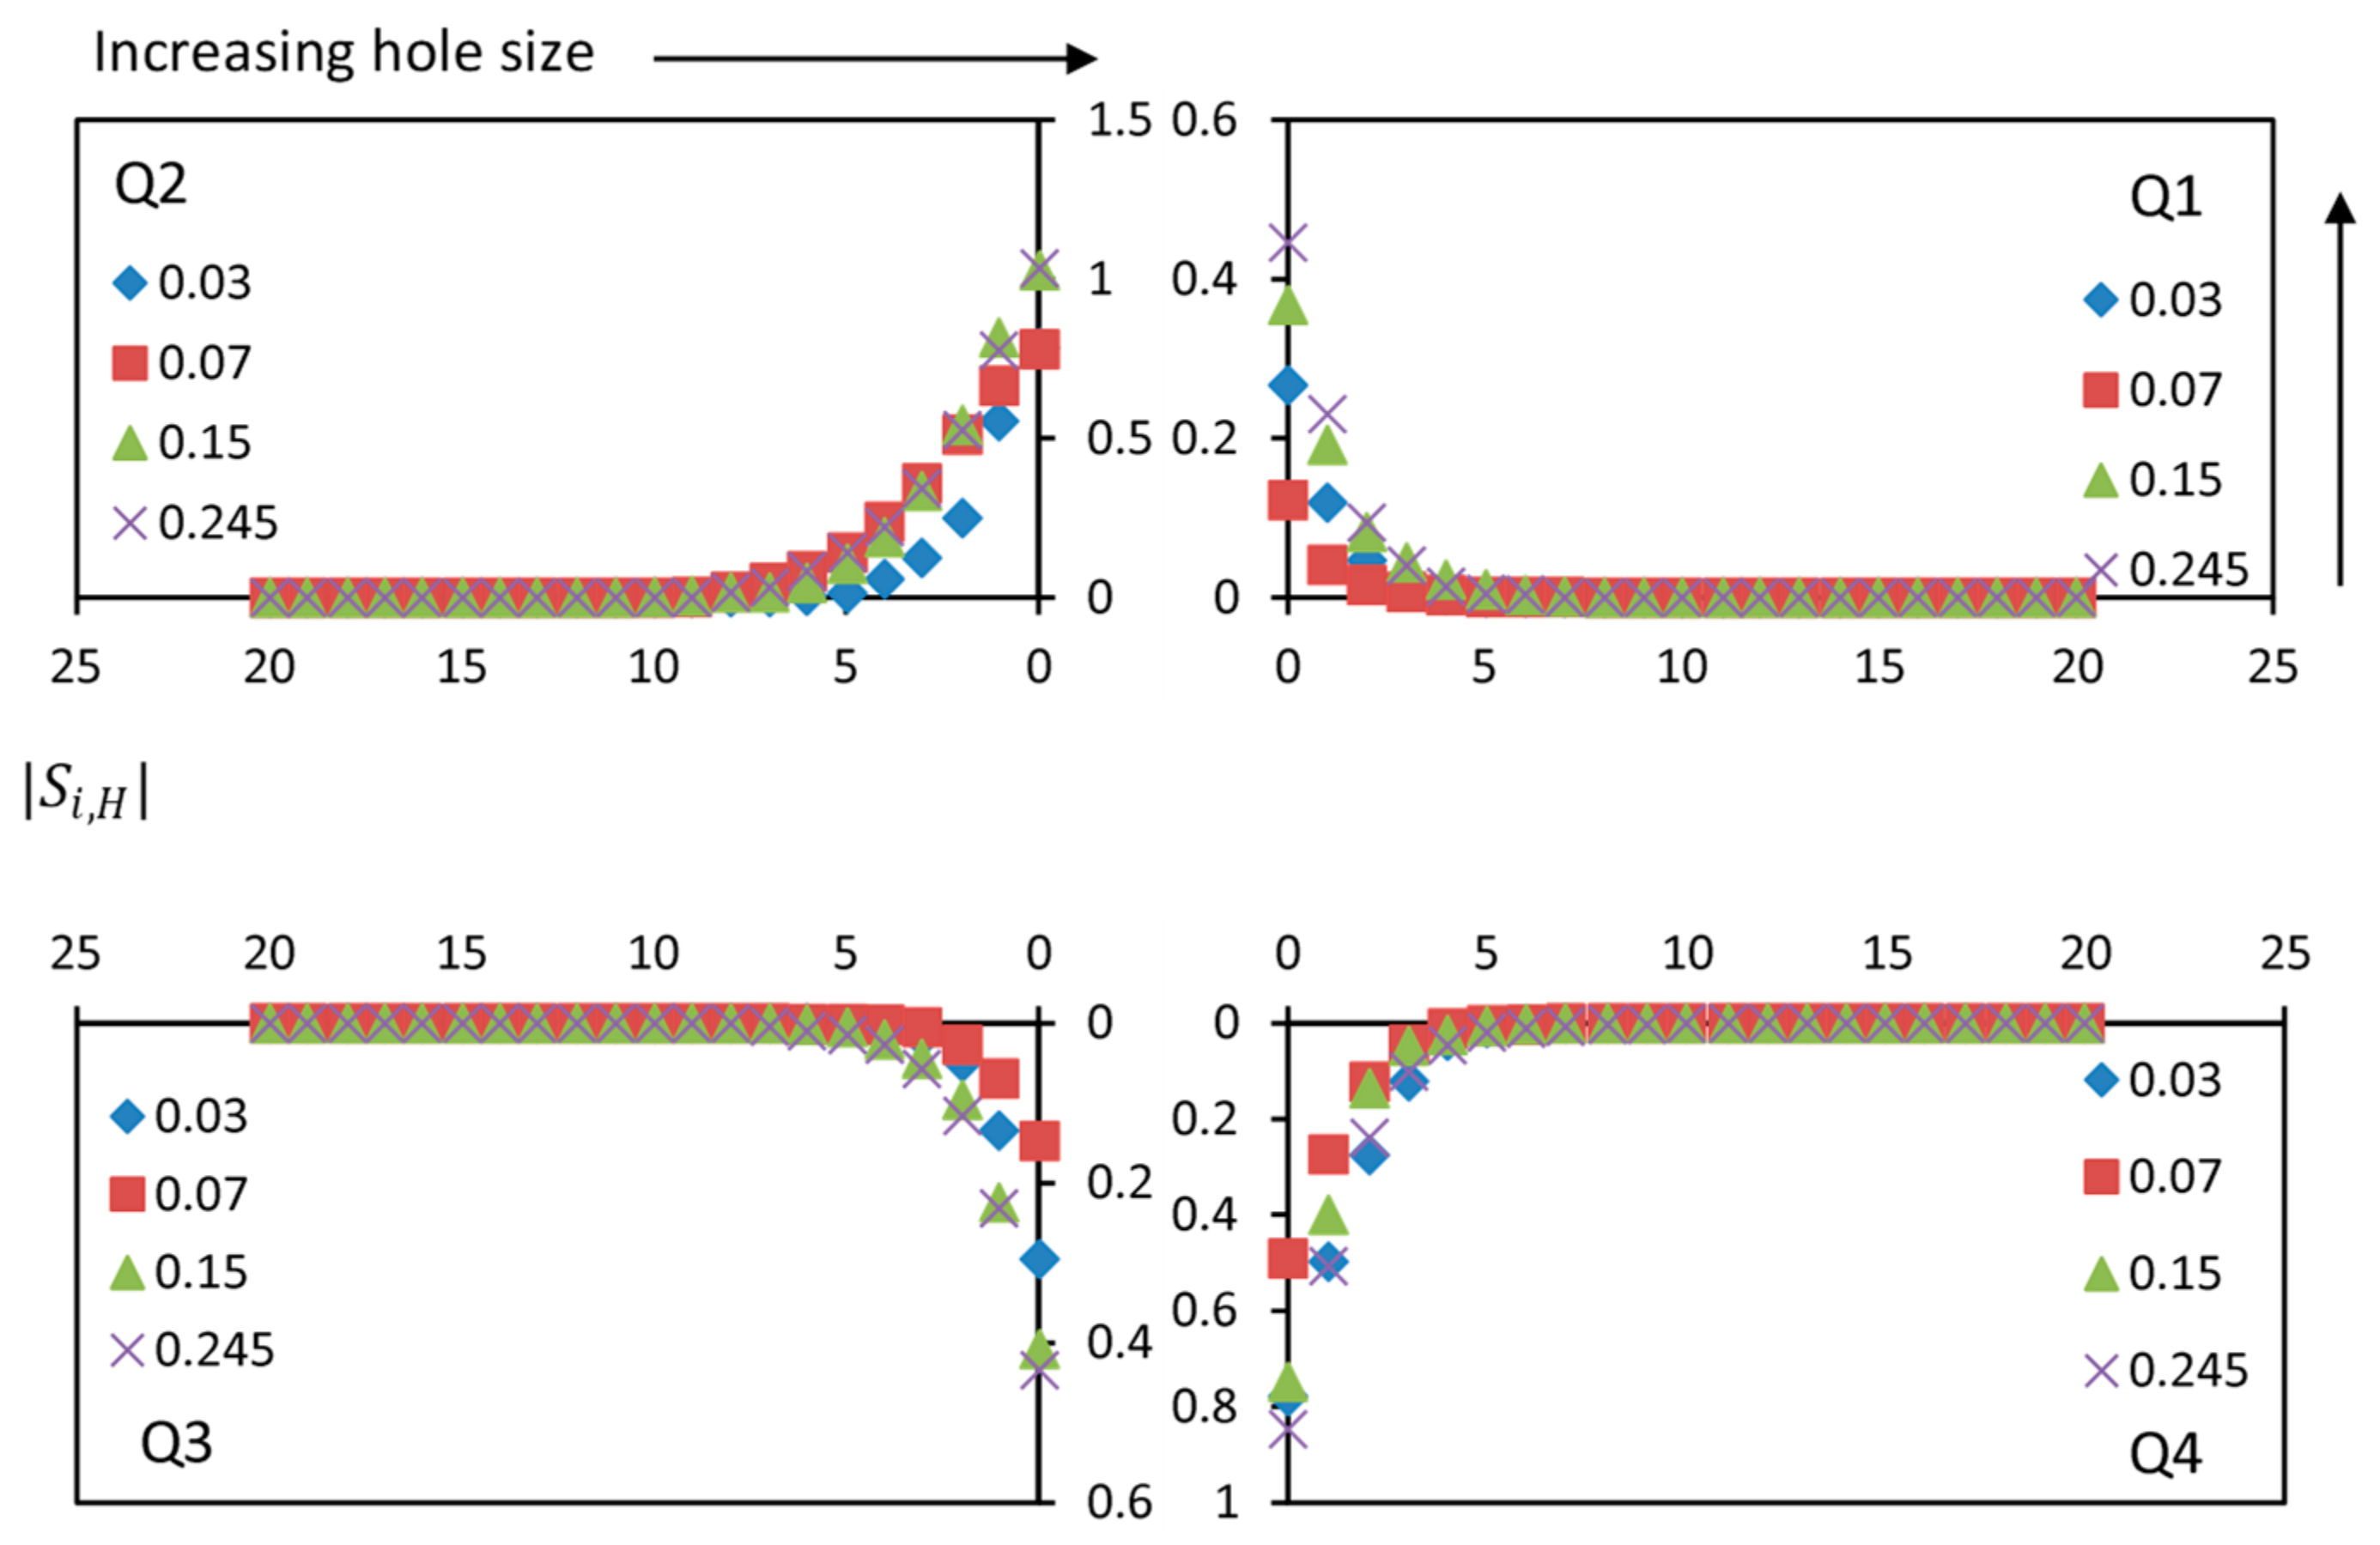
4.6. Quadrant Analysis
5. Conclusions
Author Contributions
Funding
Data Availability Statement
Conflicts of Interest
References
- Akoz, M.S.; Sahin, B.; Akilli, H. Flow characteristic of the horizontal cylinder placed on the plane boundary. Flow Meas. Instrum. 2010, 21, 476–487. [Google Scholar]
- Devi, K.; Hanmaiahgari, P.R.; Pu, J.H. Effects of a spoiler attachment on the wake flow of a bed-mounted horizontal pipe. Phys. Fluids 2024, 36, 105160. [Google Scholar]
- Nishino, T.; Roberts, G.T.; Zhang, X. Vortex shedding from a circular cylinder near a moving ground. Phys. Fluids 2007, 19, 025103. [Google Scholar]
- Magnier, M.; Druault, P.; Germain, G. Experimental investigation of upstream cube effects on the wake of a wall-mounted cylinder: Wake rising reduction, TKE budget and flow organization. Eur. J. Mech. B/Fluids 2021, 87, 92–102. [Google Scholar]
- Taye, J.; Barman, J.; Patel, M.; Kumar, B. Turbulent characteristics of sinuous river bend. ISH J. Hydraul. Eng. 2021, 27 (Suppl. S1), 256–263. [Google Scholar]
- Dey, S.; Das, R.; Gaudio, R.; Bose, S.K. Turbulence in mobile-bed streams. Acta Geophys. 2012, 60, 1547–1588. [Google Scholar]
- Dey, S.; Raikar, R.V. Characteristics of loose rough boundary streams at near-threshold. J. Hydraul. Eng. 2007, 133, 288–304. [Google Scholar]
- Feriet, D.E.; Kampe, J. The Gram-Charlier Approximation of the Normal Law and the Statistical Description of Homogeneous Turbulent Flow near Statistical Equilibrium (No. dtmb-2013); David Taylor Model Basin Washington DC Applied Mathematics Lab: Washington, DC, USA, 1966. [Google Scholar]
- Gallagher, M.; McEwan, I.; Nikora, V. The Changing Structure of Turbulence Over a Self–Stabilising Sediment Bed; School of Engineering, University of Aberdeen: Aberdeen, UK, 1999; Volume 21. [Google Scholar]
- Gaudio, R.; Miglio, A.; Calomino, F. Friction factor and von Kármán’s in open channels with bed-load. J. Hydraul. Res. 2011, 49, 239–247. [Google Scholar]
- Afzal, B.; Faruque, M.A.; Balachandar, R. Effect of Reynolds number, near-wall perturbation and turbulence on smooth open-channel flows. J. Hydraul. Res. 2009, 47, 66–81. [Google Scholar]
- Willmarth, W.W.; Lu, S.S. Structure of the Reynolds stress near the wall. J. Fluid Mech. 1972, 55, 65–92. [Google Scholar]
- Antonia, R.A.; Atkinson, J.D. High-order moments of Reynolds shear stress fluctuations in a turbulent boundary layer. J. Fluid Mech. 1973, 58, 581–593. [Google Scholar]
- Sharma, A.; Kumar, B. Probability distribution functions of turbulence using multiple criteria over non-uniform sand bed channel. ISH J. Hydraul. Eng. 2020, 26, 163–172. [Google Scholar]
- Tarrab, L.; Garcia, C.M.; Cantero, M.I.; Oberg, K. Role of turbulence fluctuations on uncertainties of acoustic Doppler current profiler discharge measurements. Water Resour. Res. 2012, 48, 1–12. [Google Scholar]
- Gurugubelli, Y.; Timbadiya, P.V.; Barman, B. Turbulent flow structures and Reynolds stress anisotropy in an asymmetric sinuous mobile channel. Phys. Fluids 2024, 36, 085173. [Google Scholar]
- Raupach, M.R. Conditional statistics of Reynolds stress in rough-wall and smooth-wall turbulent boundary layers. J. Fluid Mech. 1981, 108, 363–382. [Google Scholar]
- Gonzalez-Castro, J.A.; Muste, M. Framework for estimating uncertainty of ADCP measurements from a moving boat by standardized uncertainty analysis. J. Hydraul. Eng. 2007, 133, 1390–1410. [Google Scholar]
- Goring, D.G.; Nikora, V.I. Despiking acoustic Doppler velocimeter data. J. Hydraul. Eng. 2002, 128, 117–126. [Google Scholar]
- Van Atta, C.W.; Chen, W.Y. Correlation measurements in grid turbulence using digital harmonic analysis. J. Fluid Mech. 1968, 34, 497–515. [Google Scholar]
- Nakagawa, H.; Nezu, I. Prediction of the contributions to the Reynolds stress from bursting events in open-channel flows. J. Fluid Mech. 1977, 80, 99–128. [Google Scholar]
- Lu, S.S.; Willmarth, W.W. Measurements of the structure of the Reynolds stress in a turbulent boundary layer. J. Fluid Mech. 1973, 60, 481–511. [Google Scholar]
- Li, Y.; Wei, J.; Gao, X.; Chen, D.; Weng, S.; Du, W.; Wang, W.; Wang, J.; Tang, C.; Zhang, S. Turbulent bursting and sediment resuspension in hyper-eutrophic Lake Taihu, China. J. Hydrol. 2018, 565, 581–588. [Google Scholar]
- Hanmaiahgari, P.R.; Roussinova, V.; Balachandar, R. Turbulence characteristics of flow in an open channel with temporally varying mobile bedforms. J. Hydrol. Hydromech. 2017, 65, 35–48. [Google Scholar]
- Zhou, J.; Zhang, Q.; Li, J. Probability distribution function of near-wall turbulent velocity fluctuations. Appl. Math. Mech. 2005, 26, 1245–1254. [Google Scholar]
- He, M.; Liang, D.; Ren, B.; Li, J.; Shao, S. Wave interactions with multi-float structures: SPH model, experimental validation, and parametric study. Coast. Eng. 2023, 184, 104333. [Google Scholar]


| Runs | D (cm) | h (cm) | U (cm/s) | (cm/s) | ||
|---|---|---|---|---|---|---|
| 1 | 8 | 30 | 15 | 0.71 | 0.087 | 12,000 |
| 2 | 8 | 30 | 19 | 0.92 | 0.111 | 15,200 |
Disclaimer/Publisher’s Note: The statements, opinions and data contained in all publications are solely those of the individual author(s) and contributor(s) and not of MDPI and/or the editor(s). MDPI and/or the editor(s) disclaim responsibility for any injury to people or property resulting from any ideas, methods, instructions or products referred to in the content. |
© 2025 by the authors. Licensee MDPI, Basel, Switzerland. This article is an open access article distributed under the terms and conditions of the Creative Commons Attribution (CC BY) license (https://creativecommons.org/licenses/by/4.0/).
Share and Cite
Kumar, S.; Kumar, B.; Pu, J.H.; Hanmaiahgari, P.R. Probability Distribution Functions of Velocity Fluctuations and Quadrant Analysis on Turbulent Flow Around a Horizontal Cylinder Across a Channel Bed. Water 2025, 17, 958. https://doi.org/10.3390/w17070958
Kumar S, Kumar B, Pu JH, Hanmaiahgari PR. Probability Distribution Functions of Velocity Fluctuations and Quadrant Analysis on Turbulent Flow Around a Horizontal Cylinder Across a Channel Bed. Water. 2025; 17(7):958. https://doi.org/10.3390/w17070958
Chicago/Turabian StyleKumar, Sandeep, Bimlesh Kumar, Jaan H. Pu, and Prashanth Reddy Hanmaiahgari. 2025. "Probability Distribution Functions of Velocity Fluctuations and Quadrant Analysis on Turbulent Flow Around a Horizontal Cylinder Across a Channel Bed" Water 17, no. 7: 958. https://doi.org/10.3390/w17070958
APA StyleKumar, S., Kumar, B., Pu, J. H., & Hanmaiahgari, P. R. (2025). Probability Distribution Functions of Velocity Fluctuations and Quadrant Analysis on Turbulent Flow Around a Horizontal Cylinder Across a Channel Bed. Water, 17(7), 958. https://doi.org/10.3390/w17070958