Article

Cumulative Risk of Heavy Metals in Long-Term Operational Rain Garden

1
State Key Laboratory of Water Engineering Ecology and Environment in Arid Area, Xi’an University of Technology, Xi’an 710048, China
2
Shanxi Province Water Conservancy and Hydropower Survey Design & Research Institute Co., Ltd., Taiyuan 030024, China
*
Author to whom correspondence should be addressed.
Water 2025, 17(7), 955; https://doi.org/10.3390/w17070955
Submission received: 1 October 2024 / Revised: 5 March 2025 / Accepted: 21 March 2025 / Published: 25 March 2025

Abstract

:
With the advancement of sponge city construction, rain gardens, as key facilities for concentrating and infiltrating rainwater runoff, have been widely established. However, the accumulation of heavy metals (HMs) in the fillers and the associated pollution risks cannot be ignored, which have a significant impact on the operational lifespan of these facilities. This study took the observation point (P) within a rain garden that has been in operation since 2012 and the control point (CK), which is the soil sample collection point in the natural infiltration area, as samples. Based on the monitoring data of HM content from 2017 to 2022, the pollution characteristics of Cu, Zn, and Cd were analyzed using enrichment factors and the geo-accumulation index, and the potential ecological risks were evaluated to reveal the impact of concentrated infiltration of runoff. The results showed that Cu and Cd accumulated in the 0–10 cm depth, while Cu and Zn exhibited seasonal annual variations, and the variation of Cd was not obvious. The study found that Cu and Zn were in a non-enriched state, while Cd was slightly enriched. Among the single ecological risk factor indices, the pollution levels of Cu and Zn were low, while that of Cd was relatively high. Comparison of the data from the observation point and the control point reveals that 88.9% of the data points of single ecological risk factor indices at each soil depth at the observation point are higher than those at the control point, revealing the impact of concentrated infiltration of rainwater runoff on the soil. However, the comprehensive assessment indicated that the overall ecological risk of the soil in the rain garden and the natural filtration area was at a low level. Nevertheless, given that the long-term operation of rain gardens may still pose pollution risks to the soil and groundwater, it is imperative to take timely measures to control HM pollution to ensure the long-term stable operation of sponge city facilities and the safety of the ecological environment.

1. Introduction

Rapid urbanization has led to increased water pollution, and various strategies have been proposed to address this issue, such as Low Impact Development (LID) in the United States and Sustainable Urban Drainage Systems (SUDS) in the United Kingdom [1]. China has been building sponge cities that incorporate natural retention, natural infiltration, and natural purification. Two batches of sponge city pilot projects have been implemented in cities across China that are susceptible to both droughts and floods. The construction of sponge cities aims to enhance urban aesthetics, improve the living environment for citizens, and restore the urban ecological water cycle through artificial means. Rain gardens, as one of the concentrated infiltration measures in sponge cities, effectively recharge groundwater and mitigate the adverse effects of urbanization on the water environment [2]. Moreover, they have a significant impact on nitrogen when the groundwater level is at 2–3 m, with a limited effect on phosphorus [3,4]. The soil within rain gardens serves as the medium for rainwater runoff. Concentrated runoff can increase the heavy metal (HM) content in runoff, leading to a greater accumulation of HM pollutants in the soil when they infiltrate. The soil acts to remove HM pollutants from rain-water runoff, causing these pollutants to remain in the soil [5]. Consequently, this elevates the risk of HM pollution in the soil environment [6,7,8,9]. HMs are known for their characteristics of being difficult to degrade, having strong toxicity, and posing an accumulation risk [10]. Under long-term operational conditions, they can cause irreversible harm to the surrounding ecosystem and human health [11,12]. Therefore, the analysis of changes in HM content and distribution in long-term operational rain garden soils, as well as the evaluation of HM accumulation effects and pollution risks, holds significant importance for the construction and sustainable operation of sponge cities.
The research on the cumulative effects and pollution risks of HMs in rain garden soil mainly focuses on the assessment of the cumulative effects of HMs in soil at a single time point, without analyzing the cumulative effects and pollution risks exhibited by long-term data of HMs in rain garden soil, and without comparing the soil HM content, cumulative effects, and pollution risks with natural infiltration areas (compared with the concentrated infiltration effect of rainwater runoff in rain garden, we refer to the area where soil that has not been modified by human activities and maintains natural infiltration is located as the natural infiltration area). For instance, Al-Ameri et al. [13] studied the spatiotemporal variation and accumulation characteristics of soil HMs (Cd, Cu, and Zn) in 29 and 49 rain gardens sampled in 2006/07 and 2014/15 in Australia, respectively. Their findings showed that rain garden soil HMs primarily accumulate at a depth of 0–2 cm without migrating to the 13–15 cm medium profile, thereby aligning with previous studies. This indicates that concentrated infiltration of HMs in rain gardens is mainly limited to the surface layer, with HM content rapidly decreasing as soil depth increases [14,15,16]. The comparison between observation sites and control group reveals no significant difference in HM content below 15 cm in soil profiles [17,18,19]. Kluge et al. [20] studied the distribution of HMs (Zn, Cu, Pb, and Cd) in 22 rain-water harvesting systems operated for 11–22 years. The majority of HMs accumulated heavily in the top 0–20 cm of soil, with median HM content decreasing with soil depth. Some HM contents exceeded local threshold values, indicating potential pollution risks. Similarly, Duan et al. [21] studied rain garden soil operated for 7–16 years and found an accumulation risk of HMs in the soil medium. Conducting two field surveys in 2019, they observed significant HM accumulation primarily in the top 0–10 cm of soil, with average content 2–3 times higher than background soil values, resulting in mild to moderate overall pollution levels.
Existing research is mostly limited to conducting single soil sampling in rain gardens and measuring pollution levels by analyzing the ratio of soil HM content to local background values. However, this method fails to effectively distinguish whether HM pollution in soil is caused by the inherent properties of the soil itself or attributed to the effects of concentrated infiltration under sponge city measures. The relationship between the two needs to be further clarified in order to provide more accurate and scientific basis for the study of soil HM pollution in sponge city construction. Therefore, this article proposes an analysis of the HM content in the soil of long-term operating rain gardens, and compares it with the soil HM content and cumulative effect of natural infiltration control points. It explores the pollution level and potential ecological hazards of HMs in long-term operating rain gardens, reveals the impact of concentrated infiltration on long-term operating rain gardens, and lays the foundation for calculating the service life of rain gardens.
This article takes a long-term operating rain garden as the research object, based on long-term soil HM data from 27 April 2017 to 5 December 2022, analyzes the changes and spatiotemporal distribution characteristics of soil HM pollutants, studies the cumulative effects and pollution risks of soil HMs in the rain garden, and compares them with natural infiltration control points to reveal the impact of concentrated infiltration of rainwater runoff on HMs in the rain garden soil. It clarifies the inherent relationship between concentrated infiltration of rainwater runoff and HMs in the rain garden soil, providing key basic data support and a theoretical basis for further accurately quantifying the effective operating life of sponge city concentrated infiltration measures under soil HM pollution stress. It also helps to plan and evaluate the long-term stability and sustainability of centralized infiltration facilities in sponge city construction more scientifically.

2. Materials and Methods
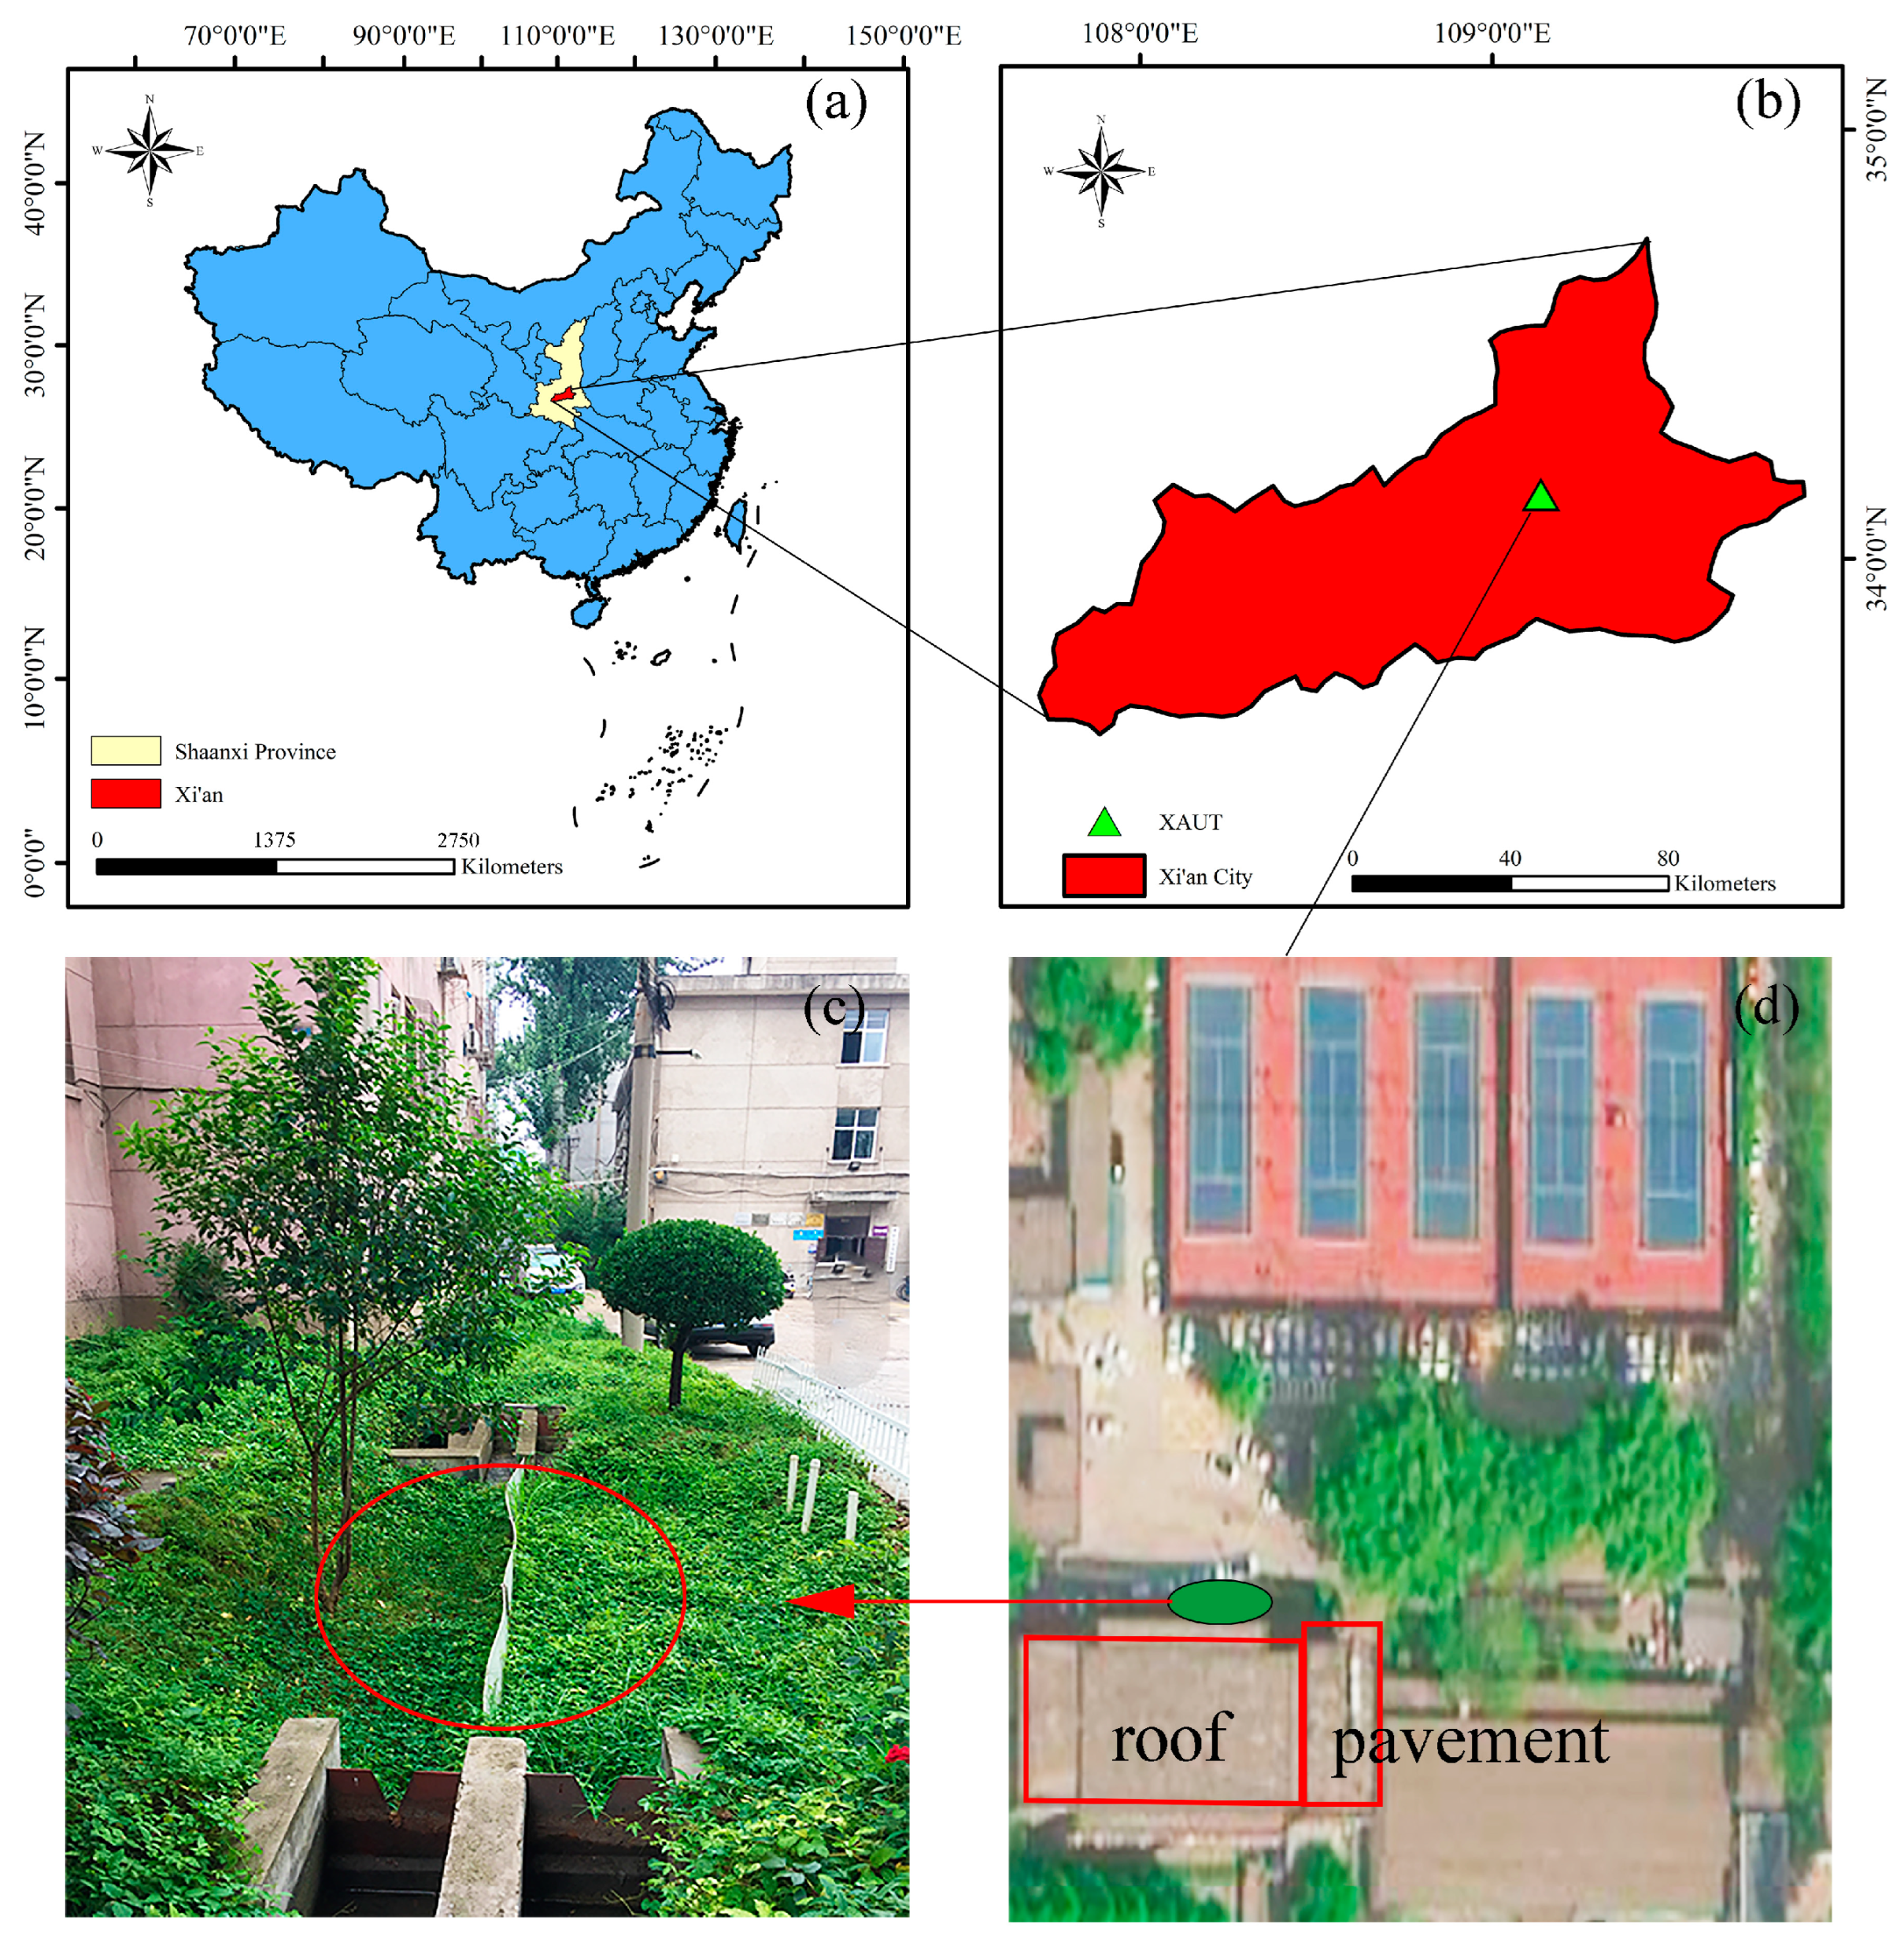
2.1. Study Area

The rain garden in a university in Xi’an, Shaanxi Province, was taken as the study material, shown in Figure 1. It is located at 108°29′09″ E, 34°15′19″ N. The research area belongs to the warm temperate semi-humid continental monsoon climate zone. The average temperature for many years was 13.6 °C, with the annual average precipitation being 583 mm. The precipitation was mainly concentrated from May to October, with the rain-fall from July to September accounting for 52% of the annual rainfall.
An elliptical rain garden was built in 2012, with an area of ~9.42 m2 and a confluence ratio of 15:1. The rain garden was divided into two areas within the same area using a partition board, which is used to collect rainwater from the pavement and roof, drain water from the road area, and purify runoff pollutants. The left side was treated with the anti-seepage treatment, with the outlet pipe being buried at the bottom. The right side was filled with local loess without the anti-seepage treatment. As shown in Figure 1c, two 45° triangular weirs were installed at the garden inlet, while 30° triangular weirs were installed at the bottom outlet on the impervious side and the overflow outlet on the infiltration side. In this paper, the rain garden on the right infiltration side was taken as the research object.

2.2. Soil Sample Collection

The soil samples were collected two days after rain from both inside and outside a rain garden using a soil drill for layered sampling. The infiltration side of the rain garden served as the sample observation point (P), while the outside point was designated as the control point (CK), unaffected by concentrated rainwater runoff infiltration. The 50 cm soil layer was divided into three depths: 0–10 cm, 20–30 cm, and 40–50 cm. To obtain samples, three representative points in the rain garden were selected, and soil from the same depth at each point was combined to form a single observation point sample. The control point sample collection followed the same procedure. Soil samples were stored in plastic sealing bags, transported in insulated boxes, and immediately pre-treated, tested, and analyzed in the laboratory. The dataset comprises eighteen sets of data spanning from 27 April 2017 to 5 December 2022.

2.3. Soil Sample Testing Method

Detection of Cu and Zn was performed using atomic absorption method [22] and spectrophotometer (model: YQA-035; PerkinElmer, Waltham, MA, USA), with detection limits of 1 mg/kg and 4 mg/kg, respectively. The soil samples were air-dried, crushed, and sieved (100 mesh nylon screen), then weighed (0.2 g) and subjected to graphite electrothermal plate (Shanghai Naiyi Laboratory Instrument Co., Ltd., Shanghai, China) digestion method with sequential addition of HCl, HNO3, HF, and HClO4 (Xi’an Sanpu Chemical Reagent Co., Ltd., Xi’an, China). After decomposition, HNO3 was added to set the volume, and the supernatant was collected for detection. Cd was detected via graphite furnace atomic absorption spectrophotometry [23] using the same spectrophotometer (PerkinElmer, Waltham, MA, USA), with a detection limit of 0.01 mg/kg. Soil samples underwent pretreatment and decomposition with nitric acid, hydrofluoric acid, and perchloric acid. The sample solution was then directly analyzed by the atomic absorption spectrophotometer to determine the Cd content in the soil [24].

2.4. Trend Analysis

Theil–Sen linear regression and non-parametric Mann–Kendall (MK) test were used to analyze the trend of HM content in soil at different depths. The Theil–Sen is a nonparametric statistic, and its slope estimator is the median of slopes, denoted as β. The Theil–Sen approach is commonly used for time series analysis, for example, in soil moisture analysis [25,26] and phenological trends of alpine vegetation [27]. The MK test was conducted to detect the significant change in the HM content trend, with a significance level of α = 0.05 and a critical value of Z1−α = ±1.96.

2.5. Evaluation Method of Soil HM Pollution

The methods for analyzing the accumulation effects and pollution risks of soil HMs are diverse. Depending on the assessment target, these methods can be categorized into single-factor methods for evaluating individual pollutants and comprehensive evaluation methods for assessing the combined effects of multiple pollutants [28]. Single-factor methods include the single pollution index [29,30,31], enrichment factor method [32,33,34], geo-accumulation index method [35,36], and potential ecological hazard index method [37,38], among others. Additionally, comprehensive evaluation methods encompass the Nemero comprehensive pollution index method [39], the comprehensive potential ecological index method, and fuzzy number methods [40,41,42], among others.
In this study, we employed the enrichment factor method and geo-accumulation index method to analyze the accumulation effects and pollution risks of individual HMs in soil. Additionally, for the soil HMs’ comprehensive ecological risk assessment, we utilized the potential ecological hazard index method.

2.5.1. Enrichment Factor

The enrichment factor method was widely used to evaluate the degree of accumulation and pollution level of HMs in the soil, sediment, and other environmental media. The enrichment factor was calculated as follows:
E F = C i / C n s e d i m e n t C i / C n b a c k g r o u n d
where E F is the enrichment factor; C i / C n s e d i m e n t is the determination content ratio of the soil HM i to standardized element n, and C i / C n b a c k g r o u n d is the background content ratio of metal i and standardized element n in soil. According to the EF value, HM pollution can be divided into six grades [43,44], and the specific classification and pollution degree can be seen in Table 1.

2.5.2. Geo-Accumulation Index

The geo-accumulation index is a parameter first used by German scientist Müller to determine the degree of HM pollution based on the relationship between the total concentration of HMs and the background value. It is widely used as a quantitative index to study the degree of pollution of HMs in sediments and other substances. The geo-accumulation index was calculated as follows:
I g e o = l o g 2 C i 1.5 × B i
where I g e o is the geo-accumulation index; C i is the measured concentration of element i in the sample; and B i is the geochemical background value of element i in the soil. The specific classification and pollution degree of the pollution index can be found in Table 1 [45].

2.5.3. Potential Ecological Risk Index (ER)

The potential ecological risk index method is a set of methods to evaluate the ecological hazard coefficient generated by HM pollution using the principle of sedimentology. This method comprehensively considers the soil’s HM content, along with the ecological effects, environmental effects, and toxicological factors of HMs [46] (Table 1). The potential ecological risk index E r i is expressed as:
E r i = T r i × C i C n i
where E r i is the potential ecological risk index; C i is HM content; C n i is the reference value; and T r i is the toxicity response coefficient of a HM, which reflects the toxicity level of HMs and the soil sensitivity to HM pollution. According to related studies, the toxicity response coefficients of Cd, Zn, and Cu were 30, 1, and 5, respectively.
The comprehensive potential ecological risk index (RI) of HMs can be expressed as the sum of E r i , with the assessment details provided in Table 1.
R I = i = 1 m E r i

3. Results and Discussion

3.1. Spatial Variation of Soil HMs

To analyze the cumulative effect and ecological risk of HMs in the rain garden soil, the different statistical values of the HM content in the rain garden soil (mean value, point excess rate, coefficient of variation, skewness, and kurtosis) were analyzed and compared with those in the different layers of soil (Table 2).
The mean concentrations of Cu, Zn, and Cd in various soil layers of the rain garden significantly differed, surpassing the soil background values in Shaanxi Province (Table 2). Guo et al. [47] similarly observed accumulation of Cu, Zn, and Cd in the soil, while Davis et al. [48] estimated that HM levels would exceed local land application thresholds 20 years later.
In the observation of soil Cd content, at depths of 0–10 cm, only a few observation points have higher levels than the control points, while the majority of observation points have not exceeded the control points. However, at depths of 20–30 cm and 40–50 cm, the Cd content at most observation points is higher than that at the control points. Meanwhile, the content of Cu and Zn in the soil at the observation points mostly exceeded that of the control points (Table 2). These data indicate that concentrated infiltration has an impact on the content of HMs in soil. The catchment area of the rain garden includes the roof and road surface, with a catchment area of 141.3 m2. In the surface runoff, the average concentration of Cu is 52.18 ug/L (concentration range 16.50–70.44 ug/L), the average concentration of Zn is 115.40 ug/L (concentration range 0.8–558.6 ug/L), and the average concentration of Cd is 46.09 ug/L (concentration range 5.96–372.20 ug/L) (Table 3). There are three ways in which HM pollutants in the rain garden are carried by surface runoff, dry deposition, and wet deposition. From 2017 to 2022, the amount of Cu, Zn, and Cd pollutants carried by surface runoff was 14,284.52 mg, 31,591.28 mg, and 12,617.08 mg, respectively, with a total amount of 58,492.88 mg; The total dry deposition is 642.47 mg/m2, and the total wet deposition is 288.59 mg/m2. In the natural infiltration control group (CK) soil, HM pollutants only enter through dry and wet deposition. In the rainwater, the concentration of Cu, Zn, and Cd is 5.45 ug/L, 72.14 ug/L, and 0.32 ug/L [49]. The dry and wet deposition amounts are consistent with those in the rain garden, which are 642.47 mg/m2 and 288.59 mg/m2, respectively (Table 3). In summary, the input of Cu, Zn, and Cd in the soil of the rain garden is much higher than that of the natural infiltration soil (CK). The concentrated infiltration of rainwater runoff has an appreciable impact on the HM content of the rain garden soil. Although HM levels in rain garden soil were below the screening value for soil pollution risk in agricultural land (pH > 7.5 in soil environmental quality standard), with thresholds for Cu, Zn, and Cd set at 100 mg/kg, 300 mg/kg, and 0.6 mg/kg, respectively. However, the HM content in the collected roof and road runoff exceeds the environmental quality standard of surface water, resulting in HM accumulation [50,51,52]. The HM content in deep soil may be related to the pollution of basic building materials [20]. Combined with the skewness coefficient and kurtosis coefficient, it can be seen that Zn at 40–50 cm shows a right skewness in the content changes of Cu, Zn, and Cd, with a large Zn content value (Table 2).

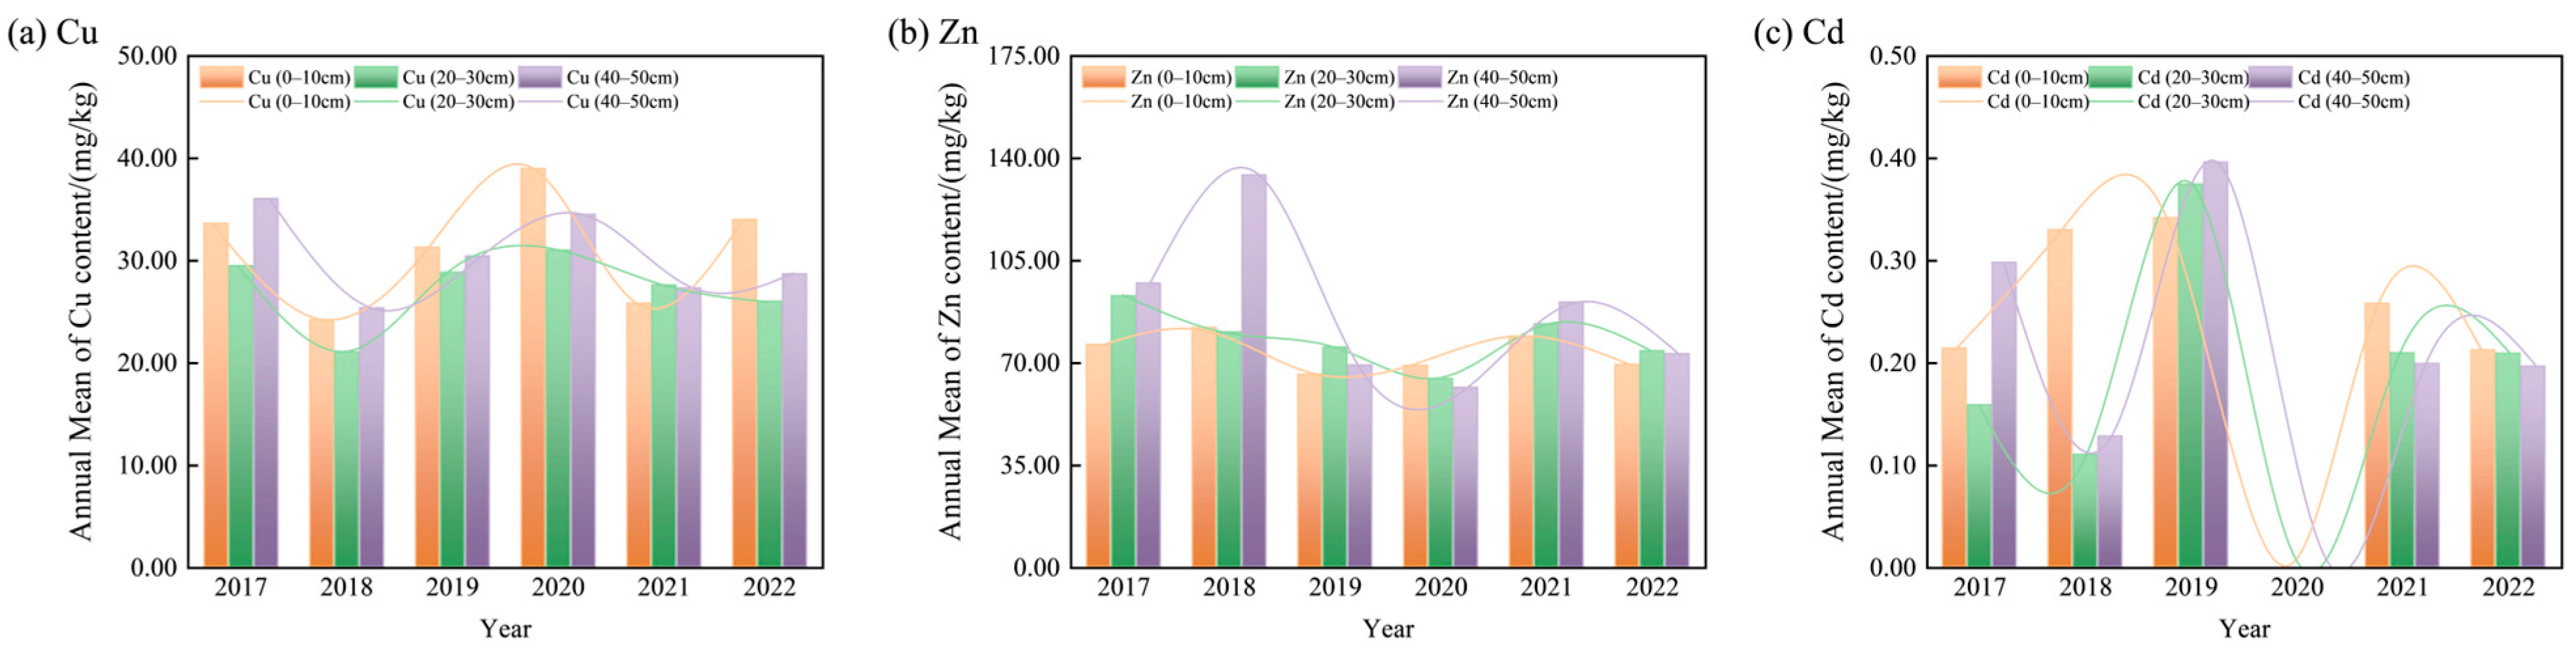
3.2. Temporal Variation of Soil HMs

The content of HMs in the rain garden soil was in the following order: Zn > Cu > Cd. To further analyze the cumulative effect of HMs in the soil, this paper first analyzed the spatial variation of HMs in soil, then analyzed their temporal variation (Figure 2).
Due to the influence of plants, humus, and rainfall runoff, the contents of Cu, Zn and Cd in the soil vary continuously at different soil depths (Figure 2). On 5 December 2022, the Cu content in the soil at depths of 0–10 cm, 20–30 cm, and 40–50 cm was 1.79, 1.09, and 1.24 times that of 27 April 2017, respectively. The Cu content increased slightly at the 0–10 cm depth (Figure 2a). The Zn content in the soil changed over time, decreasing at all layers from 27 April 2017 to 5 December 2022 (Figure 2). The reduction in Zn content from 2017 to 2022 was analyzed using Theil–Sen linear regression and the non-parametric Mann–Kendall (MK) test, and was found to be insignificant (β < 0, |Zc| < 1.96), indicating no significant reduction (Table 4). The Cd content in the soil on 5 December 2022 was 1.53, 1.25, and 0.32 times that of 27 April 2017, respectively, and accumulated at depths of 0–10 cm and 20–30 cm (Figure 2). The corresponding β values for Cd content were greater than 0, and |Zc| < 1.96, indicating that the accumulation was not significant (Table 4). The accumulation of Cu and Cd in the soil is consistent with previous studies [14,15,16], indicating that HMs mainly accumulate in the 0–10 cm depth.
The soil HM content exhibits seasonal and annual fluctuations. The Cu content in the soil shows an upward trend during the summer–autumn–winter period and a downward trend in the winter–spring–summer period (Figure 2a). From 2017 to 2022, the Cu content displayed cyclical changes, fluctuating from decreasing to increasing (Figure 3a). The Zn content in the soil shows an upward trend during the winter–spring–summer period and a downward trend in the summer–autumn–winter period (Figure 2b). Specifically, the Zn content in the 0–10 cm and 20–30 cm depth layers exhibits cyclical changes from decreasing to increasing, while the Zn content in the 40–50 cm depth layer shows a cyclical change from increasing to decreasing (Figure 3b). The Cd content in the soil shows no obvious seasonal variation throughout the year. However, the Cd content in the 0–10 cm and 40–50 cm depth layers demonstrates cyclical changes from increasing to decreasing, while the Cd content in the 20–30 cm depth layer shows a cyclical change from decreasing to increasing (Figure 3c). These fluctuations may be attributed to factors such as plant senescence, decreased microbial activity, dry deposition of HMs in winter, and soil erosion caused by rainfall during the summer and autumn, leading to a decrease in Cu and Zn content [53]. The competition for adsorption between Zn and Cd, with Zn having a stronger adsorption ability, results in only a slight change in the content of Cd [54].

3.3. Evaluation of HM Cumulative Effect

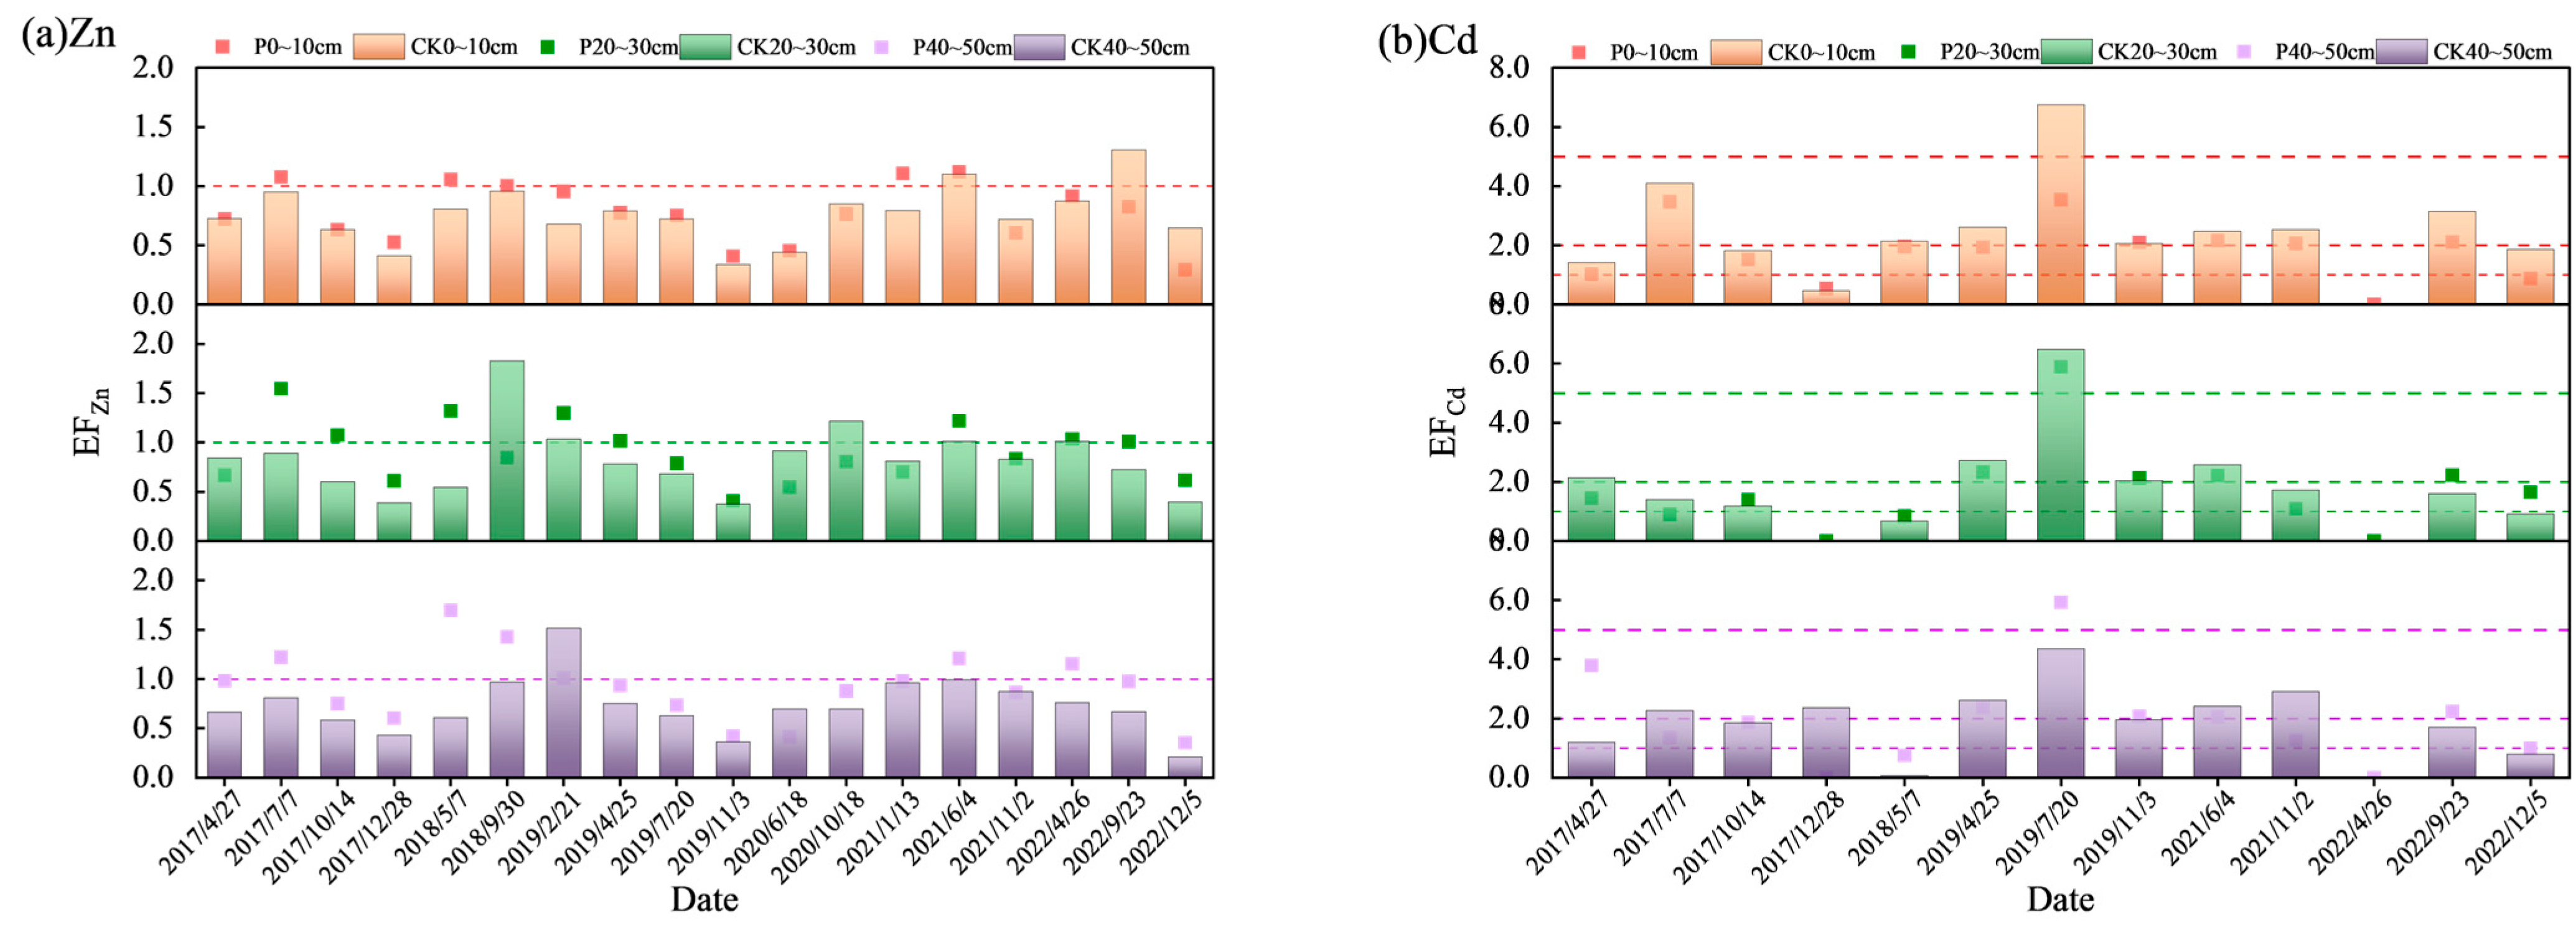
3.3.1. Evaluation Result of Enrichment Factor Method

Using the reference value of soil HMs in Shaanxi Province, China, as the background value, and using Cu as the calibration element, the enrichment factor ( E F ) is shown in Figure 4.
The E F of Zn and Cd at the observation point and control point of the rain garden were between 0–2 and 0–7, respectively, belonging to no enrichment to slight enrichment and no enrichment to severe enrichment. The frequency of E F of Zn and Cd in the observation points exceeding those in the control points was 72.22% and 35.90%, respectively, indicating that concentrated infiltration has an impact on the enrichment of HMs in the soil.
The mobility of Zn in soil is affected by various factors such as soil texture and pH value. In clay soils, it is more easily adsorbed and fixed by the soil, while in sandy soils, the larger the particle size, the weaker the adsorption capacity. In alkaline soil, zinc is more likely to form precipitates or be adsorbed on the surface of soil particles. The filler in the rain garden is loess, with a low soil porosity and a weakly alkaline pH. The Zn has a weak migration ability in the soil, and the soil has a strong adsorption capacity for Zn, resulting in a higher enrichment level at the observation point in the rain garden than at the control point.
The migration of Cd is affected by the movement of water in the soil. During rainfall, the water flow velocity in the soil pores is relatively fast, and cadmium may migrate laterally or vertically with the water flow. The concentrated infiltration effect of rain gardens leads to increased water inflow, increased soil moisture, and vigorous vegetation growth, resulting in a higher Cd concentration in the control point than in the observation point [55,56].

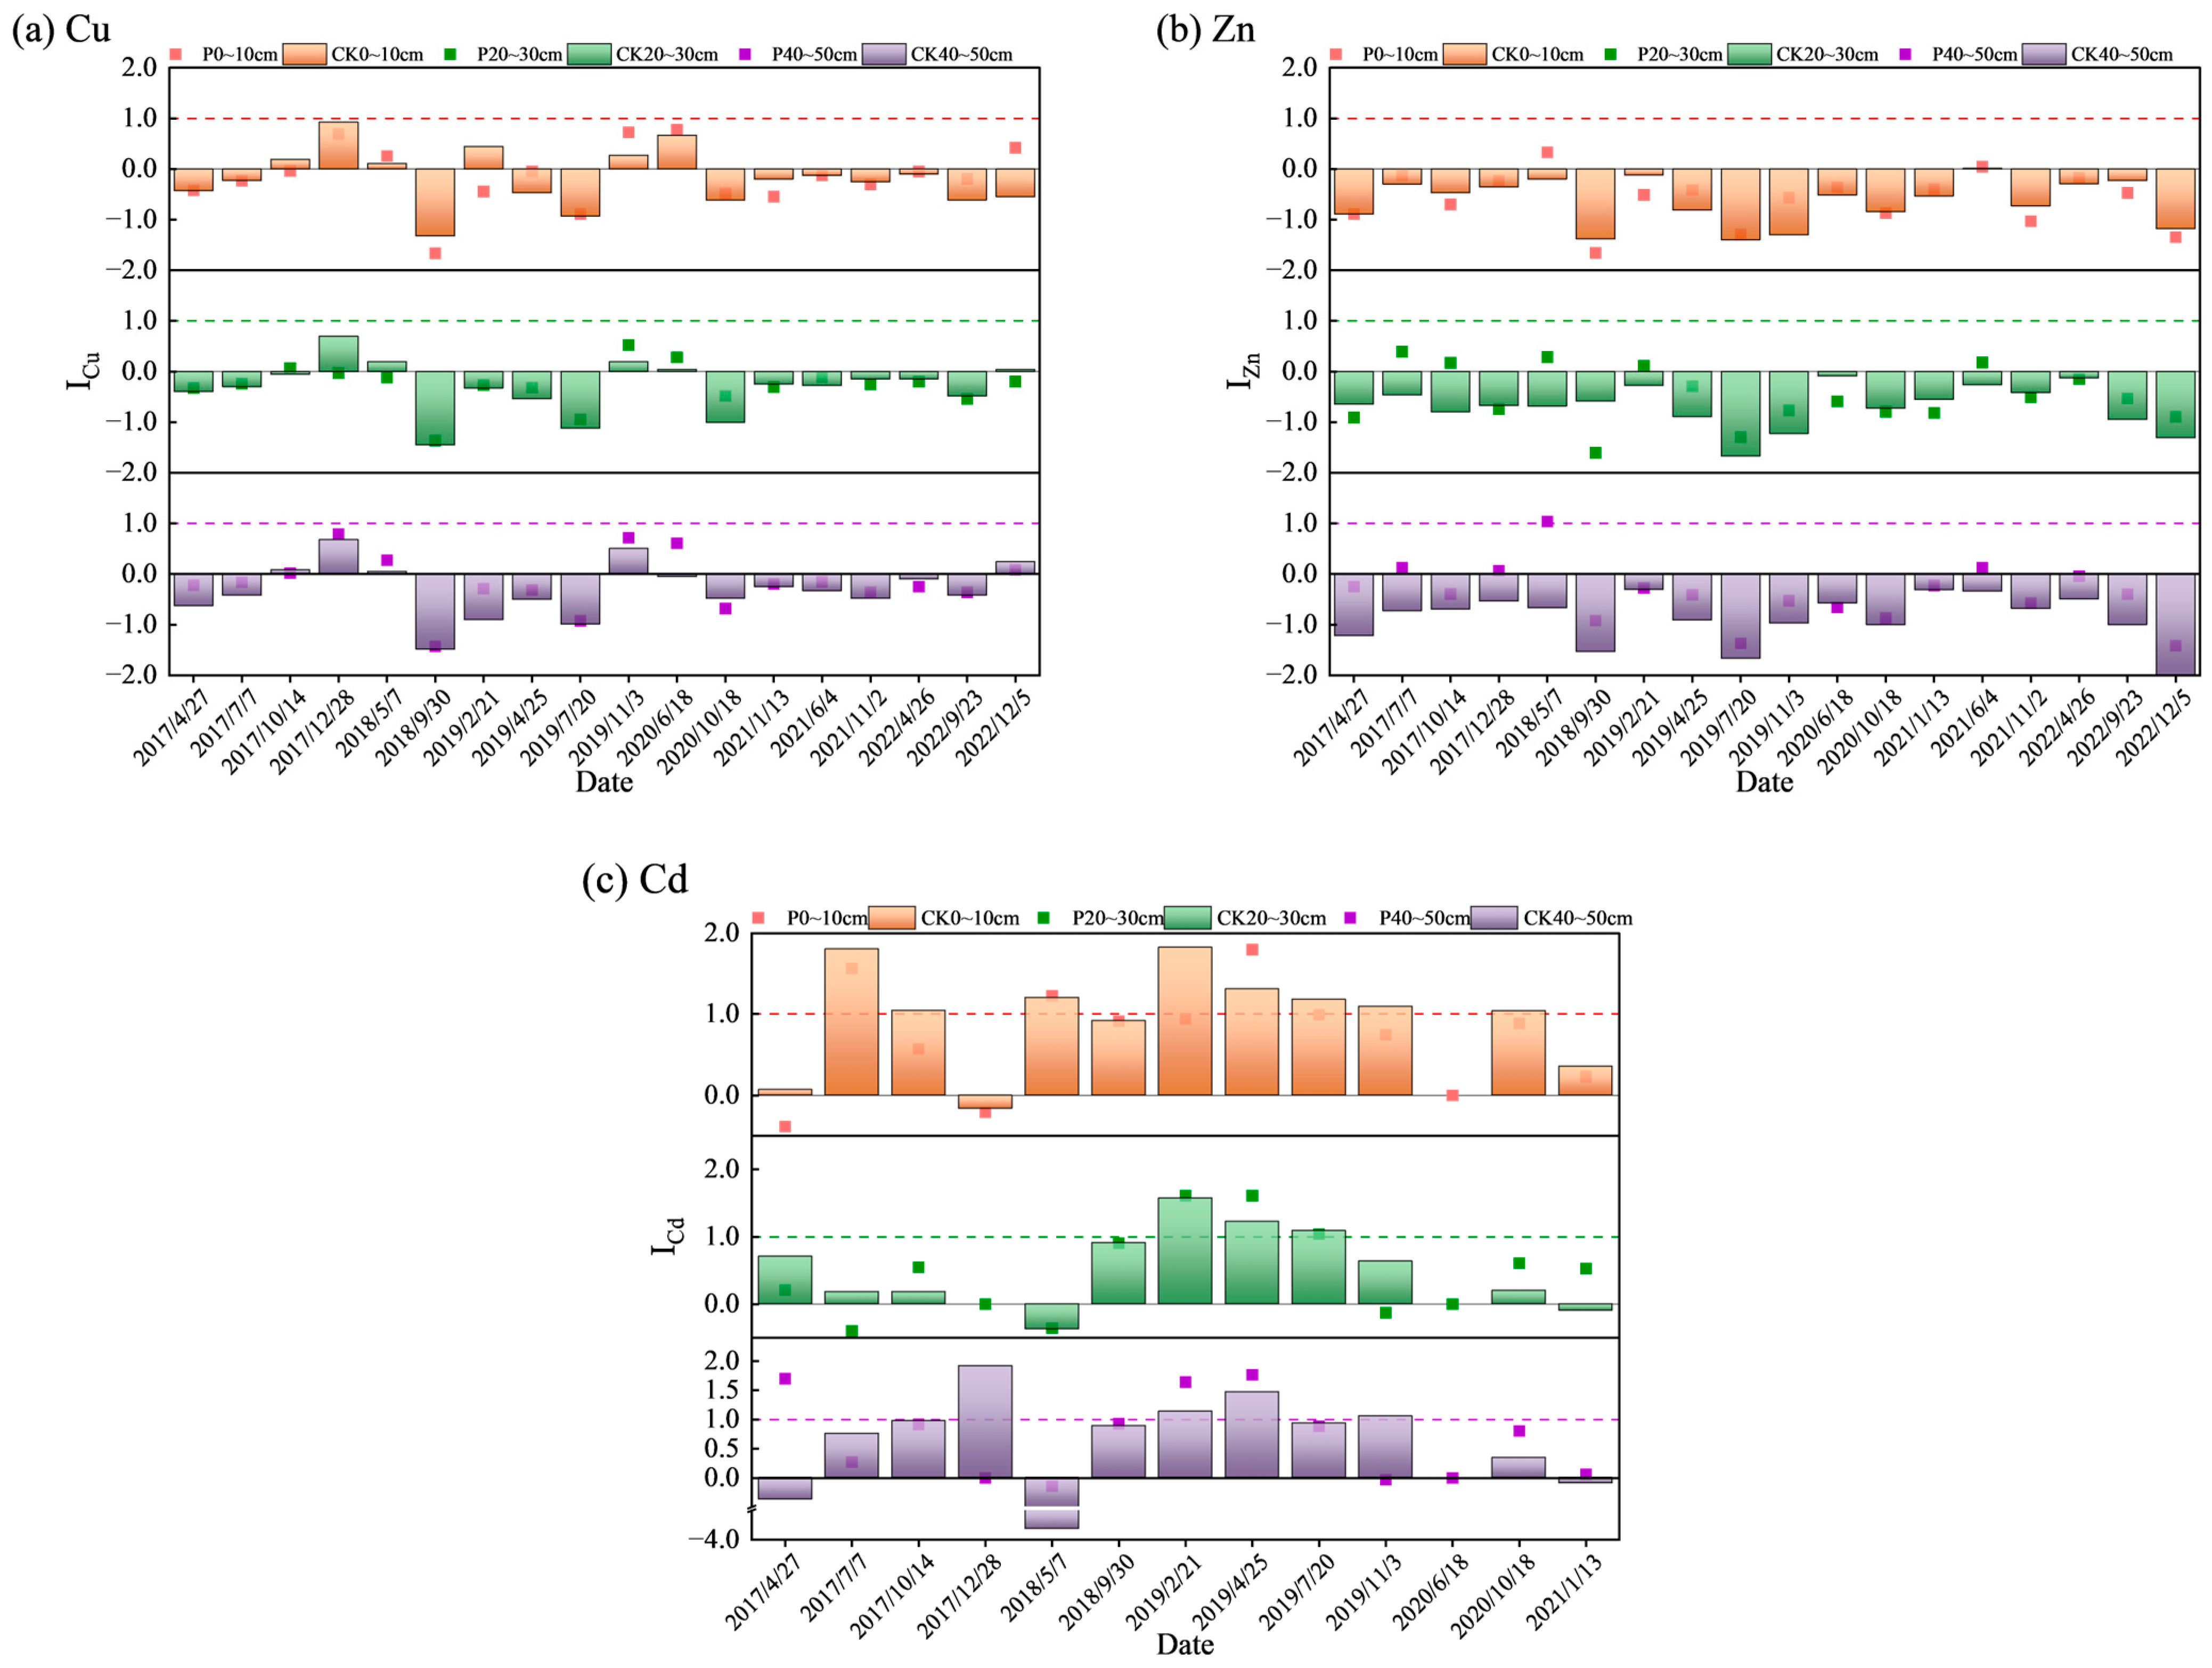
3.3.2. Evaluation Result of Geo-Accumulation Index

The cumulative effect of HMs on the rain garden soil was evaluated using the geo-accumulation index ( I g e o ). The I g e o of the observation and control points are calculated according to Equation (2). The changes in the plotted cumulative index method over time are shown in Figure 5.
As shown in Figure 5, the I g e o of Cu, Zn, and Cd at the observation point and the control point in the rain garden changed over time. The I g e o of Cu, Zn, and Cd at the observation point in the rain garden ranged from −2 to 1, −2.0 to 1.04, and −4 to 2.0, respectively, indicating a state of no enrichment to moderate enrichment. By December 2022, Cu at the observation point was at a slightly enriched level at 0–10 cm and 40–50 cm soil depths, and at a no enrichment level at 20–30 cm. At the control point, Cu was at a no enrichment level at 0–10 cm, and at a slightly enriched level at 20–30 cm and 40–50 cm. Zn at both the observation point and the control point was at a no enrichment level throughout the soil profile. The frequencies of the I g e o of Cu and Zn at the observation point being greater than that at the control point were 66.67% and 70.37%, respectively, and this frequency increased with the increase of soil depth, indicating that concentrated infiltration has an impact on the accumulation of soil HMs, and the deeper the soil layer, the greater the impact. The rain garden collects road surface rainwater. During vehicle operation, the wear of components such as tires and brake pads generates tiny particles containing Cu and Zn. The fuel and lubricating oil used by vehicles also contain Cu and Zn elements [57,58,59]. These are washed into the rain garden by rainwater runoff, resulting in a higher I g e o at the observation point than at the control point. Cd at both the observation point and the control point was at a slightly enriched level throughout the soil profile. In 2022, the I g e o of Cd was as follows: P0–10 cm < CK0–10 cm, P20–30 cm > CK20–30 cm, P40–50 cm > CK40–50 cm. This might be due to the absorption of Cd by the roots of herbaceous plants in the soil, resulting in a lower HM concentration at the 0–10 cm layer of the rain garden than at the control point. Conversely, the Cd concentration in the 20–50 cm soil layer of the rain garden was higher than that at the control point (Figure 5c). The main reason might be that under long-term operation conditions, the rain garden collects a large amount of rainwater from the road surface and the roof. This rainwater undergoes dry and wet deposition of HMs and is then washed into the rain garden, thereby increasing the concentration of HMs in the soil of the rain garden [49].
Comparative analysis of the E F and I g e o shows that HMs Cu and Zn in both the rain garden and naturally infiltrating soil are at non-enriched levels. In the rain garden soil, Cd exhibits slight enrichment at depths of 0–50 cm. Similarly, the E F indicates that Cd in naturally infiltrating soil is also slightly enriched at the same depth range. The I g e o shows that Cd is slightly enriched in the 0–10 cm depth range but is non-enriched in the 20–50 cm range. To minimize soil pollution risk, considering the maximum enrichment under the worst conditions, Cd in naturally infiltrating soil is regarded as slightly enriched.
The accumulation characteristics of HMs in sponge city facility soils, as studied by Lei et al. [60], differ from the results of this study, which align with the findings of Yan et al. [61]. This discrepancy might be related to the fact that Lei et al. collected soil and rainfall runoff from pavement in different functional zones at a single time point, such as the average content of Zn and Cd in the stormwater runoff from the road surface in Xi’an City from 2013 to 2014 being 137.92 μg/L and 0.25 μg/L, respectively [50], and the average content of Cu, Zn, and Cd in the stormwater runoff from 2014 to 2015 being 109.30 μg/L, 447.5 μg/L, and 2.33 μg/L, respectively [62]. In this study, the average concentrations of Cu, Zn and Cd in the inflow water of the rain garden were 52.18 μg/L, 115.40 μg/L, and 46.09 μg/L, respectively. The content of HMs in the runoff varies [63,64]. Alternatively, it could be due to the collection of soil samples at different time points [65,66]. Differences in soil HM content may arise from variations in time periods and the diverse effects of plants and microorganisms on HM retention, degradation, and rainfall characteristics. These factors lead to different amounts of HMs entering and being retained in the soil, resulting in temporal changes in soil HM content. This study, based on long-term data, minimizes biases from short-term environmental changes on HM content at specific sampling times and accommodates changes induced by seasonal variations.

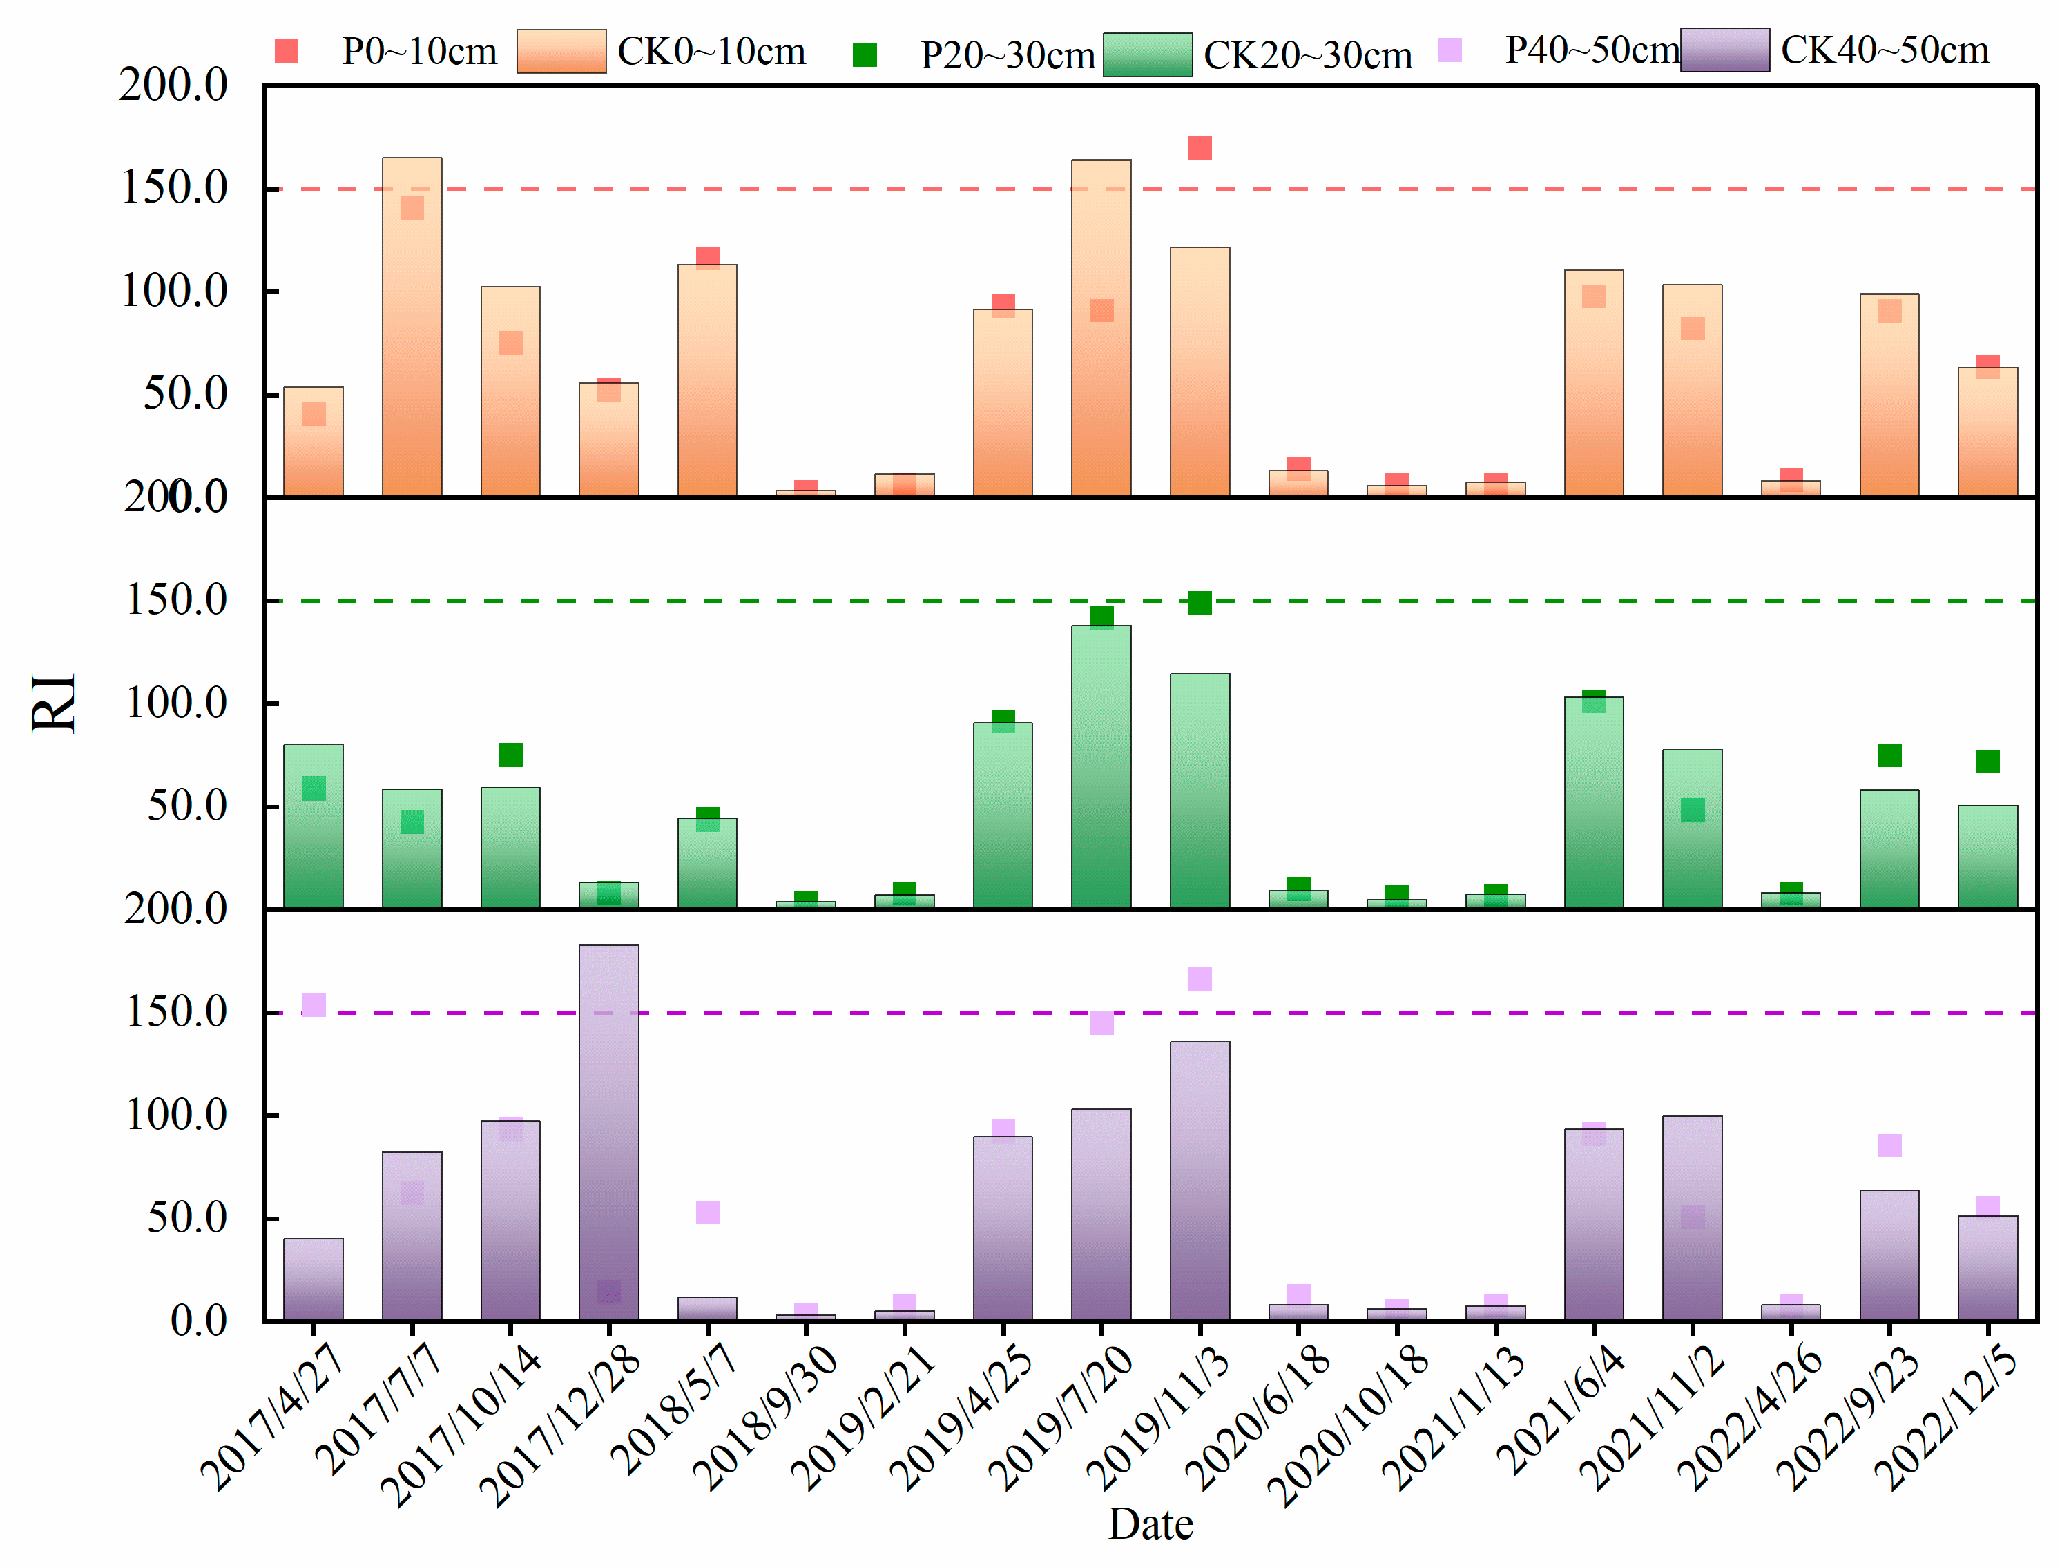
3.4. Ecological Risk Assessment of HM Pollutants

As shown in Table 5, the analysis of Er of soil HMs at the rain garden observation point and the control point indicates that Er of Cd is significantly higher than that of Zn and Cu. The average Er of Cd at the observation point and the control point at soil depths of 0–10 cm, 20–30 cm, and 40–50 cm are 83.83, 73.90, 87.07, 95.49, 72.16, and 79.83 respectively. Based on this, Cd is classified as a moderate and considerable potential risk element, while Zn and Cu belong to the low ecological risk category. Further comparison of the data from the observation point and the control point reveals that 88.9% of the data points of Er at each soil depth at the observation point are higher than those at the control point, revealing the impact of concentrated infiltration of rainwater runoff on the soil.
The potential ecological risk of the rain garden and naturally infiltrated soils changes over time are shown in Figure 6. The potential ecological risk index for HMs indicates that soil layers in the rain garden had higher values than those in naturally infiltrated soil, with both stabilizing over time. From 2017 to 2022, soils in rain gardens were generally at medium potential ecological risk, except for a few points (P40–50 cm on 27 April 2017; CK0–10 cm on 7 July 2017; CK0–10 cm on 20 July 2019; P0–10 cm and P40–50 cm on 3 November 2019). Most layers of potential ecological risk in naturally infiltrated soil from 2017 to 2022 were classified as low ecological risk. Cd in urban road dust in Xi’an is moderately polluted, while Zn and Cu are at low pollution levels, making it a high-risk ecological area [67]. There is a garbage dump around the rain garden, which dumps garbage every day and forms garbage dust, resulting in high levels of Cd in the dust on the road and roof [68]. The runoff washes away the road surface and roof, entering the rain garden, resulting in a higher ecological risk to the soil of the rain garden. Cd is the primary factor contributing to a higher comprehensive potential ecological risk index, as it has a relatively high toxicity response coefficient and makes a significant contribution to soil potential ecological risk due to its low background values. This also explains the severe pollution status of Cd in the soil [60,69,70]. The potential ecological risks of the observation and control points in the rain garden are both low, which is consistent with the research results of Liu and Chu et al. on biological retention facilities for different land types and residual sludge matrix biological retention facilities [71,72].
Boivin et al. [73] and Legret et al. [74] used deep soil at depths of 1.5 m and 2.5 m as control values, while Lind and Karro [75] utilized geochemical background values as control values. This study adopts geochemical background values for evaluation, comparing them with a control group. The comprehensive potential ecological risk index for HMs in rain gardens was found to be higher than in natural infiltration (Figure 6), suggesting that concentrated infiltration of rainfall runoff impacts the ecological safety of rain garden soil. Previous studies by scholars evaluated the static ecological risks of soil over time, while this article can derive the dynamic risk changes of rain garden soil over time based on the trend changes of observation and control points. By accounting for initial variations in soil HM content, this approach prevents errors in HM ecological risk assessment. Consequently, sponge city construction may increase the potential ecological risk of facility soil media. Maintenance departments for sponge city facilities should prioritize monitoring Cd content in both sponge city media and groundwater to ensure the healthy and effective operation of sponge cities. By analyzing the potential risks of fillers in sponge city measures, a foundation has been laid for calculating the operational lifespan of sponge city facilities.
This study, from the perspective of HM sources in rain garden soils, proposes key directions for future research. Firstly, it is recommended to systematically monitor HMs in rainwater and dry deposition within rain gardens and their catchment areas, in order to comprehensively understand the characteristics of HM inputs. Secondly, comparative analysis should be conducted to clarify the contribution rate of atmospheric deposition to soil HMs, thereby more accurately distinguishing between natural and anthropogenic sources. Lastly, further investigation into the spatiotemporal variation patterns of HM concentrations is needed to reveal their dynamic migration processes. These research efforts will contribute to a deeper understanding of the transport, transformation, and accumulation mechanisms of pollutants in rain gardens, while also providing important scientific basis for the optimized design and management of rain gardens.

4. Conclusions

This study investigated the accumulation and spatiotemporal distribution of HMs in a rain garden that has been collecting rainwater runoff from roads and roofs since 2012. The enrichment factor method, geo-accumulation index, and potential ecological hazard index were employed to assess pollution and ecological risk. The results showed that the concentrations of HMs (Zn, Cu, and Cd) in the rain garden soil were mostly higher than the soil background values in the Shaanxi Province and the control point, indicating varying degrees of accumulation. However, HM accumulation at different depths was inconsistent. Compared with the control point, the observation points of the rain garden accumulated more at the 40–50 cm soil depth, while Cu and Cd accumulated at depths of 0–10 cm. The seasonal and interannual variations in HM content in soil are mainly attributed to the influence of plants, microorganisms, rainfall, and the characteristics of HMs themselves. According to the enrichment factor and geo-accumulation index methods, Cu and Zn were non-enriched, whereas Cd was slightly enriched. In the single ecological risk factor index, both Cu and Zn showed a low pollution level at 0–50 cm soil depth, while Cd exhibited a strong pollution level. The comprehensive potential ecological risk assessment method was applied to both the rain garden and the naturally infiltrating plot soils. The results showed that both had low ecological risk levels. Cu and Zn are primarily influenced by traffic pollution sources generated by road vehicles, while Cd is associated with dust from garbage dumps. The rain garden is filled with loess, and the soil is weakly alkaline, which affects the transport of HMs. Additionally, vegetation also influences HM content in the soil. However, the rain garden soil had a slightly higher comprehensive potential ecological risk index for HMs than the naturally infiltrating soil, suggesting a minor impact from concentrated rainwater runoff infiltration. These findings highlight HM pollutants’ enrichment, potential ecological risks, and the need for further research, while also providing a foundation for assessing the operational lifespan of sponge city facilities. Future studies should measure metal concentrations in rainwater and dry deposition to clarify atmospheric contributions, distinguish natural from anthropogenic sources, and analyze spatial-temporal variations, enhancing understanding of transport and accumulation mechanisms in rain gardens.

Author Contributions

Conceptualization, D.Y. and H.L.; Formal analysis, D.Y.; Investigation, D.Y. and H.L.; Methodology, H.L. and C.J.; Resources, H.L. and J.L.; Writing—original draft, D.Y.; Writing—review and editing, D.Y., B.J. and B.C. All authors have read and agreed to the published version of the manuscript.

Funding

This research was funded by the National Natural Science Foundation of China, grant number 51879215 and 52000150.

Data Availability Statement

The data presented in this study are available on request from the corresponding author (Li Huaien, lhuaien@mail.xaut.edu.cn).

Acknowledgments

We are grateful to the editors and the anonymous reviewers for their insightful comments and suggestions.

Conflicts of Interest

Author Binkai Jia was employed by the company Shanxi Province Water Conservancy and Hydropower Survey Design & Research Institute Co., Ltd. The remaining authors declare that the research was conducted in the absence of any commercial or financial relationships that could be construed as a potential conflict of interest.

References

  1. Fletcher, T.D.; Shuster, W.; Hunt, W.F.; Ashley, R.; Butler, D.; Arthur, S.; Trowsdale, S.; Barraud, S.; Semadeni-Davies, A.; Bertrand-Krajewski, J.L.; et al. SUDS, LID, BMPs, WSUD and more—The evolution and application of terminology surrounding urban drainage. Urban Water J. 2015, 12, 525–542. [Google Scholar] [CrossRef]
  2. Tang, S.; Luo, W.; Jia, Z.; Li, S.; Wu, Y.; Zhou, M. Effect of rain gardens on storm runoff reduction. Adv. Water Sci. 2015, 26, 787–794. (In Chinese) [Google Scholar]
  3. Jia, Z.; Wu, S.; Tang, S.; Luo, W.; Xu, Q.; Shao, Z. Influences of focused recharge from rain gardens on groundwater level and water quality. Adv. Water Sci. 2018, 29, 221–229. (In Chinese) [Google Scholar]
  4. Xu, M.; Luo, W.; Jia, Z.; Tang, S.; Xu, Q.; Yin, X. Influence of rainwater garden infiltration on water content in unsaturated soil and groundwater. J. Yangzhou Univ. Nat. Sci. Ed. 2020, 23, 63–68. (In Chinese) [Google Scholar]
  5. Lefevre, G.H.; Paus, K.H.; Natarajan, P.; Gulliver, J.S.; Hozalski, R.M. Review of Dissolved Pollutants in Urban Storm Water and Their Removal and Fate in Bioretention Cells. J. Environ. Eng. 2015, 141, 04014050. [Google Scholar] [CrossRef]
  6. Li, H.; Davis, A.P. Urban Particle Capture in Bioretention Media. I: Laboratory and Field Studies. J. Environ. Eng. 2008, 134, 409–418. [Google Scholar] [CrossRef]
  7. Peter, T.; Weiss, L.G.; Gulliver, J.S. Contamination of Soil and Groundwater Due to Stormwater Infiltration Practices; University of Minnesota Stormwater Assessment Project; University of Minnesota: Minneapolis, MN, USA, 2008. [Google Scholar]
  8. Winiarski, T.; Bedell, J.P.; Delolme, C.; Perrodin, Y. The impact of stormwater on a soil profile in an infiltration basin. Hydrogeol. J. 2006, 14, 1244–1251. [Google Scholar] [CrossRef]
  9. Tedoldi, D.; Chebbo, G.; Pierlot, D.; Kovacs, Y.; Gromaire, M.C. Impact of runoff infiltration on contaminant accumulation and transport in the soil/filter media of Sustainable Urban Drainage Systems: A literature review. Sci. Total Environ. 2016, 569, 904–926. [Google Scholar] [CrossRef]
  10. Meland, S. Ecotoxicological Effects of Highway and Tunnel Wash Water Runoff; Norwegian University of Life Sciences: Ås, Norway, 2010. [Google Scholar]
  11. Sultan, M.B.; Choudhury, T.R.; Alam, M.N.; Doza, M.B.; Rahmana, M.M. Soil, dust, and leaf-based novel multi-sample approach for urban heavy metal contamination appraisals in a megacity, Dhaka, Bangladesh. J. Environ. Adv. 2022, 7, 100154. [Google Scholar] [CrossRef]
  12. Han, Q.; Liu, Y.; Feng, X.; Mao, P.; Wang, M. Pollution effect assessment of industrial activities on potentially toxic metal distribution in windowsill dust and surface soil in central China. J. Sci. Total Environ. 2021, 759, 144023. [Google Scholar] [CrossRef]
  13. Al-Ameri, M.; Hatt, B.; Coustumer, L.S.; Fletcher, T.; Payne, E.; Deletic, A. Accumulation of heavy metals in stormwater bioretention media: A field study of temporal and spatial variation. J. Hydrol. 2018, 567, 721–731. [Google Scholar] [CrossRef]
  14. Davis, A.P.; Shokouhian, M.; Ni, S. Loading estimates of lead, copper, cadmium, and zinc in urban runoff from specific sources. Chemosphere 2001, 44, 997–1009. [Google Scholar] [CrossRef]
  15. Hatt, B.E.; Fletcher, T.D.; Deletic, A. Hydraulic and pollutant removal performance of fine media stormwater filtration systems. Environ. Sci. Technol. 2008, 42, 2535–2541. [Google Scholar] [CrossRef]
  16. Muthanna, T.M.; Viklander, M.; Blecken, G.; Thorolfsson, S.T. Snowmelt pollutant removal in bioretention areas. Water Res. 2007, 41, 4061–4072. [Google Scholar] [CrossRef] [PubMed]
  17. Nightingale, H.I. Lead, zinc, and copper in soils of urban storm-runoff retention basins. J. Am. Water Works Assoc. 1975, 67, 443–446. [Google Scholar] [CrossRef]
  18. Schroeder, R.A. Potential for Chemical Transport Beneath a Stormwater Runoff Recharge (Retention) Basin for an Industrial Catchment in Fresno, California; Water-resources Investigations Report 93–4140; U.S. Geological Survey: Reston, VA, USA, 1995.
  19. Jones, P.S.; Davis, A.P. Spatial accumulation and strength of affiliation of heavy metals in bioretention media. J. Environ. Eng. 2013, 139, 479–487. [Google Scholar] [CrossRef]
  20. Kluge, B.; Markert, A.; Facklam, M.; Sommer, H.; Kaiser, M.; Pallasch, M.; Wessolek, G. Metal accumulation and hydraulic performance of bioretention systems after long-term operation. J. Soils Sediments 2018, 18, 431–441. [Google Scholar] [CrossRef]
  21. Duan, X.; Wang, S.; Li, J. Accumulation characteristics and risk of heavy metals and microbial community composition in bioretention systems: A case study of a university campus. Ecol. Eng. 2023, 193, 106996. [Google Scholar] [CrossRef]
  22. HJ 491-2019; Soil and Sediment—Determination of Copper, Zinc, Lead, Nickel and Chromium—Flame Atomic Absorption Spectrophotometry. China Environmental Publishing Group: Beijing, China, 2019.
  23. GB/T 17141-1997; Soil Quality—Determination of Lead, Cadmium—Graphite Furnace Atomic Absorption Spectrophotometry. Standards Press of China: Beijing, China, 1997.
  24. Wei, F. Modern Analytical Methods of Soil Elements; China Environmental Science Press: Beijing, China, 1992; pp. 74–88. [Google Scholar]
  25. Deng, Y.; Wang, S.; Bai, X.; Luo, G.; Wu, L.; Cao, Y.; Li, H.; Li, C.; Yang, Y.; Hu, Z.; et al. Variation trend of global soil moisture and its cause analysis. Ecol. Ind. 2020, 110, 105939–105949. [Google Scholar] [CrossRef]
  26. Luo, X.; Li, S.; Yang, W.; Liu, L.; Shi, Y.; Lai, Y.; Yu, P.; Yang, Z.; Luo, K.; Zhou, T.; et al. Spatio-temporal changes in global root zone soil moisture from 1981 to 2017. J. Hydrol. 2023, 626, 130297. [Google Scholar] [CrossRef]
  27. Feng, Z.; Chen, J.; Huang, R.; Yang, Y.; You, H.; Han, X. Spatial and Temporal Variation in Alpine Vegetation Phenology and Its Response to Climatic and Topographic Factors on the Qinghai–Tibet Plateau. Sustainability 2022, 14, 12802. [Google Scholar] [CrossRef]
  28. Xie, Z.; Zhang, Y.; Chen, D.; Yang, J.; Liang, Y. Research on assessment methods of heavy metal pollution in soil—Taking Guangzhou as an example. J. Agro-Environ. Sci. 2016, 35, 1329–1337. (In Chinese) [Google Scholar]
  29. Liu, Y.; Liu, M.; Wang, L.; Yin, A.; Huang, Z.; Yao, D.; Dai, W.; Wang, N.; Wang, H. Assessment of heavy metal pollution of farmland soil around an abandoned silicon plant in Yunnan. J. Agro-Environ. Sci. 2022, 41, 785–793. (In Chinese) [Google Scholar]
  30. Dong, C.; Zhang, M.; Zhang, H.; Yang, H.; Li, J.; Tan, F.; Dong, X.; Zhang, N.; Bao, L. Heavy Metal Characteristics and Comprehensive Quality Index Evaluation of Soil-Crop System in 11 Cities of Yunnan Province, China. J. Geosci. Environ. Prot. 2022, 10, 257–272. [Google Scholar] [CrossRef]
  31. Han, I.; Whitworth, K.W.; Christensen, B.; Afshar, M.; Han, H.A.; Rammah, A.; Oluwadairo, T.; Symanski, E. Heavy metal pollution of soils and risk assessment in Houston, Texas following Hurricane Harvey. Environ. Pollut. 2022, 296, 118717. [Google Scholar] [CrossRef]
  32. Hu, X.; Wang, C.; Zou, L. Characteristics of heavy metals and Pb isotopic signatures in sediment cores collected from typical urban shallow lakes in Nanjing, China. J. Environ. Manag. 2011, 92, 742–748. [Google Scholar] [CrossRef]
  33. Wang, L.; Dai, L.; Li, L.; Liang, T. Multivariable cokriging prediction and source analysis of potentially toxic elements (Cr, Cu, Cd, Pb, and Zn) in surface sediments from Dongting Lake, China. Ecol. Indic. 2018, 94, 312–319. [Google Scholar] [CrossRef]
  34. Wang, X.; Fu, R.; Li, H.; Zhang, Y.; Lu, M.; Xiao, K.; Zhang, X.; Zheng, C.; Xiong, Y. Heavy metal contamination in surface sediments: A comprehensive, large–scale evaluation for the Bohai Sea. China. Environ. Pollut. 2020, 260, 113986. [Google Scholar] [CrossRef]
  35. Wei, Z.; Wang, D.; Zhou, H.; Qi, Z. Assessment of Soil Heavy Metal Pollution with Principal Component Analysis and Geo-accumulation Index. Procedia Environ. Sci. 2011, 10, 1946–1952. [Google Scholar]
  36. Hasan, A.B.; Kabir, S.; Reza, A.H.M.S.; Zaman, M.N.; Ahsan, A.; Rashid, M. Enrichment factor and geo-accumulation index of trace metals in sediments of the ship breaking area of Sitakund Upazilla (Bhatiary–Kumira), Chittagong, Bangladesh. J. Geochem. Explor. 2013, 125, 130–137. [Google Scholar] [CrossRef]
  37. Zhang, J.; Li, X.; Guo, L.; Deng, Z.; Wang, D.; Liu, L. Assessment of heavy metal pollution and water quality characteristics of the reservoir control reaches in the middle Han River, China. Sci. Total Environ. 2021, 799, 149472. [Google Scholar] [CrossRef] [PubMed]
  38. Wu, G.; Wang, L.; Yang, R.; Hou, W.; Zhang, S.; Guo, X.; Zhao, W. Pollution characteristics and risk assessment of heavy metals in the soil of a construction waste landfill site. Ecol. Inform. 2022, 70, 101700. [Google Scholar] [CrossRef]
  39. Guo, W.; Zhao, R.; Zhang, J.; Bao, Y.; Wang, H.; Yang, M.; Sun, X.; Jin, F. Characteristics and Assessment of Heavy Metal Pollution in Soil of Baotou Iron Mine Area, Inner Mongolia. Chin. J. Environ. Sci. 2011, 32, 3099–3105. (In Chinese) [Google Scholar]
  40. Onkal-Engin, G.; Demir, I.; Hiz, H. Assessment of urban air quality in Istanbul using fuzzy synthetic evaluation. Atmos. Environ. 2004, 38, 3809–3815. [Google Scholar] [CrossRef]
  41. Zhai, H.; Lu, W.; Yang, W.; Li, J. Application of fuzzy mathematics and pollution index method in soil heavy metal pollution. J. Soil 2008, 2, 212–215. (In Chinese) [Google Scholar]
  42. Liang, Z.; Chen, C.; Han, Y.; Cheng, C.; Luo, Y.; Xu, W.; Chen, Q.; Ren, S. Assessment of heavy metal pollution in sewage irrigated soil in Dunhua Irrigation District of Taiyuan City based on fuzzy mathematics. Huanjing Huaxue 2010, 29, 1152–1157. (In Chinese) [Google Scholar]
  43. Chabukdhara, M.; Nema, A.K. Assessment of heavy metal contamination in Hindon River sediments: A chemometric and geochemical approach. Chemosphere 2012, 87, 945–953. [Google Scholar] [CrossRef] [PubMed]
  44. Sutherland, R.A. Bed sediment-associated trace metals in an urban stream, Oahu, Hawaii. Environ. Geol. 2000, 39, 611–627. [Google Scholar] [CrossRef]
  45. Muller, G. Index of geo-accumulation in sediments of the Rhine River. Geojournal 1969, 2, 108–118. [Google Scholar]
  46. Hakanson, L. An ecological risk index for aquatic pollution control: A seal approach. Water Res. 1980, 14, 975–1001. [Google Scholar] [CrossRef]
  47. Guo, C.; Li, J.; Li, H.; Li, Y. Influences of stormwater concentration infiltration on the heavy metal contents of soil in rain gardens. Water Sci. Technol. 2020, 81, 1039–1051. [Google Scholar] [CrossRef] [PubMed]
  48. Davis, A.P.; Shokouhian, M.; Sharma, H.; Minami, C.; Winogradoff, D. Water quality improvement through bioretention: Lead, copper, and zinc removal. Water Environ Res. 2003, 75, 73–82. [Google Scholar] [CrossRef] [PubMed]
  49. Yan, X. Study on Pollution Characteristics of Heavy Metals in Atmosphere, Soil and Precipitation in Xi’an City. Master’s Thesis, Xi’an University of Architecture and Technology, Xi’an, China, 2013. (In Chinese). [Google Scholar]
  50. Wu, M. Study on the Characteristics of Heavy Metal and PAHs of Road Runoff of Xi’an City. Master’s Thesis, Chang’an University, Xi’an, China, 2016. (In Chinese). [Google Scholar]
  51. Guo, W.; Zhang, Z.; Wen, X.; Zhang, H.; Wang, Y. Contamination Characteristics of Surface Runoff in Densely Populated Areas in Downstream Yangtze River, China. Chin. J. Environ. Sci. 2021, 42, 3304–3315. (In Chinese) [Google Scholar]
  52. Dong, W.; Chen, X.; Wei, X.; Zhao, Z. Characteristics of Heavy Metal Pollution in Road Runoff in Urumqi City. Huanjing Gongcheng 2014, 32, 105–110. (In Chinese) [Google Scholar]
  53. Wang, Z.; Shan, J.; Liu, C.; Wang, K.; Teng, H.; Jiang, Q. Effects of winter warming on the migration characteristics and pollution risk assessment of Zn, Cu, and Pb in the snow-soil continuum in seasonal snow cover area. Environ. Technol. Innov. 2023, 31, 103159. [Google Scholar] [CrossRef]
  54. Lin, Q. Experimental Study on Adsorption and Migration of Heavy Metals Cu, Cd, Zn, Pb in Soil. Master’s Thesis, Qingdao University, Qingdao, China, 2008. (In Chinese). [Google Scholar]
  55. Wang, S.; Wang, Y.; Zhao, Y.; Hou, Y. Research progress in heavy metal pollution and phytoremediation in soil. J. Agric. 2023, 13, 20–23+32. (In Chinese) [Google Scholar]
  56. Narayanan, M.; Ma, Y. Mitigation of heavy metal stress in the soil through optimized interaction between plants and microbes. J. Environ. Manag. 2023, 345, 11872. [Google Scholar] [CrossRef]
  57. Lin, Y.; Wu, M.; Fang, F.; Wu, J.; Ma, K. Characteristics and influencing factors of heavy metal pollution in surface dust from driving schools of Wuhu, China. Atmos. Pollut. Res. 2020, 12, 305–315. [Google Scholar] [CrossRef]
  58. Wi, E.; Park, E.; Shin, H.; Hong, J.; Jeong, S.; Kwon, J.T.; Lee, H.; Lee, J.; Kim, Y. Overall distribution of tire-wear particles, nano carbon black, and heavy metals in size-fractionated road dust collected from steel industrial complexes. Sci. Total Environ. 2023, 884, 163878. [Google Scholar] [CrossRef]
  59. Yesilonis, I.D.; Pouyat, R.V.; Neerchal, N.K. Spatial distribution of metals in soils in Baltimore, Maryland: Role of native parent material, proximity to major roads, housing age and screening guidelines. Environ. Pollut. 2008, 156, 723–731. [Google Scholar] [CrossRef]
  60. Lei, X.; Qiu, L.; Wei, Z.; Yang, C.; He, B. Pollution characteristics and risk assessment of heavy metals in the bioretention systems of sponge cities. Environ. Sci. 2022, 43, 4127–4135. (In Chinese) [Google Scholar]
  61. Yan, D.; Li, H.; Li, J.; Chao, X.; Hao, S.; Song, K. Study on accumulation and pollution risk of heavy metals in rain garden soil. Acta Sci. Circumstantiae 2021, 41, 3359–3365. (In Chinese) [Google Scholar]
  62. Yuan, H.; Zheng, P.; Li, X.; Wang, X. Four season pollution characteristics of heavy metals in runoff rainwater from different underlying road surfaces in Xi’an City. J. Ecol. Environ. 2014, 23, 1170–1174. [Google Scholar] [CrossRef]
  63. Bezuglova, O.S.; Gorbov, S.N.; Tischenko, S.A.; Aleksikova, A.S.; Tagiverdiev, S.S.; Sherstnev, A.K.; Dubinina, M.N. Accumulation and migration of heavy metals in soils of the Rostov region, south of Russia. J. Soils Sediments 2016, 16, 1203–1213. [Google Scholar] [CrossRef]
  64. Wang, F.; Dong, W.; Zhao, Z.; Wang, H.; Li, W.; Chen, G.; Wang, F.; Zhao, Y.; Huang, J.; Zhou, T. Heavy metal pollution in urban river sediment of different urban functional areas and its influence on microbial community structure. Sci. Total Environ. 2021, 778, 146383. [Google Scholar] [CrossRef]
  65. He, M.; Yan, P.; Yu, H.; Yang, S.; Xu, J.; Liu, X. Spatiotemporal modeling of soil heavy metals and early warnings from scenarios-based prediction. Chemosphere 2020, 255, 126908. [Google Scholar] [CrossRef]
  66. Huang, S.; Liao, Q.; Hua, M.; Wu, X.; Bi, K.; Yan, C.; Chen, B.; Zhang, X. Survey of heavy metal pollution and assessment of agricultural soil in Yangzhong district, Jiangsu Province, China. Chemosphere 2007, 67, 2148–2155. [Google Scholar] [CrossRef]
  67. Wang, X.; Gao, Q.; Wang, W.; Yan, J.; Liu, Y.; Kuang, S.; Lu, J. Determining priority control factors for heavy metal management in urban road dust based on source-oriented probabilistic ecological-health risk assessment: A study in Xi’an during peak pollution season. J. Environ. Manag. 2024, 369, 122105. [Google Scholar] [CrossRef] [PubMed]
  68. Tang, J.; Tang, H.; Sima, W.; Wang, H.; Zou, D.; Qiu, B.; Qu, J.; Liang, R.; Dong, J.; Liao, Y.; et al. Heavy metal pollution level and potential ecological risk assessment of sludge landfill. Environ. Prog. Sustain. Energy 2022, 41, e13795. [Google Scholar] [CrossRef]
  69. Huang, H.; Xu, Z.; Yan, J.; Zhao, X.; Wang, D. Characteristics of Heavy Metal Pollution and Ecological Risk Evaluation of Indoor Dust from Urban and Rural Areas in Taiyuan City During the Heating Season. Environ. Sci. 2021, 42, 2143–2152. (In Chinese) [Google Scholar]
  70. Zhao, Z.; Zhao, W.; Huang, T.; Cheng, S.; Yu, L.; Yin, Y. Seasonal Characteristics and Ecological Risk Assessment of Heavy Metals in PM10 Around Electroplating Plants. Environ. Sci. 2018, 39, 18–26. (In Chinese) [Google Scholar]
  71. Liu, X. Characteristics of Heavy Metal Removal and Migration Accumulation in Residual Sludge Matrix Bioretention Facility. Master’s Thesis, Hebei University of Engineering, Handan, China, 2022. (In Chinese). [Google Scholar] [CrossRef]
  72. Chu, Y.; Yang, L.; Zhou, Y.; Wang, X.; Wang, S.; Zhang, M. Distribution characteristics and risk assessment of heavy metal accumulation in typical bioretention facilities. Environ. Sci. 2022, 43, 3608–3622. (In Chinese) [Google Scholar]
  73. Boivin, P.; Saadé, M.; Pfeiffer, H.R.; Hammecker, C.; Degoumois, Y. Depuration of highway runoff water into grass-covered embankments. Environ. Technol. 2008, 29, 709–720. [Google Scholar] [CrossRef]
  74. Legret, M.; Demare, D.; Balades, J.D.; Madiec, M. Study of heavy metal pollution in a storm water infiltration area. In Proceedings of the Novatech ’92, International Conference on Innovative Technologies in the Domain of Urban Stormwater Drainage, Lyon, France, 3–5 November 1992; pp. 33–42. [Google Scholar]
  75. Lind, B.; Karro, E. Stormwater infiltration and accumulation of heavy metals in roadside green areas in Goteborg, Sweden. Ecol. Eng. 1995, 5, 533–539. [Google Scholar] [CrossRef]
Figure 1. Location of the rain garden. Note: (a) Map of China showing the location of Xi’an, Shaanxi Province; (b) Map of Xi’an showing the location of Xi’an University of Technology; (c) On-site photograph of the rain garden; (d) Top-view schematic diagram of the rain garden and its catchment area.
Water 17 00955 g001
Figure 2. Temporal and spatial variations of HM content in soil of long-term operating rain gardens. Note: (a) variation of Cu content in soil depths of 0–10 cm, 20–30 cm, and 40–50 cm; (b) variation of Zn content in soil depths of 0–10 cm, 20–30 cm, and 40–50 cm; (c) variation of Cd content in soil depths of 0–10 cm, 20–30 cm, and 40–50 cm.
Water 17 00955 g002
Figure 3. Interannual variation of soil HMs from 2017 to 2022. Note: (a) Cu; (b) Zn; (c) Cd.
Water 17 00955 g003
Figure 4. Variation of of EF observation and control points in rain garden. Note: (a) Zn; (b) Cd. P0–10 cm, P20–30 cm, and P40–50 cm represent the soil at depths of 0–10 cm, 20–30 cm, and 40–50 cm in the rain garden; CK0–10 cm, CK20–30 cm, and CK40–50 cm represent natural infiltration areas of 0–10 cm, 20–30 cm, and 40–50 cm soil (control point). The dashed line in Figure 4 represents the maximum critical value of enrichment coefficient corresponding to different enrichment levels in the enrichment coefficient method.
Water 17 00955 g004
Figure 5. Variation of I g e o of the observation and control points in rain garden. Note: (a) Cu; (b) Zn; (c) Cd. P0–10 cm, P20–30 cm, and P40–50 cm represent the soil at depths of 0–10 cm, 20–30 cm, and 40–50 cm in the rain garden; CK0–10 cm, CK20–30 cm, and CK40–50 cm represent natural infiltration areas of 0–10 cm, 20–30 cm, and 40–50 cm soil (control point). The dashed line represents the maximum critical cumulative index corresponding to the cumulative degree classification of the ground accumulation index.
Water 17 00955 g005
Figure 6. Variation of potential ecological risk index of soil HMs over time Note: P0–10 cm, P20–30 cm, and P40–50 cm represent the soil at depths of 0–10 cm, 20–30 cm, and 40–50 cm in the rain garden; CK0–10 cm, CK20–30 cm, and CK40–50 cm represent natural infiltration areas of 0–10 cm, 20–30 cm, and 40–50 cm soil (control point). The dashed line represents the critical potential hazard index corresponding to the classification of potential ecological hazards index.
Water 17 00955 g006
Table 1. Scale used to describe risk factors of E F , I g e o , E r i , and R I .
Grade   Standards   for   E F Grade   Standards   for   I g e o
Class E F Enrichment statusClass I g e o Sediment quality
I≤1No enrichmentII≤0No enrichment
II1~2Slight enrichmentIII0~1Slight enrichment
III2~5Moderate enrichmentIV1~2Moderate enrichment
IV5~20Severe enrichmentV2~3Moderately strong enrichment
V20~40Very severe enrichmentVI3~4Strong enrichment
VI>40Extremely severe enrichmentVI4~5Quite strong enrichment
VII>5Extremely strong enrichment
Potential ecological risk for monomial factorPotential ecological risk for multinomial factor
E r i <40Low ecological risk R I <150Low ecological risk
40~80Moderate ecological risk150~300Moderate ecological risk
80~160Considerable ecological risk300~600Considerable ecological risk
160~320High ecological risk≥600Very high ecological risk
≥320Very high ecological risk
Table 2. Description of statistics of different depths of HM pollutants in rain garden (n = 18).
HM ElementsSoil Layer/cmMean mg/kgFEB/%FER/%CV/%Skbk
Cu0–10 cm31.4288.8961.1139.460.65−0.10
20–30 cm27.6788.8961.1126.940.451.90
40–50 cm30.7483.3377.7837.990.880.45
Zn0–10 cm32.9461.1161.1175.300.480.39
20–30 cm34.1950.0055.5689.490.54−0.92
40–50 cm39.0072.2294.4499.552.106.61
Cd0–10 cm0.2677.7815.3843.850.540.28
20–30 cm0.2272.2250.0052.290.94−0.04
40–50 cm0.2666.6753.8552.650.63−0.93
Note: FEB: frequency of sample points exceeding the background value of Shaanxi Province; FER: frequency of sample points exceeding the control point (CK); CV: coefficient of variation; Sk: skewness; bk: kurtosis.
Table 3. Statistics of cumulative pollutant input of HMs (Cu, Zn, and Cd) in rain garden (P) and natural infiltration area (CK) from 2017 to 2022.
ElementCuZnCd
CKPCKPCKP
EMC/(ug/L)5.4552.1872.14115.400.3246.09
Pollutant concentration/(ug/L)2.05~12.1616.50~70.4416.94~273.460.80~558.60.10~1.315.96~372.20
Dry deposition flux/(mg/m2)13.8013.80627.58627.581.091.09
Wet deposition flux/(mg/m2)19.1619.16268.16268.161.271.27
Total pollutant amount/(mg)014,284.52031,591.28012,617.08
Note: EMC: average concentration of pollutants. The mean concentration of pollutants in CK represents the concentration of HMs in precipitation, while the mean concentration of pollutants in P represents the concentration of HMs in surface runoff from concentrated infiltration; P: rain garden; CK: control point, naturally infiltrated soil.
Table 4. Results of trend analysis for HM concentrations (Cu, Zn, and Cd) at various soil depths.
CuZnCd
0–10 cm20–30 cm40–50 cm0–10 cm20–30 cm40–50 cm0–10 cm20–30 cm40–50 cm
β0.2600−0.1020−0.1568−0.3746−0.6700−2.01380.00430.0058−0.0044
Zc0.3788−0.1136−0.4924−0.2273−0.6818−1.36360.06860.8563−0.7785
Note: β > 0 indicates that soil HMs have an increasing trend over time; β < 0 indicates a decreasing trend of soil HMs over time. Significant decrease and increase trends correspond to negative and positive Theil–Sen estimation, respectively, with a significant Mann–Kendall test (|Zc| > 1.96). Insignificant decrease and increase trends correspond to negative and positive Theil–Sen estimation, respectively, with a significant Mann–Kendall test (|Zc|< 1.96).
Table 5. Statistical analysis values of single ecological factors.
HM ElementsSoil Layer/cmEiPEiCK
MinMaxMeanMinMaxMean
Cu0–102.3612.857.343.0014.277.12
20–302.9110.776.462.7412.156.46
40–502.7812.967.182.6811.996.46
Zn0–100.471.891.050.571.511.01
20–300.491.971.150.471.410.97
40–500.563.081.240.371.220.86
Cd0–1034.47156.3883.8340.21159.5795.49
20–3034.15137.2373.9034.79134.0472.16
40–5040.85153.1987.073.19169.7979.83
Note: EiP refers to the potential ecological risk index of the observation points; EiCK refers to the potential ecological risk index of the control points.
Disclaimer/Publisher’s Note: The statements, opinions and data contained in all publications are solely those of the individual author(s) and contributor(s) and not of MDPI and/or the editor(s). MDPI and/or the editor(s) disclaim responsibility for any injury to people or property resulting from any ideas, methods, instructions or products referred to in the content.

