Article

Investigating Sedimentation Patterns and Fluid Movement in Drip Irrigation Emitters in the Yellow River Basin

1
Key Laboratory of Water-Saving Agriculture of Henan Province, Institute of Farmland Irrigation of Chinese Academy of Agricultural Science, Xinxiang 453002, China
2
Graduate School of Chinese Academy of Agricultural Science, Beijing 100081, China
*
Author to whom correspondence should be addressed.
These authors contributed equally to this work
Water 2025, 17(7), 910; https://doi.org/10.3390/w17070910
Submission received: 17 January 2025 / Revised: 11 March 2025 / Accepted: 18 March 2025 / Published: 21 March 2025
(This article belongs to the Special Issue Advances in Agricultural Irrigation Management and Technology)

Abstract

:
Developing efficient water-saving irrigation technologies that utilize high sand-laden water is an important approach to alleviating agricultural water scarcity in the Yellow River Basin. This study aims to investigate sedimentation patterns and fluid movement characteristics in drip irrigation emitters under such challenging water conditions. The dynamic changes in Dra and Cu were determined through short-period intermittent clogging tests to evaluate the anti-clogging performance of four different emitter types. The distribution and particle size composition of the deposited sediments inside the emitters were analyzed using a high-resolution electron microscope and a laser particle size analyzer. Additionally, the RNG k-ε turbulence model was used to simulate the fluid movement inside the emitters. The results showed that the B drip irrigation belt had better sediment tolerance and operational stability. The anti-clogging capacity of drip irrigation can be improved by optimizing the combination of emitter channel structure and sediment content. The fluid in the channel was divided into mainstream zone and vortex zone. Sediment particles increased in the backing-water zone and vortex center, where particles of 0.05–0.1 mm were more prone to settling due to reduced transport capacity. Energy dissipation primarily took place at the curvature of the emitter channel, and within each channel unit, gradually decreasing along the vortex flow direction, with the lowest dissipation aligning with sediment deposition zones. These findings provide a theoretical basis for mitigating clogging in high sand-laden water drip irrigation systems, offering valuable insights for improving the effective utilization of water resources in the Yellow River Basin.

1. Introduction

Water is an essential resource for human survival and a scarce, irreplaceable, and valuable natural asset. China has long faced severe water scarcity, with per capita water resources amounting to only one-fourth of the global average. Additionally, the uneven spatial and temporal distribution of water resources significantly constrains regional economic development in China [1,2]. In recent years, escalating water pollution and resource waste have further exacerbated the crisis, posing serious challenges to both economic activities and daily life [3]. As a major agricultural country, China faces significant challenges due to the shortage of agricultural water resources, which greatly hinders the development of its agriculture. To promote the sustainable development of agriculture, many agricultural experts have turned their focus toward utilizing non-traditional water sources, such as recycled water, mildly saline water, and high sand-laden water [4,5,6,7]. Due to its high sediment content, Yellow River water is difficult to use effectively. Even after certain filtration treatments, completely removing all suspended solids remains impossible. These fine particles are deposited in the emitter channel, the accumulated particles gradually reduce the emitter channel’s cross-sectional area, obstructing water flow and decreasing velocity. This further accelerates sediment deposition, ultimately leading to severe clogging [8]. Figure 1 is a simplified diagram illustrating the role of particle adhesion and precipitation in the emitter clogging process. Additionally, seasonal flow variations, over-extraction, and pollution further complicate its sustainable utilization in irrigation systems. Therefore, the application of Yellow River water in agricultural irrigation faces many challenges. Nevertheless, with continuous technological advancement, an increasing number of researchers are focusing on how to effectively utilize the high sediment content in Yellow River water, exploring new treatment and irrigation technologies to reduce the negative impact of poor water quality on agricultural production [9]. Drip irrigation, known for its water-saving efficiency, has gradually gained widespread attention in this context [10]. Drip irrigation systems can precisely control the flow rate and water application, reducing water loss and directly supplying moisture to plant roots, thereby improving water use efficiency [11]. However, when applying Yellow River water in drip irrigation, the sand particles and suspended matter in water easily cause emitter clogging, which in turn affects irrigation effectiveness and the proper functioning of the system [12]. Therefore, addressing the problems caused by sediment deposition and clogging in drip irrigation systems has become a critical technical challenge that needs to be overcome.
Emitters are the heart of drip irrigation systems, with their efficiency and lifespan critical to the system’s performance [13]. Anti-clogging capability is a key criterion for assessing the quality of emitters, significantly influencing the overall system’s operational lifespan [14]. Enhancing an emitter’s anti-clogging capability helps to ensure the long-term efficient functioning of the system while also reducing maintenance and management costs [15]. At the same time, in areas lacking water resources, not only conventional groundwater and surface water but also low-quality water, such as reclaimed water and high sand-laden water, are frequently utilized for drip irrigation [5,6,7]. These low-quality waters contain a large number of metal ions, suspended particles, and organisms, which greatly increase the likelihood of blockage in drip irrigation emitters and contribute to more complex clogging mechanisms [16,17]. The blockage of the emitter channel is a significant obstacle to the drip irrigation technology [18].
When sand-laden water is employed for irrigation, physical clogging is the main cause of emitter blockage [19]. Therefore, minimizing the particle adhesion and deposition of the emitter channel is crucial for enhancing an emitter’s anti-clogging capability. Precipitation and filtration are critical treatment processes when utilizing high sand-laden water for drip irrigation. The filters commonly employed range from 120 mesh to 200 mesh (0.075~0.125 mm) [20]. However, during actual usage, particles larger than 0.1 mm can still enter the emitter. Over time, the accumulation of these smaller particles leads to emitter clogging [21,22]. The micro-channel of the emitter (0.25~0.2 mm) is between macroscopic and microscopic in size, resulting in complex internal water flow conditions. To investigate the factors influencing emitter clogging and the migration and accumulation patterns of solid particles within these narrow channels, some researchers have employed visual platforms to directly observe the migration of water and sand inside the channel. Li et al. [23] applied digital particle image velocimetry (DPIV) and laser-induced fluorescence velocimetry (LIFV) to show all the flow fields of the plane model of the emitters and realized the visualization of the water flow inside the emitter channel. Liu et al. [24], using DPIV, discovered that there are stagnation zones and vortex zones within the labyrinth channel. Sediment particles tended to be deposited in these stagnation zones, while the effective development of high-speed vortices was able to enhance the sediment flushing ability of the emitters. However, the cost of those technologies was relatively high. Thus, some researchers employed computational fluid dynamics (CFD) to study sediment movement within emitter channels.
Zhang et al. [25] adopted the CFD to examine the impact of various emitter channels structures on particle passage rates. The parameters were ranked by significance as follows: tooth angle > channel width-to-depth ratio > tooth top width-to-height ratio. Based on these findings, they developed a parametric model to predict the emitter’s anti-clogging capability. Feng et al. [26] compared two flow path design approaches using CFD: the main channel design and the design of a vortex-based flushing wall. They concluded that fully developing vortices within the emitter channel increases both the velocity and turbulence intensity near the walls in deposition-prone areas. This enhanced flow near the walls effectively scours the channel surfaces, thereby preventing the adhesion of clogging material. These studies demonstrated that sediment particles tended to accumulate in emitter channel’s low-speed zones. Furthermore, both the size and velocity of these sediment particles were influenced by the emitter channel structures [27]. However, the influence of sediment characteristics themselves was often ignored. To further explore the factors affecting emitter clogging in actual conditions, Wu et al. [28] conducted experiments using water with high sediment content as the source for drip irrigation. It was discovered that emitter clogging was primarily influenced by sediment content, particle size, and grading of the particles. Additionally, dynamic changes in working conditions proved helpful in removing fine particle clogs. To investigate the sedimentation behavior of particles within emitter channel and its influencing factors, Hou et al. [29] found through their study of sediment accumulation characteristics in the drip irrigation using Yellow River water that the sediment entering this emitter was mainly composed of silt and sand particles, with less clay content, and more than 99% of the sediment could be discharged. As emitter clogging worsened, the characteristics of sediment accumulation inside the emitter changed. The size of sediment particles varied across different emitters.
The above research findings show that particles transport behavior was closely related to sediment characteristics and the emitter channel structure. However, there are still few studies on the correlation between the emitter channel, the sediment content, the sediment particle size composition, and the emitter’s clogging characteristics [19]. In this context, this paper focused on a single-wing labyrinth drip irrigation belt featuring four different maze channel structures as the research object. The main research objectives were as follows: (1) to established three concentration gradients of sand-bearing water sources and conduct short-period intermittent drip irrigation clogging tests [30,31] and to investigate the impact of sediment content and particle size distribution on emitter clogging; (2) to analyze the dynamic changes in emitter clogging under different emitter channel structures in muddy water conditions; and (3) to conduct numerical simulations to explore the flow patterns and turbulent kinetic energy within the emitter to better understand the mechanisms of clogging. This paper analyzed the effect of sediment particle size retention and sediment deposition patterns in different emitter channel structures, providing technical support for the study of emitter clogging patterns, improving emitter anti-clogging capabilities for supporting sustainable water use, and ensuring efficient irrigation and long-term agricultural productivity in the Yellow River Basin.

2. Materials and Methods

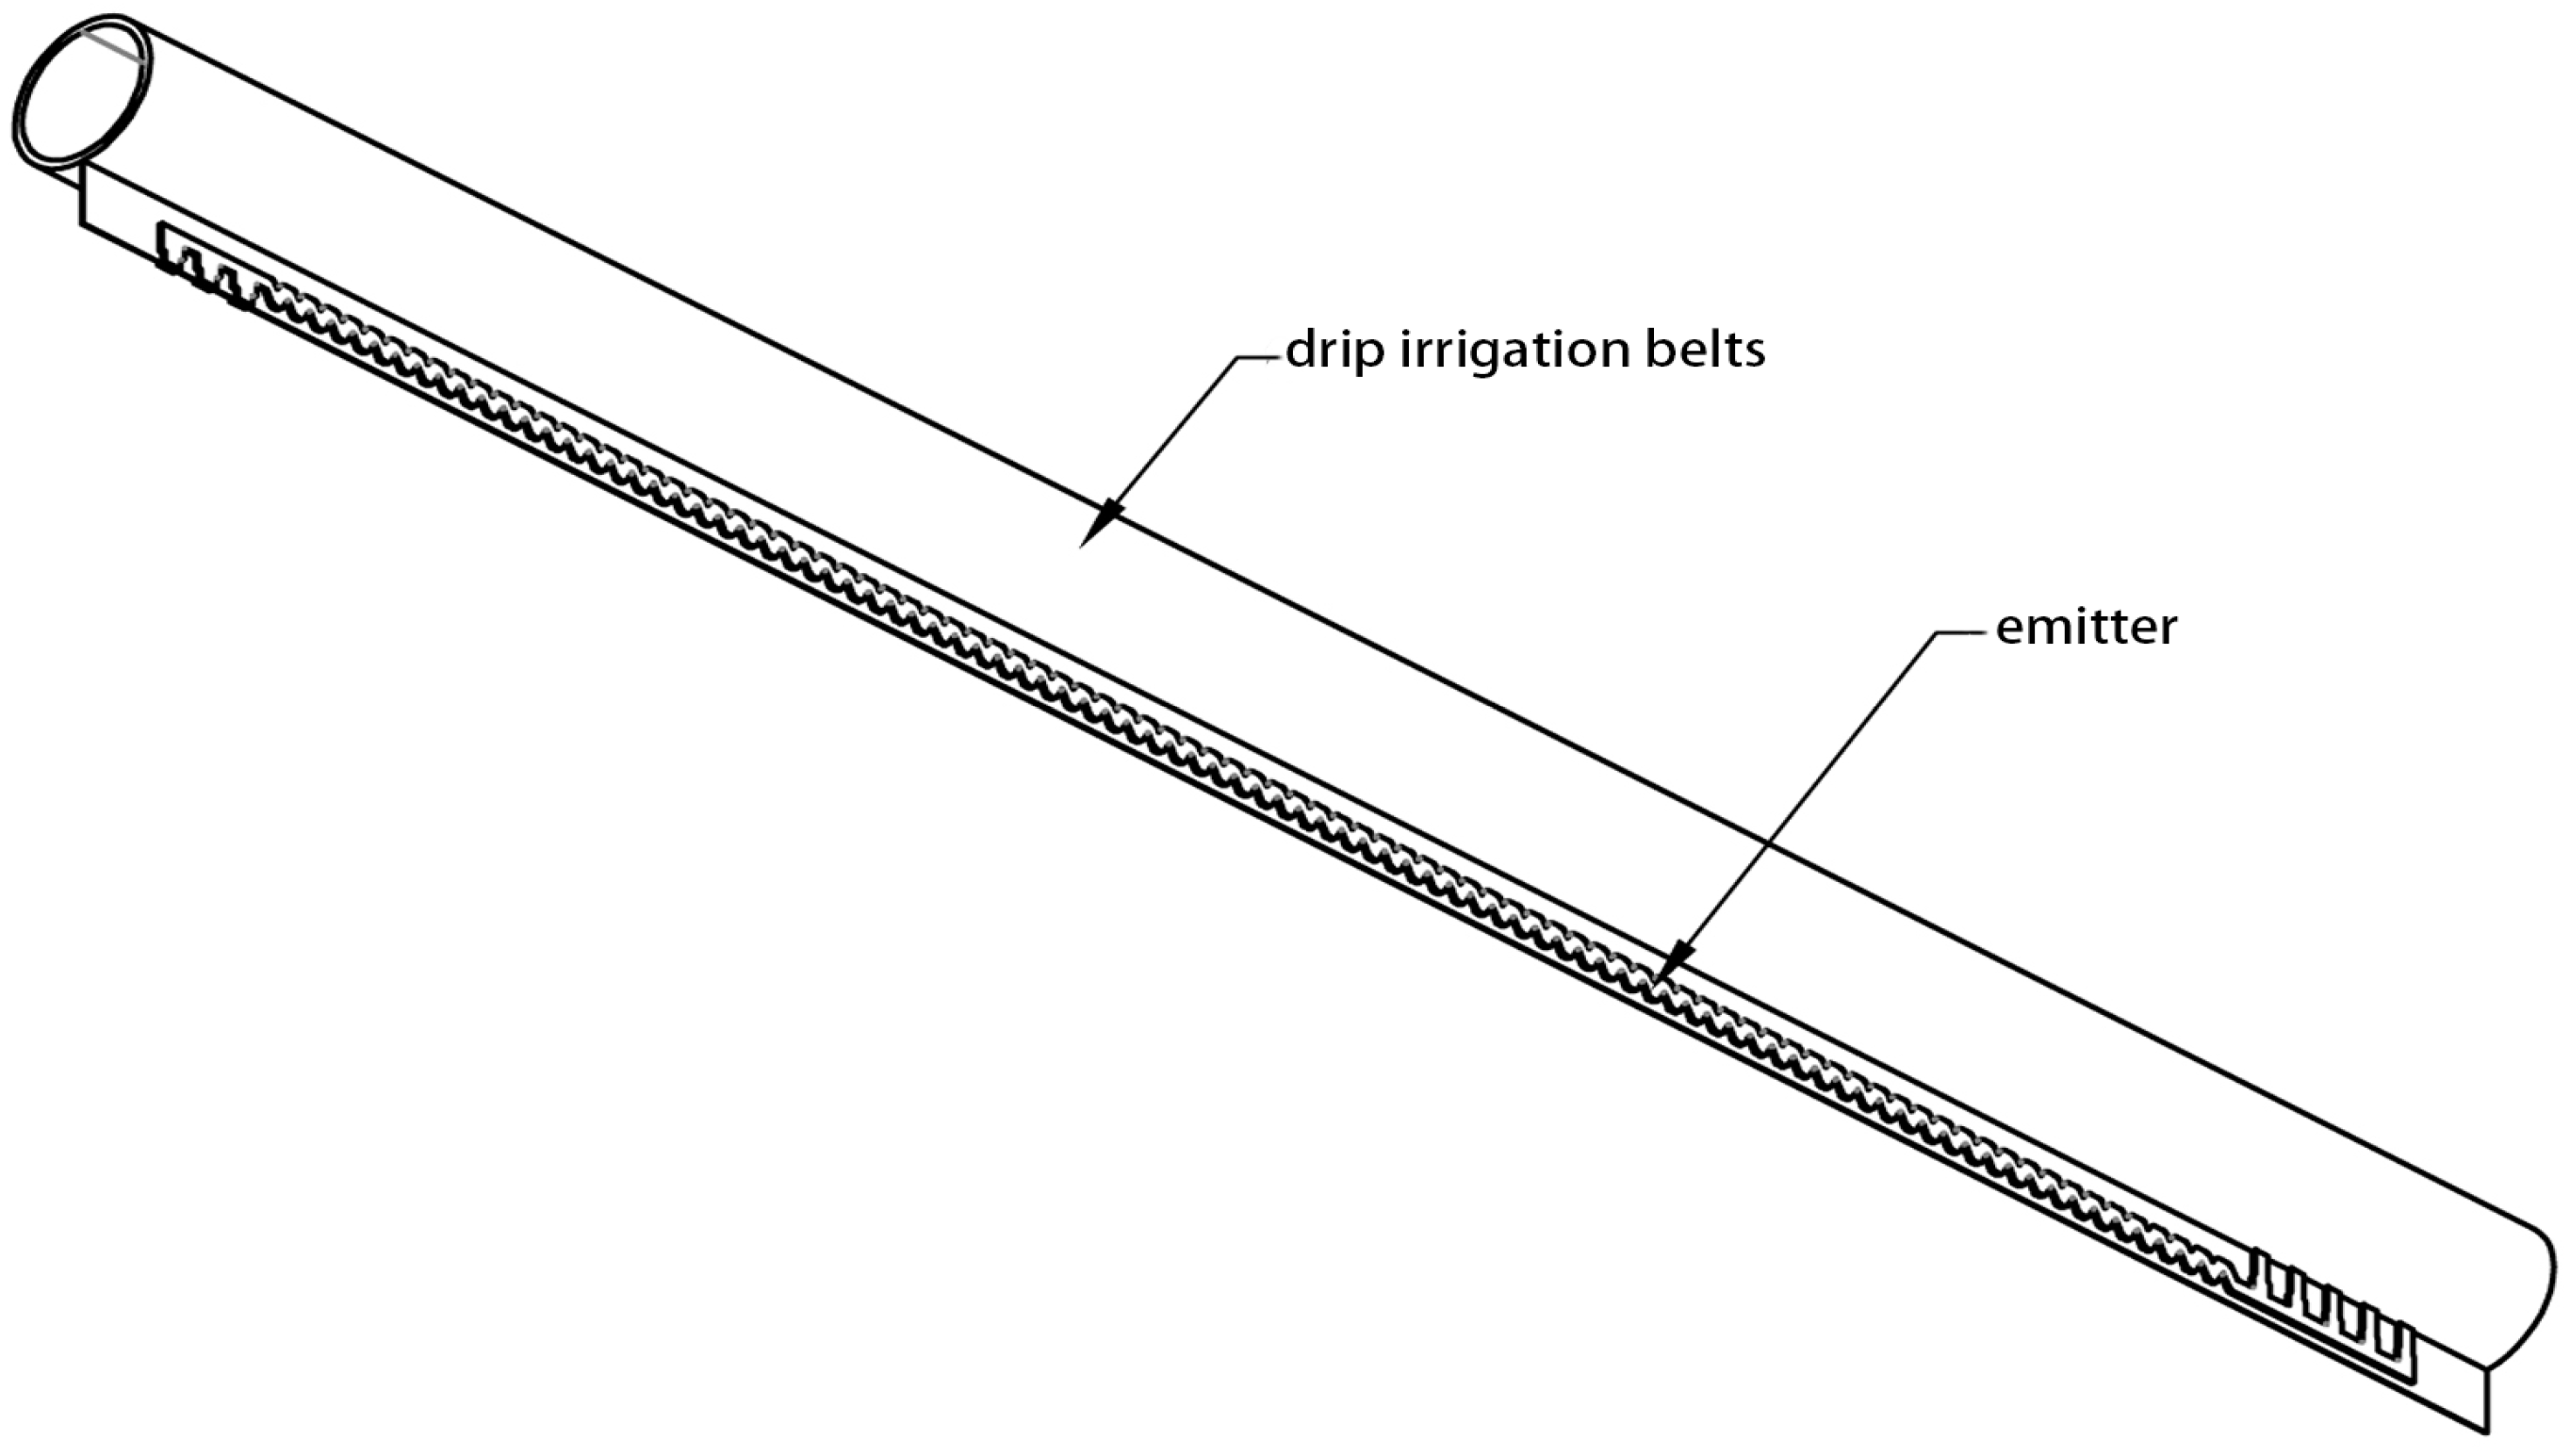
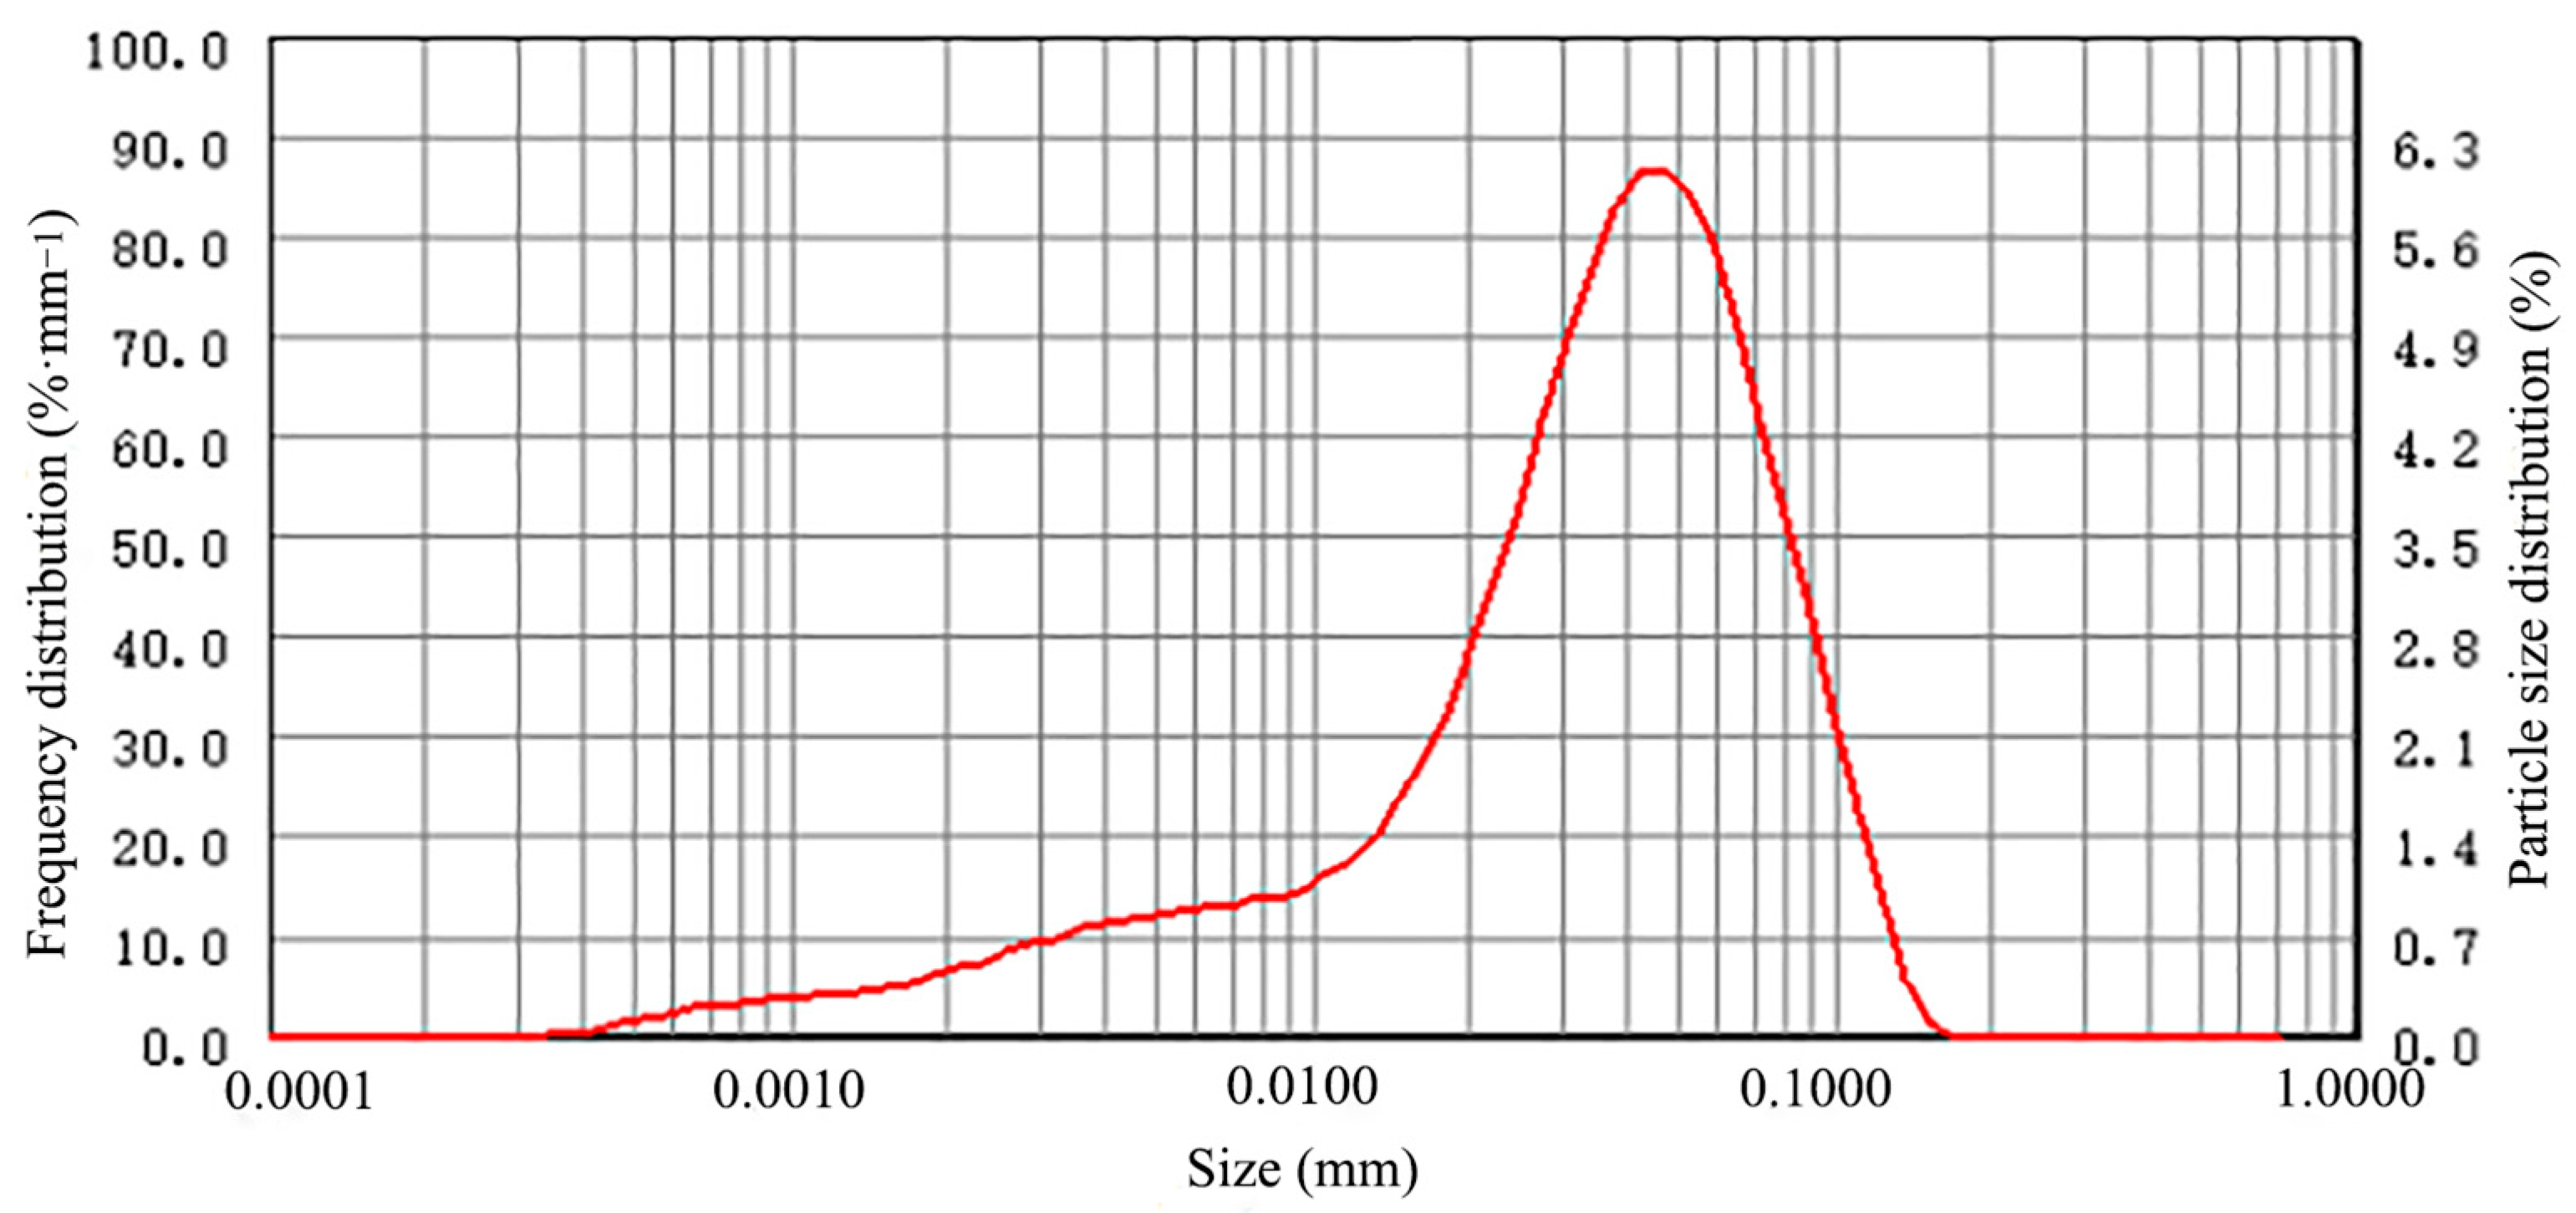
2.1. Experimental Materials

Four varieties of single-wing labyrinth drip irrigation belts (Figure 2 is a 3D model schematic of the drip irrigation belts), each with distinct emitter channels, were selected for testing and designated A, B, C, and D. Figure 3 illustrates the emitter channel profiles. Prior to the test, the fundamental parameters of each drip irrigation belt were assessed, and its hydraulic performance was evaluated (see the technique in GB/T 19812.1-2017) [32], with the results presented in Table 1. This experiment utilized artificially prepared sand-laden water. The sand utilized in this study was sourced from the Qiliying test base in Xinxiang City. It was naturally desiccated and pulverized, sifted through a 120-mesh screen (aperture 0.125 mm), then mixed with water to form sand-laden water with a defined sediment concentration. The mechanical composition of the initial sediment particles was examined via a laser particle size analyzer (Dandong Baxter, Dandong, China). The precise outcomes are presented in Table 2 and Figure 4. D10, D50, and D90 are the particle sizes at which the cumulative particle size distribution reached 10, 50, and 90%, as shown in Table 3.

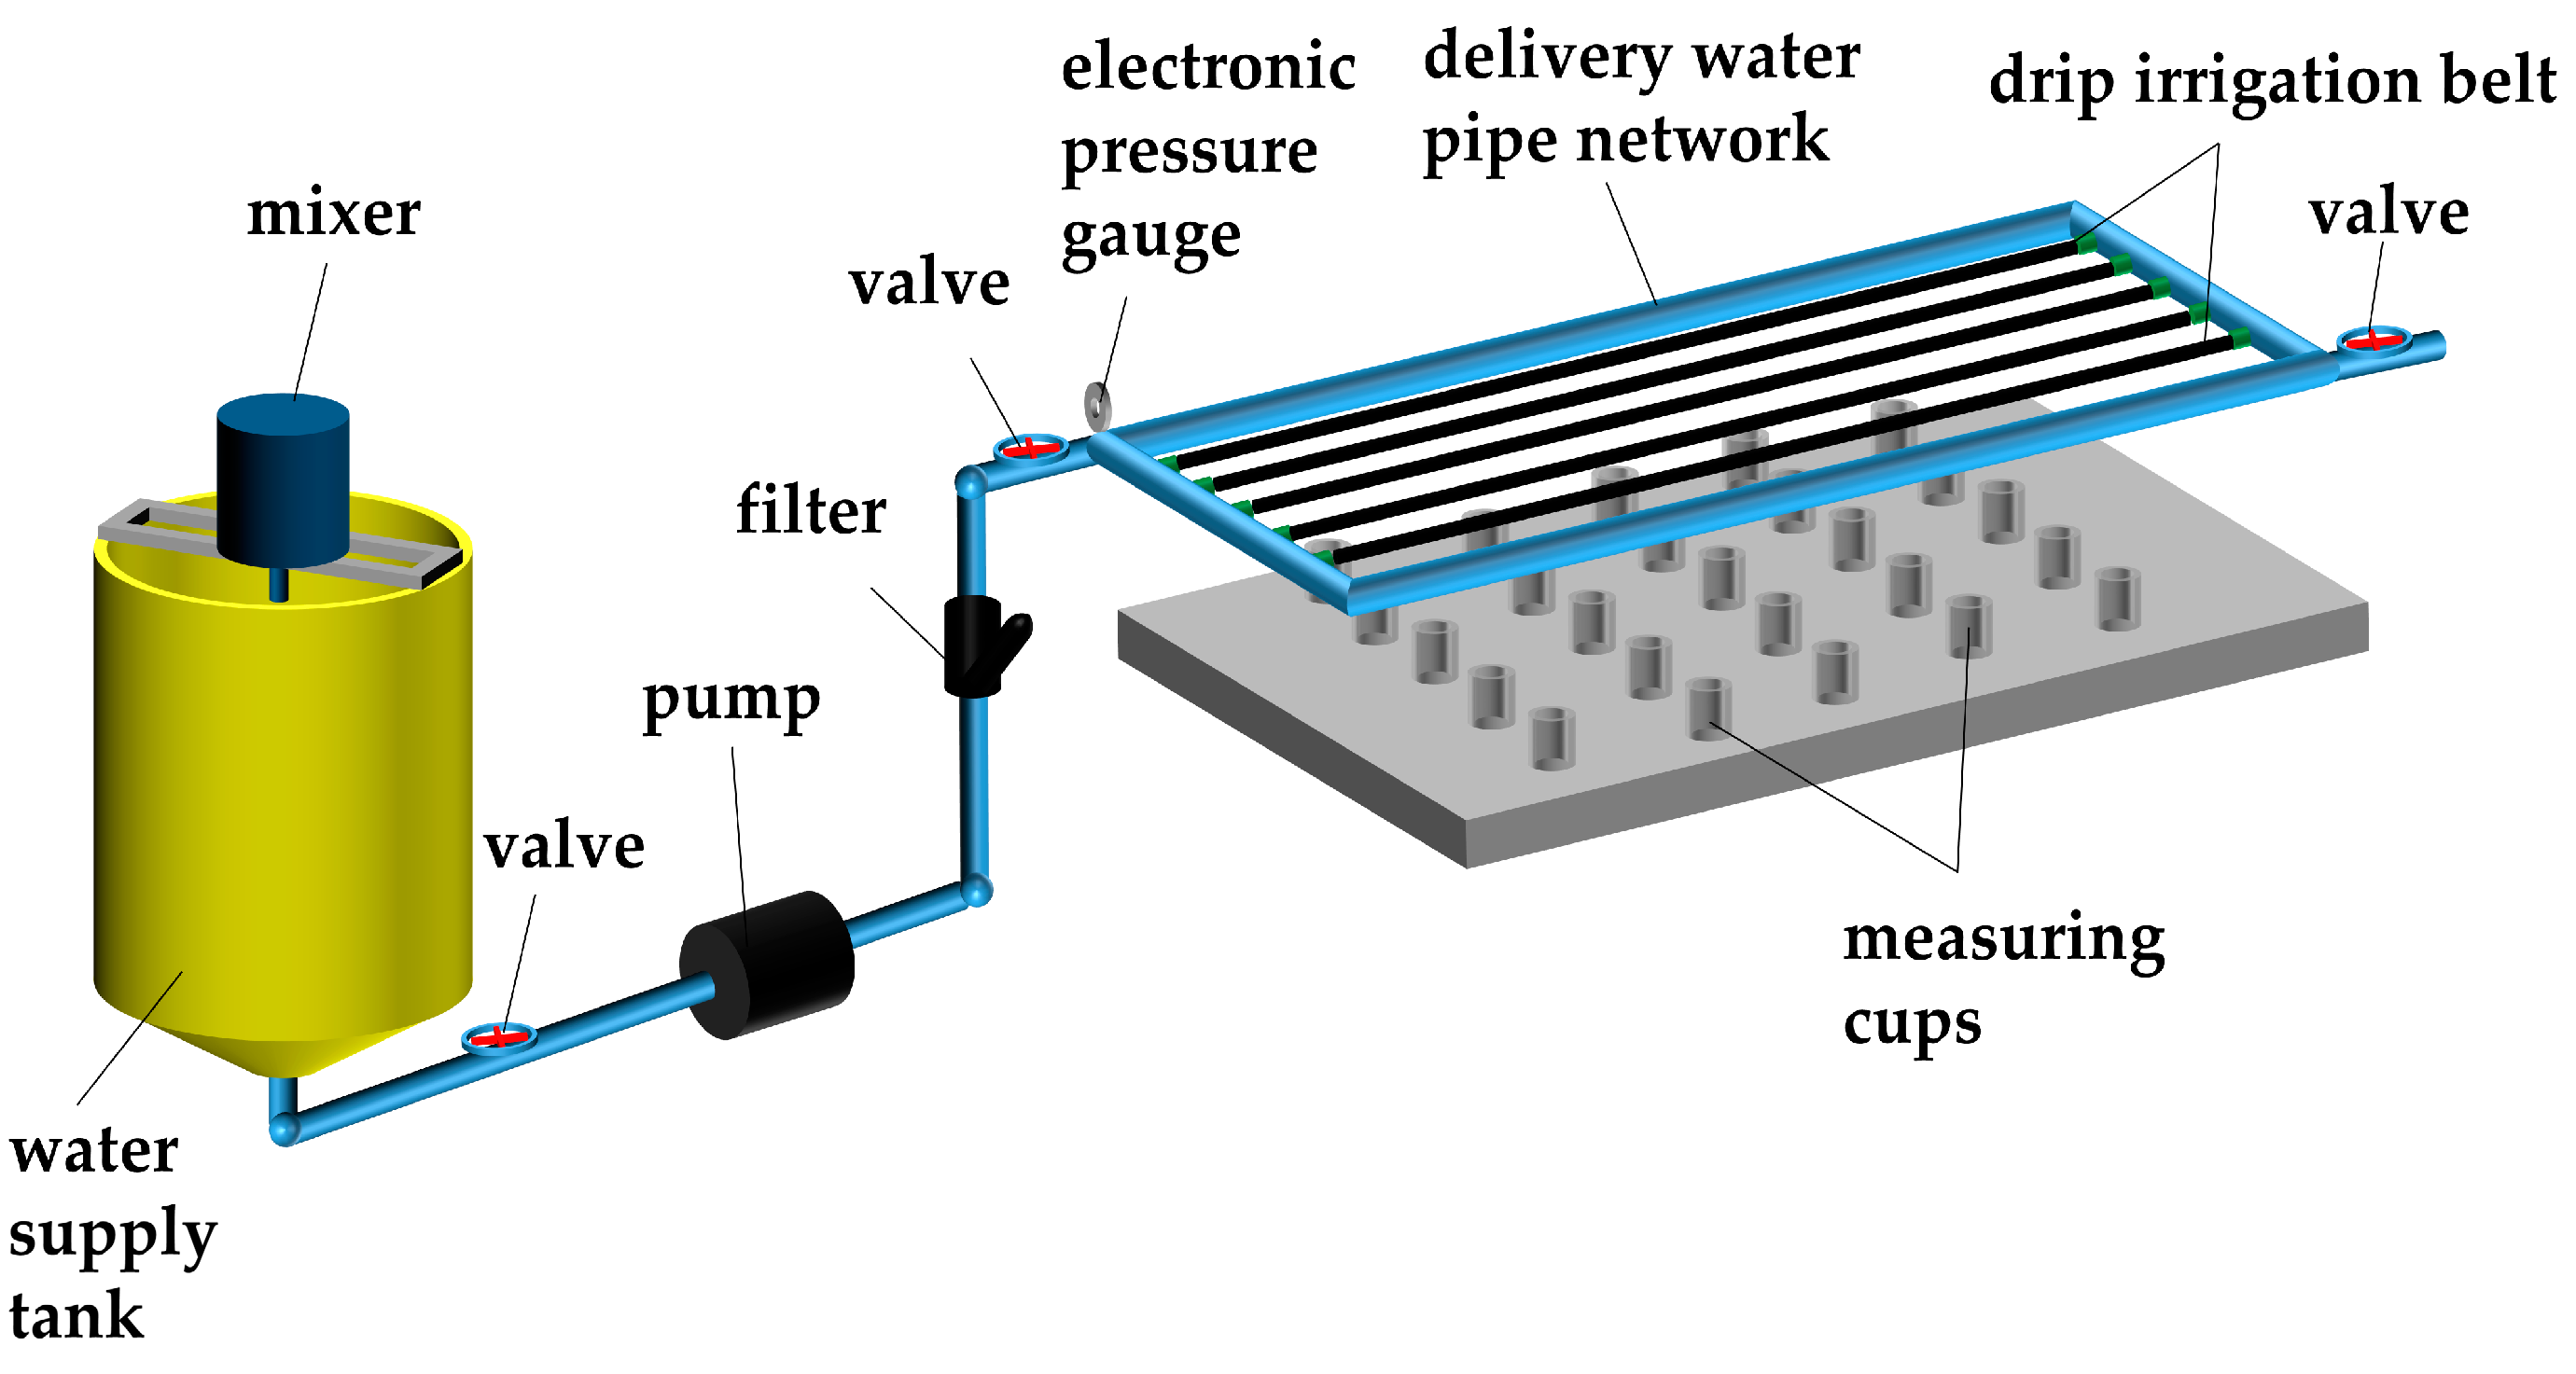
2.2. Experimental Devices

The experiment was performed on a clogging test platform (Figure 5), which comprising water source, headworks, and transmission network. Concerning the current mode of conventional drip irrigation system, 120 mesh filters were selected for the test platform. The water was sourced from a cylindrical storage tank with a capacity of 100 L. A gear motor (750 W, 130 R·min−1) was positioned above the storage tank to ensure the homogeneity of sand-laden water. The motor was affixed to the impeller via a rigid support to uniformly agitate the silt. The headworks comprised a variable frequency pump (400 W, output flow 2.5 m3·h−1, head 35 m), a valve, a laminated filter (BALDR, 120 mesh), and a precision electronic pressure gauge (0.4 level, measurement range 0.25 MPa). The water conveyance pipe network was a rectangle of 80 cm by 250 cm, capable of accommodating five 2.5 m drip irrigation belts organized with equal spacing in the center. Five measuring cups, each with a capacity of 500 mL, were positioned beneath each drip irrigation belt to capture the water discharged from the emitter.

2.3. Experimental Design

The examination was performed in the drip irrigation testing facility of the Institute of Farmland Irrigation, Chinese Academy of Agricultural Sciences, in Xinxiang City, from September 2023 to June 2024. Three muddy water sources (1, 2, and 3 g·L−1) with concentration gradients were established in the experiment, and the applied pressure was 0.1 MPa. Prior to the muddy water test, the clean water flow rate of the emitter was measured. The testing platform was activated, and the pressure was kept at 0.1 MPa. A total of 25 emitters were chosen for the drip irrigation belt, with a measuring cup below each to quantify the emitter’s flow rate. Each test lasted for 5 min and was repeated twice. The indoor muddy water test utilized the short-duration intermittent muddy water testing method, with the pressure on the pressure gauge maintained at 0.1 MPa. To attain the dynamic equilibrium of the flow pattern and sediment deposition within the emitter, the irrigation duration for each session was 1.5 h, and the interval between adjacent irrigation was 0.5 h. Prior to the conclusion of each irrigation cycle, the pressure gauge of the regulating valve was stabilized at 0.1 MPa, and the emitter’s flow was measured, followed by the calculation of the average flow rate. Upon the reduction in the average relative flow rate to 70%, the test was terminated, and the capillary was extracted and positioned in a ventilated area to dry, after which it was severed in order to gather capillary sludge and emitter sediment. To maintain the consistency of the muddy water in the tank, the mixer operated continuously during the irrigation process. Subsequent to each series of treatment assessments, the testing apparatus was cleansed to ensure the absence of sediment residue, after which the aforementioned procedure was reiterated using a new drip irrigation belt.

2.4. Evaluation Index and Determination Method

2.4.1. Performance Evaluation of Drip Irrigation Emitter Anti-Clogging

The average relative flow rate and irrigation uniformity were typically used as evaluation metrics for the anti-clogging capability of emitter in a drip irrigation system [33]. The average discharge ratio variation (Dra) assessed the flow variation in the emitter, while Christensen’s uniformity coefficient (Cu) evaluated the uniformity of drip irrigation [34]. The measuring cylinder method was employed to quantify the emitter’s flow rate. The emitter’s water output was determined using a measuring cup at the end of each irrigation (with an access duration of 5 min), and the water collected in each measuring cup was quantified using a measuring cylinder and subsequently translated to the emitter’s flow rate (L·h−1).
The average discharge ratio variation (Dra) was expressed as the ratio of the average discharge rate of an emitter to its rated discharge rate, presented as a percentage, according to [35], using Equation (1).
D r a = 100 % × i = 1 n q i n q n e w
where q i is the flow of the i-th emitter, in L·h−1; q n e w is the average initial flow rate, in L·h−1; and n is the number of emitters. When calculating the average flow ratio of a single emitter, n = 1.
The Dra indicates the extent of the emitter’s average flow rate reduction. When the Dra is reduced by more than 25% (Dra < 75%), the emitter is considered clogged [19]. A smaller Dra signifies a greater reduction in the flow rate and the more severe clogging of the emitter.
Christensen’s uniformity coefficient (Cu) was utilized to assess the impact of emitter clogging on the drip irrigation system uniformity, according to [36], using Equation (2).
C u = 1 i = 1 N | X i X ¯ | i = 1 N X i × 100 %
where X i is the observed value of the irrigation amount of the i-th emitter; X ¯ is the sample mean; and N is the number of sampling points.

2.4.2. Collecting and Dry Weight Test of Sediment

After testing, the emitters on the drip irrigation belt were removed, numbered from 1 to 25, and dried in the oven at 60 °C until a constant weight was reached. The mass of each emitter was documented as m1. After the mechanical removal of all emitters, a brush and additional instruments were employed to extract and gather the sediment within the emitter channel. Subsequently, the emitters were placed into a sealing bag containing 20 mL of ultrapure water, then inserted into an ultrasonic cleaning apparatus (GongYi Zihua, Gongyi, China, XM-P10H, 200 W, 40 kHz) for 1 h. After that, the emitters were extracted from the sealing bag. The runner was thoroughly cleaned using a brush and additional equipment to eliminate any silt residue, dried, and weighed again, with the measurement recorded as m2. An electronic analytical balance (METTLER TOLEDO, Zurich, Switzerland, MA204, precision 0.0001 g) was employed for weighing, with the weight differential between two measurements representing the dry weight (m) of the silted sediment from the emitter, expressed as m = m1 − m2.

2.4.3. Distribution and Mechanical Composition of Sediment Particle

Five emitters were randomly chosen from each group, the emitter channels were mechanically stripped, and the sediment within the emitter channels was examined and documented using an electron microscope (OVIS, Shenzhen, China, AO-HK830-0318). The sediment particle size gradation collected from the emitter channel was assessed using a laser particle size analyzer (Dandong Baxter, Dandong, China). In accordance with the Chinese particle size grading standard, the interior sediment composition was categorized into clay particles (d < 0.002 mm), silt particles (0.002 mm ≤ d ≤ 0.05 mm), and sand particles (d > 0.05 mm). The initial sediment particle size composition was as follows: 4.52% clay particles, 66.09% silt particles, and 29.39% sand particles.

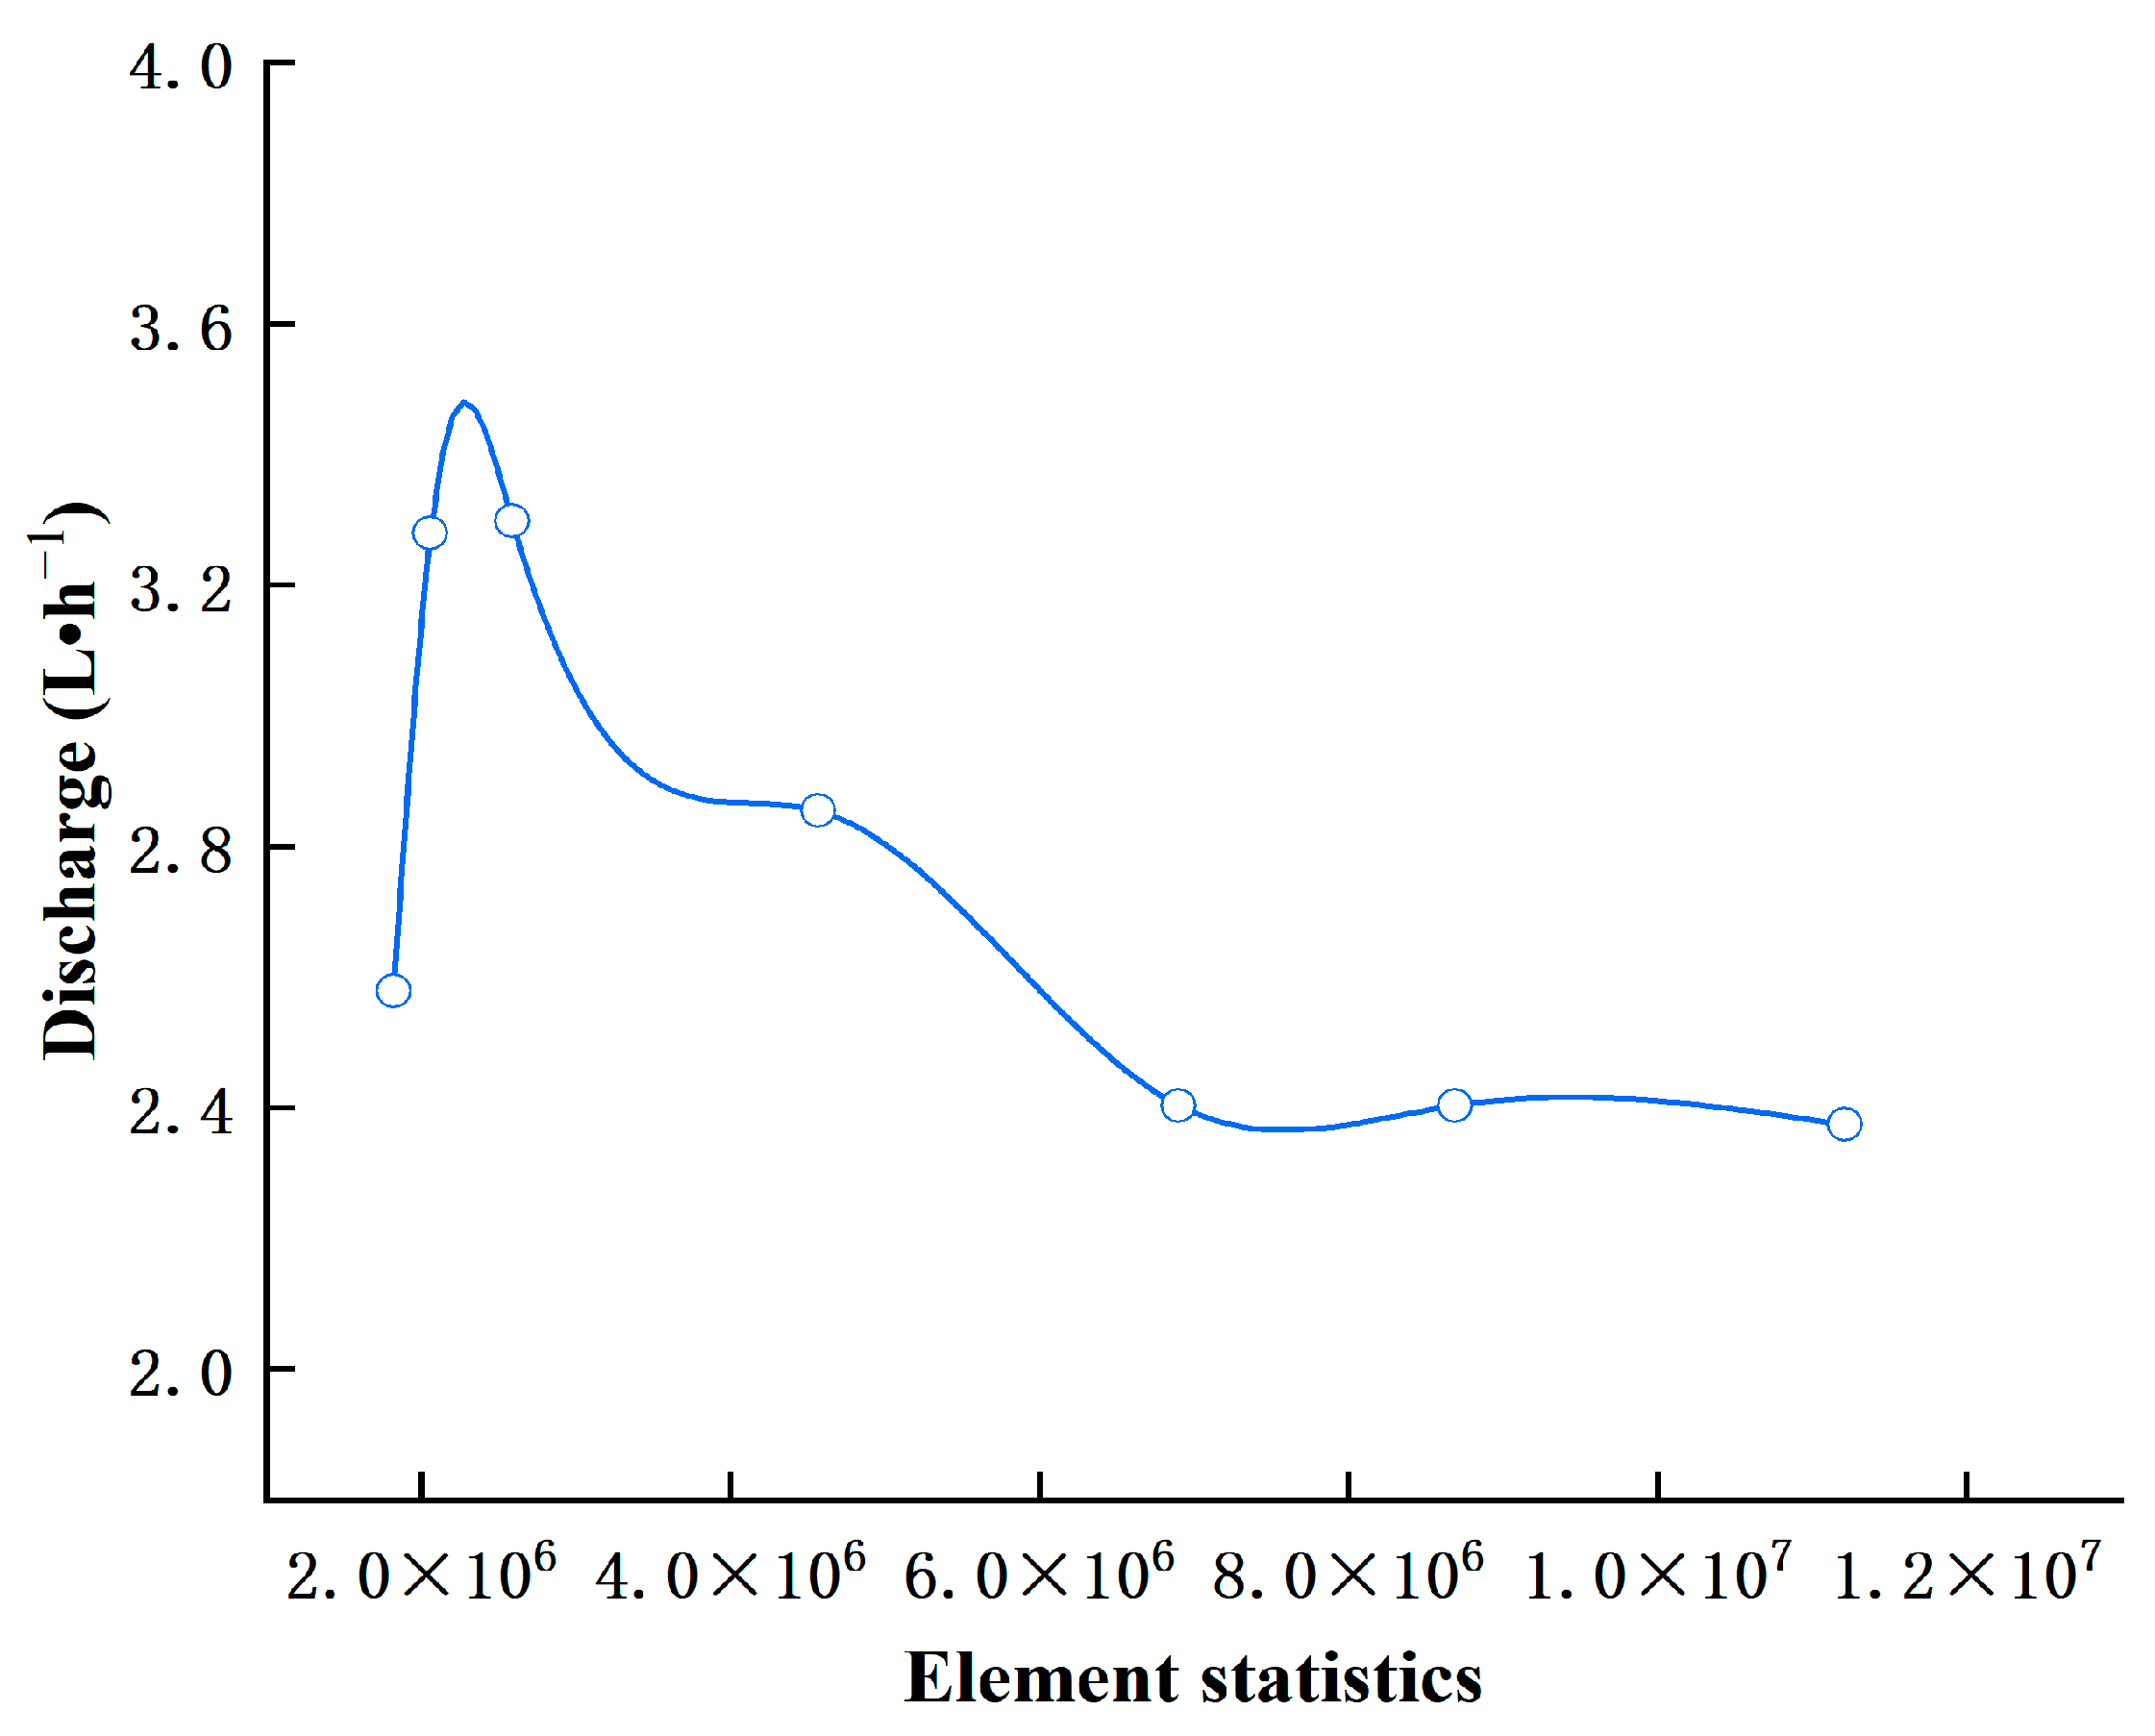
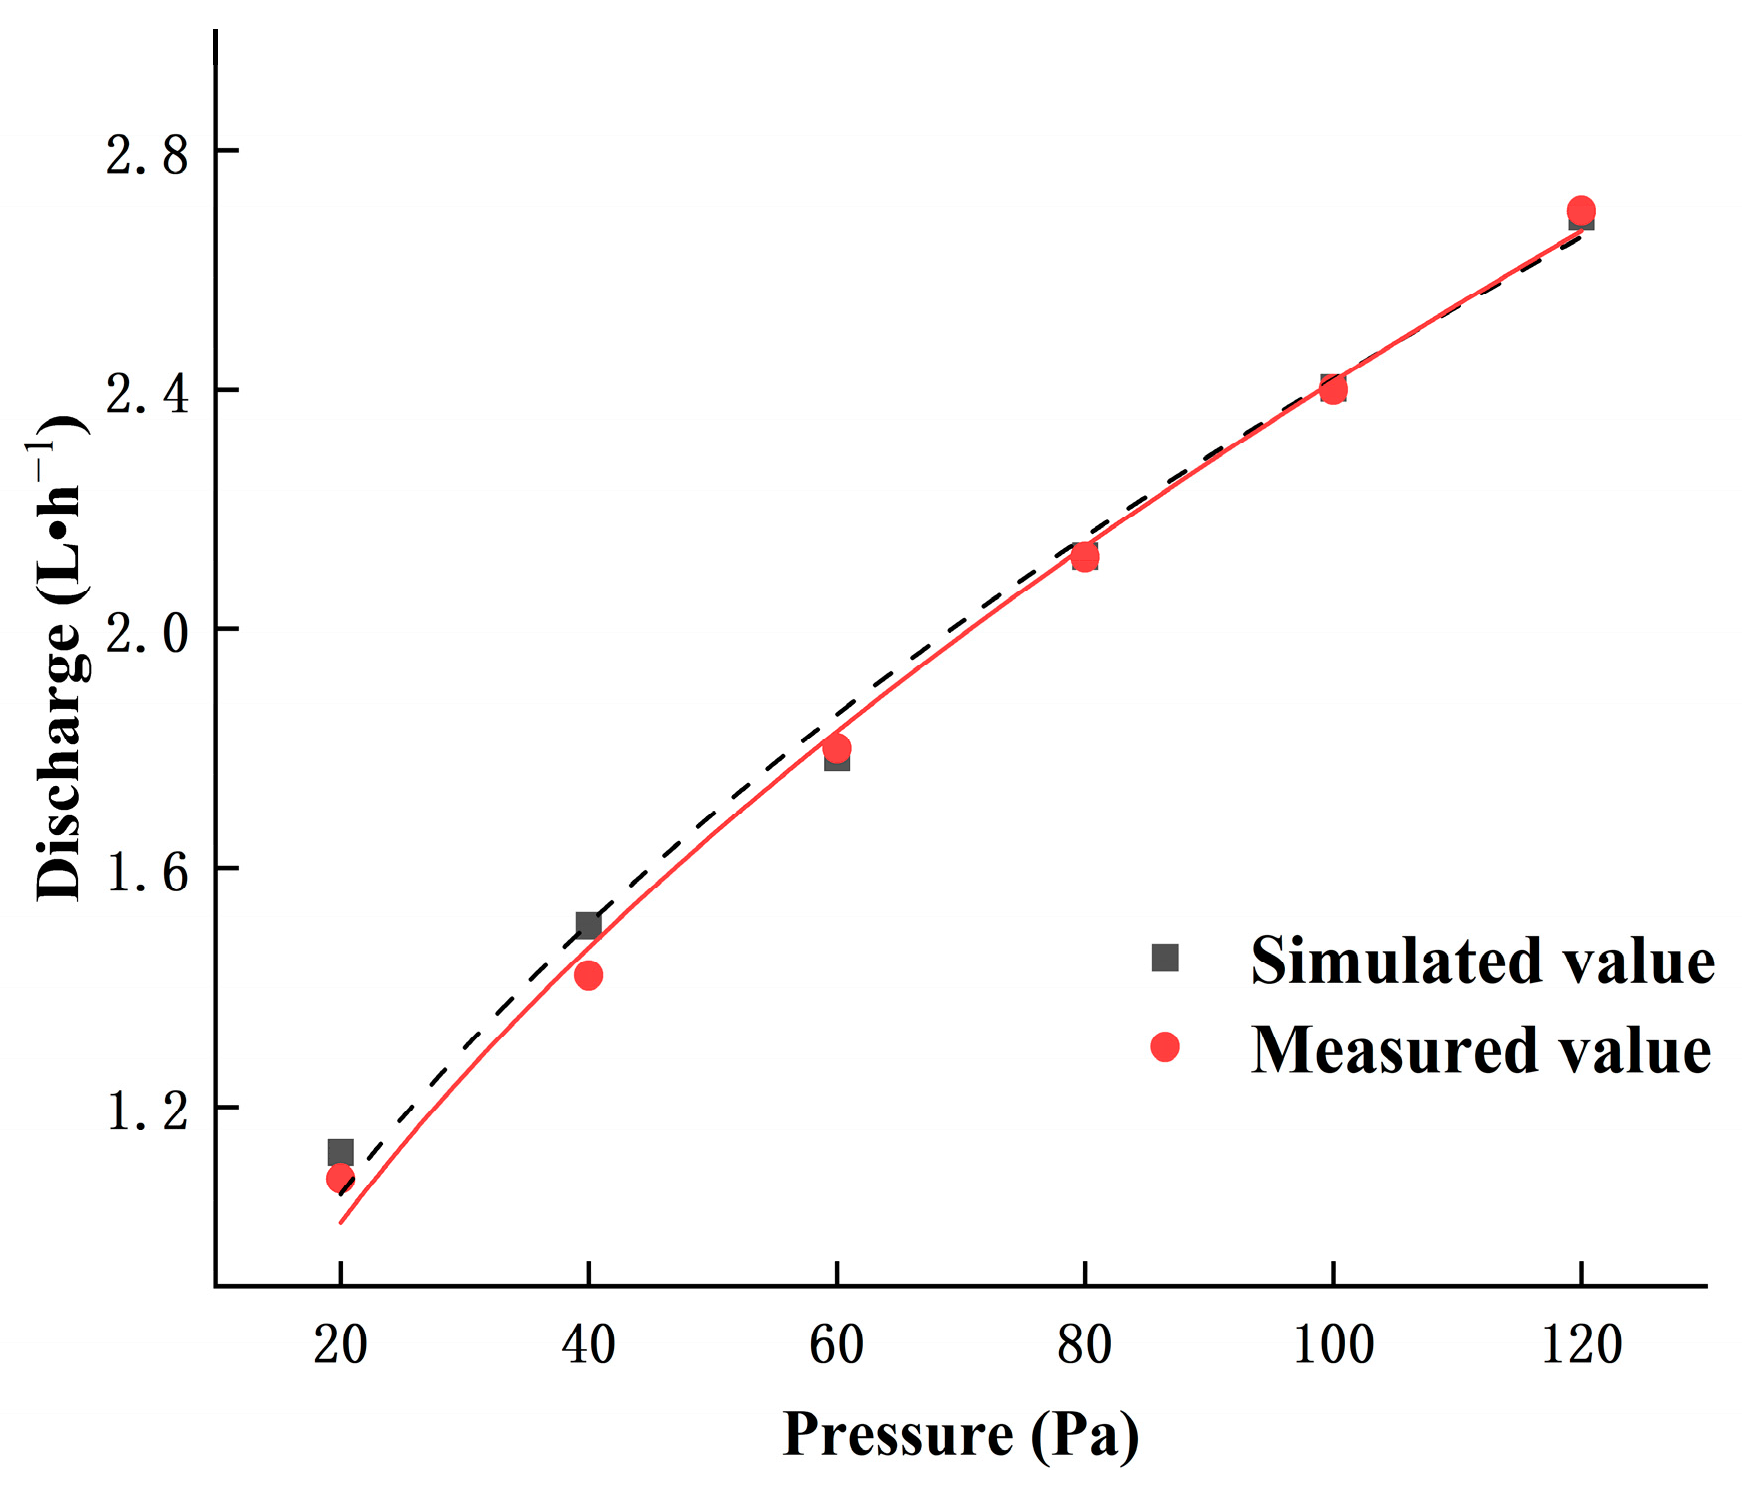
2.5. Physical Model Structure and Simulation Parameter Design

The B drip irrigation tapes were selected as the test objects, and ANSYS (2024 R1) DesignModeler and Meshing were used to model and mesh the runners, respectively. Since the runner structure is of regular shape, a structured meshing model was used. The mesh quality was evaluated using orthogonal quality evaluation coefficients. The mesh independence check was carried out using local encryption at operating pressure (inlet pressure of 100 kPa). As shown in Figure 6, the mesh size of the labyrinth channel was selected to be 0.1 mm, the mesh size of the inlet and outlet was 0.01 mm, and the number of meshes was 6901224.
Many researchers have confirmed the high accuracy of the RNG k-ε model in calculating the flow field of labyrinth emitters, so this study selected the RNG k-ε turbulence model [26,37]. In the RNG k-ε model, the dissipation rate equation (ε) is modified to include additional correction terms to account for the turbulent energy dissipation more effectively, especially for flows with strong curvatures and high strain rates.
The turbulent kinetic energy is calculated using the following transport equation:
k t + U k = P k ε + μ t k
where k is turbulent kinetic energy (m2·s−2); P k is production of turbulent kinetic energy (m2·s−3); ε is dissipation rate of turbulent kinetic energy (m2·s−3); μ t is turbulent viscosity (Pa·s); and is gradient operator (for the diffusion term).
In the RNG k-ε model, the production term P k is adjusted with a modification to more accurately account for the turbulent flow characteristics:
P k = μ t u i x j + u j x i u i x j
where u i and u j represent the velocity components in different directions.
The turbulent viscosity in the RNG k-ε model is calculated using the following equation, similar to the standard k-ε model but with improved terms for more accurate predictions:
μ t = ρ C μ k 2 ε
where μ t is turbulent viscosity (Pa·s); ρ is fluid density (kg·m−3); and C μ is empirical constant (typically 0.0845 for the RNG k-ε model).
Flow field simulation was performed using ANSYS (2024 R1) Fluent software, the initial boundary condition at the inlet was set as pressure inlet, and the pressures were set to be 20 kPa, 40 kPa, 60 kPa, 80 kPa, 100 kPa, and 120 kPa, and the initial boundary condition at the outlet was set as a pressure outlet with 0 kPa. In addition to this, the no-slip boundary condition was applied. The near-wall flow was calculated using the standard wall function. The “SIMPLEC” algorithm was used to couple velocity and pressure. Convective phases were discretized in a second-order windward format, with a convergence accuracy of 10−5. The particle density was defined as 2500 kg·m−3, and the fluid and sediment particles were treated as continuous phases. As shown in Figure 7, the difference between the experimental flow and the simulated flow was within 5.86%, indicating a high simulation accuracy.

2.6. Data Processing

Microsoft Excel was employed to compute the average discharge ratio variation (Dra) and irrigation uniformity coefficient (Cu), while SPSS (26.0) software was utilized for correlation analysis, for the two-way ANOVA, and for analyzing significant differences through multiple comparison methods. The numerical simulation results were processed using Tecplot (2024 R1) software.

3. Results

3.1. Dynamic Change in Anti-Clogging Characteristic Index of the Emitter

Figure 8 shows the change process of the average discharge ratio variation (Dra) and the irrigation uniformity coefficient (Cu) of the drip irrigation emitter over time. As can be seen, Dra showed an overall downward trend with the increase in system running time, starting with a slow decrease followed by a sharp decline. As the increase in sediment content, the clogging speed of emitter increased. When the sediment content was 1 g·L−1, in the initial stage of system operation, the Dra showed little change, and the emitter’s actual flow rate fluctuated around the rated flow rate. A blockage in the emitter occurred when the running time reached around 50 h, and Dra exhibited a significant decreasing trend. As the running time increased, the clogging of the emitter deteriorated sharply, and the decrease in Dra increased significantly. The system running times of the four drip irrigation belts (when Dra was reduced below 75% for the first time) were 144, 156, 85.5, and 103.5 h, respectively. When the sediment content increased from 1 to 2 g·L−1, the operation time for the four drip irrigation belts was shortened by 85.42, 73.08, 57.59, and 46.38%, respectively. When the sediment content increased from 2 to 3 g·L−1, the system operation time of the A and D drip irrigation belts reduced by 35.71 and 56.76%, while the system operation time of the B and C drip irrigation belts increased by 39.29 and 4.17%. This shows that as sediment content rises, the clogging rate of the emitter increases significantly, but only within a specific range of sediment content; however, as the concentration continued to rise, the impact of further increases in sediment content on the clogging rate gradually diminished. In addition, the clogging of the emitter was random, the flow state in the emitter channel was constrained by the structural parameters, and there was a certain interaction between the flow state and sediment particles, which further had a certain impact on the clogging of the emitter. The trends of Cu and Dra were basically the same.
When the sediment content was 1 g·L−1, Dra and Cu showed a fluctuation decrease; additionally, it was observed that the blocked emitter resumed flow during the test. This was caused by the reversibility of the emitter clogging and the sudden rise in water pressure. When the emitter channel was clogged, the water-crossing section of the emitter channel was suddenly cut off, leading to an increase in pressure within the clogged section. Consequently, this elevated pressure resulted in an enhanced flow rate that could erode and ultimately compromise the integrity of the clogging structure. In addition, at the beginning of each irrigation, the pump started, and the water pressure and velocity in the emitter channel changed sharply, which also destroyed the clogging structure of the emitter channel. As the sediment content increased, Dra and Cu no longer fluctuated significantly. This could be attributed to the increase in sediment content, which facilitated the formation of a more stable clogging structure of large-size sediment particles. Consequently, it was more difficult for the water flow to disperse the clogging, resulting in a weakening of the reversibility of emitter clogging and an increased likelihood of complete blockage.

3.2. Correlation Analysis of Average Discharge Ratio Variation and Irrigation Uniformity Coefficient

The variation in average discharge ratio and irrigation uniformity coefficient across each group was analyzed, with the correlation between emitter Dra and Cu illustrated in Figure 9. The figure showed that the decrease in Dra and Cu occurred synchronously with the rise in the number of irrigation times under the varying conditions of sediment content. A linear fitting analysis revealed the obvious linear correlation between the emitter Dra and Cu (p < 0.5; Table 4). The fitting results indicated that the slopes of the fitted straight lines for Dra and Cu across the various emitter types exceeded 1, suggesting that the reduction in uniformity for the four emitter types surpassed the variation in Dra. At the end of the test, the Cu values of the four emitter types showed a notable discrepancy, indicating that the degree of clogging varied significantly among the emitter channel structures. In the presence of a stable water source and sediment content, the fitted slope of the D drip irrigation belt was the most pronounced, whereas the C drip irrigation belt had the least significant fitted slope. The indicated emitter clogging is more probable in the D drip irrigation belt compared to other types under the specified conditions.
Upon completion of the irrigation test, the mean discharge ratio variation and irrigation uniformity coefficient for different channel emitters were analyzed for significance, and the results are displayed in Table 5. The anti-clogging efficacy for the four drip irrigation belts varied at different constant sediment contents due to their distinct channel configurations. The anti-clogging efficacy of a certain drip irrigation belt fluctuated with sediment content, suggesting that the channel structure is a key factor influencing the anti-clogging performance of emitters, while also being affected by varying sediment content levels. In the case of a uniform sediment content in the water source, the anti-clogging efficacy for the B drip irrigation tape was notably superior, exhibiting adaptability to a wide spectrum of sediment levels.
Note: Different lowercase letters in the same column indicate significant differences (p < 0.05).

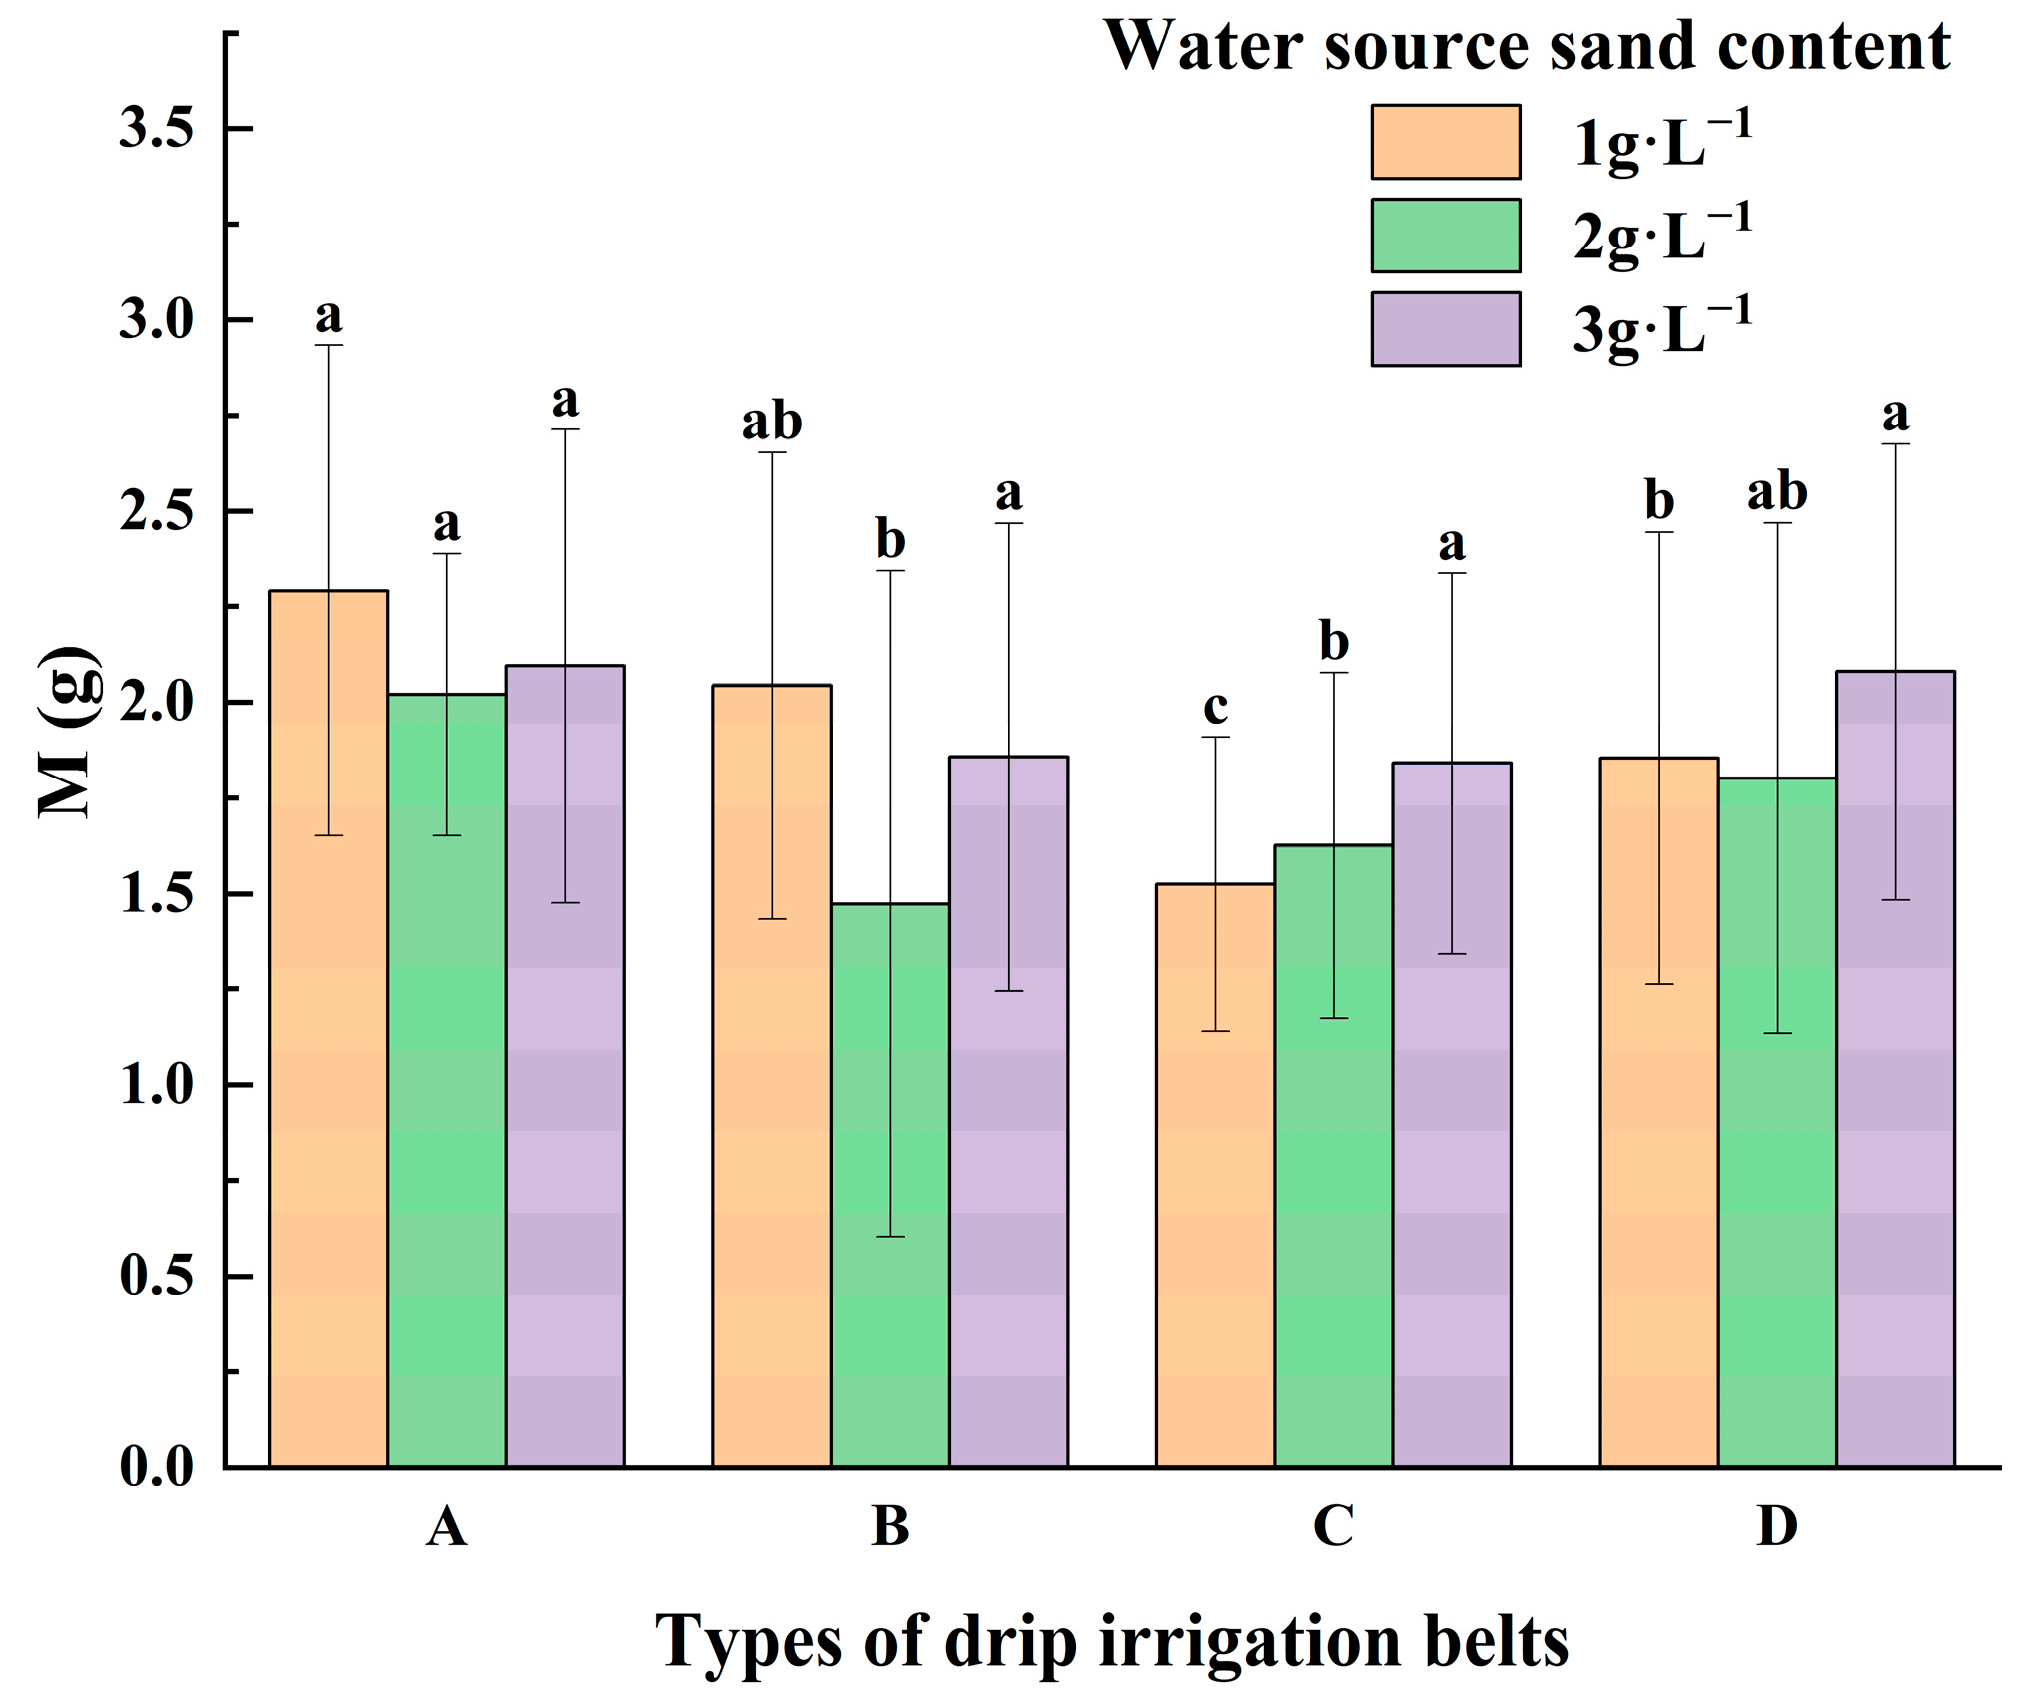
3.3. Change in Capillary Sediment Quality in Different Types of Emitters

Figure 10 illustrates the sediment quality per unit length of the capillary tube obtained at the conclusion of the irrigation test across various treatments, M, with identical sediment contents. The A drip irrigation belt exhibited a higher sediment quality per unit length of its capillary tube, whereas the C drip irrigation belt displayed a lower sediment quality. As the sediment content increased, the disparity in sediment quality per unit length of the capillary tube in the drip irrigation belts diminished. This occurred due to the reduced operational time differences between treatments, leading to shorter sediment accumulation periods in the capillary tubes and consequently narrowing the sediment quality variation per unit length across treatments. As the sediment content increased, the disparity in system operating time across treatments diminished, the sediment accumulation time within the capillary decreased, and the variation in sediment quality per unit length of the capillary tube across treatments fell. The quality of sediment per unit length of capillary tube in the C drip irrigation belt escalated with increasing sediment content, whereas the sediment quality per unit length of the capillary tubes in the other three drip irrigation belts initially declined and subsequently ascended with increasing sediment content. This indicated that various drip irrigation belts exerted distinct influences on the sedimentation of silt within the capillary tube.

3.4. Change in the Quality of Clogging in the Channel of Different Emitters

The quality of clogging in the drip irrigation belt emitter channels for all tests was measured and analyzed for significance after the sand-laden water test. Figure 11 illustrates that, with the exception of the C drip irrigation belt, as sediment content increased, the clogging mass in the emitter channel of the same drip irrigation belt initially decreased, then increased. When the sediment content was 1 g·L−1, a significant difference was observed in the clogging quality among the four drip irrigation belts, with the B drip irrigation belt exhibiting the highest clogging quality, ranging from 0.0990 to 0.4306 g. However, when the sediment content was 2 g·L−1, no significant difference was noted in the clogging quality between the emitter channels of the B and C drip irrigation belts. At this time, the A drip irrigation belt exhibited the lowest quality of the emitter channel’s clogging, recorded at 0.0240 to 0.1736 g. When the sediment content was increased to 3 g·L−1, the quality of clogging in the emitter channel for the A drip irrigation belt remained slightly smaller than that of the other three types. However, the overall quality of clogging in the emitter channels of all four drip irrigation belts did not show obvious differences. The suggested which the quality of channel clogging was influenced by the interaction between channel structure and the sediment content. In scenarios with low sediment content, there was a notable disparity in the clogging quality among emitters with different channel structures. As the sediment content increased, the influence of emitter channel on the clogging quality of the emitters diminished progressively. When the sediment content was 3 g·L−1 in the water source, no significant differences in channel clogging quality were observed among various channel structures.
The increase in sediment content of the water source led to a reduction in the differences in sediment quality per unit length of capillary tube and the clogging quality of emitter channels among the various types of drip irrigation belts. Consequently, a significance analysis was conducted. Table 6 illustrated that the correlation between sediment quality per unit length of the capillary tube and clogging quality in the emitter channel was influenced by the sediment content of the water source and the type of drip irrigation belt. Furthermore, the relationship between sediment quality per unit length of the capillary tube and clogging quality in the emitter channel varied with increasing sediment content of the water source, which was also associated with the notable randomness of clogging events.
In order to better explore the effects of the test factors on the results, a two-way analysis of variance (ANOVA) was performed based on the experimental results: M (the sediment quality per unit length for drip irrigation belt), m (the quality of emitter channel clogging), and Q (relative flow rate of emitter). The results are shown in Table 7. The emitter channel and sediment content had a significant impact on M, but their interaction did not significantly affect M. This suggested that the emitter structure or type of the drip irrigation belt and sediment content significantly influence sediment accumulation, but their interaction did not produce an effect beyond their individual impacts. Additionally, the emitter channel structure, sediment content, and their interaction all had a highly significant effect on m. This suggests that the emitter channel structure and sediment content can significantly alter the accumulation of clogging material, especially when the sediment content is high, making clogging more pronounced. The significance of the interaction implied that the combined effect of these two factors was more important for clogging formation than their independent effects. But these factors did not significantly alter the water flow rate or flow in the emitters. This could mean that under the conditions of this experiment, although clogging occurred, its effect on the change in flow was minimal. A longer duration of operation or different conditions may be needed to observe significant changes in flow.

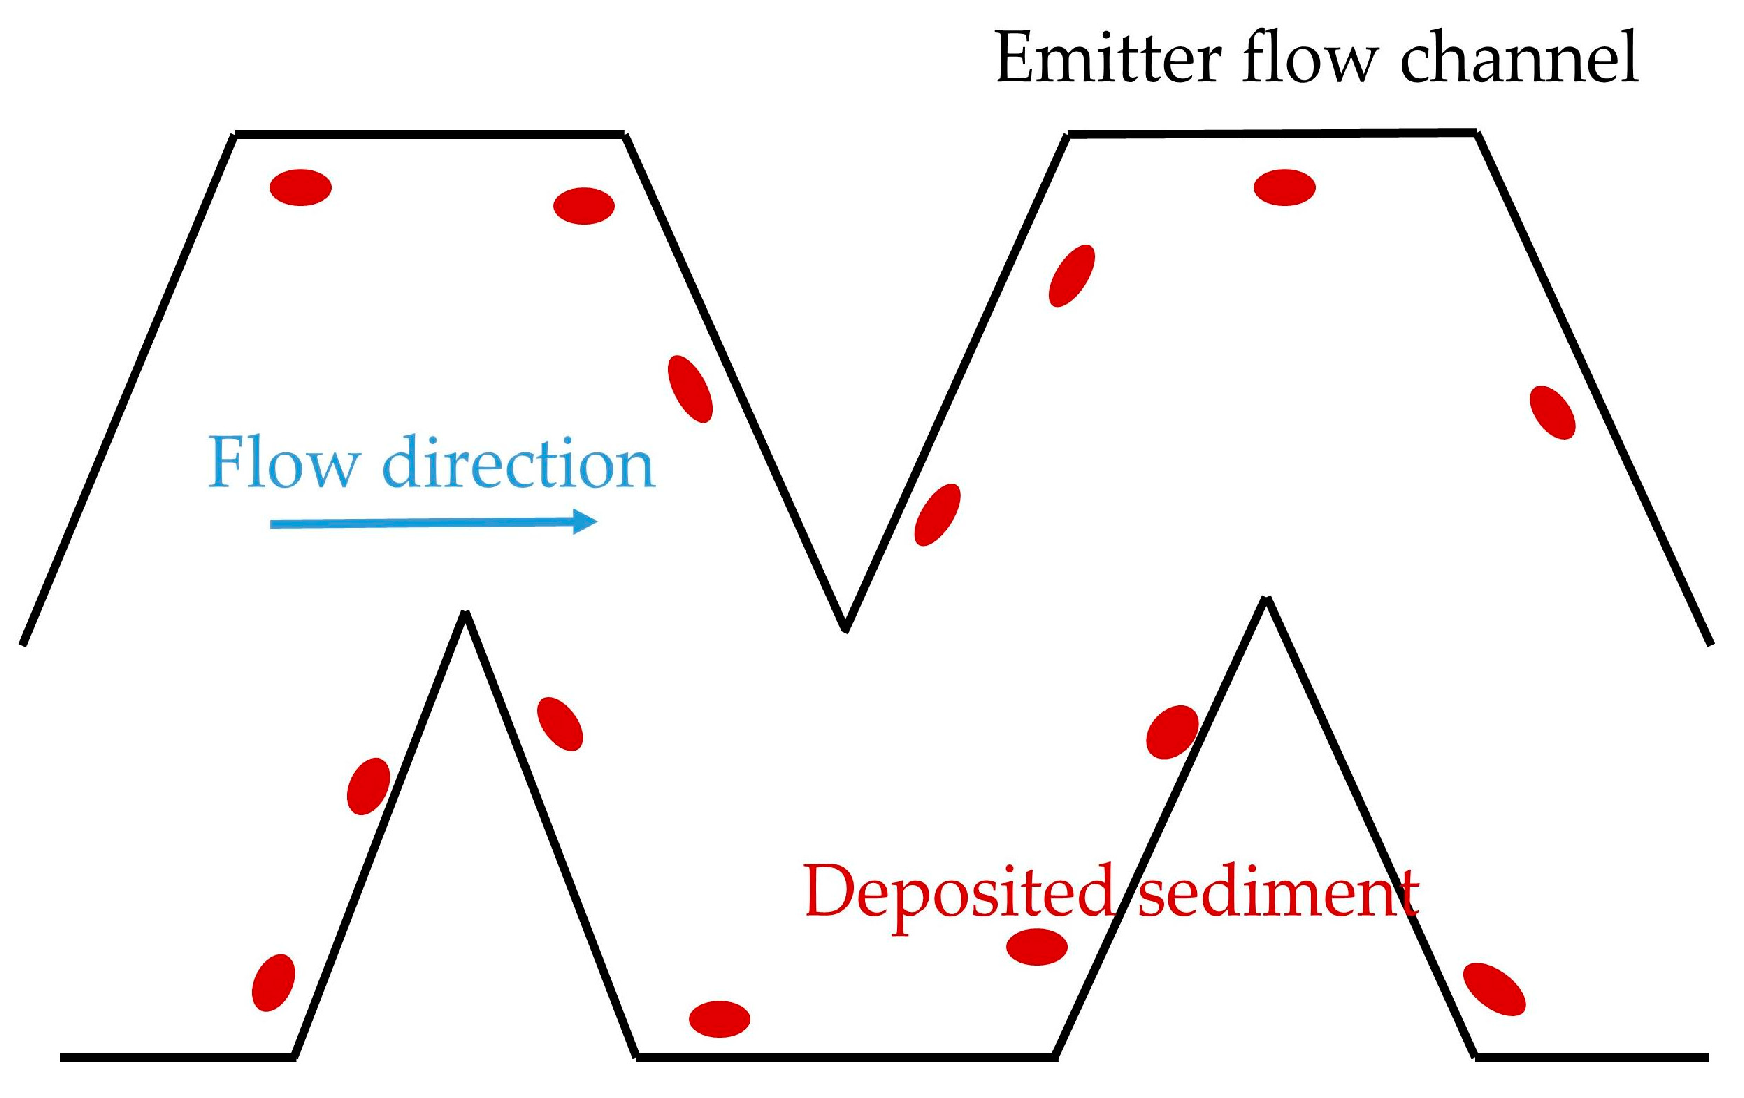
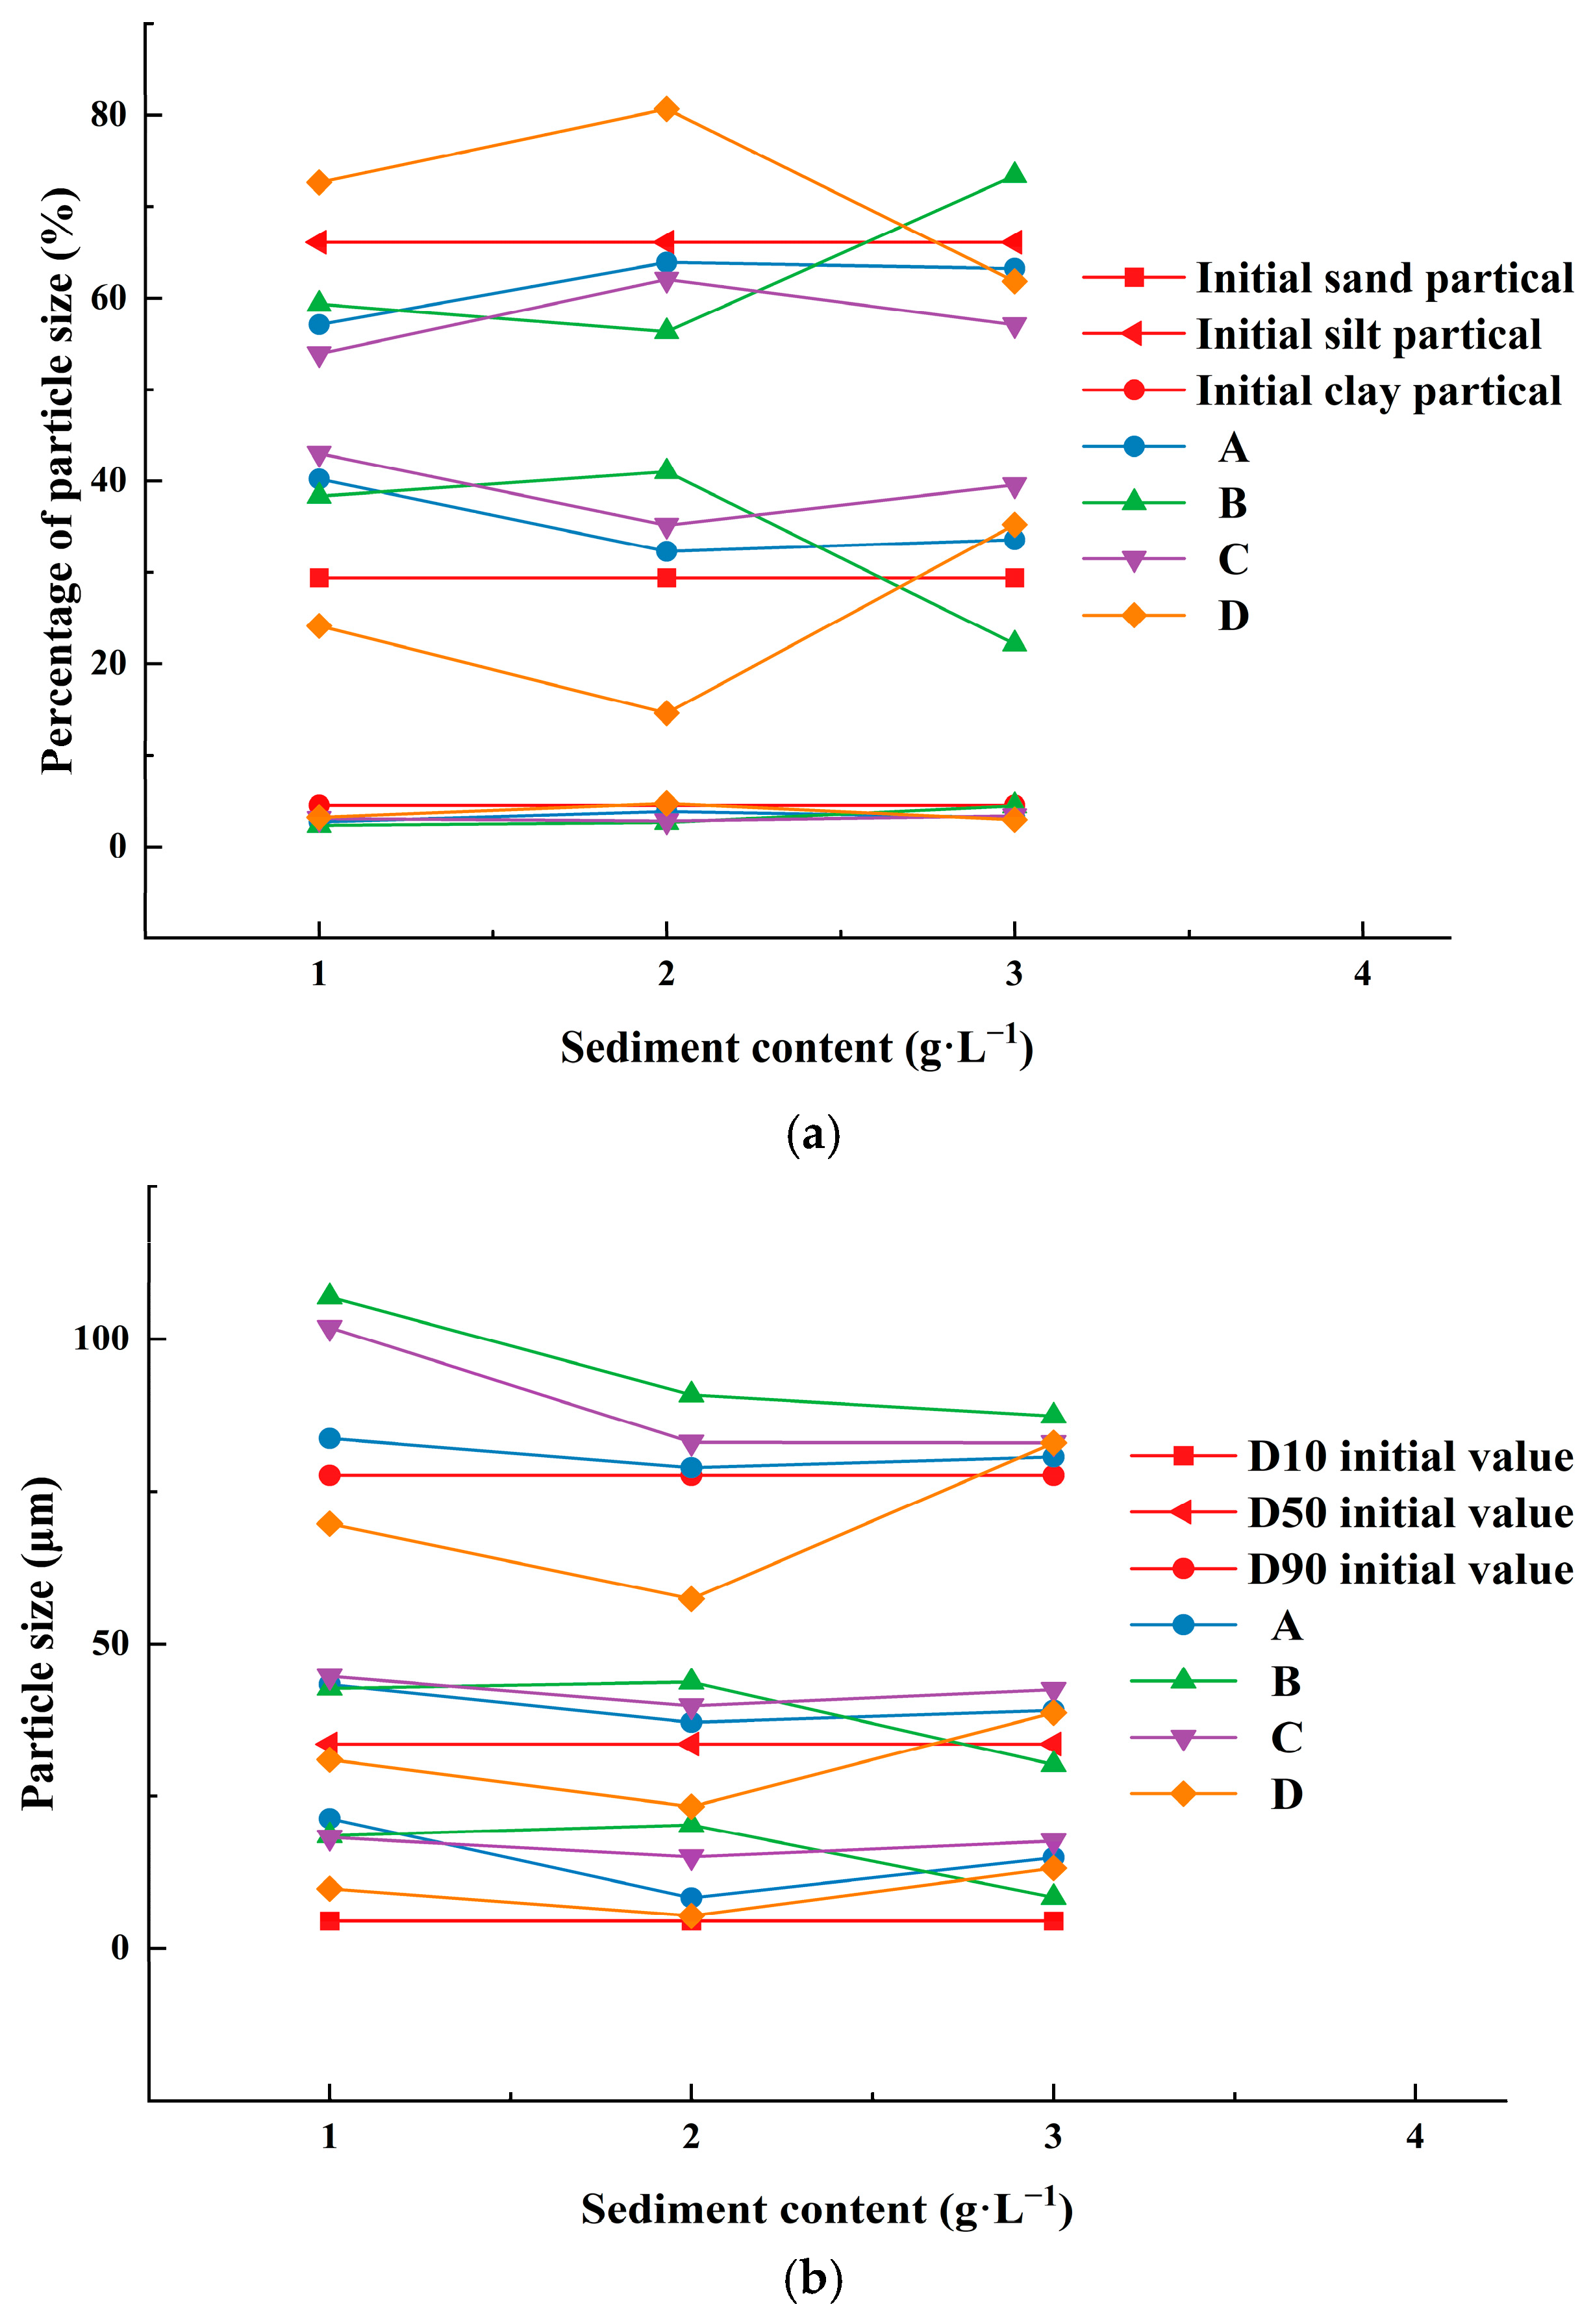
3.5. Sediment Deposition Location and Particle Size Composition in Emitter Channel of Different Types

The sediment particle size composition in the emitter channel for each treatment condition is presented in Table 8, while Table 9 displays the particle size values of D10, D50, and D90 corresponding to each treatment condition. Figure 12 illustrates the alteration in sediment particle size composition within the emitter channel for each treatment following the completion of the sand-laden water test. Figure 12a shows that, at the conclusion of the sand-laden water test, the sand particle ratio in the emitter channel sediment increased by 9.80 to 39.61%, compared to the initial sediment particle size. Conversely, the proportion of silt particles decreased by 3.33 to 18.44%, and the proportion of clay particles decreased by 1.33 to 48.67%. In contrast, the D and B drip irrigation belts exhibited a reduction in the sand particle ratio and an increase in silt particles ratio at certain sediment content levels. Figure 3d and Figure 12b demonstrate that the emitter channel size of the D drip irrigation belt was larger, facilitating a higher discharge capacity for larger sediment particles. However, as sediment content increased, the flow channel’s ability to discharge sediment diminished, leading to the accumulation of larger sediment particles within the channel. In contrast, the B drip irrigation belt exhibited a gradual decline in discharge capacity for sediment particles with increasing sediment content, resulting in a higher residual amount of silt particles and a decrease in the proportion of sediment particles of other sizes. The fraction of clay particles in the sediment was minimal, and variations in this fraction exerted no obvious effect on the overall effect. During a drip irrigation process, smaller sediment particles in the silt particles and clay particles were expelled from the emitter along with the water flow, while larger sediment particles in the silt particles and sand particles tended to accumulate within the emitter channel. Consequently, the proportion of clay and silt particles in emitter channel sediment diminished, whereas the sand particle ratio increased. The response ranges of various emitter configurations to sediment particle sizes exhibited some variability and were influenced by alterations in sediment content. Overall, the primary response range for sediment particle sizes in the emitter channel was 0.05 to 0.1 mm, comprising 70 to 85% of the total sediment within the flow channel.
The sediment content significantly influenced the sedimentation rate within the flow channel, while the sediment distribution locations were primarily determined by the flow channel’s structure and sediment particle composition. Consequently, the principal sediment deposition locations within the same flow channel remained consistent despite variations in sediment content. The analysis of the flow channel revealed that sediment distribution was categorized into complete sedimentation and partial sedimentation, with varying degrees of partial sedimentation observed. The clogging process in each flow channel unit operated independently, with the most significant interactions occurring between adjacent units. As the distance between flow channel units increased, the influence of these interactions diminished. Additionally, the occurrence of clogging within an emitter channel unit exhibited a degree of randomness, resulting in potential clogging events in one or more stages of the emitter channel. When the sediment content was 1 g·L−1, the system operated for an extended duration, and the progression of clogging in the flow channel became more pronounced. Consequently, taking the emitter flow channels of the four drip irrigation belts with a sediment content of 1 g·L−1 in the water source as an example, the distribution of sediment within different flow channels was analyzed.
Figure 13 illustrates the sediment distribution within the emitter channels of the four drip irrigation belts at various phases of the clogging process. The sediment distribution in the emitter channels of the four drip irrigation belts was fundamentally the same. During the preliminary phase of sediment deposition (Figure 13a), sediment particles predominantly accumulated in the outer corners of the flow channel. As sand-laden water traversed the labyrinthine flow channel, certain sediment particles were progressively deposited and congregated in regions of low flow velocity, influenced by gravitational forces or frictional interactions with the channel’s inner walls. Over time, with prolonged system operation, an increasing number of sediment particles accumulated, resulting in the formation of a relatively stable sedimentary structure among them. The sediment layer progressively built up in various locations within the flow channel (Figure 13b). When sediment built-up develops to a certain stage, it could cause labyrinth flow channel blockage (Figure 13c). Sediment particles block the entire cross-section of the emitter channel, allowing water to flow only through the gaps between them. Finer particles gradually fill these gaps, eventually fully blocking the emitter channel.

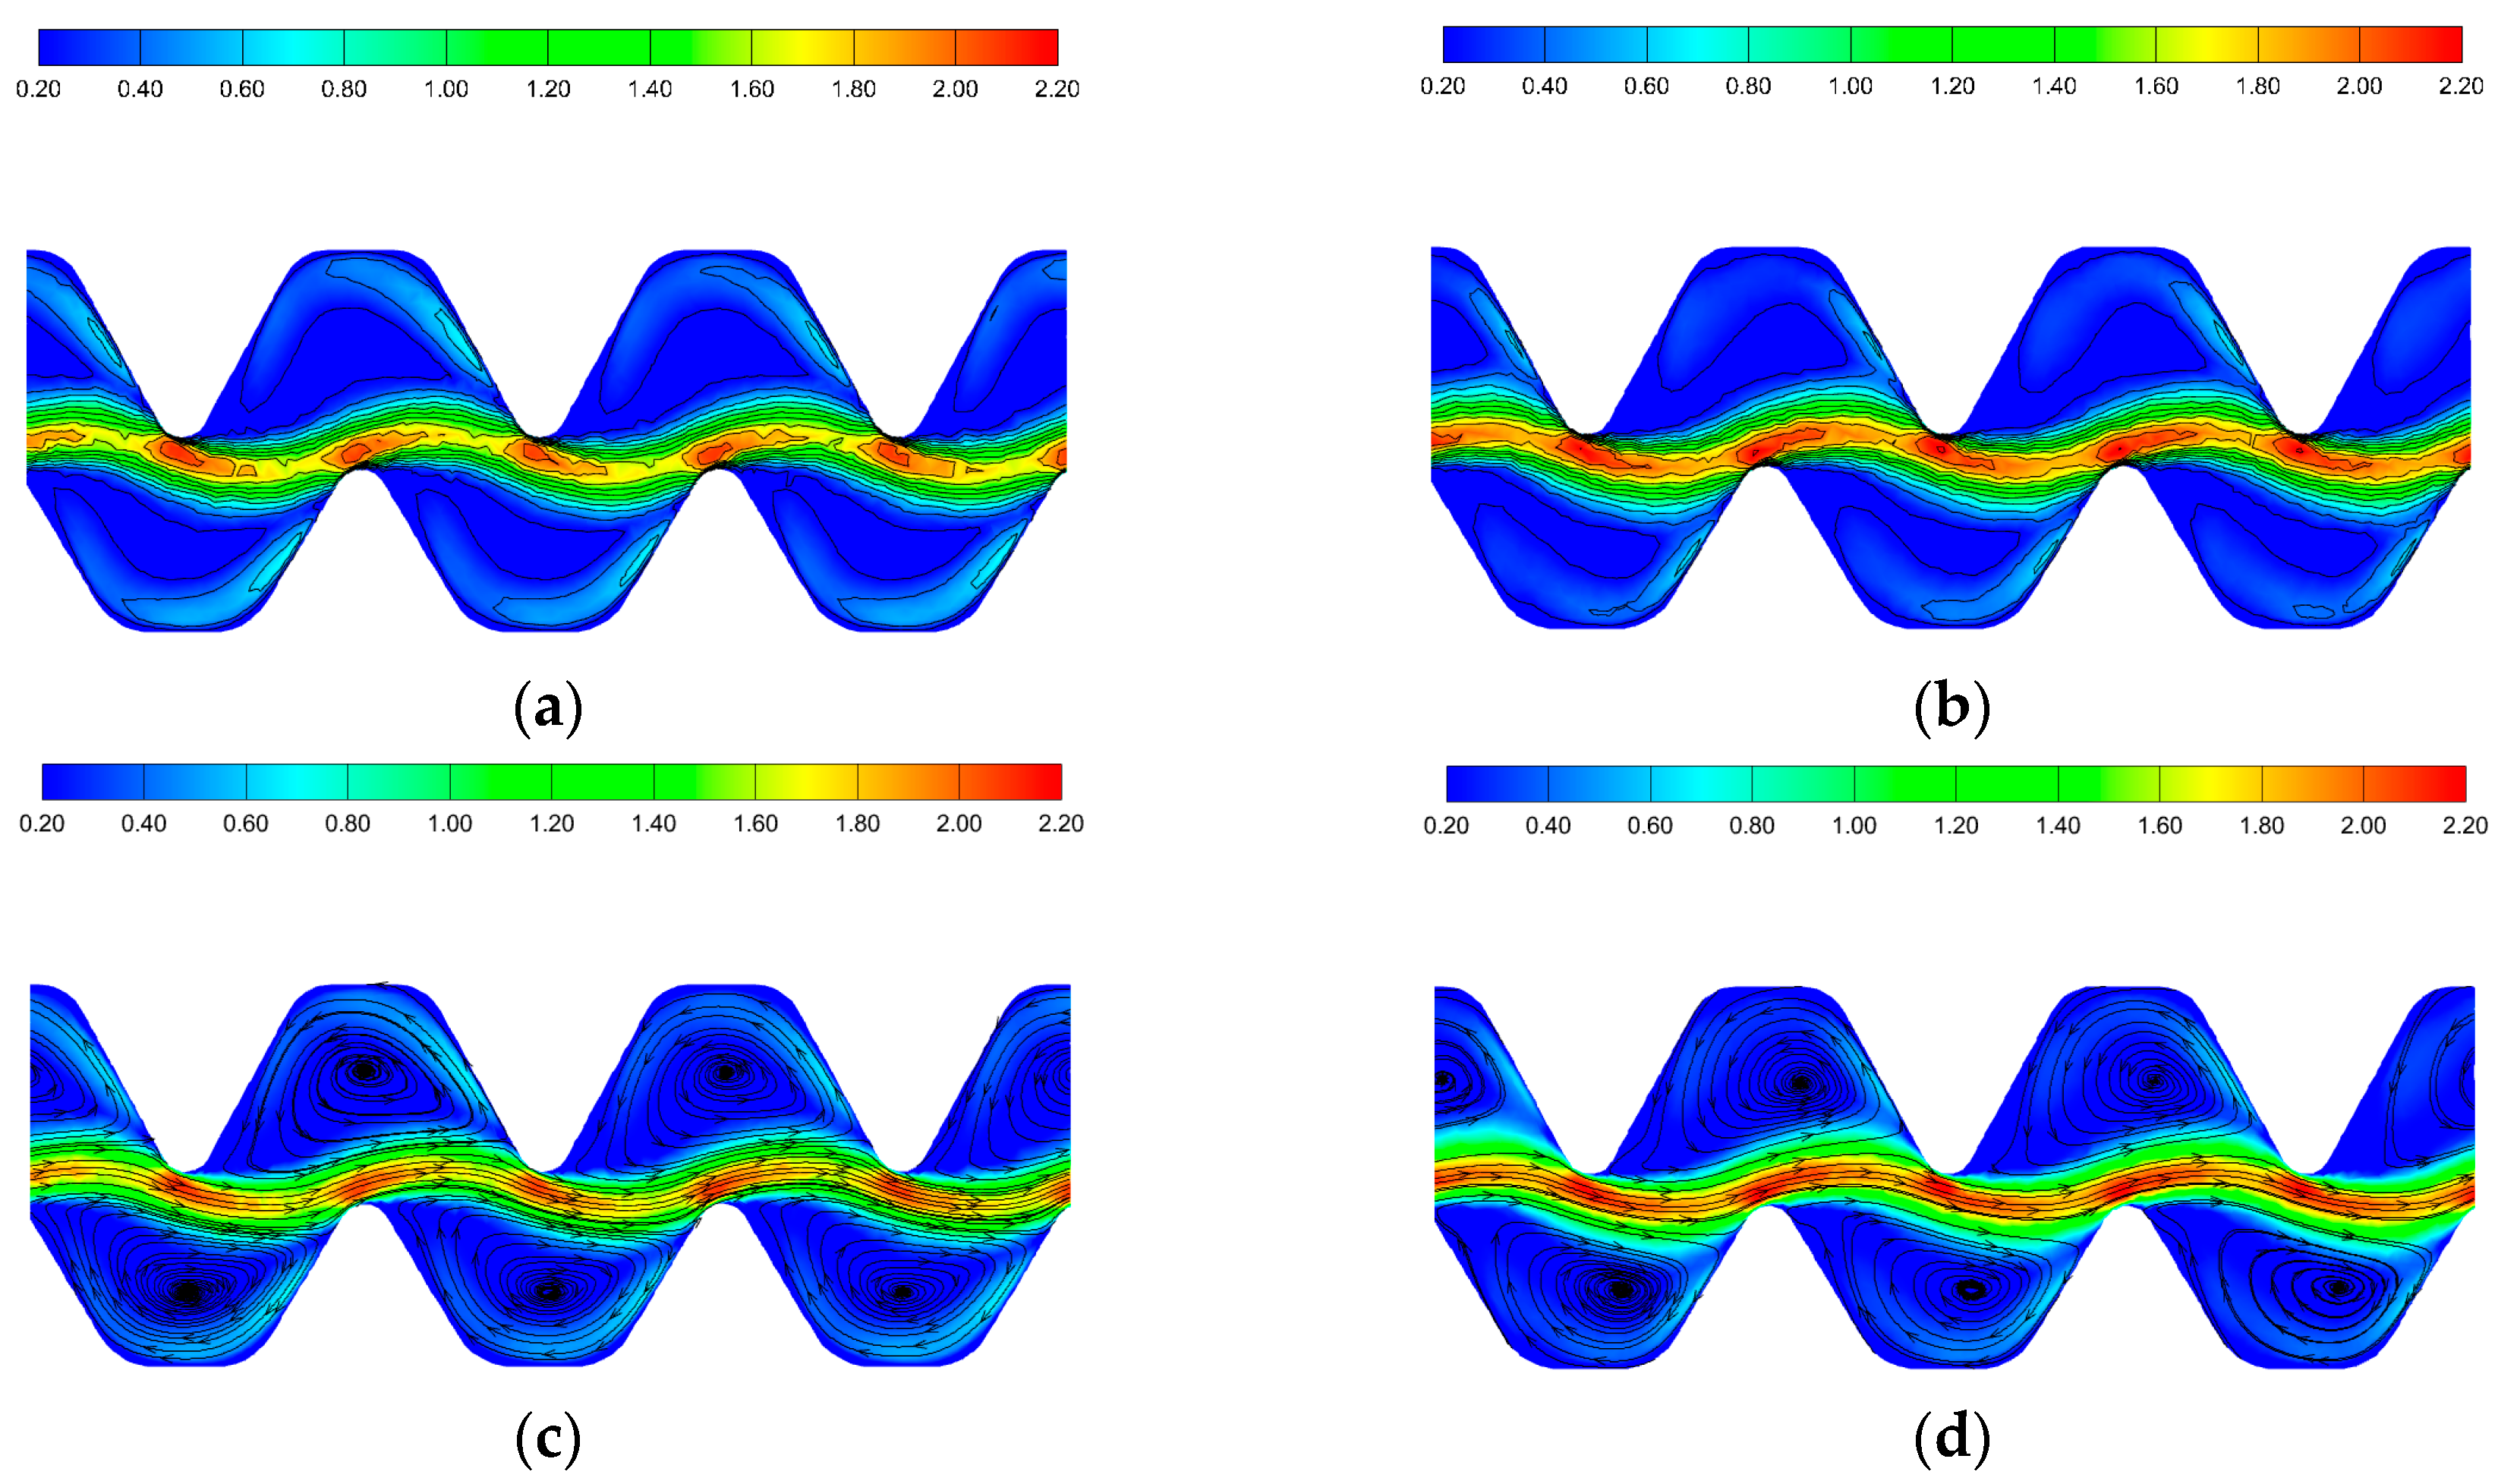
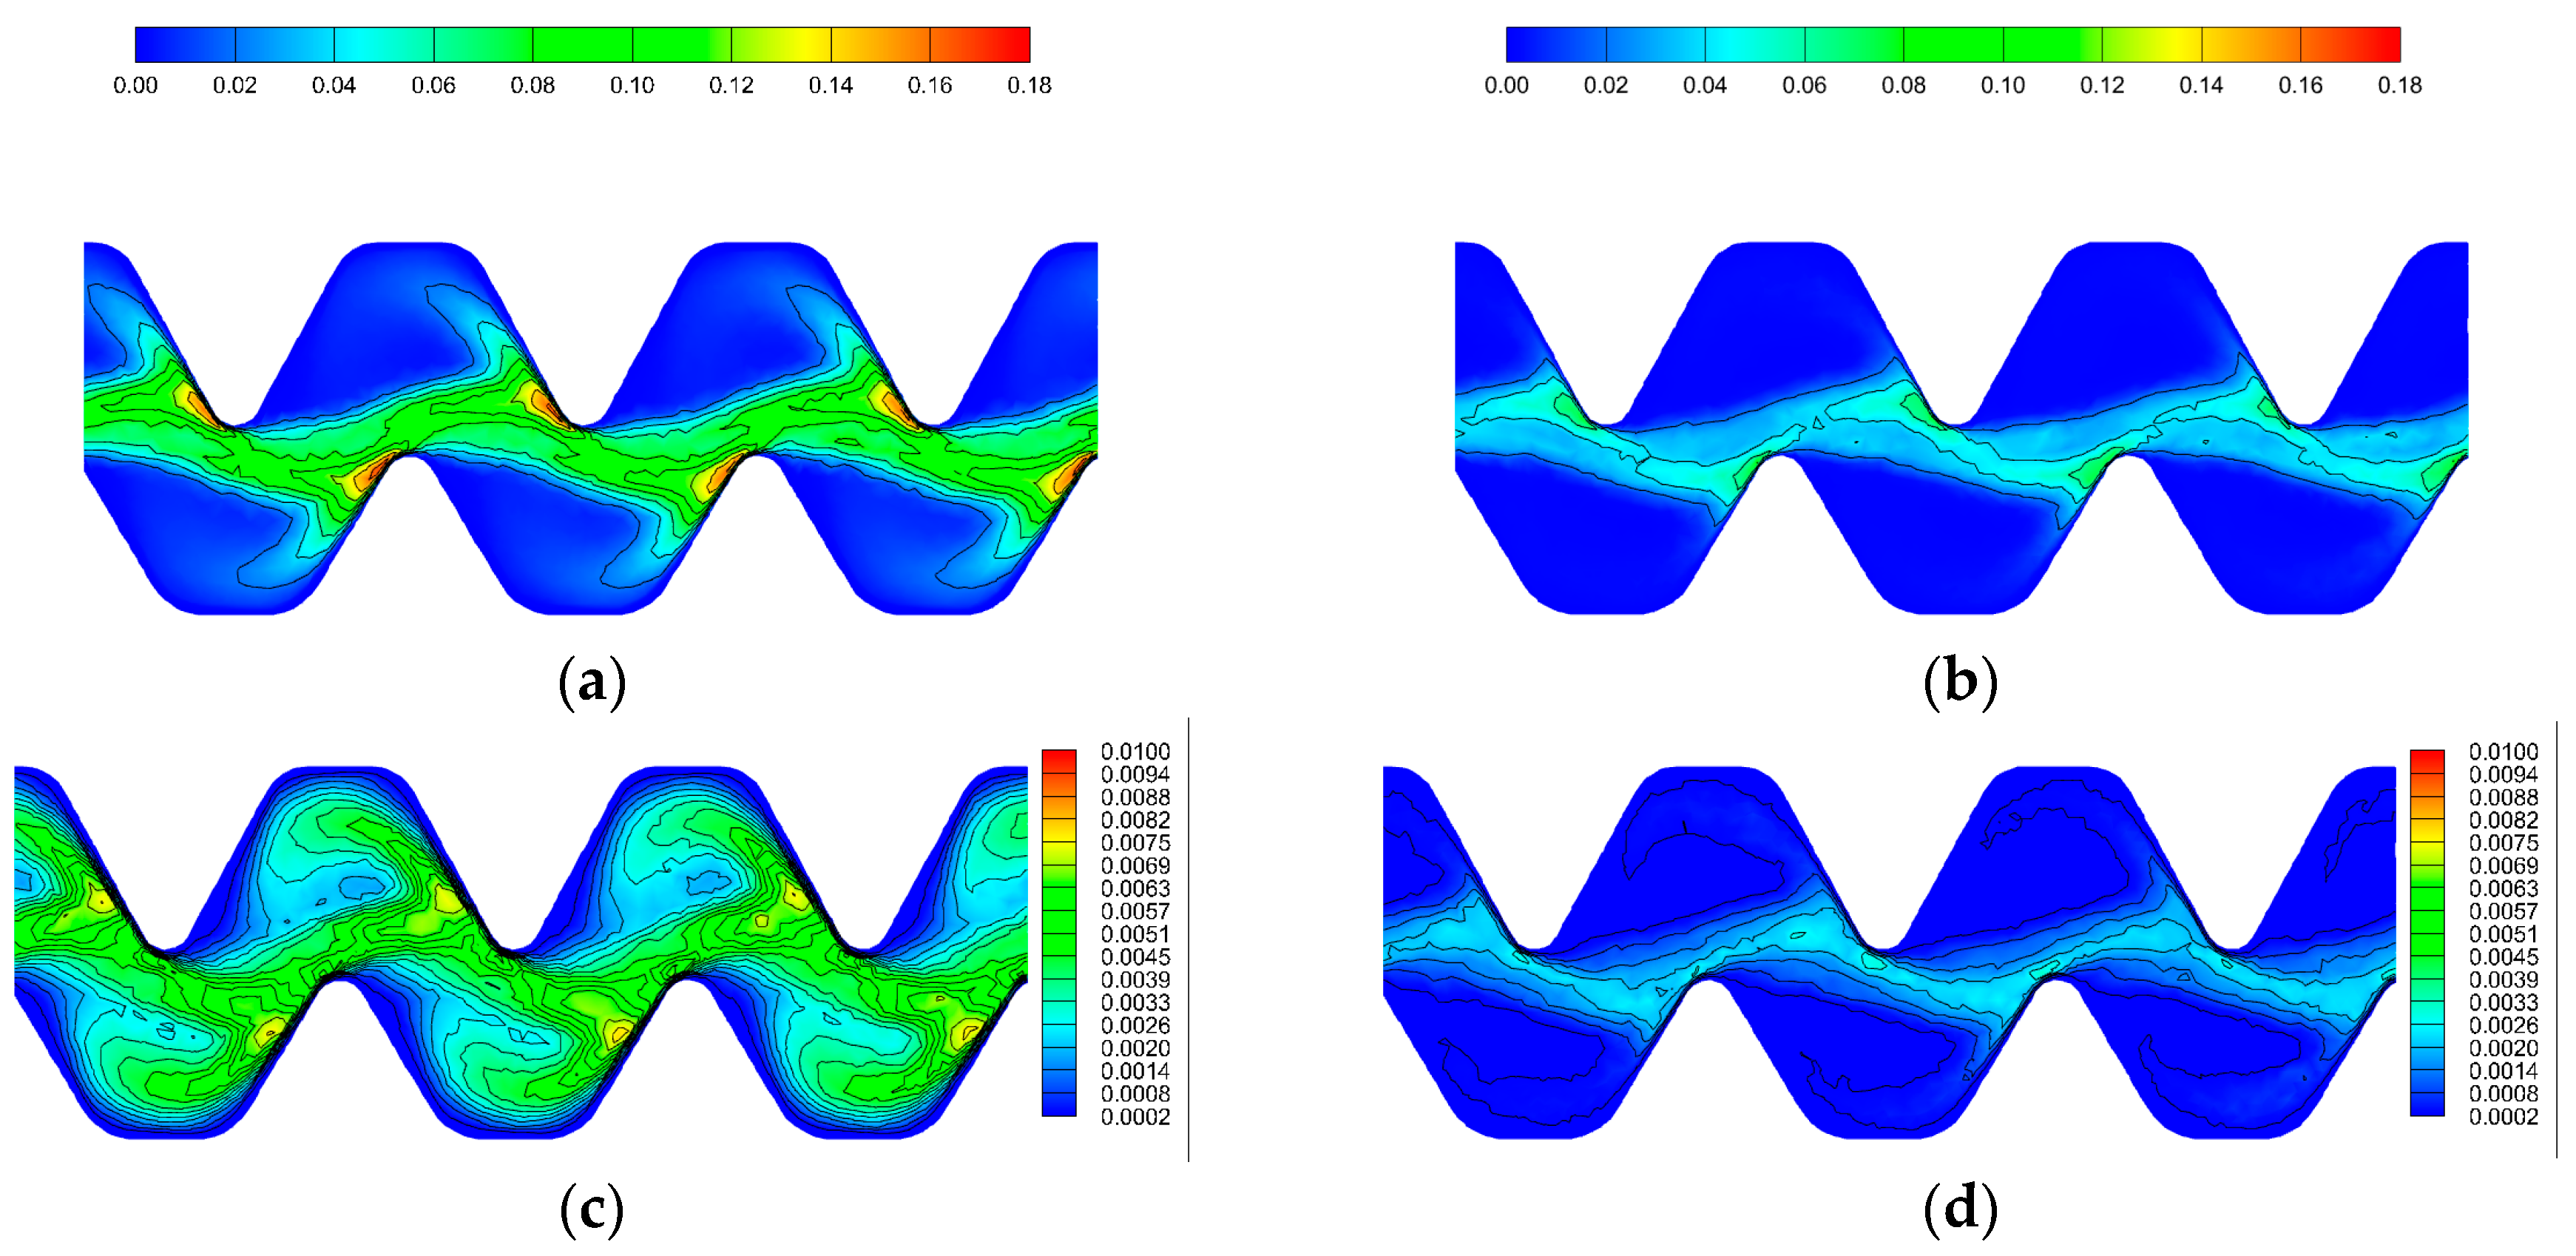
3.6. The Change in Flow Velocity and Turbulent Kinetic Energy in the Emitter

We observed a clear power–law relationship between flow rate and pressure, with the fitted mathematical formula as follows:
Q = 0.23 · P 0.52
where Q is the flow rate, P is the pressure, and 0.23 and 0.52 are constants derived from experimental data. The R2 value of this fit is 0.99. Additionally, we calculated the mean square error (MSE) between the model predictions and experimental observations as follows:
M S E = 1 n i = 1 n y i y ^ i 2
where n is the sample sizes and yi and yi are the experimental observations and the simulated predictions, respectively. Upon calculation, MSE = 0.001542736, indicating a strong correlation between the two. After validating the simulation results, we processed the simulation data using Tecplot software.
The variation patterns of flow velocity and turbulent kinetic energy in the emitter channel under different operating conditions are similar. Here, the simulation results of the B drip irrigation tape when sediment content was 1 g·L−1 were analyzed as an example. In the Tecplot software, profiles were taken at distances of 0.5 mm and 0.1 mm from the vertical wall and the variations in flow velocity and turbulent kinetic energy at these two locations were analyzed. Based on the streamline simulation results (Figure 14), the region flowing along the flow main direction was identified as a main flow zone, while this region where vortices were formed by detachment from the main flow boundary layer was identified as the vortex zone. The low-speed and high-speed zones were delineated based on the average flow velocity across the section of the emitter channel. A wavy pattern was observed in the streamlined areas of the main flow zone, with flow velocity higher compared to the near-wall region and the maximum velocity occurring at the middle bend. The low-speed zone, particularly at the upper and lower bends, is where vortices typically form. In the vortex region, the flow exhibits a swirling motion, which increased the residence time of the fluid in this area. Additionally, since the vortex zone flow velocity was relatively small, this creates favorable conditions for sediment deposition. The lee side of the flow path walls (the side opposite to the water flow direction) was characterized by the lowest flow velocity and is most susceptible to sediment accumulation. The flow velocity in the main flow zone at the 0.1 mm section was generally higher than that at the 0.5 mm section. However, in the vortex zone, the flow velocity at the 0.1 mm section was slightly lower compared to the 0.5 mm section, and it increased the risk of sand particle deposition near the bend in the flow path vertical wall.
Figure 15 shows the turbulent kinetic energy distribution in the emitter flow channel. As can be seen, the turbulent kinetic energy significantly increased in the narrow regions of the emitter channel, which was associated with the increased shear forces experienced by the fluid in these areas. The intensity of turbulent kinetic energy is directly associated with the energy dissipation capacity of the emitter channel unit. The greater the dissipation capacity, the fewer flow channel units are required, but the pressure on the emitter channel increases and the thickness of the emitter channel walls increases when it is the same material. In practical applications, these factors need to be considered comprehensively. Additionally, in the 0.1 mm section, the turbulent kinetic energy at each point was noticeably smaller than in the 0.5 mm section, which might be influenced by the effects of the wall. Near the vertical wall, the wall obstruction led to a decrease in turbulent kinetic energy. However, the overall distribution trend of turbulent kinetic energy was similar for both sections. The turbulent kinetic energy in the facing-water zone (the side in the direction of water flow) of the emitter channel’s wall was significantly greater compared to that in the backing-water zone. The flow was relatively stable in the facing-water zone, while part of the water from the facing-water zone might recirculate to the backing-water zone of the same unit, thus extending the water’s stay in the backing-water zone and thereby promoting sediment buildup. The turbulence viscosity indicates the rate of momentum transfer, this was elevated in the narrower sections of the flow channel, aligning with the overall distribution of turbulent kinetic energy. In the region where the recirculating flow met the main flow in backing-water zone, the momentum transfer efficiency was significantly reduced; this was especially the case in the 0.1 mm section, where there was almost no momentum transfer. As a result, this region had the lowest turbulent kinetic energy and was also the location where sediment was most likely to accumulate in the emitter channel.

4. Discussion

4.1. The Impact of Sediment Characteristics on Emitter Clogging

When sand-laden water was used as the drip irrigation water source, sediment particles inevitably entered the emitter’s micro-channel. The interaction between sediment content and sediment particle size made the emitter vulnerable to physical clogging [38,39]. The Dra initially varied slowly during the emitter’s clogging, followed by a gradual increase in the rate of decrease, resulting from the progressive deposition of particles within the flow channel. The test indicated that the emitters were responsible for the majority of the sediment particles released, implying that the emitters possessed a degree of sediment discharge capacity. This alignes with the findings of Hou et al. [40]. Moreover, a substantial quantity of sediment was deposited in the capillary tube, whereas the sediment remaining in the flow channel was minimal, corroborating the findings of Yang et al. [41]. Sediment particles within the flow channel could escape from the emitter with the water flow. Wu et al. [28] identified—in somewhat different terms from the findings of this study—that the predominant factor affecting clogging at a sediment content of over 1.5 g·L−1 was the sediment content itself and the effect of particle size variability on clogging was comparatively minor.
This study found that increasing the sediment content from 1 to 2 g·L−1 significantly accelerated the clogging speed of the emitters of all four types of drip irrigation belts. The result aligns with the findings of the previously mentioned study. However, in this study, the clogging speed of the emitters did not continue to accelerate as the sediment content increased. Moreover, the rise in the clogging speed of the emitters decreased significantly or was even delayed when the sediment content rose from 2 to 3 g·L−1. This trend was influenced by differences in emitter structure and sediment content settings compared to Wu et al. [28], leading to distinct clogging patterns. Various mutual feedback processes between flow channel structures and sediment content led to distinct clogging patterns in the emitters. Unlike the findings of this study, Ren et al.’s [42] clogging test in a large-flow channel labyrinth emitter revealed that a sediment content of less than 2 g·L−1 did not significantly affect the emitter’s clogging. The reason for this is that they utilized an emitter channel that was 3 mm in size, which is much larger than that of the flow channel in the present study, and while the sediment content is the same, this large flow channel has a larger passage and a relatively small chance of collision between sediment particles. In addition, the movement of water and sediment particles in a large emitter channel relies on gravitational force, so it can be difficult to identify the effect of sediment content on emitter clogging in short-cycle sand-laden water tests when using small sediment content concentrations. These findings suggest that the influence of sediment content on clogging is closely related to the emitter channel size and structure.

4.2. The Impact of Flow Channel Structure on Emitter Clogging

Overall, there is a critical range of sediment content when emitters become susceptible to clogging [43]. This study suggests that the critical range of sediment content is related to the emitter channel structure as well as the sediment particle size composition. When the sediment content was less than the critical sediment content range, emitter clogging occurred due to the interactions of particle size and sediment content, and clogging speed increased with the increase in sediment content. However, when the sediment content exceeded the critical sediment content range, the clogging speed of the emitter tended to stabilize, and further increases in sediment content did not cause significant changes in clogging speed. As a result, it is important to take into account the relationship between the water source’s sediment content, sediment particle size, and flow channel structure while examining the clogging law of emitters in sand-laden water [31]. In practice, drip irrigation is frequently utilized as an irrigation vehicle for integrating water and fertilizer, and the impact of varying fertilizer applications on emitters’ ability to discharge sediment also varies [44]. Drip irrigation is an important vehicle for water and fertilizer integration; however, whether sand-laden water can be used for water and fertilizer integration is still unclear. Future studies should also examine the combined effects of fertilizer components and sediment characteristics on clogging mechanisms.
The flow channel structure is an intrinsic determinant that affects the emitter anti-clogging capability [45]. It has been demonstrated that sediment particles within the emitter channel are susceptible to the influence of whirlpools generated at the corners, resulting in their deposition. The low-velocity vortex zone had been identified as the primary location for sediment particle deposition [46]. The movement of sediment particles in the channel was primarily driven by the drag force of the water flow. The water velocity was higher in the bends of the channel, where high-velocity regions were formed, which caused the sediment particles to maintain a high speed, making it difficult for them to settle. Once the sediment particles left these high-velocity regions, their speed exceeded that of the water flow. They were then mainly influenced by the resistance of the water and their own inertia. Simultaneously, affected by vortices, the sediment particles tended to concentrate and settle easily at the vortex center and in the backing-water zone. To gain a clear understanding of the movement of sediment particles, Zhu et al. [47] conducted simulations of particle transport in flow channels with varying internal tooth structures. According to their research, sediment particles flow irregularly in low-velocity zones due to whirlpools, and they also noticed that longer retention duration is the outcome of this irregular movement’s increasing magnitude with particle size. The data from this study, which showed that the particle sizes causing clogging of the emitters were concentrated in the medium–large particle size range 0.05~0.1 mm, are consistent with the above indication that medium- and large-sized sediment particles significantly affect emitter clogging. Based on the above studies and the conclusions of this experiment, it can be inferred that the distribution mechanism of emitter clogging is closely related to vortices within the flow channel. The distribution of vortices is linked to the energy dissipation effect of the emitter’s flow channel, which determines its hydraulic performance. This provides a new perspective for the future development of high-performance emitters—approaching the channel design of the emitters from the perspective of energy conversion. This method effectively integrates an emitter’s anti-clogging performance with its hydraulic performance, significantly improving the efficiency of emitter development.

4.3. The Coupling Effect Between Sediment Characteristics and Flow Channel Structure

Research has demonstrated that the retention of sediment particles inside the emitter channel depends on the relative sizes of the two. The particle size of sediment that is easily retained ranges between 1/7 and 1/10 of the smallest dimension of the emitter channel, which is also known as the sensitive particle size range for clogging the emitter channel [48]. The sediment particle size composition also plays a significant role in flow channel clogging, and a stable clogging structure is made up of both large and small sediment particles. Fine, viscous particles that occur through flocculation will fill in the pore space between the large sediment particles, leading to the creation of a stable clogging structure [49], which is extremely harmful to the emitter. This study observed that the highest proportion of silt particles, followed by sand particles, and the least number of clay particles were deposited in the emitter channel. This is consistent with the findings of previous studies. However, variations were observed in different treatments, indicating a complex interaction between sediment composition and emitter channel structure. Especially at higher sediment levels, their combined effect is more crucial for clogging than their independent impacts. Therefore, a reasonable combination of emitter channel structure and sediment content can effectively reduce sediment deposition in emitters, thereby improving the anti-clogging capacity of the drip irrigation system.
Given that the initial sediment composition was fixed and the gradient of sediment content was significant, it was not feasible for accurately ascertaining the combined effect of sediment content and particle size composition on emitter clogging. Future studies should employ a sieving process to separate the added sediment and refine the sediment content level, while also taking into account the effect of sediment characteristics on clogging patterns. This will facilitate the analysis of the interaction between different particle sizes of sediment, as well as the sediment deposition pattern inside the emitter for different combinations of sediment particle size composition and sediment content. Additionally, future field trials should be conducted to explore the clogging behavior of such drip irrigation belts in the actual usage process within the Yellow River Basin. This would provide valuable insights into the real-world performance of these emitters under variable environmental and operational conditions. Field experiments are crucial for assessing the long-term durability and reliability of the emitters in the presence of highly sand-laden water, as laboratory conditions may not be able to fully replicate the complexities and challenges faced in agricultural settings. These trials could help optimize irrigation system management and enhance the efficient use of sand-laden water, ultimately improving water resource management in the Yellow River Basin.

5. Conclusions

Emitter clogging is influenced by sediment content, particle size, and channel structure. As sediment content increases, clogging accelerates, peaking within a specific range. The emitter’s sensitivity to particle size depends on its channel structure, while sediment accumulation is mainly influenced by the content. The interaction of emitter channel structure and sediment content significantly affects clogging, and an optimal combination can enhance drip irrigation system anti-clogging capacity. Among these factors, emitter channel structure plays the key role in anti-clogging performance. In this study, the B drip irrigation belt has the best anti-clogging capability and adaptability to varying sediment content.
The proportion of silt particles is the highest among the deposited sediment particles in the emitter channel of the emitter, followed by sand particles, while clay particles are the least abundant. Under most treatment conditions, the proportion of sand increases while silt and clay proportions decrease. The particles most responsible for clogging are within the 0.05 to 0.1 mm range, making up 70 to 85% of the total sediment.
Vortices formed at emitter channel units, where minimal momentum transfer in the backing-water zone reduced turbulent kinetic energy and increased sediment particle residence time, promoting deposition. The lowest point of energy dissipation occurred in the backing-water zone and vortex center, coinciding with the sediment deposition areas. The velocity distribution near vertical walls resembled that in the central region but had lower turbulent kinetic energy. Reducing the right-angle regions in the channel can effectively lower the risk of emitter clogging. These findings emphasize the importance of particle size, composition, and emitter channel design in emitter clogging, which is crucial for optimizing drip irrigation in sand-laden water, particularly in the Yellow River Basin. The effective management of sediment composition and emitter channel design can reduce clogging risk, improve irrigation efficiency, and support sustainable water use and agricultural practices.

Author Contributions

Conceptualization, M.W.; methodology, M.W. and H.S.; software, H.L. and H.S.; validation, M.W., M.X. and H.S.; formal analysis, M.W. and M.X.; investigation, M.W. and M.X.; resources, H.L. and R.L.; data curation, M.W.; writing—review and editing, R.L. and Q.H.; visualization, M.W.; supervision, Q.H.; funding acquisition, R.L. and Q.H. All authors have read and agreed to the published version of the manuscript.

Funding

This study is supported by the National Key Research and Development program of China (2022YFD1900403), the Henan Provincial Key R&D and Promotion Special (Science and Technology Tackling) Project (no. 242102110215, no. 252102110236), and the Basic Research Project of the Institute of Farmland Irrigation of Chinese Academy of Agricultural Science (no. IFI2024-23).

Data Availability Statement

The data that support the findings of this study are available from the corresponding author upon reasonable request.

Acknowledgments

We would like to thank the anonymous reviewers for their long-term guidance and constructive comments.

Conflicts of Interest

The authors declare no conflicts of interest.

Abbreviations

The following abbreviations are used in this manuscript:
DPIVDigital particle image velocimetry
LIFVLaser-induced fluorescence velocimetry
CFDComputational fluid dynamics
DraDischarge ratio variation
CuChristensen’s uniformity coefficient

References

  1. Liu, M.; Zhou, X.; Huang, G.; Li, Y. The Increasing Water Stress Projected for China Could Shift the Agriculture and Manufacturing Industry Geographically. Commun. Earth Environ. 2024, 5, 396. [Google Scholar] [CrossRef]
  2. Zhang, Y.; Khan, S.U.; Swallow, B.; Liu, W.; Zhao, M. Coupling Coordination Analysis of China’s Water Resources Utilization Efficiency and Economic Development Level. J. Clean. Prod. 2022, 373, 133874. [Google Scholar] [CrossRef]
  3. Zhang, Q.; Shen, J.; Sun, F. Spatiotemporal Differentiation of Coupling Coordination Degree between Economic Development and Water Environment and Its Influencing Factors Using GWR in China’s Province. Ecol. Model. 2021, 462, 109794. [Google Scholar] [CrossRef]
  4. Fan, L.; Shen, J.; Wang, X.; Zhang, Y. Effects of Ditch Water and Yellow River Irrigation on Saline–Alkali Characteristics of Soil and Paddy. Water 2024, 16, 2598. [Google Scholar] [CrossRef]
  5. Jiao, Y.; Feng, J.; Liu, Y.; Yang, L.; Han, M. Sustainable Operation Mode of a Sand Filter in a Drip Irrigation System Using Yellow River Water in an Arid Area. Water Supply 2020, 20, 3636–3645. [Google Scholar] [CrossRef]
  6. Pei, Y.; Li, Y.; Liu, Y.; Zhou, B.; Shi, Z.; Jiang, Y. Eight Emitters Clogging Characteristics and Its Suitability under On-Site Reclaimed Water Drip Irrigation. Irrig. Sci. 2014, 32, 141–157. [Google Scholar] [CrossRef]
  7. Yang, G.; Li, F.; Tian, L.; He, X.; Gao, Y.; Wang, Z.; Ren, F. Soil Physicochemical Properties and Cotton (Gossypium hirsutum L.) Yield under Brackish Water Mulched Drip Irrigation. Soil Tillage Res. 2020, 199, 104592. [Google Scholar] [CrossRef]
  8. Lv, C.; Zhang, E.; Gan, H.; Niu, W.; Ali, S.; Dong, A.; Zhang, W.; Wu, M.; Sun, D. Aerated Drip Irrigation Increased the Emitter Clogging Risk of the Yellow River Water Drip Irrigation. Irrig. Drain. 2023, 72, 3–20. [Google Scholar] [CrossRef]
  9. Qin, C.; Zhang, J.; Wang, Z.; Lyu, D.; Liu, N.; Xing, S.; Wang, F. Anti-Clogging Performance Optimization for Shunt-Hedging Drip Irrigation Emitters Based on Water–Sand Motion Characteristics. Water 2022, 14, 3901. [Google Scholar] [CrossRef]
  10. Zhang, W.; Tian, Y.; Feng, Y.; Liu, J.; Zheng, C. Water-Saving Potential of Different Agricultural Management Practices in an Arid River Basin. Water 2022, 14, 2072. [Google Scholar] [CrossRef]
  11. Yang, P.; Wu, L.; Cheng, M.; Fan, J.; Li, S.; Wang, H.; Qian, L. Review on Drip Irrigation: Impact on Crop Yield, Quality, and Water Productivity in China. Water 2023, 15, 1733. [Google Scholar] [CrossRef]
  12. He, X.; Wu, P.; Zhang, L.; Wei, Y.; Liu, X.; Yang, F.; Zhou, W. Microporous Ceramic Emitter: A Drip Irrigation Emitter Suitable for High-Sediment Water. J. Water Process Eng. 2024, 67, 106169. [Google Scholar] [CrossRef]
  13. Zhou, W.; Zhang, L.; Wu, P.; Cai, Y.; Zhao, X.; Yao, C. Hydraulic Performance and Parameter Optimisation of a Microporous Ceramic Emitter Using Computational Fluid Dynamics, Artificial Neural Network and Multi-Objective Genetic Algorithm. Biosyst. Eng. 2020, 189, 11–23. [Google Scholar] [CrossRef]
  14. Wang, H.; Wang, J.; Wang, C.; Wang, S.; Qiu, X.; Sun, Y.; Li, G. Characterization of Labyrinth Emitter-Clogging Substances in Biogas Slurry Drip Irrigation Systems. Sci. Total Environ. 2022, 820, 153315. [Google Scholar] [CrossRef]
  15. Muhammad, T.; Zhou, B.; Puig-Bargu´es, J.; Ding, C.; Li, S.; Manan, I.; Zhou, Y.; Liu, Z.; Li, Y. Assessment of Emitter Clogging with Multiple Fouling and Root Intrusion in Sub-Surface Drip Irrigation during 5-Year Sugarcane Growth. Agric. Water Manag. 2022, 274, 107981. [Google Scholar] [CrossRef]
  16. Shen, Y.; Puig-Bargués, J.; Li, M.; Xiao, Y.; Li, Q.; Li, Y. Physical, Chemical and Biological Emitter Clogging Behaviors in Drip Irrigation Systems Using High-Sediment Loaded Water. Agric. Water Manag. 2022, 270, 107738. [Google Scholar] [CrossRef]
  17. Hu, Y.; Wu, W. Review and Development Strategy of Irrigation with Unconventional Water Resources in China. Strateg. Study CAE 2018, 20, 69–76. [Google Scholar] [CrossRef]
  18. Shi, K.; Kong, J.; Yue, H.; Huang, Y.; Wei, X.; Zhangzhong, L. Magnetized Water Irrigation Alleviates Emitter Clogging of a Drip Fertigation System. Agronomy 2023, 13, 108. [Google Scholar] [CrossRef]
  19. Lv, C.; Niu, W.; Du, Y.; Sun, J.; Dong, A.; Wu, M.; Mu, F.; Zhu, J.; Siddique, K.H.M. A Meta-Analysis of Labyrinth Channel Emitter Clogging Characteristics under Yellow River Water Drip Tape Irrigation. Agric. Water Manag. 2024, 291, 108634. [Google Scholar] [CrossRef]
  20. Zhang, J.; Xiao, Y.S.; Wu, Y.; Jia, F.; Li, S.; Zhou, B.; Li, Y. Effects of Microorganisms on Clogging Process and Clogging Substances Accumulation of Drip Irrigation Emitters Using the High-Sediment Water Sources. Irrig. Sci. 2022, 40, 845–856. [Google Scholar] [CrossRef]
  21. Leverenz, H.L.; Tchobanoglous, G.; Darby, J.L. Clogging in Intermittently Dosed Sand Filters Used for Wastewater Treatment. Water Res. 2009, 43, 695–705. [Google Scholar] [CrossRef]
  22. Wang, H.; Ling, G.; Wang, W.; Hu, X.; Gao, X. A Prediction Model of Labyrinth Emitter Service Duration (ESD) under Low-Quality (Sand-Laden Water) Irrigation. Water 2022, 14, 1690. [Google Scholar] [CrossRef]
  23. Li, Y.; Yang, P.; Xu, T.; Ren, S.; Lin, X.; Wei, R.; Xu, H. CFD and Digital Particle Tracking to Assess Flow Characteristics in the Labyrinth Flow Path of a Drip Irrigation Emitter. Irrig. Sci. 2008, 26, 427–438. [Google Scholar] [CrossRef]
  24. Liu, H.; Li, Y.; Liu, Y.; Yang, P.; Ren, S.; Wei, R.; Xu, H. Flow Characteristics in Energy Dissipation Units of Labyrinth Path in the Drip Irrigation Emitters with DPIV Technology. J. Hydrodyn. Ser. B 2010, 22, 137–145. [Google Scholar] [CrossRef]
  25. Zhang, J.; Zhao, W.; Tang, Y.; Lu, B. Anti-Clogging Performance Evaluation and Parameterized Design of Emitters with Labyrinth Channels. Comput. Electron. Agric. 2010, 74, 59–65. [Google Scholar] [CrossRef]
  26. Feng, J.; Li, Y.; Wang, W.; Xue, S. Effect of Optimization Forms of Flow Path on Emitter Hydraulic and Anti-Clogging Performance in Drip Irrigation System. Irrig. Sci. 2018, 36, 37–47. [Google Scholar] [CrossRef]
  27. Dong, A.; Niu, W.; Zhang, W.; Lv, C.; Wu, M. Influencing Factors and Characterization Methods of the Anti-Clogging Ability of Labyrinth Channel Emitters. Irrig. Drain. 2023, 72, 589–606. [Google Scholar] [CrossRef]
  28. Wu, Z.; Zhang, Z.; Zhang, K.; Luo, C.; Niu, W.; Yu, L. Influence of particle size and concentration of sediment on clogging of labyrinth channels emitters. Trans. Chin. Soc. Agric. Eng. 2014, 30, 99–108. [Google Scholar]
  29. Hou, P.; Xiao, Y.; Wu, N.; Wang, H.; Ma, Y.; Li, Y. Cascade relationship between the emitter structure-sedimentation-clogging behavior in drip irrigation systems with Yellow River water. J. Hydraul. Eng. 2020, 51, 1372–1382. [Google Scholar] [CrossRef]
  30. Xu, T.; Bao, S.; Li, Z.; Yu, Q.; Zheng, E. The Study of Structural Optimization on Hydraulic Performance and Anti-Clogging Performance of Labyrinth Drip Irrigation Emitters. Agronomy 2023, 13, 2496. [Google Scholar] [CrossRef]
  31. Wang, H.; Ling, G.; Hu, M.; Wang, W.; Hu, X. Physical Clogging Characteristics of Labyrinth Emitters under Low-Quality (Sand-Laden Water) Irrigation. Agronomy 2022, 12, 1615. [Google Scholar] [CrossRef]
  32. GB/T 19812. 1–2017; Plastic Equipment for Water Saving Irrigation–Part 1: Drip Tape with Labyrinth on one Side. Standardization Administration of the People’s Republic of China, SAC: Beijing, China, 2017. [Google Scholar]
  33. Zhou, H.; Li, Y.; Wang, Y.; Zhou, B.; Bhattarai, R. Composite Fouling of Drip Emitters Applying Surface Water with High Sand Concentration: Dynamic Variation and Formation Mechanism. Agric. Water Manag. 2019, 215, 25–43. [Google Scholar] [CrossRef]
  34. Zhang, L.; Merkley, G.P. Relationships between Common Irrigation Application Uniformity Indicators. Irrig. Sci. 2012, 30, 83–88. [Google Scholar] [CrossRef]
  35. Niu, W.; Liu, L.; Chen, X. Influence of Fine Particle Size and Concentration on the Clogging of Labyrinth Emitters. Irrig. Sci. 2013, 31, 545–555. [Google Scholar] [CrossRef]
  36. Wang, C.; Bai, D.; Li, Y.; Zhang, Q.; Ma, X.; Wu, S.; Lei, J. Effect of Irrigation Commutative Flow Technology on Reducing Deposition and Improving Anti-clogging Performance of a Flat Labyrinth Drip Pipe. Water Supply 2022, 22, 7656–7670. [Google Scholar] [CrossRef]
  37. Feng, J.; Wang, W.; Liu, H. Study on Fluid Movement Characteristics inside the Emitter Flow Path of Drip Irrigation System Using the Yellow River Water. Sustainability 2020, 12, 1319. [Google Scholar] [CrossRef]
  38. Li, Y.; Feng, X.; Han, X.; Sun, Y.; Li, H. Analysis of Anti-Clogging Performance and Particle Transport Characteristics of a Stellate Irrig. Emitter. Biosyst. Eng. 2024, 242, 50–66. [Google Scholar] [CrossRef]
  39. Ma, C.; Jiang, C.; Li, Y.; Shi, N.; Liu, S.; Hu, X.; Liu, Z.; Sun, Z.; Muhammad, T. Effect of Lateral Flushing on Emitter Clogging in Drip Irrigation Using High-Sediment Water. Agric. Water Manag. 2024, 293, 108702. [Google Scholar] [CrossRef]
  40. Hou, P.; Puig-Bargués, J.; Liu, L.; Xiao, Y.; Zhou, B.; Li, Y. New Anti-Clogging Perspective by Discharging Sediment from Drip Irrigation Emitters with High-Sediment Loaded Water. Irrig. Sci. 2024, 42, 645–656. [Google Scholar] [CrossRef]
  41. Yang, B.; Wang, F.; Wang, J.; Wang, C.; Qiu, X. Numerical Simulation and Optimisation of the Inlet Structure of Dentiform Emitters in Drip-Irrigation Systems. Biosyst. Eng. 2024, 246, 183–190. [Google Scholar] [CrossRef]
  42. Ren, G.; Wu, P.; Zhu, D.; Niu, W.; Zhang, L.; Chen, J. Influence of Sediment Particle Size on Clogging of Large Labyrinth Channels Emitters. J. Irrig. Drain. 2016, 35, 1–6. [Google Scholar] [CrossRef]
  43. Yu, L.; Li, N.; Liu, X.; Yang, Q.; Long, J. Influence of Flushing Pressure, Flushing Frequency and Flushing Time on the Service Life of a Labyrinth-Channel Emitter. Biosyst. Eng. 2018, 172, 154–164. [Google Scholar] [CrossRef]
  44. Hou, P.; Liu, L.; Tahir, M.; Li, Y.; Wang, X.; Shi, N.; Xiao, Y.; Ma, C.; Li, Y. Effect of Fertilization on Emitter Clogging in Drip Irrigation Using High Sediment Water: Perspective of Sediment Discharge Capacity. Agric. Water Manag. 2024, 294, 108723. [Google Scholar] [CrossRef]
  45. Feng, J.; Pan, J.; Liu, H.; Liu, Y.; Hou, P.; Jiao, Y.; Sun, H.; Ma, C.; Ke, S. Optimal Structural Parameters of Drip Laminar Emitters Using High Sediment Irrigation Water. Appl. Eng. Agric. 2023, 39, 449–459. [Google Scholar] [CrossRef]
  46. Ait-Mouheb, N.; Schillings, J.; Al-Muhammad, J.; Bendoula, R.; Tomas, S.; Amielh, M.; Anselmet, F. Impact of Hydrodynamics on Clay Particle Deposition and Biofilm Development in a Labyrinth-Channel Dripper. Irrig. Sci. 2019, 37, 1–10. [Google Scholar] [CrossRef]
  47. Zhu, Z.; Yuan, R.; Chen, Y.; Luo, W.; Yang, X.; Cao, Z. Characteristic analysis and structure optimization of labyrinth flow channels with different internal tooth structures. J. Chongqing Univ. Technol. (Nat. Sci.) 2023, 37, 348–358. [Google Scholar]
  48. de Sousa Pereira, D.J.; Lavanholi, R.; de Araújo, A.C.S.; de Camargo, A.P.; Ait-Mouheb, N.; Frizzone, J.A.; Molle, B. Evaluating Sensitivity to Clogging by Solid Particles in Irrigation Emitters: Assessment of a Laboratory Protocol. J. Irrig. Drain. Eng. 2020, 146, 04020033. [Google Scholar] [CrossRef]
  49. Zhang, W.; Lv, C.; Zhao, X.; Dong, A.; Niu, W. The Influence Mechanism of the Main Suspended Particles of Yellow River Sand on the Emitter Clogging—An Attempt to Improve the Irrigation Water Utilization Efficiency in Yellow River Basin. Agric. Water Manag. 2021, 258, 107202. [Google Scholar] [CrossRef]
Figure 1. The simple schematic diagram of emitter blockage.
Water 17 00910 g001
Figure 2. Drip irrigation belt 3D model.
Water 17 00910 g002
Figure 3. Sectional view of the emitter channel structures of the four types of drip irrigation belts. (ad) show the emitter channels of drip irrigation belts A, B, C, and D, respectively.
Water 17 00910 g003
Figure 4. Initial sediment particle size distribution curve.
Water 17 00910 g004
Figure 5. Diagram of the short-period intermittent clogging test device.
Water 17 00910 g005
Figure 6. Mesh independence test.
Water 17 00910 g006
Figure 7. Pressure–flow curve.
Water 17 00910 g007
Figure 8. Dynamics of emitter Dra and Cu over time during system operation at different sediment contents in water sources. The red dashed line in the figure indicates the time when the Dra of the emitter first drops below 75%.
Water 17 00910 g008
Figure 9. Synergistic variation curves of Dra and Cu of emitters during the operation of the system with different sediment contents in water sources.
Water 17 00910 g009
Figure 10. The sediment quality per unit length (M) of four types of drip irrigation belt capillary tubes. Note: Different lowercase letters in the graph indicate significant differences between treatments (p < 0.05).
Water 17 00910 g010
Figure 11. The quality of channel clogging (m) for four types of drip irrigation belt emitter channels. Note: Different lowercase letters in the graph indicate significant differences between treatments (p < 0.05).
Water 17 00910 g011
Figure 12. The alteration of sediment particle size composition in the flow channel of each treatment pump following the muddy water test. (a) Variations in the proportions of sand, powder, and viscous particles; (b) variations in D10, D50, and D90.
Water 17 00910 g012
Figure 13. Distribution of sediment in the emitter channels of four drip irrigation belts at different stages of the clogging process. (a) Initial stage; (b) developmental stage; (c) formative stage.
Water 17 00910 g013
Figure 14. The contour map of flow velocity (m·s−1) and the streamline distribution map in the emitter channel. (a,b): the contour map of flow velocity in the 0.5 mm and 0.1 mm section. (c,d): the streamline distribution map in the 0.5 mm and 0.1 mm section.
Water 17 00910 g014
Figure 15. The distribution of turbulent kinetic energy (m2·s−2) and turbulent viscosity (m2·s−1) in the emitter flow channel. (a,b): the contour map of turbulent kinetic energy in the 0.5 mm and 0.1 mm section. (c,d): the contour map of turbulent viscosity in the 0.5 mm and 0.1 mm section.
Water 17 00910 g015
Table 1. Parameters related to four types of drip irrigation belts.
TypeInner Diameter
(mm)
Pitch(cm)Wall Thickness
(mm)
Number of Outlets Rated Flow Rate
(L·h−1)
Flow Index
(m)
Flow Coefficient
(k)
Flow Coefficient of Variation
(%)
A17.5200.1453.430.520.3103.4%
B16300.2032.400.520.2185.2%
C16200.1654.540.550.3677.1%
D16300.2053.200.550.2513.4%
Table 2. Initial sediment particle size composition.
Particle Size (mm)0.00050.00100.00200.00500.01000.02000.04500.07500.10000.2000
Cumulative Ratio (%)0.231.864.5110.9117.5329.7765.3288.7396.46100.0
Table 3. Particle size values of initial sediment D10, D50, and D90.
Percentage of Particle SizeD10D50D90
Particle size value (mm)0.004490.033530.07766
Table 4. Linear fitting results for emitters Dra and Cu (y = a + b × x).
Sediment Content1 g·L−12 g·L−13 g·L−1
TypesABCDABCDABCD
a−0.62−0.74−0.60−1.01−0.85−1.00−0.76−0.91−0.87−0.87−0.62−0.97
b1.701.781.622.011.841.971.731.921.881.841.571.94
R20.970.970.970.990.980.990.950.990.980.970.950.99
Table 5. Significance analysis of differences in Dra and Cu of irrigation between emitters at the end of the irrigation test (%).
Drip Irrigation BeltDraCu
1 g·L−12 g·L−13 g·L−11 g·L−12 g·L−13 g·L−1
A93.28 a87.06 b85.76 b74.33 b75.74 b97.07 a
B91.05 a97.74 a97.76 a93.43 a92.28 a88.36 b
C88.24 b94.05 a99.01 a91.19 a87.21 a82.97 c
D91.52 a95.02 a98.04 a93.49 a91.91 a82.84 c
Note: Different lowercase letters in the same column indicate significant differences (p < 0.05).
Table 6. Results of correlation analysis.
Sediment Content (g·L−1)ABCD
10.1280.685 **0.3460.509 **
20.544 **0.767 **0.399 *0.075
30.410 *0.0320.3720.689 **
Note: * indicates that the correlation of the sample data fit is at the level of significance (p < 0.05). ** indicates that the correlation of the sample data fits is at a highly significant level (p < 0.01).
Table 7. Two-factor ANOVA table (p-value).
Impact FactorMmQ
Drip irrigation belt0.0120.0000.547
Sediment content0.0000.0000.822
Drip irrigation belt × sediment content0.0540.0000.988
Note: p < 0.05—the factor has a significant effect on the dependent variable. p < 0.01—the factor has a highly significant effect on the dependent variable.
Table 8. Distribution of sediment particle sizes deposited by emitters, in %.
Drip Irrigation BeltSediment Content
(g·L−1)
>0.1 mm0.05~0.1 mm0.02~0.05 mm0.01~0.02 mm0.005~0.01 mm0~0.005 mm
A15.5534.6651.255.170.053.32
23.6528.6244.5911.514.407.23
33.7529.8248.1710.882.185.20
B19.7428.6044.7211.752.003.19
24.7036.3348.586.140.164.09
32.0420.1147.1617.925.217.56
C110.4232.6145.016.520.355.09
24.9430.2047.8010.022.164.88
35.9033.6747.547.510.235.15
D12.2921.8649.2617.213.765.62
20.5514.0442.8924.069.019.45
34.9430.3046.8210.661.925.36
Table 9. D10, D50, and D90 particle sizes of sediment deposited in the emitter channel (mm).
Drip Irrigation BeltSediment Content (g·L−1)D10D50D90
A10.021300.043330.08369
20.008340.037080.07891
30.014910.039080.08066
B10.018470.042700.10690
20.020260.043720.09084
30.008420.030140.08737
C10.018220.044650.10190
20.015050.039790.08303
30.017620.042480.08295
D10.009820.030930.06971
20.005340.023290.05735
30.013170.038670.08295
Disclaimer/Publisher’s Note: The statements, opinions and data contained in all publications are solely those of the individual author(s) and contributor(s) and not of MDPI and/or the editor(s). MDPI and/or the editor(s) disclaim responsibility for any injury to people or property resulting from any ideas, methods, instructions or products referred to in the content.

