
Fluoride Risk Prognostication: A Pioneering Ensemble Machine Learning Approach for Groundwater Contamination Prediction in Parts of the East Coast of India

 , ,
, ,  ,
,  ,
,  ,
,  and
and 
Abstract
1. Introduction
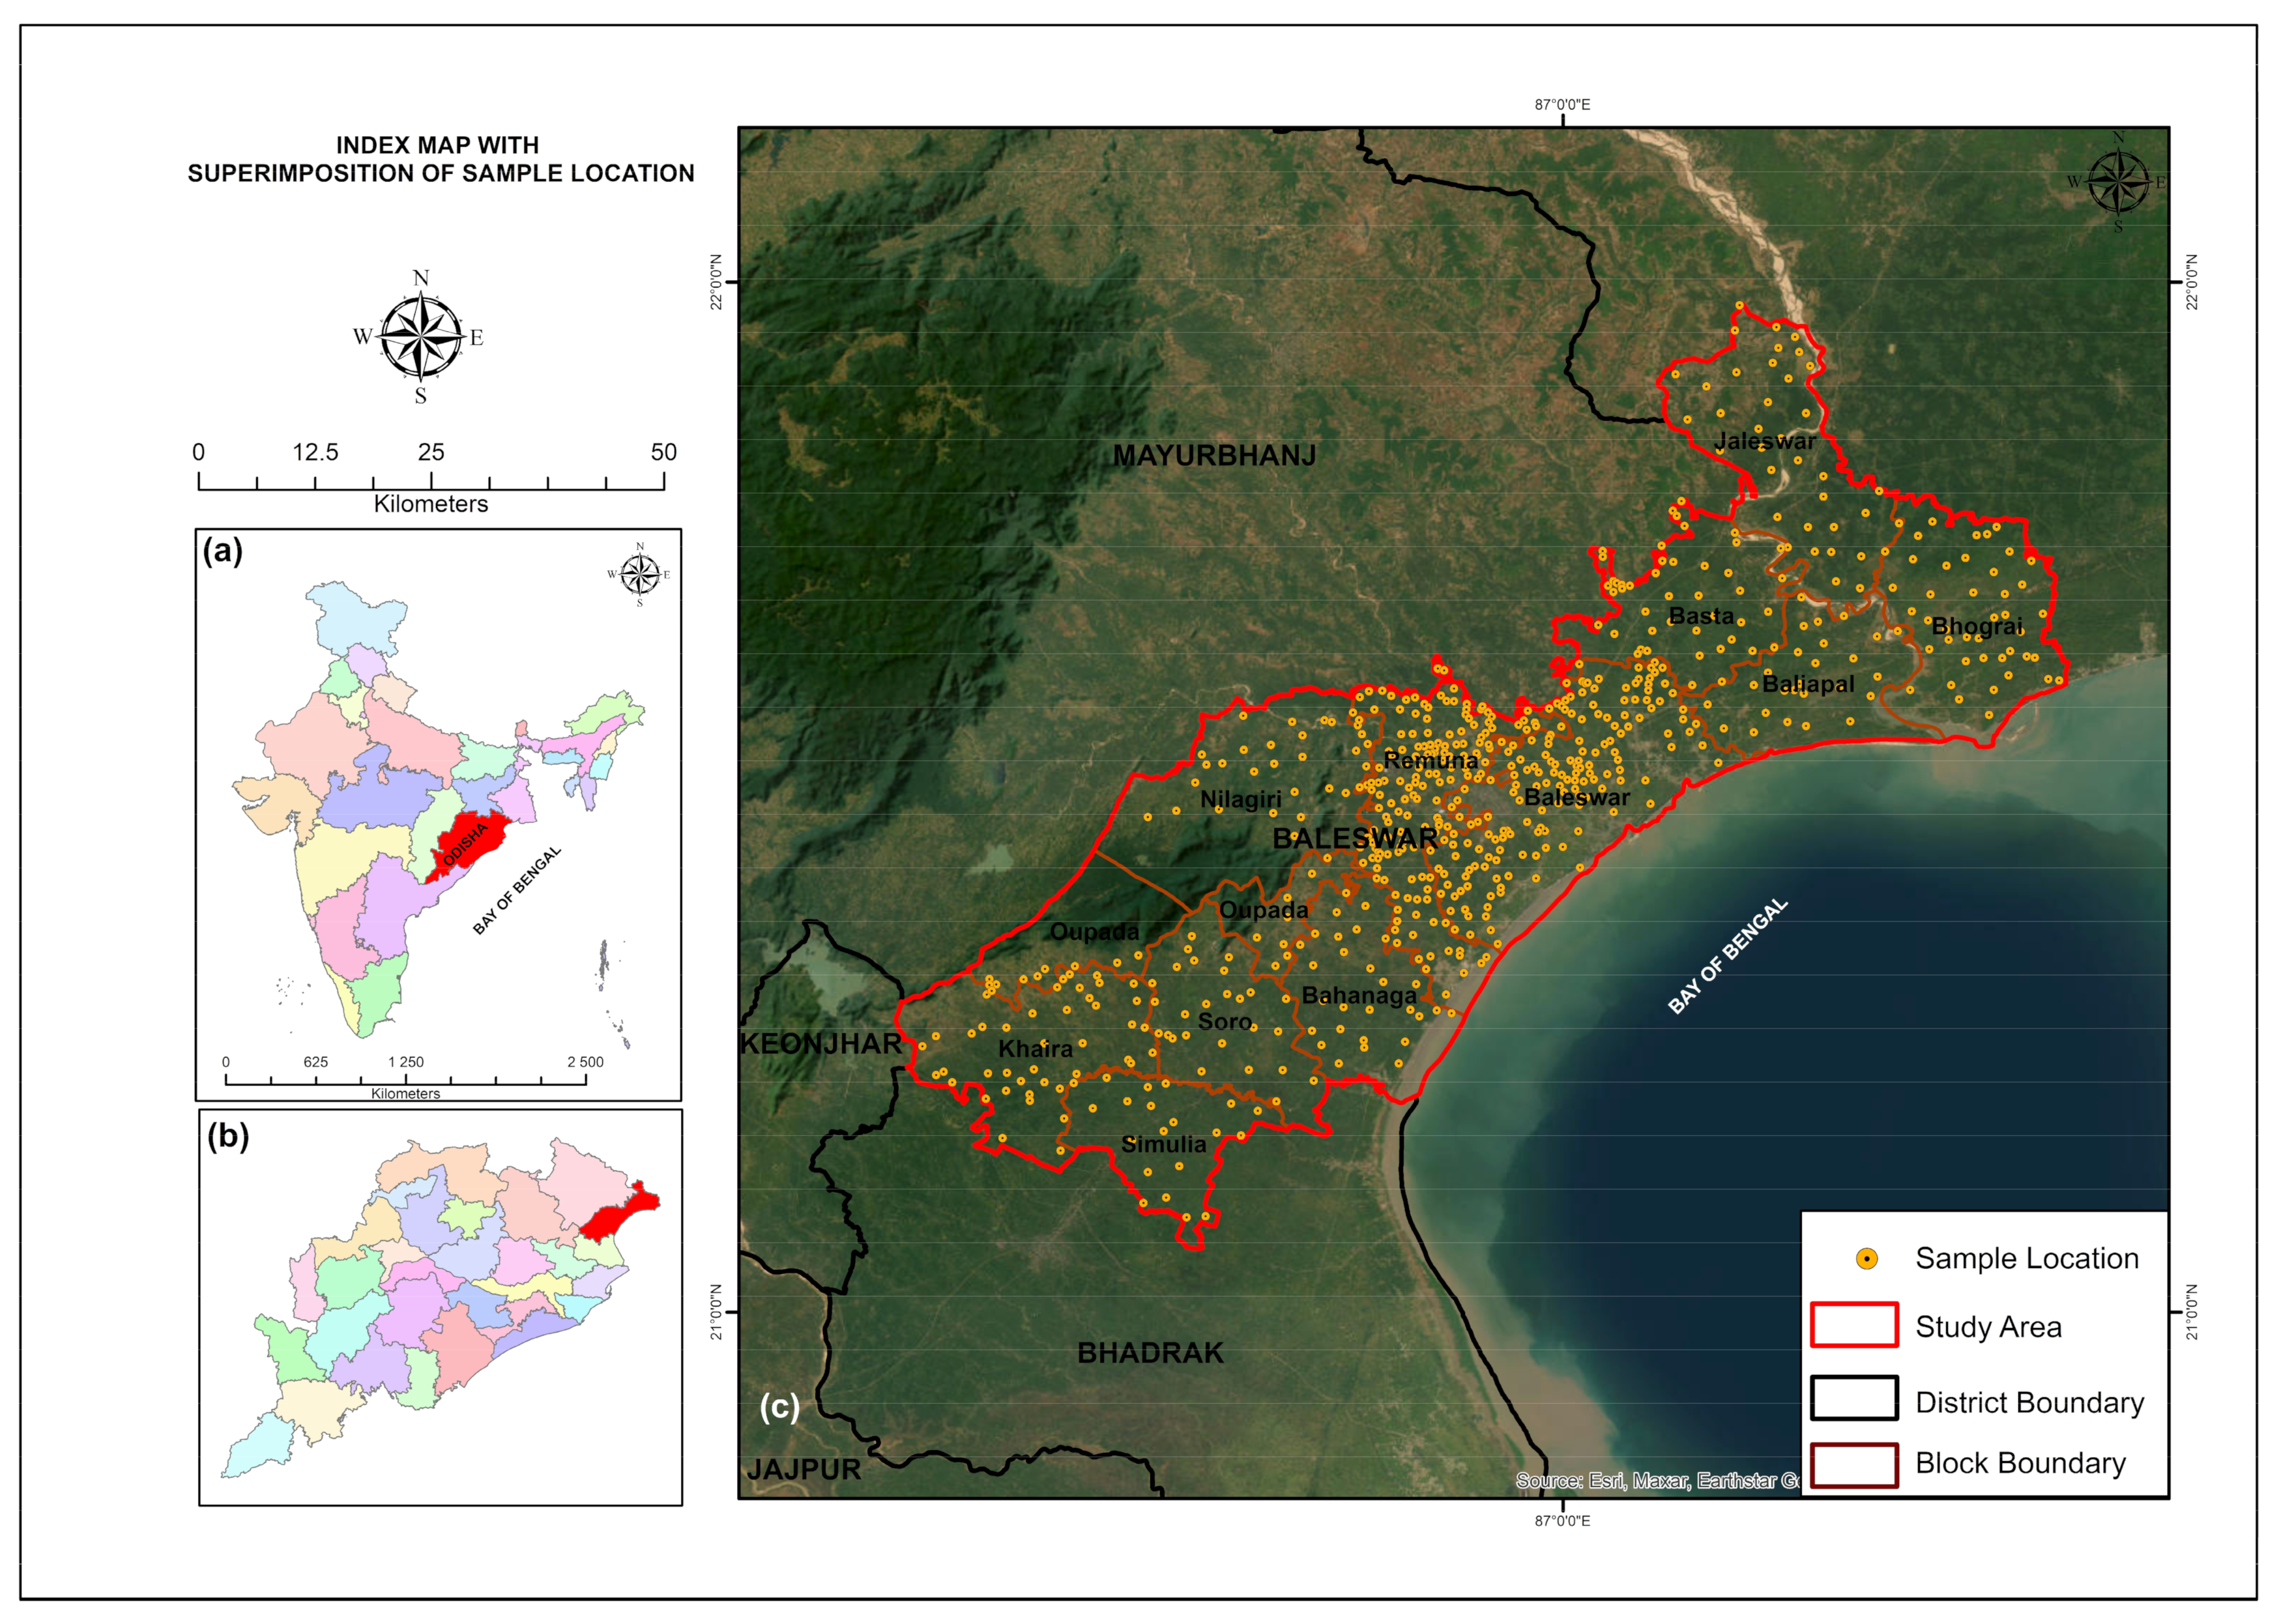
2. Study Area
2.1. Hydrogeological Characteristics
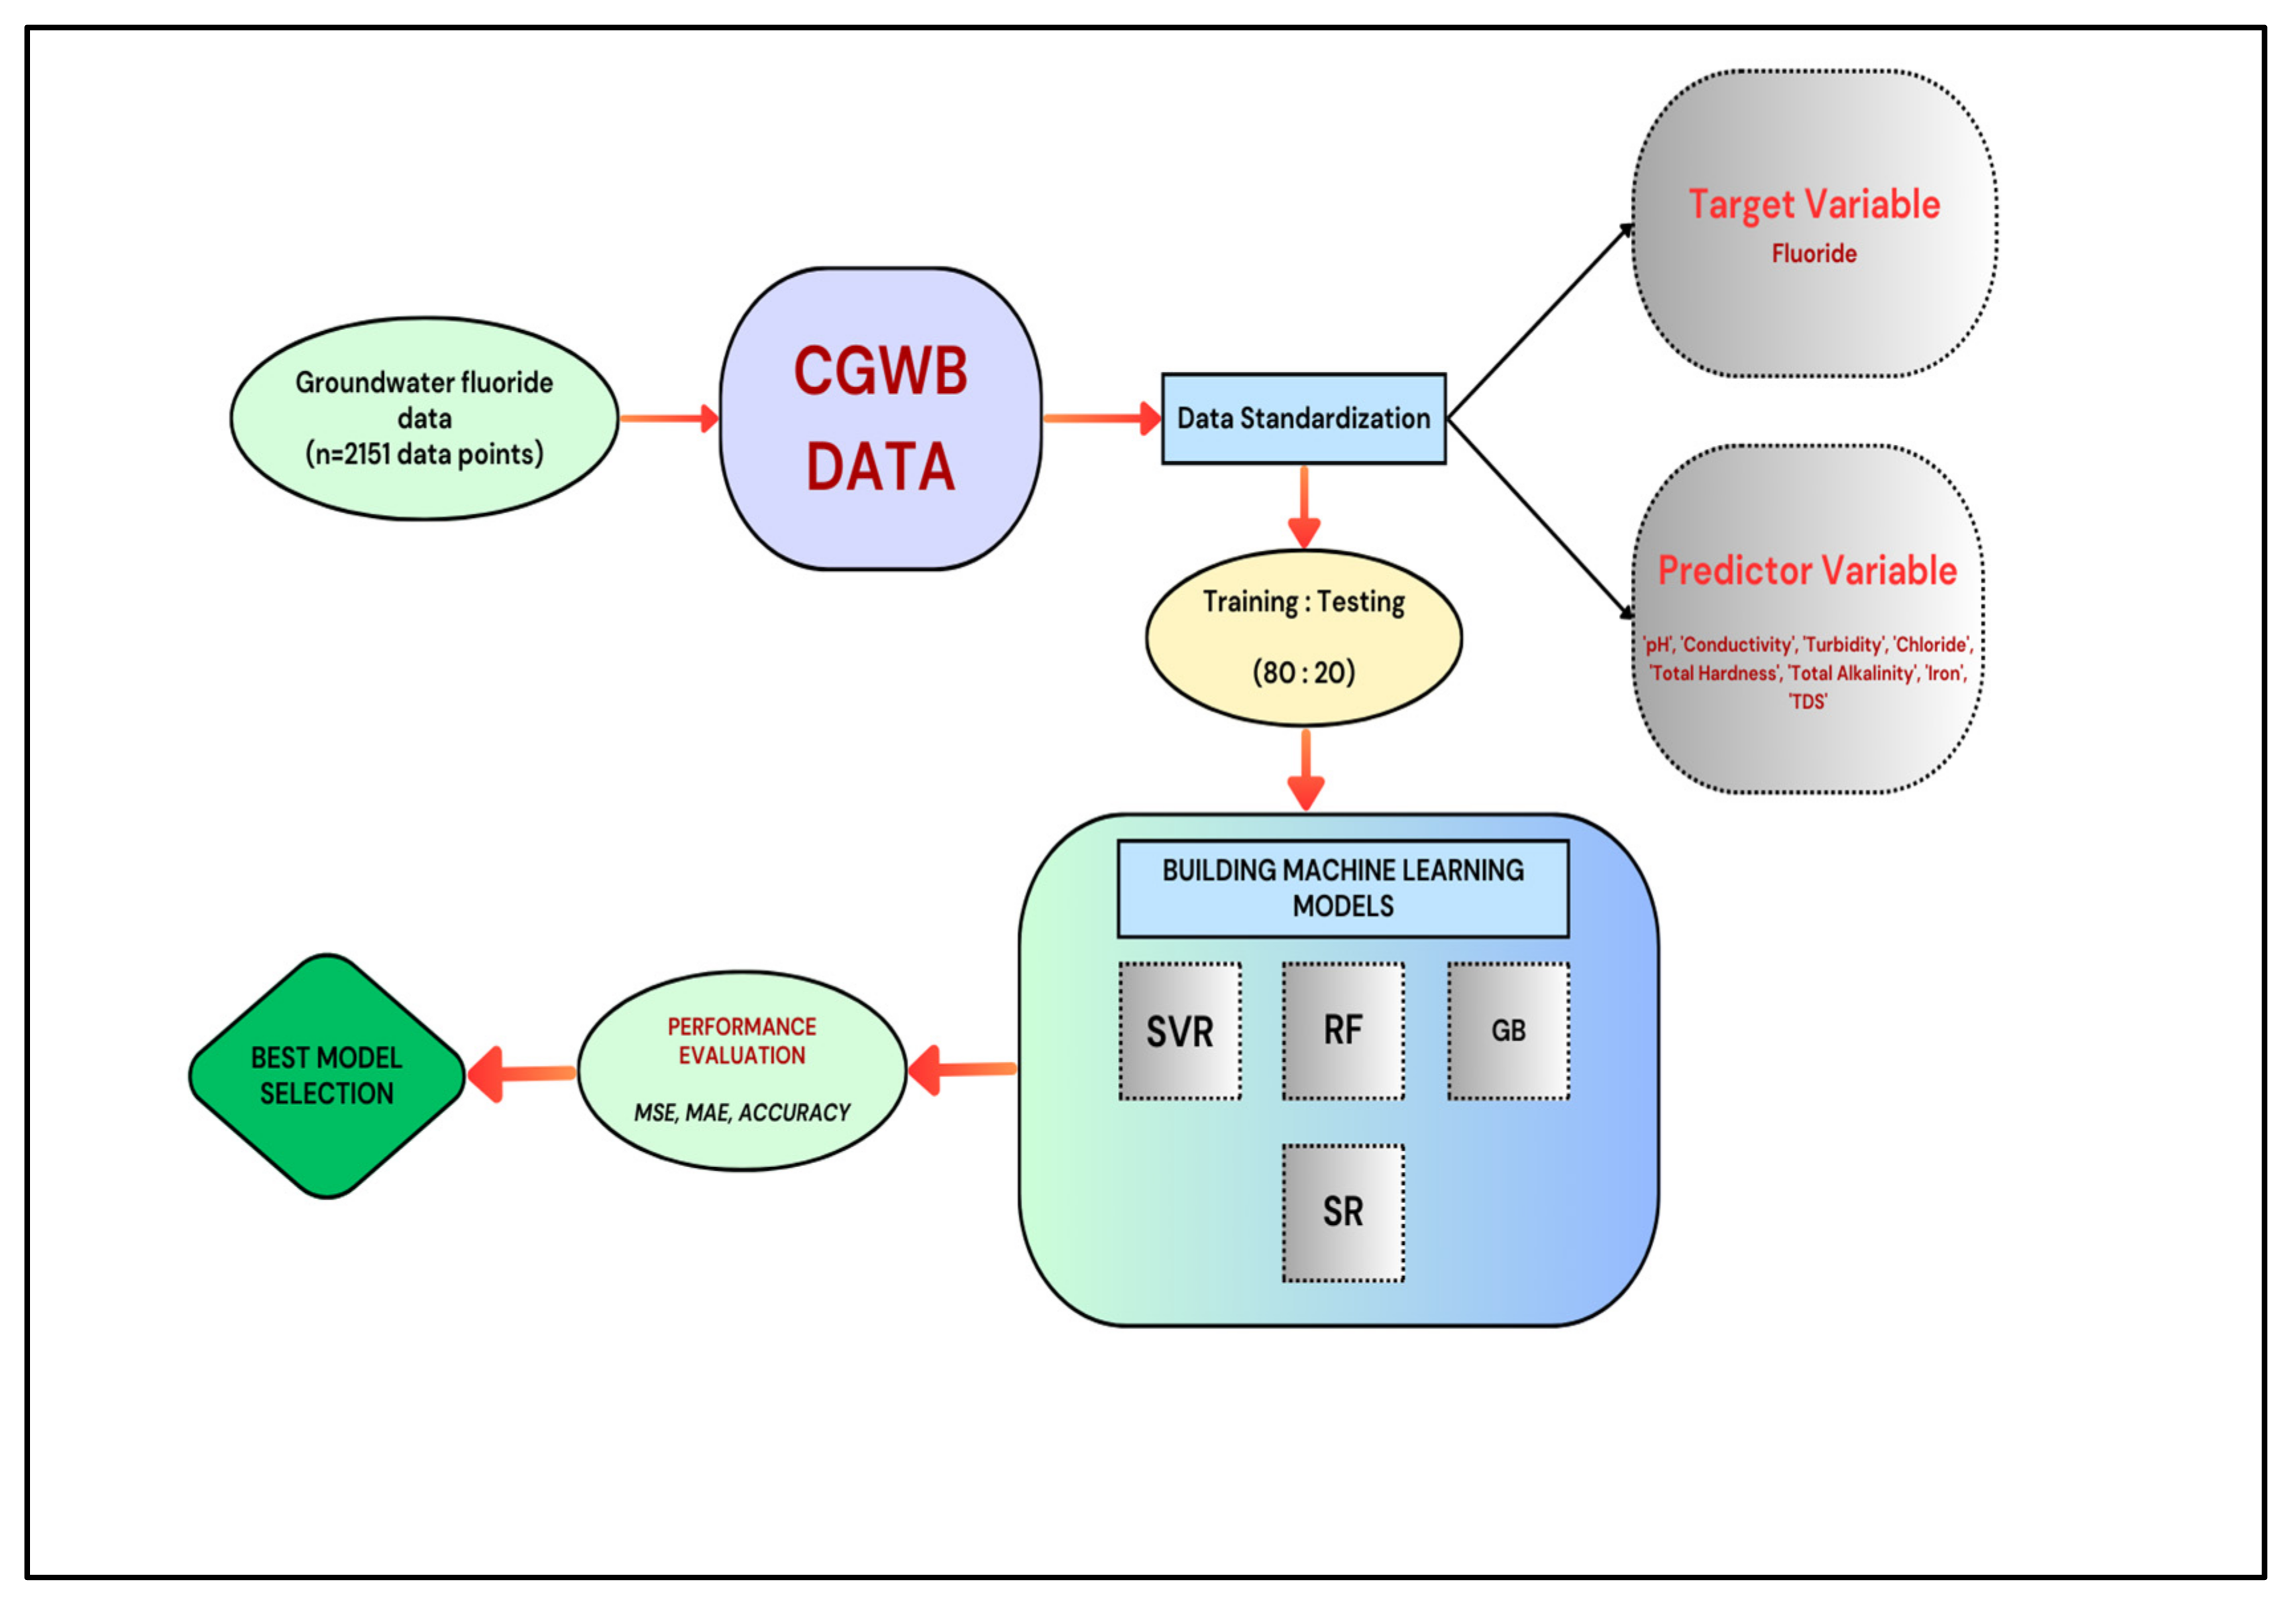
2.2. Methodology and Model Specification
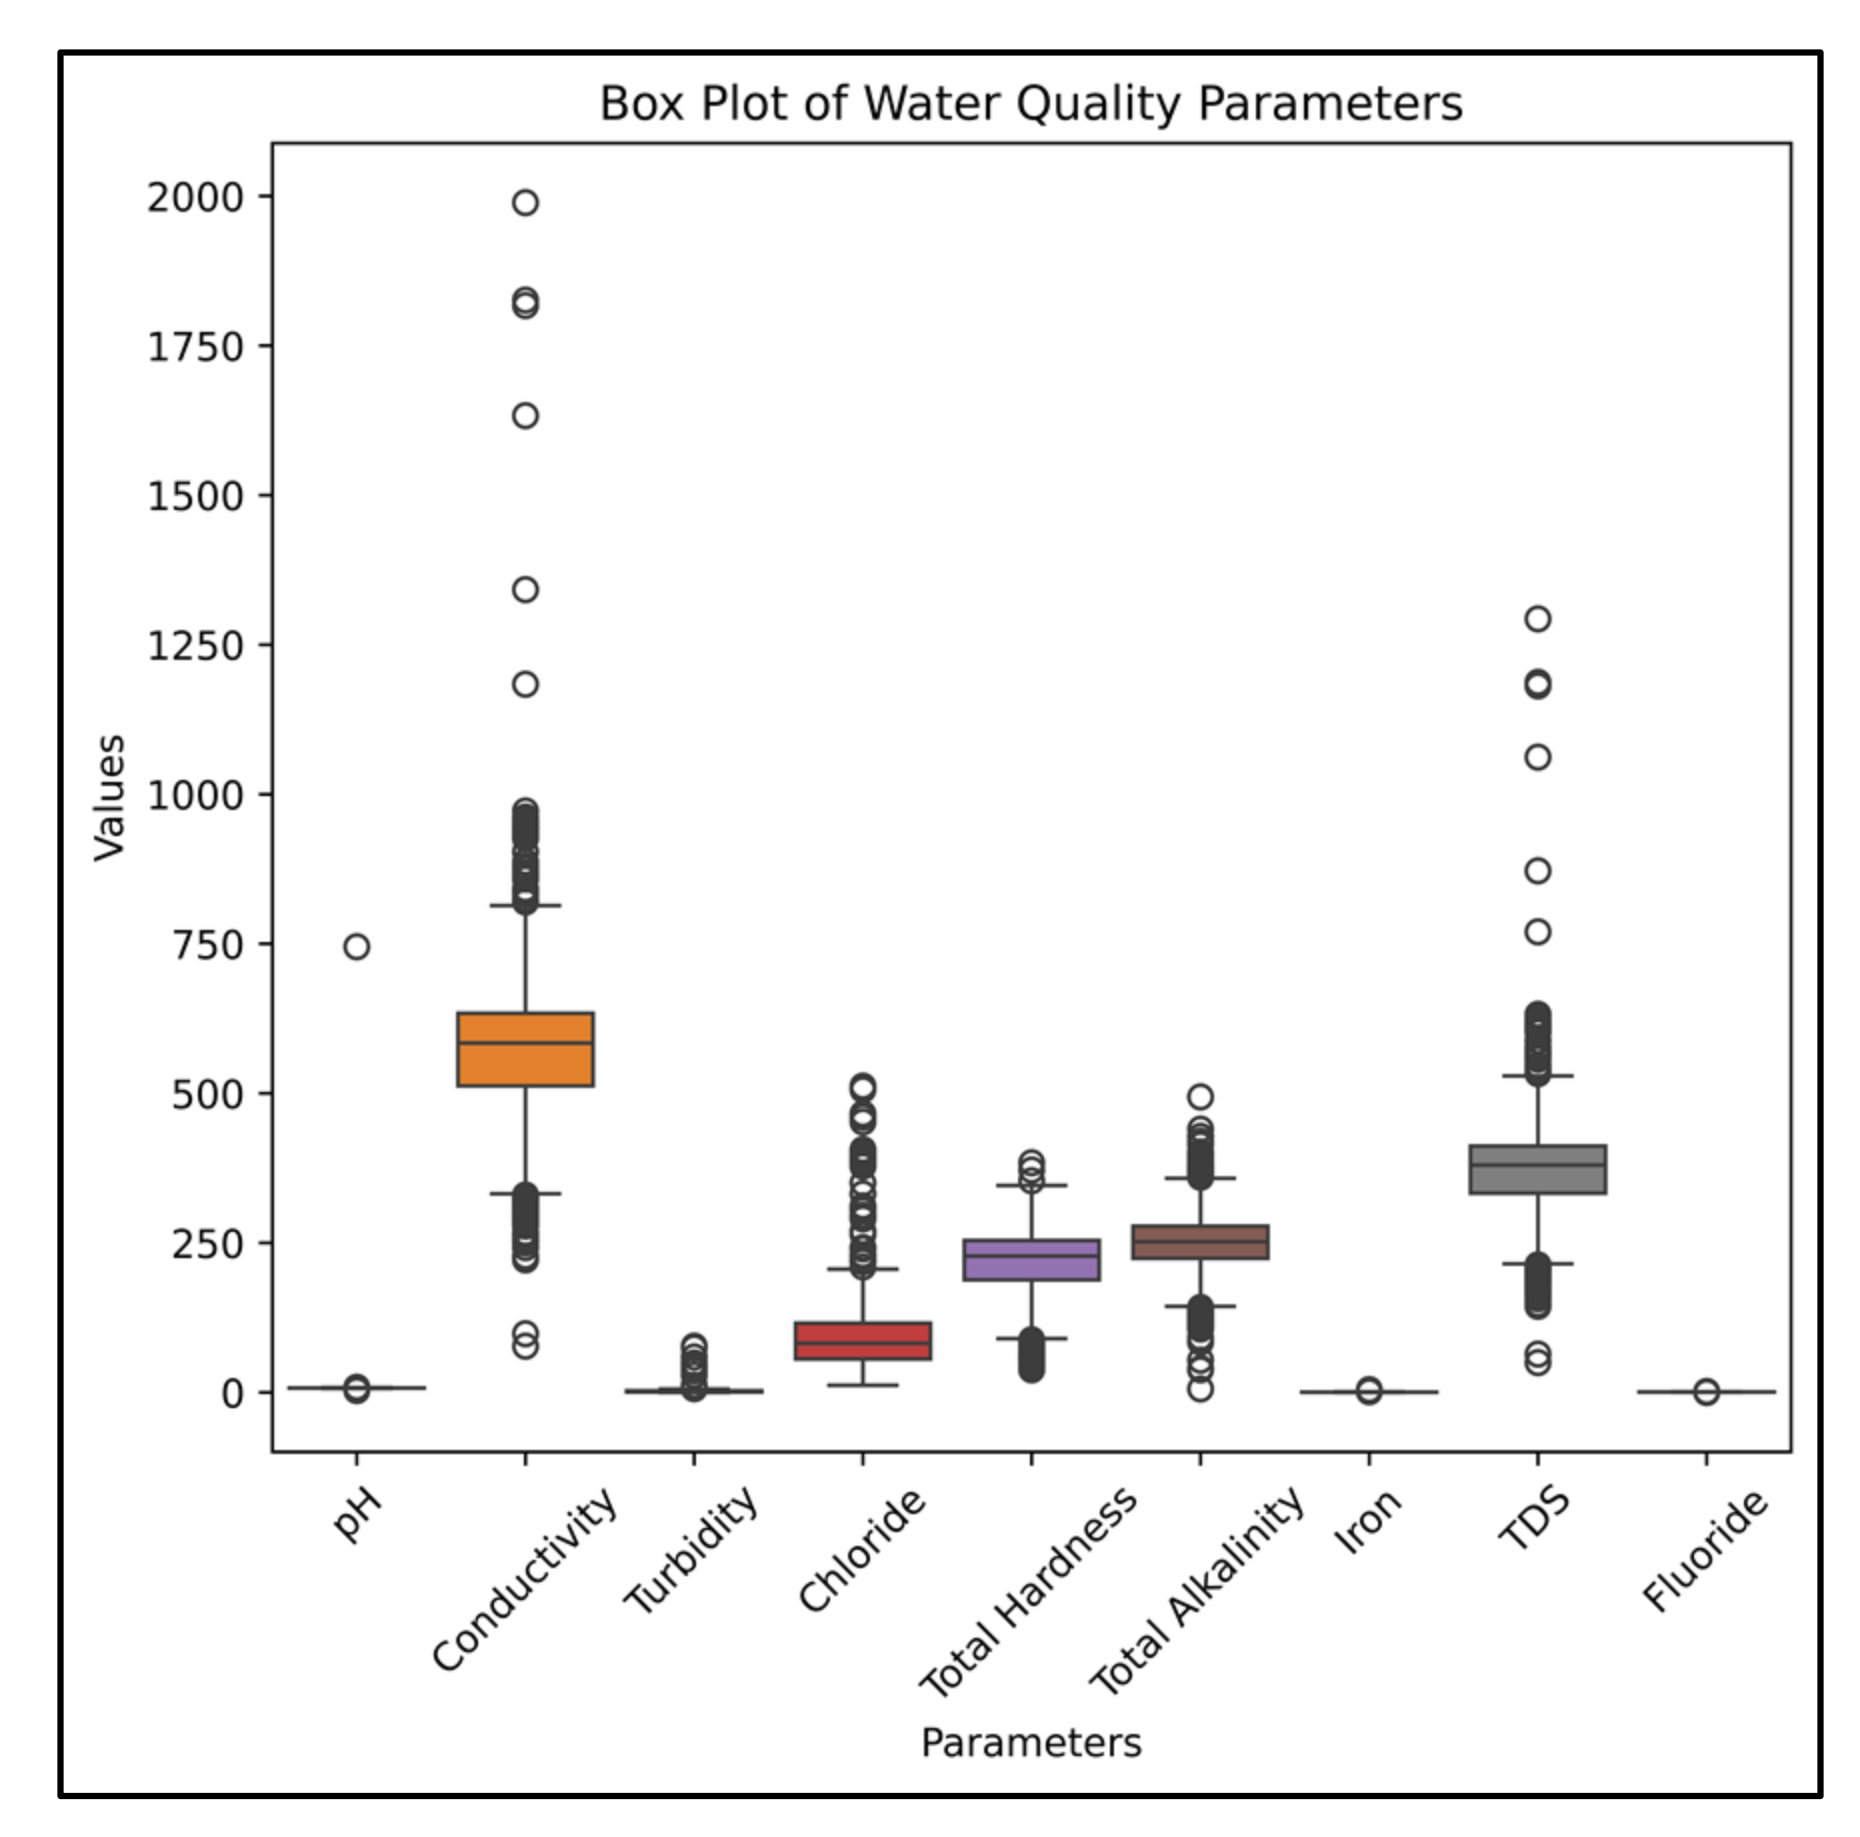
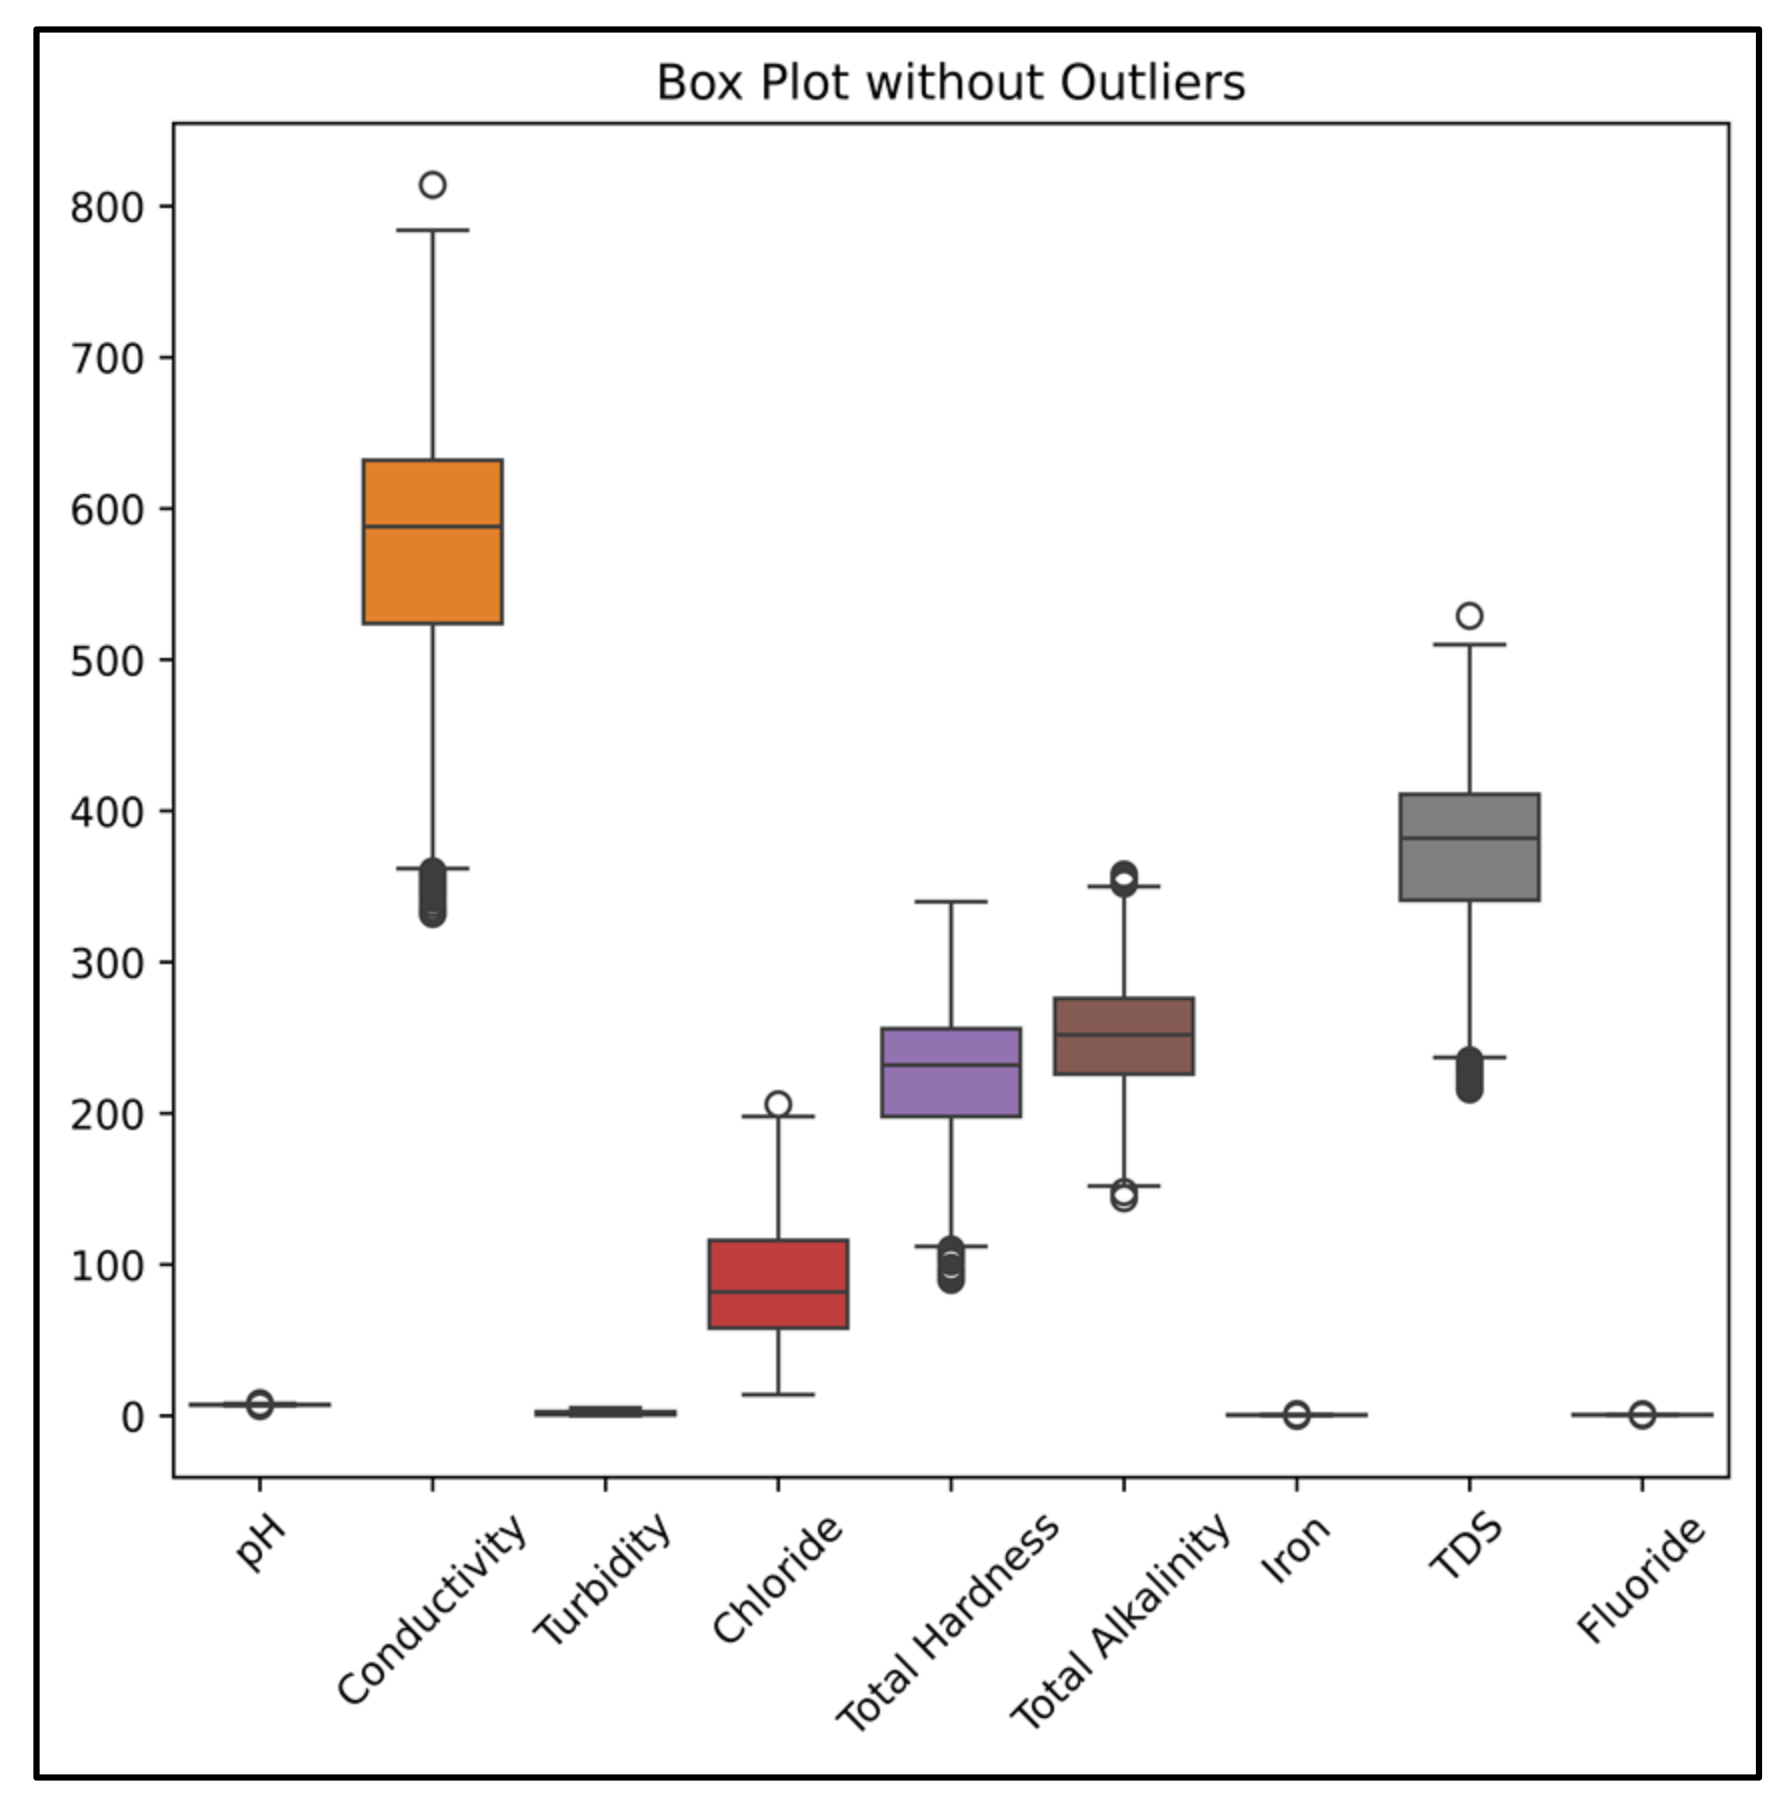
2.2.1. Datasets Description
2.2.2. Model Description and Development
2.2.3. Machine Learning Models
Support Vector Regression (SVR)
Random Forest (RF)
Gradient Boosting (XGBoost)
Stacking Regressor (SR)
3. Results
4. Discussion
4.1. Summary
4.2. Interpretations
4.3. Local Environmental and Social Factors
4.4. Comparison with Other Studies
4.5. Implications
4.6. Limitations
4.7. Recommendations and Future Work
5. Conclusions
Author Contributions
Funding
Data Availability Statement
Acknowledgments
Conflicts of Interest
References
- Narsimha, A. Application of GIS to Evaluate the Groundwater Quality for Drinking Purposes in Semiarid Region of Telangana State, India. In Groundwater Contamination in Coastal Aquifers; Elsevier: Amsterdam, The Netherlands, 2022; pp. 191–200. [Google Scholar] [CrossRef]
- Mrozik, W.; Rajaeifar, M.A.; Heidrich, O.; Christensen, P. Environmental Impacts, Pollution Sources and Pathways of Spent Lithium-Ion Batteries. Energy Environ. Sci. 2021, 14, 6099–6121. [Google Scholar] [CrossRef]
- Barad, S.; Mishra, P.; Sahu, P.C.; Sarkar, T.; Amin MF, M.; Choudhury, T.; Edinur, H.A.; Kari, Z.A.; Nandi, D.; Pati, S. Comparative Approach of Decision Tree and CWQI Analysis for Classification of Groundwater with a Special Reference to Fluoride Ion in Drought-Prone Boudh District of Odisha, India. Sustain. Water Resour. Manag. 2021, 7, 94. [Google Scholar] [CrossRef]
- Yadav, K.; Raphi, M.; Jagadevan, S. Geochemical Appraisal of Fluoride Contaminated Groundwater in the Vicinity of a Coal Mining Region: Spatial Variability and Health Risk Assessment. Geochemistry 2021, 81, 125684. [Google Scholar] [CrossRef]
- Jha, S.K.; Singh, R.K.; Damodaran, T.; Mishra, V.K.; Sharma, D.K.; Rai, D. Fluoride in Groundwater: Toxicological Exposure and Remedies. J. Toxicol. Environ. Health Part B Crit. Rev. 2013, 16, 52–66. [Google Scholar] [CrossRef] [PubMed]
- Shaji, E.; Sarath, K.; Santosh, M.; Krishnaprasad, P.; Arya, B.; Babu, M.S. Fluoride Contamination in Groundwater: A Global Review of the Status, Processes, Challenges, and Remedial Measures. Geosci. Front. 2024, 15, 101734. [Google Scholar] [CrossRef]
- Vikas, D.; Sharma, S. Fluoride Contamination in Drinking Water and Associated Health Risk Assessment in the Malwa Belt of Punjab, India. Environ. Adv. 2022, 8, 100242. [Google Scholar] [CrossRef]
- Steven, L. Greater Tooth-Brushing Frequency, Fluoride Supplement Use, and Tap Water Fluoride Concentrations above 0.7 Mg/L Are Risk Factors for Dental Fluorosis. J. Evid.-Based Dent. Pract. 2005, 5, 37–38. [Google Scholar] [CrossRef]
- Wood, R.J.K.; Lu, P. Coatings and Surface Modification of Alloys for Tribo-Corrosion Applications. Coatings 2024, 14, 99. [Google Scholar] [CrossRef]
- Mridha, D.; Priyadarshni, P.; Bhaskar, K.; Gaurav, A.; De, A.; Das, A.; Joardar, M.; Chowdhury, N.R.; Roychowdhury, T. Fluoride Exposure and Its Potential Health Risk Assessment in Drinking Water and Staple Food in the Population from Fluoride Endemic Regions of Bihar, India. Groundw. Sustain. Dev. 2021, 13, 100558. [Google Scholar] [CrossRef]
- Gogoi, R.R.; Khanikar, L.; Gogoi, J.; Neog, N.; Deka, D.J.; Sarma, K.P. Geochemical Sources, Hydrogeochemical Behaviour of Fluoride Release and Its Health Risk Assessment in Some Fluorosis Endemic Areas of the Brahmaputra Valley of Assam, India. Appl. Geochem. J. Int. Assoc. Geochem. Cosmochem. 2021, 127, 104911. [Google Scholar] [CrossRef]
- Indrani, M.; Singh, U.K. Fluoride Abundance and Their Release Mechanisms in Groundwater along with Associated Human Health Risks in a Geologically Heterogeneous Semi-Arid Region of East India. Microchem. J. Devoted Appl. Microtech. All Branches Sci. 2020, 152, 104304. [Google Scholar] [CrossRef]
- Chakraborti, D.; Rahman, M.M.; Chatterjee, A.; Das, D.; Das, B.; Nayak, B.; Pal, A.; Chowdhury, U.K.; Ahmed, S.; Biswas, B.K.; et al. Fate of over 480 Million Inhabitants Living in Arsenic and Fluoride Endemic Indian Districts: Magnitude, Health, Socio-Economic Effects and Mitigation Approaches. J. Trace Elem. Med. Biol. Organ Soc. Miner. Trace Elem. (GMS) 2016, 38, 33–45. [Google Scholar] [CrossRef]
- Ayoob, S.; Gupta, A.K. Fluoride in Drinking Water: A Review on the Status and Stress Effects. Crit. Rev. Environ. Sci. Technol. 2006, 36, 433–487. [Google Scholar] [CrossRef]
- Kar, B.; Patra, B.; Mohapatra, P.D. Distribution of Fluoride in the Environment of Balasore District, Odisha, India. Asian J. Water Environ. Pollut. 2013, 10, 87–90. [Google Scholar]
- Saurabh, S.; Saxena, A. Global Status of Nitrate Contamination in Groundwater: Its Occurrence, Health Impacts, and Mitigation Measures. In Handbook of Environmental Materials Management; Springer International Publishing: Berlin/Heidelberg, Germany, 2018; pp. 1–21. [Google Scholar] [CrossRef]
- Sinha Ray, S.P. Fluoride Contamination in Groundwater—Some Mitigation Options. In Ground Water Contamination in India; Springer Nature: Cham, Switzerland, 2024; pp. 313–323. [Google Scholar] [CrossRef]
- Job, C.A. Groundwater Quality Treatment and Waste Disposal. In Production, Use, and Sustainability of Groundwater; CRC Press: Boca Raton, FL, USA, 2021; pp. 233–271. [Google Scholar] [CrossRef]
- Patle, G.T.; Singh, D.K.; Sarangi, A. Modelling of Climate-Induced Groundwater Recharge for Assessing Carbon Emission from Groundwater Irrigation. Curr. Sci. 2018, 115, 64. [Google Scholar] [CrossRef]
- Mohammadi, A.A.; Ghaderpoori, M.; Yousefi, M.; Rahmatipoor, M.; Javan, S. Prediction and Modeling of Fluoride Concentrations in Groundwater Resources Using an Artificial Neural Network: A Case Study in Khaf. Environ. Health Eng. Manag. 2016, 3, 217–224. [Google Scholar] [CrossRef]
- Lidberg, W.; Karlsson, C.; Sohlenius, G.; Westphal, F.; Larson, J.; Ågren, A.M.; Lin, Y. Evaluating Machine Learning Methods for Predicting Surface Deposits Across Physiographic Regions in Sweden. 2024. Available online: https://www.ssrn.com/abstract=4965382 (accessed on 1 December 2024).
- Joel, P.; Berg, M. Global Machine-Learning Model of Naturally Occurring Fluoride in Groundwater. Available online: https://meetingorganizer.copernicus.org/EGU23/EGU23-12956.html (accessed on 15 May 2023).
- Ling, Y.; Podgorski, J.; Sadiq, M.; Rasheed, H.; Eqani, S.A.; Berg, M. Monitoring and Prediction of High Fluoride Concentrations in Groundwater in Pakistan. Sci. Total Environ. 2022, 839, 156058. [Google Scholar] [CrossRef]
- Faheem, Z.; Kazmi, J.H.; Shaikh, S.; Arshad, S.; Noreena; Mohammed, S. Random Forest-Based Analysis of Land Cover/Land Use LCLU Dynamics Associated with Meteorological Droughts in the Desert Ecosystem of Pakistan. Ecol. Indic. 2024, 159, 111670. [Google Scholar] [CrossRef]
- Rosecrans, C.Z.; Belitz, K.; Ransom, K.M.; Stackelberg, P.E.; McMahon, P.B. Predicting Regional Fluoride Concentrations at Public and Domestic Supply Depths in Basin-Fill Aquifers of the Western United States Using a Random Forest Model. Sci. Total Environ. 2022, 806, 150960. [Google Scholar] [CrossRef]
- Anbarasu, S.; Ganesan, S. Human Health Risk and Water Quality Assessment Due to Fluoride and Nitrate around Cauvery River Basin, Southern India. Environ. Monit. Assess. 2024, 196, 880. [Google Scholar] [CrossRef]
- Huang, S.; Xia, J.; Wang, Y.; Lei, J.; Wang, G. Water Quality Prediction Based on Sparse Dataset Using Enhanced Machine Learning. Environ. Sci. Ecotechnol. 2024, 20, 100402. [Google Scholar] [CrossRef] [PubMed]
- Hlaing, P.T.; Humphries, U.W.; Waqas, M. Hydrological Model Parameter Regionalization: Runoff Estimation Using Machine Learning Techniques in the Tha Chin River Basin, Thailand. MethodsX 2024, 13, 102792. [Google Scholar] [CrossRef] [PubMed]
- Zhong, H.; Yuan, Y.; Luo, L.; Ye, J.; Zhong, C. Water Quality Prediction of Mbr Based on Machine Learning: A Novel Dataset Contribution Analysis Method. SSRN Electron. J. 2022, 50, 103296. [Google Scholar] [CrossRef]
- Madhumita, S. Evaluation of Machine Learning-Based Modeling Approaches in Groundwater Quantity and Quality Prediction. In Advances in Remediation Techniques for Polluted Soils and Groundwater; Elsevier: Amsterdam, The Netherlands, 2022; pp. 87–103. [Google Scholar] [CrossRef]
- Essamlali, I.; Nhaila, H.; Khaili, M.E. Advances in Machine Learning and IoT for Water Quality Monitoring: A Comprehensive Review. Heliyon 2024, 10, e27920. [Google Scholar] [CrossRef]
- Yang, X.; Chen, Q.; Pan, Z.; Cheng, J.; Zheng, W.; Liang, Y.; Chen, H.; Chen, G.; Wang, W. Application of Patient-Based Real-Time Quality Control Based on Artificial Intelligence Monitoring Platform in Continuously Quality Risk Monitoring of Down Syndrome Serum Screening. J. Clin. Lab. Anal. 2024, 38, e25019. [Google Scholar] [CrossRef]
- Priskilla Angel Rani, J.; Nivasini, R.; Yesubai Rubavathi, C.; Jona, P. Machine Learning Based Real Time Water Quality Monitoring System. In Proceedings of the 2023 Third International Conference on Artificial Intelligence and Smart Energy (ICAIS), Coimbatore, India, 2–4 February 2023; IEEE: Piscataway, NJ, USA, 2023. [Google Scholar] [CrossRef]
- Bansal, H.; Devarakonda, V.; Dixit, M. Nitrate Contamination Prediction in Groundwater Data in Karnataka, India, Using Machine Learning (ML) Techniques. Available online: https://meetingorganizer.copernicus.org/EGU24/EGU24-14857.html (accessed on 9 March 2024).
- Haggerty, R.; Sun, J.; Yu, H.; Li, Y. Application of Machine Learning in Groundwater Quality Modeling—A Comprehensive Review. Water Res. 2023, 233, 119745. [Google Scholar] [CrossRef]
- Huang, X.; Jin, M.; Liang, X.; Su, J.; Ma, B. Predicting the Risk of Groundwater Nitrate Contamination Using Machine Learning Tools. Available online: https://meetingorganizer.copernicus.org/EGU22/EGU22-1945.html (accessed on 27 March 2022).
- Azimi, S.; Moghaddam, M.A.; Monfared, S.H. Prediction of Annual Drinking Water Quality Reduction Based on Groundwater Resource Index Using the Artificial Neural Network and Fuzzy Clustering. J. Contam. Hydrol. 2019, 220, 6–17. [Google Scholar] [CrossRef]
- Mikail, O.; Karaca, H. Optimization of Process Parameters at Direct Liquefaction of Waste PETs. Process Saf. Environ. Prot. Trans. Inst. Chem. Eng. Part B 2023, 171, 986–994. [Google Scholar] [CrossRef]
- Oldemar, R. PredictoR: Predictive Data Analysis System. CRAN: Contributed Packages, The R Foundation. Available online: https://cran.r-project.org/web/packages/predictoR/index.html (accessed on 3 March 2019).
- Barzegar, R.; Asghari Moghaddam, A.; Adamowski, J.; Fijani, E. Comparison of Machine Learning Models for Predicting Fluoride Contamination in Groundwater. Stoch. Environ. Res. Risk Assess. Res. J. 2017, 31, 2705–2718. [Google Scholar] [CrossRef]
- Nadiri, A.A.; Fijani, E.; Tsai, F.T.; Asghari Moghaddam, A. Supervised Committee Machine with Artificial Intelligence for Prediction of Fluoride Concentration. J. Hydroinformatics 2013, 15, 1474–1490. [Google Scholar] [CrossRef]
- Van Cranenburgh, S.; Wang, S.; Vij, A.; Pereira, F.; Walker, J. Choice Modelling in the Age of Machine Learning—Discussion Paper. J. Choice Model. 2022, 42, 100340. [Google Scholar] [CrossRef]
- Malekzadeh, M.; Kardar, S.; Shabanlou, S. Simulation of Groundwater Level Using MODFLOW, Extreme Learning Machine and Wavelet-Extreme Learning Machine Models. Groundw. Sustain. Dev. 2019, 9, 100279. [Google Scholar] [CrossRef]
- Yadav, S.; Bansal, S.K.; Yadav, S.; Kumar, S. Fluoride Distribution in Underground Water of District Mahendergarh, Haryana, India. Appl. Water Sci. 2019, 9, 62. [Google Scholar] [CrossRef]
- Rossi, G.; Valadas, L.; Squassi, A. Fluoride and Silver Ion Concentrations and pH in Silver Diamine Fluoride Solutions from Argentina. Acta Odontol. Latinoam. 2022, 35, 120–124. [Google Scholar] [CrossRef] [PubMed]
- Bhadani, V.; Singh, A.; Kumar, V.; Gaurav, K. Machine Learning Models to Predict Groundwater Level in a Semi-Arid River Catchment, Central India. Available online: https://meetingorganizer.copernicus.org/EGU23/EGU23-12629.html (accessed on 15 May 2023).
- Madani, A.; Hagage, M.; Elbeih, S.F. Random Forest and Logistic Regression Algorithms for Prediction of Groundwater Contamination Using Ammonia Concentration. Arab. J. Geosci. 2022, 15, 1619. [Google Scholar] [CrossRef]
- Mishra, P.; Nandi, D.; Sahu, P.; Mohanta, K.; Edinur, H.; Sarkar, T.; Pati, S. Hydro-Geochemical Attributes Based Classifiers for Groundwater Analysis. Ecol. Eng. Environ. Technol. 2021, 22, 28–39. [Google Scholar] [CrossRef]
- DemirYetiş, A.; İlhan, N.; Kara, H. Integrating Deep Learning and Regression Models for Accurate Prediction of Groundwater Fluoride Contamination in Old City in Bitlis Province, Eastern Anatolia Region, Türkiye. Environ. Sci. Pollut. Res. Int. 2024, 31, 47201–47219. [Google Scholar] [CrossRef]
- Stoffel, P.; Berktold, M.; Müller, D. Real-Life Data-Driven Model Predictive Control for Building Energy Systems Comparing Different Machine Learning Models. 2023. Available online: https://www.ssrn.com/abstract=4596970 (accessed on 15 November 2024).
- Yasaswini, G.; Kushala, S.; Santhosh, G.S.; Naik, M.T.; Mondal, M.; Dey, U.; Das, K.; Sarkar, S.; Kumar, P. Occurrence and Distribution of Fluoride in Groundwater and Drinking Water Vulnerability of a Tropical Dry Region of Andhra Pradesh, India. Water 2024, 16, 577. [Google Scholar] [CrossRef]
- Singh, K.; Hundal, H.S.; Singh, D. Groundwater Quality Assessment of Arid Regions of Punjab, India with Special Reference to Fluoride. J. Agric. Sci. Appl. 2013, 2, 1–7. [Google Scholar] [CrossRef]
- Jha, S.; Sinha, S.; Hazra, S. Hydrochemical Evolution and Assessment of Groundwater Quality in Fluorosis-Affected Area, Mandla District, Central India. Groundw. Sustain. Dev. 2021, 14, 100614. [Google Scholar] [CrossRef]
- Barman, N.K.; Chatterjee, S.; Khan, A. Trends of Shoreline Position: An Approach to Future Prediction for Balasore Shoreline, Odisha, India. Open J. Mar. Sci. 2015, 5, 13–25. [Google Scholar] [CrossRef]
- Hazra, S.; Ghosh, A.; Ghosh, S.; Pal, I.; Ghosh, T. Assessing Coastal Vulnerability and Governance in Mahanadi Delta, Odisha, India. Prog. Disaster Sci. 2022, 14, 100223. [Google Scholar] [CrossRef]
- Mausam (Editor). Monsoon Season (June–September 2012). Mausam 2013, 64, 569–584. [Google Scholar] [CrossRef]
- Pulak, M.; Behera, B. Socio-Economic and Environmental Implications of Solar Electrification: Experience of Rural Odisha. Renew. Sustain. Energy Rev. 2016, 56, 953–964. [Google Scholar] [CrossRef]
- Kerr, R.A. European Climate. Mild Winters Mostly Hot Air, Not Gulf Stream. Science 2002, 297, 2202. [Google Scholar] [CrossRef]
- Anand, C.; Moses, S.C. A Study on Agricultural Mechanization Status under Paddy and Wheat Crop Production in Central Region of Uttar Pradesh, India. Int. J. Environ. Clim. Change 2023, 13, 2835–2841. [Google Scholar] [CrossRef]
- Shun-Ichi, K.; Yoshida, T. Identification of Main Paddy Rice Cultivars in Tochigi Prefecture by RAPD Analysis. Jpn. J. Crop Sci. 2005, 74, 207–211. [Google Scholar] [CrossRef]
- Camacho, L.; Dumée, L.; Zhang, J.; Li, J.; Duke, M.; Gomez, J.; Gray, S. Advances in Membrane Distillation for Water Desalination and Purification Applications. Water 2013, 5, 94–196. [Google Scholar] [CrossRef]
- Schweitzer, G.E. Improved Monitoring Techniques to Assess Groundwater Quality near Sources of Contamination. In Safe Drinking Water; CRC Press: Boca Raton, FL, USA, 2017; pp. 168–176. [Google Scholar] [CrossRef]
- Ahmad, S.; Singh, R.; Arfin, T.; Neeti, K. Fluoride contamination, consequences and removal techniques in water: A review. Environ. Sci. Adv. 2022, 1, 620–661. [Google Scholar]
- Kushwaha, N.L.; Kudnar, N.S.; Vishwakarma, D.K.; Subeesh, A.; Jatav, M.S.; Gaddikeri, V.; Ahmed, A.A.; Abdelaty, I. Stacked Hybridization to Enhance the Performance of Artificial Neural Networks (ANN) for Prediction of Water Quality Index in the Bagh River Basin, India. Heliyon 2024, 10, e31085. [Google Scholar] [CrossRef]
- Lakhera, S.; Chandra, S.; Rahi, D.C. Development of Water Quality Prediction Model for Narmada River Using Artificial Neural Networks. Research Square. Available online: https://www.researchsquare.com/article/rs-1166542/v1 (accessed on 29 December 2021).
- Hodson, T.O. Root-Mean-Square Error (RMSE) or Mean Absolute Error (MAE): When to Use Them or Not. Geosci. Model Dev. 2022, 15, 5481–5487. [Google Scholar] [CrossRef]
- Idemudia, O.; Ehiorobo, J.O.; Izinyon, C.O.; Ilaboya, I. Evaluating the performance of Random Forest, Decision Tree, Support Vector Regression and Gradient Boosting for streamflow prediction. CTU J. Innov. Sustain. Dev. 2024, 16, 116–130. [Google Scholar] [CrossRef]
- Marsland, S. Machine Learning: An Algorithmic Perspective, 2nd ed.; CRC Press: Boca Raton, FL, USA, 2014. [Google Scholar]
- Kocaoğlu, A. Efficient Optimization of a Support Vector Regression Model with Natural Logarithm of the Hyperbolic Cosine Loss Function for Broader Noise Distribution. Appl. Sci. 2024, 14, 3641. [Google Scholar] [CrossRef]
- Tran, D.A.; Tsujimura, M.; Ha, N.T.; Nguyen, V.T.; Van Binh, D.; Dang, T.D.; Doan, Q.; Bui, D.T.; Ngoc, T.A.; Phu, L.V.; et al. Evaluating the predictive power of different machine learning algorithms for groundwater salinity prediction of multi-layer coastal aquifers in the Mekong Delta, Vietnam. Ecol. Indic. 2021, 127, 107790. [Google Scholar] [CrossRef]
- Joel, P.; Berg, M. Global Analysis and Prediction of Fluoride in Groundwater. Nat. Commun. 2022, 13, 4232. [Google Scholar] [CrossRef]
- Johannes, L.; Laaha, G. Effect of Merging Large Datasets on Prediction Accuracy of Low Flow Estimation by Random Forest. Available online: https://meetingorganizer.copernicus.org/EGU22/EGU22-7312.html (accessed on 28 March 2022).
- Kashiyama, M.; Hirokawa, M.; Matsuno, R.; Sakuma, K.; Itoh, T. Interactive Visualization of Ensemble Decision Trees Based on the Relations among Weak Learners. In Proceedings of the 2024 28th International Conference Information Visualisation (IV), Coimbra, Portugal, 23–26 July 2024; IEEE: Piscataway, NJ, USA, 2024; Volume 119, pp. 1–6. [Google Scholar] [CrossRef]
- Yajima, D.; Ohkawa, T.; Muroi, K.; Imaishi, H. Predicting Toxicity of Food-Related Compounds Using Fuzzy Decision Trees. Int. J. Biosci. Biochem. Bioinform. 2014, 4, 33–38. [Google Scholar] [CrossRef]
- Afikah, A.; Findawati, Y. Classification of Vacational High School Graduates’ Ability in Industry Using Extreme Gradient Boosting (XGBoost), Random Forest and Logistic Regression. Available online: https://archive.umsida.ac.id/index.php/archive/preprint/view/734/version/726 (accessed on 11 April 2023).
- Naghibi, S.A.; Hashemi, H.; Berndtsson, R.; Lee, S. Application of Extreme Gradient Boosting and Parallel Random Forest Algorithms for Assessing Groundwater Spring Potential Using DEM-Derived Factors. J. Hydrol. 2020, 589, 125197. [Google Scholar] [CrossRef]
- El Hafyani, M.; El Himdi, K.; El Adlouni, S. Improving Monthly Precipitation Prediction Accuracy Using Machine Learning Models: A Multi-View Stacking Learning Technique. Front. Water 2024, 6, 1378598. [Google Scholar] [CrossRef]
- Ji, C. Research on an Integrated Index Prediction Model Based on RF-XGBOOST-ANN. In Proceedings of the 2023 IEEE International Conference on Control, Electronics and Computer Technology (ICCECT), Jilin, China, 28–30 April 2023; IEEE: Piscataway, NJ, USA, 2023. [Google Scholar] [CrossRef]
- Ahmar, A.S. Forecast Error Calculation with Mean Squared Error (MSE) and Mean Absolute Percentage Error (MAPE). J. Inf. Vis. 2020, 1, 94–96. [Google Scholar] [CrossRef]
- Robi’atul, A.; Fitrani, A.S. Sentiment Analysis on Twitter About Domestic Violence Using Random Forest and Extreme Gradient Boosting Methods. Available online: https://archive.umsida.ac.id/index.php/archive/preprint/view/2459/version/2451 (accessed on 22 August 2023).
- M’hamdi, O.; Takács, S.; Palotás, G.; Ilahy, R.; Helyes, L.; Pék, Z. A Comparative Analysis of XGBoost and Neural Network Models for Predicting Some Tomato Fruit Quality Traits from Environmental and Meteorological Data. Plants 2024, 13, 746. [Google Scholar] [CrossRef]
- Garima, S.; Mehta, S. Prediction of Geogenic Source of Groundwater Fluoride Contamination in Indian States: A Comparative Study of Different Supervised Machine Learning Algorithms. J. Water Health 2024, 22, 1387–1408. [Google Scholar] [CrossRef]
- Chen, J.; Chen, S.; Fu, R.; Li, D.; Jiang, H.; Wang, C.; Peng, Y.; Jia, K.; Hicks, B.J. Remote Sensing Big Data for Water Environment Monitoring: Current Status, Challenges, and Future Prospects. Earth’s Future 2022, 10, e2021EF002289. [Google Scholar] [CrossRef]


| pH | Conductivity (μS/cm) | Turbidity (NTU) | Chloride (mg/L) | Total Hardness (mg/L) | Total Alkalinity (mg/L) | Iron (mg/L) | TDS (mg/L) | Fluoride (mg/L) | |
|---|---|---|---|---|---|---|---|---|---|
| count | 1853 | 1853 | 1853 | 1853 | 1853 | 1853 | 1853 | 1853 | 1853 |
| Mean | 7.40 | 572.86 | 1.74 | 87.32 | 226.16 | 249.20 | 0.55 | 372.49 | 0.67 |
| Std | 0.30 | 87.89 | 1.26 | 39.85 | 41.81 | 39.38 | 0.22 | 57.22 | 0.14 |
| Min | 6.51 | 332.0 | 0.02 | 14.0 | 90.0 | 144.0 | 0.002 | 216.0 | 0.248 |
| 25% | 7.18 | 524.0 | 0.66 | 58.0 | 198.0 | 226.0 | 0.461 | 341.0 | 0.581 |
| 50% | 7.37 | 588.0 | 1.7 | 82.0 | 232.0 | 252.0 | 0.593 | 382.0 | 0.682 |
| 75% | 7.59 | 632.0 | 2.7 | 116.0 | 256.0 | 276.0 | 0.726 | 411.0 | 0.778 |
| max | 8.27 | 814.0 | 5.27 | 206.0 | 340.0 | 358.0 | 1.2 | 529.0 | 1.09 |
| Pseudocode for Stacking Regressor: |
|---|
| INPUT: X_train, y_train, X_test, y_test INITIALIZE base_models = [RF, GB] INITIALIZE meta_model = GradientBoostingRegressor CREATE stacking_model = StackingRegressor (base_models, meta_model) TRAIN stacking_model.fit (X_train, y_train) PREDICT y_pred_stack = stacking_model. predict(X_test) EVALUATE MSE, MAE, R2, Accuracy OUTPUT: MSE, MAE, Accuracy |
| Models | MAE | MSE | Accuracy |
|---|---|---|---|
| SVR | 0.115 | 0.022 | 0.826 |
| Stacker Regressor | 0.103 | 0.018 | 0.896 |
| Random Forest | 0.106 | 0.019 | 0.841 |
| XGBoost | 0.111 | 0.021 | 0.833 |
Disclaimer/Publisher’s Note: The statements, opinions and data contained in all publications are solely those of the individual author(s) and contributor(s) and not of MDPI and/or the editor(s). MDPI and/or the editor(s) disclaim responsibility for any injury to people or property resulting from any ideas, methods, instructions or products referred to in the content. |
© 2025 by the authors. Licensee MDPI, Basel, Switzerland. This article is an open access article distributed under the terms and conditions of the Creative Commons Attribution (CC BY) license (https://creativecommons.org/licenses/by/4.0/).
Share and Cite
Pati, A.K.; Tripathy, A.R.; Nandi, D.; Thakur, R.R.; Ðurin, B.; Dogančić, D.; Fetoshi, O. Fluoride Risk Prognostication: A Pioneering Ensemble Machine Learning Approach for Groundwater Contamination Prediction in Parts of the East Coast of India. Water 2025, 17, 909. https://doi.org/10.3390/w17060909
Pati AK, Tripathy AR, Nandi D, Thakur RR, Ðurin B, Dogančić D, Fetoshi O. Fluoride Risk Prognostication: A Pioneering Ensemble Machine Learning Approach for Groundwater Contamination Prediction in Parts of the East Coast of India. Water. 2025; 17(6):909. https://doi.org/10.3390/w17060909
Chicago/Turabian StylePati, Alok Kumar, Alok Ranjan Tripathy, Debabrata Nandi, Rakesh Ranjan Thakur, Bojan Ðurin, Dragana Dogančić, and Osman Fetoshi. 2025. "Fluoride Risk Prognostication: A Pioneering Ensemble Machine Learning Approach for Groundwater Contamination Prediction in Parts of the East Coast of India" Water 17, no. 6: 909. https://doi.org/10.3390/w17060909
APA StylePati, A. K., Tripathy, A. R., Nandi, D., Thakur, R. R., Ðurin, B., Dogančić, D., & Fetoshi, O. (2025). Fluoride Risk Prognostication: A Pioneering Ensemble Machine Learning Approach for Groundwater Contamination Prediction in Parts of the East Coast of India. Water, 17(6), 909. https://doi.org/10.3390/w17060909