Abstract
Recent studies have emphasized the diel nature of dissolved CO2 (pCO2) in lake systems; however, around the world, field measurements have been conducted at different times, and it is not clear how, and to what extent, this variable sampling time affects CO2 emission (FCO2). This research aimed to investigate whether 10:00 am. was an effective time for lake field sampling to capture 24 h mean pCO2 and FCO2 from subtropical eutrophic shallow lake systems. To accomplish this goal, our study compiled long-term data from three individual studies on a shallow lake system in southeast Louisiana, USA. The data comprised samples collected across three-hour intervals, seasonally, over five years. This study highlights that a lake system can function as a carbon sink during peak daylight hours and can shift to a source overnight to early morning. The findings from the longer-term data confirmed 9:00 am to 11:00 am as the time range when pCO2 deviation from the daily mean is at its lowest (111% of the daily mean). Sampling outside of this time range resulted in an increase in FCO2 (32.09 mmol m−2 h−1) of up to 271% (87.03 mmol m−2 h−1) in overnight samples, with daytime measurements of FCO2 flipping the lake from source to sink sequestering −20.17 mmol m−2 h−1. Based on our findings, we strongly recommend that future studies in similar aquatic systems utilize the 9:00–11:00 am timeframe for field sampling to increase the accuracy and compatibility of shared data in carbon emission estimation.
1. Introduction
Global lakes cover only about 3.7% of the total non-glaciated land surface area [1]. However, they play a crucial role as transitional zones between land and ocean in receiving, storing, transporting, and transforming carbon. Despite their small coverage, global lakes have been reported to contribute 25% of the carbon dioxide (CO2) emissions from inland waters to the atmosphere. However, the current estimates of CO2 emission from these lakes vary largely from 0.32 to 0.70 Pg [2,3,4]. This large discrepancy has been attributed to several factors including coarse time-resolution of measurements of partial pressure of dissolved CO2 (pCO2) [5,6], skewed frequency in sampling locations and lake types [7,8], and differences in field sampling times [9,10]. Early studies on global surface water pCO2 showed that roughly 90% of lakes were supersaturated in CO2 with respect to the atmosphere, and acted as CO2 sources [2,11,12]. Several recent studies have highlighted that lakes are more intricate, with pCO2 readings varying drastically depending on sample timing during the day [10,13]. Coupled with the disproportionate emissions per unit surface area, this emphasizes the importance of constraining lake field measurements of pCO2 to improve our understanding of their role in global carbon cycling.
The variability in lake pCO2 levels has been shown to shift due to changing seasons, temperature, and light availability, which impacts primary productivity and respiration rates [14,15,16]. Despite these findings, many lake CO2 emission estimates are based on low-resolution measurements on a weekly or monthly scale [12,17,18]. In addition to low-frequency measurements, estimates of pCO2 based on alkalinity, temperature, and pH are still widely used in many published works, which presents considerable uncertainty in pCO2 accuracy [19,20]. Increasingly, studies have focused on utilizing direct field measurements through floating chambers and deployable sensors, which have been shown to produce more accurate and reproducible results [21,22,23,24]. With the introduction of these sensors, studies have been able to discern the diel nature of pCO2 in lakes and river systems. The studies by Potter and Xu (2023) [13] and Xu et al. (2019) [9] have shown that pCO2 can shift a large amount between night and day hours, resulting in the lake shifting from a sink to a source of pCO2 over 24 h. Therefore, point measurements of pCO2 or FCO2 at different times of the day could significantly impact whole-day lake CO2 estimations, especially when scaling up regionally and globally. Hence, constraining the uncertainties is of relevance. This highlights the importance of standardizing field sampling times to increase estimation accuracy and make data comparable among studies.
Based on their recent study of CO2 outgassing from a subtropical shallow lake, Potter and Xu (2023) [13] proposed to standardize field measurement time of 10:00 am. (or U.S. Central Standard Time (CST) 10:00 for the study area) as the most appropriate sampling time to capture average conditions of pCO2 across a given day. Previous research on the same lake by Xu et al. (2019) [9] stressed the significant shift in pCO2 between dawn and dusk, which has also been evidenced by a recent study [22] conducted in a large subtropical lake in central China. Collectively, these studies demonstrated that diel variability is significant due to sunlight availability as well as the eutrophic status of the highly urbanized lake. Lakes with these characteristics have been shown to be affected by increased nutrient loading through higher precipitation totals, resulting in a significant seasonal shift in primary productivity [24,25]. Conversely in the case of droughts or declining rainfall, pCO2 was still shown to be rising, due to increased turbidity, Chl-a, and an increase in local surface-level algal blooms [26]. This leaves a knowledge gap in the seasonal variability in lake pCO2 and the implications of utilizing in situ sampling times outside of the 10:00 am local time suggested by Potter and Xu (2023) [13] Due to the highly variable nature of lakes following precipitation events or sky cover, it is important to set standards for measurement times based on standardized conditions such as sunny days [27].
This study aimed to determine whether 10:00 am local time operates as an effective sampling time for representing 24 h diel average conditions in CO2 emission from a subtropical lake across seasons, and to what extent different sample times can induce the daily pCO2 error. We compiled data from five years (2017–2022) for a well-monitored subtropical eutrophic lake in southeast United States. The specific study objectives were to (1) determine the seasonal variability in pCO2 in a subtropical lake, (2) analyze pCO2 values across varying sample times to assess the error associated with sample timing, and (3) quantify the difference in CO2 emission estimation with varied measurement timings. With these objectives in mind, we aimed to test the hypothesis that 10:00 am represents the most effective time for lake sampling to capture the mean lake pCO2 conditions over a given 24 h period across seasons.
2. Materials and Methods
This study was conducted at University Lake (latitude 30°24′50″ N; longitude 91°10′00″ W) in Baton Rouge in southeastern Louisiana, USA (Figure 1). The lake has a mean depth of roughly 0.9 m with an overall perimeter of 6.7 km and a surface area of 0.76 km2. The lake is characterized as hypereutrophic with total phosphorus concentrations ranging from 0.31 to 0.32 mg L−1, total nitrogen of 1.81 to 2.23 mg L−1, chlorophyll-a of 7.8–163 μg L−1, and an average BOD5 and BOD10 of 7.6 and 12.7 mg L−1 [28,29,30]. The lake’s surrounding area comprises six small lakes, a local golf course, and urban neighborhoods. The total watershed drainage of these surrounding areas is approximately 1.87 km2. Baton Rouge, Louisiana, is characterized by a subtropical climate with long, hot summers and relatively short and mild winters. Seasonal air temperatures fluctuate between a low in the winter of 11.2 °C and a high in July and August of 28.4 °C, with annual mean temperatures of about 20.5 °C. Precipitation patterns in the regions are typically well distributed across the year, with the driest month of November receiving 100 mm on average and the wettest month of August at 180 mm with an annual mean of 1550 mm per year.
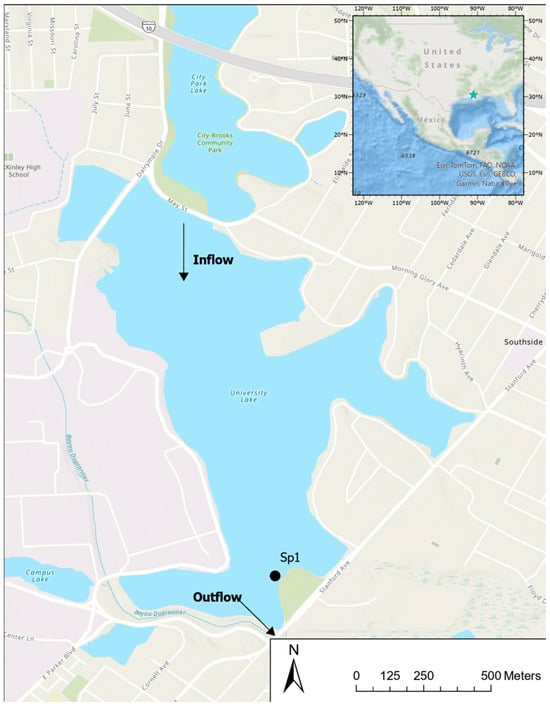
Figure 1.
The study lake is located in Baton Rouge, Louisiana, USA. The sample collection site for this study is marked by the black dot SP1 near the lake outflow.
Field sampling for this study took place over five years, beginning in the fall of 2017 and ending in the summer of 2022. Within this five-year span, three sets of concentrated samples were collected. The first set consisted of bi-weekly samples collected from November 2017 to May 2018. These samples were collected at four time points: 07:00, 10:00, 13:00, and 16:00 US Central Standard Time (CST). The second set consisted of two 48 h trips, with samples collected every three hours, beginning at 19:00 on 28 January and 30 July 2022, and ending 48 h later at 22:00 CST on 30 January and 1 August 2022. The third data set included samples collected seasonally at 10:00 CST from November 2021 to November 2022. Samples were collected at three-hour intervals due to the highly biologically active nature of the lake. Leaving the sensor in the lake for long-term continuous measurements results in algal growth on the sensor membrane, impacting results. With this in mind the sensor was removed and rinsed with DI water following each sampling event. The samples, therefore, included six fall samples, three summer samples, three spring samples, and four winter samples. Across all three data sets, samples were collected only on sunny days to avoid possible effects of varying cloud cover and precipitation on lake pCO2 levels. During each sampling trip, the pCO2 of lake water was measured using a pCO2 sensor (C-SenseTM sensor Turner Designs, San Jose, CA, USA), which converted the infrared wavelength of CO2 into pCO2 concentration. The sensor was left 30 cm below the surface of the water for about 25 min to equilibrate, followed by five minutes of 30 s readings. This sampling schedule was employed to prevent algal growth on the sensor membrane. Additionally, dissolved oxygen (DO) concentration, saturation, water temperature, and specific conductivity were measured using a YSI 556 multi-probe meter (YSI Inc., Yellow, Springs, OH, USA). The YSI probe was left in the water for the same duration as the C-sensor. While sensors were recording water measurements, triplicate grab samples were collected from a depth of 30 cm and homogenized as a composite sample from the lake and analyzed in the field for pH (Orion StarA221, Thermo Scientific, Beverly, MA, USA), turbidity (T100, Oakton Instruments, Vernon Hills, IL, USA), and fluorescence of chlorophyll-a, phycocyanin, ammonium, and colored dissolved organic matter (cDOM) (AquaFluor® handheld fluorometer, Turner Designs in Sunnyvale, CA, USA). All sensors were calibrated in the lab with respective solutions and standards prior to each sampling trip.
In addition to the in situ measurements, water samples were collected approximately 30–50 cm below the surface. Across the study period, the mean water depth at the sampling site was approximately 1 m. The samples were filtered in the field using a 0.2 µm nylon syringe filter (Environmental Express, Charleston, SC, USA) into a 20 mL glass vial for analysis of dissolved inorganic carbon (DIC) and dissolved organic carbon (DOC) concentrations. The samples were stored on ice and transported to the LSU Wetlands Biogeochemistry Analytical Services Laboratory within one week of collection. All samples were run on a Total Organic Carbon Analyzer (TOC-L CHS/CSN Shimadzu, Kyoto, Japan) through the 680 °C combustion catalytic oxidation method with non-dispersive infrared sensor (NDIR) detection. Dissolved organic carbon was determined as the difference between total dissolved carbon and total dissolved inorganic carbon. The TOC analyzer was calibrated using an inorganic and total carbon control for QA/QC.
In this study, the estimation of CO2 outgassing for the lake water surface was calculated utilizing a stagnant layer model developed by [31] which has been commonly used in estimating gas evasion from the air–water interface.
In the model, FCO2 is the flux of CO2 from the lake water surface in mmol m2 h−1, KT is the gas transfer velocity in cm h−1 [32], and KH is the solubility constant [33]. pCO2(water) was the partial pressure measured in the lake at a depth of roughly 30 cm in units of µatm. pCO2(air) was assumed to have a constant value of 420 µatm for our study due to the lack of a local eddy covariance tower. KT was converted from the normalized Schmidt number of 600 K600 based on the following equation by [34]:
Here, the gas transfer velocity KT was determined based on a wind-speed-dependent value (n), which is set at 0.50 when local wind speeds are greater than 3.7 m s−1 and 0.75 when wind speeds dip below 3.7 m s−1 [35]. ScCO2 is the Schmidt number based on the given temperature at the measurement time [36]. K600 is determined based on the following equation by Cole and Caraco (1998) [37]:
K600 is calculated based on U10, the normalized local windspeed 10 m above the lake’s surface. Windspeed and air temperature were measured on-site during sampling and verified with Baton Rouge local weather station data maintained by the Louisiana Agriclimatic Information System (https://weather.lsuagcenter.com/).
Chlorophyll-a concentration was calculated utilizing a model developed by [17] based on the strong correlation between chlorophyll-a fluorescence and extracted chlorophyll-a
In the model, Chl-a is the concentration of chlorophyll-a in µg L−1, and fluo is the measured fluorescence of chlorophyll-a in arbitrary fluorescence units (AFU) with the Turner Design fluorometer.
All statistical analyses for this study were performed on R version 4.2 and run using R studio (Boston, MA, USA). Relevant and significant correlations within the dataset were determined using a Pearson correlation matrix with a significance threshold of p < 0.05. Relationships between environmental parameters (pH, dissolved oxygen, Chl-a, turbidity, and cDOM) and carbon variables (pCO2, DIC, and DOC) were further explored through linear regressions and Student’s paired T-tests. ANOVA tests were performed to test for statistically significant variability between seasons. For all statistical tests, measurements taken between 10:00 and 19:00 CST were defined as daylight hours, and those taken between 22:00 and 07:00 CST as night hours.
3. Results
3.1. Significant Diel Cycle of pCO2
Over the study period, pCO2 in the subtropical lake averaged 642 (±633) µatm, ranging from 17 µatm measured during the middle of a winter day to 3895 measured during late night hours on a summer day. pCO2 followed a consistent trend across all sample dates, i.e., increasing rapidly over evening hours (910 ± 741 µatm) and dropping precipitously throughout the daylight hours (340 ± 222 µatm, Figure 2). Based on the measurements recorded at 10:00 CST, pCO2 was mostly close to the overall mean at 717 µatm. Across the study, pCO2 measured during daylight, any time after 10:00 CST, was only 63% (22:00 CST) to 29% (16:00 CST) of the daily mean. Concurrently, any values recorded during 22:00–7:00 CST were found to be consistently higher, from 71% (1:00 CST) to 24% higher (4:00 CST) than the daily average. Throughout the 24 h of measurements, the dissolved oxygen concentration of the lake water followed an inverse trend to pCO2 across all seasons, and it decreased overnight as pCO2 rose and peaked during the daylight hours as pCO2 reached its lowest level. DO and pH had a statistically significant negative correlation with pCO2, while water temperature, chlorophyll-a, cDOM, and ammonia fluorescence all positively correlated with pCO2 (Table 1).
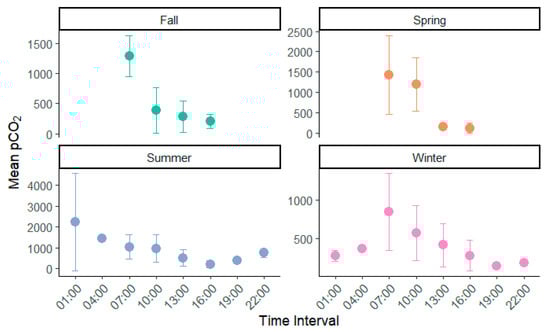
Figure 2.
pCO2 (µatm) variation by time and season in a eutrophic lake in subtropical Louisiana, USA. Samples for 01:00, 04:00, 19:00, and 22:00 CST only occurred in winter and summer sampling. Y-axis is mean pCO2 in µatm with error bars representing standard deviation.

Table 1.
Pearson correlation coefficients between phycocyanin (Phyco), chlorophyll-a (Chl-a), colored dissolved organic matter (cDOM), ammonia (Amnia), turbidity, water temperature (T), conductivity, dissolved oxygen concentration (DO) and saturation (DOsat), pH, and pCO2 across all sample dates. Only significant values are displayed (p < 0.05).
3.2. Seasonal Modification of Diel pCO2 Cycle and Ambient Conditions
pCO2 level in this eutrophic lake was lowest during the fall and winter at 350 and 583 µatm, respectively. In the warmer summer and spring, pCO2 was considerably higher at 1092 and 1196 µatm. In spring and fall, pCO2 was collected between 07:00 and 16:00 without nighttime data, potentially lowering overall estimation. The difference in pCO2 between daylight and night hours was much smaller in the winter than in the summer. The peak of pCO2 occurred at midnight in summer and early in the morning in winter (Figure 2).
Utilizing the 10:00 CST measurements, water temperature was lowest in the winter months at 10 °C, double that in the spring and fall at 20 °C and 19 °C, and nearly triple the winter temperature in the summer at 28 °C. Dissolved oxygen followed an opposite trend to pCO2 seasonally and throughout the day. Seasonally, DO was highest in the fall and winter (7.5 and 10.8 mg L−1) and lowest in spring and summer (6.2 and 4.9 mg L−1), and DO saturation reached near or above 100% in the afternoon hours in all seasons except for fall. Overall, all physiochemical parameters measured were highest in the summer months and lowest in the winter months, with the exception of dissolved oxygen concentration and saturation (Figure 3).
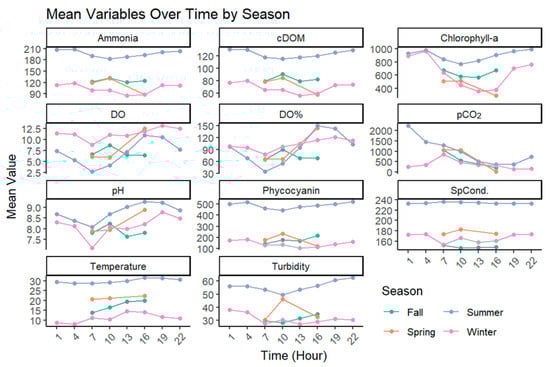
Figure 3.
Seasonal variability in all lake additional parameters across the study period with mean values from each sample time ranging from 01:00 CST to 22:00 CST. Figures include phycocyanin (AFU), chlorophyll-a (µg L−1), colored dissolved organic matter (AFU), ammonia (AFU), dissolved oxygen concentration (mg L−1) and saturation, pCO2 (µatm), pH, conductivity (µS cm−1), water temperature (°C), and turbidity (NTU).
Across the study period, dissolved carbon forms were nearly identical in the lake, with DIC averaging 14.09 mg L−1 (± 3.44) and DOC averaging 14.57 mg L−1 (±3.62). DIC tended to be lower in the cooler winter and fall months, averaging 12.6 and 12.8 mg L−1, respectively, while increasing in the spring and summer to 15.4 and 18.2 mg L−1. DOC was lowest in winter and spring months at 13.0 (± 3.3) and 13.9 mg L−1 (± 4.9) and increased through summer and fall to 16.5 (± 3.5) and 16.4 mg L−1 (± 1.9).
3.3. Diel and Seasonal Lake CO2 Emissions
Outgassing of CO2 from the lake followed a similar trend to pCO2 across our study period with lowest values of 5.58 mmol m2 h−1 (±56.2) occurring during daylight hours and increasing overnight by over ten times to 56.24 mmol m2 h−1 (±81.42, Figure 4). Based on measurements at 10:00 CST, evasion from the lake averaged 30.13 mmol m2 h−1 (±56.19 mmol m2 h−1) across the five-year study. Seasonal variability in lake evasion resulted in a drastic shift in evasion rates. Spring and summer had the highest evasion at 74.4 and 52.06 mmol m2 h−1, while winter and fall were nearly one-tenth the rate at 8.28 and −6.67 mmol m2 h−1, respectively. This seasonal variability resulted in a shift from the lake functioning as a source of CO2 to a sink during the fall.
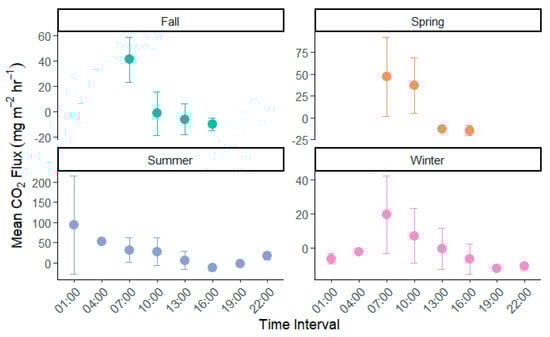
Figure 4.
FCO2 variation by time and season in University Lake, Louisiana, USA. Samples for 01:00, 04:00, 19:00, and 22:00 only occurred in winter and summer sampling. Y-axis is mean FCO2 in mmol m2 h−1 with error bars representing standard deviation.
3.4. Difference in CO2 Emission Based on Field Measurement Time
The timing of sample collection across the study clearly affected the pCO2 measured from the lake. Based on the hour of the day collected, pCO2 values measured at 1:00 CST in the middle of the night were, on average, 194% greater than the daily average, but the pCO2 values recorded at 16:00 CST were only 33% of the daily mean. pCO2 values recorded between 13:00 and 22:00 CST were consistently lower than the daily mean. There was a variation in pCO2 from the measurement made at 10:00 (730 µatm) to 61% of this at 13:00 (390 µatm) to a maximum variation at 16:00 of 33% (214 µatm) (Table 2). pCO2 continued to vary from the daily mean. However, the discrepancy was lower at 40% and 72% at 19:00 and 22:00 CST sampling times, respectively (Table 2). Inversely, nighttime measurements were consistently above the daily mean of 194% at 01:00, decreasing to 140% at 04:00, then rising again at 07:00 to 167% of the mean value. Across the five-year sampling period, 10:00 am. was consistently the closest to the daily average at 114% of the daily mean.
Table 2.
Average pCO2 across sample times in the lake, the ratio of the daily average to the hourly sample average, and the ratio of the hourly average to the standardized 10 am average. Sample count is the number of measurements at a specific time. The total mean is the mean across all sample points collected. FCO2 is calculated outgassing of CO2. FCO2 hourly: FCO2 represents the measured ratio to the daily 10 am, representing the mean flux value.
4. Discussion
This study presents one of the first long-term CO2 and dissolved carbon data sets of a subtropical eutrophic lake system. Recent progress in inland aquatic research has aimed to more precisely quantify the contribution of lake systems to the regional and global carbon budget [38,39,40]. This study proposes a standardized time for lake CO2 sampling, which is a crucial step for significantly improving future lake carbon sampling plans. The finding from our five-year study that lake CO2 levels vary across scales from seasonality on an annual scale to a more drastic shift in hourly diel variation verifies the urgent need for taking the step of reducing temporally induced uncertainties in pCO2 field measurements.
Our findings showed a substantial variability in pCO2 over the seasons, which was known and has been attributed primarily to temperature change [41,42]. However, the seasonal variability was relatively smaller than daily fluctuations, as evidenced by our long-term measurements that pCO2 was, on average, three times higher in the summer (1092 µatm) than in the fall (350 µatm), while the measured pCO2 across a day could shift by more than 33× from night (2231 µatm) to afternoon (68.6 µatm) in the summer, and by 6× in the winter (138 µatm at dusk to 844 µatm at dawn Table 3, Figure 2). A similar shift in the recorded pCO2 across a day and the corresponding outgassing has been confirmed by multiple high-resolution studies into aquatic pCO2 [9,10,13,22]. These studies help lay the framework for identifying a diel trend in inland lakes, suggesting a standardized lake sampling time of 10:00 CST for subtropical lake systems. This may not be the case for lake systems in drastically different climate zones, such as in northern lakes or deep lakes with thermal stratification. One such study by Johnson and others [43] found that seasonal availability was substantial for pCO2 in unproductive lake systems, while the daily variation within seasons was much lower. Our study supports and expands upon these findings for subtropical lakes, suggesting a range of 09:00 to 11:00 am for sampling time. Sampling outside this time range is associated with a risk of mischaracterizing a system as either a sink or source of pCO2 as values shift drastically outside this window (Table 2, Figure 5).
Table 3.
Mean concentrations of pCO2 (µatm) across seasons and times. Values in the season column represent the mean per sample time, with the mean column representing the average pCO2 across all sample times.
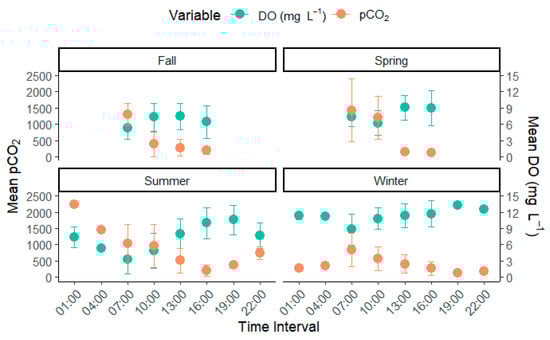
Figure 5.
Hourly rate of change for pCO2 and dissolved oxygen across each season within the lake. DO in mg L−1 and pCO2 in µatm.
The variability in CO2 outgassing across seasonal and daily scales can be attributed to photosynthetic activity and solar radiation. A study by Xu and Xu (2016) [44] on the same lake system found similar variability in these parameters, both seasonally and daily. Their analysis showed that solar radiation intensity was nearly 25% greater in summer and spring than in winter and fall. It coincided with photosynthetic oxygen production, which peaked at 400% higher values in both summer and spring and was sustained for more hours of the day. The substantially higher summer photosynthetic activity is critical to the drastic daily change in lake pCO2. In addition to the photosynthesis−respiration dynamics within lakes, the outgassing of CO2 can be strongly affected by wind speed. Rudberg et al. (2021) [7] found wind speed accounted for as much as 77% of the day-to-night variability in CO2 in northern lakes. While our study did not find the wind to be a major influence, the season variability in wind, particularly over larger and deeper lakes, can significantly impact the outgassing rate through the displacement of CO2 and in regulating a lake’s thermal gradient. Temperature fluctuations between daylight and nighttime hours can lower internal pCO2 as cooler surface water sinks, upwelling the higher concentrated CO2 rich water [45]. This may partly explain the higher nighttime outgassing rates observed in lakes.
Interestingly, based on the variability in pCO2 across daily timing and season (Table 3 and Figure 6), fall and winter are slightly later than 10:00 am for ideal sampling due to decreased overall daytime. This is likely due to the time change implemented each year for the continental United States. Each year, at midnight of the second Sunday in March, Daylight Saving Time (DST) begins where the clock is advanced by one hour; at the end date of DST, midnight of the second Sunday in November, the clock is turned back by one hour. Therefore, we suggest 11 am as the ideal time for field pCO2 measurements in the fall and winter months in the regions with winter−summer time change. The functional shift of CO2 found in this study from a source in the spring and summer to a sink in the fall and winter indicates a need for more high-resolution field monitoring in the latter two seasons.
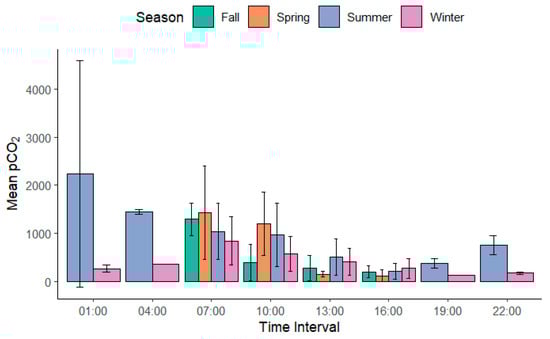
Figure 6.
Mean values of pCO2 µatm across each season and sample time throughout our study period. Error bars represent the standard deviation for each sample time per season.
Globally, even at a solar hour, sunlight availability can be modified by geographical location, altitude, and topography of sampling locations. This may be the reason why Wang et al. (2024) [22] found 11:00 to 12:00 to be the ideal field sampling time for their study location in Central China. The variable nature of each geographical region and lake system makes an exact standardized time difficult for global lakes. As our timing was very close to that found by Wang and others in 2024, we suggest a range from 09:00–11:00 am, local time, as the ideal sampling time. However, as the daily mean varied by 50% (Table 2) 3:00 h before and after 10:00, this suggests that any further deviation from this time range may misrepresent the lake’s actual outgassing rate across seasons.
Our study showed that nearly all measured physiochemical parameters closely followed an hourly shift. Most notably, dissolved oxygen concentration followed a near-perfect inverse trend with pCO2 across seasons and had the highest correlation with pCO2 (−0.50, p < 0.05, Table 1, Figure 5). The relationship between DO and pCO2 in highly productive lakes has been well established in many studies [46,47], particularly in warm summer months, where eutrophic lakes tend to substantially increase the activity of primary producers throughout the day, as seen in the elevated levels of chlorophyll a, phycocyanin, and colored dissolved organic matter found in our study (Figure 3). Primary producers take up lake CO2 and produce dissolved oxygen. This relationship partially drives the diel pCO2 relationship in lake systems [48]. Conversely, the increased concentration of biological activity through autotrophs and heterotrophs in the lakes during warm months can cause a rise in respiration, resulting in an overall net increase in pCO2. The increased respiration from elevated biological presence offsets this balance, resulting in the observed higher summer pCO2 compared with winter. This relationship will likely intensify with climate change, increasing temperature and precipitation patterns. These dynamics will increase phytoplankton growth in these systems as increased precipitation increases net nutrient runoff, increasing eutrophication and pCO2, particularly in shallow lake systems [49].
This study demonstrates that field measurements of pCO2 conducted at different times can mischaracterize the role of eutrophic lakes as a sink or source. While we postulate setting up a standardized timing for field measurements of pCO2, our results are currently constricted to similar lake systems, i.e., subtropical, eutrophic shallow lakes, as sunlight variability, temperature, and nutrient loading vary drastically over spatial−temporal distributions [50]. For similar lakes, our findings in Table 2 can be used as a baseline for determining a functioning sampling time for other lake systems. However, further analysis will enhance applicability of these findings for lakes across variable latitudes or trophic states. Lake CO2 is primarily controlled by weather, topography, and geomorphology conditions, in addition to the local biological and chemical factors. The practical application of these findings suggests a need for standardizing sampling time across different lake systems. Furthermore, these findings present a method of correcting pCO2 data collected from lake systems from variable sample times. In fact, a majority of studies on CO2 emission from aquatic systems, including lakes, reservoirs, and rivers, fail to account for timing and, as such, have no record of sample time in their study methods [51,52,53]. This suggests a potential drastic over- or under-estimation of the actual CO2 evasion from their work, depending on whether the sampling was conducted in the early morning, afternoon, or evening. Utilizing the ratio from Table 2, studies may adjust their findings using the ratio of the sample collected to the mean as an amplification factor. This can help standardize current lake datasets to more accurately represent their actual contribution to the carbon budget, providing a reliable method for correction and standardization in future studies on air–water CO2 emission. More studies on diel pCO2 in other geographical regions and under different weather conditions (e.g., cloudy and rainy days) are needed to refine the correction factor. These studies should employ a similar strategy of diel sampling across seasons to capture the best time for single-point sampling.
5. Conclusions
This study monitored pCO2 and physiochemical water conditions in a subtropical lake over a five-year period from fall 2017 to summer 2022, with samples including high-resolution 24 h measurements and low-resolution monthly measurements. Throughout all sample dates, a substantial drop in lake pCO2 was observed from dawn till dusk, with a steep rise in pCO2 coinciding with the nighttime hours. We confirmed that samples collected at 10:00 am (or US CST for the study site) resulted in the most minor variability from the daily mean lake CO2 concentration and outgassing rate across all seasons. Fall and winter appeared to be slightly later than 10:00 am for ideal sampling for the study location due mainly to the time change implemented in the United States each year. Considering the arbitrary winter−summertime change, the range from 09:00 am to 11:00 am is recommended for measuring field dissolved CO2 across seasons to represent 24 h average outgassing conditions. All samples measured after this range were consistently lower than the daily mean by a factor of 0.33 to 0.72. Samples collected during the night hours were regularly greater by factors of 1.40 to 1.94. The diel variability in lake dissolved CO2 concentration and flux was considerably greater than the seasonal variability, varying by 2000% across the day and 400% across the seasons. Outgassing of CO2 was as much as 271% higher overnight. However, it was substantially lower during the day, making the lake switch from a source of CO2 to a sink and resulting in a potential mischaracterization of lakes. These findings highlight the importance of standardizing field measurement time in aquatic CO2 research to improve carbon accounting of inland waters. While the variability across trophic status, geographic location, and topography is yet to be determined, the results from this study are inferable to dissolved carbon dioxide dynamics in similar aquatic systems around the world. Future studies may employ this strategy to determine variability across lake systems, determining amplification factors for lakes in a variety of geographical locations or trophic states, still, diel sampling may help to constrain the role of lakes in the carbon budget.
Author Contributions
L.P., data curation, formal analysis, investigation, methodology, writing—original draft, and writing—review and editing; Y.X., conceptualization, data curation, funding acquisition, methodology, project administration, supervision, writing—original draft, and writing—review and editing; J.S., data curation, investigation, funding acquisition, and writing—review and editing. All authors have read and agreed to the published version of the manuscript.
Funding
This study was partially supported by a U.S. Department of Agriculture Hatch Fund project (Project#: LAB94459), a Wilbert’s Sons Undergraduate Research Internship, and a Millard Perkins Undergraduate Research Grant.
Data Availability Statement
Data will be made available on request.
Acknowledgments
This study was partially supported by several graduate students who assisted with previous field sampling and data collection, including Zhen Xu, Rongjie Yang, and Xiaoyue Ni, for which the authors are thankful. The authors are also thankful to the academic editor and three anonymous reviewers for their valuable feedback and suggestions, which were helpful in improving the quality and readability of this article.
Conflicts of Interest
The authors declare no conflict of interest.
References
- Verpoorter, C.; Kutser, T.; Seekell, D.A.; Tranvik, L.J. A global inventory of lakes based on high–resolution satellite imagery. Geophys. Res. Lett. 2014, 41, 6396–6402. [Google Scholar]
- Raymond, P.A.; Hartmann, J.; Lauerwald, R.; Sobek, S.; McDonald, C.; Hoover, M.; Guth, P. Global carbon dioxide emissions from inland waters. Nature 2013, 503, 355–359. [Google Scholar] [PubMed]
- Holgerson, M.A.; Raymond, P.A. Large contribution to inland water CO2 and CH4 emissions from very small ponds. Nat. Geosci. 2016, 9, 222–226. [Google Scholar]
- DelSontro, T.; Beaulieu, J.J.; Downing, J.A. Greenhouse gas emissions from lakes and impoundments: Upscaling in the face of global change. Limnol. Oceanogr. Lett. 2018, 3, 64–75. [Google Scholar]
- Duan, H.; Xiao, Q.; Qi, T. Measuring lake carbon dioxide from space: Opportunities and challenges. Innov. Geosci. 2023, 1, 100025. [Google Scholar]
- Lauerwald, R.; Allen, G.H.; Deemer, B.R.; Liu, S.; Maavara, T.; Raymond, P.; Alcott, L.; Bastviken, D.; Hastie, A.; Holgerson, M.A.; et al. Inland water greenhouse gas budgets for RECCAP2: 2. Regionalization and homogenization of estimates. Glob. Biogeochem. Cycles 2023, 37, e2022GB007658. [Google Scholar]
- Rudberg, D.; Duc, N.T.; Schenk, J.; Sieczko, A.K.; Pajala, G.; Sawakuchi, H.O.; Verheijen, H.A.; Melack, J.M.; MacIntyre, S.; Karlsson, J.; et al. Diel variability of CO2 emissions from northern lakes. J. Geophys. Res. Biogeosci. 2021, 126, e2021JG006246. [Google Scholar]
- Borges, A.V.; Deirmendjian, L.; Bouillon, S.; Okello, W.; Lambert, T.; Roland, F.A.; Razanamahandry, V.F.; Voarintsoa, N.R.G.; Darchambeau, F.; Kimirei, I.A.; et al. Greenhouse gas emissions from African lakes are no longer a blind spot. Sci. Adv. 2022, 8, eabi8716. [Google Scholar]
- Xu, Y.J.; Xu, Z.; Yang, R. Rapid daily change in surface water pCO2 and CO2 evasion: A case study in a subtropical eutrophic lake in Southern USA. J. Hydrol. 2019, 570, 486–494. [Google Scholar]
- Yang, R.; Xu, Z.; Liu, S.; Xu, Y.J. Daily pCO2 and CO2 flux variations in a subtropical mesotrophic shallow lake. Water Res. 2019, 153, 29–38. [Google Scholar]
- Marotta, H.; Duarte, C.M.; Sobek, S.; Enrich-Prast, A. Large CO2 disequilibria in tropical lakes. Glob. Biogeochem. Cycles 2009, 23, GB4022. [Google Scholar]
- Cole, J.J.; Caraco, N.F.; Kling, G.W.; Kratz, T.K. Carbon dioxide supersaturation in the surface waters of lakes. Science 1994, 265, 1568–1570. [Google Scholar] [PubMed]
- Potter, L.; Xu, Y.J. Can a eutrophic lake function as a carbon sink? Case study of a subtropical eutrophic lake in southern USA. J. Hydrol. 2023, 625, 130071. [Google Scholar]
- Maberly, S.C. Diel, episodic and seasonal changes in pH and concentrations of inorganic carbon in a productive lake. Freshw. Biol. 1996, 35, 579–598. [Google Scholar]
- Golub, M.; Koupaei-Abyazani, N.; Vesala, T.; Mammarella, I.; Ojala, A.; Bohrer, G.; Weyhenmeyer, G.A.; Blanken, P.D.; Eugster, W.; Koebsch, F.; et al. Diel, seasonal, and inter-annual variation in carbon dioxide effluxes from lakes and reservoirs. Environ. Res. Lett. 2023, 18, 034046. [Google Scholar]
- Klaus, M.; Seekell, D.A.; Lidberg, W.; Karlsson, J. Evaluations of climate and land management effects on lake carbon cycling need to account for temporal variability in CO2 concentrations. Glob. Biogeochem. Cycles 2019, 33, 243–265. [Google Scholar]
- Golub, M.; Desai, A.R.; McKinley, G.A.; Remucal, C.K.; Stanley, E.H. Large uncertainty in estimating pCO2 from carbonate equilibria in lakes. J. Geophys. Res. Biogeosci. 2017, 122, 2909–2924. [Google Scholar]
- Whitfield, C.; Aherne, J.; Watmough, S. Predicting the partial pressure of carbon dioxide in boreal lakes. Can. Water Resour. J. 2009, 34, 415–426. [Google Scholar]
- Abril, G.; Bouillon, S.; Darchambeau, F.; Teodoru, C.R.; Marwick, T.R.; Tamooh, F.; Geeraert, N.; Deirmendjian, L.; Polsenaere, P.; Borges, A.V. Large overestimation of pCO2 calculated from pH and alkalinity in acidic, organic-rich freshwaters. Biogeosciences 2015, 12, 67–78. [Google Scholar]
- Hunt, C.W.; Salisbury, J.E.; Vandemark, D. Contribution of non-carbonate anions to total alkalinity and overestimation of pCO2 in New England and New Brunswick rivers. Biogeosciences 2011, 8, 3069–3076. [Google Scholar]
- Miah, O.; Roy, A.; Sakib, A.A.; Niloy, N.M.; Haque, M.M.; Shammi, M.; Tareq, S.M. Diel and seasonal variations of pCO2 and fluorescent dissolved organic matter (FDOM) in different polluted lakes. Environ. Sci. Pollut. Res. 2023, 30, 92720–92735. [Google Scholar] [CrossRef] [PubMed]
- Wang, Y.; Ma, B.; Shen, S.; Zhang, Y.; Ye, C.; Jiang, H.; Li, S. Diel variability of carbon dioxide concentrations and emissions in a largest urban lake, Central China: Insights from continuous measurements. Sci. Total Environ. 2024, 912, 168987. [Google Scholar] [CrossRef] [PubMed]
- Yang, R.; Chen, Y.; Li, D.; Qiu, Y.; Lu, K.; Liu, S.; Song, H. Significant Daily CO2 Source–Sink Interchange in an Urbanizing Lake in Southwest China. Water 2023, 15, 3365. [Google Scholar] [CrossRef]
- Oliver, S.; Corburn, J.; Ribeiro, H. Challenges regarding water quality of eutrophic reservoirs in urban landscapes: A mapping literature review. Int. J. Environ. Res. Public Health 2019, 16, 40. [Google Scholar] [CrossRef]
- Yuan, D.; Xu, Y.J.; Ma, S.; Zhang, K.; Miao, R.; Li, S. Nitrogen addition effect overrides warming effect on dissolved CO2 and phytoplankton structure in shallow lakes. Water Res. 2023, 244, 120437. [Google Scholar] [CrossRef]
- Tonetta, D.; Staehr, P.A.; Petrucio, M.M. Changes in CO2 dynamics related to rainfall and water level variations in a subtropical lake. Hydrobiologia 2017, 794, 109–123. [Google Scholar]
- Marotta, H.; Duarte, C.M.; Pinho, L.; Enrich-Prast, A. Rainfall leads to increased pCO2 in Brazilian coastal lakes. Biogeosciences 2010, 7, 1607–1614. [Google Scholar]
- Xu, Y.J.; Mesmer, R.Y.A.N. The dynamics of dissolved oxygen and metabolic rates in a shallow subtropical urban lake, Louisiana, USA. In Understanding Freshwater Quality Problems in a Changing World; IAHS Publication: Wallingford, UK, 2013; Volume 361, pp. 212–219. [Google Scholar]
- Xu, Z.; Xu, Y.J. Determination of trophic state changes with diel dissolved oxygen: A case study in a shallow lake. Water Environ. Res. 2015, 87, 1970–1979. [Google Scholar] [CrossRef]
- Xu, Z.; Xu, Y.J. Rapid field estimation of biochemical oxygen demand in a subtropical eutrophic urban lake with chlorophyll a fluorescence. Environ. Monit. Assess. 2015, 187, 4171. [Google Scholar] [CrossRef]
- Cai, W.J.; Wang, Y. The chemistry, fluxes, and sources of carbon dioxide in the estuarine waters of the Satilla and Altamaha Rivers, Georgia. Limnol. Oceanogr. 1998, 43, 657–668. [Google Scholar] [CrossRef]
- Katul, G.; Liu, H. Multiple mechanisms generate a universal scaling with dissipation for the air-water gas transfer velocity. Geophys. Res. Lett. 2017, 44, 1892–1898. [Google Scholar]
- Weiss, R. Carbon dioxide in water and seawater: The solubility of a non-ideal gas. Mar. Chem. 1974, 2, 203–215. [Google Scholar]
- Jähne, B.; Heinz, G.; Dietrich, W. Measurement of the diffusion coefficients of sparingly soluble gases in water. J. Geophys. Res. Oceans 1987, 92, 10767–10776. [Google Scholar]
- Guérin, F.; Abril, G.; Serça, D.; Delon, C.; Richard, S.; Delmas, R.; Tremblay, A.; Varfalvy, L. Gas transfer velocities of CO2 and CH4 in a tropical reservoir and its river downstream. J. Mar. Syst. 2007, 66, 161–172. [Google Scholar]
- Wanninkhof, R. Relationship between wind speed and gas exchange over the ocean revisited. Limnol. Oceanogr. Methods 2014, 12, 351–362. [Google Scholar]
- Cole, J.J.; Caraco, N.F. Atmospheric exchange of carbon dioxide in a low-wind oligotrophic lake measured by the addition of SF6. Limnol. Oceanogr. 1998, 43, 647–656. [Google Scholar]
- Drake, T.W.; Raymond, P.A.; Spencer, R.G.M. Terrestrial carbon inputs to inland waters: A current synthesis of estimates and uncertainty. Limnol. Oceanogr. Lett. 2018, 3, 132–142. [Google Scholar]
- Qi, T.C.; Shen, M.; Luo, J.H.; Xiao, Q.T.; Liu, D.; Duan, H.T. Spatiotemporal heterogeneity of lake carbon dioxide flux leads to substantial uncertainties in regional upscaling estimates. Sci. Total Environ. 2024, 948, 174920. [Google Scholar]
- Wen, Z.D.; Shang, Y.X.; Lyu, L.; Tao, H.; Liu, G.; Fang, C.; Li, S.J.; Song, K.S. Re-estimating China’s lake CO2 flux considering spatiotemporal variability. Environ. Sci. Ecotechnol. 2024, 19, 100337. [Google Scholar]
- Sobek, S.; Tranvik, L.J.; Cole, J.J. Temperature independence of carbon dioxide supersaturation in global lakes. Glob. Biogeochem. Cycles 2005, 19, GB2003. [Google Scholar]
- Kosten, S.; Roland, F.; Da Motta Marques, D.M.; Van Nes, E.H.; Mazzeo, N.; Sternberg, L.D.S.; Cole, J.J. Climate-dependent CO2 emissions from lakes. Glob. Biogeochem. Cycles 2010, 24, GB2007. [Google Scholar] [CrossRef]
- Jonsson, A.; Aberg, J.; Jansson, M. Variations in pCO2 during summer in the surface water of an unproductive lake in northern Sweden. Tellus B Chem. Phys. Meteorol. 2007, 59, 797–803. [Google Scholar]
- Xu, Z.; Xu, Y.J. A deterministic model for predicting hourly dissolved oxygen change: Development and application to a shallow eutrophic lake. Water 2016, 8, 41. [Google Scholar] [CrossRef]
- Morales-Pineda, M.; Cózar, A.; Laiz, I.; Úbeda, B.; Gálvez, J.Á. Daily, biweekly, and seasonal temporal scales of pCO2 variability in two stratified Mediterranean reservoirs. J. Geophys. Rese. Biogeosci. 2014, 119, 509–520. [Google Scholar] [CrossRef]
- Pace, M.L.; Prairie, Y.T. Respiration in lakes. Respir. Aquat. Ecosyst. 2005, 1, 103–122. [Google Scholar]
- Hanson, P.C.; Bade, D.L.; Carpenter, S.R.; Kratz, T.K. Lake metabolism: Relationships with dissolved organic carbon and phosphorus. Limnol. Oceanogr. 2003, 48, 1112–1119. [Google Scholar] [CrossRef]
- Katkov, E.; Fussmann, G.F. The effect of increasing temperature and pCO2 on experimental pelagic freshwater communities. Limnol. Oceanogr. 2023, 68, S202–S216. [Google Scholar] [CrossRef]
- Reis, P.C.J.; Barbosa, F.A.R. Diel sampling reveals significant variation in CO2 emission from a tropical productive lake. Braz. J. Biol. 2014, 74 (Suppl. S1), S113–S119. [Google Scholar] [CrossRef]
- Lapierre, J.F.; Seekell, D.A.; Filstrup, C.T.; Collins, S.M.; Emi Fergus, C.; Soranno, P.A.; Cheruvelil, K.S. Continental-scale variation in controls of summer CO2 in United States lakes. J. Geophys. Res. Biogeosci. 2017, 122, 875–885. [Google Scholar] [CrossRef]
- Seekell, D.A.; Gudasz, C. Long-term pCO2 trends in Adirondack Lakes. Geophys. Res. Lett. 2016, 43, 5109–5115. [Google Scholar]
- Nydahl, A.C.; Wallin, M.B.; Weyhenmeyer, G.A. No long-term trends in pCO2 despite increasing organic carbon concentrations in boreal lakes, streams, and rivers. Glob. Biogeochem. Cycles 2017, 31, 985–995. [Google Scholar]
- Couturier, M.; Prairie, Y.T.; Paterson, A.M.; Emilson, E.J.S.; del Giorgio, P.A. Long-term trends in pCO2 in lake surface water following rebrowning. Geophys. Res. Lett. 2022, 49, e2022GL097973. [Google Scholar]
Disclaimer/Publisher’s Note: The statements, opinions and data contained in all publications are solely those of the individual author(s) and contributor(s) and not of MDPI and/or the editor(s). MDPI and/or the editor(s) disclaim responsibility for any injury to people or property resulting from any ideas, methods, instructions or products referred to in the content. |
© 2025 by the authors. Licensee MDPI, Basel, Switzerland. This article is an open access article distributed under the terms and conditions of the Creative Commons Attribution (CC BY) license (https://creativecommons.org/licenses/by/4.0/).