1. Introduction
Agriculture plays a fundamental role in ensuring food security and economic stability worldwide [
1,
2]. With the global population continuously increasing, the demand for agricultural products is rising, making efficient land use a crucial component of sustainable development [
3,
4]. However, arable land is limited, and ecological conditions impose significant constraints on crop cultivation in many regions [
5]. Climate change, soil degradation, and water scarcity further exacerbate these challenges, highlighting the need for sustainable agricultural practices [
6,
7]. To address these issues, advancements in seed breeding, mechanization, and soil fertility management have been implemented, enhancing productivity and resilience. Among these strategies, selecting optimal locations for crop cultivation remains one of the most effective methods to maximize agricultural yield while ensuring long-term sustainability and food security [
8,
9].
Wheat, as a staple food crop, holds a critical position in global agriculture. It serves as the primary food source for over three billion people worldwide [
10,
11,
12]. Due to its strategic importance, wheat is cultivated extensively in more than 70 countries, using both irrigated and rainfed methods [
13]. Rainfed wheat farming is particularly crucial in regions facing water scarcity, where sustainable agricultural practices are essential for maintaining food security [
14,
15]. Countries such as China, India, the United States, and Russia play significant roles in global wheat production, each employing diverse agronomic strategies to optimize yield [
16,
17]. In the Middle East, Iran is the second-largest wheat producer, with an annual average production of 14.5 million tons based on a five-year average from 2016 to 2020. More than half of Iran’s cultivated land is allocated to wheat, with rainfed farming being the dominant method [
18].
Rainfed wheat cultivation is particularly vital for efficient water resource management [
19,
20,
21]. Unlike irrigated farming, which relies heavily on artificial water supply, rainfed wheat depends on natural precipitation, making it a sustainable alternative in water-scarce regions. The proper management of rainfed farming can significantly contribute to reducing water consumption, while ensuring food security. Many countries facing arid and semi-arid conditions have adopted strategies to enhance rainfed wheat productivity through improved soil moisture conservation techniques, drought-resistant cultivars, and precision agriculture methods [
22]. As climate change intensifies water scarcity worldwide, the role of rainfed agriculture in sustaining global food production becomes increasingly crucial [
23].
Evaluating homogeneous areas for rainfed wheat yield is essential for enhancing agricultural productivity and sustainability [
24,
25,
26]. Various methods, including remote sensing, Geographic Information Systems (GISs), and spatial multi-criteria decision analysis (SMCDA), have been employed to assess land suitability for crop cultivation [
27,
28,
29]. These techniques facilitate the identification of optimal locations by integrating multiple environmental and socioeconomic factors [
30]. Remote sensing provides valuable data on land surface characteristics, while GISs enable the spatial analysis and visualization of these factors [
31,
32,
33]. SMCDA further supports decision-making by systematically weighing different criteria, reducing uncertainty, and ensuring that land-use decisions are both data-driven and holistic. The integration of SMCDA allows for a more structured evaluation of diverse agricultural conditions, making it a crucial tool in sustainable farming practices, particularly in regions with variable climatic and soil conditions.
Several studies have explored land suitability for wheat cultivation using advanced spatial analysis techniques. Zampieri et al. [
34] studied the effects of various parameters on wheat yield from 1980 to 2010. This study found that heat stress and drought were the primary factors affecting rainfed wheat, while excess water also had a negative impact on rainfed wheat. Herzberg et al. [
35] examined land suitability for potential agricultural land-use types in the hilly region of central Vietnam using multi-criteria decision-making. In this study, participatory rural assessment, the analytic hierarchy process (AHP), GIS, and SMCDA were employed to assess land use. The findings showed that five crops—rice, cassava, acacia, banana, and rubber—had high potential for cultivation in the region. Mohammed et al. [
28] investigated the suitability of land for rainfed wheat cultivation in the Al-Armouk watershed, Syria, using an SMCDA integrated with a GIS. The study utilized soil characteristics, climate data with a 30 m resolution, and a digital elevation model (DEM) to conduct a comprehensive land evaluation. The results revealed that 23.8% of the area was classified as highly suitable for rainfed wheat farming, emphasizing the critical role of topographic factors in optimizing wheat production under rainfed conditions. Orhan [
36] applied a GIS-based multi-criteria analysis to assess land suitability for citrus cultivation in Mersin, Turkey. The study analyzed 14 preferred and 10 exclusion factors, highlighting the importance of global climate data in land suitability assessments. The findings emphasized that citrus cultivation is highly dependent on climatic conditions, reinforcing the significance of integrating climate data into agricultural land evaluations. Aymen et al. [
37] examined agricultural land suitability in Jordan’s Mafraq Governorate using remote sensing techniques and a GIS. Their study analyzed the most suitable locations for rainfed and irrigated crop cultivation based on five key parameters: precipitation, temperature, slope, soil type, and water well distribution. The weighted overlay analysis classified land suitability into four categories: currently unsuitable (NS), somewhat suitable (S3), moderately suitable (S2), and highly suitable (S1), following the FAO framework. The results indicated that only 0.2% and 1.4% of the governorate’s total area were suitable for rainfed and irrigated cultivation, respectively, primarily due to low soil fertility and severe water scarcity.
In Iran, wheat is cultivated through both rainfed and irrigated methods, making the country the second-largest wheat producer in the Middle East, with an annual average production of 14.5 million tons from 2016 to 2020. More than half of the cultivated land is dedicated to wheat farming, with rainfed agriculture being the predominant method. Kurdistan province is one of the key regions for rainfed wheat cultivation, ranking second in Iran in terms of cultivated area. This province plays a crucial role in ensuring sustainable food security in Iran. Identifying homogeneous zones with similar yield potential can enhance agricultural planning, crop insurance, and yield prediction models, ultimately improving resource management and long-term sustainability.
Despite extensive research on land suitability for rainfed wheat cultivation, limited attention has been given to evaluating the homogeneity of these areas in terms of crop yield. Identifying homogeneous zones with a similar yield potential remains a critical gap in current studies, offering opportunities for more precise agricultural planning and resource management. This study aims to introduce a new approach for evaluating homogeneous areas for rainfed wheat yield. By integrating remote sensing, GIS, and SMCDA, the research seeks to identify regions with a similar yield potential, facilitating better decision-making for agricultural stakeholders. The findings of this study will support the optimization of wheat production, enhance resource allocation efficiency, and strengthen food security in Iran and globally.
2. Study Area
Kurdistan province is located in western Iran, covering an area of about 29,619 km
2. It lies between 34°44′ N and 36°30′ N latitude and 45°31′ E to 48°16′ E longitude. According to the latest national census data from 2016, the population of Kurdistan province is 1,603,111 people, with 30% employed in the agricultural sector. This is significantly higher than the national average of 12%, highlighting the importance of the agricultural sector in this province. The climate of Kurdistan is diverse and classified into four distinct types according to the De Martonne method: semi-arid, Mediterranean, humid, and very humid [
38,
39]. The De Martonne index, which combines precipitation and temperature data, provides a clear framework for understanding the suitability of climates for agriculture. For example, areas classified as semi-arid may experience lower yields due to water stress, while humid areas may achieve higher yields. This classification can help target agricultural practices and improve yield predictions in rainfed systems.
Kurdistan’s topography is marked by valleys, plains, and highlands, creating significant elevation differences that also influence the climate. Weather currents influenced by the Atlantic Ocean and Mediterranean Sea collide with the Zagros highlands as they pass through Kurdistan, losing much of their moisture as rain and snow. As a result, Kurdistan is one of the few provinces in Iran with an average annual rainfall of over 450 mm, making it suitable for rainfed wheat cultivation. Kurdistan ranks second among Iranian provinces for rainfed wheat cultivation. According to statistics from the Ministry of Agricultural Jihad, more than 87% of the province’s agricultural production is rainfed, and over 85% of its arable land is cultivated using rainfed methods, with more than 90% of this being rainfed wheat. However, the mountainous nature of the region presents challenges for wheat cultivation, as the sharp drops in minimum temperatures during certain times of the year cause frostbite and damage to the plants. Additionally, the steep slopes and high altitudes in some areas have led farmers to prefer gardening over farming using rainfed and irrigated methods. A more detailed illustration of the geographical location of the study area is provided in
Figure 1. This province, with its diverse climate and geography, offers a unique setting for various environmental studies and research.
3. Data and Methods
3.1. Data
In this study, the identification of homogeneous agricultural areas was based on key parameters that influence the growth and yield of rainfed wheat. The approach incorporated insights from previous research and expert opinions in the field. The data used include several environmental and soil factors that affect the plant’s development at various phenological stages. These factors include precipitation and temperature during each growth stage, soil characteristics (such as soil texture, pH, cation exchange capacity (CEC), calcium carbonate (CaCO₃), and organic carbon (OC)), and topographical attributes, including slope and elevation. Additionally, to delineate agricultural areas, global land cover data from the European Space Agency for 2021 were also incorporated.
Table 1 provides an overview of the data sources and the spatial accuracy of the data used in this study.
3.1.1. Climatic Data
Eleven water and meteorological stations were employed to calculate the planting date and growth degree days (GDDs) for the analysis (
Table 2). These stations were distributed across the province, with elevations ranging from 1500 m at the Sanandaj and Bijar stations to 2181 m at the Zarineh station, the highest point. Data collected from these stations between 2018 and 2021 were used to calculate the planting date and GDDs. However, due to the limited number of stations and the relatively low accuracy of their interpolation, satellite imagery was used to supplement the data and improve precision. Satellite data were preferred for estimating precipitation and temperature over ground-based weather station data for several reasons. First, Kurdistan province has highly heterogeneous topography, which causes significant climatic variations across the region. Ground stations, being distantly located from each other, may not accurately represent temperature and precipitation conditions across the entire province. Moreover, some stations lacked long-term statistical data, and errors identified in the records rendered some stations unreliable. To verify the accuracy of satellite data, stations with high accuracy, such as the Sanandaj station, were used as a reference.
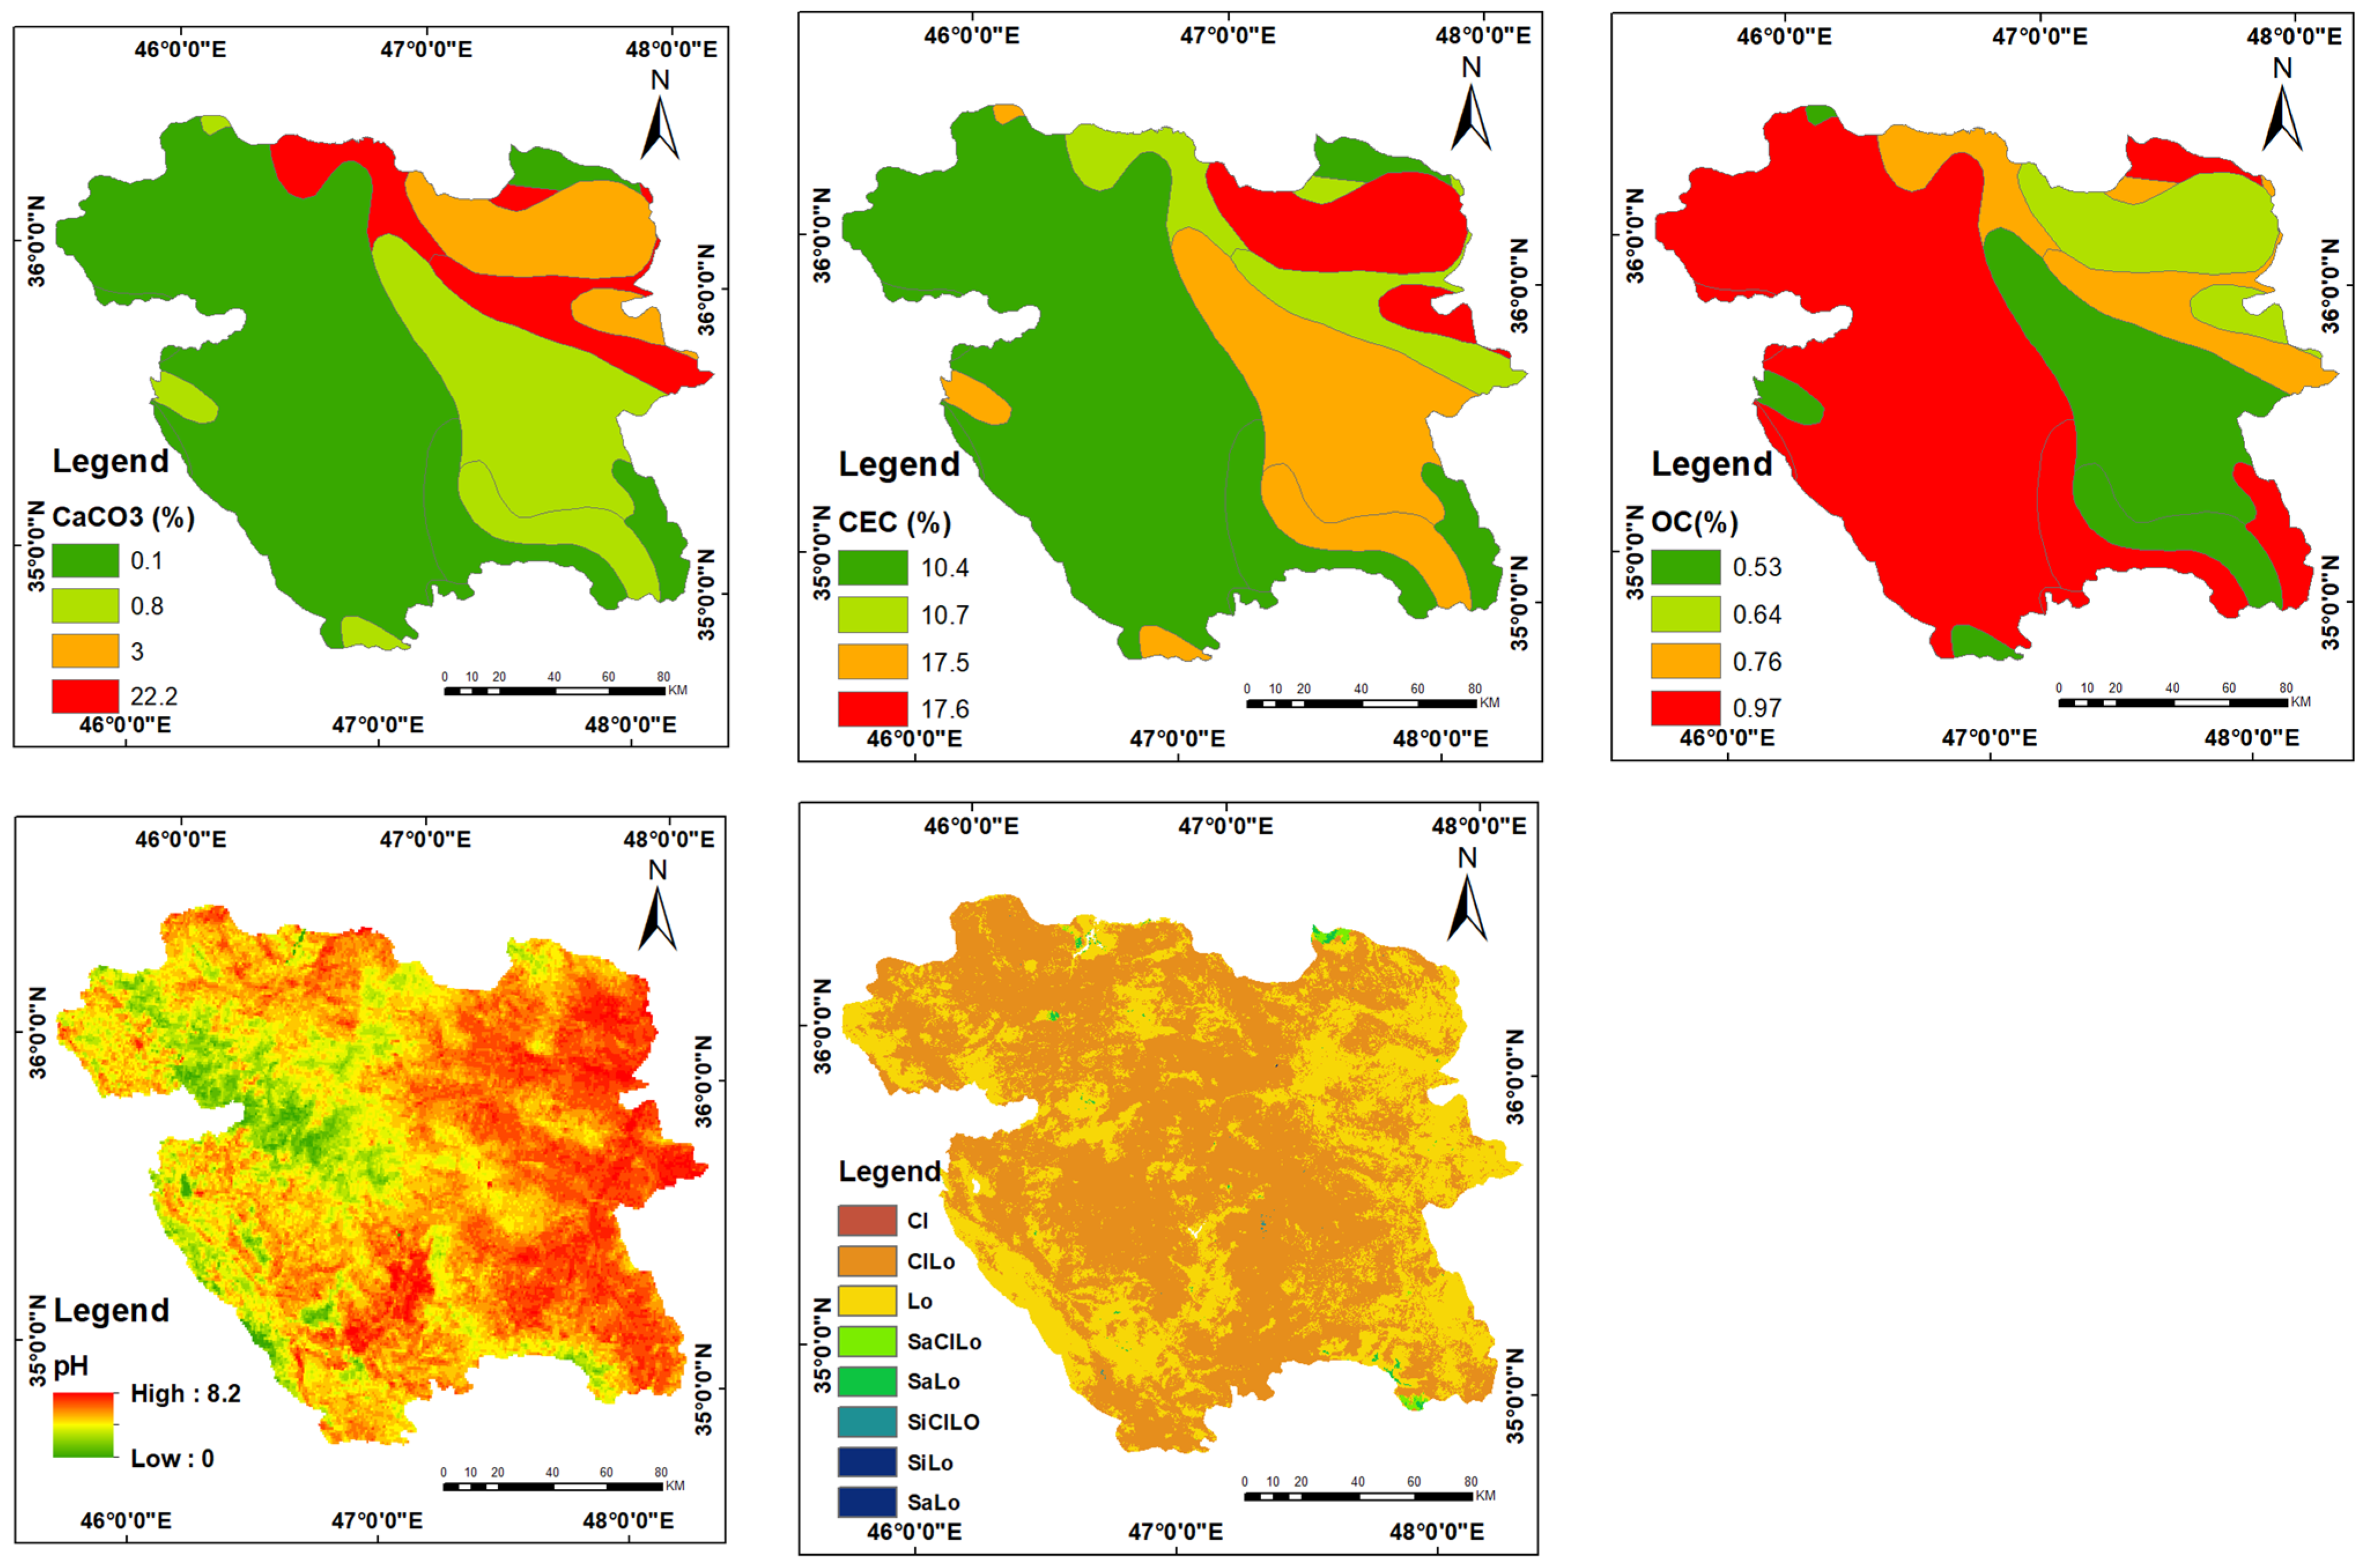
3.1.2. Soil Data
In this study, to identify homogeneous agricultural areas, the physical and chemical properties of the soil in the region were analyzed. Soil texture and pH data were sourced from the United States Department of Agriculture (USDA), while additional data on CEC, CaCO
3, pH, and OC were obtained from FAO publications (
Figure 2). For rainfed wheat cultivation, the ideal soil pH range is between 6 and 7, with a CEC greater than 24. The optimal soil textures for wheat cultivation are loam (L), sandy loam (SL), and silty clay (SiCL). In addition, the best OC content for wheat farming is considered to be above 2%, while calcium carbonate content should be less than 10%.
3.1.3. Topographic Data
To analyze elevation changes and calculate slope, a digital elevation model (DEM) from the SRTM sensor with a 30 m resolution was used.
Figure 3 illustrates the elevation and slope maps across Kurdistan province. The ideal elevation range for rainfed wheat cultivation is between 1500 m and 1700 m. Additionally, wheat can be cultivated on slopes of up to 15 degrees, with steeper slopes presenting cultivation challenges.
3.1.4. Crop Yield Data
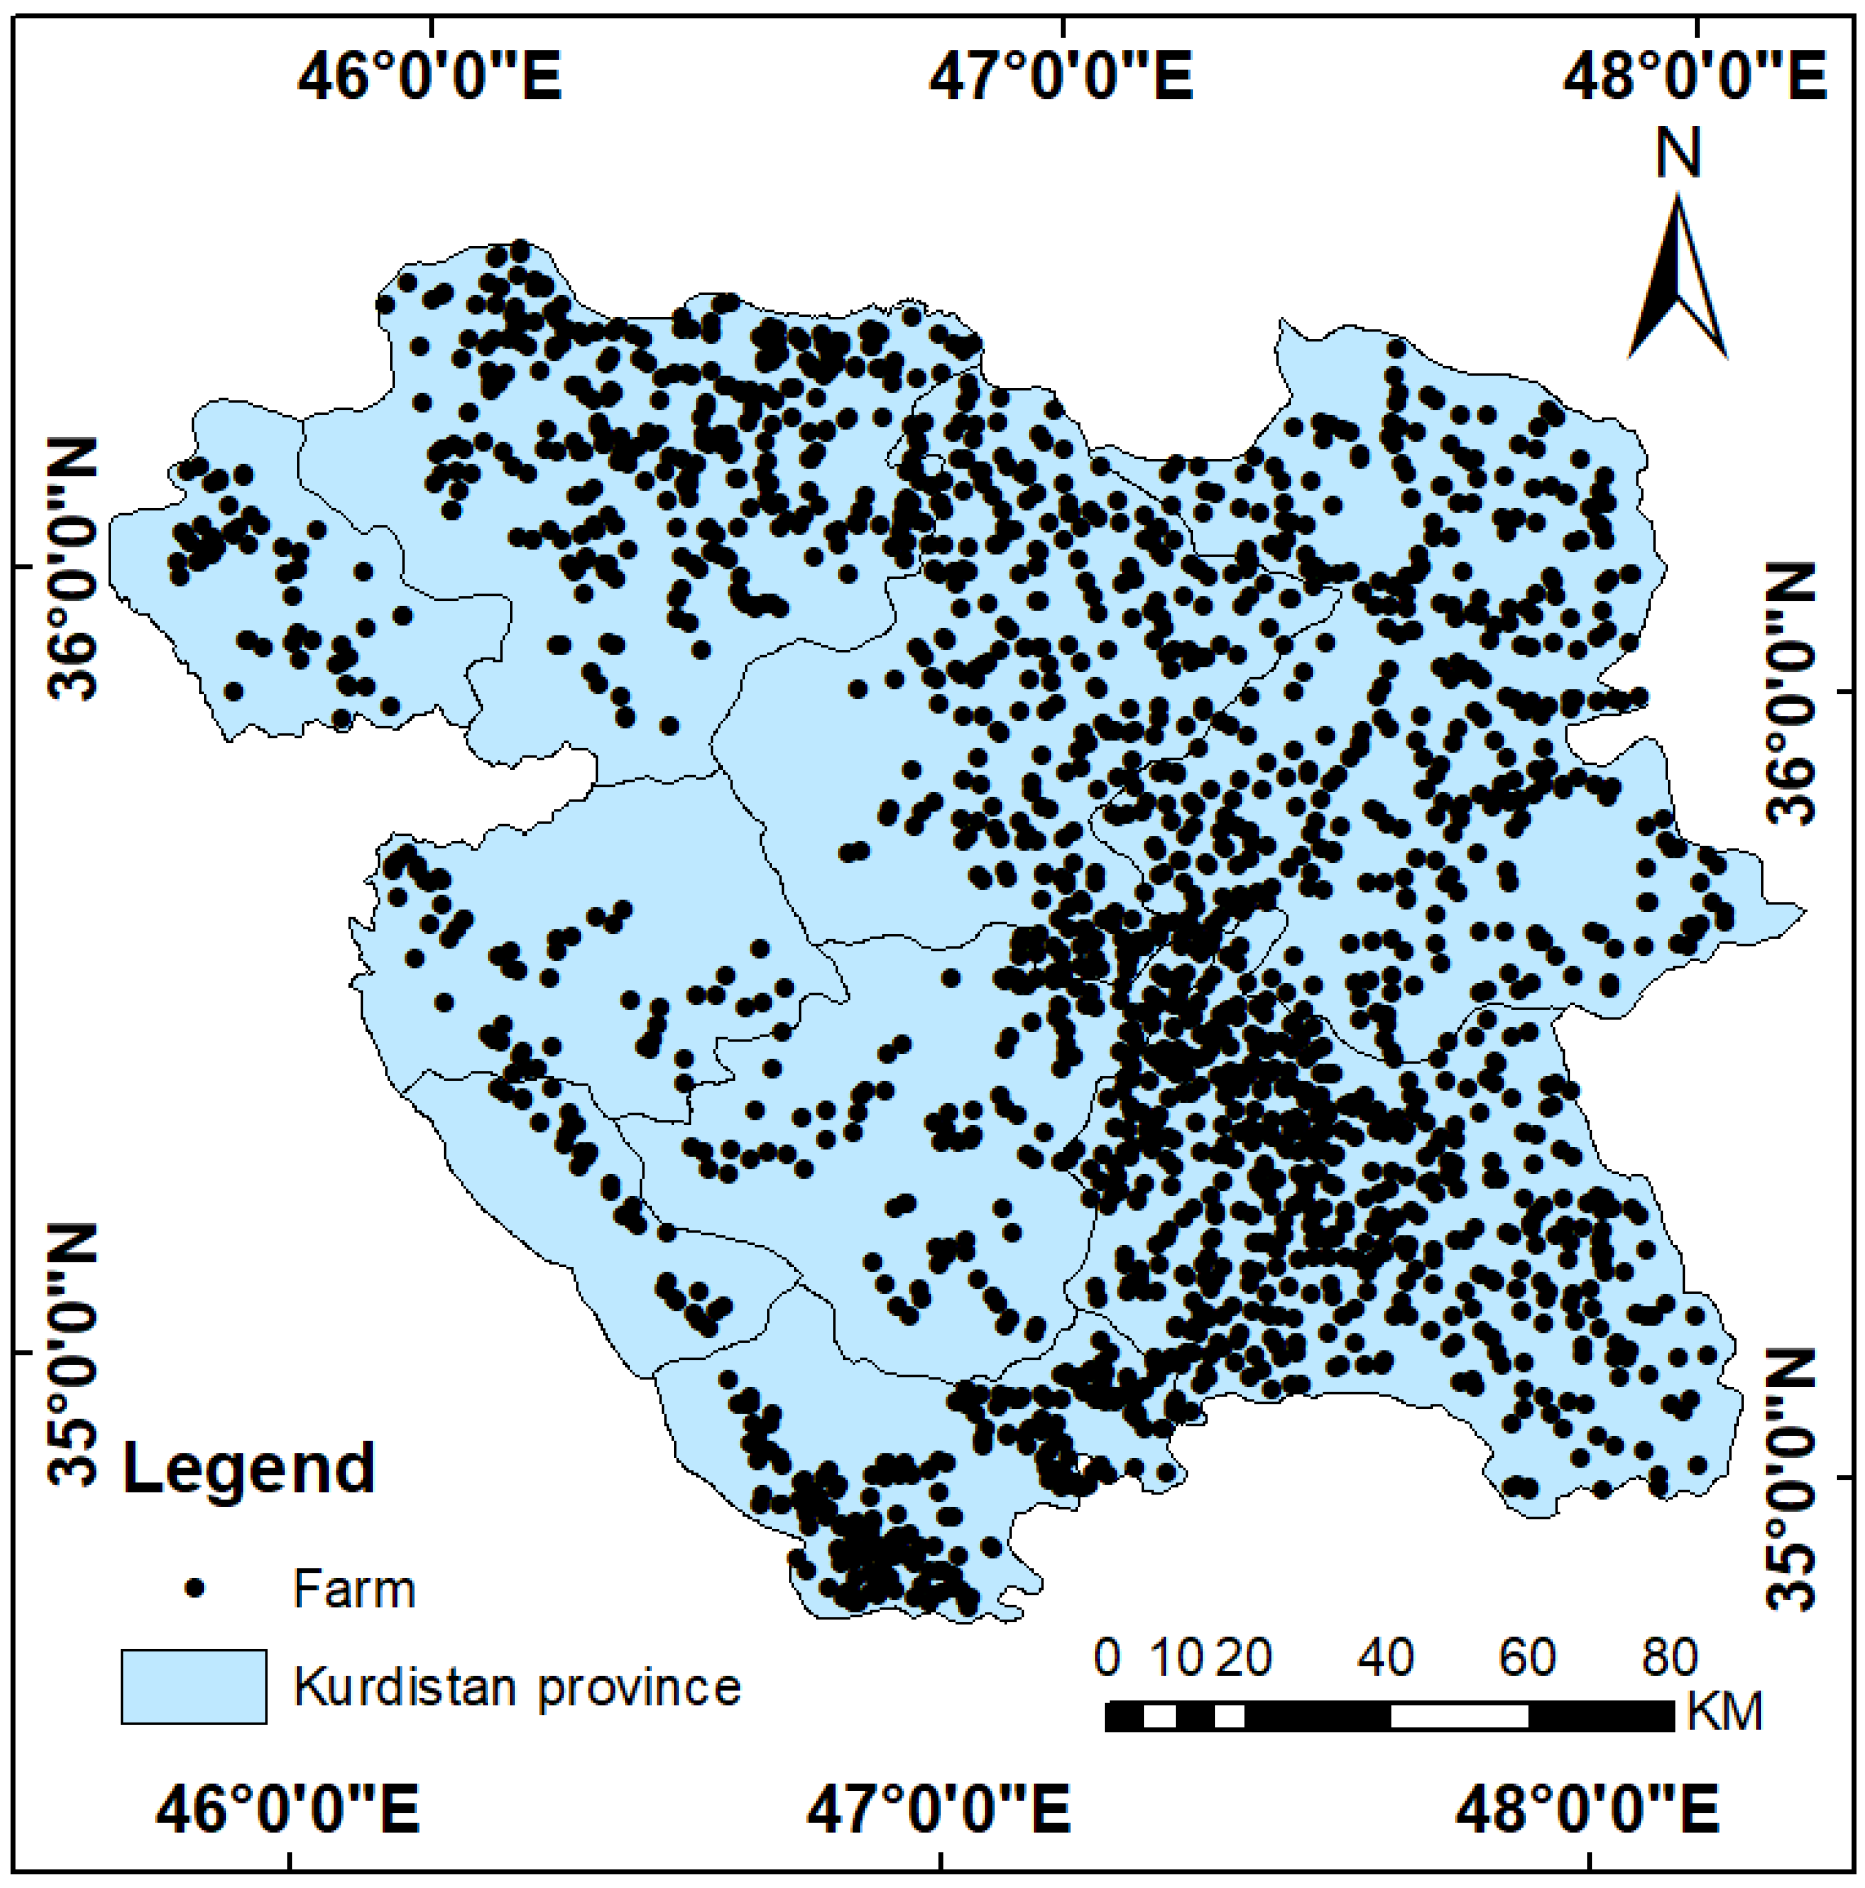
The data on the location and performance of approximately 2000 wheat farms in Kurdistan province from 2019 to 2021 were obtained from the Agricultural Jihad Organization. Statistical information related to crop yield at the farm level is presented in
Table 3, while the location of the farms across the entire province is shown in
Figure 4. The dataset includes wheat yield information from farms over different years. For instance, in the 2018–2019 period, the average yield was 1175 kg·hm
−2, with a minimum of 100 kg·hm
−2 and a maximum of 2757 kg·hm
−2. The highest number of farms was recorded in 2019–2020, totaling 979, with an average yield of 1308 kg·hm
−2. The year 2020–2021 saw a significant decrease in average yield, dropping to 518 kg·hm
−2.
3.2. Methods
3.2.1. Calculation of Crop Sowing Date
In this research, 11 water and meteorological stations across the province were sourced from the website of the Iran Water and Meteorology Organization. To calculate the crop production date for each station, it was determined that, given the semi-arid climate of the region, October should be the optimal month for planting. This month must meet two conditions: temperatures should range between 8 and 14 °C, and total rainfall should be at least 5 mm, with no drought conditions for the subsequent 15 days. In the next step, Weibull’s formula was applied to calculate the probability of the occurrence of weather patterns, which is considered more accurate than other formulas.
Table 4 shows the crop production date based on Eshtern’s first definition and the planting date suggested by the Weibull formula, calculated with a 70% probability. The Weibull formula is expressed as follows:
where
P represents the probability of occurrence,
m is the rank number, and
n is the total number of data points.
3.2.2. Calculation of Growing Degree Days (GDDs)
After determining the planting date, the time required for the plant to reach each phenological stage was calculated using the GDD method. The GDD method is used to assess the plant’s thermal requirements at different growth stages. The calculation is performed as follows:
where
Tmax is the maximum daily temperature,
Tmin is the minimum daily temperature, and
Tbase is the base temperature.
In this study, the base temperature for wheat is set at 4.5 °C, according to the recommendation of Nuttonson and Relationships [
40]. The three main phenological stages for wheat—germination, flowering, and seed filling—were used in this study. The thermal requirements of the plant were determined as follows: (1) from planting to germination: 150 GDDs, (2) from planting to flowering: 1350 GDDs, and (3) from planting to seed filling: 2300 GDDs.
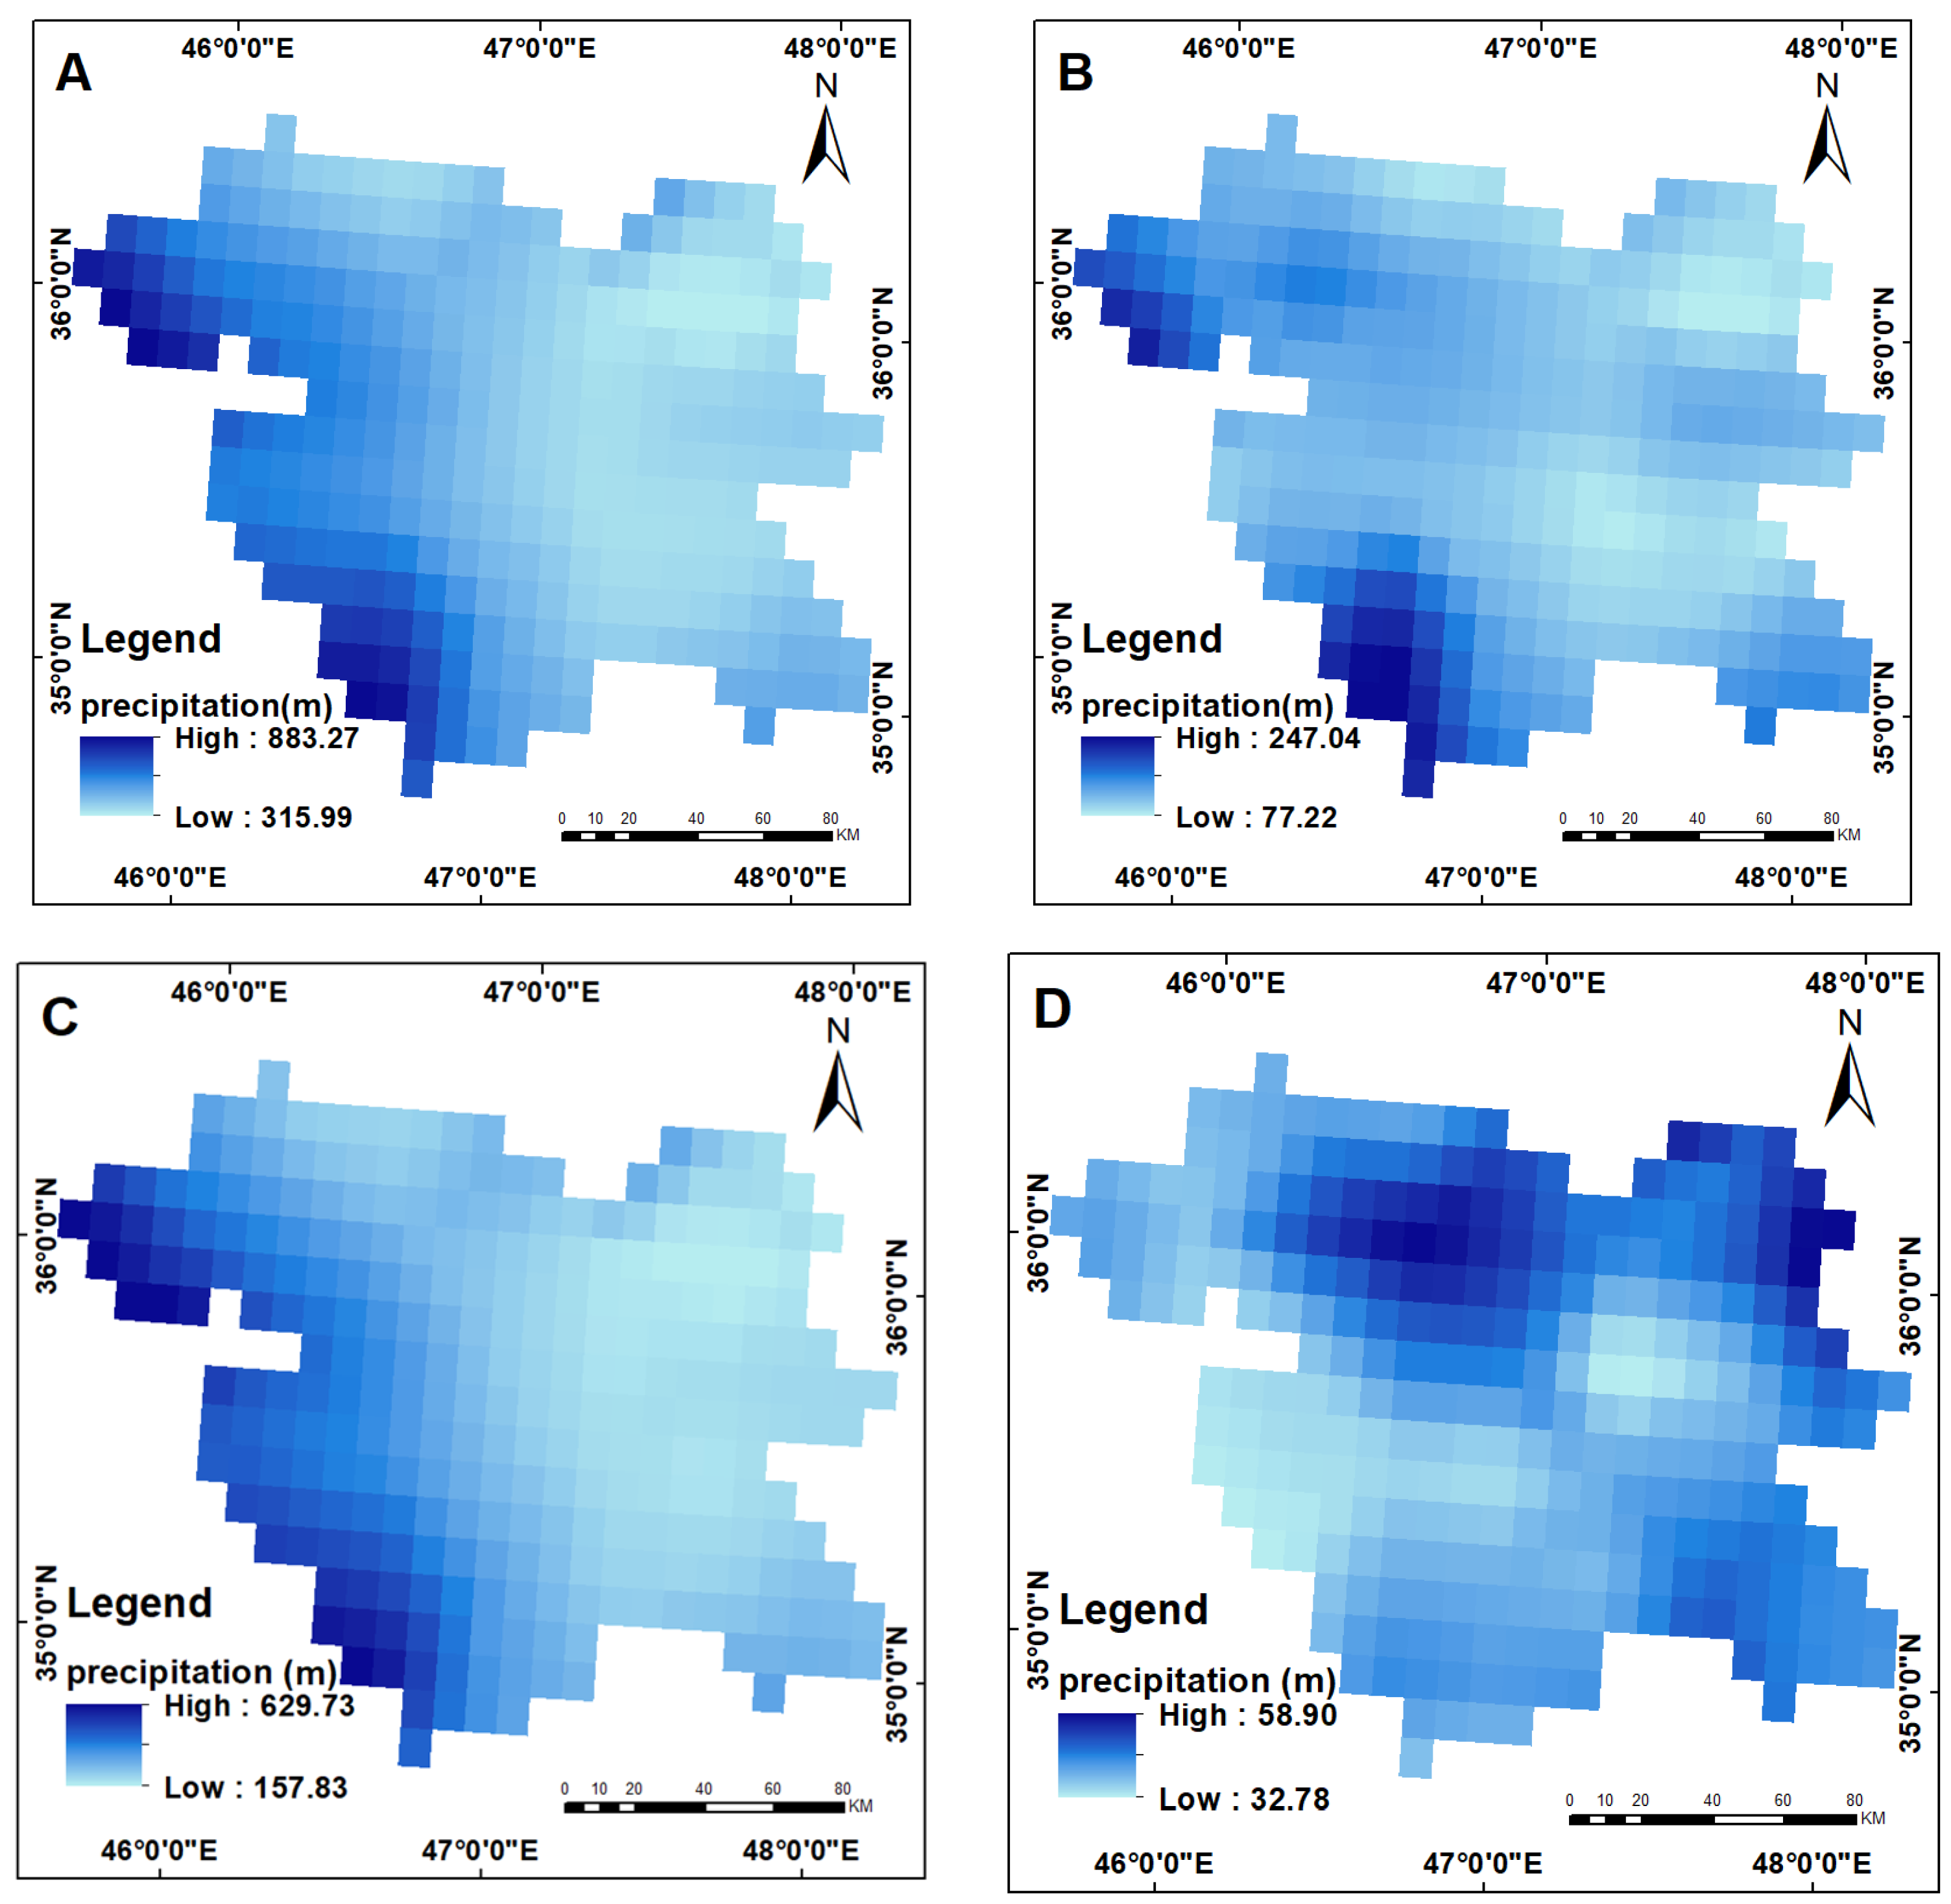
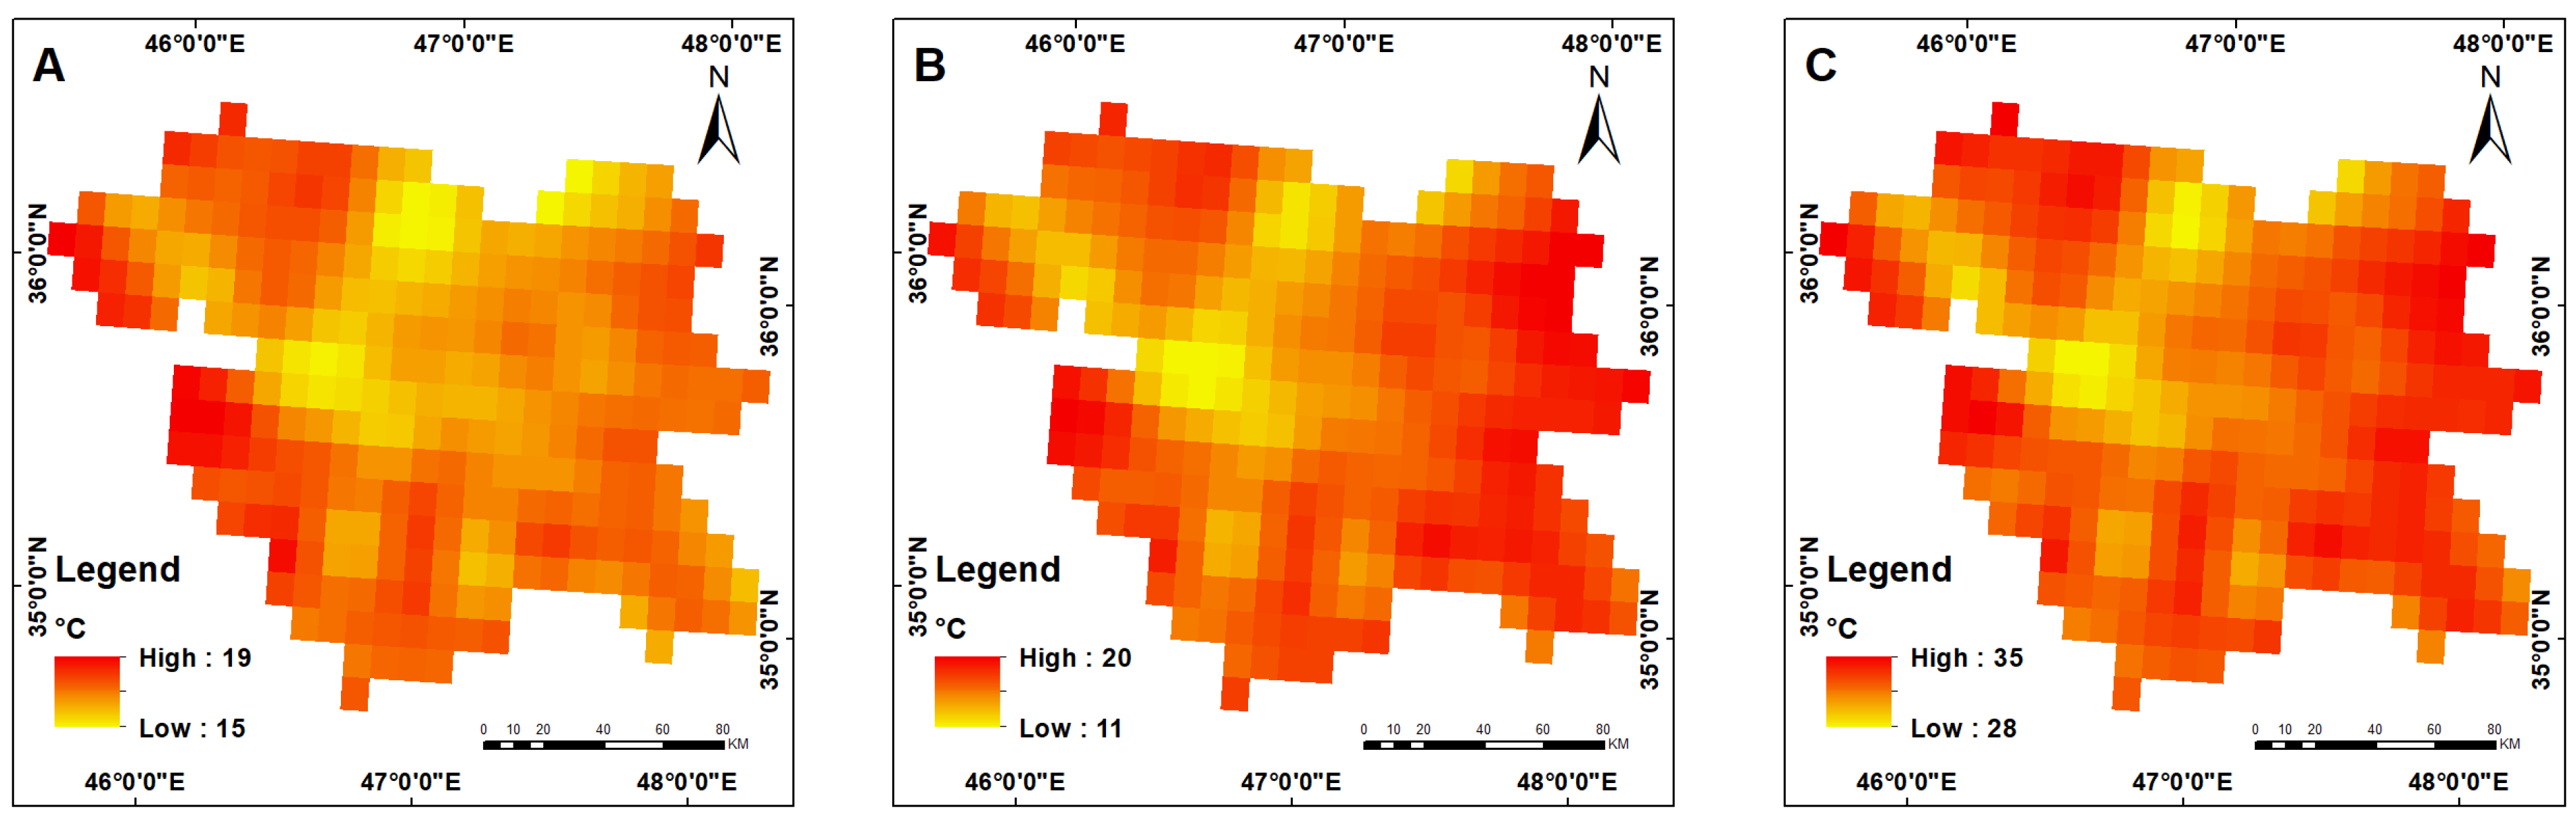
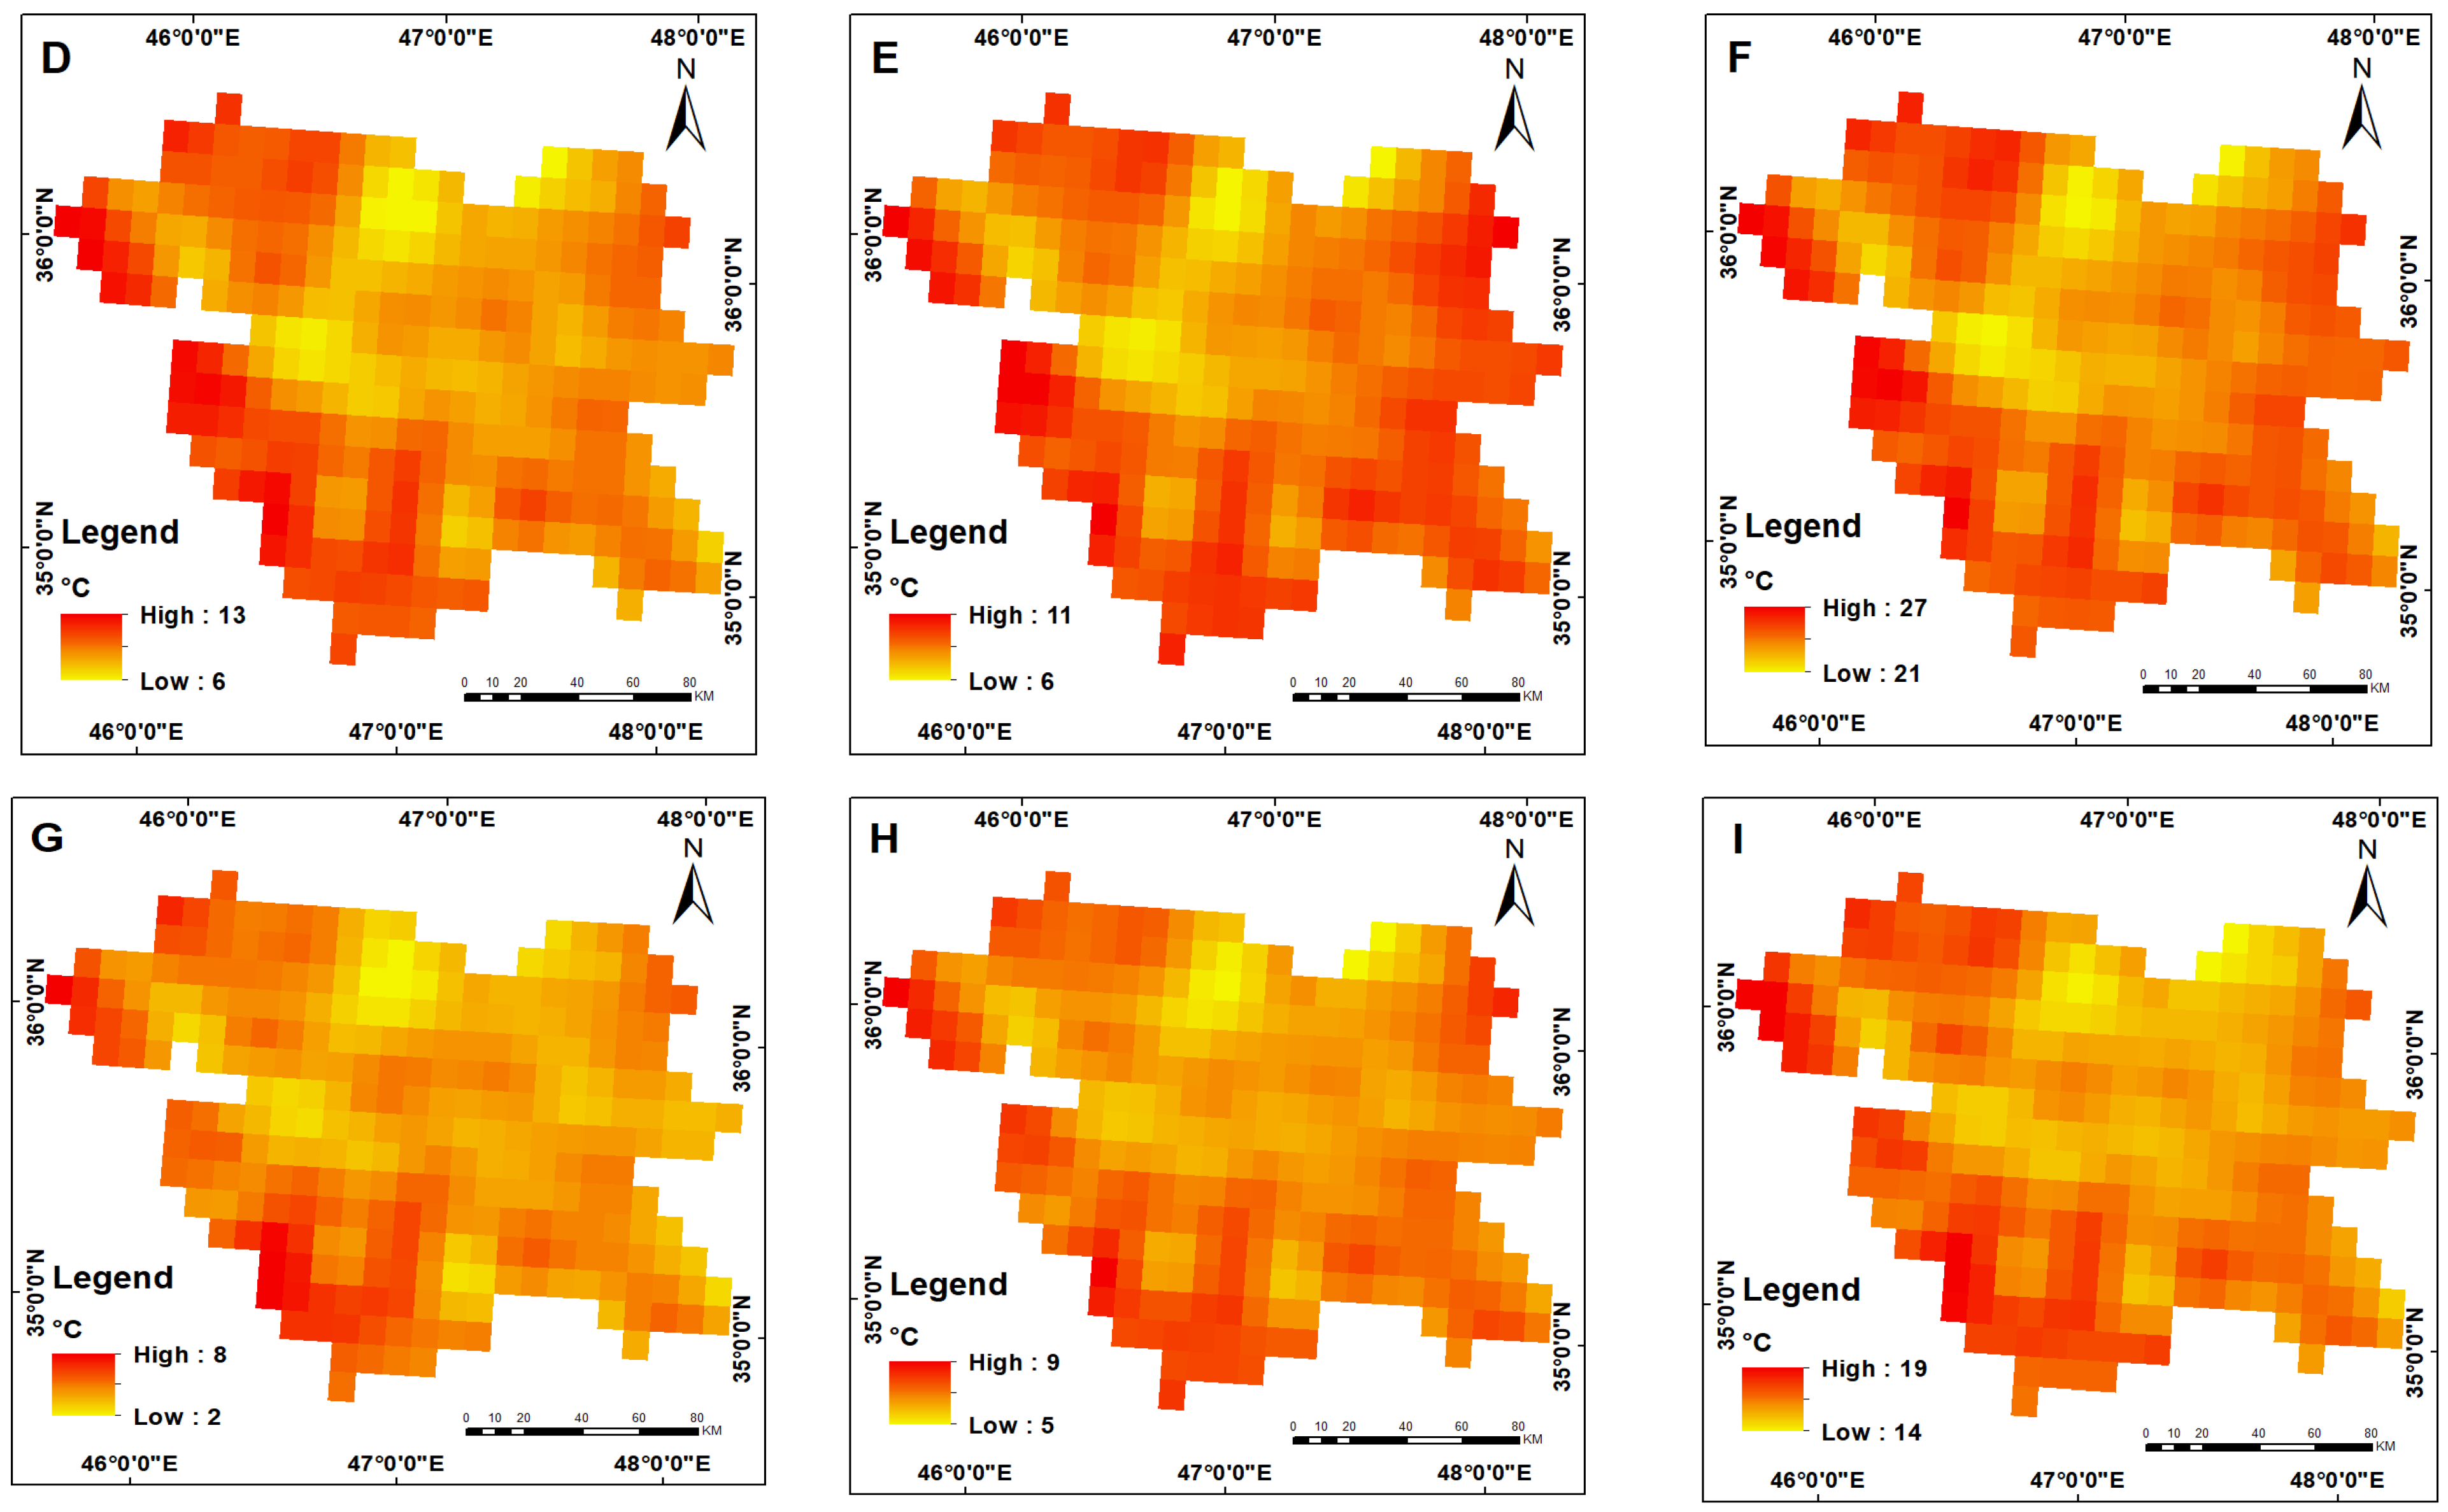
Once the time frames for the plant to reach each phenological stage in each city were determined, cumulative precipitation, minimum temperature, maximum temperature, and average temperature for each stage were calculated and harmonized according to CHIRPS satellite data. These data were used to show the province-wide trends (
Figure 5 and
Figure 6). The use of this product is preferred because it offers greater consistency and better accuracy than interpolation methods between the sparse water and meteorological stations in the province. The limited number of stations results in low interpolation accuracy, making satellite data more reliable.
3.2.3. Criteria Fuzzification
To standardize the layers and apply the necessary constraints based on wheat cultivation requirements, fuzzy functions were applied to each layer. The selection of the fuzzy function type for each layer was determined according to the characteristics of the layer and its threshold limits in Kurdistan province, as established by previous studies. The defined fuzzy functions and their corresponding thresholds are presented in
Table 5.
3.2.4. Criteria Weight Calculation
Saaty’s [
41] Analytical Hierarchy Process (AHP) model provides a structured representation of complex decision-making problems. At the highest level of this model, the overall goal is defined, followed by criteria and sub-criteria at subsequent levels. This model allows for the simultaneous incorporation of both quantitative and qualitative criteria, while also enabling the consistency of judgments to be verified [
42,
43].
In this study, to assess the significance of the four main criteria and sixteen sub-criteria, a pairwise comparison matrix was first constructed based on expert opinions. The nine-point Saaty scale was used for these comparisons. The weight of each criterion was then determined using the geometric mean method, which is recognized for its high accuracy. Next, the consistency ratio (CR) was calculated to ensure the reliability of the judgments. This is performed by dividing the consistency index (CI) by the random index (RI), with the resulting value required to not exceed 0.1 [
44,
45]. The calculation formula is as follows:
where
CR represents the consistency ratio,
CI refers to the consistency index, and
RI denotes the random index.
3.2.5. Weighted Linear Combination (WLC)
One of the most widely used techniques in multi-criteria evaluation analysis is the WLC method [
46,
47,
48]. This approach, also known as the simple additive weighting method or scoring method, allows for the integration of multiple criteria by assigning weights based on their relative importance. In this method, the final suitability score for each alternative is determined by multiplying the value of each criterion (a) by its corresponding weight (w), and then summing the results:
where a represents the value of a criterion and w denotes the weight assigned to that criterion. This technique ensures a systematic and quantitative assessment of multiple factors in decision-making processes. Finally, the potential map was classified into five classes: S1, S2, S3, N1, and N2. Additionally, a one-way Analysis of Variance (ANOVA) test was conducted as a statistical analysis to confirm the significant differences between the classes. For model validation, the average actual yield data in each homogeneous class for each year were calculated in relation to the potential yield. Furthermore, the correlation coefficient between the average calculated potential values in the homogeneous classes and the average actual yield data in the classes was determined.
4. Results
4.1. Weight of the Criteria
In this study, four main criteria—precipitation, temperature, soil, and topography—were considered, with a total of twenty sub-criteria. The weight of each criterion and its sub-criteria were determined through a pairwise comparison matrix (
Table 6). Among these, precipitation was identified as the most influential factor, receiving the highest weight (0.529), while topography was the least significant, with the lowest weight (0.069). Within the precipitation category, the average annual rainfall was the most critical sub-criterion, accounting for 52.1% of the precipitation weight. Germination stage precipitation followed with a weight of 0.231, while flowering and seed filling stage precipitation had lower weights of 0.171 and 0.077, respectively.
Temperature, as the second most important criterion (0.268), had the maximum temperature during the grain filling stage as the most influential sub-criterion (0.302). Other significant temperature-related factors included the minimum temperature in the flowering stage (0.215) and the minimum temperature in the germination stage (0.152). In contrast, the average temperature during the germination stage (0.018) and maximum temperature in the germination stage (0.023) had the least impact. For soil, which held a weight of 0.134, the CaCO3 content was the most significant sub-criterion, contributing 46.4% of the total soil weight. Other important factors included OC (0.259) and soil texture (0.161), while CEC (0.042) had the least influence. Topography, though ranked the lowest in importance, showed that slope (0.8) played a more crucial role compared to elevation (0.2). This weighting framework highlights the dominant role of precipitation and temperature in determining optimal conditions, with soil properties and topography playing a supplementary yet necessary role in the evaluation process.
4.2. Suitability of Rainfed Wheat Cultivation
After applying fuzzification to the criteria and determining their respective weights using AHP, the layers were integrated using the WLC model. This process resulted in a suitability map for dryland wheat cultivation in Kurdistan province (
Figure 7). The generated map categorizes the region into five suitability classes based on the yield potential. The S1 class, representing a very good yield, covers areas with 85–100% of the potential yield, while the S2 class, indicating a good yield, includes regions with 60–85% of the potential yield. The S3 class corresponds to moderate yield areas with 40–60% of the potential yield, whereas the N1 class consists of zones with a low yield, ranging from 25% to 40% of the potential yield. Lastly, the N2 class includes areas with a very low yield, where the potential yield is less than 25%. The results highlight that temperature, along with certain soil chemical properties such as soil pH and OC, are major limiting factors for dryland wheat cultivation in Kurdistan province. In the map of homogeneous areas, the largest area is represented by class S2, while the smallest is for class S1. In the map of homogeneous regions with climatic criteria, the largest area is represented by class S3, and the smallest area is for class S1.
The distribution of homogeneous areas for dryland wheat cultivation in Kurdistan province is presented in
Table 7. The S1 class, representing areas with a very high yield potential (85–100% of potential yield), covers 40,461 hm
2, accounting for approximately 1.2% of the total study area. The S2 class, which includes regions with good yield potential (60–85%), spans 1,283,775 hm
2, making up the largest portion of the province at 37.8%. The S3 class, characterized by moderate yield potential (40–60%), covers 838,497 hm
2, equating to 24.7% of the total area. Areas with a low yield potential (N1, 25–40%) extend across 650,662 hm
2, representing 19.2% of the region. Lastly, the N2 class, signifying areas with a very poor yield potential (below 25%), covers 148,577 hm
2, comprising 4.4% of the study area. These findings indicate that while a significant portion of Kurdistan province has favorable conditions for dryland wheat cultivation, certain areas remain unsuitable due to limiting environmental and soil factors. The difference in homogeneous area classes in this study was confirmed at a
p < 0.05 confidence level.
4.3. Validating Homogeneous Areas Using Crop Yield Data
To validate the homogeneous areas identified for dryland wheat cultivation in the study area, actual yield data at the farm scale were collected for the years 2018–2019, 2019–2020, and 2020–2021 from the Organization of Agricultural Jihad of Kurdistan province.
Table 8 presents the average crop yield for each homogeneous class across these years, comparing it to the highest observed potential yield (3064.28 kg/hm
2) in the province. The S1 class, representing areas with the highest yield potential, achieved an average total yield of 2327 kg/hm
2, which is approximately 75% of the potential yield. This class showed variations across years, with yields ranging from 1410.12 kg/hm
2 in 2020–2021 to 2902.95 kg/hm
2 in 2019–2020. The S2 class, with a good yield potential, had an average total yield of 2022.2 kg/hm
2, equating to 66% of the potential yield, while its annual yield fluctuated between 973.09 kg/hm
2 in 2020–2021 and 2726.07 kg/hm
2 in 2019–2020.
For S3, which represents areas with a moderate yield potential, the average yield was 1245.84 kg/hm2, covering 43% of the potential yield, with annual fluctuations from 809.21 kg/hm2 in 2020–2021 to 1477 kg/hm2 in 2018–2019. The N1 class, denoting areas with a poor yield potential, had an average total yield of 923.61 kg/hm2 (approximately 30% of the potential yield), with a minimum of 786.95 kg/hm2 in 2020–2021 and a maximum of 1136.62 kg/hm2 in 2019–2020. Finally, the N2 class, representing the most unsuitable areas for dryland wheat cultivation, had the lowest average total yield of 636.44 kg/hm2, corresponding to only 20% of the potential yield. Yields varied from 341.18 kg/hm2 in 2020–2021 to 1058.71 kg/hm2 in 2019–2020. The correlation coefficient between the average calculated potential values in the homogeneous classes and the average actual yield data in the classes was 0.94. These results confirm that the classification of homogeneous areas corresponds well with actual yield variations, demonstrating that temperature and soil chemical properties, particularly soil pH and organic carbon (OC), are key limiting factors for dryland wheat production in the province.
5. Discussion
The rapid population growth in recent years has posed significant challenges to sustainable food security. Without the adoption of modern agricultural management practices, particularly for strategic crops, a future food crisis is inevitable. This study employs a comprehensive set of criteria to identify homogeneous areas for rainfed wheat yield assessment. Most of these criteria align with previous research [
49,
50], incorporating both climatic and soil parameters to reflect both stability and advancements in methodology.
Key factors such as slope, annual precipitation, and average temperature, which have been emphasized in prior studies, are included. However, this study introduces more detailed climatic indicators, such as precipitation and temperature at each phenological stage, with particular attention to minimum and maximum temperatures during flowering—factors often overlooked in earlier research. Unlike previous studies that relied on interpolation between ground stations—introducing high uncertainty due to the wide spacing between stations (up to 100 km in Kurdistan province)—this study utilizes continuous satellite data with a spatial resolution of 5.6 km. This significantly enhances the accuracy of evaluating precipitation and temperature criteria.
To assess land suitability for rainfed wheat, fuzzy functions were applied to each criterion based on established models [
51,
52]. The AHP method was used to assign weights to the criteria, with input from 40 experts in agriculture, agricultural climatology, soil science, and climatology. While some studies have identified precipitation and altitude as the most influential factors for rainfed wheat, expert evaluations in this study ranked precipitation and temperature as the dominant determinants. The findings also highlight the effectiveness of AHP in integrating heterogeneous data, consistent with Hamzeh et al. [
53], who demonstrated strong agreement between the fuzzy-AHP method and the traditional Sys table. In this study, the yield in each homogeneous area also correlated well with the Sys classification, except for class S1. Over three growing seasons, the average yield for each homogeneous class aligned with Sys-based expectations. While previous studies have assessed land suitability for rainfed wheat using the fuzzy-AHP method, they have primarily classified land into suitability categories. However, this study uniquely evaluates performance homogeneity across different classes at the farm level over multiple years, providing valuable insights for agricultural resource management, including crop insurance strategies. The AHP method is an established method for multi-criteria decision-making, particularly because of its ability to address both quantitative and qualitative criteria while incorporating expert judgment. Unlike other methods such as the entropy method, which rely solely on data-based weighting and may not consider subjective factors such as farmer experience or regional agricultural preferences, the AHP method allows for the integration of expert knowledge and stakeholder input. This makes it particularly suitable for agricultural studies, where factors such as soil quality, climate suitability, and management practices often require expert interpretation.
In this study, rainfall was given the highest weight because, in rainfed agriculture, precipitation is the most critical factor, directly determining the amount of water available for crop growth and yield. Unlike irrigated systems, rainfed agriculture relies entirely on natural rainfall to meet the water needs of crops. Insufficient or irregular rainfall can lead to water stress, reduced photosynthesis, and ultimately, lower yields. On the other hand, topography was assigned the lowest weight because, while it still plays a role, it is generally the least important factor in rainfed agriculture. Topography influences water drainage, soil erosion, and microclimate, but its impact is secondary compared to rainfall. For example, while steep slopes can result in soil erosion and nutrient loss, these issues can be mitigated through terracing or contour farming. The results of this research can contribute to precision agriculture by improving the prediction and estimation of crop yields using artificial intelligence methods. If the yield values of farms in a given area are homogeneous, artificial intelligence can be more effectively trained, leading to more accurate decisions. Given the research focus on determining homogeneous areas for rainfed wheat cultivation and considering that rainfed agriculture is a suitable method for managing water resources to increase agricultural production, this model could potentially be implemented in other areas for sustainable water resource management. This approach not only addresses the challenges of rainfed wheat cultivation but also provides a robust framework for enhancing the resilience and productivity of agriculture in semi-arid environments worldwide. The methodology developed for rainfed wheat can be adapted to other crops commonly grown in semi-arid regions, such as barley, sorghum, millet, chickpeas, and lentils. These crops share similar constraints related to water availability, nutrient management, and climate variability. Similarly, the integration of climate, soil, and remote sensing data is highly transferable to other semi-arid regions, such as the Mediterranean Basin, the drylands of Central Asia, and parts of sub-Saharan Africa. These regions face similar challenges, including water scarcity, soil degradation, and climate variability.
Despite its contributions, this study had certain limitations. The absence of large-scale soil salinity data for the province was a significant constraint, as soil salinity directly affects wheat yield. Future research should incorporate this factor. Additionally, inconsistencies in data resolution increased uncertainty, and the lack of long-term yield records limited the accuracy of the results. Extending the yield dataset over a longer period would significantly improve precision and reliability.
One of the key uncertainties in this study arises from the interpolation of temperature and precipitation data. The accuracy of interpolated climate variables largely depends on the spatial distribution and density of ground-based weather stations. In regions with sparse station coverage, interpolation methods may introduce biases, affecting the reliability of the estimated values. Additionally, the choice of interpolation technique, such as Kriging or Inverse Distance Weighting (IDW), influences the precision of the results, as each method has inherent assumptions that may not fully capture local climate variations. These uncertainties highlight the need for complementary data sources to improve accuracy. The integration of satellite-derived climate data has significantly enhanced the reliability of temperature and precipitation estimations. Remote sensing datasets, such as MODIS and ECOSTRESS, provide high-resolution observations that supplement ground-based measurements, reducing spatial uncertainty, especially in areas with limited meteorological station coverage. Moreover, the use of data assimilation techniques, where satellite data are merged with reanalysis products, further refines the accuracy of climate variables and helps address interpolation-related errors. Future studies could focus on developing hybrid models that integrate ground-based observations, satellite data, and numerical weather prediction outputs to minimize uncertainties. The application of machine learning algorithms, such as random forest and deep learning models, can improve climate data interpolation by capturing complex relationships between topography, land cover, and climate variables. Additionally, the incorporation of multi-source climate datasets, such as ERA5 and CHIRPS, can enhance cross-validation efforts, leading to more robust climate assessments. By leveraging these advancements, future models can further reduce uncertainties and improve the accuracy of climate-based analyses.
6. Conclusions
In this study, the Weibull formula was used to determine the crop cultivation date with a 70% probability for each city. The degree of growth was then applied to estimate the timing of the three key phenological stages: germination, flowering, and seed filling. After this, all criteria were fuzzified, and their respective weights were assigned by experts using the AHP model. Among the main criteria, precipitation, temperature, soil, and topography received the highest weights in descending order. For sub-criteria, annual rainfall was identified as the most influential factor within the precipitation category, while maximum temperature during the seed filling stage had the highest weight under temperature. Among soil-related factors, CI (calcium carbonate content) was the most significant, and for topography, slope received the highest weight. Using the WLC model, these criteria were integrated, resulting in the classification of homogeneous areas for rainfed wheat cultivation in Kurdistan province into five classes: N2, N1, S3, S2, and S1. The largest area of the province falls into class S2, whereas class S1 represents the smallest area. Based on field assessments, it was determined that in classes N2 and N1, the minimum temperature at each phenological stage and soil CaCO3 content are the primary limiting factors for rainfed wheat cultivation. The CaCO3 content plays a dual role: while it can improve soil structure and provide essential calcium, excessive amounts can lead to nutrient imbalances, the reduced availability of micronutrients, and physical barriers to root growth. The minimum temperature is also crucial for preventing cold stress. If the minimum temperature during stages such as flowering falls below 9 °C, the plant will experience reduced yields and frost damage. To validate the homogeneity of these classes, the average yield for each class was calculated over three consecutive years and compared to the potential yield of the region. The results showed a gradual decline in yield from class S1 to N2, with the ratio of the average yield to potential yield being 75% for S1, 66% for S2, 43% for S3, 30% for N1, and 20% for N2. It was also found that, except for class S1 (which did not reach the 85–100% performance threshold), all other classes fell within their expected potential yield ranges. Therefore, for farms categorized within any of these four classes, the yield can be reliably estimated relative to the potential performance of the region.
Several recommendations for future studies can help enhance the assessment of the rainfed wheat cultivation potential. First, incorporating remote sensing data and machine learning algorithms could improve the accuracy of spatial modeling and yield predictions. Second, conducting long-term climate change impact analyses would provide valuable insights into the future viability of rainfed wheat cultivation under different climate scenarios. Third, integrating socioeconomic factors such as farmers’ management practices, access to agricultural inputs, and market conditions would lead to a more comprehensive evaluation of the cultivation potential. Expanding the study to include other provinces with similar climatic conditions would allow for broader regional comparisons and model validation. Researchers can examine all the criteria presented in this study in other developmental periods introduced by the Zadoks scale to increase accuracy. Finally, using higher-resolution soil and climate data could refine the classification of homogeneous areas, leading to more precise recommendations for sustainable agricultural planning. By integrating machine learning models and remote sensing time-series data, yield predictions can be significantly improved, providing farmers and policymakers with actionable insights. This approach not only enhances the accuracy of predictions but also supports sustainable agricultural practices by enabling precision management and climate adaptation strategies. Expanding this methodology to other crops and regions underscores its potential to address global food security challenges in semi-arid environments. The findings of this study can guide government policies towards sustainable food security. By identifying homogeneous areas in terms of yield, the government can encourage farmers to grow crops and invest in high-yielding areas, as well as prioritize financing based on these areas. Additionally, governments can encourage farmers to insure their crops to provide psychological security and reduce financial risks, as the results of this study can be used to determine the specific index amount for crop insurance in each homogeneous area. Based on these findings, farmers are advised to increase their crop yields by scheduling planting and harvesting, managing water sustainably, and selecting varieties that are appropriate for their local soil and climate conditions.


