
Evaluation of Historical Dry and Wet Periods over Lake Kyoga Basin in Uganda


Abstract
1. Introduction
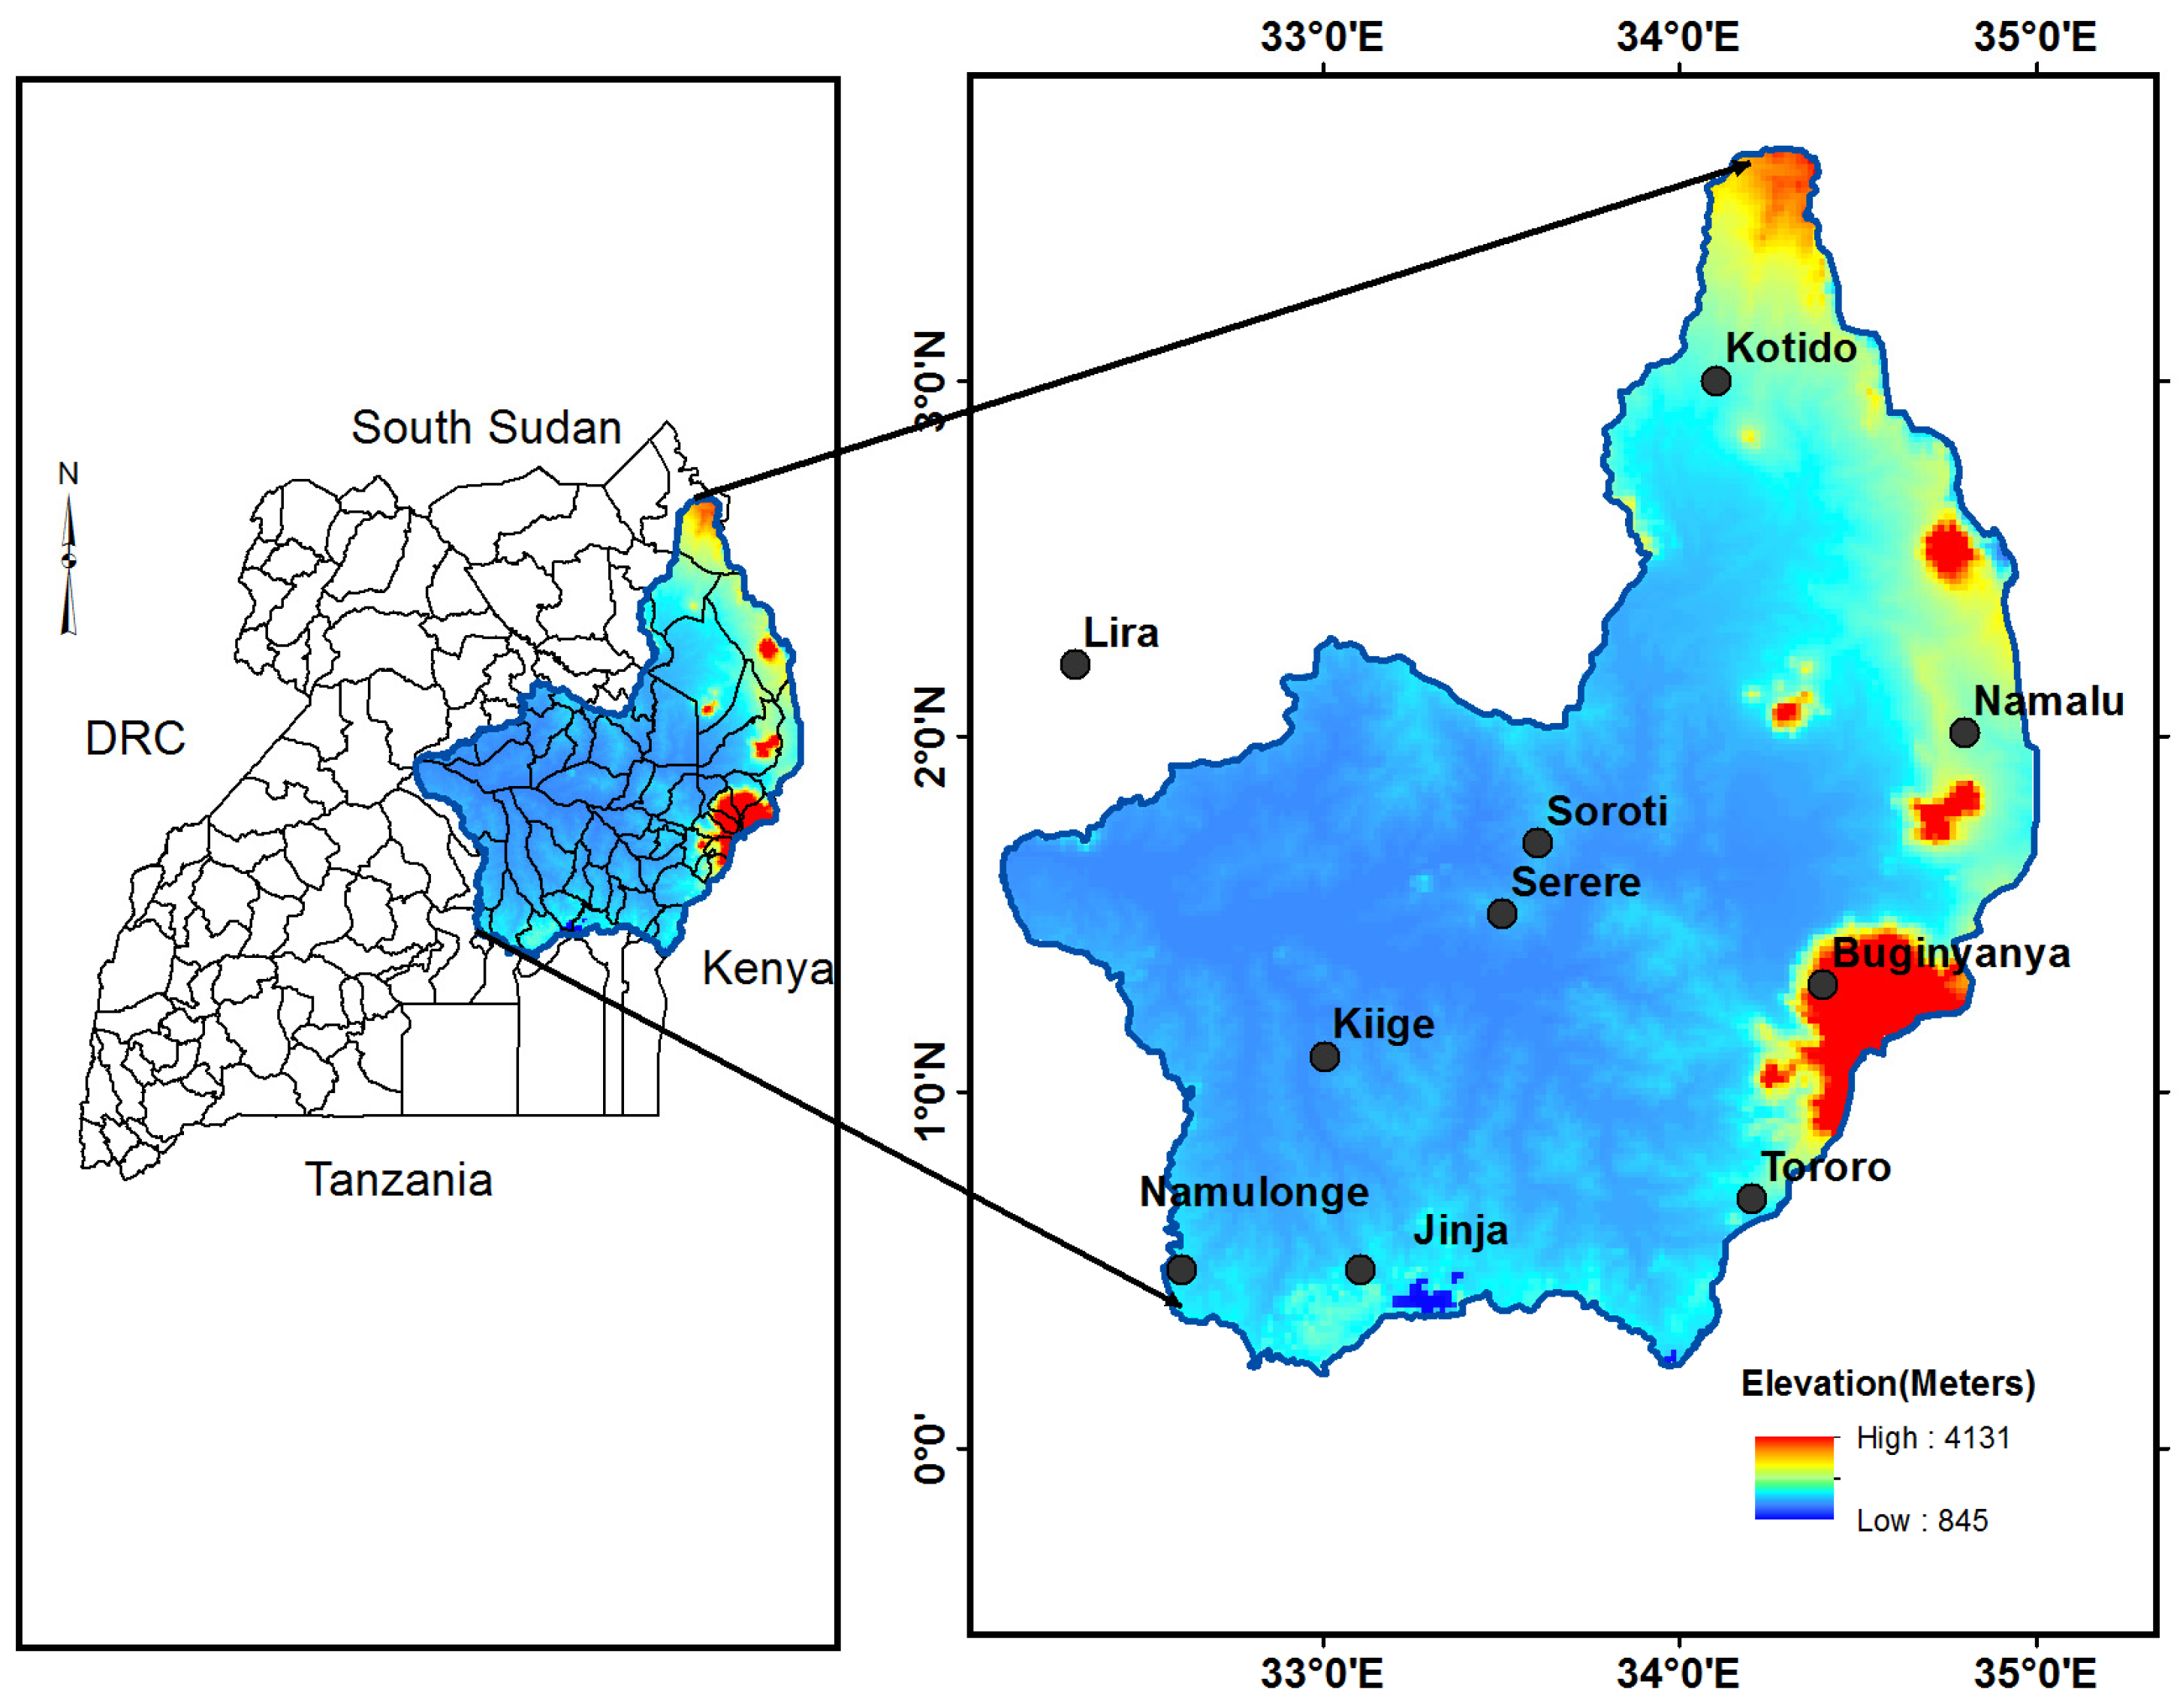
2. Study Area
3. Materials and Methods
3.1. Materials
3.1.1. Observed Station Climate Data
3.1.2. Climate Hazards Group Infrared Precipitation with Stations Data (CHIRPS)
3.1.3. TAMSAT Precipitation Data
3.2. Methods
3.2.1. Descriptive Statistics and Mann–Kendall Trend Analysis
3.2.2. Sen’s Slope Methods
3.2.3. Number of WET/DRY Days over MAM and SOND Rainfall Seasons
3.2.4. Cumulative Departure Index (CDI) for 1981–2017
3.2.5. Rainfall Anomaly Index (RAI) for 1981–2017
4. Results
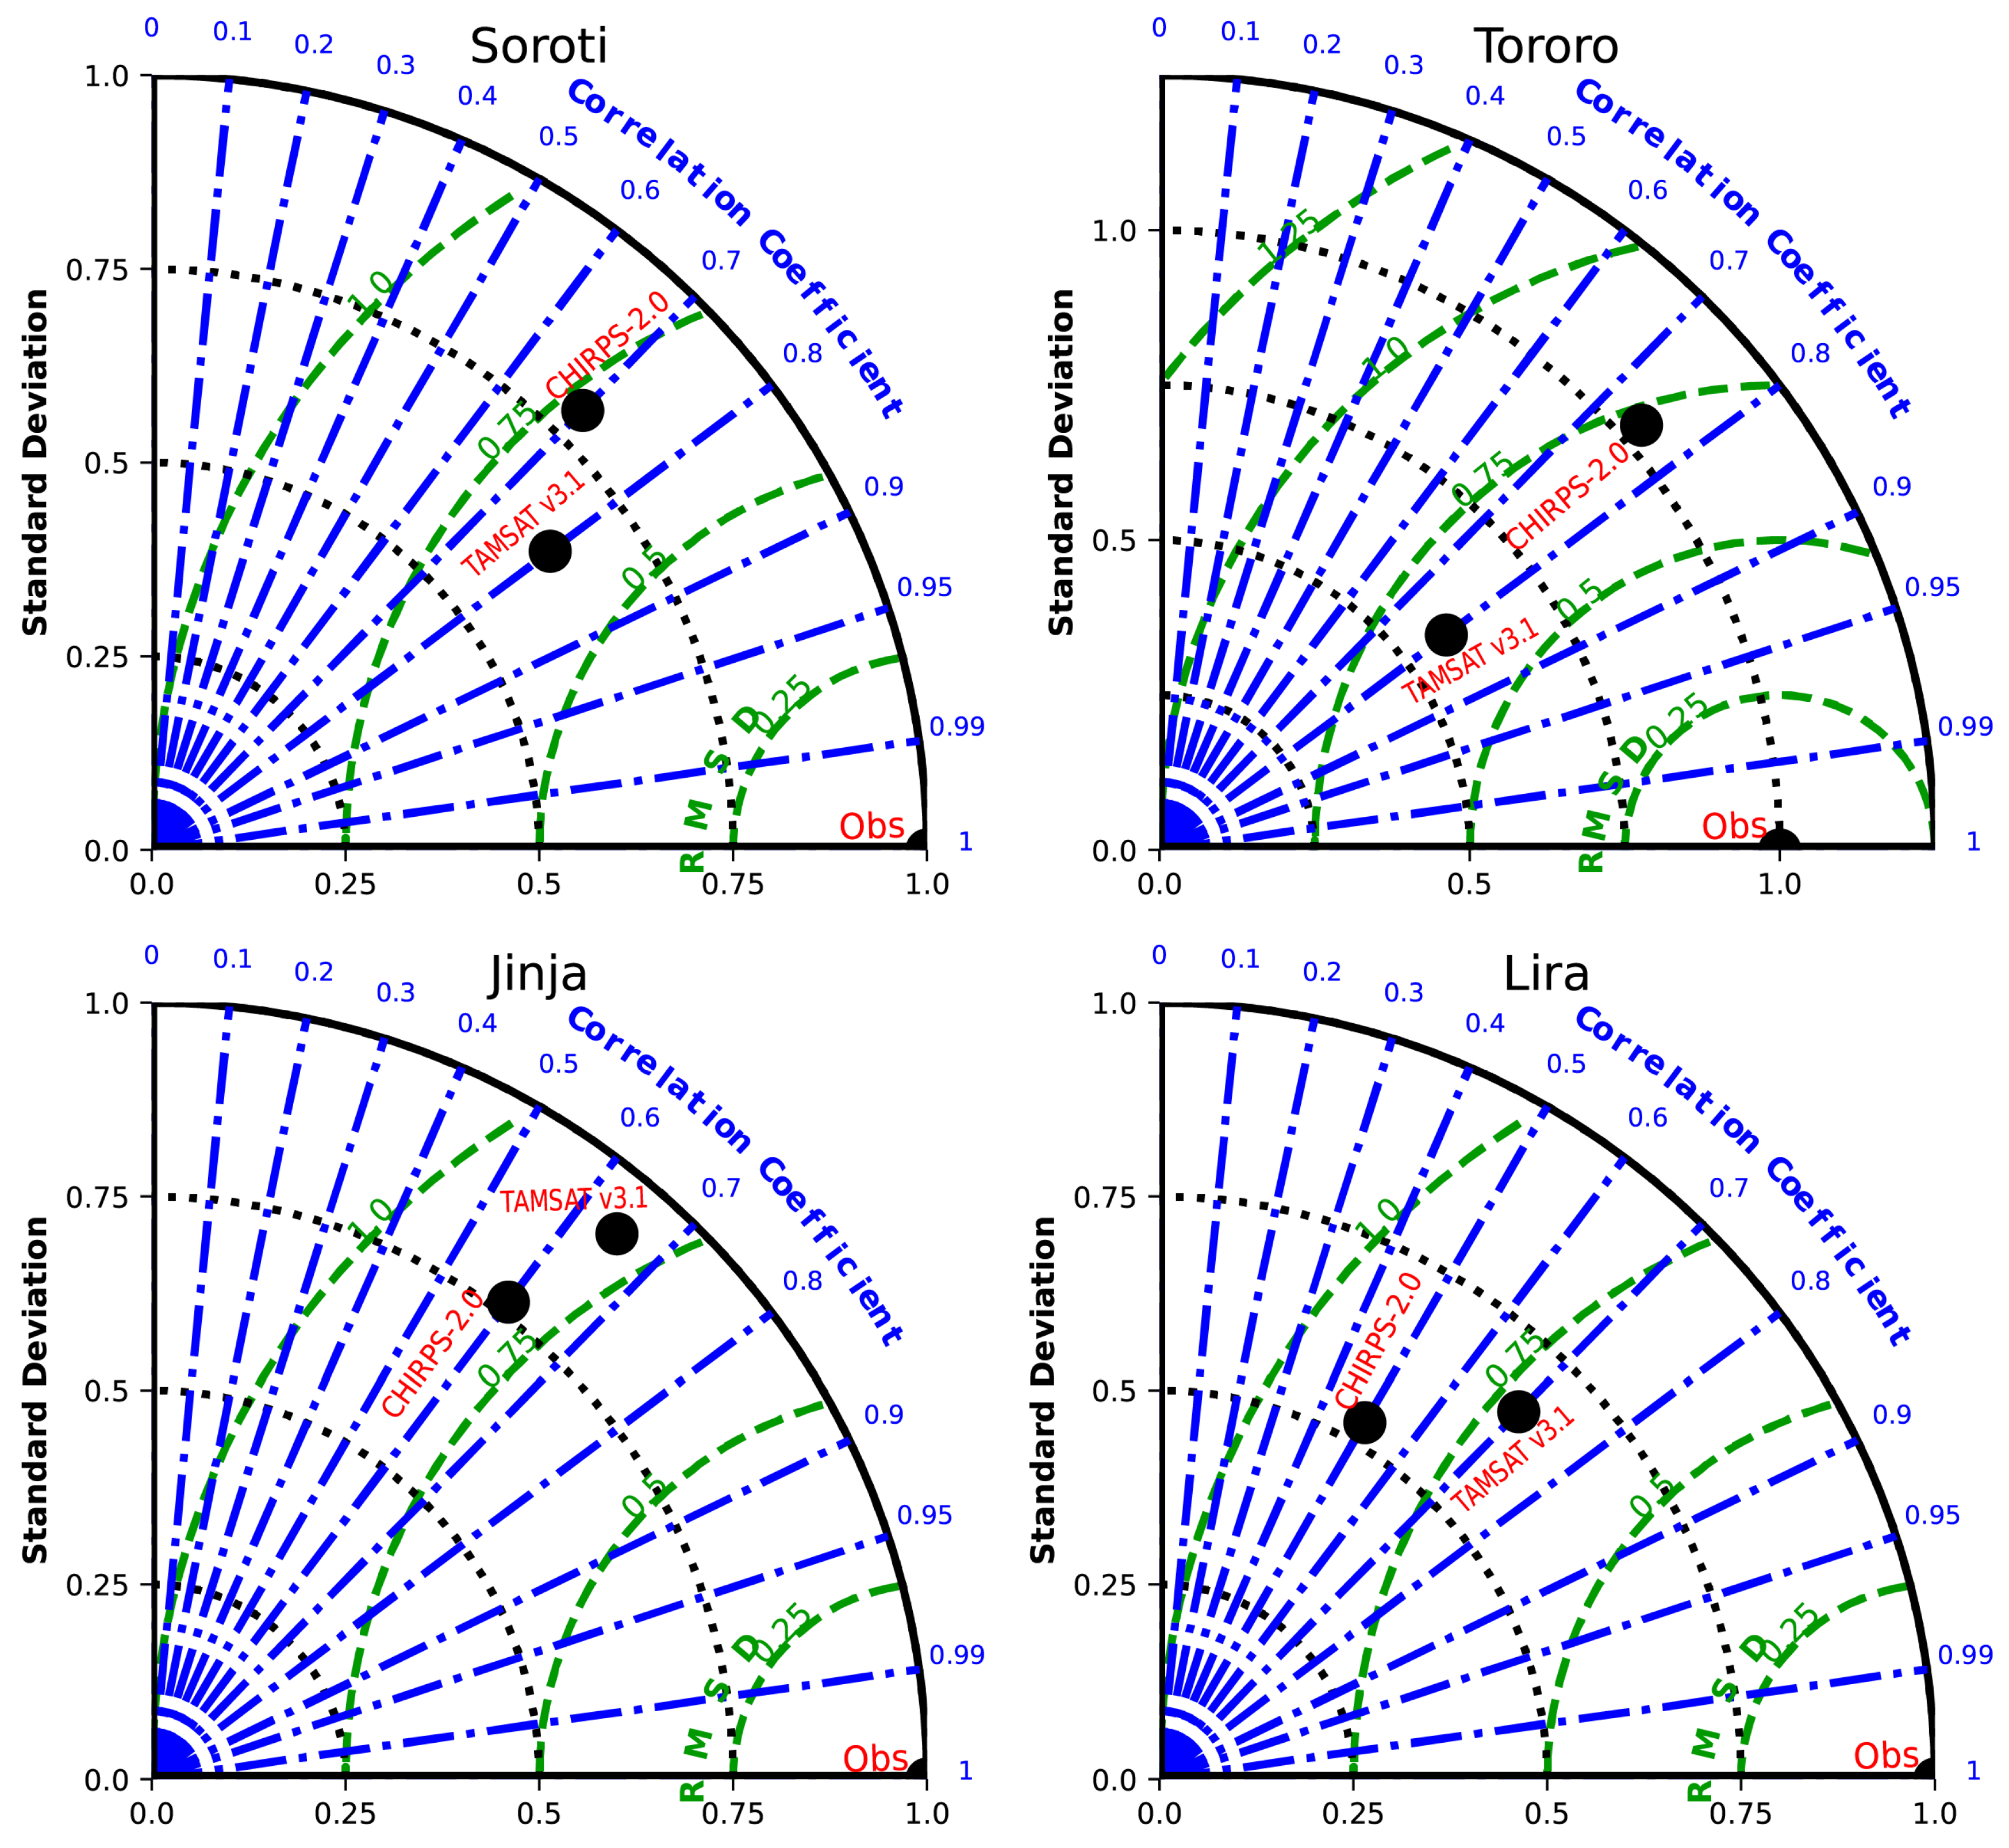
4.1. Relationship Between CHIRPS and TAMSAT and Observed Station Rainfall Data
4.2. Mean Monthly Annual Rainfall Cycles over Different Stations
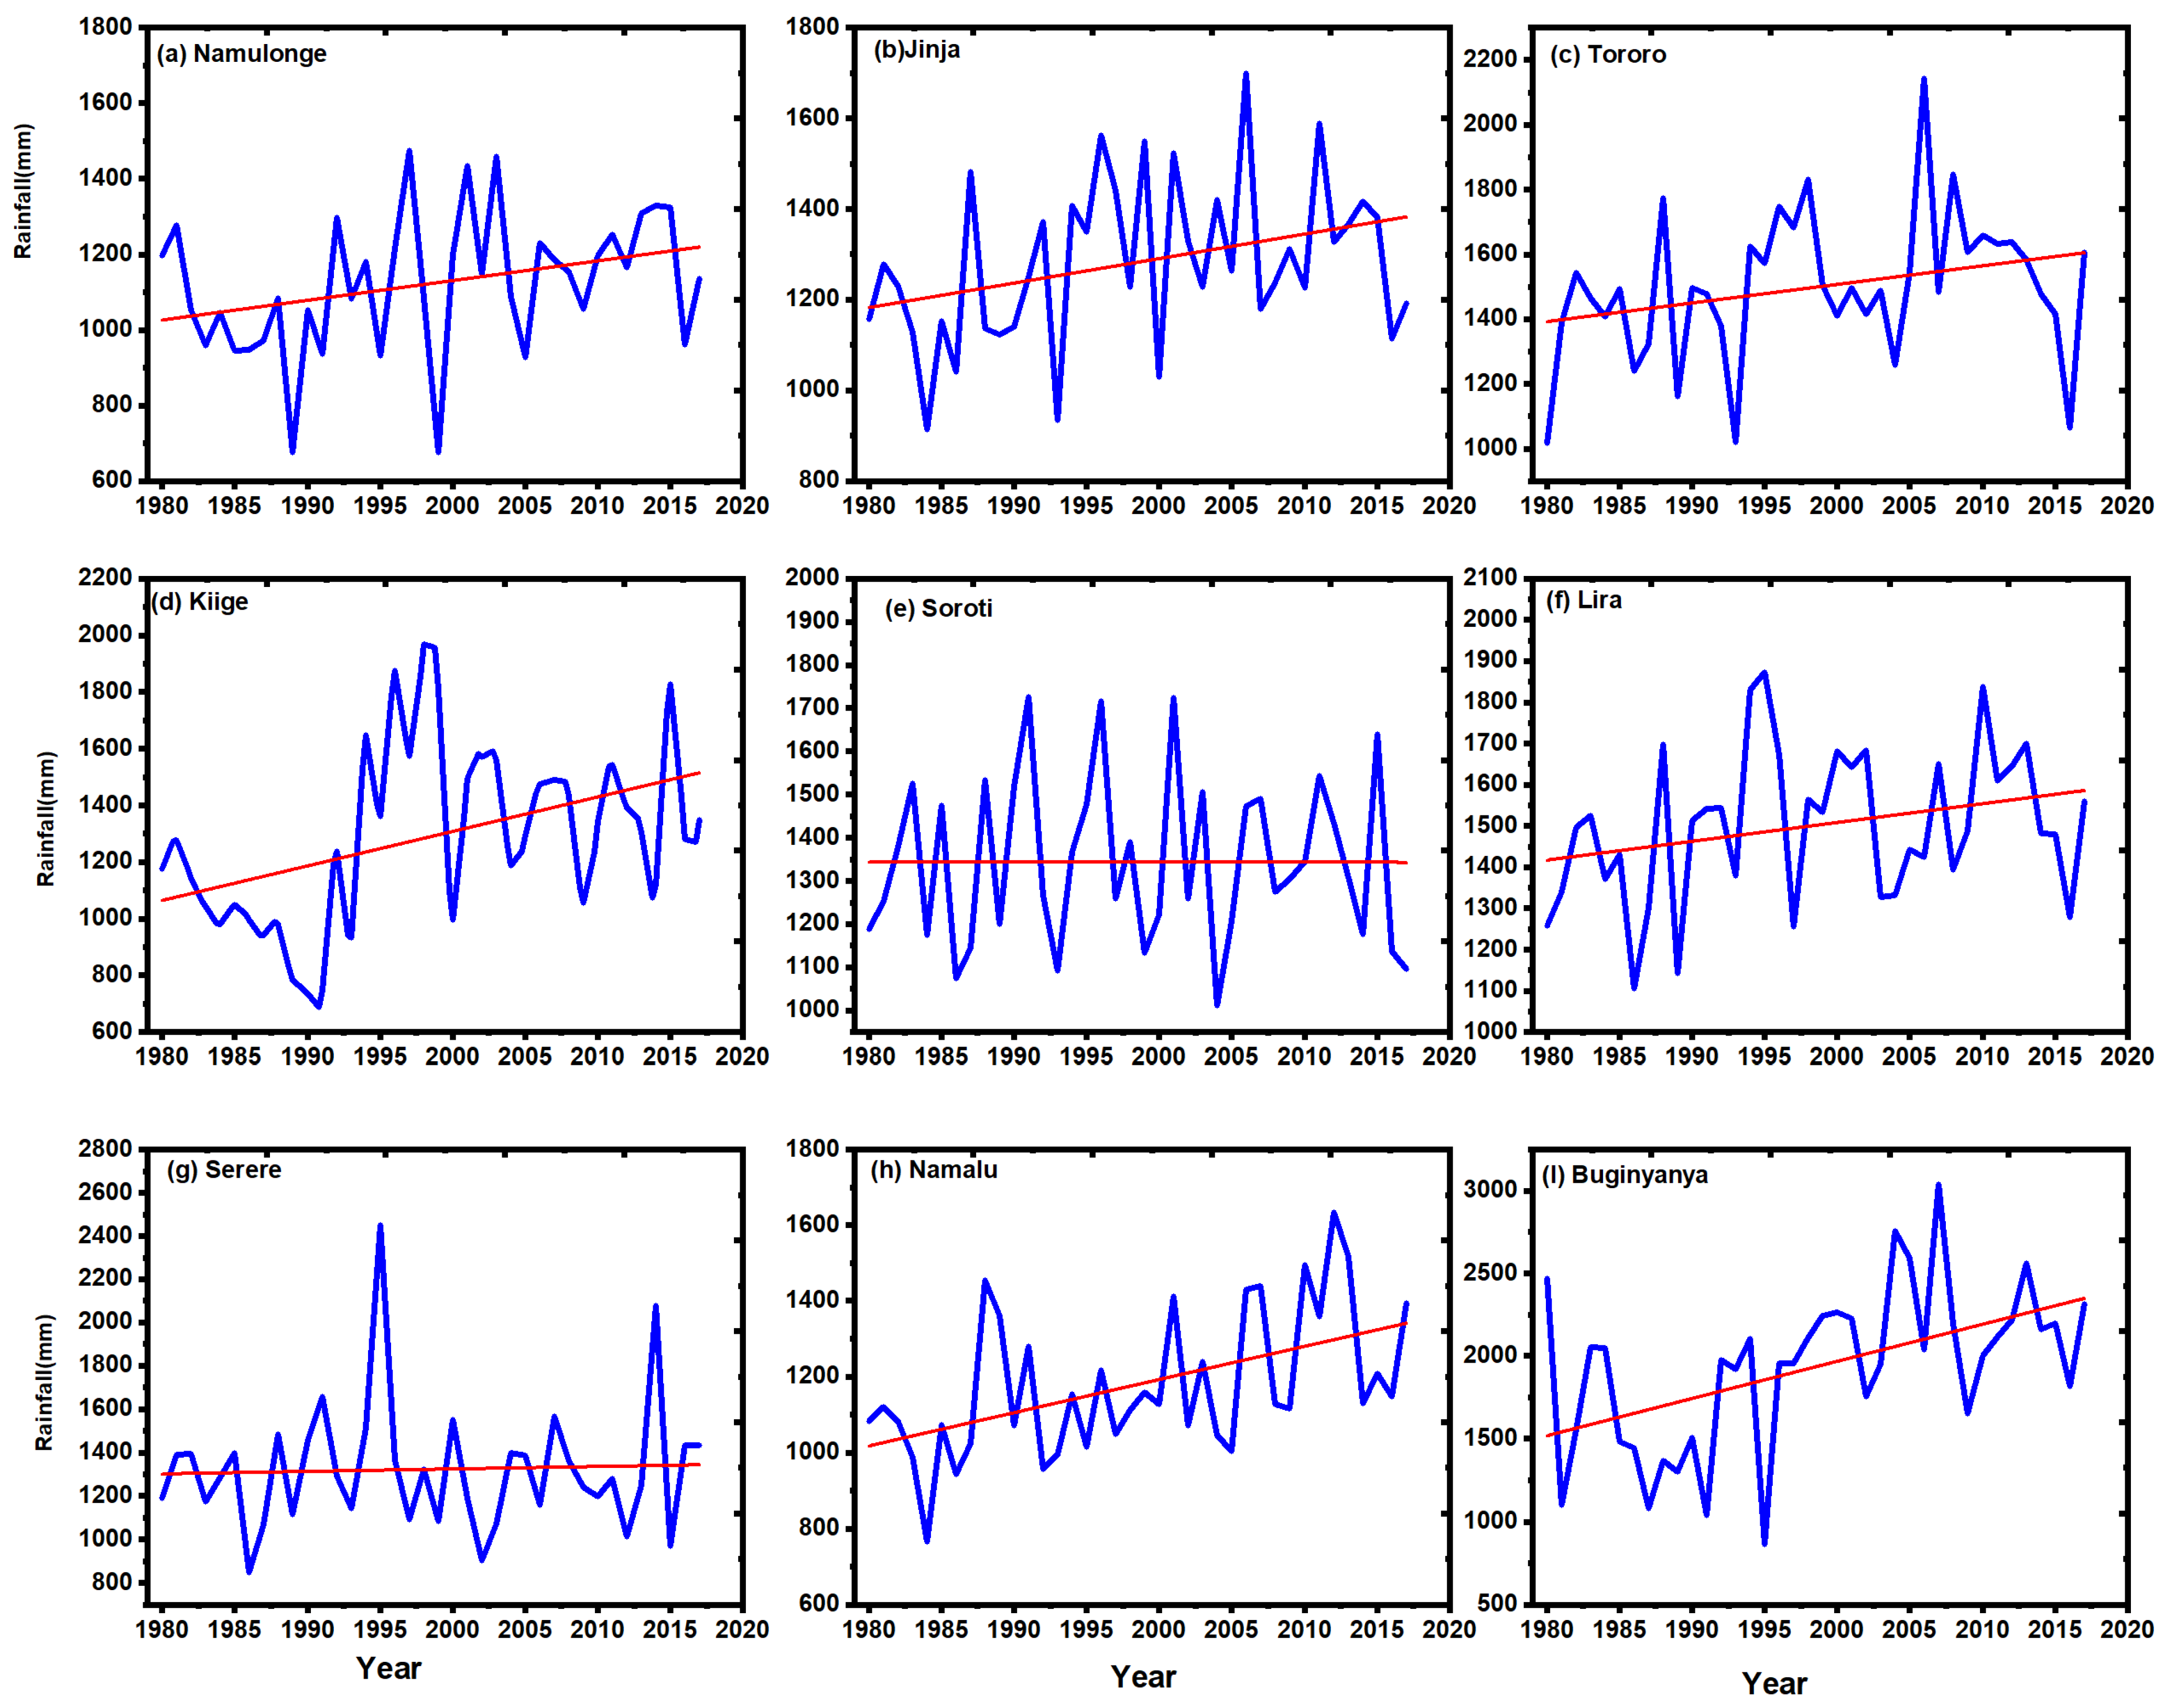
4.3. Descriptive Statistics and Trends of Seasonal Annual Rainfall
4.4. Onset and Cessation of Rainfall for Lake Kyoga Basin
4.5. Temporal Variation in Annual and Seasonal Rainfall in Lake Kyoga Basin
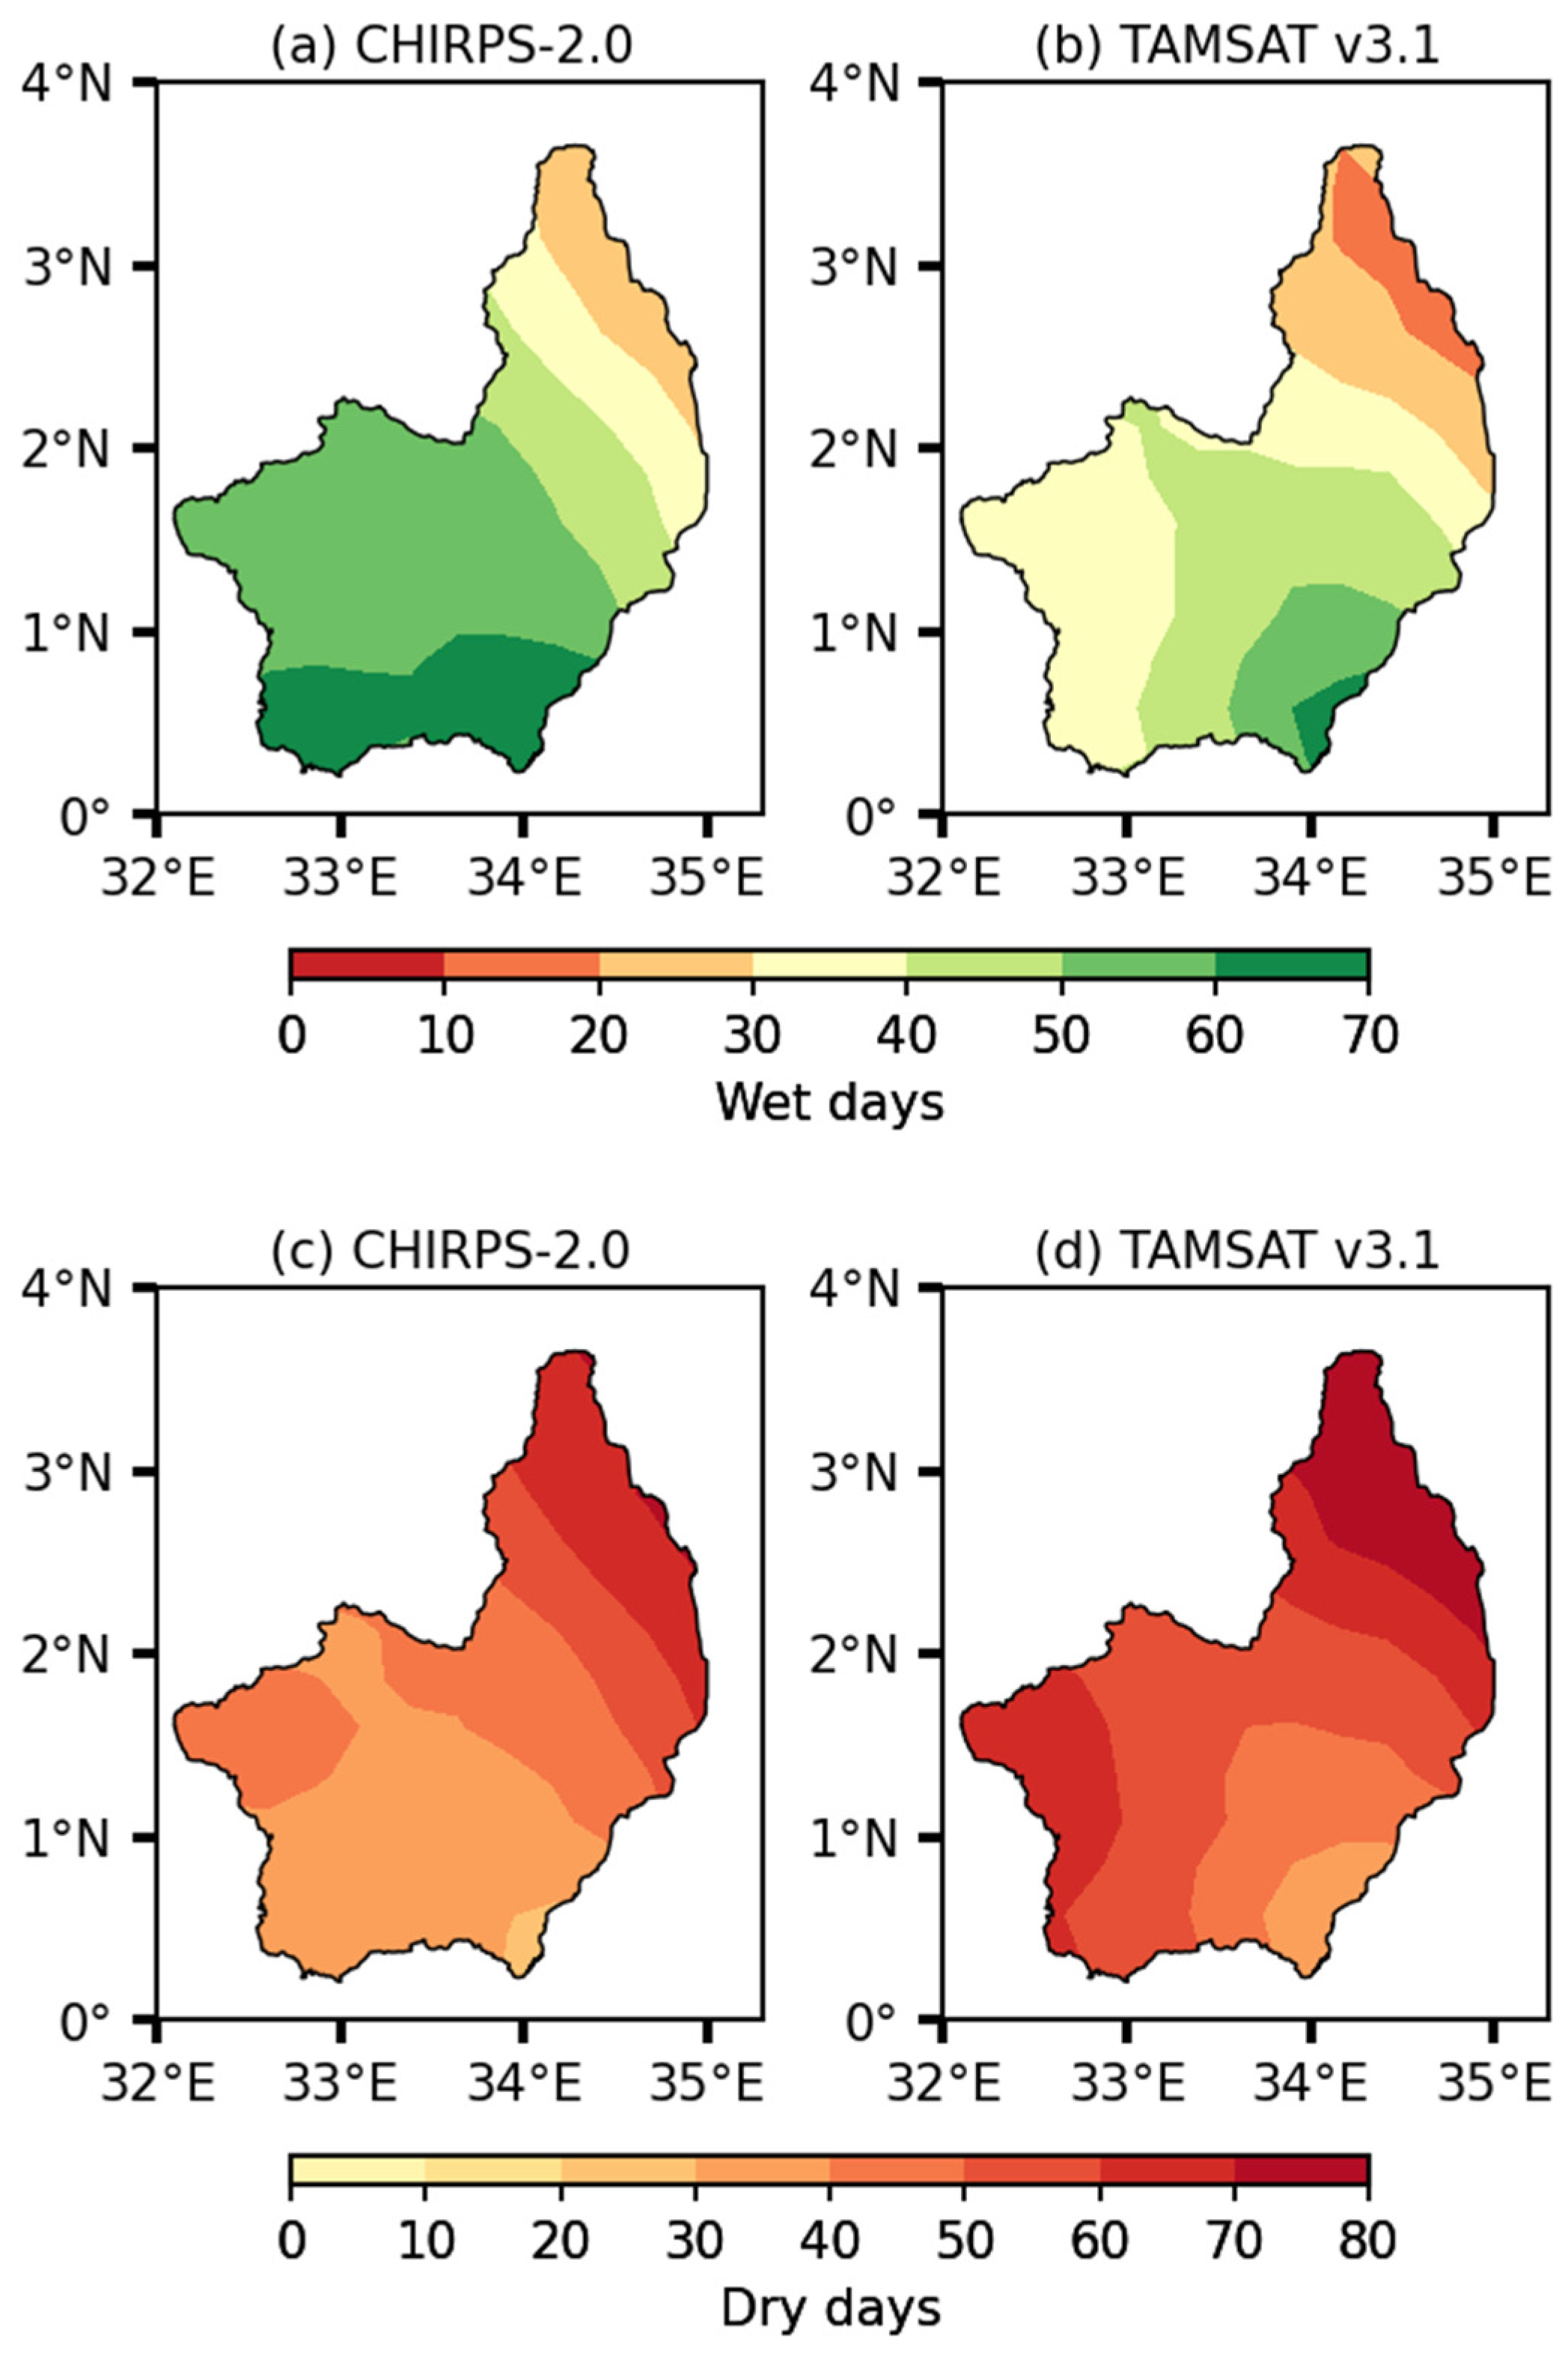
4.6. Number of Wet/Dry Days During MAM and SOND Rainfall Seasons
4.7. Cumulative Departure Index (CDI) over Lake Kyoga Basin
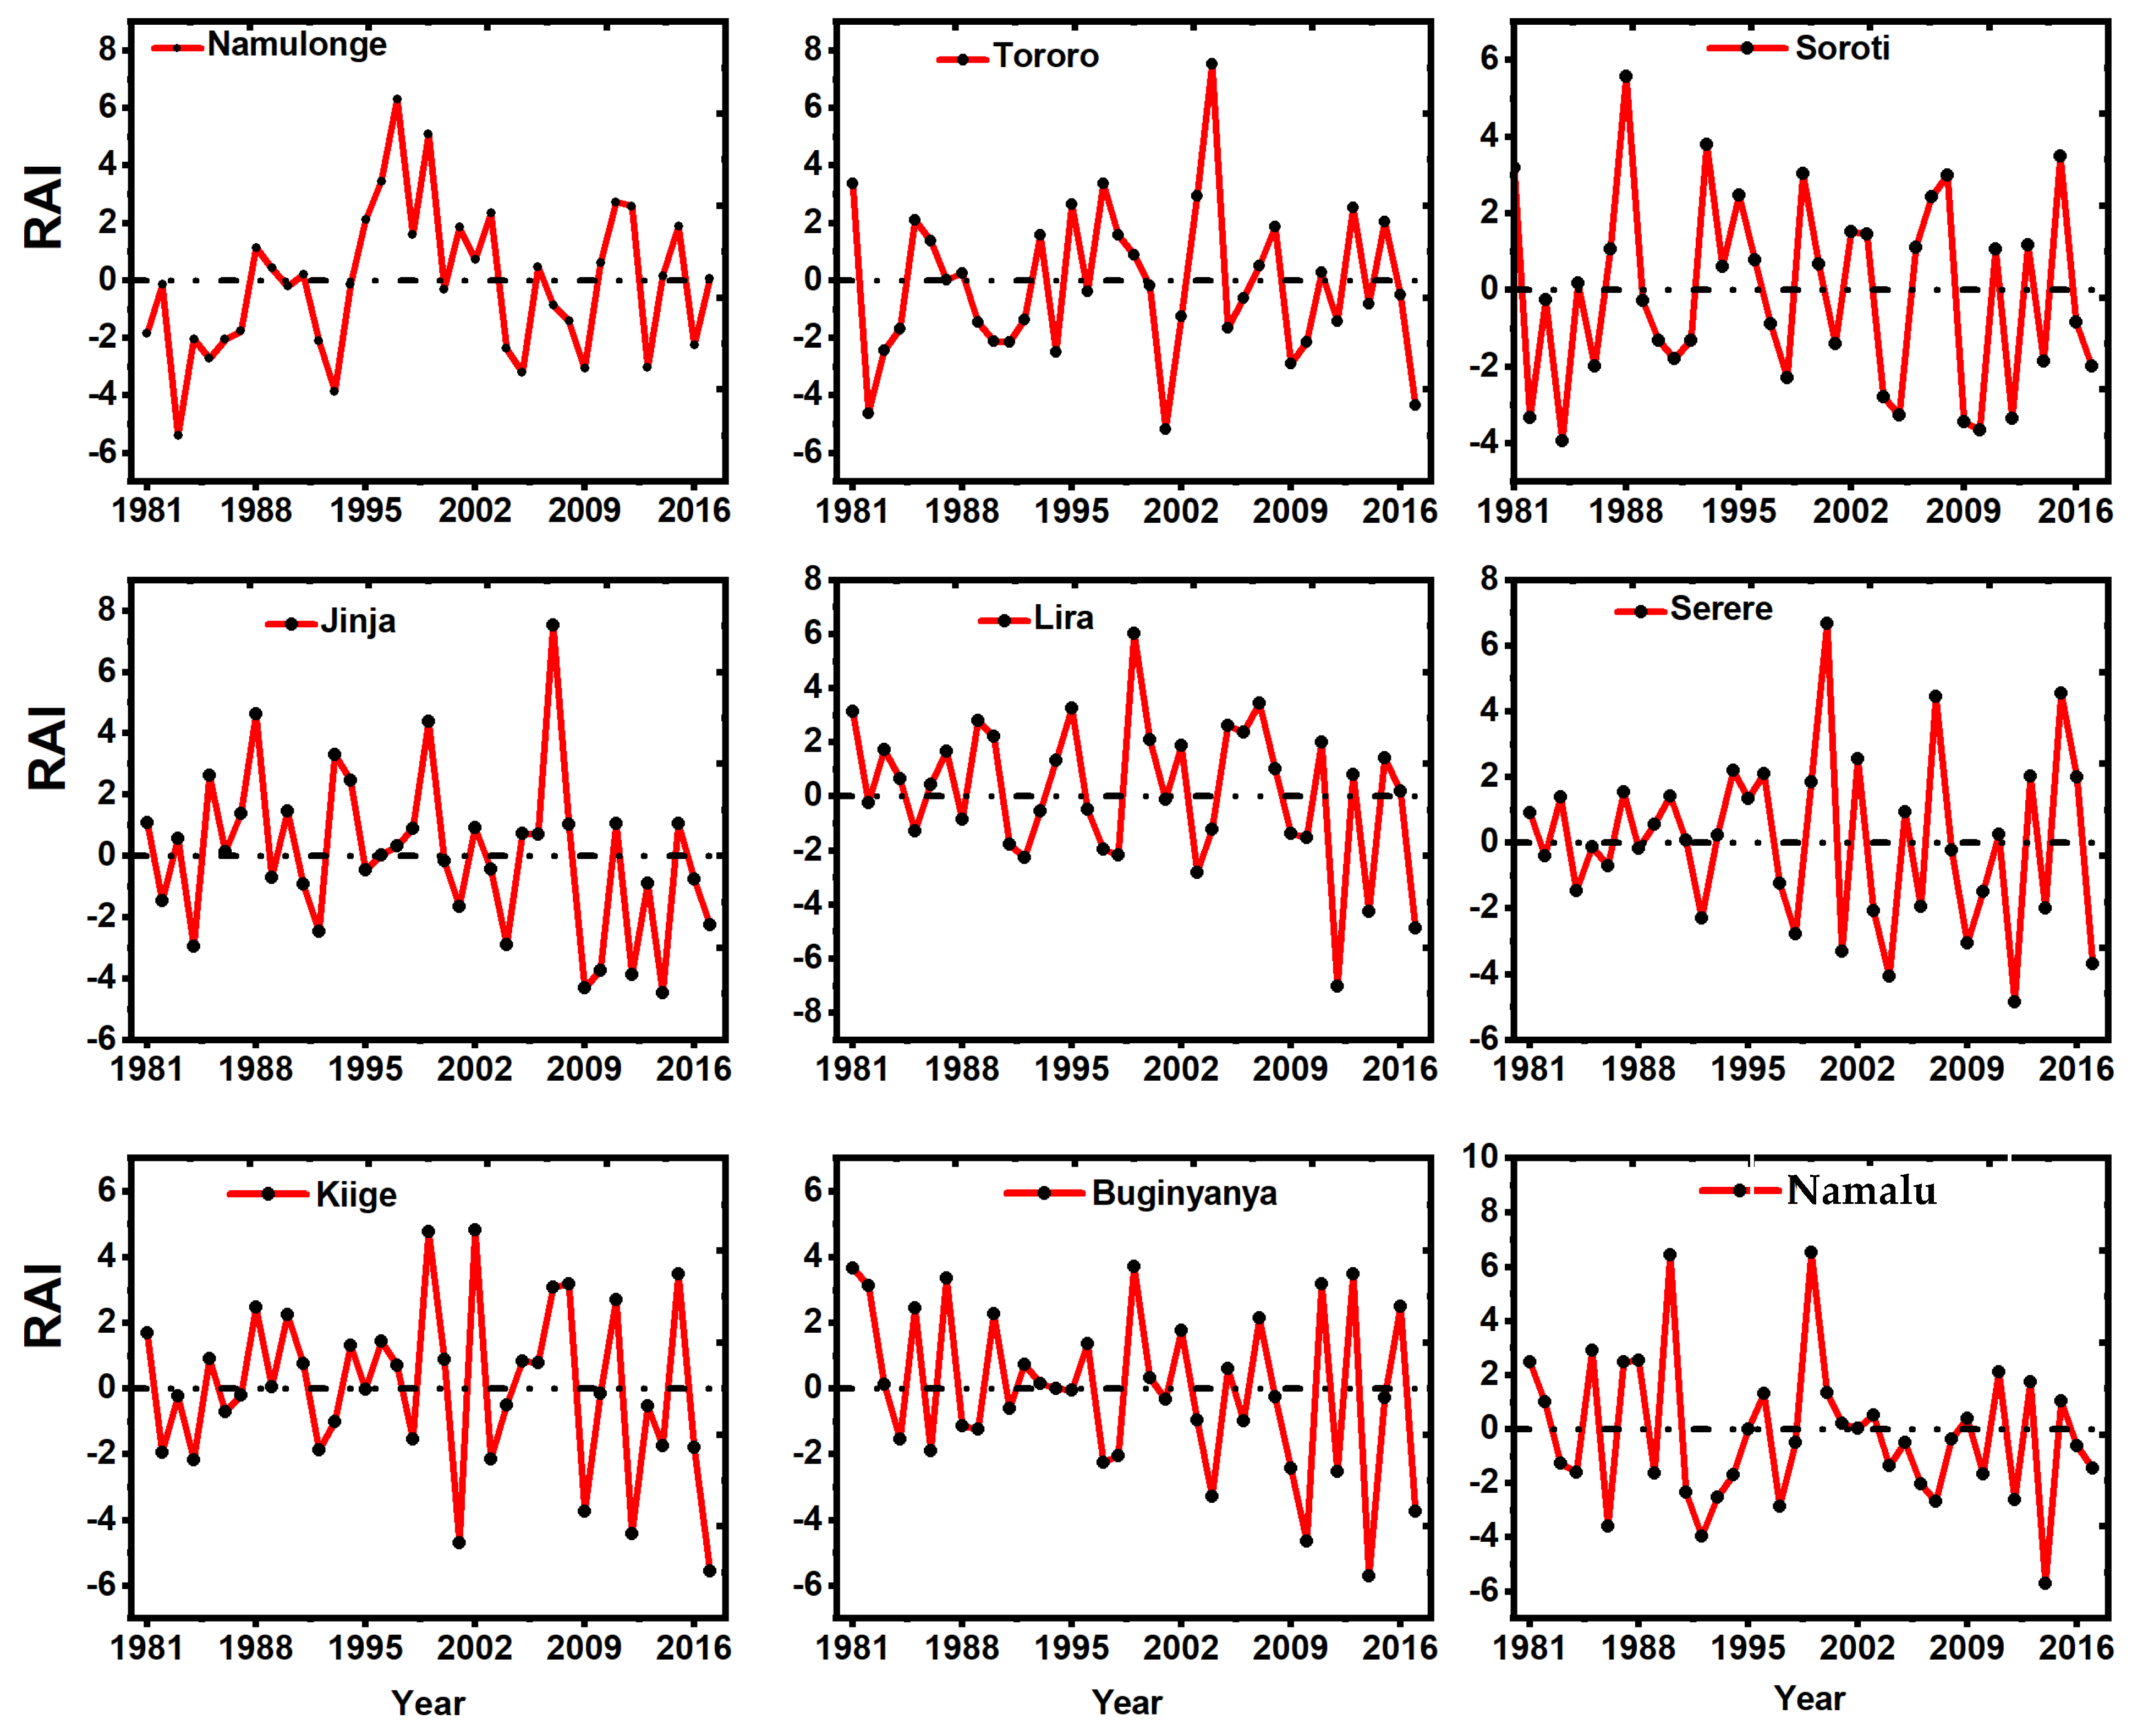
4.8. RAI over Lake Kyoga Basin for 1981–2017
5. Discussion
6. Conclusions
Author Contributions
Funding
Data Availability Statement
Conflicts of Interest
References
- Min, S.; Zhang, X.; Zwiers, F.W.; Hegerl, G.C. Human Contribution to More-Intense Precipitation Extremes. Nature 2011, 470, 378–381. [Google Scholar] [CrossRef] [PubMed]
- IPCC. Managing the Risks of Extreme Events and Disasters to Advance Climate Change Adaptation; IPCC: Geneva, Switzerland, 2012. [Google Scholar]
- IPCC. Climate Change 2014: Synthesis Report; Pachauri, R.K., Ed.; IPCC: Geneva, Switzerland, 2014. [Google Scholar]
- Adhikari, U.; Nejadhashemi, A.P.; Woznicki, S.A. Climate Change and Eastern Africa: A Review of Impact on Major Crops. Food Energy Secur. 2015, 4, 110–132. [Google Scholar] [CrossRef]
- Almazroui, M.; Saeed, F.; Saeed, S.; Islam, M.N.; Ismail, M. Projected Change in Temperature and Precipitation Over Africa from CMIP6. Earth Syst. Environ. 2020, 4, 455–475. [Google Scholar] [CrossRef]
- Nuwagira, U.; Yasin, I. Review of the Past, Current, and the Future Trend of the Climate Change and Its Impact in Uganda. East Afr. J. Environ. Nat. Resour. 2022, 5, 115–126. [Google Scholar] [CrossRef]
- Lobell, D.B.; Burke, M.B.; Tebaldi, C.; Mastrandrea, M.D.; Falcon, W.P.; Naylor, R.L. Prioritizing Climate Change Adaptation Needs for Food Security in 2030. Science 2008, 319, 607–610. [Google Scholar]
- Ongoma, V.; Chen, H.; Omony, G.W. Variability of Extreme Weather Events over the Equatorial East Africa, a Case Study of Rainfall in Kenya and Uganda. Theor. Appl. Climatol. 2018, 131, 295–308. [Google Scholar] [CrossRef]
- Government of Uganda; UNFPA. The State of Uganda Population Report 2009: Addressing the Effects of Climate Change on Migration; United Nations Population Fund: New York, NY, USA, 2009.
- MacLeod, D.; Caminade, C. The Moderate Impact of the 2015 El Niño over East Africa and Its Representation in Seasonal Reforecasts. J. Clim. 2019, 32, 7989–8001. [Google Scholar] [CrossRef]
- Palmer, P.I.; Wainwright, C.M.; Dong, B.; Maidment, R.I.; Wheeler, K.G.; Gedney, N.; Hickman, J.E.; Madani, N.; Folwell, S.S.; Abdo, G.; et al. Drivers and Impacts of Eastern African Rainfall Variability. Nat. Rev. Earth Environ. 2023, 4, 254–270. [Google Scholar] [CrossRef]
- Thornton, P.K.; Owiyo, T.; Jones, P.G.; Owiyo, T.; Kruska, R.L.; Herrero, M.; Orindi, V.; Bhadwal, S.; Kristjanson, P.; Notenbaert, A.; et al. Climate Change and Poverty in Africa: Mapping Hotspots of Vulnerability. Afr. J. Agric. Resour. Econ. 2008, 2, 24–44. [Google Scholar] [CrossRef]
- Shikuku, K.M.; Winowiecki, L.; Twyman, J.; Eitzinger, A.; Perez, J.G.; Mwongera, C.; Läderach, P. Climate Risk Management Smallholder Farmers’ Attitudes and Determinants of Adaptation to Climate Risks in East Africa. Clim. Risk Manag. 2017, 16, 234–245. [Google Scholar] [CrossRef]
- Schlenker, W.; Lobell, D.B. Robust Negative Impacts of Climate Change. Environ. Res. Lett. 2010, 5, 014010. [Google Scholar] [CrossRef]
- Pachauri, R.K.; Reisinger, A. Climate Change 2007: Synthesis Report. Contribution of Working Groups I, II and III to the Fourth Assessment Report of the Intergovernmental Panel on Climate Change; IPCC: Geneva, Switzerland, 2007. [Google Scholar]
- African Union. State of Africa’s Population 2017: Keeping Rights of Girls, Adolescents and Young Women at the Centre of Africa’s Demographic Dividend; African Union: Ababa, Ethiopia, 2017. [Google Scholar]
- Onyutha, C.; Acayo, G.; Nyende, J. Analyses of Precipitation and Evapotranspiration Changes across the Lake Kyoga Basin in East Africa. Water 2020, 12, 1134. [Google Scholar] [CrossRef]
- Mubialiwo, A.; Chelangat, C.; Onyutha, C. Changes in Precipitation and Evapotranspiration over Lokok and Lokere Catchments in Uganda. Bull. Atmos. Sci. Technol. 2021, 2, 2. [Google Scholar] [CrossRef]
- Atube, F.; Malinga, G.M.; Nyeko, M.; Okello, D.M.; Mugonola, B.; Omony, G.W.; Uma, I.O. Farmers’ Perceptions of Climate Change, Long-Term Variability and Trends in Rainfall in Apac District, Northern Uganda. CABI Agric. Biosci. 2022, 4, 1–16. [Google Scholar] [CrossRef]
- Obubu, J.P.; Mengistou, S.; Fetahi, T.; Alamirew, T.; Odong, R.; Ekwacu, S. Recent Climate Change in the Lake Kyoga Basin, Uganda: An Analysis Using Short-Term and Long-Term Data with Standardized Precipitation and Anomaly Indexes. Climate 2021, 9, 179. [Google Scholar] [CrossRef]
- Onyutha, C. Trends and Variability of Temperature and Evaporation over the African Continent: Relationships with Precipitation. Atmosfera 2021, 34, 267–287. [Google Scholar]
- Filahi, S.; Tanarhte, M.; Mouhir, L.; El Morhit, M.; Tramblay, Y. Trends in Indices of Daily Temperature and Precipitations Extremes in Morocco. Theor. Appl. Climatol. 2016, 124, 959–972. [Google Scholar] [CrossRef]
- Funk, C.; Peterson, P.; Landsfeld, M.; Pedreros, D.; Verdin, J.; Shukla, S.; Husak, G.; Rowland, J.; Harrison, L.; Hoell, A.; et al. The Climate Hazards Infrared Precipitation with Stations—A New Environmental Record for Monitoring Extremes. Sci. Data 2015, 2, 1–21. [Google Scholar] [CrossRef]
- Wainwright, C.M.; Marsham, J.H.; Keane, R.J.; Rowell, D.P.; Finney, D.L.; Black, E.; Allan, R.P. ‘Eastern African Paradox’ Rainfall Decline Due to Shorter Not Less Intense Long Rains. Npj Clim. Atmos. Sci. 2019, 2, 1–9. [Google Scholar] [CrossRef]
- Maidment, R.I.; Grimes, D.; Black, E.; Tarnavsky, E.; Young, M.; Greatrex, H.; Allan, R.P.; Stein, T.; Nkonde, E.; Senkunda, S.; et al. Data Descriptor: A New, Long-Term Daily Satellite-Based Rainfall Dataset for Operational Monitoring in Africa. Sci. Data 2017, 4, 170063. [Google Scholar] [CrossRef]
- Taylor, K.E. Taylor Diagram Primer. 2005. Available online: https://pcmdi.llnl.gov/staff/taylor/CV/Taylor_diagram_primer.pdf (accessed on 20 January 2025).
- Mann, H.B. Non-Parametric Test Against Trend. Econometrica 1945, 13, 245–259. [Google Scholar]
- Kendall, M.G. Appendix: Mann-Kendall Trend Tests; Oxford University Press: Oxford, UK, 1975; p. 202. [Google Scholar]
- Ayugi, B.O.; Tan, G. Recent Trends of Surface Air Temperatures over Kenya from 1971 to 2010. Meteorol. Atmos. Phys. 2019, 131, 1401–1413. [Google Scholar] [CrossRef]
- Theil, H. A Rank-Invariant Method of Linear and Polynomial Regression Analysis. In Henri Theil’s Contributions to Economics and Econometrics; Springer: Dordrecht, The Netherlands, 1950; pp. 345–381. [Google Scholar] [CrossRef]
- Sen, P.K. Estimates of the Regression Coefficient Based on Kendall’s Tau. Am. Stat. Assoc. 1968, 63, 1379–1389. [Google Scholar] [CrossRef]
- Mumo, L.; Yu, J.; Ayugi, B. Evaluation of Spatiotemporal Variability of Rainfall over Kenya from 1979 to 2017. J. Atmos. Sol. Terr. Phys. 2019, 194, 105097. [Google Scholar] [CrossRef]
- Caloiero, T.; Coscarelli, R. Analysis of the Characteristics of Dry and Wet Spells in a Mediterranean Region. Environ. Process. 2020, 7, 691–701. [Google Scholar]
- Kendon, E.J.; Stratton, R.A.; Tucker, S.; Marsham, J.H.; Berthou, S.; Rowell, D.P.; Senior, C.A. Enhanced Future Changes in Wet and Dry Extremes over Africa at Convection-Permitting Scale. Nat. Commun. 2019, 10, 1794. [Google Scholar] [CrossRef]
- Tilahun, K. Analysis of Rainfall Climate and Evapo-Transpiration in Arid and Semi-Arid Regions of Ethiopia Using Data over the Last Half a Century. J. Arid Environ. 2006, 64, 474–487. [Google Scholar] [CrossRef]
- Hänsel, S.; Schucknecht, A.; Matschullat, J. The Modified Rainfall Anomaly Index (MRAI)—Is This an Alternative to the Standardised Precipitation Index (SPI) in Evaluating Future Extreme Precipitation Characteristics? Theor. Appl. Climatol. 2015, 123, 827–844. [Google Scholar] [CrossRef]
- Kansiime, M.K.; Wambugu, S.K.; Shisanya, C.A. Perceived and Actual Rainfall Trends and Variability in Eastern Uganda: Implications for Community Preparedness and Response. J. Nat. Sci. Res. 2013, 3, 179–195. [Google Scholar]
- Indeje, M.; Semazzi, F.H.M.; Ogallo, L.J. ENSO Signals in East African Rainfall Seasons. Int. J. Climatol. 2000, 46, 19–46. [Google Scholar] [CrossRef]
- Brown, E.; Sutcliffe, J.V.; Brown, E.; John, V. The Water Balance of Lake Kyoga, Uganda the Water Balance of Lake Kyoga, Uganda. Hydrol. Sci. J. 2013, 58, 341–353. [Google Scholar] [CrossRef]
- Ogwang, B.; Nimusiima, A.; Tindamanyire, T.; Serwanga, M.; Ayesiga, G.; Ojara, M.; Ssebabi, F.; Gugwa, G.; Nsubuga, Y.; Atim, R.; et al. Characteristics and Changes in SON Rainfall Over. J. Environ. Agric. Sci. 2016, 8, 45–53. [Google Scholar]
- Mubiru, D.N.; Komutunga, E.; Agona, A.; Apok, A.; Ngara, T. Characterising Agrometeorological Climate Risks and Uncertainties: Crop Production in Uganda. S. Afr. J. Sci. 2012, 108, 108–118. [Google Scholar] [CrossRef]
- Nsubuga, F.W.; Rautenbach, H. Climate Change and Variability: A Review of What Is Known and Ought to Be Known For. Int. J. Clim. Change Strateg. Manag. 2018, 10, 752–771. [Google Scholar] [CrossRef]
- NAPA. Climate Change: Uganda National Adaptation Programmes of Action (NAPA); Ministry of Water and Environment (MWE): Kampala, Uganda, 2007.
- Rowell, D.P.; Booth, B.B.; Nicholson, S.E.; Good, P. Reconciling Past and Future Rainfall Trends over East Africa. J. Clim. 2015, 28, 9768–9788. [Google Scholar] [CrossRef]
- Clive, A.S. The Changing Climate of Africa Part I: Introduction and Eastern Africa. In African Ecology—Benchmarks and Historical Perspectives; Springer: Berlin/Heidelberg, Germany, 2012; pp. 57–140. ISBN 9783642228711. [Google Scholar]
- Kizza, M.; Rodhe, A.; Xu, C.-Y.; Ntale, H.K.; Halldin, S. Temporal Rainfall Variability in the Lake Victoria Basin in East Africa during the Twentieth Century. Theor. Appl. Climatol. 2009, 98, 119–135. [Google Scholar] [CrossRef]
- Nsubuga, F.W.N.; Olwoch, J.M.; Rautenbach, C.J.D.W. Climatic Trends at Namulonge in Uganda: 1947–2009. J. Geogr. Geol. 2011, 3, 119–131. [Google Scholar] [CrossRef]
- Saji, N.H.; Vinayachandran, P.N. A Dipole Mode in the Tropical Indian Ocean. Nature 1999, 401, 360–363. [Google Scholar]
- Behera, S.K.; Luo, J.J.; Masson, S.; Delecluse, P.; Gualdi, S.; Navarra, A.; Yamagata, T. Paramount Impact of the Indian Ocean Dipole on the East African Short Rains: A CGCM Study. J. Clim. 2005, 18, 4514–4530. [Google Scholar] [CrossRef]
- Ogwang, B.A.; Chen, H.; Li, X.; Gao, C. The Influence of Topography on East African October to December Climate: Sensitivity Experiments with RegCM4. Adv. Meteorol. 2014, 2014, 14. [Google Scholar] [CrossRef]
- Ayugi, B.; Tan, G.; Rouyun, N.; Zeyao, D.; Ojara, M.; Mumo, L.; Babaousmail, H.; Ongoma, V. Evaluation of Meteorological Drought and Flood Scenarios over Kenya, East Africa. Water 2020, 11, 307. [Google Scholar] [CrossRef]
- Ghaleb, F.; Mario, M.; Sandra, A. Regional Landsat-Based Drought Monitoring from 1982 to 2014. Climate 2015, 3, 563–577. [Google Scholar] [CrossRef]
- Lyon, B.; Dewitt, D.G. A Recent and Abrupt Decline in the East African Long Rains. Geophys. Res. Lett. 2012, 39, 1–5. [Google Scholar] [CrossRef]
- Cai, W.; Borlace, S.; Lengaigne, M.; Van Rensch, P.; Collins, M. Increasing Frequency of Extreme El Niño Events Due to Greenhouse Warming. Nat. Clim. Change 2014, 4, 111–116. [Google Scholar] [CrossRef]
- Nicholson, S.E. Climate and Climatic Variability of Rainfall over Eastern Africa. Rev. Geophys. 2017, 55, 590–635. [Google Scholar] [CrossRef]
- ACF. 2015/16 El Nino Event Global Report; ACF: London, UK, 2015. [Google Scholar]
- Ntale, H.K.; Gan, T.Y. East African Rainfall Anomaly Patterns in Association with El Niño/Southern Oscillation. J. Clim. 2004, 9, 257–268. [Google Scholar] [CrossRef]
- UNISDR. Progress and Challenges in Disaster Risk Reduction: A Contribution Towards the Development of Policy Indicators for the Post-2015 Framework for Disaster Risk Reduction; ISDR: Geneva, Switzerland, 2014. [Google Scholar]


| Stations | Longitude (Degree) | Latitude (Degree) | Elevation (Meters) | Data Period (Years) | Rainfall Zones |
|---|---|---|---|---|---|
| Namulonge | 32.6 | 0.5 | 1128.3 | 1981–2017 | B |
| Tororo | 34.2 | 0.7 | 1176 | 1981–2017 | D |
| Soroti | 33.6 | 1.7 | 1115.8 | 1981–2017 | E |
| Jinja | 33.1 | 0.5 | 1175.1 | 1981–2017 | A2 |
| Lira | 32.3 | 2.2 | 1120.2 | 1981–2017 | I |
| Serere | 33.5 | 1.5 | 1098 | 1961–2017 | E |
| Kiige | 33 | 1.1 | 1089.4 | 1981–2017 | B |
| Buginyanya | 34.4 | 1.3 | 1875 | 1981–2017 | F |
| Kotido | 34.1 | 3 | 1219.5 | 1981–2017 | G |
| Namalu | 34.8 | 2 | 1274.4 | 1981–2017 | L |
| Annual | MAM | SOND | |||||||||||||
|---|---|---|---|---|---|---|---|---|---|---|---|---|---|---|---|
| Station | Mean (mm) | Max (mm) | Min (mm) | p-v (MK) | Sen’s Slope (mm/Decade) | Mean (mm) | Max (mm) | Min (mm) | p-v (MK) | Sen’s Slope (mm/Decade) | Mean (mm) | Min (mm) | Max (mm) | p-v (MK) | Sen’s Slope (mm/Decade) |
| Namalu | 1180.6 | 1633.5 | 765.0 | 0.01 * | 87.8 | 385.0 | 534.3 | 236.5 | 0.539 | 11.8 | 346.5 | 184.7 | 673.1 | 0.00 | 5.9 |
| Buginyanya | 1719.6 | 3179.4 | 2064 | 0.11 | 63.9 | 526.7 | 681.7 | 337.0 | 0.539 | 9.9 | 560.1 | 224.4 | 861.5 | 0.04 | 4.9 |
| Kiige | 1272.4 | 1530.7 | 958.5 | 0.16 | 32.6 | 467.1 | 645.1 | 364.7 | 0.685 | −4.7 | 460.6 | 180.3 | 723.8 | 0.09 | 3.4 |
| Namulonge | 1719.6 | 2015.7 | 1240.5 | 0.27 | 52.9 | 470.7 | 615.4 | 326.3 | 0.647 | 4.3 | 452.8 | 140.9 | 772.6 | 0.72 | 12.3 |
| Soroti | 1411.9 | 1813.9 | 1148.0 | 0.25 | 30.3 | 484.8 | 660.0 | 366.5 | 0.969 | −7.0 | 455.0 | 244.0 | 740.2 | 0.34 | 32 |
| Tororo | 1573.3 | 2203.5 | 1191.8 | 0.01 * | 8.6 | 578.1 | 773.9 | 411.2 | 0.410 | 7.8 | 532.9 | 153.8 | 955.1 | 0.01 | 68.7 |
| Jinja | 1331.9 | 1739.1 | 1073.5 | 0.02 * | 50.4 | 476.8 | 612.5 | 318.9 | 0.244 | 12.7 | 489.7 | 167.0 | 863.2 | 0.41 | 29.1 |
| Lira | 1405.6 | 1698.0 | 997.3 | 0.38 | 19.6 | 425.8 | 534.1 | 296.6 | 0.302 | −10.5 | 484.8 | 202.0 | 707.4 | 0.23 | 30.1 |
| MAM | SOND | ||||||
|---|---|---|---|---|---|---|---|
| Station | Statistics | Onset (Dates) | Cessation (Dates) | Seasonal Length Months | Onset (Date) | Cessation (Dates) | Seasonal Length Days |
| Soroti | Mean | 15 March | 27 June | 3.5 | 21 July | 15 November | 3.7 |
| Minimum | 29 February | 30 May | 2.0 | 1 July | 1 November | 1.8 | |
| Maximum | 15 April | 29 September | 6.7 | 23 October | 31 December | 5.3 | |
| CV | 11% | 11% | 33% | 11% | 5% | 5% | |
| Namulonge | Mean | 30 March | 22 June | 2.7 | 21 August | 24 November | 3.1 |
| Minimum | 3 March | 1 June | 1.0 | 1 August | 1 November | 1.6 | |
| Maximum | 14 May | 10 August | 4.6 | 31 October | 26 December | 4.4 | |
| CV | 22% | 9% | 30% | 9% | 6% | 22% | |
| Tororo | Mean | 19 March | 7 July | 3.6 | 26 August | 7 December | 3.3 |
| Minimum | 1 March | 1 June | 2.2 | 1 August | 17 November | 1.5 | |
| Maximum | 27 April | 15 October | 6.2 | 7 October | 31 December | 4.7 | |
| CV | 19% | 16% | 27% | 8% | 5% | 23% | |
| Buginyanya | Mean | 16 March | 13 July | 6.5 | 4 September | 24 November | 2.7 |
| Minimum | 29 February | 29 June | 6.0 | 19 August | 20 November | 3.1 | |
| Maximum | 26 April | 29 November | 11.1 | 4 November | 24 December | 3.3 | |
| CV | 21% | 16% | 23% | 7% | 3% | 20% | |
| Lira | Mean | 29 March | 6 August | 2.9 | 14 August | 27 November | 3.4 |
| Minimum | 2 March | 3 June | 2.0 | 1 August | 1 November | 3.0 | |
| Maximum | 17 May | 14 December | 4.5 | 9-Oct | 30 December | 3.6 | |
| CV | 19% | 31% | 1% | 7% | 5% | 1% | |
Disclaimer/Publisher’s Note: The statements, opinions and data contained in all publications are solely those of the individual author(s) and contributor(s) and not of MDPI and/or the editor(s). MDPI and/or the editor(s) disclaim responsibility for any injury to people or property resulting from any ideas, methods, instructions or products referred to in the content. |
© 2025 by the authors. Licensee MDPI, Basel, Switzerland. This article is an open access article distributed under the terms and conditions of the Creative Commons Attribution (CC BY) license (https://creativecommons.org/licenses/by/4.0/).
Share and Cite
Babaousmail, H.; Ojara, M.A. Evaluation of Historical Dry and Wet Periods over Lake Kyoga Basin in Uganda. Water 2025, 17, 1044. https://doi.org/10.3390/w17071044
Babaousmail H, Ojara MA. Evaluation of Historical Dry and Wet Periods over Lake Kyoga Basin in Uganda. Water. 2025; 17(7):1044. https://doi.org/10.3390/w17071044
Chicago/Turabian StyleBabaousmail, Hassen, and Moses A. Ojara. 2025. "Evaluation of Historical Dry and Wet Periods over Lake Kyoga Basin in Uganda" Water 17, no. 7: 1044. https://doi.org/10.3390/w17071044
APA StyleBabaousmail, H., & Ojara, M. A. (2025). Evaluation of Historical Dry and Wet Periods over Lake Kyoga Basin in Uganda. Water, 17(7), 1044. https://doi.org/10.3390/w17071044