Article

Multiscale Factors Driving Extreme Flooding in China’s Pearl River Basin During the 2022 Dragon Boat Precipitation Season

1
Guangzhou Meteorological Observatory, Guangzhou 511430, China
2
Guangdong Meteorological Observatory, Guangzhou 510641, China
3
Guangzhou Institute of Tropical and Marine Meteorology, China Meteorological Administration, Guangzhou 510641, China
*
Author to whom correspondence should be addressed.
Water 2025, 17(7), 1013; https://doi.org/10.3390/w17071013
Submission received: 7 February 2025 / Revised: 24 March 2025 / Accepted: 24 March 2025 / Published: 29 March 2025
(This article belongs to the Special Issue Climate Change and Hydrological Processes)

Abstract

:
This study delves into the once-in-a-century extreme precipitation events in the northern region of the Pearl River Basin during the 2022 Dragon Boat Festival period. Through a comprehensive analysis spanning various temporal scales, from synoptic-scale systems to subseasonal oscillations, including the rare triple-peaked La Niña phenomenon, we illuminate the intricate interactions among these factors and their impact on extreme precipitation events. Specifically, we present a conceptual model of multiscale interaction systems contributing to extreme precipitation in the BeiJiang Basin. Our findings reveal that, during the 2022 Dragon Boat Festival period, precipitation in the BeiJiang Basin exhibited characteristics across multiple time scales, with the synoptic-scale environment proving highly conducive. Systems such as the South Asian High, Western Pacific Subtropical High, and South China Sea summer monsoon were identified as the direct influencing factors of precipitation. Importantly, our study highlight the pivotal role of subseasonal oscillation propagation stagnation in extreme precipitation in the BeiJiang Basin, with synoptic-scale systems playing a contributing role. We emphasize the indirect influence of ENSO signals, regulating not only monsoons but also the propagation of subseasonal oscillations. The interplay of these factors across different temporal scales significantly impacts flood hazards. Overall, our study significantly enhances the understanding of mechanisms driving extreme precipitation events in the Pearl River Basin, with profound implications for water resource management and disaster prevention.

1. Introduction

“Dragon-Boat Precipitation (DBP)” refers to intense rainfall occurring in southern China during the Dragon Boat Festival period, typically from late May to mid-June (21 May–21 June). It is associated with the South China Sea (SCS) summer monsoon, convective precipitation, and frontal precipitation from the convergence of cold and warm air masses [1]. The Beijiang River Basin (BJB), one of the three major rivers of the Pearl River Basin (PRB, shown in Figure 1), mainly flows through Guangdong Province before merging with Xijiang River to form the Pearl River Delta and finally emptying into the SCS. With a total length of approximately 470 km and a basin area of 42,930 km2, the BJB is the second largest river in the PRB and one of the most important rivers in Guangdong Province. The basin experiences a humid subtropical climate, with a long-term mean annual precipitation of approximately 1700 mm and a mean annual potential evapotranspiration (PET) exceeding 1200 mm. These climatic conditions, combined with the region’s complex topography, make the BJB highly susceptible to extreme rainfall and flooding events. In 2022, the PRB experienced multiple episodes of heavy rainfall, leading to widespread flooding. The BJB, a major sub-basin of the PRB, witnessed two significant flood events, which were officially designated as the first and second floods of the year. These floods occurred at 11:00 on 14 June and 12:00 on 19 June, respectively, marking the most severe flooding in the region since 1915 [2]. These statistics highlight the importance of accurate precipitation forecasting for river basins, especially in regions like the PRB where extreme rainfall events have significant socio-economic impacts.
Heavy rainfall results from the interactions among various systems operating at multiple temporal scales. Particularly, extreme or persistent heavy rainfall occurs when systems at different scales (planetary, synoptic, mesoscale, and small-scale) interact significantly. Among these multiscale systems, while planetary-scale systems (3000–8000 km) do not directly cause heavy rainfall, they play a crucial role in events lasting over two days by influencing the movement of synoptic-scale systems, thereby indirectly affecting heavy rainfall. For instance, pre-flood precipitation in southern China exhibits distinct subseasonal variability [3,4,5,6], with periods of increased and decreased rainfall occurring on time scales of 10–20 days and 30–60 days. The low-frequency characteristics of precipitation are primarily driven by low-frequency variations in atmospheric circulation. A key modulator of rainfall anomalies in southern China, particularly extreme rainfall events [7,8], is the Madden–Julian Oscillation (MJO) [9,10]. The MJO is a large-scale tropical phenomenon characterized by eastward-propagating anomalies in rainfall and circulation, with typical timescale of 30–60 days. Originating over the Indian Ocean, it propagates eastward across the Maritime Continent and into the Pacific Ocean, exerting a global influence on weather patterns. During specific phases, the MJO enhances convective activity and moisture transport via teleconnection waves, leading to increased rainfall in regions such as southern China. This oscillatory behavior makes the MJO a crucial predictor of subseasonal weather variability, especially in monsoon regions. The eastward propagation of MJO convection, from the western Indian Ocean to the western Pacific, is commonly monitored using the real-time multivariate MJO (RMM) index [11], which divides MJO activity into eight phases. Phases 2–3 and 6–7 are particularly significant, representing “wet” and “dry” phases, respectively, that strongly influence pre-flood precipitation in southern China. Recent research has also highlighted the significant impact of prolonged stagnation of the MJO in specific phases on persistent heavy rainfall in certain regions. For example, Roxy et al. [12] attributed strong Southeast Asian rainfall in 2011 to the long-term stagnation of the MJO in phases 5–7. Chinese scholars have also indicated that the prolonged stagnation of MJO convection in the Indian Ocean region (phases 1–2) was a key factor in the occurrence of super-heavy rainfall events in the Yangtze River Basin in 2020 [13,14].
At seasonal and longer time scales, the El Niño-Southern Oscillation (ENSO) is the strongest signal of the tropical Pacific Ocean–atmosphere interaction on interannual scales and is a crucial influencing factor on East Asian climate [15]. ENSO is a natural climate phenomenon characterized by periodic fluctuations in sea surface temperatures (SSTs) and atmospheric pressure in the tropical Pacific Ocean. It consists of two main phases: El Niño, associated with warmer-than-average SSTs in the central and eastern Pacific, and La Niña, associated with cooler-than-average SSTs in the same region. These phases alter global atmospheric circulation patterns, leading to significant impacts on weather and climate worldwide. China, located in eastern Asia, is profoundly influenced by the East Asian monsoon. The timing and intensity of the onset of the South China Sea (SCS) summer monsoon are modulated by ENSO [16,17,18,19], thereby regulating the intensity and frequency of rainfall, including extreme rainfall events [20], in southern China. For example, during El Niño years, the SCS summer monsoon tends to be weaker and delayed, often resulting in reduced rainfall. Conversely, during La Niña years, the monsoon is typically stronger and earlier, leading to increased rainfall and a higher likelihood of extreme precipitation events.
Given that multiscale factors may modulate precipitation in South China, analyzing only the synoptic-scale systems responsible for flood-triggering heavy rainfall is insufficient to fully explain this extreme event. Previous studies on the causes of extreme rainfall in 2022 have mostly focused on the synoptic scale [1,21,22,23,24] or individual influencing systems with longer timescales [7,8,13,20,25], with fewer studies revealing the causes from the perspective of multiscale influencing factors. This paper focuses on why the BJB experienced a once-in-a-century flood-triggering heavy rainfall event in 2022 [2]. The aim is to reveal the causes of flood-triggering precipitation in the BJB during the DBP period in 2022 from the perspective of multiscale influencing systems and their interactions. While our study aims to provide a comprehensive understanding of the multiscale factors contributing to the 2022 DBP event in the BJB, it is important to acknowledge some research limitations. Firstly, while we focus on the key multiscale systems and their interactions, the complexity of the atmospheric system means that other factors may also play a role, which may not be fully captured in this study. Secondly, data availability and resolution constraints may limit the depth and precision of our analysis, particularly at smaller scales. Despite these limitations, this paper will provide valuable insights into the multiscale mechanisms that contributed to the once-in-a-century flood-triggering heavy rainfall event in the BJB region in 2022.
The remaining sections of this paper are structured as follows: Section 2 presents the data and methods utilized. Section 3 discusses the multiscale characteristics of the flood-triggering heavy rainfall in the BJB during the 2022 Dragon Boat Festival. Following that, Section 4 reveals the influences of multiscale factors on the extreme DBP events. Finally, Section 5 offers a summary and discussion.

2. Data and Methods

This study explores the relationship between heavy precipitation events in the BJB and various multiscale factors by utilizing multiple data sources. Specifically, we utilized precipitation data from the Global Precipitation Measurement (GPM) and Tropical Rainfall Measuring Mission (TRMM) satellites [26,27], as well as precipitation data from national and regional meteorological stations collected and compiled by the China Meteorological Administration’s (CMA) National Meteorological Information Center. Since the TRMM satellite concluded its mission in April 2015, with the GPM satellite succeeding its tasks, we merged the precipitation data from both satellites into a single-gridded precipitation dataset. It is noteworthy that we validated the satellite precipitation data using station-based precipitation data, and the results remained consistent regardless of the precipitation product chosen, indicating independence from the choice of precipitation product. Furthermore, we employed circulation and humidity fields from European Centre for Medium-Range Weather Forecasts (ECMWF) Reanalysis 5th Generation (ERA5) data [28], as well as outgoing longwave radiation (OLR) data [29] and sea surface temperature (SST) data [30] from the National Oceanic and Atmospheric Administration (NOAA).
To monitor the activity of tropical intraseasonal signals, we adopted the Boreal Summer Intraseasonal Oscillation (BSISO) index [31]. The BSISO index is a widely used metric to track the evolution of large-scale tropical convection and circulation patterns during the boreal summer (May–October). It captures two main modes of variability: BSISO1, which operate on a 30–60 day timescale, and BSISO2, which operates on a 10–30 day timescale. These modes are characterized by the northward and eastward propagation of rainfall and wind anomalies, influencing monsoon activity and extreme weather events in regions such as South Asia and East Asia. By dividing BSISO activity into eight phases, the index provides a framework for understanding the spatial and temporal evolution of intraseasonal variability, making it a valuable tool for studying subseasonal climate phenomena (see Table 1).
In Figure 2, we employ the precipitation anomaly percentage to describe the deviation of precipitation from a reference period or long-term average (for example, the temporal coverage for precipitation data are from 1998 to 2002, while for ERA5 data, it is from 1991 to 2020). The formula for calculating the anomaly percentage is as follows:
A P = A n o m L T M × 100 %
where AP represents the anomaly percentage, anomaly represents the anomaly value, and LTM represents the climatological mean.
When conducting significance tests for correlation coefficients, this study employs the t-test formula (as shown in Equation (2)) at a 95% confidence level with (n − 2) degrees of freedom (where n is the sample size) to compute the critical value of the correlation coefficient. If the absolute value of the calculated correlation coefficient exceeds the critical value, it is considered to pass the significance test. The t-test was chosen because it is robust and widely used for comparing two groups under the assumption of normally distributed data, and a 95% confidence level (p < 0.05) was selected to ensure the balance between Type I and Type II errors, consistent with common practices in climate studies. Sensitivity tests were conducted using 90% and 99% confidence levels to ensure the robustness of our findings.
t = r n 2 1 r 2

3. The Multiscale Nature of Flood-Inducing Rainfall in the BJB

The precipitation during this event exhibited a typical pattern of more rainfall in the north and less in the south (see Figure 2). Specifically, the BJB became the epicenter of this precipitation event, with an accumulated rainfall of 1200 mm and a precipitation anomaly percentage of 200%. The immense cumulative precipitation during this event far exceeded the long-term average, leading to a once-in-a-century flood in the BJB.
We selected the region between 23.5–25° N and 112–115° E as the primary precipitation zone in the BJB. During the 32-day period of DBP in 2022, as shown in Figure 3a, precipitation exceeded historical climatological norms on 18 days. From 12 June to 21 June, daily cumulative precipitation exceeded the historical average by an average of 39 mm (range: 9–72 mm), with consecutive days of precipitation surpassing double the historical average after 16 June. A t-test confirmed that the daily precipitation during this period was significantly higher than the historical average (p < 0.01). This period represented the peak of precipitation during the 2022 DBP, significantly increasing the flood control pressures in the area.
During the 2022 DBP, the precipitation in the BJB exhibited significant multiscale characteristics. From a synoptic-scale perspective (Figure 3b), the maximum daily rainfall in the BJB during the DBP was comparable to that of February and March of the same year, indicating that individual daily rainfall events were not extreme. However, it was precisely at the subseasonal scale that we observed a notable peak in precipitation. The moving average results (illustrated by the green line for 5-day average and red line for 10-day averages) clearly highlighted the pronounced subseasonal scale characteristics of basin precipitation. Remarkably, subseasonal scale precipitation in the BJB peaked during the 2022 DBP. This emphasizes the crucial role likely played by subseasonal scale signals in the extreme precipitation event of 2022. Taking a broader temporal perspective, comparing the precipitation levels during DBP across different years (Figure 3c), the annual precipitation in the BJB during the 2022 DBP period peaked, surpassing that of 2008, a year previously regarded as experiencing the strongest DBP in the history of Guangdong Province [21]. However, in 2008, the DBP precipitation was more concentrated in the coastal cities and counties of South China.
In brief, the precipitation during the 2022 DBP period exhibited a distinct north–south gradient and historical extremity, serving as the primary cause of the flood-triggering heavy rainfall in the BJB. The precipitation in the BJB during this period displayed multiscale characteristics. From a synoptic-scale perspective, the basin-average precipitation did not show historical extremity. The occurrence of flood-triggering precipitation in the BJB in 2022 can be attributed to the prolonged duration and significant accumulation of rainfall during the DBP period, resulting in the historical extremity of precipitation on subseasonal and even climatic time scales. Therefore, comprehensively discussing the extremity of the 2022 DBP in the BJB necessitates the consideration of multiscale factors and the modulation effect of the entire climatic environment.

4. Impact of Multiscale Temporal Factors on Extreme Precipitation

The multiscale characteristics of heavy precipitation in the pre-flood season of the BJB in 2022 imply that key influencing factors may involve multiple temporal scales. Understanding these multiscale influencing factors and their interactions is crucial for effectively preventing and mitigating catastrophic flood-triggering heavy rainfall events. In the following, we will discuss the favorable conditions for this flood-triggering heavy rainfall event from the perspectives of synoptic-scale systems, subseasonal scale signals, and interannual scale background, focusing particularly on how the historical extremity of this precipitation event was formed.

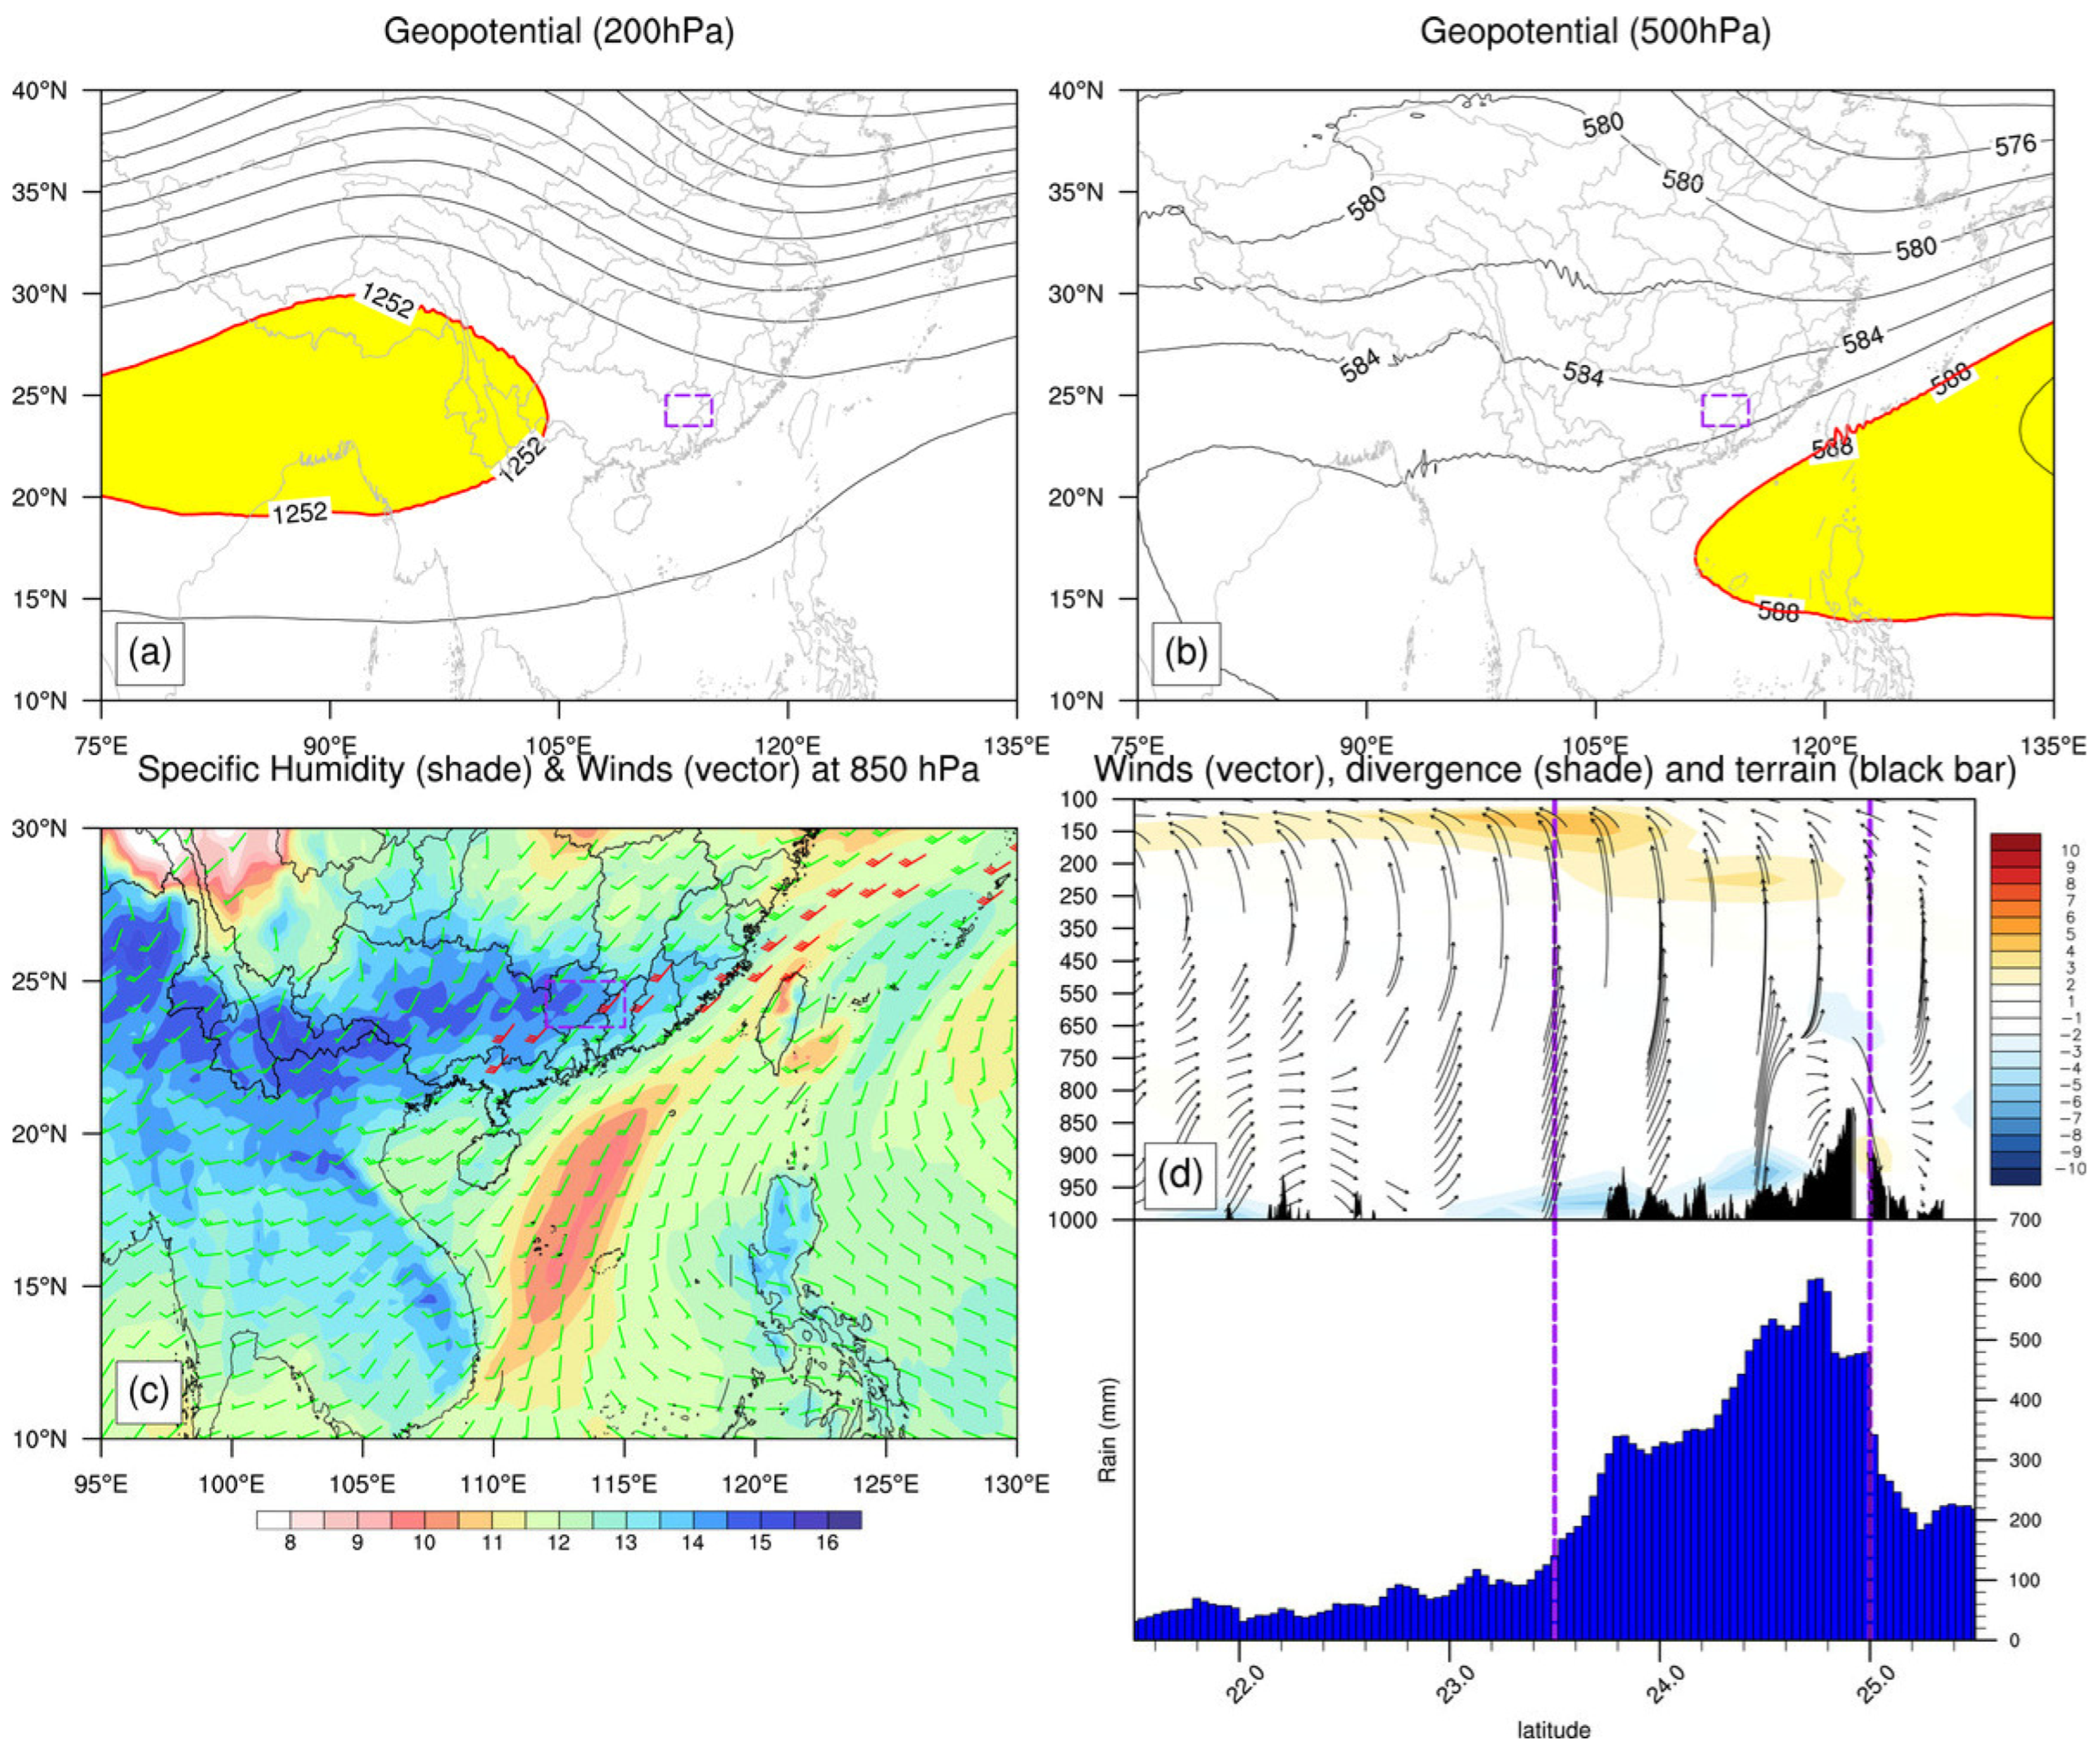
4.1. Favorable Synoptic Environments

The synoptic-scale systems play a direct and crucial role in precipitation, revealing not only the distribution, movement, and vertical motion of atmospheric moisture but also determining the location, intensity, and duration of precipitation. Therefore, the timely and accurate analysis and understanding of synoptic-scale patterns are essential for precipitation prediction and the mitigation of associated risks, such as flooding. Figure 4 illustrates the linear correlation of circulation patterns with precipitation in the BJB during the 2022 DBP period. A broad anticyclonic circulation is observed in the lower levels over the SCS, with Southern China situated to its north, promoting the onshore southwest monsoon flow. The upper-level divergence field closely aligns with the precipitation area in the BJB, providing crucial clues for predicting precipitation regions. In the region controlled by the anticyclonic circulation (10–20° N), significant subsidence airflow is evident. Correspondingly, influenced by the convergence circulation of the southwest monsoon, significant upward motion is observed in the BJB. In summary, the combination of a lower-level anticyclonic circulation, enhanced southwest monsoon, upper-level divergence field, and the interplay between subsidence and upward airflows collectively constitutes a synoptic system configuration favorable for precipitation in the BJB region.
To clarify the backgrounds that contributed to the aforementioned circulation patterns, Figure 5 further elucidates the favorable environmental conditions prevalent during the post-June 12 period of the DBP, focusing on aspects such as dynamic fields (Figure 5a,b), water vapor distribution (Figure 5c), and geographical context (Figure 5d). As previously noted, the extreme event associated with the 2022 DBP predominantly unfolded after 12 June. Following this date, persistent heavy rainfall led to flood-inducing downpours in the BJB.
Dynamic fields like the South Asia High (SAH) and Western Pacific Subtropical High (WPSH) played pivotal roles in shaping these background field. The SAH, a high-pressure system in the upper troposphere, is typically centered over the Tibetan Plateau during summer. Meanwhile, the WPSH, a semi-permanent high-pressure system in the lower troposphere, influences moisture transport and precipitation patterns. The SAH was located over the Tibetan Plateau, with its core positioned over the northern Indian subcontinent or nearby regions, placing the BJB under the northwesterly flow along the northeastern edge of the SAH, precisely within the outflow divergence zone of this high-pressure system (Figure 5a). This location facilitates the upper-level divergence, thereby enhancing the atmospheric pumping action and favoring upward motion (Figure 5d). Meanwhile, the WPSH was located over the eastern SCS, and combined with shortwave trough fluctuations over the Tibetan Plateau region, further intensified the convergence of air masses with contrasting temperature and humidity from the north and south over Guangdong (Figure 6e).
It is worth noting that the specific position of the WPSH is crucial for determining the precipitation zones, as rainfall typically occurs on the northern side of the WPSH. When the WPSH’s main body extends northward, encompassing the entirety of South China, it results in prolonged periods of sunny, scorching, and arid weather. However, the WPSH maintained a generally southern position, situated over the eastern South China Sea and the western Pacific. This alignment allows WPSH’s southeastern easterly flow to merge smoothly with the southwesterly monsoon from the SCS. As depicted in Figure 5c, a high humidity zone is observed on the northern side of the WPSH, coupled with regions of high wind speeds associated with low-level jets. This combination results in the BJB being a zone of high water vapor flux, creating favorable moisture conditions conducive to precipitation.
Many studies have shown that low-level jets play a critical role in heavy rainfall during the pre-summer rainy season in South China [22,23]. During this event, the low-level jet also played a crucial role. Even the average low-level wind speed for the event reached the jet stream threshold of 12 m/s. On the mornings of June 18 and 19, maximum wind speeds of over 20 m/s and 16 m/s were recorded in Guangxi and Guangdong, respectively. The core of the jet extended from the northern SCS to inland Guangdong, with the precipitation area located in the jet’s exit region, consistent with the classical relationship between jets and heavy precipitation.
The terrain of the Nanling Mountains plays a crucial role in enhancing moisture convergence, which subsequently increases the precipitation intensity. As moist air moves inland, it encounters the windward slopes of the Nanling Mountains (Figure 5d). The interaction of this moist, low-level airflow with the mountain slopes creates an orographic effect, causing the horizontal convergence of the airflow as it slows and accumulates at the base of the mountains. This process forces the moist air to ascend, intensifying vertical motion. Additionally, the combination of low-level convergence and upper-level divergence over the mountainous region further supports uplift (Figure 5d), leading to strong convection and increased rainfall intensity on the windward slopes. This topographic influence is thus a key factor in amplifying precipitation during heavy rainfall events in the region.
Seasonal mean patterns provide a broader perspective on the occurrence of precipitation in the BJB region. However, to gain a deeper understanding of how synoptic disturbances impact precipitation in this area, we now delve into the daily evolution of key synoptic systems. These changes in atmospheric pressure systems can significantly influence the pathways and strength of monsoonal airflow, thereby affecting the spatiotemporal distribution of precipitation. Monitoring and studying the SAH and the WPSH is of great importance for predicting precipitation in South China. To achieve the real-time monitoring of the activity characteristics of these key synoptic systems, the scientific community calculates indices that reflect information on system intensity and position, tracking changes in these indices over time [32]. In operational weather forecasting, meteorologists typically observe the characteristic contours in the 200 hPa and 500 hPa geopotential height fields. Specifically, the 1252-dagpm line represents the SAH, while the 588-dagpm line represents the WPSH. This approach has proven to be both simple and effective, gaining popularity among forecasters [33].
Figure 6a,b illustrates the daily evolution of these two characteristic lines. From 12 June to 17 June, the core of the SAH moved westward. However, after 18 June, the SAH’s center began to shift northward from the northern part of the Indian subcontinent, gradually entering the Tibetan Plateau region. Overall, from 12 June to 21 June, the SAH’s core underwent a transition from the northern part of the Indian subcontinent to over the plateau. During this stage, the configuration of atmospheric systems kept the upper atmosphere over the BJB in a state of persistent divergence (Figure 6e, shading area), leading to continuous heavy precipitation. Previous studies have indicated that, when the SAH’s core is positioned over the Tibetan Plateau, it usually signifies the end of the pre-flood season in South China [34]. This finding is consistent with the gradual cessation of precipitation in the BJB after 21 June.
The activity of the WPSH from 12 June to 21 June can be distinctly divided into two stages ([20], also shown in Figure 6b). During the first phase, spanning from 12 June to 15 June, the WPSH underwent a notable westward extension. This extension facilitated the convergence of cold air from the north with warm, moist air from the south over South China (Figure 6d), thereby creating meteorological conditions favorable for frontal shear rainstorms. In the second stage, from 17 June to 21, the WPSH began to retreat eastward. Despite this retreat, the plateau shortwaves intensified and shifted southward (Figure 6c), leading to an increase in low-level wind speeds due to the enhanced pressure gradient between the trough and the WPSH (Figure 6d). This enhancement further facilitated the transport of moisture by the SCS monsoon, directing the convergence of low-level moisture over the BJB region (shaded area in Figure 6e). The combination of low-level convergence with upper-level divergence created a suction effect, resulting in strong upward motion in the middle troposphere (contours in Figure 6e). These conditions collectively contributed to a favorable synoptic pattern conducive to precipitation in the BJB area.
It is noteworthy that, whether in the earlier westward extension stage or the later eastward retreat stage, the overall position of the WPSH ridge remained south of 20° N. This positioning provided a continuous favorable environment for precipitation over the BJB region. After 21 June, as the WPSH covered the entire South China region, precipitation in the BJB tended to cease, marking the end of the precipitation events in this area and also signaling the cessation of the DBP period.
In brief, the occurrence of flood-triggering heavy rainfall in the BJB in 2022 was facilitated by favorable synoptic-scale, with the position of SAH and WPSH, and the intensity of the SCS monsoon being a crucial systems leading to sustained precipitation. Notably, the relatively southern position of the WPSH and the consistently strong intensity of the monsoon were the primary reasons for the sustained heavy precipitation in the BJB. However, historical extreme precipitation should not be solely viewed from the perspective of synoptic scales. For example, the 2008 Dragon Boat Festival extreme rainfall also occurred under favorable synoptic conditions, yet the spatial distribution of heavy rainfall differed significantly from that in 2022 [21]. A comparison of the 2022 and 2008 events reveals distinct differences in the intensity and position of the WPSH: in 2022, the WPSH was positioned anomalously south and west compared to climatology, while in 2008, it was positioned north and east. This raises critical questions: What factors maintained the relatively southern position of the WPSH in 2022? Did signals on longer time scales also play significant roles? These questions may require explanations from abnormal signals on longer time scales, as large-scale signals typically constrain their smaller-scale systems. Additionally, the 2008 event occurred under La Niña conditions, which are known to enhance the intensity of the SCS monsoon [21]. Similarly, the 2022 extreme rainfall may have been influenced by interannual-scale signals, which also modulate subseasonal-scale phenomena. Therefore, the subsequent sections of this paper will focus on the pivotal role of factors beyond synoptic scales in the extreme precipitation events in the BJB in 2022.

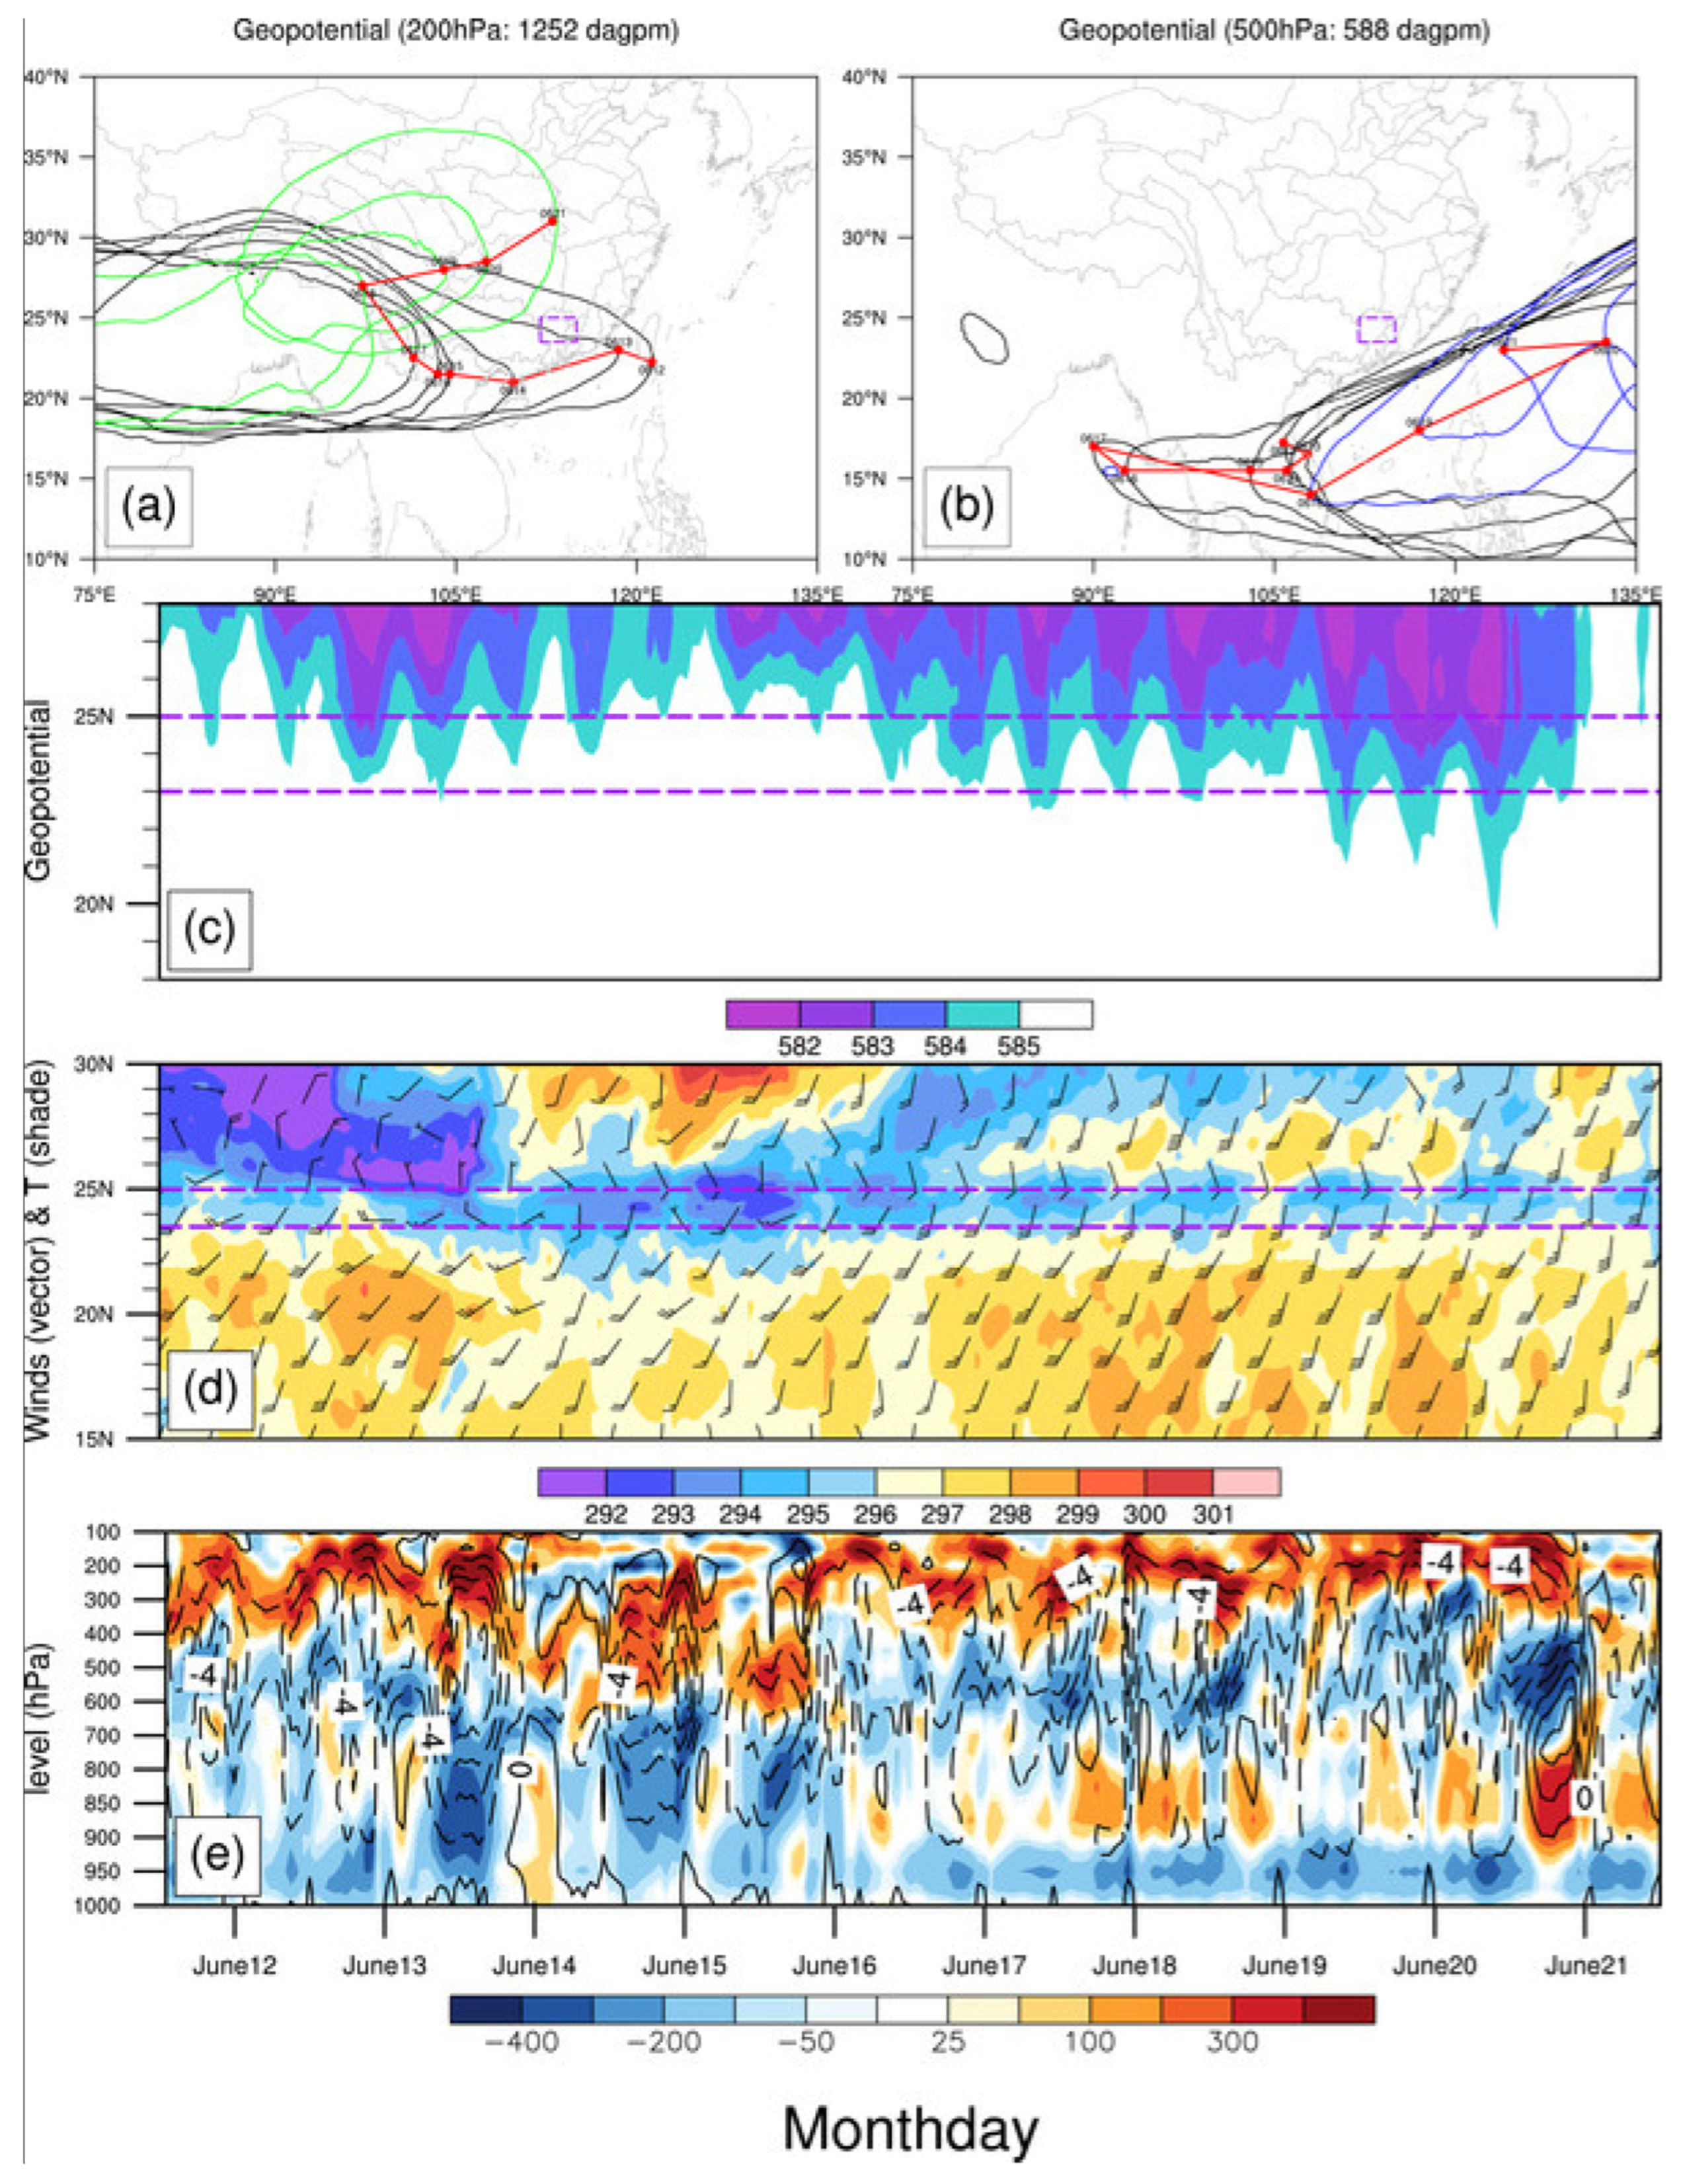
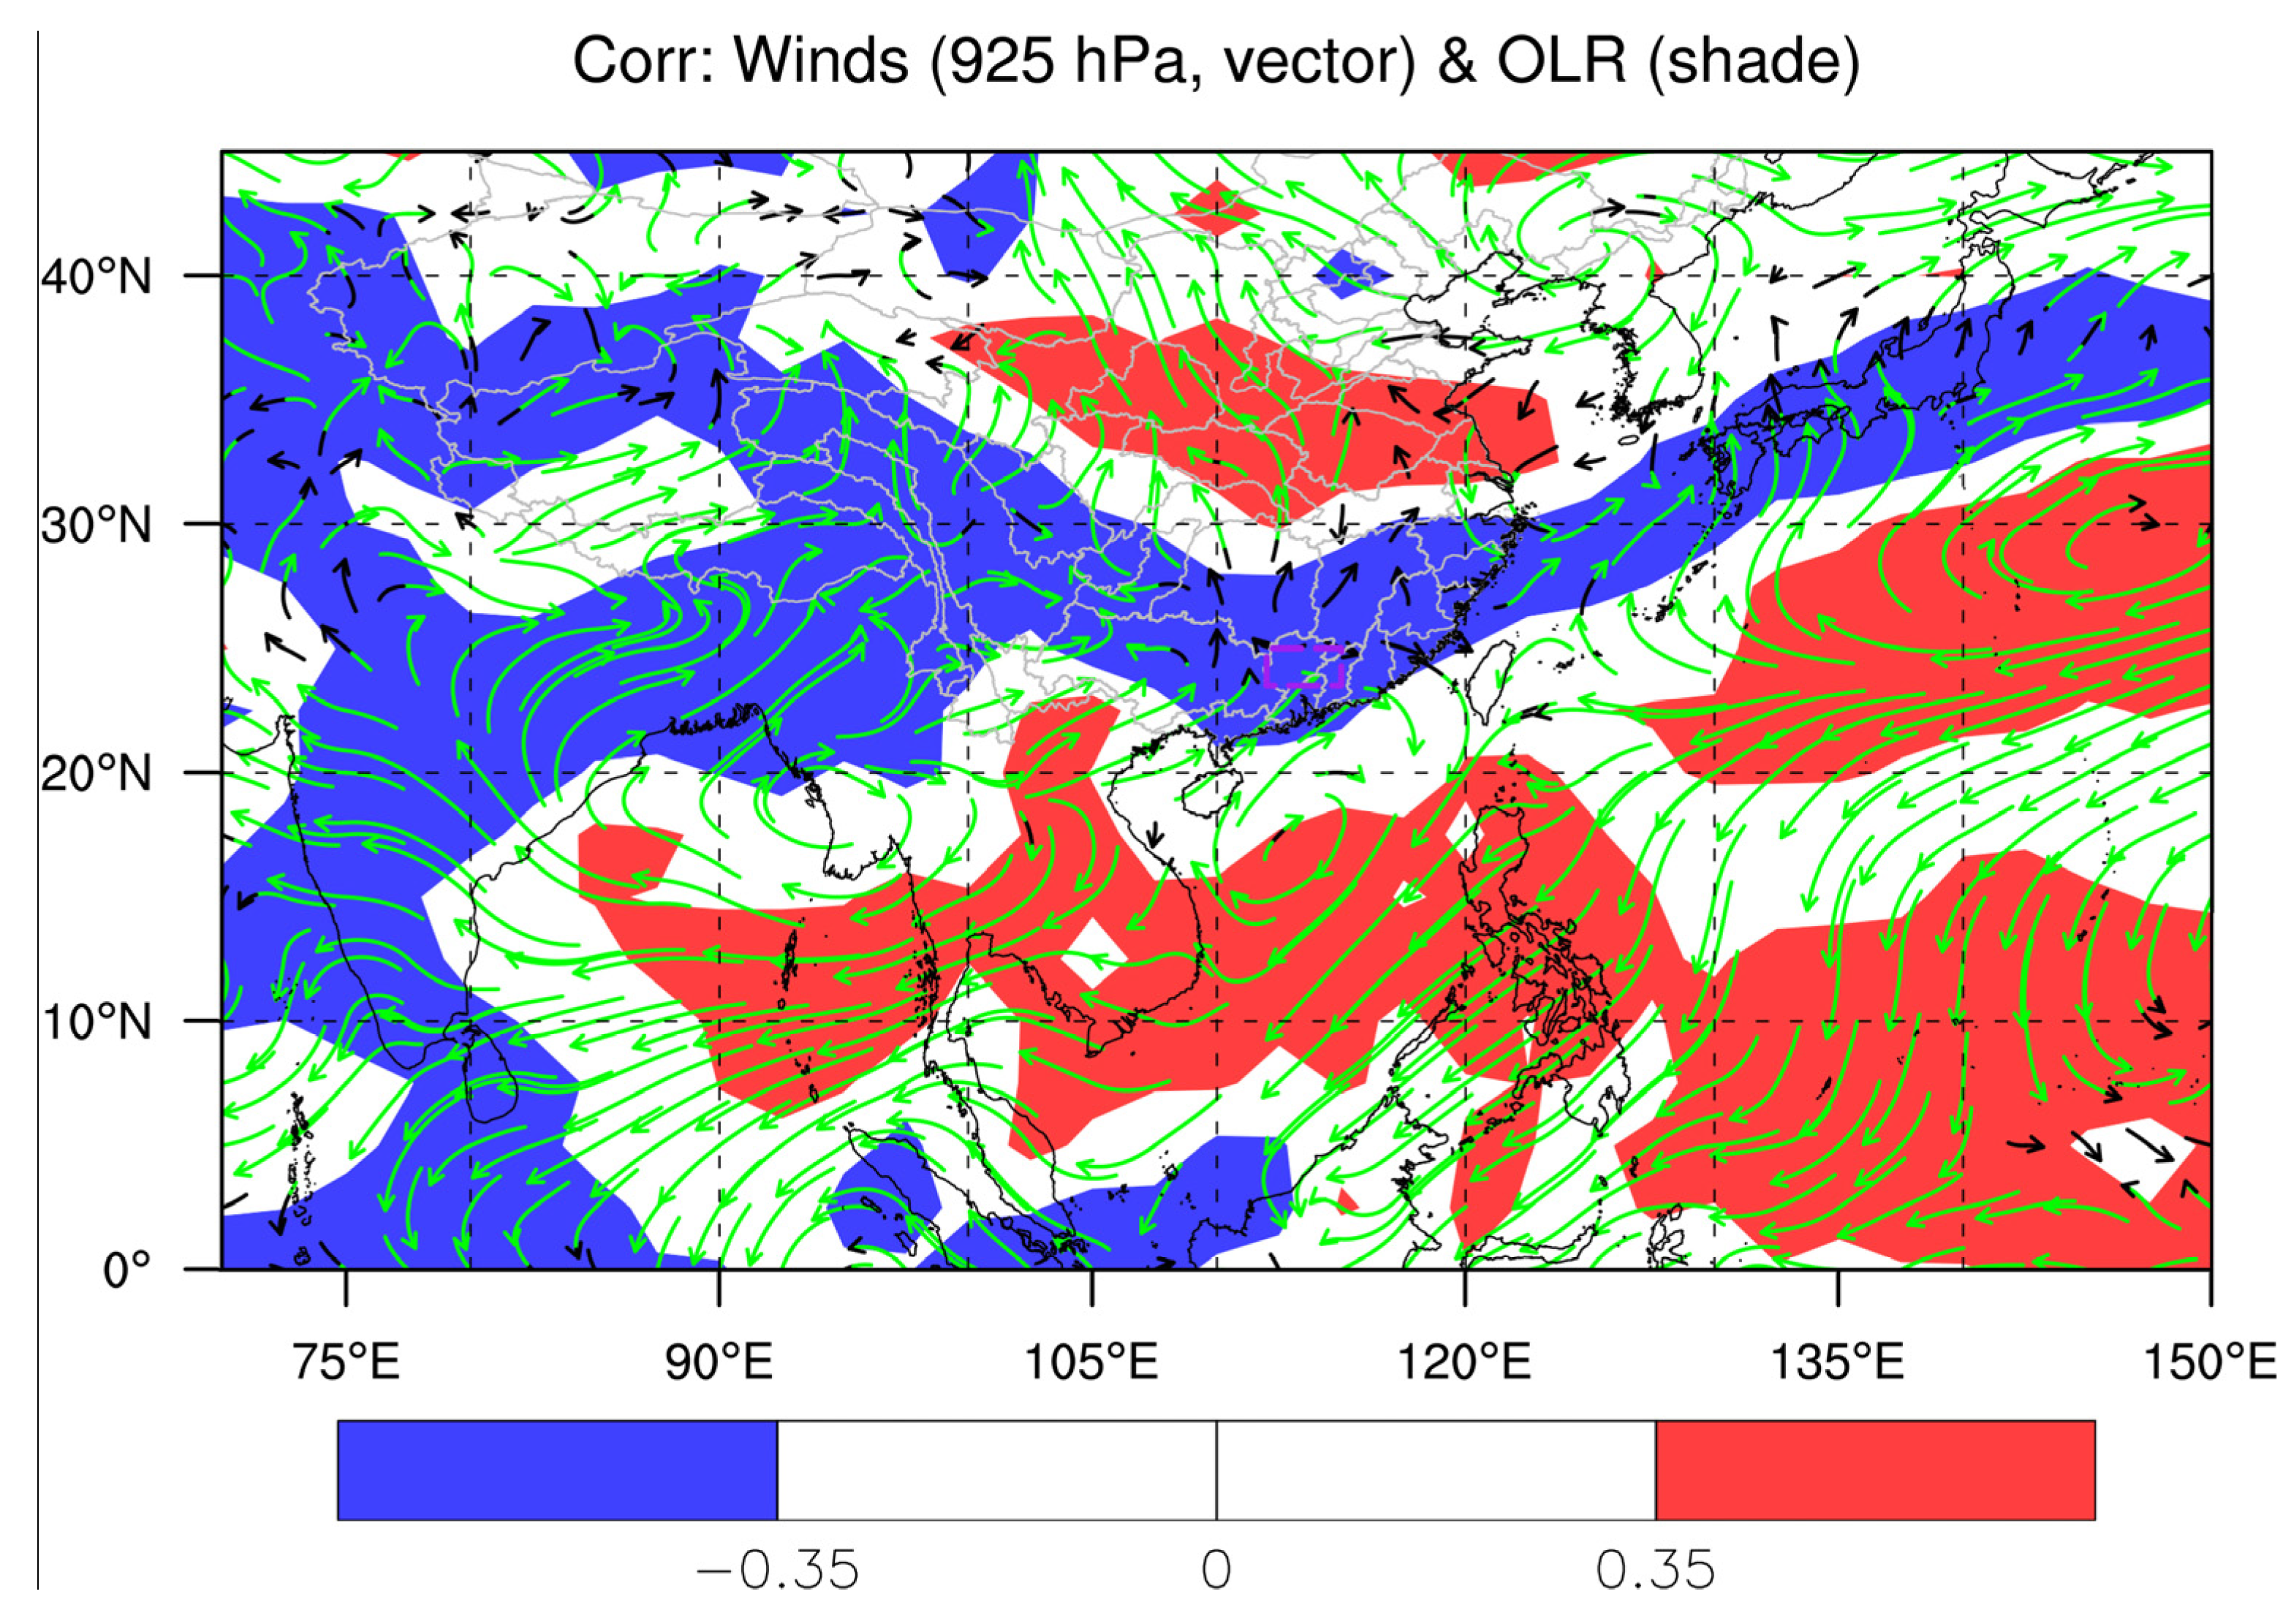
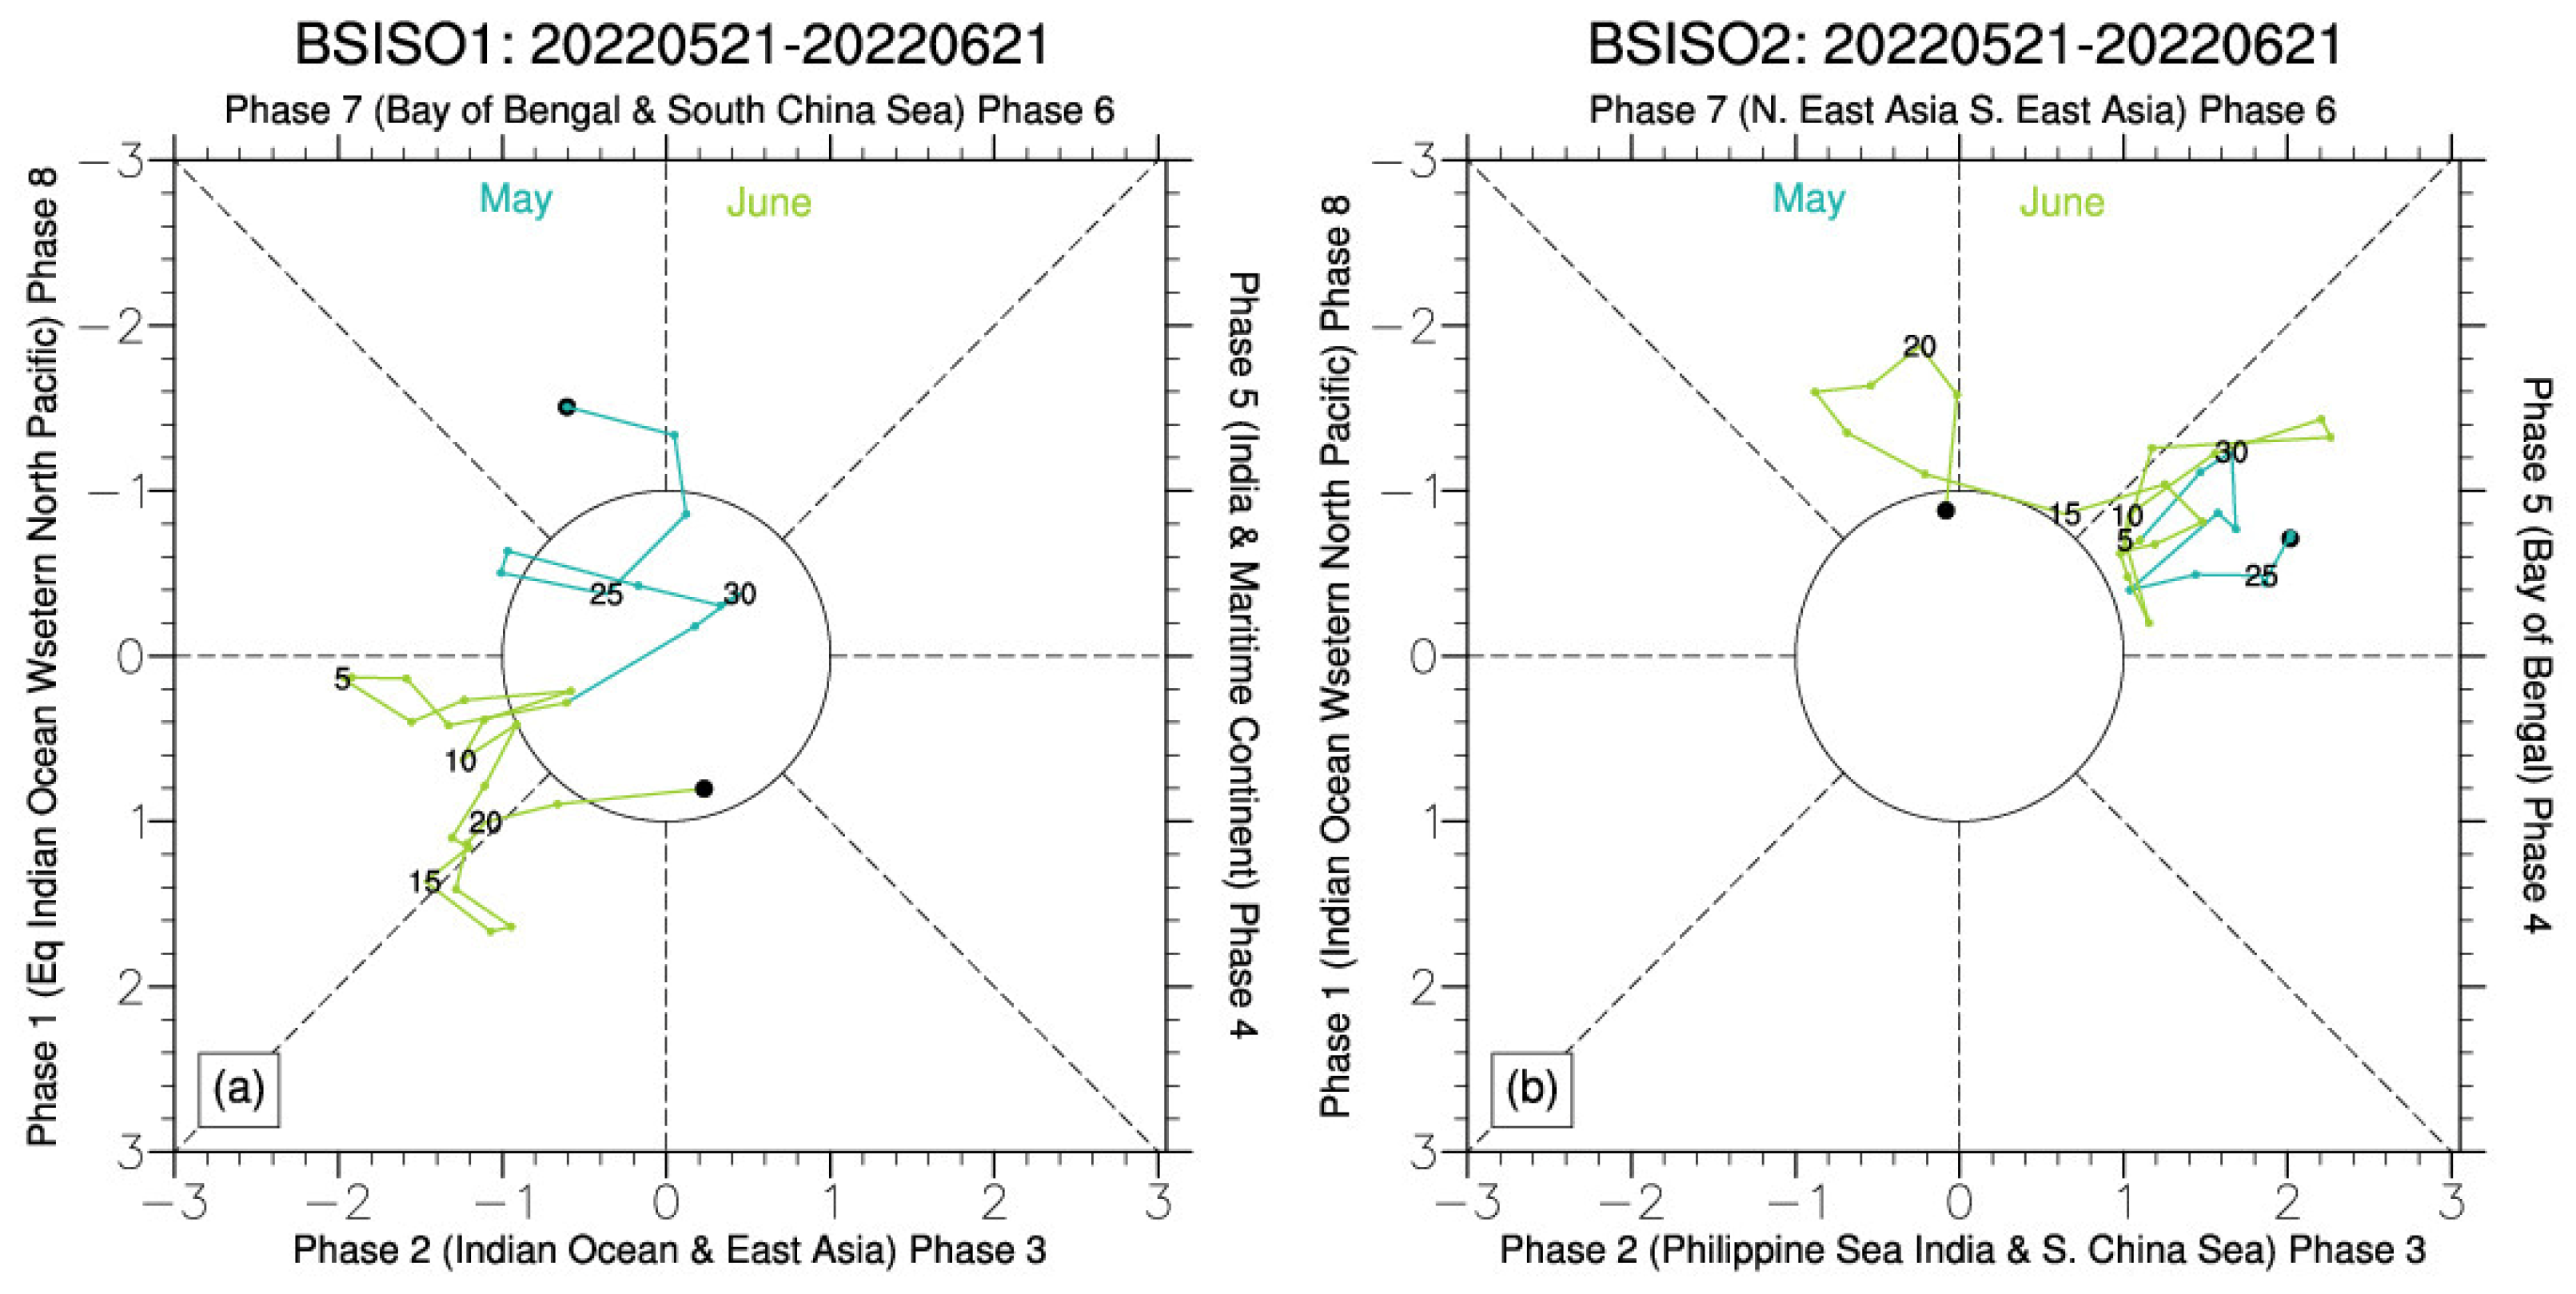
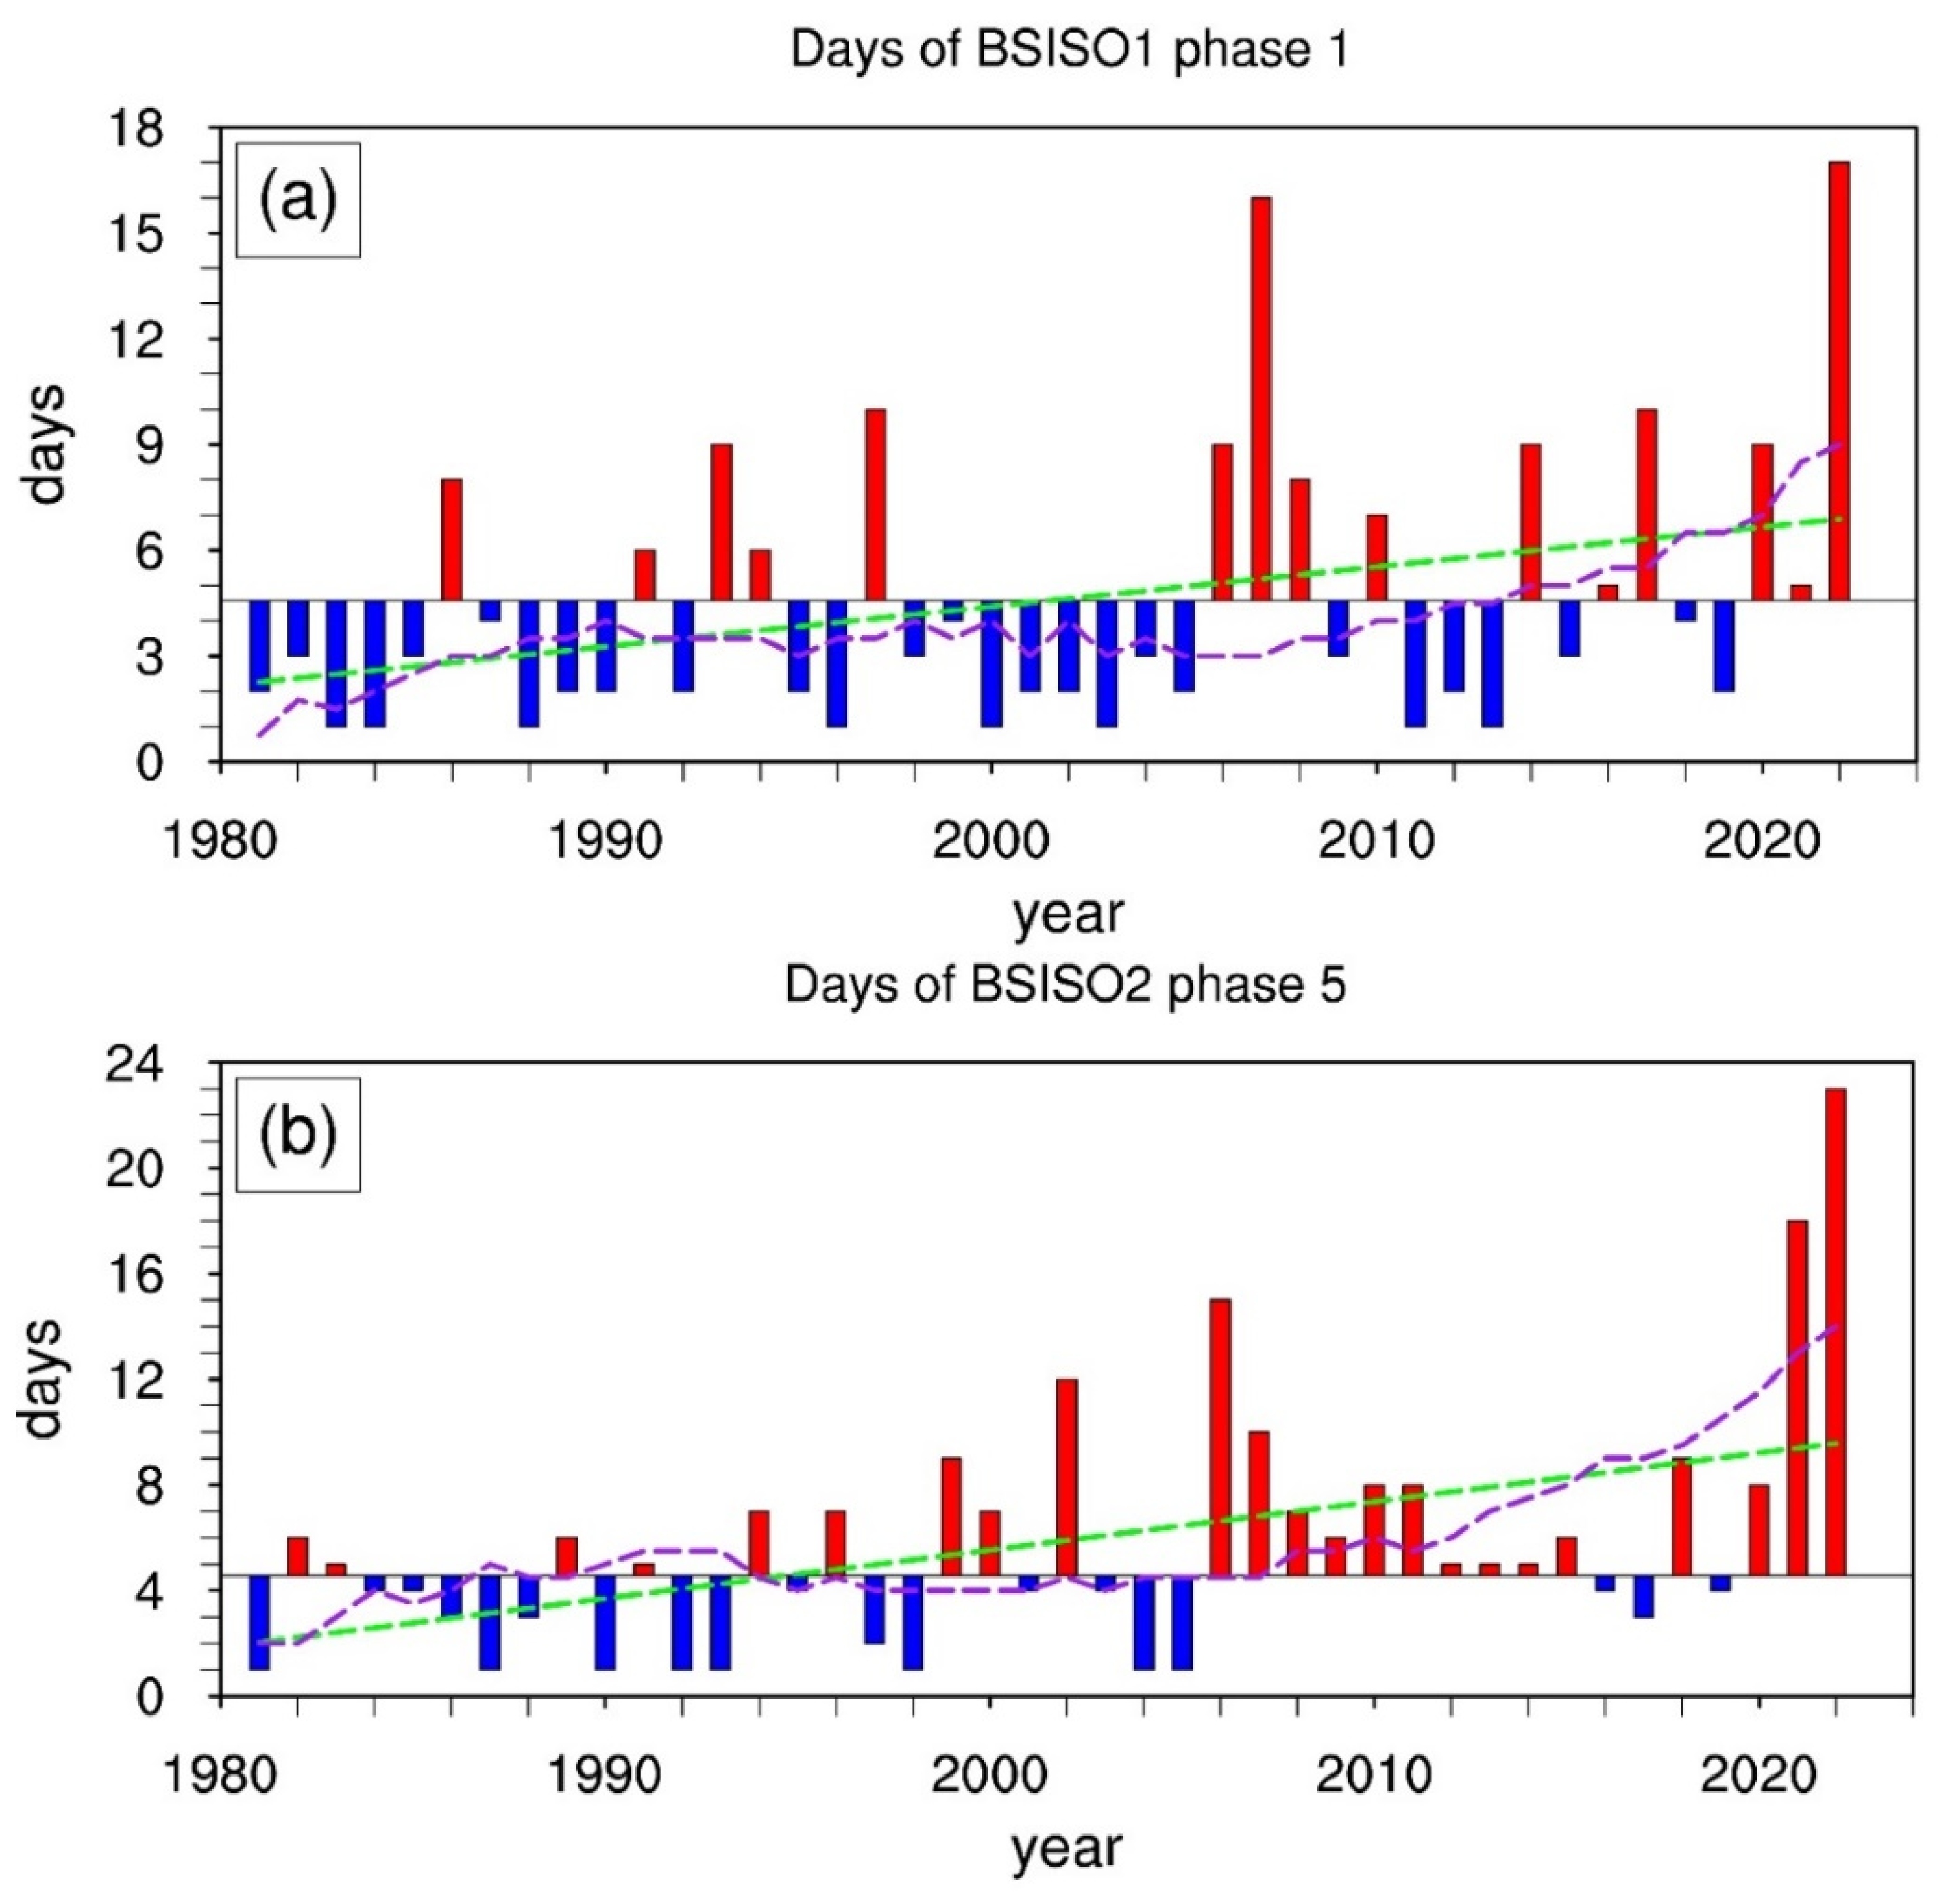
4.2. Influence of Subseasonal-Scale Signal Stagnation

While synoptic-scale systems directly influence short-term precipitation patterns, subseasonal oscillations modulate the persistence and intensity of rainfall over longer periods (>10 days). In the subseasonal time scale, a significant source of predictability comes from intraseasonal oscillations (ISOs), particularly the eastward propagation of the MJO on planetary scales [6,7]. Studies have shown that tropical ISOs exhibit significant variations across different seasons [35,36,37], with MJO typically more active during winter in the Northern Hemisphere and the BSISO exhibiting more complexity, including pronounced northward propagation features besides eastward propagation across the Indian and western Pacific monsoon regions [31,38]. The BSISO signal is considered one of the key factors influencing rainfall and flooding in the Asian monsoon region [39,40,41,42,43,44]. Although the precipitation in the BJB during the 2022 DBP period exhibits clear low-frequency characteristics in multi-day sliding averages, it remains unclear whether such features correspond to low-frequency signals in tropical regions. Figure 7 illustrates the correlation distribution of subseasonal-scale precipitation in the BJB with the 925hPa wind field and OLR. The regions extending from South Asia through the southern SCS to the western equatorial Pacific exhibit convective suppression, while the southern China region (including the BJB) exhibits a convective active area. An anomalous anticyclone exists between these two convective activity areas. Although this circulation anomaly is similar to the synoptic-scale-related results (Figure 4), the subsidence in the synoptic scale background mainly occurs in the southern SCS, whereas the subseasonal-scale convective suppression is primarily concentrated on the southern side of the SCS anomalous anticyclone near the equator. These results indicate that with the extension of time scales, the corresponding circulation anomalies also expand in spatial scale, consistent with the principle of spatiotemporal equivalence, thereby emphasizing the significant role of tropical intraseasonal oscillations in extreme heavy rainfall processes during the DBP period.
In June to July 2020, record-breaking floods struck the Meiyu Belt in China, Japan, and Korea, which were attributed to the unusually persistent (lasting 59 days) and quasi-stationary MJO activity over the Indian Ocean during the same period [12]. To investigate whether intraseasonal-scale signals also played a crucial role during the extreme DBP period in 2022, this study employed the BSISO index [31] to monitor its activity, as it is more representative in influencing precipitation in the summer monsoon regions of Asia. Figure 8 illustrates the monitoring of the BSISO index during the 2022 DBP period. Unlike the classic intraseasonal oscillations, both BSISO1 (representing 30–60-day oscillations) and BSISO2 (representing 10–30-day oscillations) exhibited anomalous propagation stagnation during the 2022 DBP period (spanning 32 days). Specifically, the BSISO1 index monitoring showed that quasi-30–60-day oscillations were in the phase 1 for 17 days, which significantly exceeded the climatological state (~5 days per phase). The BSISO2 index monitoring revealed that quasi-10–30-day oscillations were in the phase 5 for 23 days, also well above the historical climatological average (~5 days per phase).
The aforementioned phase anomalies indicate that the propagation of low-frequency oscillation signals ceased during the 2022 DBP period, a phenomenon that is also extreme historically (see Figure 9). Compared to historical counterparts, the duration of Phase 1 for BSISO1 and Phase 5 for BSISO2 during the 2022 DBP period reached historical extremes, indicating that the anomalous behavior of subseasonal-scale signals during this period was exceptionally rare in history. Furthermore, the linear trend (green line) and polynomial fit trend (purple line) analyses reveal a notable upward trend in the frequency of these specific phase changes in ISO. The phase anomaly changes in BSISO1 align with the findings of Sasikumar et al. [45], which also indicate an accelerated regeneration speed of the MJO in the western Indian Ocean, increased residence time in the western hemisphere and western Indian Ocean, but reduced time in the eastern Indian Ocean and eastern Pacific. This anomaly is attributed to the local feedback of the MJO on the Indian Ocean and the emergence of a La Niña-like mode in Pacific SST.
To investigate the potential mechanisms underlying the unusual ISO events and their modulation of extreme precipitation in the BJB, we composited anomaly maps of OLR and low-level wind fields within the ISO frequency range in Figure 10. Convection anomalies associated with Phase 1 of BSISO1 appear over the equatorial Indian Ocean, accompanied by anomalous anticyclonic circulation and suppressed convection prevailing over the Western North Pacific (WNP). This enhances the intensity of the SCS summer monsoon, facilitating the transport of abundant warm and moist airflow from the tropical Indian Ocean–Pacific region to East Asia. In the South China region, the convergence of anomalous southwesterly flows leads to exceptionally active convective activity. It is noteworthy that the composited results in Figure 10a closely resemble those in Figure 7, once again highlighting the crucial modulating role of this phase anomaly of BSISO1 on precipitation in the BJB at the subseasonal time scale. Circulation anomalies associated with Phase 5 of BSISO2 manifest as anomalous anticyclonic circulation from the east of the Philippines to the western Pacific region. While this circulation anomaly may not linearly modulate precipitation in the BJB (as shown in Figure 7), the enhanced SCS summer monsoon and convective activity in the SCS region, coupled with the upslope terrain of the Nanling Mountains, still contributes to an amplifying effect on precipitation in the BJB.
The stagnation in the propagation of the BSISO may also indirectly impact precipitation by modulating the activities of the WPSH. Huang et al. [46] observed that the cumulative influence of convection within the tropical WNP ISO plays a crucial role in regulating the meridional displacement of the WPSH. Specifically, their findings revealed that active WNP ISO activities can stimulate a poleward-propagating Rossby wave train, promoting a northward shift of the WPSH. To illustrate the positional changes of the WPSH during the DBP period in 2022, we adopted the western boundary point (hereinafter referred to as ridgepoint) and ridge line index (hereinafter referred to as ridgeline) defined by Liu et al. [47]. During the DBP period in 2022, the WPSH ridgeline was abnormally positioned farther south, and its ridgepoint unusually farther west (relative to the climatic state, as illustrated in Figure 10c,d), thereby creating conducive conditions for precipitation in the South China. Notably, the anomalous positioning of the WPSH in 2022 could be attributed to the suppression resulting from the cumulative influence of tropical WNP ISO convection, which coincided with the opposite phase of the ISO described in Huang et al. [46]. In that study, BSISO1 persisted for an extended period during phases 6–8, corresponding to an active convective state in the WNP. Conversely, during the 2022 DBP period, BSISO1’s phase 1 persisted for a longer duration, corresponding to a convective suppression state in the WNP. The rapid northward shift and eastward retreat of the WPSH after the prolonged stagnation of the ISO ended (e.g., the transition of BSISO1 from phase 1 to phases 2–3 and BSISO2 from phase 5 to phases 6–7, after the 17th) may suggest a coupling between these two cross-timescale signals. Of course, this hypothesis warrants further exploration to confirm the existence of this regulatory mechanism and to investigate the potential impacts of BSISO2’s prolonged maintenance in phase 5.
In brief, during the 2022 DBP period, the active days of BSISO1 in phase 1 (17 days) and BSISO2 in phase 5 (23 days) were more than three times and four times the climatological average (5 days), respectively. This prolonged subseasonal oscillation favored the intensified SCS summer monsoon, potentially causing the WPSH to be abnormally positioned farther south and west, compared to climatology, providing continuous tropical moisture supply for prolonged rainfall in the BJB.
Notably, the abnormal propagation of BSISO observed during the 2022 DBP period was not seen in 2008, representing a key difference between the two events. This suggests that subseasonal-scale signals may play a critical role in modulating synoptic-scale systems, such as the WPSH and SCS monsoon, thereby influencing the spatial and temporal characteristics of extreme precipitation. The stagnation of BSISO propagation during this period may have been further modulated by interannual-scale anomalies. Specifically, the cooler-than-average SSTs in the central-eastern Pacific during the triple-peak La Niña event likely enhanced western Pacific convection and strengthened the Walker circulation, creating favorable conditions for BSISO phase stagnation. This interannual modulation of subseasonal variability underscores the complex interactions across temporal scales, which played a critical role in the 2022 extreme precipitation event. Therefore, the subsequent sections of this paper will focus on the pivotal role of interannual-scale anomalies in modulating BSISO propagation and their indirect effects on extreme precipitation in the BJB.

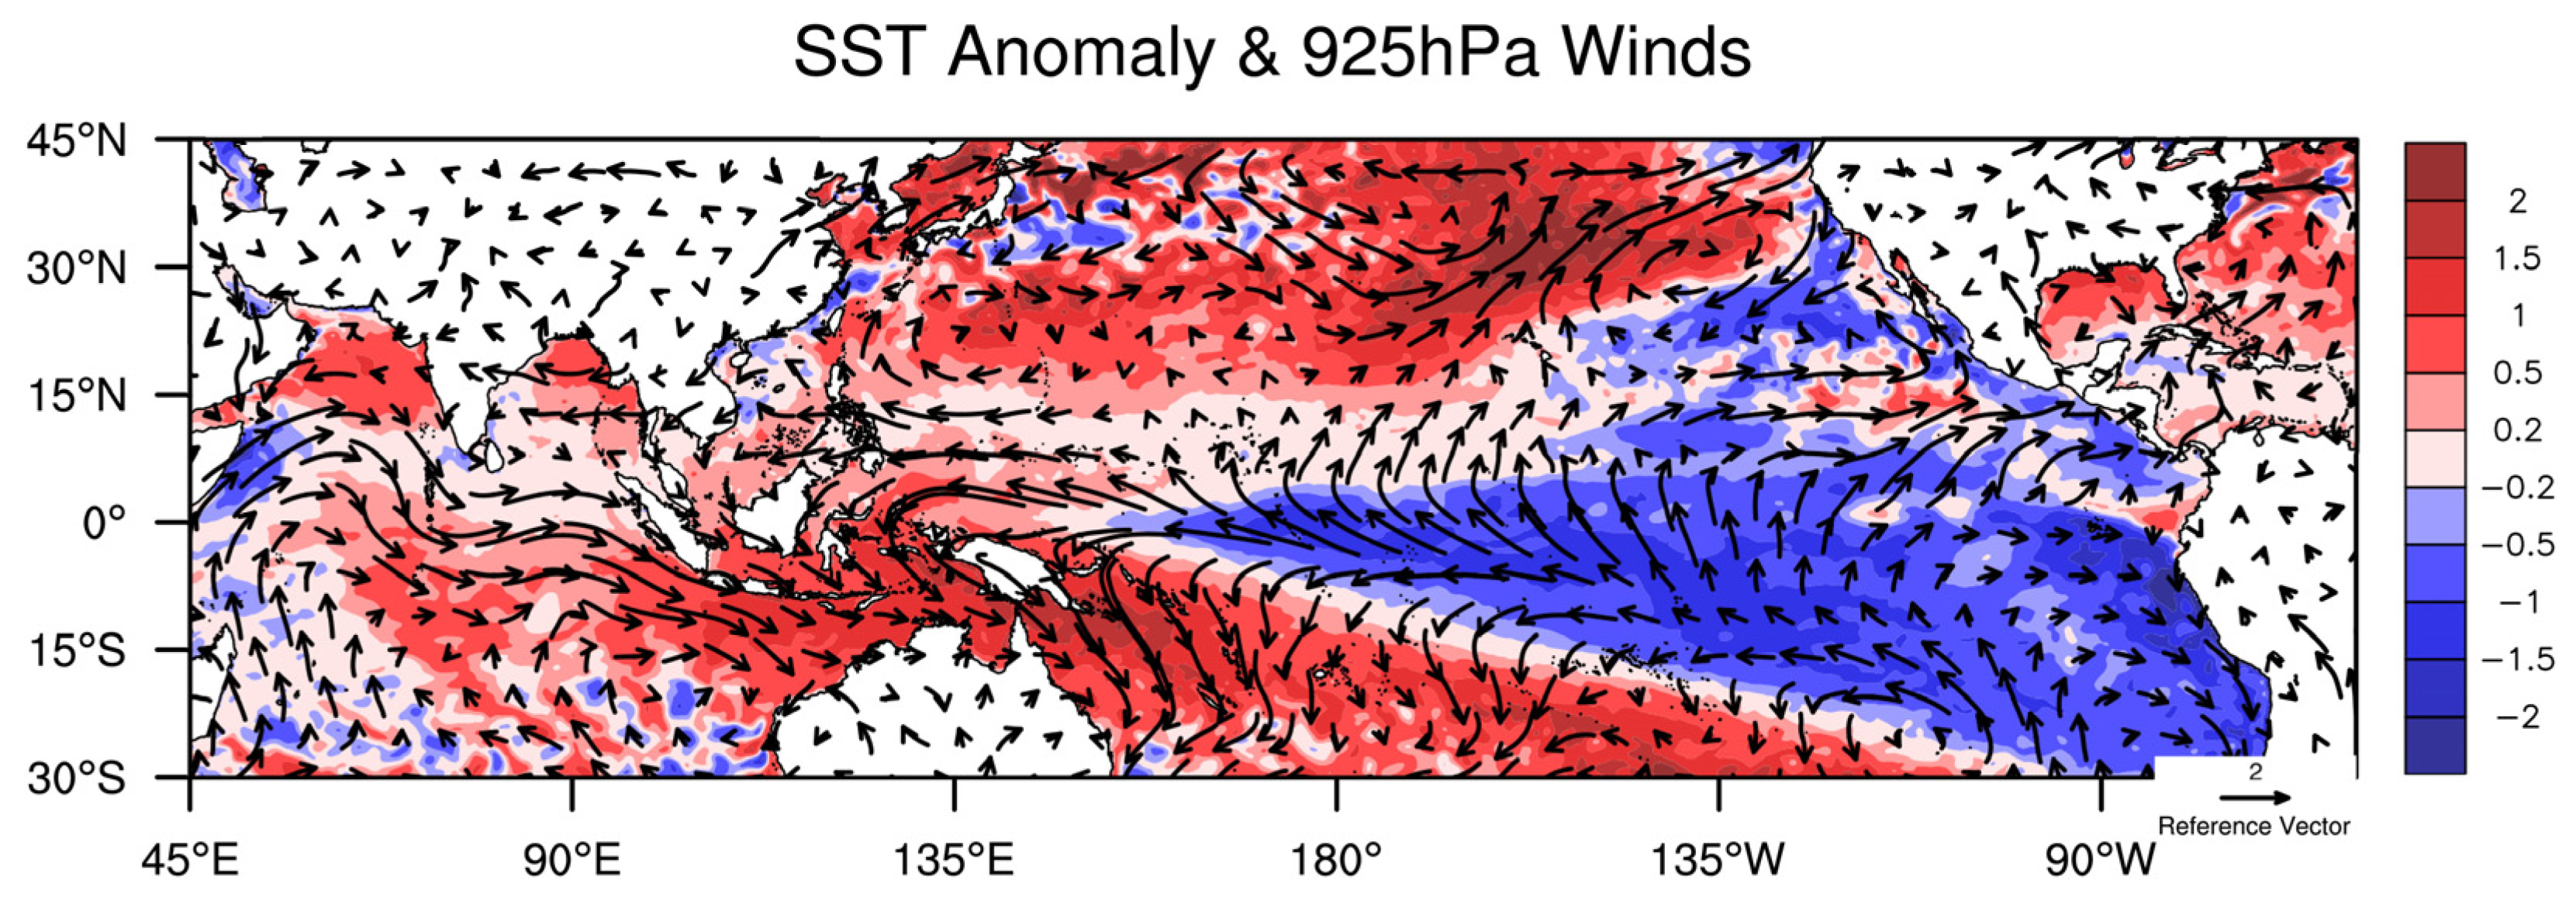
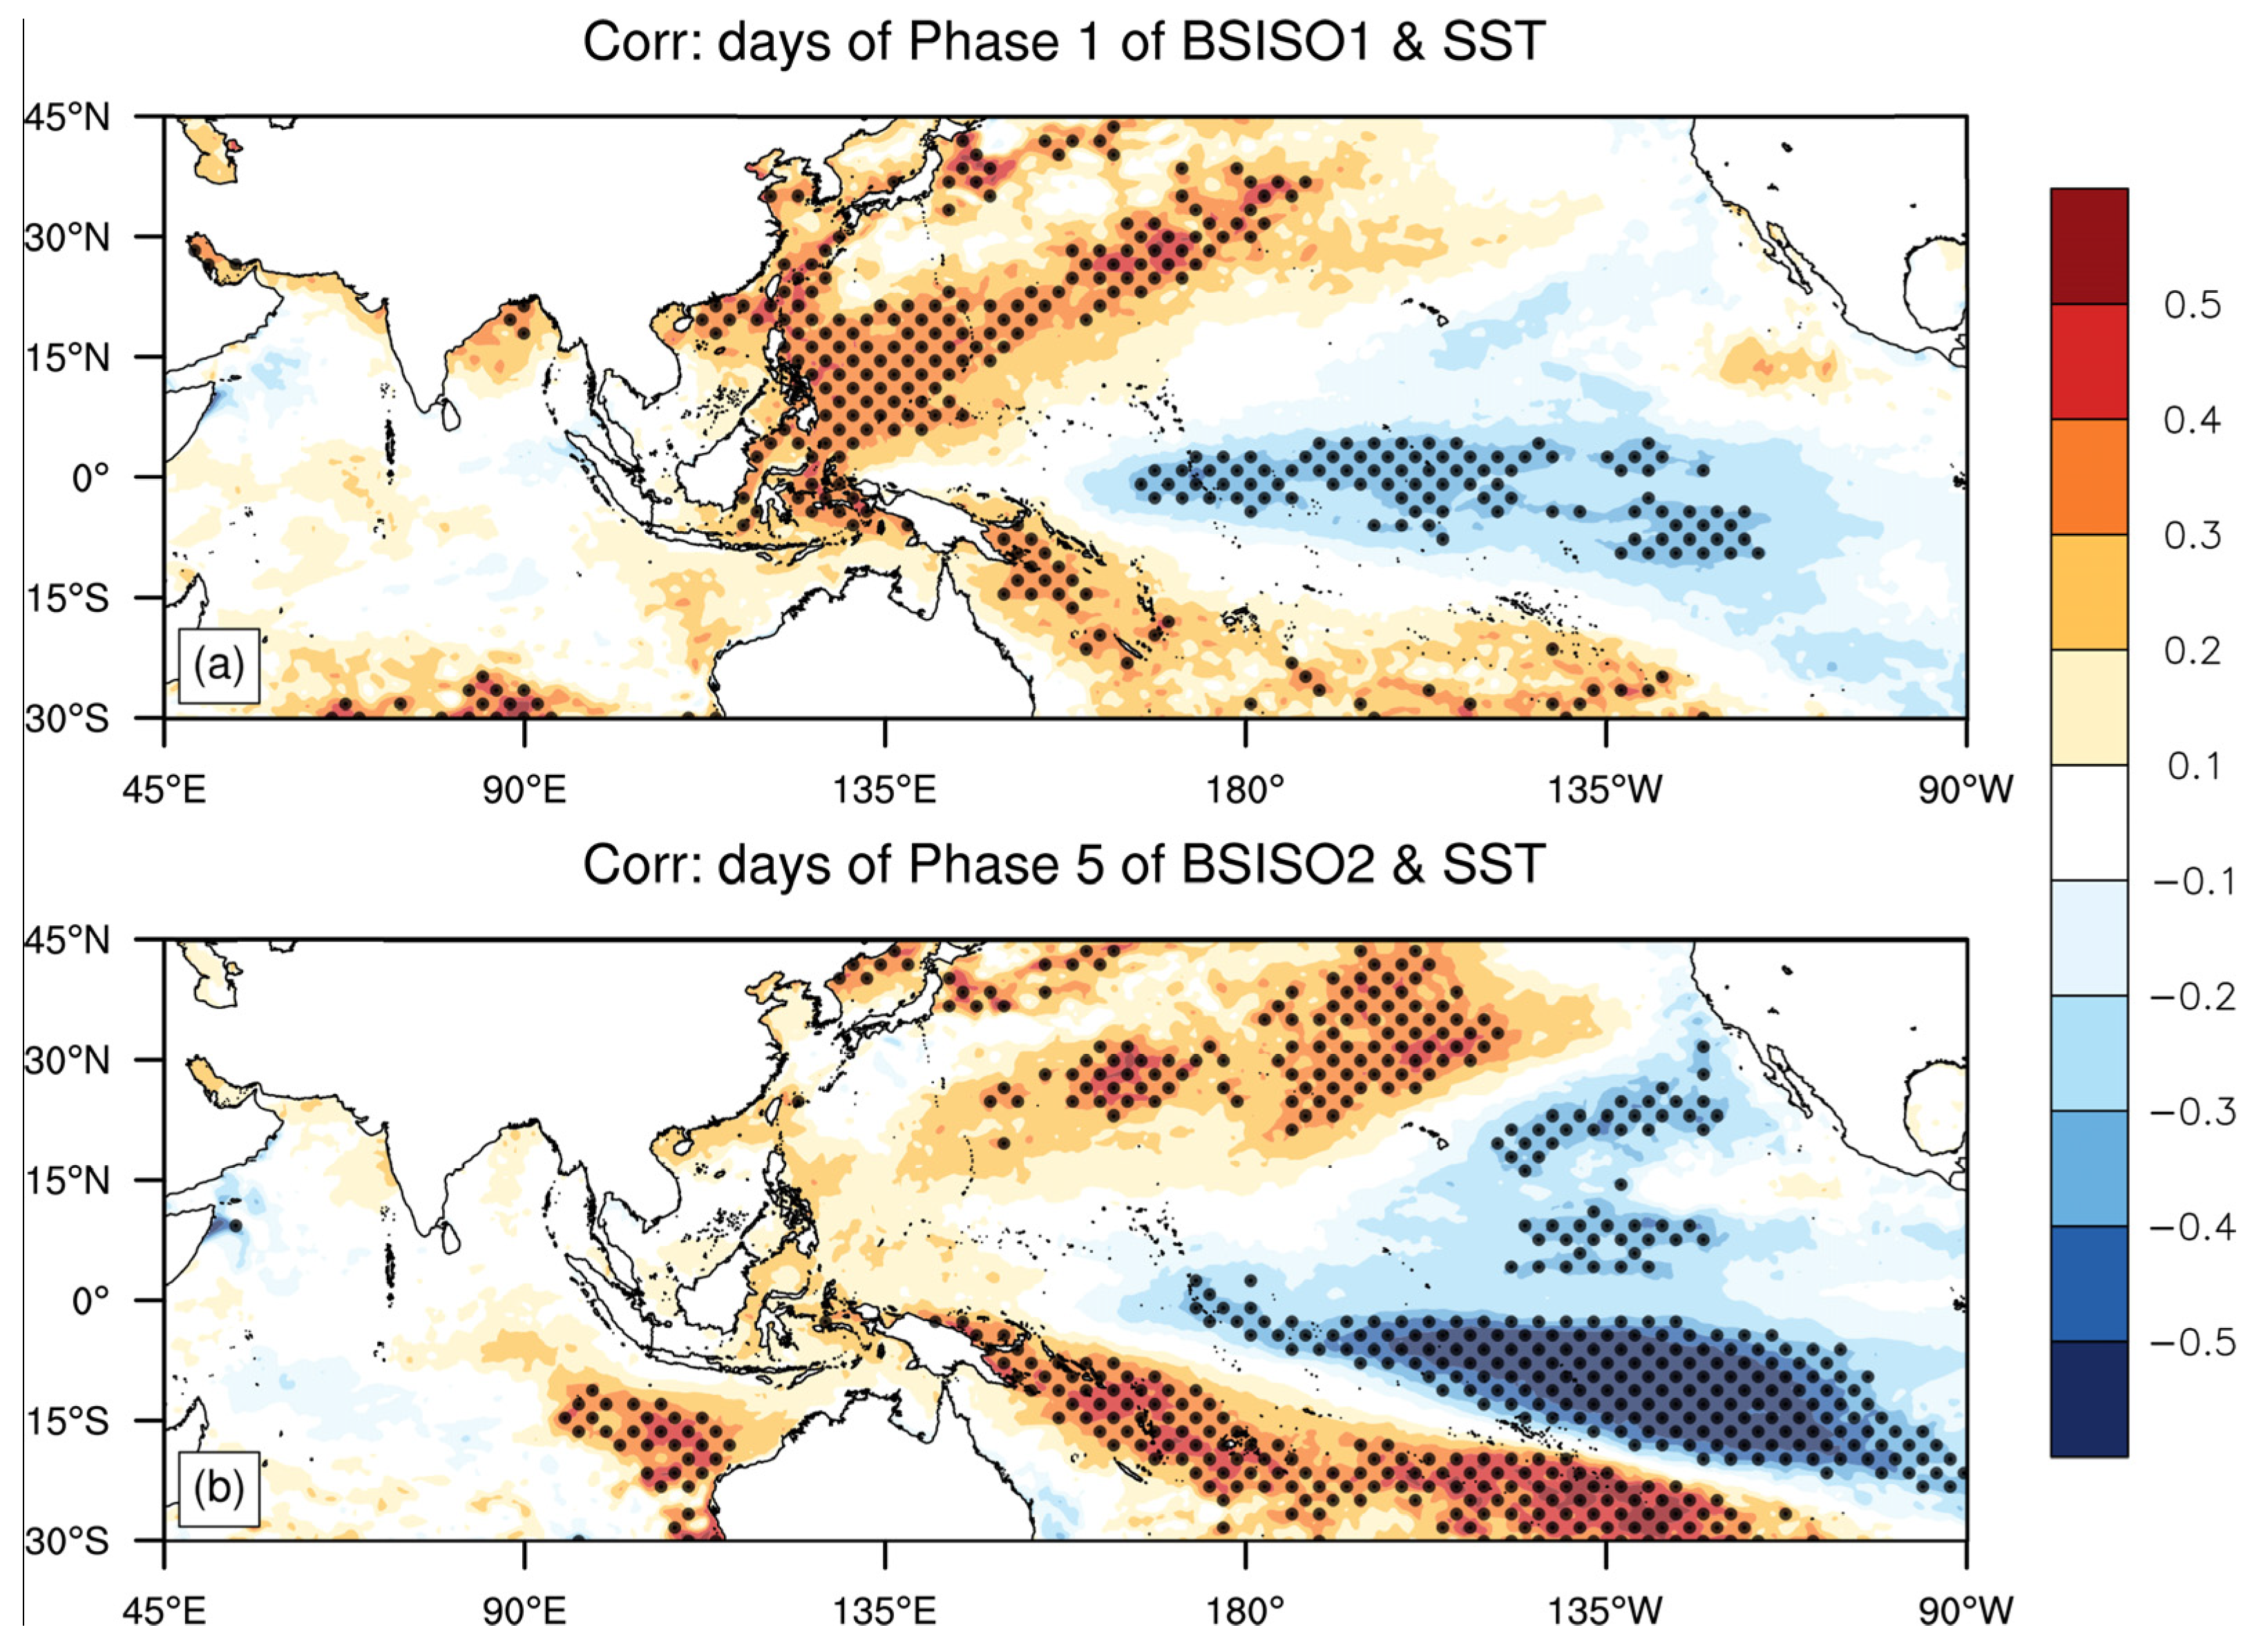
4.3. Indirect Effects of Rare Tri-Peak La Niña Phenomenon

On an even larger scale, interannual phenomena such as La Niña set the background conditions for BSISO activity. Is there a connection between the extreme heavy rainfall event in the BJB in 2022 and tropical anomalous interannual signals? According to the latest data released by the NOAA in April 2023, SST in the central and eastern equatorial Pacific have remained below average since the winter of 2020 (see Figure 11). The current La Niña event began in September 2020, strengthened again in September after weakening in May 2021, and persisted until January 2023 when the La Niña event ended. The occurrence of consecutive La Niña events over three consecutive winters is extremely rare, marking the first occurrence of a “triple peak” La Niña phenomenon in this century.
Interestingly, we did not find a significant concurrent correlation between La Niña-like SST anomalies and the interannual-scale anomalies in precipitation over the BJB (Figure omitted). Instead, significant SST signals were found in the Northeast Pacific and maritime continental regions, consistent with the findings of Liu et al. [21], who attributed the extreme precipitation event in 2022 to historical warm anomalies in the Northeast Pacific and maritime continental regions. While such results indicate no direct link between the extreme DBP in 2022 and the rare tri-peaked La Niña phenomenon, this does not rule out the possibility of indirect effects of the interannual-scale anomaly signals. Firstly, the warm SST anomalies in the Northeast Pacific and maritime continental regions are closely related to the ENSO phenomenon. Secondly, anomalous ENSO signals can indirectly affect the timing and intensity of the onset of the SCS summer monsoon, thereby influencing the heavy rainfall in southern China [19]. Generally, in the year following a La Niña event, the onset of the summer monsoon tends to be early. According to statistics, the onset of the SCS summer monsoon in 2022 (12 May) was earlier than the average onset time (the fourth pentad of May). After the monsoon onset, the warm and humid conditions in southern China significantly improved, leading to an increase in heavy rainfall events. Additionally, under the forcing of La Niña background SST, the enhancement of anticyclonic circulation in the Northwest Pacific region favors interannual-scale southerly wind anomalies in the SCS region (Figure 12), increasing the intensity of the SCS summer monsoon, thereby contributing to the extreme precipitation during the 2022 DBP period.
From a perspective of multiscale interactions, abnormal ENSO signals may indirectly influence the extreme DBP in 2022 by modulating the anomalies in subseasonal-scale signals. For instance, Pohl and Matthews [48] found that the lifespan of the MJO is significantly shortened (extended) under warm (cold) conditions in the eastern Pacific. Wei and Ren [49] systematically investigated the influence of different ENSO types on the propagation speed of the MJO. Their results showed that, during El Niño, the MJO propagates rapidly and symmetrically from the Indian Ocean to the equatorial western Pacific, whereas during La Niña, the MJO moves slowly eastward and often takes a detour around the southern maritime continent. Wang et al. [50] classified MJO events into four categories using a clustering analysis method, including “non-propagating”, “jumping”, “slow-propagating”, and “fast propagating” MJO events. Through the composite analysis of the SST anomalies in the background fields of each type of MJO event, they found that “non-propagating” MJO events correspond to significant La Niña-like SST anomalies, providing further evidence that La Niña background SST conditions are unfavorable for the eastward propagation of the MJO.
During the 2022 DBP period, the number of days with BSISO1 in the phase 1 and BSISO2 in the phase 5 reached historical extremes (Figure 9), which may also be related to the rare three-peak La Niña phenomenon. To reveal this possibility, Figure 13 calculates the correlation coefficients between the summer (May to August) occurrences of BSISO1 in the phase 1 and BSISO2 in the phase 5 and the interannual SST. The figure shows that La Niña-like SST positively contributes to the summer occurrences of BSISO1 in phase 1 and BSISO2 in phase 5. In other words, the rare three-peak La Niña phenomenon impedes the propagation of intraseasonal oscillations, indirectly leading to sustained heavy rainfall during the DBP period in 2022.

5. Conclusions and Discussion

This study aims to investigate the causes of extreme precipitation events in the PRB during the DBP period of 2022. We conducted a comprehensive analysis spanning multiple time scales, from synoptic-scale systems to subseasonal oscillations, and even the rare triple-peaked La Niña phenomenon of this century. We constructed a conceptual framework summarizing the contributions of multiscale interactions to the extreme precipitation process, revealing the complex relationships among these factors and their impacts on extreme precipitation events in the study area (Figure 14).
The extreme precipitation during the 2022 Dragon Boat Festival Period in the Pearl River Basin represents a paradigm case of multiscale synergy—an aspect underexplored in prior studies focusing on single-scale drivers [20,21]. At the synoptic scale, systems such as SAH, the WPSH, and the SCS monsoon are the direct influencing factors leading to precipitation. The SAH transitioned from the Indian subcontinent towards the Tibetan Plateau, providing favorable conditions for upper-level outflow in the BJB. The dominance of the WPSH in the eastern SCS region facilitated the opening of a low-level moisture transport corridor. Meanwhile, the strong summer monsoon in the SCS transported moisture to the northern regions of South China. This, coupled with the unique terrain of the Nanling Mountains, led to the intense convergence and uplift of moist air on the windward slopes. At the subseasonal scale, our analysis revealed a connection between this sustained heavy rainfall and anomalous behavior in subseasonal oscillations, specifically, the duration of BSISO1 in phase 1 and BSISO2 in phase 5 far exceeded climatological averages. This extended duration in the specific phases of ISO, by exciting Rossby–Kelvin wave trains [51], enhanced the intensity of the SCS summer monsoon and moisture transport at subseasonal scales. Additionally, the Accu-ISO signals can indirectly affect the precipitation by modulating the activity of synoptic-scale systems [46]. At the interannual scale, the emergence of the triple-peak La Niña phenomenon was found to advance the timing and intensify the eruption of the SCS summer monsoon, thereby augmenting the extremity of rainfall at the interannual scale in 2022. Additionally, a La Niña-type SST distribution was identified as impeding the propagation of ISOs, leading to specific phase anomalies and consequently regulating the persistence of heavy rainfall.
Our study advances the field through two novel contributions:
(1)
First identification of the combined impacts from a rare triple-peaked La Niña, stalled BSISO phases, and synoptic–system interactions on South China rainfall extremes;
(2)
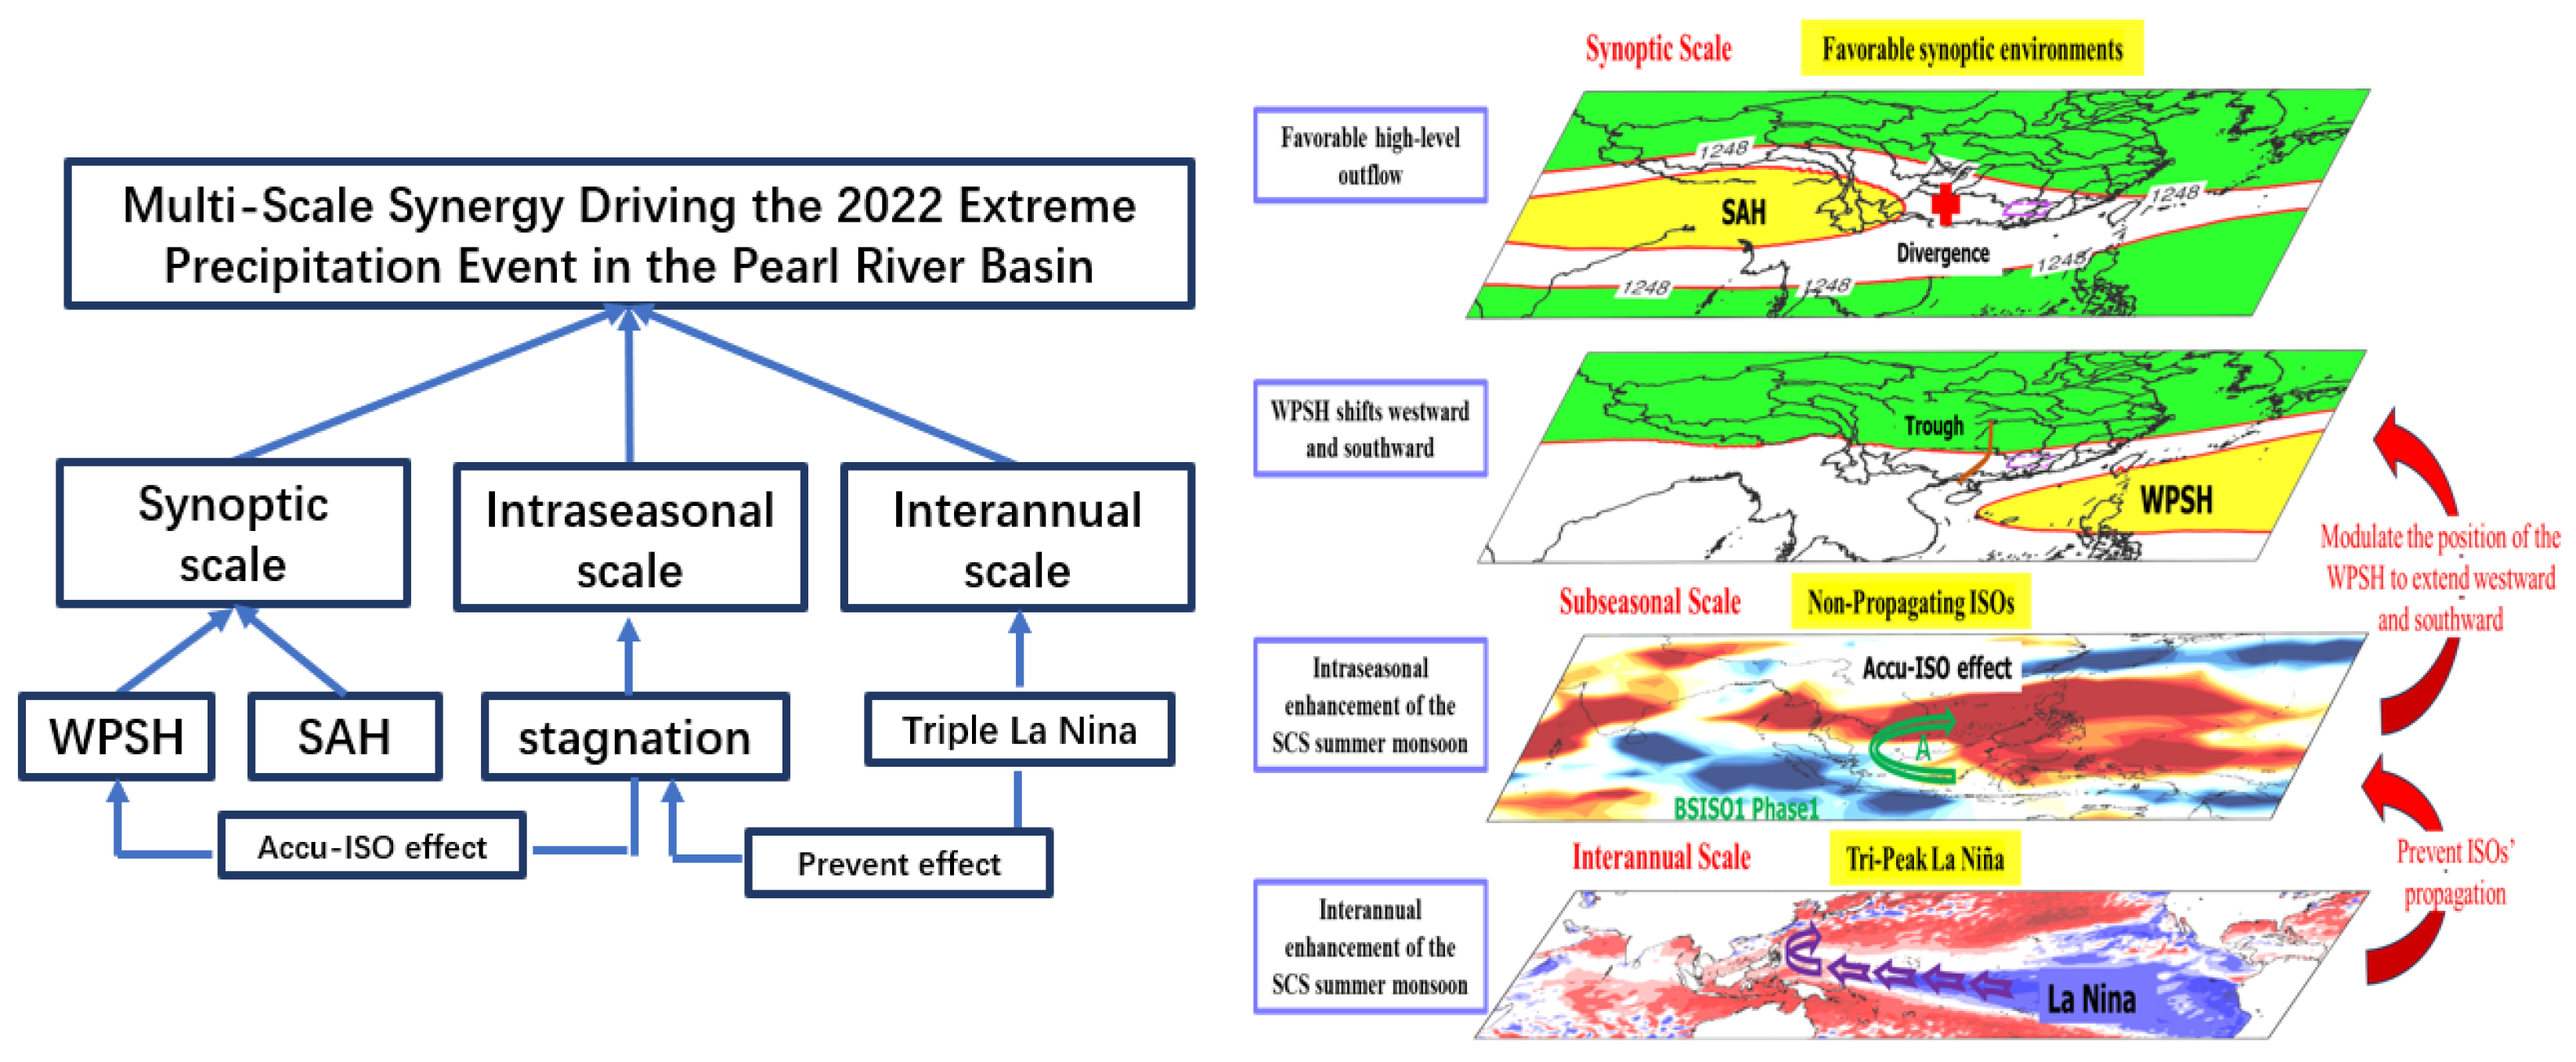
A new conceptual framework (Figure 14) quantifying cross-scale feedbacks between interannual (ENSO), subseasonal (ISO), and synoptic systems.
These findings redefine operational extreme weather forecasting by emphasizing cross-scale precursors, which have significant implications for both research and practical applications in water resource management:
(1)
Early warning potential: The co-occurrence of third-year La Niña and BSISO phase 1/5 persistence (detectable 4–6 weeks pre-event) could serve as a novel predictor for South China rainstorms;
(2)
Methodological innovation potential: The paradigm shift calls for revisiting attribution methodologies in climate science and developing scale-integrated prediction systems.
While rooted in a regional case study, this work illuminates the universal principles of multiscale climate interactions. The framework developed here—highlighting the synergistic coupling of synoptic (e.g., SAH-WPSH dipole), subseasonal (BSISO stagnation), and interannual (triple-peak La Niña) systems—provides a transferable toolkit for analyzing flood extremes in other global basins (e.g., the Amazon, Ganges–Brahmaputra, and Mekong River basins). Although the impacts of specific weather or climate systems may vary across regions due to geographic differences, the role of multiscale interactions in driving extreme precipitation is universally applicable. This framework not only advances our understanding of compound meteorological hazards but also offers practical insights for improving flood risk assessments and early warning systems under evolving climate conditions.
However, the complex interaction mechanisms between these multiscale factors remain an area of ongoing exploration. Two critical frontiers warrant further investigation: How do synoptic-scale systems (e.g., SAH, WPSH) respond to versus drive subseasonal anomalies such as BSISO stagnation? Resolving this causality requires advanced diagnostic tools (e.g., vorticity budget analysis) to quantify the bidirectional feedback between scales.
While existing studies confirm climate models’ ability to simulate ENSO’s modulation of monsoon systems [18] and the combined impacts of central Pacific SST anomalies with BSISO signals on regional extremes [24,52], a pivotal challenge lies in assessing whether current-generation models (e.g., CESM2, EC-Earth3) can replicate cross-temporal scale synergies. Systematic sensitivity experiments—such as spectral nudging to isolate BSISO-scale perturbations or prescribed SST experiments to evaluate La Niña–ISO teleconnections—could rigorously test model fidelity in capturing these interactions while guiding physics parameterization improvements. Addressing these questions will refine our understanding of multiscale climate dynamics and improve the spatial adaptability of early warning systems.

Author Contributions

Conceptualization, P.R.; Methodology, N.W.; Formal analysis, J.Z.; Resources, W.D.; Data curation, W.D.; Writing—original draft, J.Z.; Writing—review & editing, P.R.; Supervision, N.W. and D.Z.; Funding acquisition, D.Z. All authors have read and agreed to the published version of the manuscript.

Funding

This work was supported by the Guangdong Provincial Meteorological Bureau’s Leader Disclosing and Taking Charge Project (GRMCGS202101); the Guangdong Meteorological Joint Fund (2024A1515510013); the CMA Leader Disclosing and Taking Charge Project (CMAJBGS202217); Special Fundings for Youth Innovation Teams from CMA (CMA2023QN05, CMA2024QN01); the Science and Technology Research Project of Guangdong Meteorological Bureau (GRMC2023Q18); and the National Natural Science Foundation of China (42075087).

Data Availability Statement

Data is contained within the article.

Conflicts of Interest

The authors declare no conflicts of interest.

References

  1. Lin, L.X.; Wu, N.G.; Huang, Z.; Cai, A.A. Causality analysis of the infrequent Dragon-Boat Precipitation in Guangdong Province in 2008. Meteor. Mon. 2009, 35, 43–50. (In Chinese) [Google Scholar]
  2. Yao, W.G. Successful flood defense in the Pearl River Basin in 2022 with multiple measures. China Water Resour. 2022, 1–4. [Google Scholar]
  3. Tang, T.Y.; Wu, C.S.; Wang, A.Y.; Hao, I.P.; Luo, H.B. An observational study of intraseasonal variations over Guangdong province China during the rainy season of 1999. J. Trop. Meteor. 2007, 23, 683–689. (In Chinese) [Google Scholar]
  4. Ji, Z.P.; Hu, L.T.; Gu, D.J.; Wu, N.G.; Liang, J. The quasi-biweekly oscillation of flood-causing tropical rain in Xijiang River region and its atmospheric circulation models. J. Trop. Meteor. 2011, 27, 775–784. (In Chinese) [Google Scholar]
  5. Cao, X.; Ren, X.J.; Yang, X.Q.; Fang, J.B. The quasi-biweekly oscillation characteristics of persistent severe rain and its general circulation anomaly over southeast China from May to August. Acta Meteor. Sin. 2012, 70, 766–778. (In Chinese) [Google Scholar]
  6. Hong, W.; Ren, X.J. Persistent heavy rainfall over South China during May–August: Subseasonal anomalies of circulation and sea surface temperature. J. Meteor. Res. Appl. 2014, 27, 769–787. [Google Scholar] [CrossRef]
  7. Zhang, L.; Wang, B.; Zeng, Q. Impact of the Madden–Julian Oscillation on Summer Rainfall in Southeast China. J. Clim. 2009, 22, 201–216. [Google Scholar]
  8. Ren, H.L.; Ren, P. Impact of Madden–Julian Oscillation upon Winter Extreme Rainfall in Southern China: Observations and Predictability in CFSv2. Atmosphere 2017, 8, 192. [Google Scholar] [CrossRef]
  9. Madden, R.A.; Julian, P.R. Detection of a 40–50 Day Oscillation in the Zonal Wind in the Tropical Pacific. J. Atmos. Sci. 1971, 28, 702–708. [Google Scholar] [CrossRef]
  10. Madden, R.A.; Julian, P.R. Description of Global-Scale Circulation Cells in the Tropics with a 40–50 Day Period. J. Atmos. Sci. 1972, 29, 1109–1123. [Google Scholar]
  11. Wheeler, M.C.; Hendon, H.H. An all-season real-time multivariate MJO index: Development of an index for monitoring and prediction. Mon. Weather Rev. 2004, 132, 1917–1932. [Google Scholar] [CrossRef]
  12. Roxy, M.K.; Dasgupta, P.; McPhaden, M.J.; Suematsu, T.; Zhang, C.; Kim, D. Twofold expansion of the Indo-Pacific warm pool warps the MJO life cycle. Nature 2019, 575, 647–651. [Google Scholar] [CrossRef]
  13. Zhang, W.J.; Huang, Z.C.; Jiang, F.; Stuecker, M.F.; Chen, G.; Jin, F. Exceptionally persistent Madden-Julian Oscillation activity contributes to the extreme 2020 East Asian summer monsoon rainfall. Geophys. Res. Lett. 2021, 48, e2020GL091588. [Google Scholar]
  14. Wang, Y.; Ren, H.L.; Wei, Y.; Jin, F.; Ren, P.; Gao, L.; Wu, J. MJO phase swings modulate the recurring latitudinal shifts of the 2020 extreme summer-monsoon rainfall around Yangtse. J. Geophys. Res. Atmos. 2022, 6, 127. [Google Scholar]
  15. Biabanaki, M.; Eslamian, S.S.; Koupai, J.A.; Cañón, J.; Boni, G.; Gheysari, M. A principal components/singular spectrum analysis approach to ENSO and PDO influences on rainfall in western Iran. J. Hydrol. Res. 2014, 45, 250–262. [Google Scholar]
  16. Huang, R.H.; Wu, Y.F. The influence of ENSO on the summer climate change in China and its mechanism. Adv. Atmos. Sci. 1989, 6, 21–32. [Google Scholar]
  17. Zhang, R.H.; Sumi, A.; Kimoto, M. Impact of El Niño on the East Asian monsoon: A diagnostic study of the ’86/87 and ’91/92 events. J. Meteor. Soc. Jpn. 1996, 74, 49–62. [Google Scholar]
  18. Tao, S.Y.; Zhang, Q.Y. Response of the Asian winter and summer monsoon to ENSO events. Chin. J. Atmos. Sci. 1998, 22, 399–407. (In Chinese) [Google Scholar]
  19. Wang, B.; Wu, R.G.; Fu, X.H. Pacific-East Asian teleconnection: How does ENSO affect East Asian climate? J. Clim. 2000, 13, 1517–1536. [Google Scholar]
  20. Liu, M.H.; Ren, H.L.; Zhang, W.J.; Ren, P.F. Influence of super El Nino events on the frequency of spring and summer extreme precipitation over eastern China. Acta Meteor. Sin. 2018, 76, 539–553. (In Chinese) [Google Scholar]
  21. Deng, W.J.; Ren, P.F.; Zhang, D.; Sun, Y.; Wu, N.-G. An Extreme Monsoonal Heavy Rainfall Event over Inland South China in June 2022: A Synoptic Causes Analysis. J. Trop. Meteor. 2023, 29, 16–25. [Google Scholar]
  22. Wang, T.; Hu, Y.M.; Pan, W.J. Climate causation analysis of the strongest Dragon-Boat precipitation in Guangdong province in 2008. Guangdong Meteor. 2008, 30, 5–7. (In Chinese) [Google Scholar]
  23. Du, Y.; Chen, G. Heavy rainfall associated with double low-level jets over Southern China. Part II: Convection initiation. Mon. Weather Rev. 2019, 147, 543–565. [Google Scholar] [CrossRef]
  24. Liu, X.; Luo, Y.; Huang, L.; Zhang, D.; Guan, Z. Roles of double low-level jets in the generation of coexisting inland and coastal heavy rainfall over south China during the pre-summer rainy season. J. Geophys. Res. Atmos. 2020, 125, e2020JD032890. [Google Scholar] [CrossRef]
  25. Liu, B.; Zhu, C.; Xu, K.; Ma, S.; Lu, M.; Han, X.; Hua, L. Record-breaking pre-flood rainfall over South China in 2022: Role of historic warming over the Northeast Pacific and Maritime Continent. Clim. Dyn. 2023, 61, 3147–3163. [Google Scholar] [CrossRef]
  26. Kummerow, C.; Barnes, W.; Kozu, T.; Shiue, J.; Simpson, J. The Tropical Rainfall Measuring Mission (TRMM) Sensor Package. J. Atmos. Ocean. 1998, 15, 809–817. [Google Scholar] [CrossRef]
  27. Hou, A.Y.; Kakar, R.K.; Neeck, S.; Azarbarzin, A.A.; Kummerow, C.D.; Kojima, M.; Oki, R.; Nakamura, K.; Iguchi, T. The Global Precipitation Measurement Mission. Bull. Am. Meteorol. Soc. 2014, 95, 701–722. [Google Scholar] [CrossRef]
  28. Hersbach, H.; Bell, B.; Berrisford, P.; Hirahara, S.; Horányi, A.; Muñoz-Sabater, J.; Nicolas, J.; Peubey, C.; Radu, R.; Schepers, D.; et al. The ERA5 global reanalysis. Q. J. R. Meteorol. Soc. 2020, 146, 1999–2049. [Google Scholar] [CrossRef]
  29. Liebmann, B.; Smith, C.A. Description of a Complete (Interpolated) Outgoing Longwave Radiation Dataset. Bull. Am. Meteorol. Soc. 1996, 77, 1275–1277. [Google Scholar]
  30. Reynolds, R.W.; Rayner, N.A.; Smith, T.M.; Stokes, D.C.; Wang, W. An Improved In Situ and Satellite SST Analysis for Climate. J. Clim. 2002, 15, 1609–1625. [Google Scholar] [CrossRef]
  31. Lee, J.Y.; Wang, B.; Wheeler, M.C.; Fu, X.; Waliser, D.E.; Kang, I.-S. Real-time multivariate indices for the boreal summer intraseasonal oscillation over the Asian summer monsoon region. Clim. Dyn. 2013, 40, 493–509. [Google Scholar]
  32. Liu, B.; Zhu, C.; Yuan, Y. Two interannual dominant modes of the South Asian High in May and their linkage to the tropical SST anomalies. Clim. Dyn. 2017, 49, 2705–2720. [Google Scholar]
  33. Chen, Y.; Zhai, P. Mechanisms for concurrent low-latitude circulation anomalies responsible for persistent extreme precipitation in the Yangtze River Valley. Clim. Dyn. 2016, 47, 989–1006. [Google Scholar]
  34. Sun, Z.; Zhou, H.; Peng, L.; Ni, D. Relationships between different types of South Asian high and atmospheric circulation in the Northern Hemisphere in July. Trans. Atmos. Sci. 2016, 39, 577–588. (In Chinese) [Google Scholar]
  35. Wang, B.; Rui, H. Synoptic climatology of transient tropical intraseasonal convection anomalies: 1975–1985. Meteor. Atmos. Phys. 1990, 44, 43–61. [Google Scholar] [CrossRef]
  36. Madden, R.A.; Julian, P.R. Observations of the 40–50-Day Tropical Oscillation—A Review. Mon. Weather Rev. 1994, 122, 814–837. [Google Scholar] [CrossRef]
  37. Zhang, C.D.; Dong, M. Seasonality in the Madden-Julian Oscillation. J. Clim. 2004, 17, 3169–3180. [Google Scholar] [CrossRef]
  38. Jiang, X.; Li, T.; Wang, B. Structures and mechanisms of the northward propagating boreal summer intraseasonal oscillation. J. Clim. 2004, 17, 1022–1039. [Google Scholar]
  39. Zhu, C.W.; Nakazawa, T.; Li, J.P.; Chen, L. The 30–60 day intraseasonal oscillation over the western North Pacific Ocean and its impacts on summer flooding in China during 1998. Geophys. Res. Lett. 2003, 30, 1952. [Google Scholar]
  40. Mao, J.; Wu, G. Intraseasonal variations of the Yangtze rainfall and its related atmospheric circulation features during the 1991 summer. Clim. Dyn. 2006, 27, 815–830. [Google Scholar] [CrossRef]
  41. Yang, J.; Wang, B.; Bao, Q. Biweekly and 21–30-day variations of the subtropical summer monsoon rainfall over the lower reach of the Yangtze River basin. J. Clim. 2010, 23, 1146–1159. [Google Scholar] [CrossRef]
  42. Chen, J.; Wen, Z.; Wu, R.; Chen, Z.; Zhao, P. Influences of northward propagating 25–90-day and quasi-biweekly oscillations on eastern China summer rainfall. Clim. Dyn. 2015, 45, 105–124. [Google Scholar] [CrossRef]
  43. Hsu, P.C.; Lee, J.Y.; Ha, K.J. Influence of boreal summer intraseasonal oscillation on rainfall extremes in southern China. Int. J. Climatol. 2016, 36, 1403–1412. [Google Scholar] [CrossRef]
  44. Lee, S.; Moon, J.; Wang, B.; Kim, H.-J. Subseasonal Prediction of Extreme Precipitation over Asia: Boreal Summer Intraseasonal Oscillation Perspective. J. Clim. 2017, 30, 2849–2865. [Google Scholar] [CrossRef]
  45. Sasikumar, K.; Nath, D.; Wang, X.; Chen, W.; Yang, S. Recent enhancement and prolonged occurrence of MJO over the Indian Ocean and their impact on Indian summer monsoon rainfall. Clim. Dyn. 2022, 59, 2585–2598. [Google Scholar] [CrossRef]
  46. Huang, Z.; Zhang, W.; Geng, X.; Hsu, P.-C. Accumulated Effect of Intra-Seasonal Oscillation Convections over the Tropical Western North Pacific on the Meridional Location of Western Pacific Subtropical High. Front. Earth Sci. 2020, 8, 579442. [Google Scholar] [CrossRef]
  47. Liu, Y.; Li, W.; Ai, W.; Li, Q. Reconstruction and Application of the Monthly Western Pacific Subtropical High Indices. J. Appl. Meteorol. Sci. 2012, 23, 414–423. (In Chinese) [Google Scholar]
  48. Pohl, B.; Matthews, A.J. Observed changes in the lifetime and amplitude of the Madden-Julian Oscillation associated with interannual ENSO sea surface temperature anomalies. J. Clim. 2007, 20, 2659–2674. [Google Scholar] [CrossRef]
  49. Wei, Y.; Ren, H. Modulation of ENSO on Fast and Slow MJO Modes during Boreal Winter. J. Clim. 2019, 32, 7483–7506. [Google Scholar] [CrossRef]
  50. Wang, B.; Chen, G.; Liu, F. Diversity of the Madden-Julian Oscillation. Sci. Adv. 2019, 5, eaax0220. [Google Scholar] [CrossRef]
  51. Ambrizzi, T.; Hoskins, B.J.; Hsu, H.-H. Rossby wave propagation and teleconnection patterns in the austral winter. J. Atmos. Sci. 1995, 52, 3661–3672. [Google Scholar] [CrossRef]
  52. Ren, P.; Ren, L.; Fu, X.; Wu, J.; Du, L. Impact of Boreal Summer Intraseasonal Oscillation on Rainfall Extremes in Southeastern China and its Predictability in CFSv2. J. Geophys. Res. Atmos. 2018, 123, 4423–4442. [Google Scholar] [CrossRef]
Figure 1. (a) Location of the Pearl River Basin within China, with shaded areas representing the multi-year mean annual precipitation (1998–2022, units: mm). (b) Same as (a) but for the multi-year mean annual evapotranspiration (1991–2020, units: mm).
Water 17 01013 g001
Figure 2. (a) Accumulated precipitation (units: mm) and (b) precipitation anomaly percentage (units: %) from 21 May to 21 June 2022. The boxed area in the figure corresponds to the latitude and longitude range of 23.5–25° N and 112–115° E, representing the Beijiang River Basin (The same geographical range is used for boxed areas in subsequent figures).
Water 17 01013 g002
Figure 3. Temporal evolution of precipitation during the Dragon Boat Festival period in the Beijiang River Basin (BJB). (a) Daily precipitation during the DBP period (21 May–21 June) in the BJB. The red line and bars represent the year 2022, while the purple line and bars indicate the climatological mean (1991–2020). (b) Daily precipitation for the year 2022, displayed as a bar chart with green and red lines representing 5-day and 10-day moving averages, respectively. (c) Cumulative precipitation during the DBP period for selected years, displayed as a bar chart with a purple line indicating the climatological mean.
Water 17 01013 g003
Figure 4. Correlation analysis between the average precipitation in the Beijiang River Basin (BJB) during the 2022 Dragon Boat Festival period and atmospheric circulation patterns. (a) Correlation coefficients between BJB precipitation and the 850 hPa wind field (vectors) and 200 hPa divergence field (shading). (b) Correlation coefficients between BJB precipitation and the meridional-vertical (v-ω) wind field along 113° E (vectors) and vertical velocity (ω) field (shading). Only results passing the 95% confidence level are displayed.
Water 17 01013 g004
Figure 5. Atmospheric circulation and moisture conditions during the extreme precipitation event in the Beijiang River Basin (BJB) from 12 to 21 June 2022. (a) Average 200 hPa geopotential height. (b) Average 500 hPa geopotential height. (c) Average 850 hPa specific humidity (shading, units: g/kg) and wind field (vectors, units: m/s; Wind speeds exceeding 12 m/s are highlighted in red). (d) Meridional-vertical cross-section along 113° E, showing the v-ω wind field (vector: v in m/s, ω in 10 2 Pa/s) and horizontal divergence (shading, units: 10−6 s−1), with cumulative rainfall distribution (units: mm) overlaid. The purple line represents the BJB, and the black bars indicate topography.
Water 17 01013 g005
Figure 6. Temporal evolution of atmospheric circulation and thermodynamic conditions during the extreme precipitation event in the Beijiang River Basin (BJB) from 12 June to 21st, 2022. (a) Characteristics of the 200 hPa geopotential height 1252-dagpm line, with red dots indicating the eastern ridge point of the South Asian High (SAH). (b) Characteristics of the 500 hPa geopotential height 588-dagpm line, with red dots indicating the western ridge point of the Western Pacific Subtropical High (WPSH). Numbers within the line segments represent dates, and red lines connect the ridge points, black contours represent pre-17 June conditions; colored contours denote post-18 June evolution. (c) Latitude–time distribution of the 500 hPa geopotential height field along 113° E. (d) Latitude–time distribution of the 925 hPa horizontal wind (vectors, units: m/s) and temperature (shading, units: K) along 113°E, with the purple line indicating the latitudinal range of the BJB. (e) Level–time distribution of the divergence field (shading, units: 10−7 s−1) and vertical velocity (contours, units: 10−1 Pa/s) averaged over the BJB region.
Water 17 01013 g006
Figure 7. Correlation analysis between subseasonal precipitation anomalies in the Beijiang River Basin (BJB) during the 2022 Dragon Boat Festival period and anomalies of the 925 hPa wind field and outgoing longwave radiation (OLR). The subseasonal anomalies represent 10–90-day filtered signals. Colored regions indicate areas where the correlation coefficients are significant at the 95% confidence level.
Water 17 01013 g007
Figure 8. Daily evolution of the Boreal Summer Intraseasonal Oscillation (BSISO) indices during the 2022 Dragon Boat Festival period (21 May–21 June). (a) BSISO1 index (30–60-day timescale) and (b) BSISO2 index (10–30-day timescale).
Water 17 01013 g008
Figure 9. Annual statistics of the duration of (a) Phase 1 for BSISO1 and (b) Phase 5 for BSISO2 during the Dragon Boat Festival period (21 May–21 June). Blue (red) bars indicate years with durations below (above) the historical climatology (1991–2020). The green line represents a linear regression trend, while the purple line depicts a third-degree polynomial fit using the least squares method.
Water 17 01013 g009
Figure 10. (a,b) The composited outgoing longwave radiation (OLR) anomalies (shading: W/m2) and 925 hPa wind anomalies (green vectors: m/s) associated with (a) Phase 1 of BSISO1 and (b) Phase 5 of BSISO2 during the 2022 Dragon Boat Festival period. (c,d) Evolution of the indices of the Western Pacific Subtropical High (WPSH; purple line: climatological mean, red line: 2022) for (c) the ridgeline index and (d) the ridgepoint index.
Water 17 01013 g010
Figure 11. Monthly evolution of the Niño 3.4 index and the Southern Oscillation Index (SOI) from January 2020 to April 2023. The Niño 3.4 index (line, units: °C) represents sea surface temperature (SST) anomalies in the central equatorial Pacific, while the Southern Oscillation Index (SOI, bars) reflects the atmospheric pressure difference between Tahiti and Darwin.
Water 17 01013 g011
Figure 12. Anomalies in sea surface temperature (SST) and 925 hPa wind field during the 2022 Dragon Boat Festival period (21 May–21 June). Shading represents SST anomalies (units: °C), while vectors indicate 925 hPa wind anomalies (units: m/s).
Water 17 01013 g012
Figure 13. Annual correlation coefficients between the number of days with (a) BSISO1 in Phase 1 and (b) BSISO2 in Phase 5 during May to August (1981–2022) and concurrent sea surface temperature (SST). Points in the figure indicate correlations that are significant at the 95% confidence level.
Water 17 01013 g013
Figure 14. Conceptual framework illustrating multiscale interactions contributing to extreme precipitation events in the Pearl River Basin (PRB) during the 2022 Dragon Boat Festival period. This figure summarizes the synergistic effects of interannual (e.g., triple-peak La Niña), subseasonal (e.g., BSISO phase stagnation), and synoptic-scale (e.g., SAH, WPSH, SCS monsoon) systems on the extreme rainfall event.
Water 17 01013 g014
Table 1. Summary of datasets used in this study.
DatasetVariablesSpatial ResolutionTemporal ResolutionTemporal CoverageSourceNotes
GPMPrecipitation0.1° × 0.1°Daily2014–2022National Aeronautics and Space Administration (NASA)/ Japan Aerospace Exploration Agency (JASA)Merged with TRMM data; validated against station observations
TRMMPrecipitation0.25° × 0.25°Daily1998–2015NASA/JAXAMission ended in April 2015; data merged with GPM
ERA5Geopotential, UV winds, temperature, specific humidity0.25° × 0.25°Hourly1979–2022ECMWFUsed for synoptic and subseasonal analysis
CMA StationsPrecipitationStationsDaily2005–2022CMAUsed for validation of satellite precipitation data
NOAA OLROutgoing longwave
radiation
2.5° × 2.5°Daily1974–2022NOAAUsed to monitor tropical convection
NOAA SSTSea surface temperature0.25° × 0.25°Monthly1981–2022NOAAUsed for interannual-scale analysis (e.g., ENSO)
China EptEvapotranspiration0.01° × 0.01°Monthly1991–2020National Tibetan Plateau Data Center in China
BSISO IndexBSISO1, BSISO2N/ADaily1981–2022Lee et al. [31]Used to monitor tropical intraseasonal signals
Disclaimer/Publisher’s Note: The statements, opinions and data contained in all publications are solely those of the individual author(s) and contributor(s) and not of MDPI and/or the editor(s). MDPI and/or the editor(s) disclaim responsibility for any injury to people or property resulting from any ideas, methods, instructions or products referred to in the content.

