
Comparing Particulate Carbon Fluxes in Tropical Karst Lakes with Different Trophic Statuses

 ,
,  ,
,  , ,
, , 
Abstract
1. Introduction
2. Materials and Methods
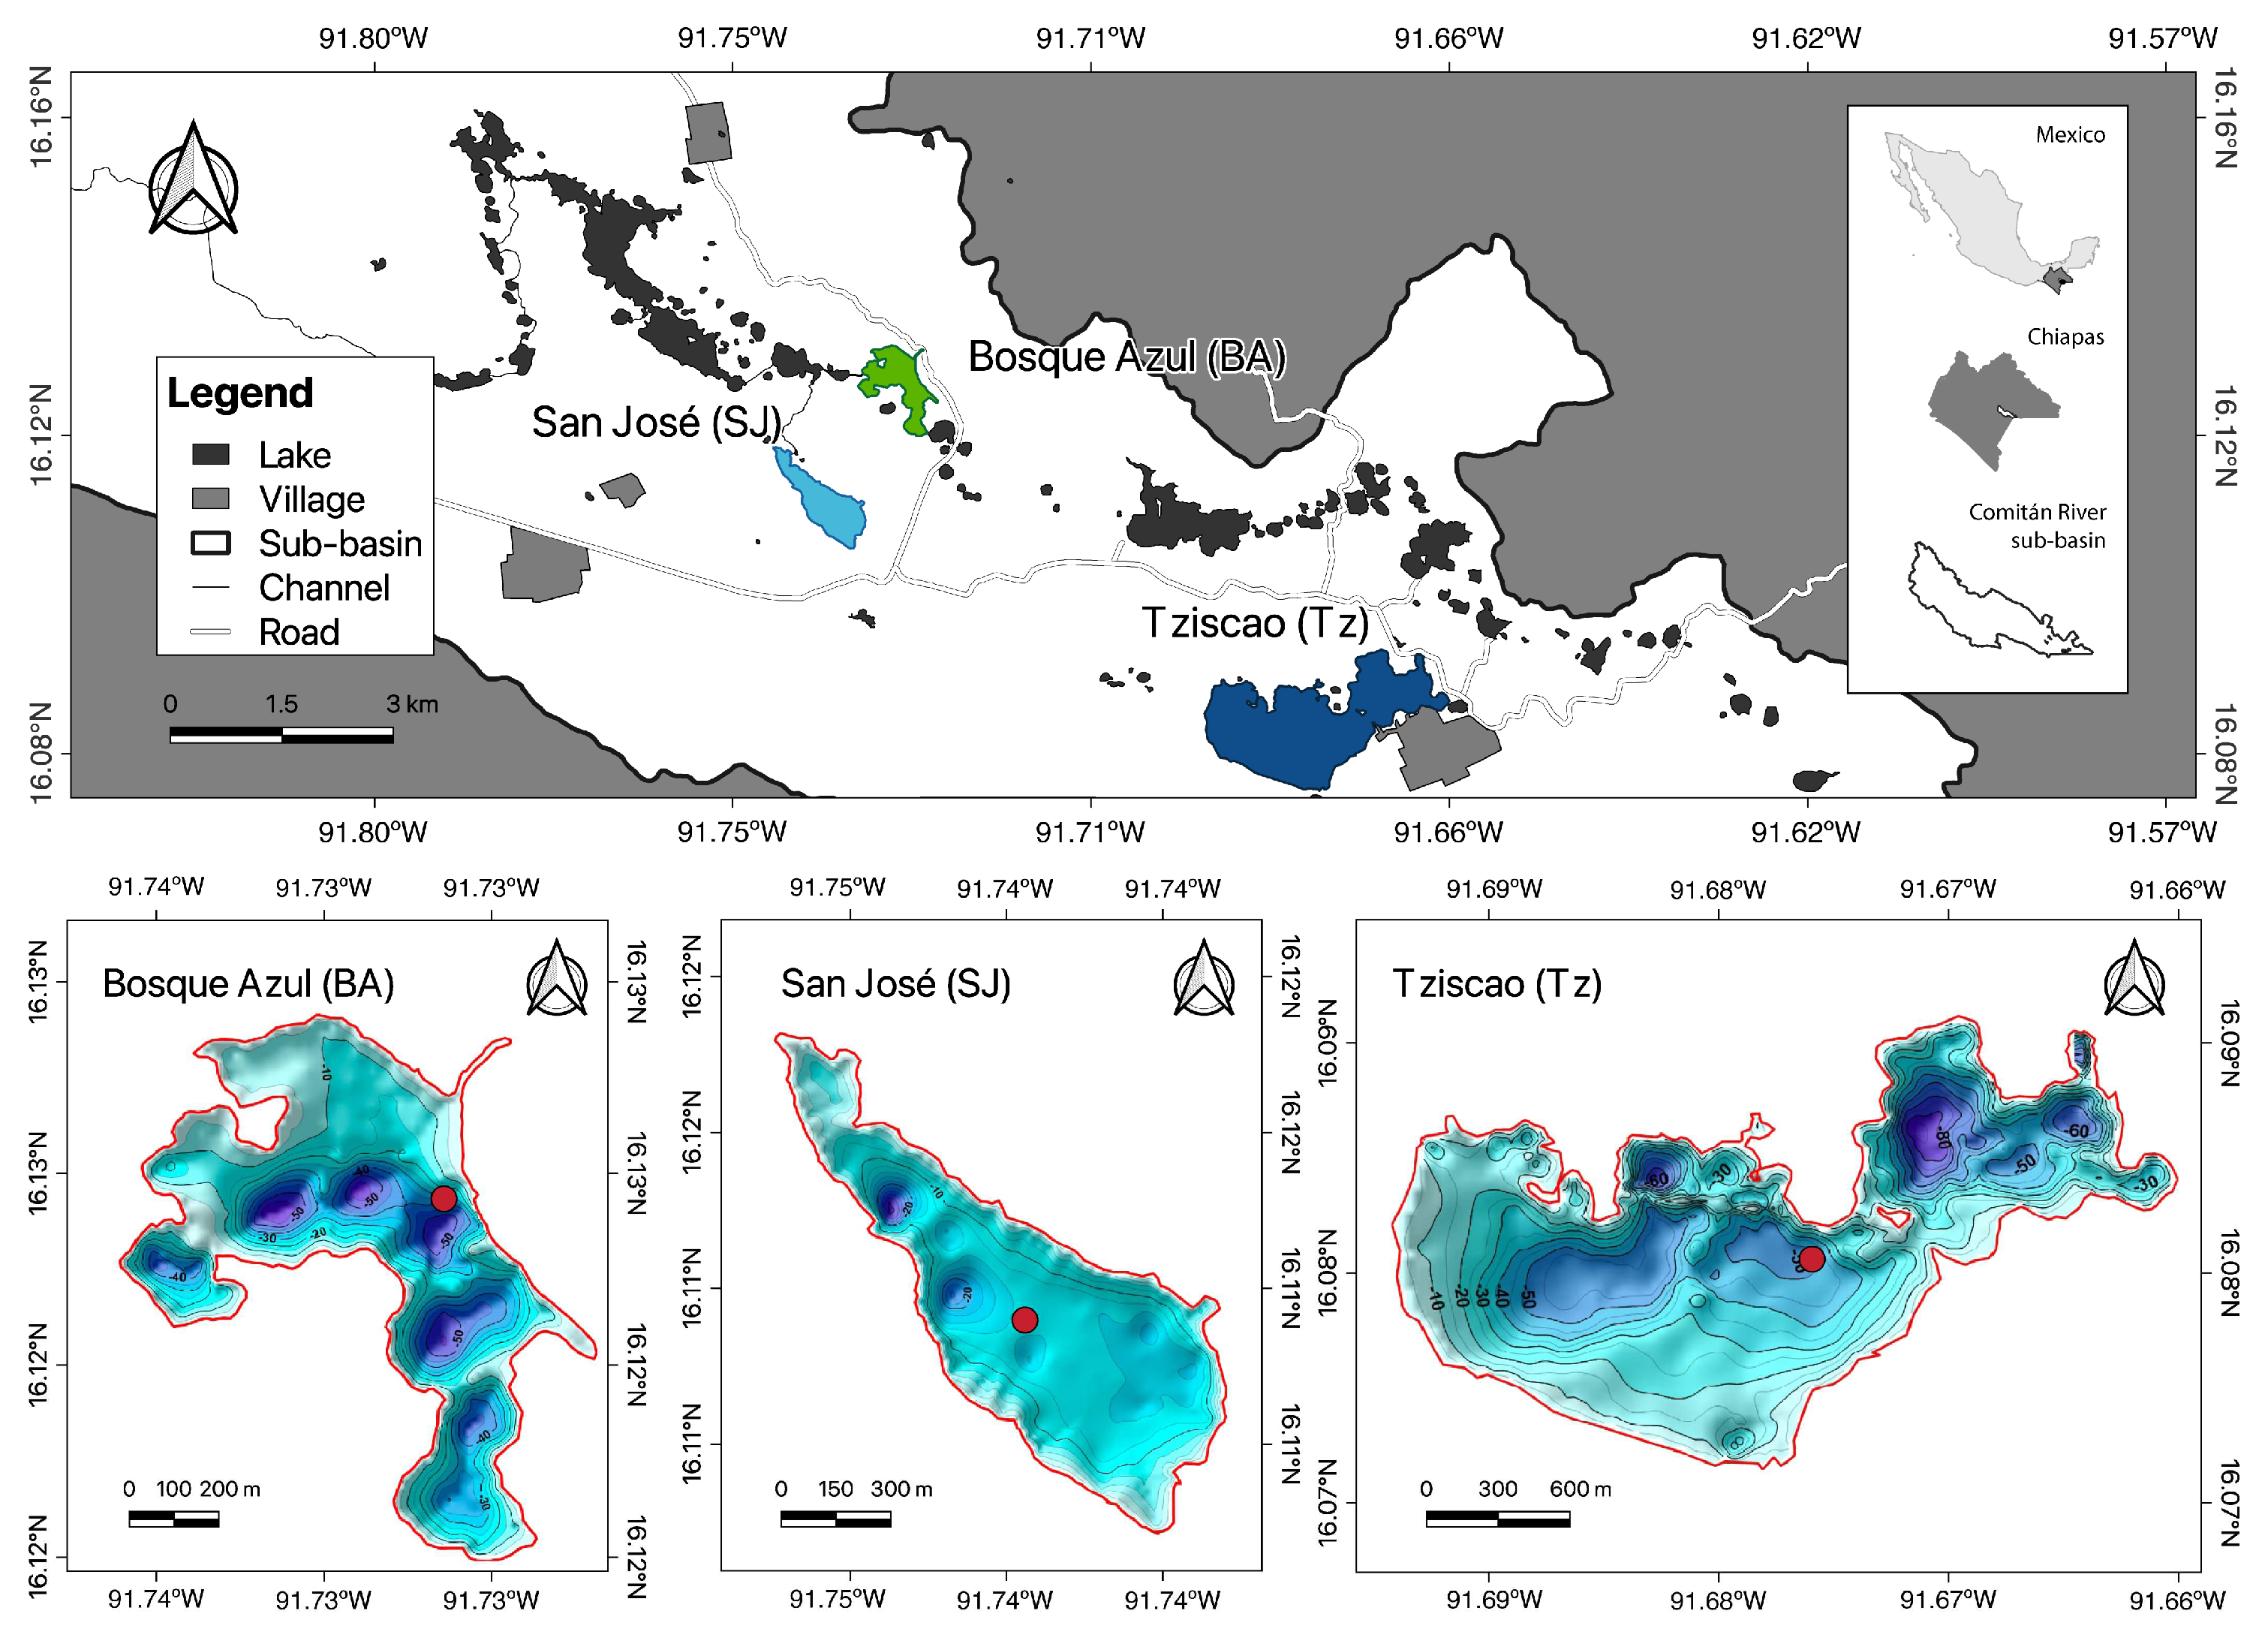
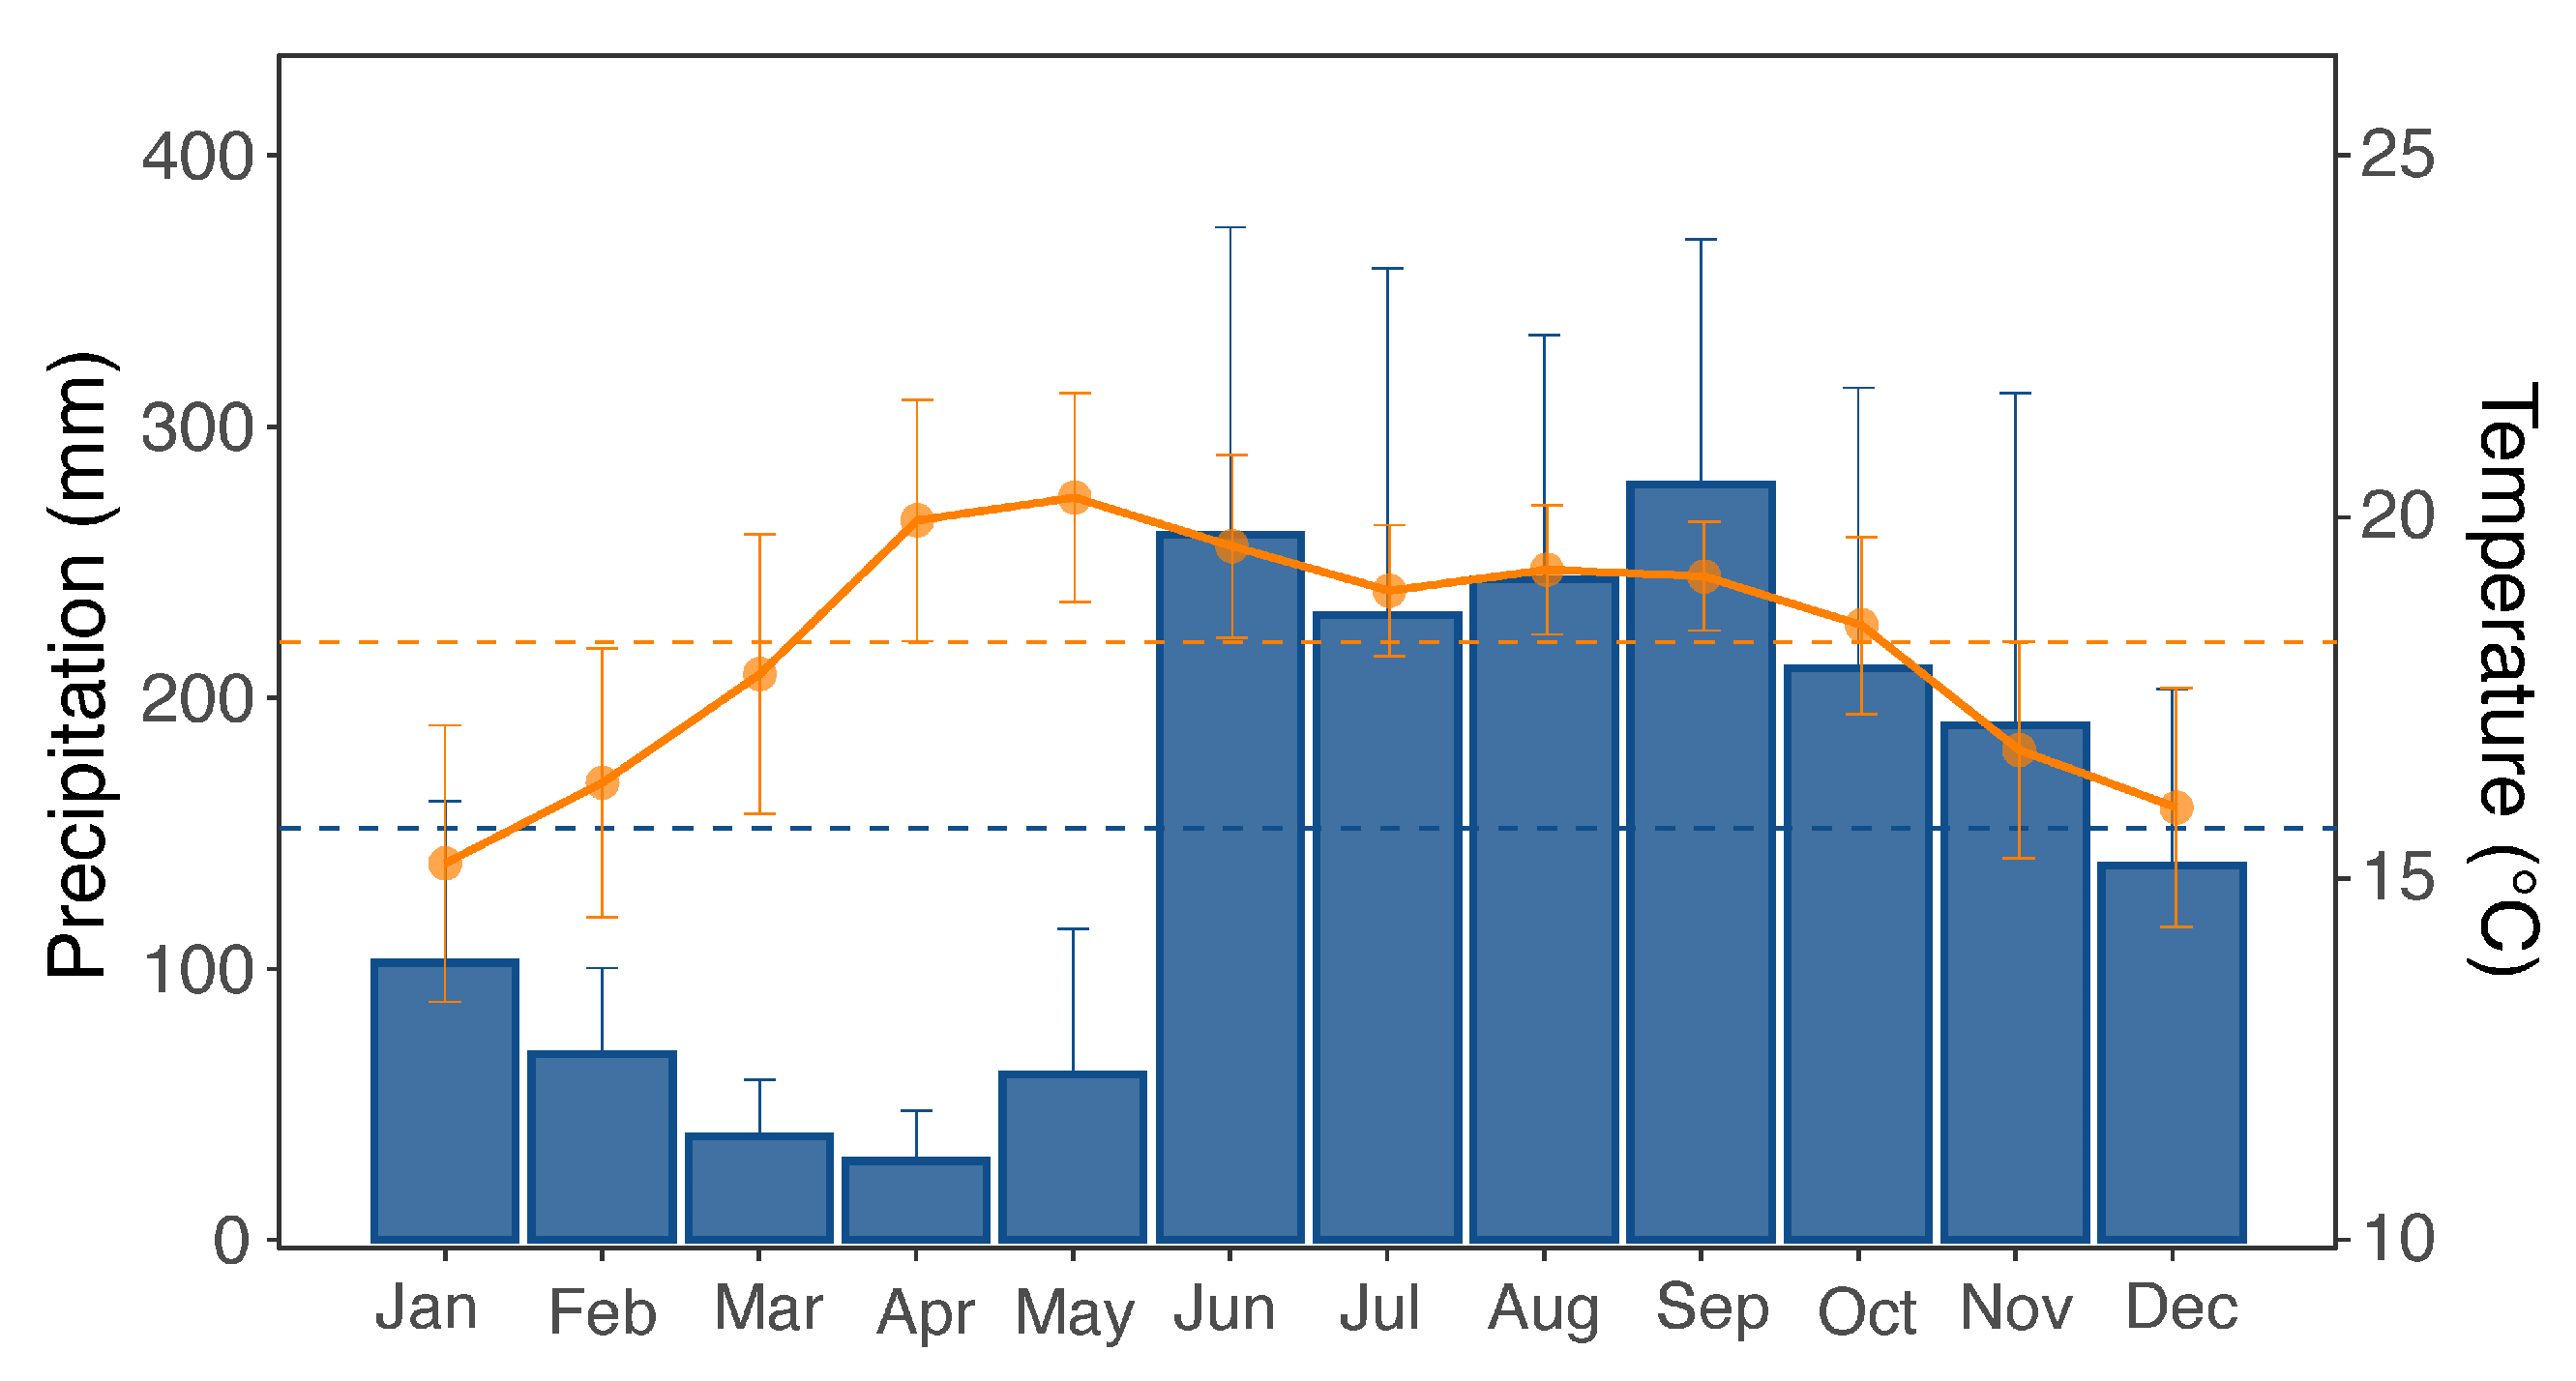
2.1. Study Area
2.2. Fluxes
2.3. Statistical Analyses
3. Results
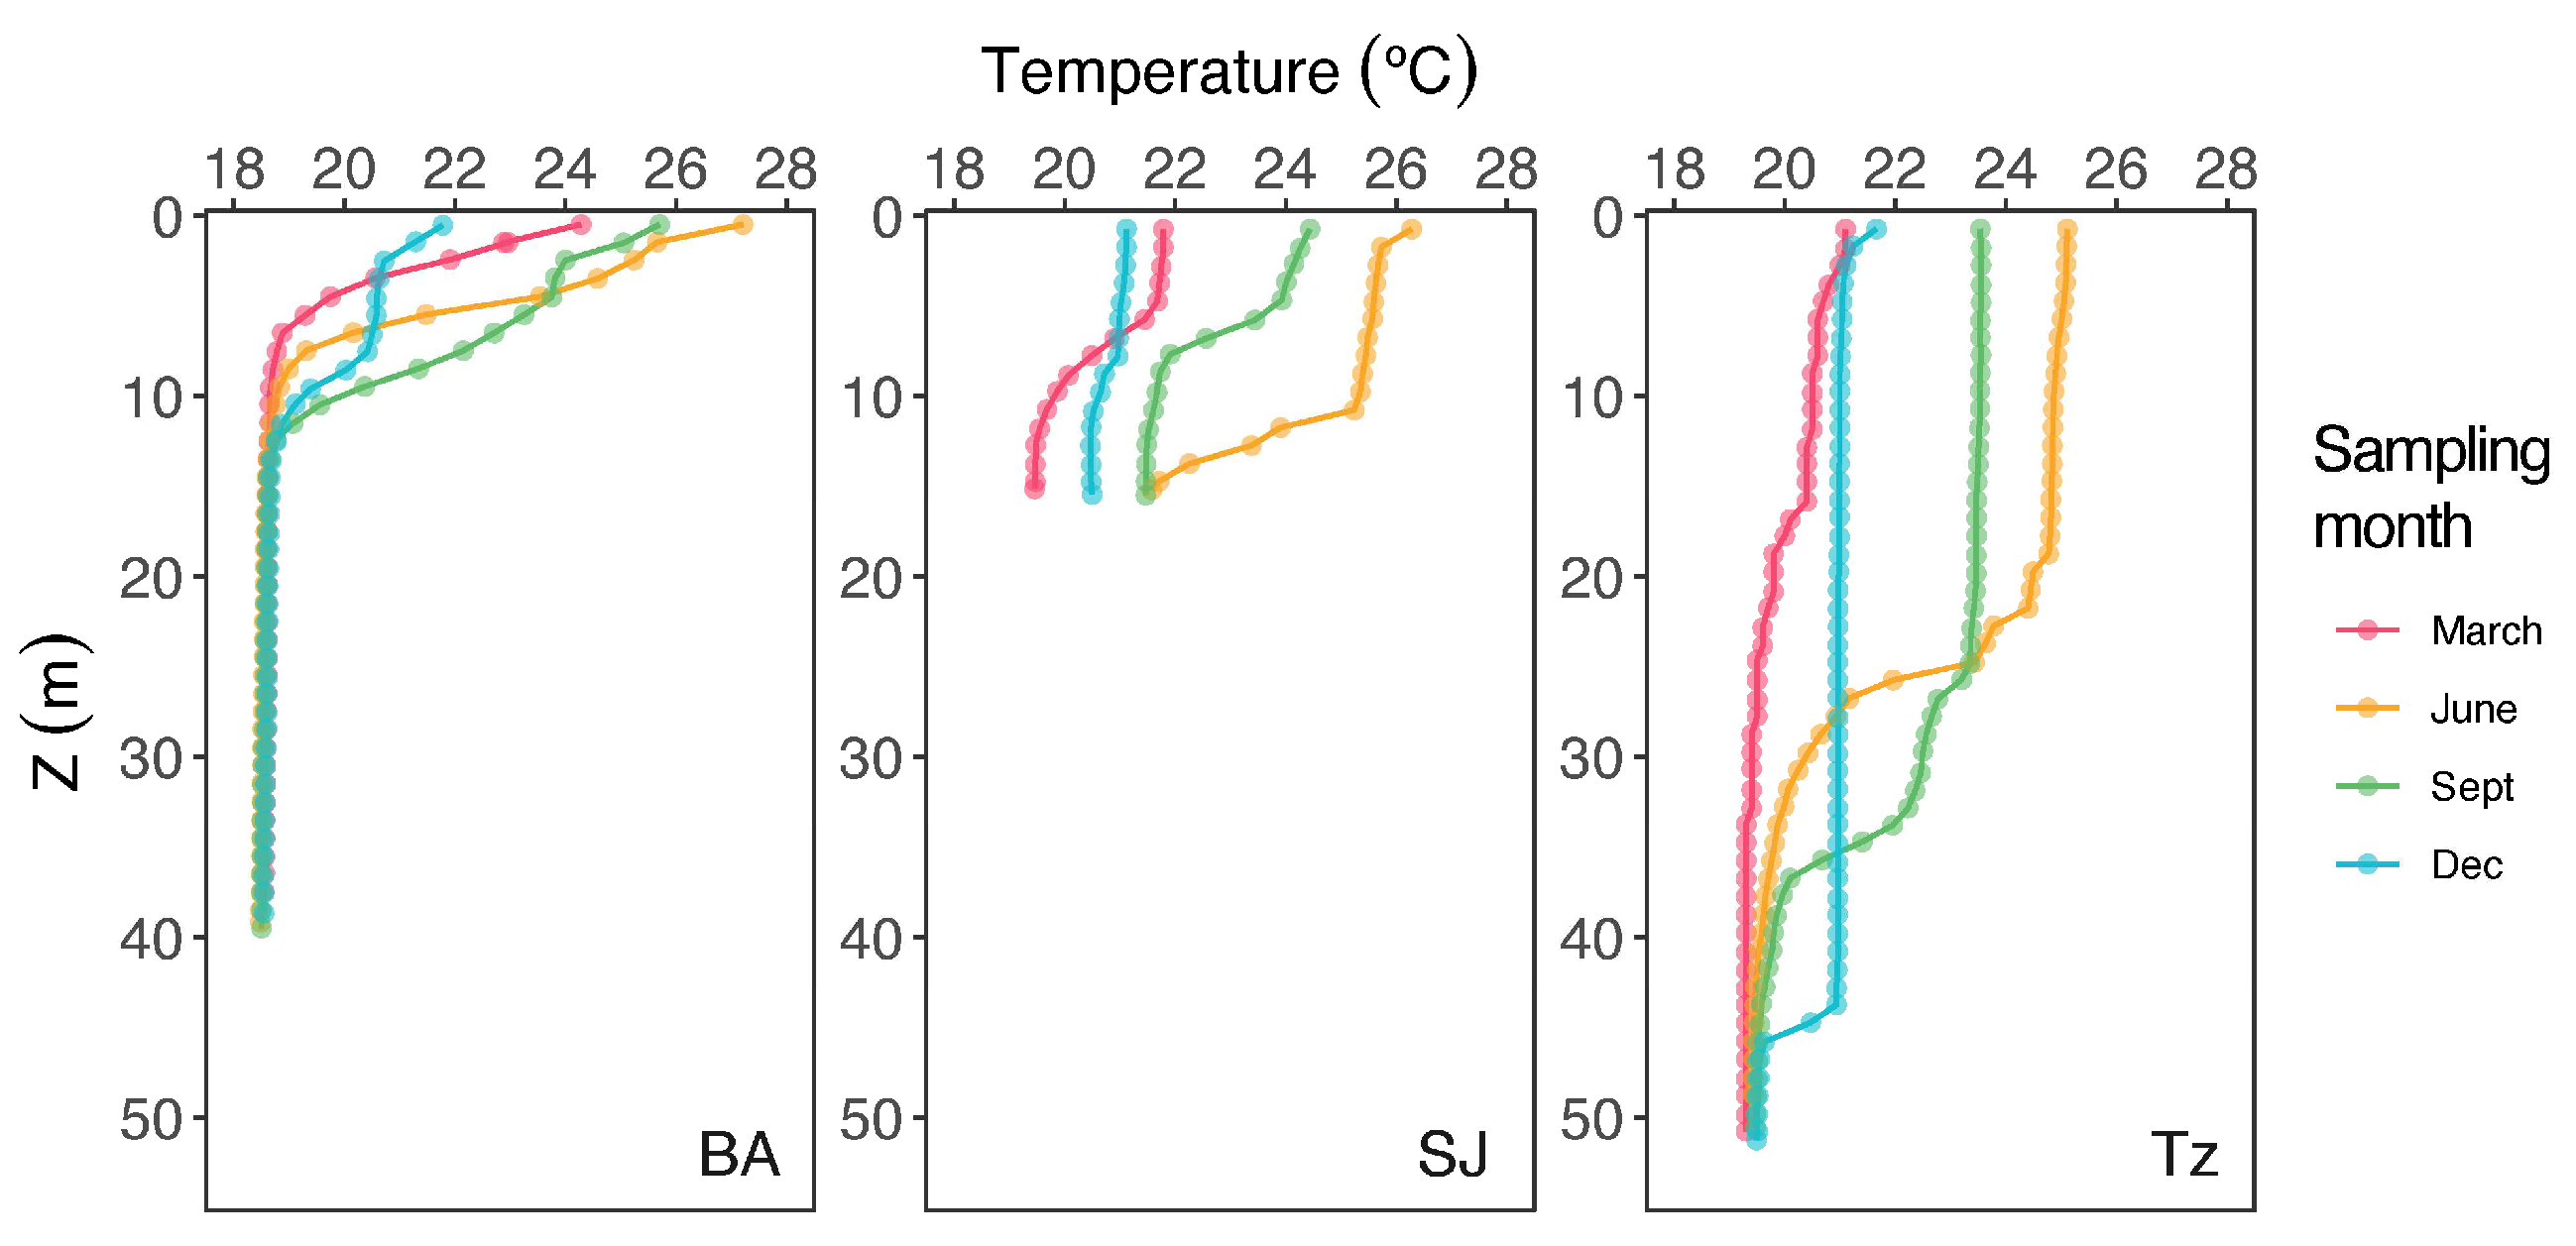
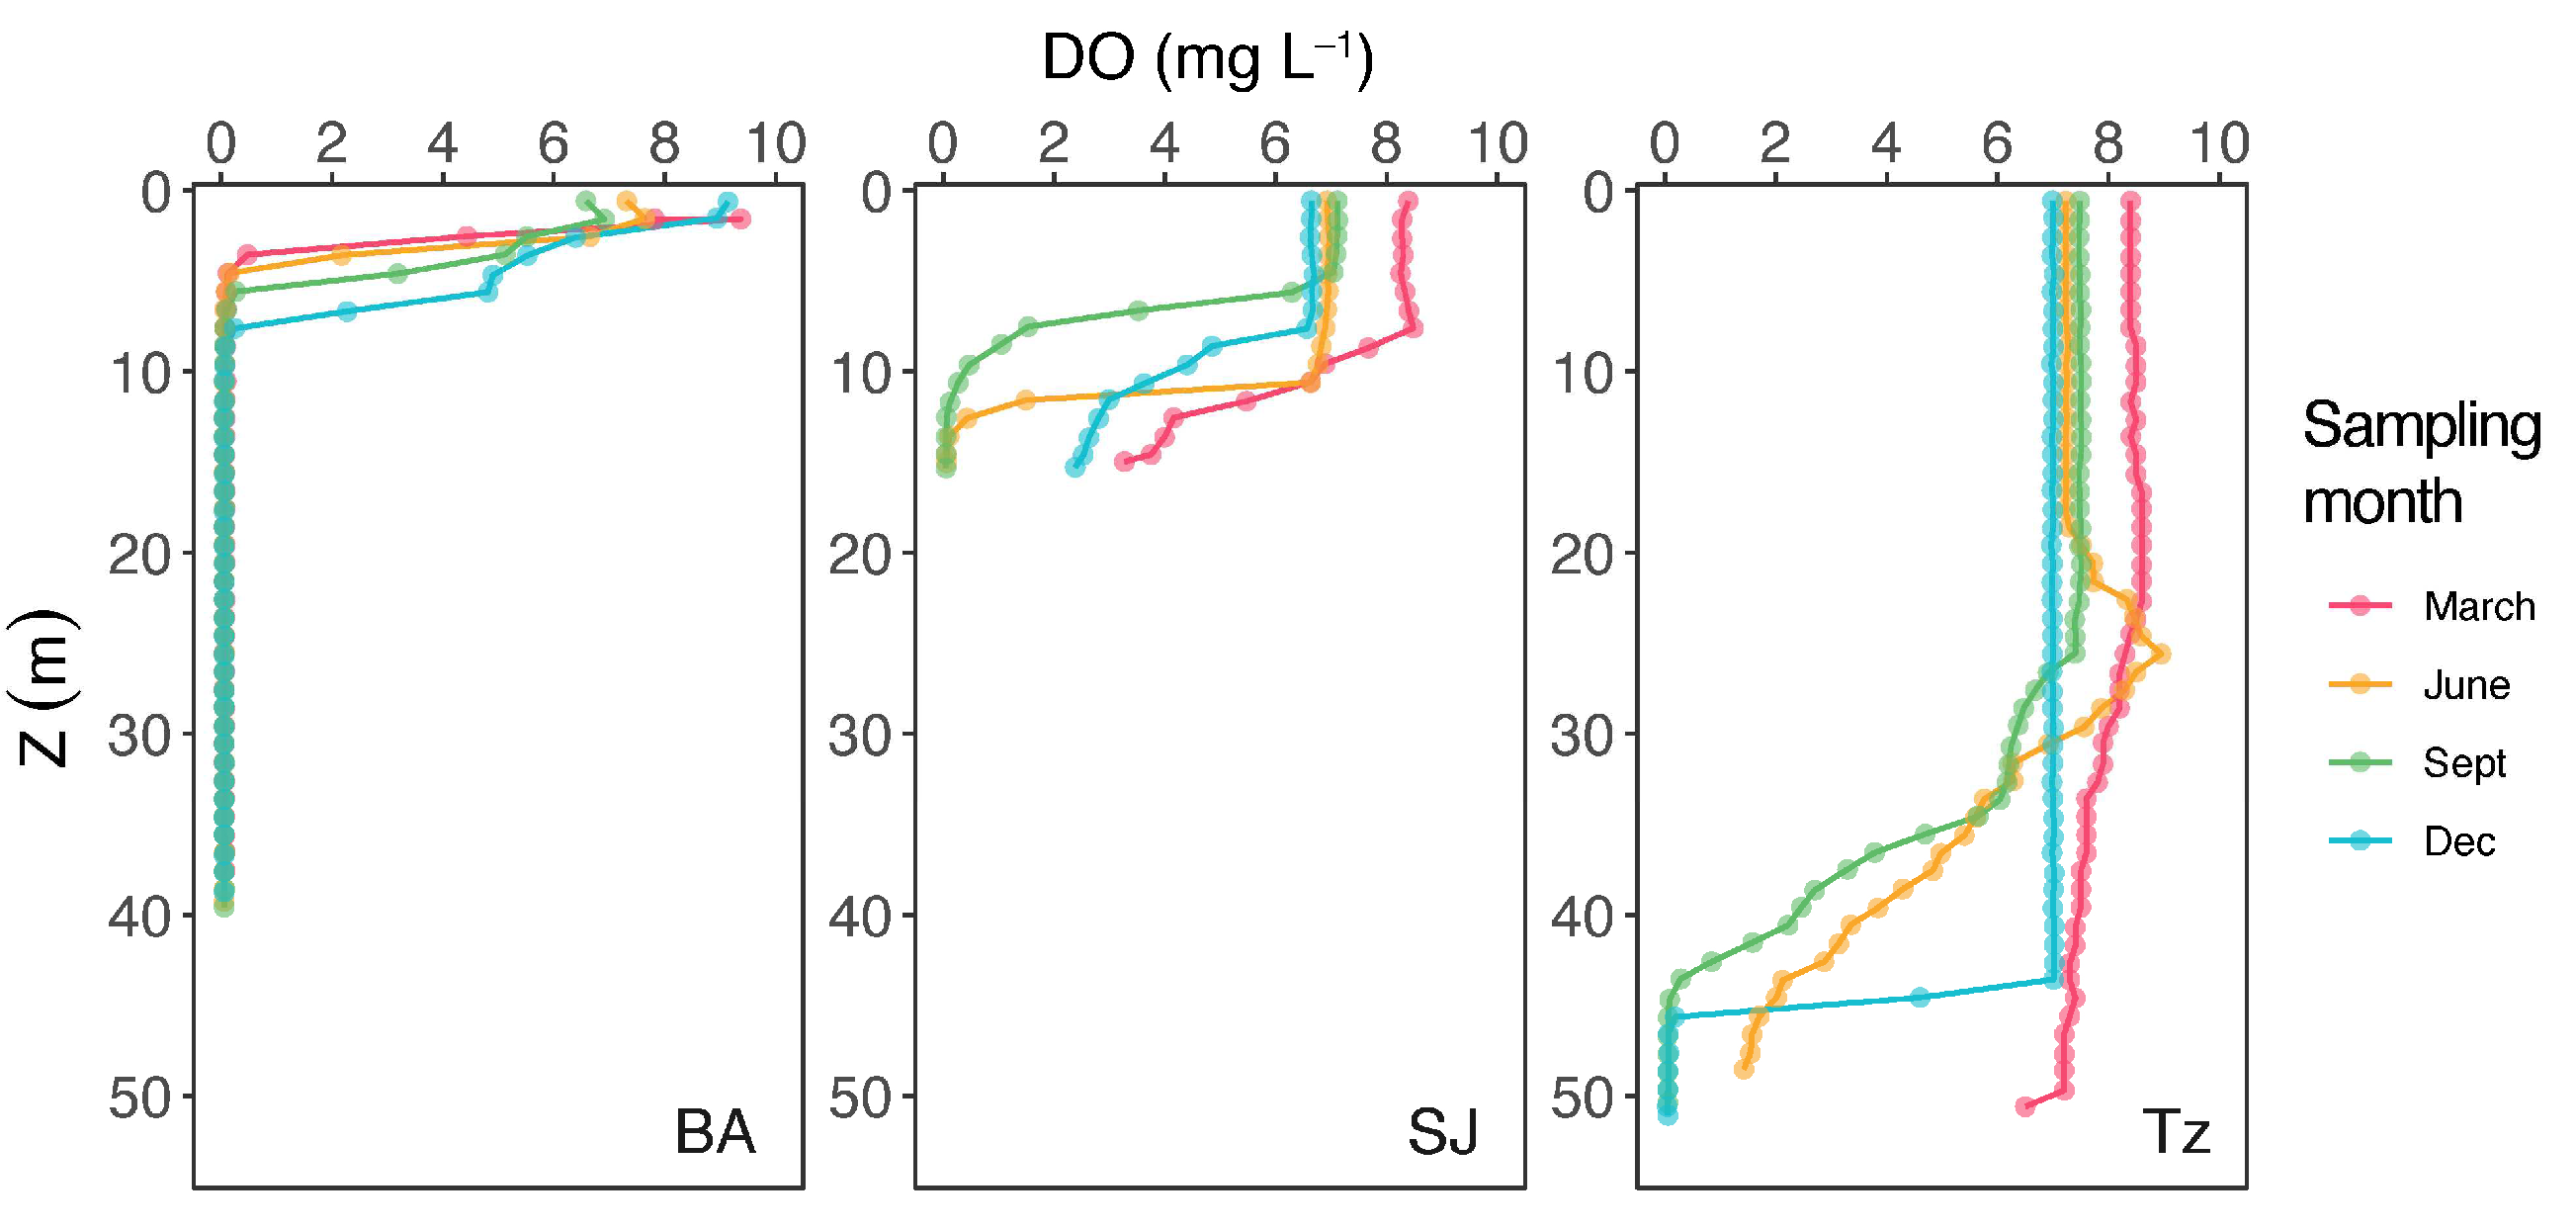
3.1. Temperature and Dissolved Oxygen
3.2. Fluxes
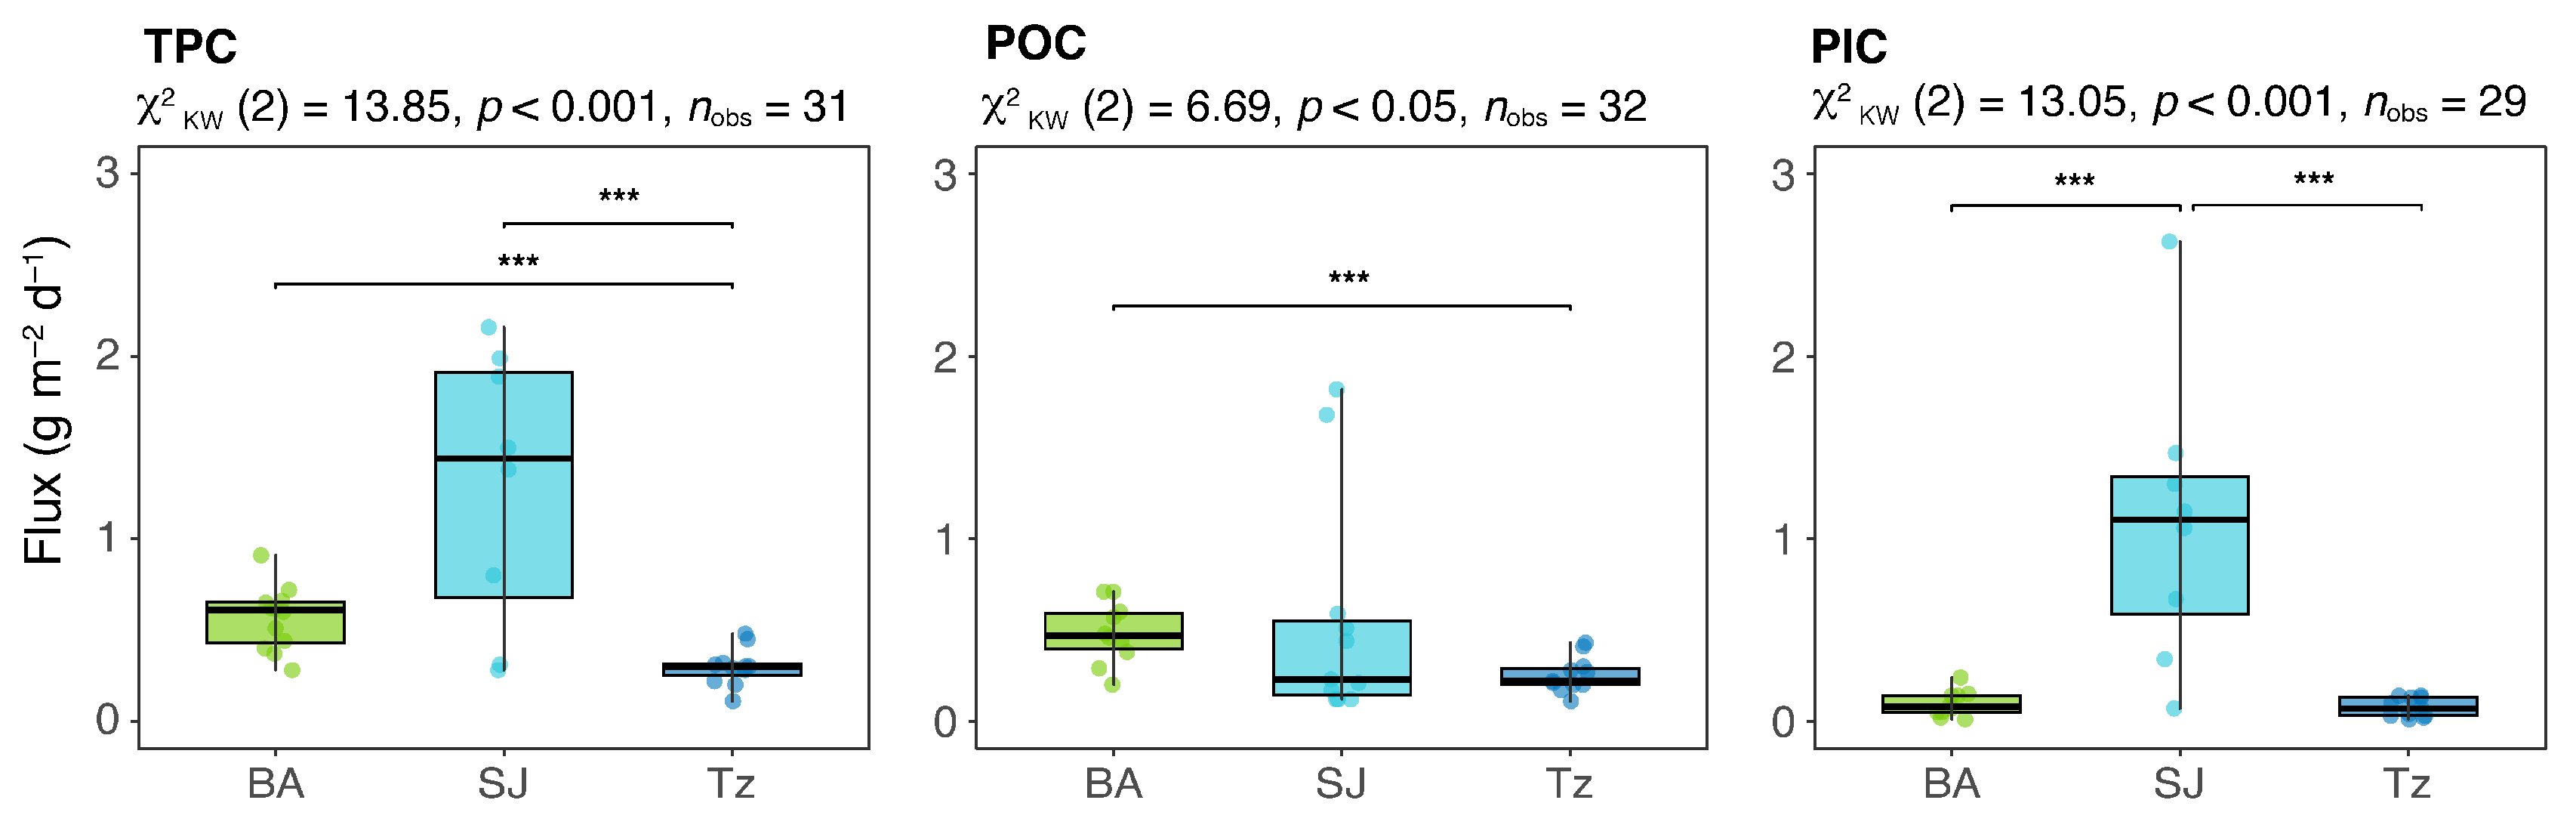
3.2.1. Carbon
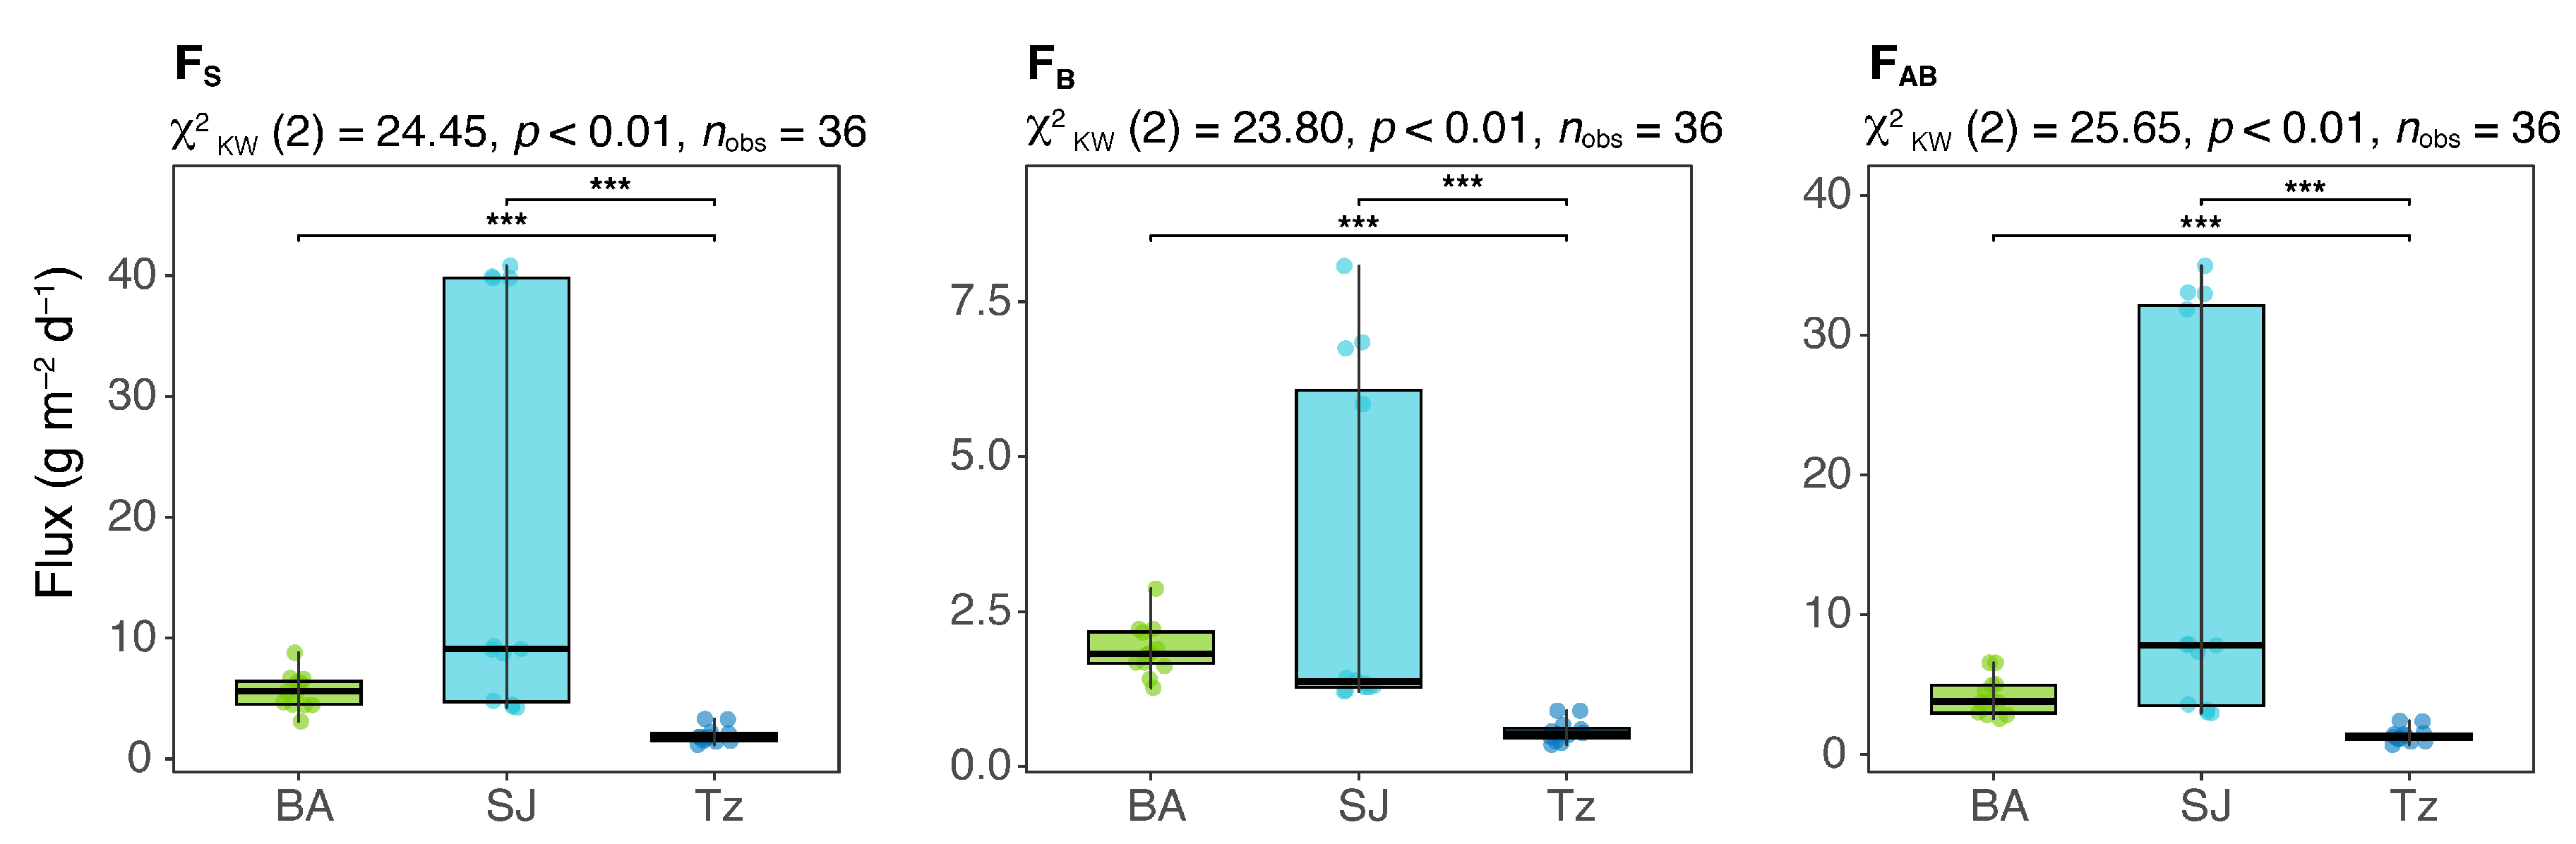
3.2.2. Seston
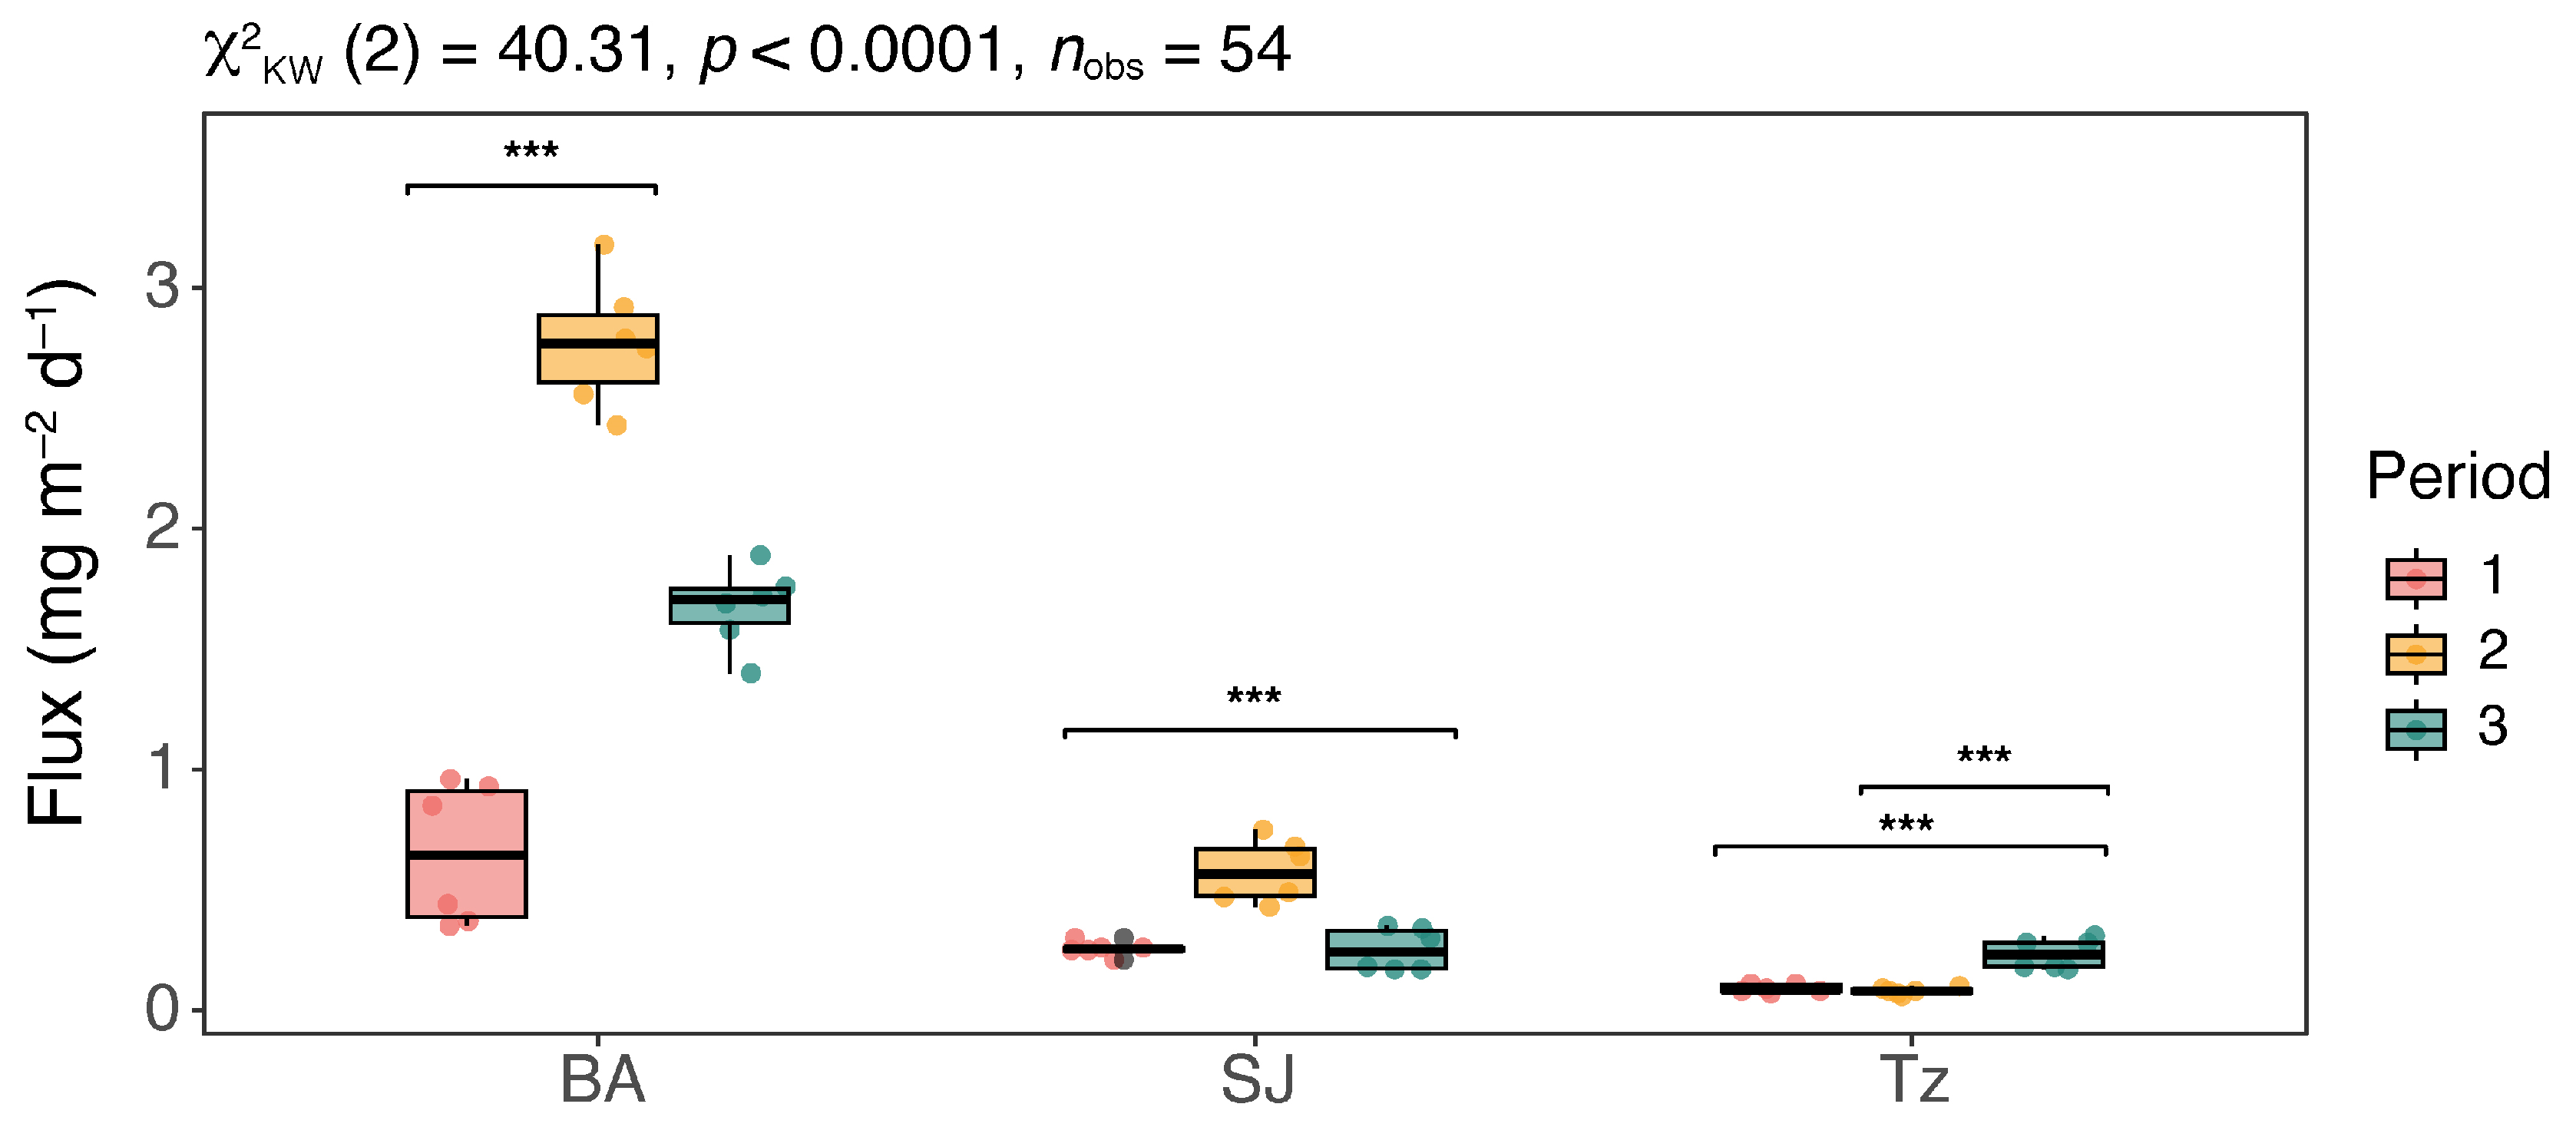
3.2.3. Chlorophyll-a
4. Discussion
5. Conclusions
Author Contributions
Funding
Data Availability Statement
Acknowledgments
Conflicts of Interest
References
- Mendonça, R.; Müller, R.A.; Clow, D.; Verpoorter, C.; Raymond, P.; Tranvik, L.J.; Sobek, S. Organic Carbon Burial in Global Lakes and Reservoirs. Nat. Commun. 2017, 8, 1694. [Google Scholar] [CrossRef] [PubMed]
- Tranvik, L.J.; Cole, J.J.; Prairie, Y.T. The Study of Carbon in Inland Waters—From Isolated Ecosystems to Players in the Global Carbon Cycle. Limnol. Oceanogr. Lett. 2018, 3, 41–48. [Google Scholar] [CrossRef]
- Butman, D.; Striegl, R.; Stackpoole, S.; del Giorgio, P.; Prairie, Y.; Pilcher, D.; Raymond, P.; Pellat, F.P.; Alcocer, J. Chapter 14: Inland waters. In Second State of the Carbon Cycle Report (SOCCR2): A Sustained Assessment Report; Cavallaro, N., Shrestha, G., Birdsey, R., Mayes, M.A., Najjar, R.G., Reed, S.C., Romero-Lankao, P., Zhu, Z., Eds.; U.S. Global Change Research Program: Washington, DC, USA, 2018; pp. 1–470. Available online: https://carbon2018.globalchange.gov/chapter/14 (accessed on 21 November 2024).
- Heathcote, A.J.; Downing, J.A. Impacts of Eutrophication on Carbon Burial in Freshwater Lakes in an Intensively Agricultural Landscape. Ecosystems 2012, 15, 60–70. [Google Scholar] [CrossRef]
- Anderson, N.J.; Bennion, H.; Lotter, A.F. Lake Eutrophication and Its Implications for Organic Carbon Sequestration in Europe. Glob. Chang. Biol. 2014, 20, 2741–2751. [Google Scholar] [CrossRef] [PubMed]
- Sun, W.; Jiang, Q.; Liu, E.; Chang, J.; Zhang, E. Climate Change Dominates Recent Sedimentation and Organic Carbon Burial in Lake Chenghai, Southwest China. J. Limnol. 2018, 77, 372–384. [Google Scholar] [CrossRef]
- Huang, C.; Chen, Z.; Gao, Y.; Luo, Y.; Huang, T.; Zhu, A.; Yang, H.; Yang, B. Enhanced Mineralization of Sedimentary Organic Carbon Induced by Excess Carbon from Phytoplankton in a Eutrophic Plateau Lake. J. Soils Sediments 2019, 19, 2613–2623. [Google Scholar] [CrossRef]
- Alcocer, J.; Ruiz-Fernández, A.C.; Escobar, E.; Pérez-Bernal, L.H.; Oseguera, L.A.; Ardiles-Gloria, V. Deposition, Burial and Sequestration of Carbon in an Oligotrophic, Tropical Lake. J. Limnol. 2014, 73, 223–235. [Google Scholar] [CrossRef]
- Ngochera, M.J.; Bootsma, H.A. Carbon, Nitrogen and Phosphorus Content of Seston and Zooplankton in Tropical Lake Malawi: Implications for Zooplankton Nutrient Cycling. Aquat. Ecosyst. Health Manag. 2018, 21, 185–192. [Google Scholar] [CrossRef]
- Durán Calderón, I.; Escolero Fuentes, O.A.; Muñoz Salinas, E.; Castillo Rodríguez, M.; Silva Romo, G. Cartografía geomorfológica a escala 1:50000 del Parque Nacional Lagunas de Montebello, Chiapas (México). Boletín Soc. Geológica Mex. 2014, 66, 263–277. [Google Scholar] [CrossRef]
- Alcocer, J.; Vargas-Sánchez, M.; Rivera-Herrera, E.M.; Oseguera, L.A.; Sánchez-Carrillo, S. Limnological Comparison of Pristine and Impacted Lakes from a Tropical, High-Altitude Karst Region in Southern Mexico. Inland. Waters 2024, 1–12. [Google Scholar] [CrossRef]
- Alcocer, J.; Merino-Ibarra, M.; Oseguera, L.A.; Escolero, O. Anthropogenic Impacts on Tropical Karst Lakes: “Lagunas de Montebello,” Chiapas. Ecohydrology 2018, 11, e2029. [Google Scholar] [CrossRef]
- Caballero, M.; Mora, L.; Muñoz, E.; Escolero, O.; Bonifaz, R.; Ruiz, C.; Prado, B. Anthropogenic Influence on the Sediment Chemistry and Diatom Assemblages of Balamtetik Lake, Chiapas, Mexico. Environ. Sci. Pollut. Res. 2020, 27, 15935–15943. [Google Scholar] [CrossRef]
- Mora Palomino, L.; García, L.A.; Ramos, Y.R.; Bonifaz, R.; Escolero, O. Description of Chemical Changes in a Large Karstic System: Montebello, Mexico. Procedia Earth Planet. Sci. 2017, 17, 829–832. [Google Scholar] [CrossRef]
- Alvarado Velázquez, J.A.; García-Meneses, P.M.; Esse, C.; Saavedra, P.; Trosino, R.M.; Alfonzo, R.B.; Mazari-Hiriart, M. Spatially Explicit Vulnerability Analysis of Contaminant Sources in a Karstic Watershed in Southeastern Mexico. Appl. Geogr. 2022, 138, 102606. [Google Scholar] [CrossRef]
- Olea-Olea, S.; Escolero, O. Nutrients Load Estimation to a Lake System through the Local Groundwater Flow: Los Lagos de Montebello, México. J. S. Am. Earth Sci. 2018, 84, 201–207. [Google Scholar] [CrossRef]
- García Amaro, E. Modificaciones al Sistema de Clasificación Climática de Köppen: Para Adaptarlo a las Condiciones de la República Mexicana, Segunda Edición, Corregida y Aumentada; Universidad Nacional Autónoma de México: Mexico City, México, 1988. [Google Scholar]
- Comisión Nacional de Áreas Naturales Protegidas (CONANP). Programa de Conservación y Manejo Parque Nacional Lagunas de Montebello; Secretaría de Medio Ambiente y Recursos Naturales: Mexico City, Mexico, 2007; pp. 9–10. ISBN 978-968-817-848-5. [Google Scholar]
- Mora P, L.; Bonifaz, R.; López-Martínez, R. Unidades geomorfológicas de la cuenca del Río Grande de Comitán, Lagos de Montebello, Chiapas-México. Boletín Soc. Geológica Mex. 2016, 68, 377–394. [Google Scholar] [CrossRef]
- Ortega-Gutiérrez, F.; Mitre, S.L.; Roldán, Q.J.; Aranda, G.J.J.; Morán, Z.D.; Alaniz, A.S.; Nieto, S.A. Carta Geológica de La República Mexicana, 1:2000000 (map); Universidad Nacional Autónoma de México, Institutoo de Geología: Mexico City, Mexico, 1992; 78p. [Google Scholar]
- Alcocer, J.; Oseguera, L.A.; Sánchez, G.; González, C.G.; Martínez, J.R.; González, R. Bathymetric and Morphometric Surveys of the Montebello Lakes, Chiapas. J. Limnol. 2016, 75, 56–65. [Google Scholar] [CrossRef]
- Bloesch, J. A Review of Methods Used to Measure Sediment Resuspension. Hydrobiologia 1994, 284, 13–18. [Google Scholar] [CrossRef]
- Gardner, W.D.; Hinga, K.R.; Marra, J. Observations on the Degradation of Biogenic Material in the Deep Ocean with Implications on Accuracy of Sediment Trap Fluxes. J. Mar. Res. 1983, 41, 195–214. [Google Scholar] [CrossRef]
- Lee, C.; Hedges, J.I.; Wakeham, S.G.; Zhu, N. Effectiveness of Various Treatments in Retarding Microbial Activity in Sediment Trap Material and Their Effects on the Collection of Swimmers. Limnol. Oceanogr. 1992, 37, 117–130. [Google Scholar] [CrossRef]
- Goto, N.; Hisamatsu, K.; Yoshimizu, C.; Ban, S. Effectiveness of Preservatives and Poisons on Sediment Trap Material in Freshwater Environments. Limnology 2016, 17, 87–94. [Google Scholar] [CrossRef]
- Arar, E.J.; Collins, G.B. In Vitro Determination of Chlorophyll and Pheophytin a in Marine and Freshwater Algae by Fluorescence; U.S. Environmental Protection Agency: Washington, DC, USA, 1997. [Google Scholar]
- Shapiro, S.S.; Wilk, M.B. An Analysis of Variance Test for Normality (Complete Samples). Biometrika 1965, 52, 591–611. [Google Scholar] [CrossRef]
- R Core Team. R: A Language and Environment for Statistical Computing; R Foundation for Statistical Computing: Vienna, Austria, 2021; Available online: https://www.R-project.org/ (accessed on 21 November 2024).
- Ogle, D.H.; Doll, J.C.; Wheeler, A.P.; Dinno, A. FSA: Simple Fisheries Stock Assessment Methods. R Package Version 0.9.5. 2023. Available online: https://CRAN.R-project.org/package=FSA (accessed on 21 November 2024).
- Almeida, B.T. Heterogeneidad Espacial En El Sistema Lacustre de Montebello: Estructura Funcional y Taxonómica Del Fitoplancton; UNAM, FES Iztacala: Tlalnepantla, México, 2014. [Google Scholar]
- Martínez, M. Caracterización de Los Suelos de La Cuenca Del Río Grande, Como Soporte Para Entender La Dinámica de Contaminantes Que Llegan al Sistema Lagunar de Montebello, Chiapas; UNAM, FES Zaragoza: Tlalnepantla, México, 2015. [Google Scholar]
- Mora, L.; Prado, B. Edafología. In Atlas del Socioecosistema Río Grande de Comitán-Lagos de Montebello, Chiapas; Mazari-Hiriart, M., García-Meneses, P.M., Eds.; Seminario Universitario de Sociedad, Medio Ambiente e Instituciones (SUSMAI), Universidad Nacional Autónoma de México, UNAM: Mexico City, México, 2024. [Google Scholar] [CrossRef]
- INEGI. Guía Para la Interpretación de Cartografía: Uso del Suelo y Vegetación: Scala 1:250, 000: Serie V; Instituto Nacional de Estadística y Geografía (INEGI): México City, Mexico, 2014; 195p. [Google Scholar]
- Castro, R.; Bonifaz, R.; Alvarado, V.J.; Mazari, M. Uso de Suelo y Vegetación. In Atlas del Socioecosistema Río Grande de Comitán-Lagos de Montebello, Chiapas; Mazari-Hiriart, M., García-Meneses, P.M., Eds.; Secretaría de Desarrollo Institucional: Ciudad de México, México, 2024. [Google Scholar] [CrossRef]
- Kruk, C.; Peeters, E.t.h.m.; Van Nes, E.H.; Huszar, V.L.M.; Costa, L.S.; Scheffer, M. Phytoplankton Community Composition Can Be Predicted Best in Terms of Morphological Groups. Limnol. Oceanogr. 2011, 56, 110–118. [Google Scholar] [CrossRef]
- Kunz, M.J.; Anselmetti, F.S.; Wüest, A.; Wehrli, B.; Vollenweider, A.; Thüring, S.; Senn, D.B. Sediment Accumulation and Carbon, Nitrogen, and Phosphorus Deposition in the Large Tropical Reservoir Lake Kariba (Zambia/Zimbabwe). J. Geophys. Res. 2011, 116, G03003. [Google Scholar] [CrossRef]
- Ohlendorf, C.; Bigler, C.; Goudsmit, G.-H.; Lemcke, G.; Livingstone, D.M.; Lotter, A.F.; Müller, B.; Sturm, M. Causes and Effects of Long Periods of Ice Cover on a Remote High Alpine Lake. J. Limnol. 2000, 59, 65–80. [Google Scholar] [CrossRef]
- Oseguera, L.A.; Alcocer, J.; Vilaclara, G. Relative Importance of Dust Inputs and Aquatic Biological Production as Sources of Lake Sediments in an Oligotrophic Lake in a Semi-Arid Area. Earth Surf. Process. Landf. 2011, 36, 419–426. [Google Scholar] [CrossRef]
- Oseguera, L.A.; Alcocer, J.; Hernández-Hernández, B. Variación Del Flujo de Carbono Orgánico Particulado En Un Lago Oligotrófico Con Dominancia de Fitoplancton de Talla Grande [Variation of Particulate Organic Carbon Flux in a Large Size Phytoplankton-Dominant Oligotrophic Lake]. In Estado Actual del Conocimiento del Ciclo del Carbono y sus Interacciones en México: Síntesis a 2013; Programa Mexicano del Carbono, Colegio de Posgraduados, Universidad Autónoma de Chapingo e Instituto Tecnológico y de Estudios Superiores de Monterrey: Texcoco, México, 2013. [Google Scholar]
- Pascoe-Orrala, T.; Alcocer, J.; Oseguera, L.A. Evaluación de las diferencias de los flujos de carbono particulado en la zona pelágica de un lago tropical profundo. In Tendencias de Investigación en Limnología Tropical: Perspectivas Universitarias en Latinoamérica; Alcocer, J., Merino-Ibarra, M., Escobar-Briones, E., Eds.; Asociación Mexicana de Limnología, A.C., Instituto de Ciencias del Mar y Limnología, UNAM, y Consejo Nacional de Ciencias y Tecnología: Texcoco, México, 2015; pp. 165–170. ISBN 978-607-02-7199-1. [Google Scholar]
- Callieri, C.; Bertoni, R.; De Marco, C.; Contesini, M. Settling Flux and Sinking Velocity of Seston in Lago Di Mergozzo (Northern Italy) and Influence of Microbial Activity on the Decomposition of Entrapped Organic Material. Hydrobiologia 1991, 213, 155–165. [Google Scholar] [CrossRef]
- Callieri, C. Sedimentation and Aggregate Dynamics in Lake Maggiore, a Large, Deep Lake in Northern Italy. Mem. Ist. Ital. Di Idrobiol. 1997, 56, 37–50. [Google Scholar]
- Wei, Y.; Yan, H.; Liu, Z.; Han, C.; Ma, S.; Sun, H.; Bao, Q. The Ballast Effect Controls the Settling of Autochthonous Organic Carbon in Three Subtropical Karst Reservoirs. Sci. Total Environ. 2022, 818, 151736. [Google Scholar] [CrossRef]
- Stallard, R.F. Weathering and Erosion in the Humid Tropics. In Physical and Chemical Weathering in Geochemical Cycles; Lerman, A., Meybeck, M., Eds.; Springer: Dordrecht, The Netherlands, 1988; pp. 225–246. [Google Scholar] [CrossRef]

| Lake | Latitude | Longitude | Altitude | Area | Volume | Zmax | Zmean |
|---|---|---|---|---|---|---|---|
| (°N) | (°W) | (m a.s.l) | (ha) | (km3) | (m) | (m) | |
| BA | 16.120–16.131 | 91.729–91.739 | 1458 | 52.5 | 0.01050 | 58 | 20.0 |
| SJ | 16.106–16.119 | 91.738–91.750 | 1454 | 60.6 | 0.00623 | 30 | 10.3 |
| Tz | 16.075–16.093 | 91.665–91.696 | 1490 | 306.6 | 0.08852 | 86 | 28.9 |
| Variable | BA | SJ | Tz | |||
|---|---|---|---|---|---|---|
| MIN–MAX | X ± SD | MIN–MAX | X ± SD | MIN–MAX | X ± SD | |
| ZSD (m) | 0.3–1.1 | 0.8 ± 0.3 | 1.8–4.1 | 3.2 ± 0.9 | 5.0–10.0 | 7.3 ± 1.3 |
| ZEU (m) | 1.6–4.8 | 2.7 ± 1.0 | 6.7–25.2 | 13.7 ± 7.2 | 21.1–28.5 | 25.3 ± 2.7 |
| T (°C) | 17.3–26.4 | 18.9 ± 1.8 | 17.2–24.9 | 20.9 ± 2.2 | 17.5–23.8 | 20.0 ± 1.9 |
| DO (mg L−1) | 0–14.7 | 1.3 ± 2.5 | 0–8.5 | 5.1 ± 2.8 | 0–8.6 | 5.7 ± 2.8 |
| pH | 6.8–9.3 | 7.7 ± 0.6 | 7.0–9.1 | 8.1 ± 0.5 | 7.0–9.3 | 8.2 ± 0.5 |
| K25 (µS cm−1) | 356.1–649.9 | 489.4 ± 59.3 | 286.6–511.3 | 337.7 ± 37.5 | 220.8–412.2 | 248.5 ± 19.9 |
| TP (µmol L−1) | 0.8–11.3 | 4.8 ± 2.6 | 0.5–2.3 | 1.3 ± 0.5 | 0.1–15.7 | 2.1 ± 3.0 |
| TN (µmol L−1) | 39.8–221.4 | 124.1 ± 49.9 | 23.2–118.3 | 46.1 ± 21.9 | 11.8–285.7 | 63.5 ± 52.8 |
| Chl (µg L−1) | 0.9–86.6 | 23.1 ± 20.7 | 0.2–5.7 | 1.2 ± 1.2 | 0.1–2.3 | 0.5 ± 0.4 |
| TSS (mg L−1) | 0.9–27.5 | 5.9 ± 5.0 | 1.0–11.4 | 5.2 ± 3.2 | 0.1–5.2 | 1.2 ± 0.9 |
| Flux | BA | SJ | Tz | ||||||
|---|---|---|---|---|---|---|---|---|---|
| n | MIN–MAX | MED ± SD | n | MIN–MAX | MED ± SD | n | MIN–MAX | MED ± SD | |
| FTPC (g m−2 d−1) | 11 | 0.28–0.91 | 0.61 ± 0.2 | 9 | 0.28–4.31 | 1.50 ± 1.2 | 11 | 0.11–0.48 | 0.30 ± 0.1 |
| FPOC (g m−2 d−1) | 10 | 0.20–0.71 | 0.47 ± 0.2 | 11 | 0.12–1.82 | 0.23 ± 0.6 | 11 | 0.11–0.43 | 0.22 ± 0.1 |
| FPIC (g m−2 d−1) | 10 | 0.01–0.24 | 0.08 ± 0.1 | 8 | 0.07–2.63 | 1.11 ± 0.8 | 11 | 0.02–0.14 | 0.07 ± 0.1 |
| Flux | BA | SJ | Tz | ||||||
|---|---|---|---|---|---|---|---|---|---|
| n | MIN–MAX | MED ± SD | n | MIN–MAX | MED ± SD | n | MIN–MAX | MED ± SD | |
| FS (g m−2 d−1) | 12 | 3.10–8.79 | 5.61 ± 1.5 | 12 | 4.25–40.8 | 9.10 ± 16.5 | 12 | 1.17–3.31 | 1.81 ± 0.7 |
| FBS (g m−2 d−1) | 12 | 1.27–2.87 | 1.82 ± 0.4 | 12 | 1.21–8.08 | 1.37 ± 2.8 | 12 | 0.35–0.90 | 0.53 ± 0.2 |
| FAB (g m−2 d−1) | 12 | 2.56–6.56 | 3.79 ± 1.4 | 12 | 2.96–35.0 | 7.82 ± 13.8 | 12 | 0.69–2.41 | 1.31 ± 0.5 |
| Flux | Period | BA | SJ | Tz | ||||||
|---|---|---|---|---|---|---|---|---|---|---|
| n | MIN–MAX | MED ± SD | n | MIN–MAX | MED ± SD | n | MIN–MAX | MED ± SD | ||
| 1 | 6 | 0.35–0.96 | 0.65 ± 0.3 | 6 | 0.21–0.30 | 0.26 ± 0.0 | 6 | 0.07–0.11 | 0.09 ± 0.0 | |
| FChl | 2 | 6 | 2.43–3.18 | 2.77 ± 0.3 | 6 | 0.43–0.75 | 0.57 ± 0.1 | 6 | 0.06–0.10 | 0.08 ± 0.0 |
| (mg m−2 d−1) | 3 | 6 | 1.40–1.89 | 1.71 ± 0.2 | 6 | 0.17–0.35 | 0.24 ± 0.1 | 6 | 0.17–0.31 | 0.23 ± 0.1 |
| 1–3 | 18 | 0.35–3.18 | 1.71 ± 0.9 | 18 | 0.17–0.75 | 0.30 ± 0.2 | 18 | 0.06–0.31 | 0.10 ± 0.1 | |
Disclaimer/Publisher’s Note: The statements, opinions and data contained in all publications are solely those of the individual author(s) and contributor(s) and not of MDPI and/or the editor(s). MDPI and/or the editor(s) disclaim responsibility for any injury to people or property resulting from any ideas, methods, instructions or products referred to in the content. |
© 2025 by the authors. Licensee MDPI, Basel, Switzerland. This article is an open access article distributed under the terms and conditions of the Creative Commons Attribution (CC BY) license (https://creativecommons.org/licenses/by/4.0/).
Share and Cite
Rivera-Herrera, M.; Alcocer, J.; Oseguera, L.A.; Vargas-Sánchez, M.; García-Oliva, F.; Sánchez-Carrillo, S. Comparing Particulate Carbon Fluxes in Tropical Karst Lakes with Different Trophic Statuses. Water 2025, 17, 1030. https://doi.org/10.3390/w17071030
Rivera-Herrera M, Alcocer J, Oseguera LA, Vargas-Sánchez M, García-Oliva F, Sánchez-Carrillo S. Comparing Particulate Carbon Fluxes in Tropical Karst Lakes with Different Trophic Statuses. Water. 2025; 17(7):1030. https://doi.org/10.3390/w17071030
Chicago/Turabian StyleRivera-Herrera, Montserrat, Javier Alcocer, Luis A. Oseguera, Mariana Vargas-Sánchez, Felipe García-Oliva, and Salvador Sánchez-Carrillo. 2025. "Comparing Particulate Carbon Fluxes in Tropical Karst Lakes with Different Trophic Statuses" Water 17, no. 7: 1030. https://doi.org/10.3390/w17071030
APA StyleRivera-Herrera, M., Alcocer, J., Oseguera, L. A., Vargas-Sánchez, M., García-Oliva, F., & Sánchez-Carrillo, S. (2025). Comparing Particulate Carbon Fluxes in Tropical Karst Lakes with Different Trophic Statuses. Water, 17(7), 1030. https://doi.org/10.3390/w17071030