Abstract
Soil moisture (SM) plays a crucial role in the hydrological and ecological processes of the Yellow River Basin (YRB), with its spatiotemporal distribution and variability serving as key factors for understanding ecosystem responses to environmental changes. However, previous research has often overlooked the spatiotemporal variation of SM across different soil layers and the complex bidirectional interactions between SM and vegetation, particularly as indicated by the Normalized Difference Vegetation Index (NDVI), within different vegetation zones and soil layers. Widely used in fields such as agriculture and water cycle research, the GLDAS dataset has been applied to analyze the spatiotemporal patterns of SM at four different depths (0–10 cm, 10–40 cm, 40–100 cm, and 100–200 cm) in the YRB from 1948 to 2022, revealing a continuous increase in SM over time, with more pronounced changes after identified breakpoints (1985 for the 10–40 cm layer, and 1986 for the other layers). Granger causality tests show that the bidirectional interaction between NDVI and SM dominates across all soil layers and regions, far surpassing the unidirectional effects of SM on NDVI or vice versa. Regardless of whether SM or NDVI is the primary variable, the Temperate Evergreen Broadleaf Forest (TEBF) region consistently exhibits the strongest lag effects across all layers, followed by the Qinghai-Tibet Plateau Alpine Vegetation (QTPAV) and the Temperate Desert Region (TDR). The Subtropical Warm Temperate Deciduous Forest (SWTDF) and Temperate Grassland Region (TGR) show the weakest lag effects. This research offers new insights into the mutual feedback between vegetation and hydrology in the YRB and provides a scientific basis for more effective water resource management.
1. Introduction
The Yellow River Basin (YRB) is a vital region in China, with a population of over 100 million and a cultivated land area exceeding 1.3 million km2, contributing significantly to China’s agricultural and industrial production [1,2]. The YRB is highly susceptible to climate change and human activities due to its diverse climatic conditions, complex topography, and varying land use types [3]. The ecological environment and water resources of the YRB are facing a severe crisis, and urgent problems such as water scarcity, severe water deficit, and imbalance between supply and demand have become a bottleneck restricting regional water resource security and ecological protection [4,5,6,7]. Therefore, exploring the spatiotemporal dynamics of water resources in the YRB and its driving factors is very important for ensuring water resource security and high-quality development to provide a scientific basis for formulating water resource management policies.
Soil moisture (SM), as a key component of the surface–atmosphere hydrological cycle, is a crucial indicator of regional water resources, influencing hydrological processes such as precipitation distribution, evapotranspiration, runoff, and infiltration [8]. Both observations and gridded products showed a decreasing trend in SM across the YRB, indicating a significant drying trend due to climate warming [9]. However, other studies suggests a significant upward trend in SM from 2003 to 2018 in the YRB [10]. Additionally, spatial heterogeneity in SM is evident, with some regions, such as the middle-upper YRB, experiencing decreasing SM from southeast to northwest, while the upper reaches of the YRB show a more humid trend [11]. Permafrost degradation in the upper reaches has also been linked to increased SM and decreased ground ice content, which impacts the eco-hydrological system [12]. Research shows that 65.7% of the annual average evapotranspiration in the Tibetan Plateau originates from soil evaporation [13]. As SM increases, soil evaporation also rises, thereby affecting the entire eco-hydrological process. The spatial distribution of SM from 2003 to 2018 has been found to follow a pattern of higher values in the east and west and lower values in the middle [10]. Moreover, variability in soil water content, particularly in the deep layers of the Loess Plateau, has also been observed [14]. However, most of these studies focus on the Loess Plateau or the middle and upper reaches of the YRB, whereas limited studies have explored variations in different soil layers. Therefore, a comprehensive understanding of SM variability across the entire YRB, incorporating both temporal and spatial distributions, is still lacking.
SM is influenced by several factors, including precipitation, temperature, vegetation type, and soil depth [15,16,17,18]. Studies have showed that an increase in precipitation has led to a humidification trend in the upper reaches of the YRB from 2000 to 2015 [11]. In contrast, rising temperatures significantly decrease SM in the YRB, with the effect being more pronounced in warmer conditions, especially in non-plain regions [19]. The interaction between vegetation and SM is particularly significant, as vegetation cover directly impacts soil water uptake, evaporation, and infiltration through root systems and canopies [20,21]. Different vegetation types influence SM at various soil depths, with deep-rooted vegetation tending to maintain higher deep soil moisture, while croplands show relatively stable SM dynamics [22,23]. Vegetation also plays a role in enhancing surface SM during the rainy season [24]. With ongoing climate change and the implementation of ecological restoration projects such as afforestation and the Grain for Green Program, the relationship between SM and vegetation greening in China has become increasingly complex and variable over the past 40 years [25,26]. The feedback mechanisms between SM and vegetation dynamics are crucial for understanding hydrological and ecological processes, as well as predicting carbon and water cycles, which influence ecosystem resilience and productivity [27].
Although a bidirectional relationship between vegetation and SM has been observed globally [28], most studies focus on the unidirectional effects of SM on vegetation, especially in the YRB. For instance, low SM and high vapor pressure deficit (VPD) have been identified as limiting factors for vegetation growth [29]. Other studies have found that SM significantly affects vegetation in about 49% of the YRB, primarily in the northern region [30]. Moreover, precipitation, SM, and temperature have been identified as the three main factors influencing NDVI, with their contributions being 37.05%, 26.42%, and 15.72%, respectively [31]. SM predominantly affects natural vegetation in the arid and semi-arid regions of the YRB [32]. To better understand the eco-hydrological process, it is essential to improve our understanding of the mutual feedback relationship between SM and NDVI, considering long-term variations and the coupling in different soil layers.
Therefore, apart from the influence of vegetation rooting depths on soil hydrological processes at different soil layers, this study sets out to investigate the vertical relationships between soil moisture (SM) and vegetation dynamics in the Yellow River Basin. Specifically, our objectives are to (1) analyze the spatiotemporal variations of SM at different soil layers from 1948 to 2022; (2) identify the correlations and mutual feedback mechanisms between NDVI and SM across varying vegetation zones and soil layers in the Yellow River Basin using the Granger causality test; and (3) explore cumulative, rather than short-term, SM changes, emphasizing delayed responses and bidirectional interactions between soil moisture and vegetation growth.
We hypothesize that (1) SM dynamics varied significantly across different soil layers and vegetation types over the Yellow River Basin during 1948–2022; and (2) complex interactions and feedback relationships exist between SM and NDVI, varying according to vegetation distribution and soil layer depths. Furthermore, by focusing on cumulative changes in SM and corresponding delayed responses in vegetation dynamics, our study intentionally disregards short-term fluctuations of soil moisture at hourly or daily scales, thus better capturing ecological and hydrological processes at seasonal or longer temporal scales.
2. Materials and Methods
2.1. Study Area
The Yellow River Basin (YRB) is located in northern China, ranging approximately from 95° E to 120° E and 30° N to 45° N [33]. The YRB is one of China’s most crucial river systems, with diverse geographical and climatic conditions [34]. In the western part of the basin lies the high-altitude Qinghai-Tibet Plateau Alpine Vegetation (QTPAV), with a cold climate and rugged terrain. Moving eastward, the landscape shifts through the Temperate Grassland Region (TGR) and the Temperate Desert Region (TDR), which include arid zones such as the Gobi Desert and the Ordos Desert. These arid regions contribute substantially to the Yellow River’s high sediment load due to their sparse vegetation and easily erodible soils. The climate becomes milder, with the vegetation gradually shifting to the Temperate Evergreen Broadleaf Forest (TEBF) and the Subtropical Warm Temperate Deciduous Forest (SWTDF). The TEBF plays a vital role in the local water cycle by moderating evapotranspiration. In contrast, the SWTDF experiences warmer temperatures and more consistent precipitation, with higher regional biodiversity and ecological productivity [35,36]. The geographic location and vegetation zoning of the YRB are shown in Figure 1.
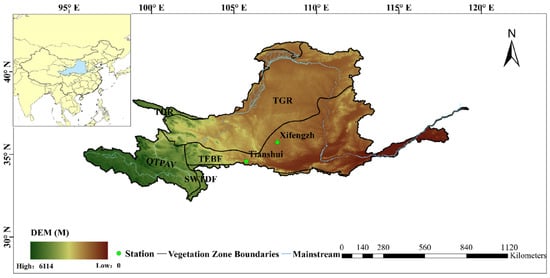
Figure 1.
Mainstream and vegetation zones in the Yellow River Basin. (TEBF—Temperate Evergreen Broadleaf Forest, QTPAV—Qinghai-Tibet Plateau Alpine Vegetation, TDR—Temperate Desert Region, SWTDF—Subtropical Warm Temperate Deciduous Forest, TGR—Temperate Grassland Region).
2.2. Data
The SM data used in this study are derived from the Global Land Data Assimilation System (GLDAS) Noah Land Surface Model Level 4 (L4) because of its long and continuous time series of 1948–2022 and the widely recognized accuracy and reliability [36]. The temporal and spatial resolutions are 3 h and 0.25° × 0.25° respectively, providing sufficient spatial and temporal details for this study. Several studies compared the usability of GLDAS and other grid datasets in China and the Yellow River Basin, and the results showed that GLDAS-2.1 performed well in (semi-) humid and arid areas of China [37,38,39,40]. Additionally, other studies compared soil moisture in GLDAS model simulations and in situ observations over the Tibetan Plateau and Yellow River Basin, and the results showed that all GLDAS models effectively captured the temporal variation of observed soil moisture, with correlation coefficients mostly above 0.5 [38,41,42,43]. These results are consistent with research assessing SM data across China, where GLDAS SM data demonstrate a good correlation with observation data and better describe variations in SM.
In order to demonstrate the applicability of GLDAS in the Yellow River Basin, we selected 2 observational stations (Tianshui and Xifengzh, as shown in Figure 1) from the International Soil Moisture Network within the Yellow River Basin to validate the suitability of GLDAS for this region [44]. Since the in situ station data were only available for soil moisture up to 100 cm, we converted the GLDAS layered data (0–10 cm, 10–40 cm, 40–100 cm) into 0–100 cm soil moisture for comparison with the observational data.
The validation results indicate that GLDAS effectively captures the variability of in situ soil moisture. Specifically, the correlation coefficients at Tianshui and Xifengzh stations are 0.61 and 0.76, respectively, demonstrating a strong consistency. Additionally, we show scatter plots of in situ soil moisture and GLDAS soil moisture data in Figure 2. The results indicate that GLDAS systematically underestimates soil moisture in the Yellow River Basin.
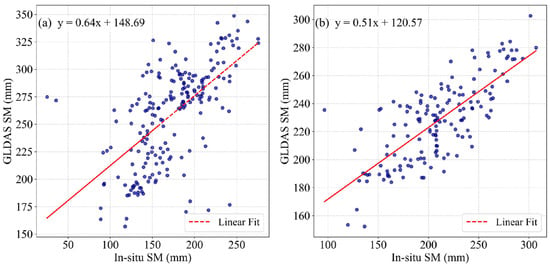
Figure 2.
Scatter plots of soil moisture between GLDAS and observed station data in the Yellow River Basin: (a) Tianshui station; (b) Xifengzh station.
Overall, the validation results confirm that GLDAS can effectively capture the spatiotemporal variations of soil moisture in the Yellow River Basin. We acknowledge that despite these promising results, GLDAS still has certain limitations in accurately capturing absolute soil moisture values. In future research, we will integrate more precise datasets. Through these efforts, we aim to improve the reliability of the result in the future.
Different vegetation types, due to the varying depths of their root systems, exhibit distinct hydrological cycles within the soil water layers. According to the previous studies, the classification into a “deep layer” (40–100 cm), “middle layer” (10–40 cm), and “surface layer” (0–10 cm) serves multiple purposes. It enhances the accuracy of representing soil moisture relative to the actual water accessibility for different types of vegetation [45,46]. For instance, the root systems of meadow vegetation are primarily located between 0.1 and 0.3 m of soil depth in the Qinghai-Tibet Plateau [47]; alpine plants roots depth are at a depth of about 1.5–2 m [48]; and the evergreen broadleaf forest root depth is mostly greater than 2 m [49]. Thus, this research adopts a layering approach to analyze soil moisture data within the GLDAS, addressing the significant variability in root growth and depths across different vegetation types. Apart from the influence of vegetation rooting depths on soil hydrological processes at different soil layers, the vertical distribution of SM directly influences vegetation water availability, and the impacts of SM on vegetation vary significantly across soil layers [50,51,52]. For instance, shallow-layer SM serves as the direct water source for vegetation, typically fluctuating in response to short-term climatic conditions, particularly precipitation and evapotranspiration [53,54]. In contrast, deeper-layer SM is usually less sensitive to climatic variations. For instance, large-scale afforestation activities can alter SM dynamics, especially pronounced in semi-arid and arid regions [55]. Furthermore, combined effects of climate change and human activities can significantly reshape the vertical profile of SM. Climate change, including increased evapotranspiration or altered rainfall patterns, tends to enhance the variability in shallow SM, ultimately altering vegetation community structures [56,57,58]. Therefore, analyzing the vertical differentiation in SM–vegetation relationships can provide valuable insights for ecological restoration in different vegetation regions.
In contrast to SM data, half-monthly Normalized Difference Vegetation Index estimates were used to better capture the long-term evolution of the climate. NDVI is a widely used vegetation index derived from various remote sensing data. NDVI is a valuable tool for assessing vegetation cover, which in turn affects hydrological processes like interception, evapotranspiration, and soil moisture dynamics [59]. High NDVI values suggest denser vegetation with higher ET and interception, while a low NDVI indicates sparse vegetation, lower transpiration, and reduced water retention [60]. This makes NDVI a crucial parameter in hydrological modeling, drought monitoring, and water resource management [61]. NDVI products were produced from optical data of different satellite platforms. The Global Inventory Modeling and Mapping Studies (GIMMS) biweekly NDVI products were used in this study considering their long historical records starting from early 1980. Since the original GIMMS NDVI suffers from the uncertainties caused by orbit drifts and sensor degradation, the reproduced version of the GIMMS NDVI product, called PKU GIMMS NDVI (1982–2022) [62] (https://zenodo.org/records/8253971) (accessed on 19 March 2023), was used. This enhanced product provides higher accuracy and consistency by mitigating the impacts of orbital drift and sensor degradation effect. The three-hour NDVI data were aggregated into half-monthly intervals to facilitate the integration and comparison with the SM data.
2.3. Methods
2.3.1. Mann–Kendall Test
The Mann–Kendall test is a non-parametric statistical method used to assess trends and change points in time series data. This method does not require assumptions about data distribution, being widely used for analyzing trends in meteorological, hydrological, and other time series data.
In this study, the Mann–Kendall test was first used to identify potential trends and change points in SM at different time periods. Since the Mann–Kendall test is well documented in the literature [63], only a brief introduction is made. Given a time series of SM (sm1, sm2, …, smn), the Mann–Kendall statistic (S) is calculated using:
where sgn(x) returns 1, 0, or −1 depending on x > 0, x = 0, or x < 0, respectively. The Z-score representing the significance of the trend observed in the time series SM was then calculated using:
where the variance of S is:
A positive Z value indicates an upward trend, while a negative Z value indicates a downward trend, with the significance being determined by comparing the calculated Z statistic to critical values from the standard normal distribution. In this study, SM across multiple layers was combined into a single dataset.
2.3.2. Empirical Orthogonal Function
In this study, Empirical Orthogonal Function (EOF) analysis was employed to examine the spatial patterns and temporal evolution of SM across the study area [64]. EOF analysis is a robust method for investigating the spatiotemporal dynamics of complex multidimensional datasets [65]. This technique enables the decomposition of soil moisture variability into orthogonal spatial patterns (EOFs) that are consistent over time, and corresponding time series known as principal components (PCs) that are spatially consistent. This method facilitates the reconstruction of the original variability in soil moisture by the product of the spatial EOFs and their temporal PCs. For a comprehensive understanding of EOF analysis applied to soil moisture, refer to detailed studies already provided in other studies [66,67]; here we provide only a summarized explanation.
EOF analysis decomposes the variability of SM into EOFs and PCs, allowing us to identify the primary modes of variability and their temporal evolution. Given a spatial temporal soil moisture matrix X with a size of M (locations) × N (time instances), it can be decomposed as below using the EOF analysis:
X(t) represents the observed SM at time, EOFi are the dominant spatial patterns (EOFs), while ai(t) are the associated time series coefficients (PCs), being the temporal evolution of EOFi; K is the number of dominant EOFs; and is the residual error term. EOF was applied to calculate the soil moisture at four different depths.
2.3.3. Granger Causality
The Granger causality test, introduced by the economist Granger in 1969, was utilized to examine the mutual influences between the monthly variations of SM and NDVI. This approach considers the alterations within the variables to accurately assess their interdependence, effectively circumventing any false correlations. The application of the Granger causality test is prevalent in exploring the interactions among components of natural resources, as demonstrated in previous studies [68,69]. In this study, Granger causality analysis was employed to investigate the causal interactions between SM at different depths and other meteorological factors, as well as the relationship between SM and the NDVI. This analysis allows us to determine whether changes in one variable precede and predict changes in another variable, indicating a causal relationship. The Granger causality test was performed with both NDVI and SM as the primary variables to examine their potential delayed effects. The significance test for NDVI determines if it has a delayed impact on SM, while the significance test for SM shows if it influences NDVI with a time delay. When both variables pass their respective significance tests, it indicates a bidirectional causal relationship, meaning that changes in one variable precede and predict changes in the other. The direction and extent of this delayed effect are determined by the time lag between the two time series, which reflects the temporal dependency and feedback mechanism between NDVI and SM.
The process involves estimating vector autoregressive (VAR) models for the variables. These models capture the temporal dependencies between variables by regressing the current value of each variable on its lagged values and the lagged values of other variables. Mathematically, the VAR model can be represented as:
where Xt and Yt are the time series variables; p and q are the lag orders for the variables X and Y, respectively; is the intercept term; and are the coefficients for the lagged values of variables X and Y, respectively; and is the error term. By examining the coefficients and , we can determine whether past values of one variable significantly contribute to the prediction of the current values of another variable.
Through Granger causality analysis, we aim to elucidate the directional relationships and potential feedback mechanisms between SM and NDVI. This analysis provides insights into the complex interactions within the study system and helps us understand the drivers of SM variability.
3. Results
3.1. Spatiotemporal Variability of SM
The SM trend in the YRB shows an upward trajectory from 1948 to 2022 (Figure 3). Moreover, the SM increases with depth, and the average annual SM is 0.19 m3/m3 for the 0–10 cm layer, 0.21 m3/m3 for the 10–40 cm layer, 0.22 m3/m3 for the 40–100 cm layer, and 0.24 m3/m3 for the 100–200 cm layer. The analysis of M-K breakpoints in the SM time series data revealed significant temporal variations across different soil layers. The SM series for the 10–40 cm layer exhibited a breakpoint in 1985, while the other three soil layers demonstrated breakpoints in 1986. Compared to the changes before the breakpoints, there are particularly sharp upward trends after the breakpoints.
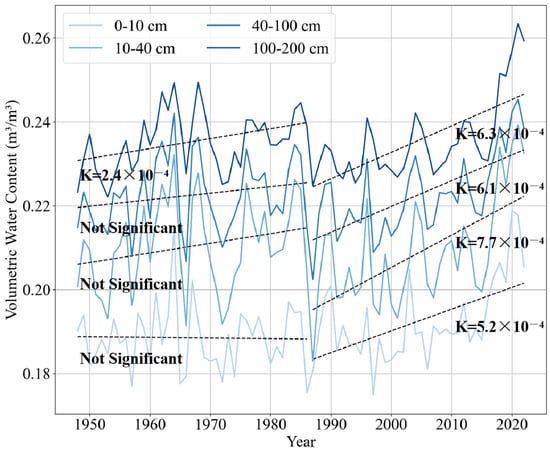
Figure 3.
Time series plot of average soil moisture in the Yellow River Basin with trend lines fitted before and after M-K breakpoint at different soil layers.
Figure 4 illustrates the spatial distribution of SM with similar patterns in four soil layers. In the 0–10 cm layer, SM is relatively lower in the central and northeastern regions of the basin, as indicated by dark green and blue hues, while the southeastern part of the basin exhibits higher moisture levels, represented by light green and yellow. In the 10–40 cm depth, a notable low-moisture area is observed within the Loess Plateau, while the southeastern region shows higher moisture levels. In the 40–100 cm layer, the western part of the basin displays lower SM compared to shallower layers, with moisture increasing gradually from west to east. A significant low-moisture area is also visible in the central Loess Plateau. In the 100–200 cm depth, the distribution pattern is similar to that of the upper layers, but the variation in SM is more pronounced compared to the shallower layers.
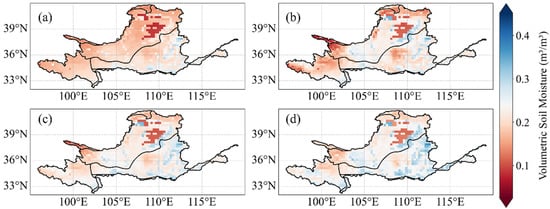
Figure 4.
Multi-year average soil moisture in the Yellow River Basin at (a) 0–10 cm, (b) 10–40 cm, (c) 40–100 cm, and (d) 100–200 cm.
To further explore the impact of climate change on soil moisture and to better understand its influence on the Yellow River Basin, we conducted a correlation analysis between soil moisture and key meteorological variables, including precipitation, temperature, and solar radiation. Figure 5 illustrates the time series plot of soil moisture in relation to these meteorological factors. The results indicate that precipitation exhibits the strongest correlation with soil moisture, reaching 0.77, followed by temperature with a correlation of 0.70. In contrast, the correlation between soil moisture and solar radiation is relatively weak, with a value of only 0.24.
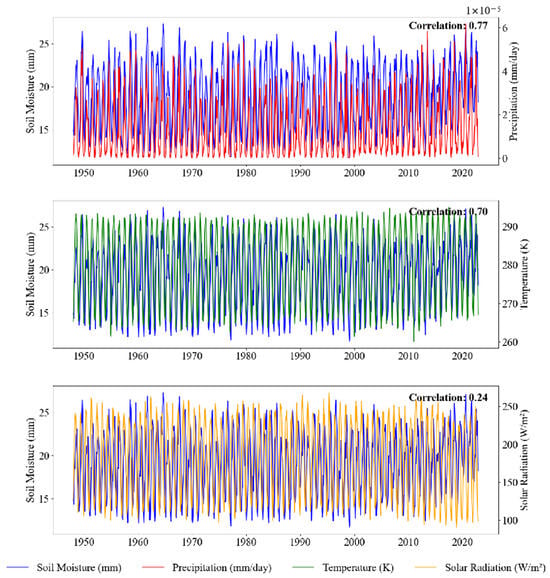
Figure 5.
Time series plot of between meteorological factors and soil moisture cumulative value.
EOF analysis was conducted to explore the spatial (Figure 6) and temporal (Figure 7) evolution patterns of SM in four layers. Although the first mode accounts for the majority of the variation, the subsequent modes provide additional insights into the spatial and temporal dynamics of SM. The variance contribution rates of the three modes at 0–10 cm are 75.08%, 8.93%, and 4.42%, totaling 88.43%. In EOF1, the entire YRB exhibits a generally negative correlation, with PC1 revealing a long-term downward trend, indicating an overall increase in SM over time. The spatial distribution of EOF2 demonstrates a gradual shift from positive to negative correlation from east to west. PC2 also shows a downward trend, suggesting that SM in the eastern region is decreasing, while in the western region it is increasing. EOF3 displays a transition from positive to negative correlation from south to north, with PC3 showing an upward trend. This suggests that, under the influence of EOF3, SM is gradually decreasing in the northern region, while the southern region is getting wetter.
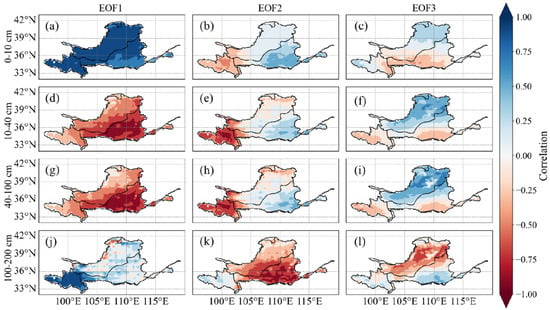
Figure 6.
Analysis of the Empirical Orthogonal Functions for soil moisture in different layers of the Yellow River Basin (p < 0.05) (a) EOF1 0–10 cm (b) EOF2 0–10 cm (c) EOF3 0–10 cm (d) EOF1 10–40 cm (e) EOF2 10–40 cm (f) EOF3 10–40 cm (g) EOF1 40–100 cm (h) EOF2 40–100 cm (i) EOF3 40–100 cm (j) EOF1 100–200 cm (k) EOF2 100–200 cm (l) EOF3 100–200 cm.
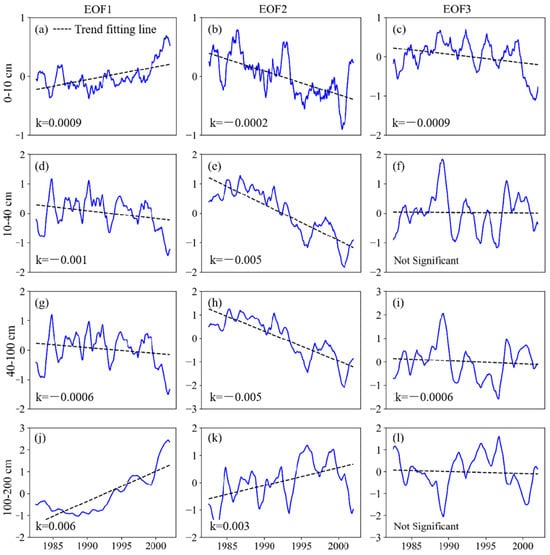
Figure 7.
Analysis of the principal components for soil moisture in different layers of the Yellow River Basin (p < 0.05) (a) EOF1 0–10 cm (b) EOF2 0–10 cm (c) EOF3 0–10 cm (d) EOF1 10–40 cm (e) EOF2 10–40 cm (f) EOF3 10–40 cm (g) EOF1 40–100 cm (h) EOF2 40–100 cm (i) EOF3 40–100 cm (j) EOF1 100–200 cm (k) EOF2 100–200 cm (l) EOF3 100–200 cm.
The results of EOF are similar between 10–40 cm and 40–100 cm; the variance contribution rates of the three modes at 10–40 cm are 43.46%, 17.11%, and 10.50%, totaling 71.07%, while the variance contribution rates of the three modes at 40–100 cm are 43.63%, 18.49%, and 11.08%, totaling 73.20%. EOF1 shows a negative correlation across the YRB, and PC1 reveals an almost zero slope, indicating that, despite seasonal fluctuations, there is no significant long-term increase or decrease in SM at this depth. The spatial distribution of EOF2 shows a marked gradient change from west to east, with the correlation shifting from positive to negative. PC2 shows a declining slope, suggesting a gradual decrease in SM in the eastern region, while the western region becoming wetter over time. EOF3 reveals a shift from positive to negative correlation from north to south, with PC3 displaying a slight negative trend, indicating that SM in the southern region is decreasing, while the northern region is becoming wetter.
The variance contribution rates of the three modes at 100–200 cm are 39.08%, 26.18%, and 9.01%, totaling 74.27%. In EOF1, there is a negative correlation in the southwest YRB, with a mixed trend of weak positive and negative correlations in the northeastern region. PC1 displays a significant downward trend, indicating that SM in the southwestern YRB is gradually increasing over the long term. EOF2 reveals a transition from positive to negative from east to west, and PC2 shows a slight upward trend, suggesting that SM is gradually increasing in the western region and decreasing in the eastern region. EOF3 shows a shift from positive to negative from south to north, with PC3 showing a very slight upward trend. This indicates that, although the change is minimal, SM in the northern region is slightly increasing, while the decrease in the southern region is relatively slow.
The analysis of SM across four soil layers in the YRB highlights significant interactions with various climatic and hydrological factors. We discuss the correlation between SM at different depths and key environmental factors, providing insights into the underlying processes affecting SM variability.
3.2. Relationship Between SM and NDVI
3.2.1. Coupling Trends Between SM and NDVI
To explore the spatial coupling relationship between NDVI and SM in different layers, we conducted spatial coupling of significant trend changes in SM and NDVI across four different soil depths (Figure 8). In most of the soil water layers, the ratio between SWTDF and QTPAV remains stable across the majority of the regions. Specifically, in the SWTDF layer, 88.00% of the points show an increase in SM corresponding with an increase in NDVI, while 12.00% show an increase in SM corresponding with a decrease in NDVI. Similarly, in the QTPAV, 60.00% of the points show an increase in SM corresponding with an increase in NDVI, and 40.00% show an increase in SM corresponding with a decrease in NDVI. In the TDR region, the 0–100 cm soil layer exhibits a similar trend, with 87.50% of the points showing an increase in SM corresponding with an increase in NDVI, while 12.50% show an increase in SM corresponding with a decrease in NDVI. However, in the 100–200 cm soil layer, the proportion of points with a decrease in SM and an increase in NDVI increases significantly to 50%, while the points with an increase in SM and NDVI increase are reduced to 37.50%, and those with a decrease in NDVI and SM decrease make up 6.25%.
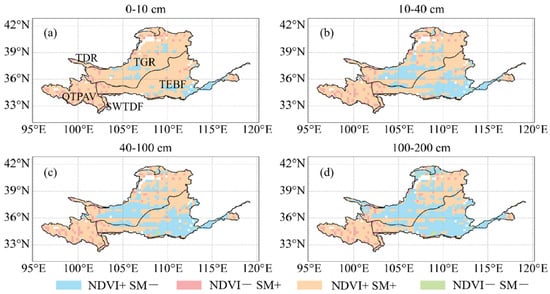
Figure 8.
Coupling trends between Normalized Difference Vegetation Index and soil moisture in the Yellow River Basin at (a) 0–10 cm, (b) 10–40 cm, (c) 40–100 cm, and (d) 100–200 cm (p < 0.05).
In the TEBF and TGR regions, similar trends are observed. As the soil depth increases, the proportion of points showing an increase in SM corresponding with an increase in NDVI decreases, while the proportion showing an increase in SM and a decrease in NDVI increases. For TGR, the percentage of points with an increase in SM and NDVI decreases as follows: 0–10 cm: 74.33%, 10–40 cm: 66.33%, 40–100 cm: 51.00%, 100–200 cm: 38.03%. In contrast, the percentage of points with a decrease in NDVI and SM increases as follows: 0–10 cm: 16.66%, 10–40 cm: 24.07%, 40–100 cm: 40.00%, 100–200 cm: 51.67%. In the TEBF region, the trend is similar, with the proportion of points showing an increase in SM and NDVI decreasing as the depth increases, and the proportion of points showing a decrease in SM and an increase in NDVI increasing. The percentages are as follows: 0–10 cm: 78.20%, 10–40 cm: 64.75%, 40–100 cm: 47.83%, 100–200 cm: 25.10% for SM increase and NDVI increase, and 0–10 cm: 17.67%, 10–40 cm: 29.71%, 40–100 cm: 46.67%, 100–200 cm: 70.00% for NDVI increase and SM decrease.
3.2.2. Granger Causality Test Results
Granger analysis revealed the bidirectional dependency between NDVI and different SM layers over a forty-year period from 1982 to 2022 in the YRB, on the half-month time scale (Figure 9). The Granger causality relationships between SM and NDVI vary among different vegetation cover types and soil depths (Table 1). In the QTPAV region, the highest proportion of bidirectional causality between NDVI and SM is observed at 0–10 cm at 63.33%, indicating a strong bidirectional dependency. However, this bidirectional relationship decreases with increasing soil depth, while at 10–40 cm SM mainly affects NDVI and at 100–200 cm NDVI mainly affects SM. In the SWTDF region, the impact of NDVI on SM at 0–10 cm (58.33%) is significantly greater than the impact of SM on NDVI (0%). In deeper soil layers, the proportion of non-significant relationships increases, particularly at 100–200 cm (70.83%). In the TDR, there is a certain proportion of bidirectional causality at 0–10 cm (33.33%). However, in other soil layers, the proportion of non-significant relationships is higher, especially in the 40–100 cm and 100–200 cm layers, at 69.44% and 61.11%, respectively. In the TEBF region, the proportion of bidirectional causality is relatively high across all soil layers, particularly in the 0–10 cm layer (57.17%). The impact of NDVI on SM is also significant, especially at 100–200 cm (36.09%). In the TGR, the bidirectional causality is generally high across all soil layers, and the impact of NDVI on SM is notable in different layers, particularly in deeper soil layers.
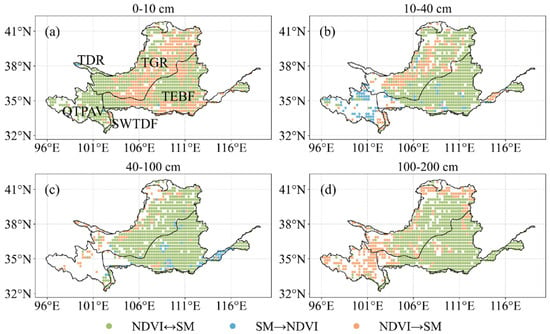
Figure 9.
The geographical patterns of the Granger relationship between soil moisture and Normalized Difference Vegetation Index, soil moisture at a depth of (a) 0–10 cm, (b) 10–40 cm, (c) 40–100 cm, and (d) 100–200 cm (p < 0.05).

Table 1.
Granger causality analysis of Normalized Difference Vegetation Index and soil moisture interactions across different soil layers and regions.
In all soil layers, the lag effect of NDVI on SM is most significant in the TEBF region, showing clear increases in the 0–10 cm, 10–40 cm, and 40–100 cm layers over the next two months, while remaining stable in the 100–200 cm layer (Figure 10). Following TEBF, the QTPAV and TDR regions also show nearly stable proportions in all soil layers over the next two months. The regions with the lowest proportions are TGR and SWTDF, whose lag effects remain stable in the 0–10 cm and 100–200 cm layers over the following two months. Additionally, the lag effects in the 10–40 cm and 40–100 cm layers tend to strengthen over time.
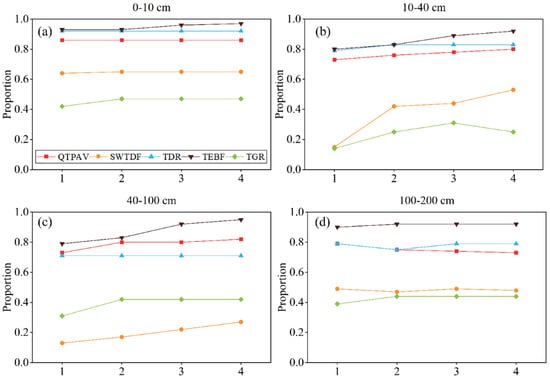
Figure 10.
Proportion of Granger significant points in different vegetation zones with Normalized Difference Vegetation Index as predictor (p < 0.05) (a) 0–10 cm (b) 10–40 cm (c) 40–100 cm (d) 100–200 cm.
When SM serves as the independent variable, TEBF still exhibits the most pronounced lag effects across all soil layers (Figure 11). QTPAV and TDR follow closely, showing very similar proportions throughout the soil layers, just behind TEBF. Notably, in the TDR region, the lag effects begin to diminish in the 10–40 cm layer after the first month, and from 40 to 200 cm, the lag effects start to weaken after just half a month. The weakest lag effects are still observed in SWTDF and TGR. It is noteworthy that in the TGR, there is a significant increase in the proportion of lag effects from 0 to 40 cm, while from 40 to 200 cm the significance of these effects decreases after the first month. In contrast, the SWTDF exhibits strengthening lag effects from 0 to 100 cm, whereas the fluctuations in the 100–200 cm layer are due to the limited number of data points, causing significant impacts on the results from even small changes.
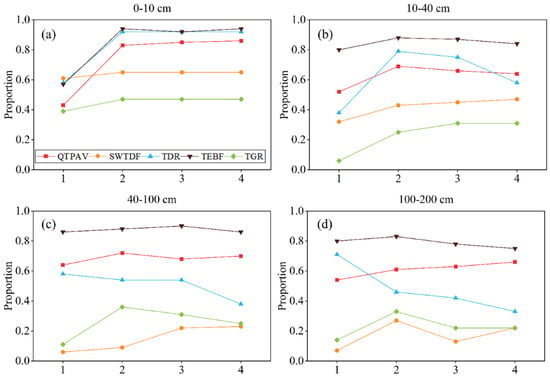
Figure 11.
Proportion of Granger significant points in different vegetation zones with soil moisture as predictor (p < 0.05) (a) 0–10 cm (b) 10–40 cm (c) 40–100 cm (d) 100–200 cm.
4. Discussion
The distribution of SM across different layers in the YRB can be observed from multi-year average data. The distribution patterns are relatively similar across all four soil layers, with lower moisture content in the western regions and higher levels in the southeast. This conclusion is also found in another research about SM distribution [4]. Notably, in the 100–200 cm layer, the variability in moisture content is somewhat greater compared to the upper layers. This distribution pattern, with lower moisture content across the Loess Plateau region, aligns with findings by researchers who analyzed SM data from the ESA CCI and observed a general decrease from southeast to northwest in the middle and upper reaches of the YRB. Similarly, Jia, et al. [70] monitored soil moisture in the 0–5 m depth across a transect in the Loess Plateau, noting a gradual decrease from south to north and an increase in spatial variability with depth.
EOF1 revealed that under PC1, the SM content across all four layers in the YRB exhibited an increasing trend. This reflects the general trend within the basin and confirms the results from the Mann–Kendall test. Under PC2 and EOF2, an east–west trend in SM changes was displayed, showing increases in the west and decreases in the east for all four layers; this conclusion aligns with [71]. PC3 and EOF3 presented a north–south trend in changes, notably with the 0–10 cm and 10–40 cm layers showing decreased SM in the north and increased SM in the south, while the 40–100 cm and 100–200 cm layers showed the opposite trend, with increases in the north and decreases in the south. SM is widely recognized as a fundamental determinant of ecosystem structure and dynamics [72,73,74]. Developing strategies to adapt to soil moisture changes is crucial for different vegetation zones, particularly for the balance of the eco-hydrological system. So, it is important to discuss the lag effects between SM and NDVI. Plant growth and development relies on adequate water supply, and soil moisture directly affects the plant’s ability to acquire water [75]. Plants absorb water from the soil through their roots, which is necessary for photosynthesis and growth [76]. The type and depth of roots vary between plants, determining their response capacity to soil moisture changes [77]. Research suggests that differences in root system structure directly affect soil moisture, with dense fine roots of spruce increasing soil porosity, enhancing water storage capacity and improving soil moisture infiltration [78]. This may partly explain why TEBF and SWTDF, both dominated by deep-rooted plants, have high significance in both NDVI-SM and SM-NDVI predictive capabilities. Additionally, soil moisture changes directly affect plant evapotranspiration [79]. In the TDR region, where soil moisture is relatively low, evapotranspiration is suppressed when soil moisture is insufficient, which affects photosynthesis and growth. Forest vegetation usually has deep and broad roots, enabling it to effectively absorb water from the deeper soil layers [80]. In the TGR and QPTAV regions, grassland or meadow plants have relatively shallow roots, making them more vulnerable to water scarcity.
Although the GLDAS dataset provides a crucial foundation for analyzing SM dynamics in the Yellow River Basin, it exhibits several critical limitations in regional applications. For example, soil parameterization uncertainty arises because GLDAS employs generalized soil texture classifications derived mainly from global-scale datasets, which do not accurately represent specific local soil characteristics, such as the widespread hard soil crusts (e.g., calcic or gypsic horizons) in the Yellow River Basin, potentially leading to inaccuracies in local-scale SM estimations. Additionally, the spatial resolution of GLDAS (0.25° × 0.25°) is insufficient for adequately capturing SM heterogeneity within small catchments or fragmented landscapes. Consequently, small-scale variations driven by local topography (e.g., valleys and slopes) or distinct land-use patterns are likely underestimated or overlooked altogether.
Moving forward, we plan to adopt more refined, high-resolution datasets to further explore the relationships between SM and vegetation dynamics in the Yellow River Basin. Additionally, we aim to conduct comprehensive multi-scale analyses to investigate cascading feedback mechanisms at daily, monthly, and annual timescales, explicitly considering geological influences such as carbonatic or gypsic crusts, which may significantly modulate the bidirectional and delayed interactions between SM and vegetation. Furthermore, future work will involve developing water resource carrying capacity models based on vertically stratified SM–vegetation relationships. Such models will provide crucial guidance for ecological restoration in arid regions, including strategies for optimizing the planting depth of deep-rooted vegetation to enhance water-use efficiency and long-term ecosystem sustainability.
5. Conclusions
This study used the Mann–Kendall test and EOF to analyze the spatiotemporal variability of SM in the YRB. The results show that SM across different layers has similar spatial distribution patterns, but as the depth increases, SM tends to be higher. After the break points (1985 for the 10–40 cm layer and 1986 for 0–10 cm, 40–100 cm, and 100–200 cm layers), the upward trend in SM across all layers was more pronounced than before the change points. In general, most of the variance at all depths reveals a long-term increasing trend in SM across the basin, especially at 0–10 cm. The analysis based on Granger testing in this study reveals that there exists a complex and significant relationship between NDVI and SM under different soil depths and vegetation zones. The bidirectional causality shows that in the QTPAV, strong bidirectional causality is observed, indicating a robust and consistent relationship between NDVI and SM. As soil depth increases, the influence of SM on NDVI becomes more dominant. In the SWTDF region, at 0–10 cm, NDVI has a dominant influence on SM. As the depth increases, the relationships become less significant; in the TDR, the 0–10 cm layer shows moderate bidirectional causality, but deeper layers exhibit weaker relationships. In the TEBF and TGR, the bidirectional causality is relatively high across all soil layers, with NDVI having a notable influence on SM, particularly in the 100–200 cm layer. Whether SM or NDVI is the primary variable, the TEBF region consistently shows the most significant lag effects across all soil moisture layers, followed by QTPAV and TDR. The regions with the weakest lag effects are SWTDF and TGR. These results can provide a scientific basis for ensuring water resource security and high-quality development.
Author Contributions
Methodology, J.X.; Software, J.X.; Validation, J.X.; Formal analysis, J.X.; Investigation, J.X.; Writing—review & editing, F.J.; Supervision, S.Y. and L.R.; Project administration, J.J., S.Y., L.R., F.J., S.J., Y.L. and X.Y.; Funding acquisition, J.J., S.Y., L.R., F.J., S.J., Y.L. and X.Y. All authors have read and agreed to the published version of the manuscript.
Funding
This research was funded by the National Natural Science Foundation of China (U2243203, 92409018), and the Natural Science Foundation of Jiangsu Province (BK20230975).
Data Availability Statement
The original contributions presented in this study are included in the article. Further inquiries can be directed to the corresponding author.
Conflicts of Interest
The authors declare no conflict of interest.
Abbreviations
To help readers have a better understanding of our work, the following table presents the abbreviations used in the text and their corresponding full forms.
| Abbreviation | Full Form |
| YRB | Yellow River Basin |
| SM | Soil Moisture |
| NDVI | Normalized Difference Vegetation Index |
| TEBF | Temperate Evergreen Broadleaf Forest |
| QTPAV | Qinghai-Tibet Plateau Alpine Vegetation |
| TDR | Temperate Desert Region |
| SWTDF | Subtropical Warm Temperate Deciduous Forest |
| TGR | Temperate Grassland Region |
| M-K | Mann–Kendall |
| EOF | Empirical Orthogonal Function |
| GLDAS | Global Land Data Assimilation System |
| GIMMS | Global Inventory Modeling and Mapping Studies |
References
- Zhao, Q.; Tian, G.; Jing, X.; Hu, H. Impact of economic development and environmental regulations on greywater footprint loads in the Yellow River Basin in China. Ecol. Indic. 2023, 154, 110586. [Google Scholar] [CrossRef]
- Zhu, M.; Zhang, X.; Elahi, E.; Fan, B.; Khalid, Z. Assessing ecological product values in the Yellow River Basin: Factors, trends, and strategies for sustainable development. Ecol. Indic. 2024, 160, 111708. [Google Scholar] [CrossRef]
- Lan, H.; Peng, J.; Zhu, Y.; Li, L.; Pan, B.; Huang, Q.; Li, J.; Zhang, Q. Research on geological and surfacial processes and major disaster effects in the Yellow River Basin. Sci. China Earth Sci. 2022, 65, 234–256. [Google Scholar] [CrossRef]
- Zhang, K.; Zhang, Q.; Wang, G.; Gu, X.; Zhao, J.; Feng, A. Spatiotemporal interactions between soil moisture and water availability across the Yellow River Basin, China. J. Hydrol. Reg. Stud. 2024, 54, 101874. [Google Scholar] [CrossRef]
- Chen, Y.; Zhu, M.; Lu, J.; Zhou, Q.; Ma, W. Evaluation of ecological city and analysis of obstacle factors under the background of high-quality development: Taking cities in the Yellow River Basin as examples. Ecol. Indic. 2020, 118, 106771. [Google Scholar] [CrossRef]
- Du, L.; Dong, C.; Kang, X.; Qian, X.; Gu, L. Spatiotemporal evolution of land cover changes and landscape ecological risk assessment in the Yellow River Basin, 2015–2020. J. Environ. Manag. 2023, 332, 117149. [Google Scholar] [CrossRef]
- Di, D.Y.; Wu, Z.N.; Guo, X.; Lv, C.M.; Wang, H.L. Value Stream Analysis and Emergy Evaluation of the Water Resource Eco-Economic System in the Yellow River Basin. Water 2019, 11, 710. [Google Scholar] [CrossRef]
- Lal, P.; Shekhar, A.; Gharun, M.; Das, N.N. Spatiotemporal evolution of global long-term patterns of soil moisture. Sci. Total Environ. 2023, 867, 161470. [Google Scholar] [CrossRef]
- Lou, D.; Wang, G.; Shan, C.; Hagan, D.F.T.; Ullah, W.; Shi, D. Changes of soil moisture from multiple sources during 1988–2010 in the Yellow River Basin, China. Adv. Meteorol. 2018, 2018, 1950529. [Google Scholar] [CrossRef]
- Hu, L.; Xie, Y.; Liu, Y. Mapping the primary factors driving spatiotemporal variations of surface soil moisture from multi-dimensional zonality in the Yellow River Basin of China. Sci. Rep. 2024, V1. [Google Scholar] [CrossRef]
- Guo, L.; Zhu, B.W.; Jin, H.; Zhang, Y.L.; Min, Y.X.; He, Y.C.; Shi, H.Y. Spatial-Temporal Variation Characteristics and Influencing Factors of Soil Moisture in the Yellow River Basin Using ESA CCI SM Products. Atmosphere 2022, 13, 962. [Google Scholar] [CrossRef]
- Song, L.; Wang, L.; Luo, D.; Chen, D.; Zhou, J. Assessing hydrothermal changes in the upper Yellow River Basin amidst permafrost degradation. Npj Clim. Atmos. Sci. 2024, 7, 57. [Google Scholar] [CrossRef]
- Wang, W.; Li, J.; Yu, Z.; Ding, Y.; Xing, W.; Lu, W. Satellite retrieval of actual evapotranspiration in the Tibetan Plateau: Components partitioning, multidecadal trends and dominated factors identifying. J. Hydrol. 2018, 559, 471–485. [Google Scholar] [CrossRef]
- Cao, R.X.; Jia, X.X.; Huang, L.M.; Zhu, Y.J.; Wu, L.H.; Shao, M.A. Deep soil water storage varies with vegetation type and rainfall amount in the Loess Plateau of China. Sci. Rep. 2018, 8, 12346. [Google Scholar] [CrossRef]
- Ren, Z.; Tian, Z.; Wei, H.; Liu, Y.; Yu, Y. Spatiotemporal evolution and driving mechanisms of vegetation in the Yellow River Basin, China during 2000–2020. Ecol. Indic. 2022, 138, 108832. [Google Scholar] [CrossRef]
- Omer, A.; Zhuguo, M.; Zheng, Z.; Saleem, F. Natural and anthropogenic influences on the recent droughts in Yellow River Basin, China. Sci. Total Environ. 2020, 704, 135428. [Google Scholar] [CrossRef]
- Xie, M.; Ren, Z.; Li, Z.; Zhang, X.; Ma, X.; Li, P.; Shen, Z. Evolution of the precipitation–stream runoff relationship in different precipitation scenarios in the Yellow River Basin. Urban Clim. 2023, 51, 101609. [Google Scholar] [CrossRef]
- Almendra-Martin, L.; Martinez-Fernandez, J.; Piles, M.; Gonzalez-Zamora, A.; Benito-Verdugo, P.; Gaona, J. Influence of atmospheric patterns on soil moisture dynamics in Europe. Sci. Total Environ. 2022, 846, 157537. [Google Scholar] [CrossRef]
- Fan, K.K.; Slater, L.; Zhang, Q.; Sheffield, J.; Gentine, P.; Sun, S.; Wu, W.H. Climate warming accelerates surface soil moisture drying in the Yellow River Basin, China. J. Hydrol. 2022, 615, 128735. [Google Scholar] [CrossRef]
- Miguez-Macho, G.; Fan, Y. Spatiotemporal origin of soil water taken up by vegetation. Nature 2021, 598, 624–628. [Google Scholar] [CrossRef]
- Wei, X.; Li, Q.; Zhang, M.; Giles-Hansen, K.; Liu, W.; Fan, H.; Wang, Y.; Zhou, G.; Piao, S.; Liu, S. Vegetation cover-another dominant factor in determining global water resources in forested regions. Glob. Change Biol. 2018, 24, 786–795. [Google Scholar] [CrossRef] [PubMed]
- Zhao, Y.; Shi, H. Temporal and Spatial Variation Characteristics of Soil Moisture in Spring in the Arid Regions of Northwest China in the Past 60s years. J. Geosci. Environ. Prot. 2022, 10, 273–282. [Google Scholar] [CrossRef]
- Zhang, Y.; Yang, P.; Liu, J.; Zhang, X.; Zhao, Y.; Zhang, Q.; Li, L. Sustainable agricultural water management in the Yellow River Basin, China. Agric. Water Manag. 2023, 288, 108473. [Google Scholar] [CrossRef]
- Chen, W.; Jin, M.; Ferré, T.P.A.; Liu, Y.; Xian, Y.; Shan, T.; Ping, X. Spatial distribution of soil moisture, soil salinity, and root density beneath a cotton field under mulched drip irrigation with brackish and fresh water. Field Crops Res. 2018, 215, 207–221. [Google Scholar] [CrossRef]
- Wang, H.; Zhang, Q.-w.; Wang, J. Spatial variation in soil water on a hillslope with ephemeral gullies restored by different vegetation restoration modes on the Loess Plateau. Catena 2023, 224, 107001. [Google Scholar] [CrossRef]
- Xue, Y.; Bai, X.; Zhao, C.; Tan, Q.; Li, Y.; Luo, G.; Wu, L.; Chen, F.; Li, C.; Ran, C.; et al. Spring photosynthetic phenology of Chinese vegetation in response to climate change and its impact on net primary productivity. Agric. For. Meteorol. 2023, 342, 109734. [Google Scholar] [CrossRef]
- Trugman, A.T.; Medvigy, D.; Mankin, J.S.; Anderegg, W.R.L. Soil Moisture Stress as a Major Driver of Carbon Cycle Uncertainty. Geophys. Res. Lett. 2018, 45, 6495–6503. [Google Scholar] [CrossRef]
- Liu, F.; Liu, H.; Adalibieke, W.; Peng, Z.; Liang, B.; Feng, S.; Shi, L.; Zhu, X. Decline in stability of forest productivity in the tropics as determined by canopy water content. Iscience 2023, 26, 107211. [Google Scholar] [CrossRef]
- Lu, J.; Qin, T.; Yan, D.; Lv, X.; Yuan, Z.; Wen, J.; Xu, S.; Yang, Y.; Feng, J.; Li, W. Response of Vegetation to Drought in the Source Region of the Yangtze and Yellow Rivers Based on Causal Analysis. Remote Sens. 2024, 16, 630. [Google Scholar] [CrossRef]
- Jiang, W.; Niu, Z.; Wang, L.; Yao, R.; Gui, X.; Xiang, F.; Ji, Y. Impacts of Drought and Climatic Factors on Vegetation Dynamics in the Yellow River Basin and Yangtze River Basin, China. Remote Sens. 2022, 14, 930. [Google Scholar] [CrossRef]
- Huang, C.; Yang, Q.; Huang, W. Analysis of the Spatial and Temporal Changes of NDVI and Its Driving Factors in the Wei and Jing River Basins. Int. J. Environ. Res. Public Health 2021, 18, 11863. [Google Scholar] [CrossRef] [PubMed]
- Jin, X.H.; Fan, Y.M.; Hu, Y.W.; Duan, H.; Yan, L.; Liu, C. Differences in the Effects of Three Water Elements on Vegetation in Different Climatic Regions: Insights from the Yellow River Basin, China. Ecohydrology 2024, 18, e2733. [Google Scholar] [CrossRef]
- Ding, Y.; Zhang, L.; He, Y.; Cao, S.; Wei, X.; Guo, Y.; Ran, L.; Filonchyk, M. Spatiotemporal evolution of agricultural drought and its attribution under different climate zones and vegetation types in the Yellow River Basin of China. Sci. Total Environ. 2024, 914, 169687. [Google Scholar] [CrossRef] [PubMed]
- Gao, Y.; Fu, S.; Cui, H.; Cao, Q.; Wang, Z.; Zhang, Z.; Wu, Q.; Qiao, J. Identifying the spatio-temporal pattern of drought characteristics and its constraint factors in the Yellow River Basin. Ecol. Indic. 2023, 154, 110753. [Google Scholar] [CrossRef]
- Yang, F.; He, F.; Wang, Y.; Zhou, S.; Dong, G. Reconstructing forest cover changes for the middle and lower reaches of the Yellow River over the past millennium. Reg. Environ. Chang. 2024, 24, 18. [Google Scholar] [CrossRef]
- Fatolazadeh, F.; Eshagh, M.; Goïta, K. A new approach for generating optimal GLDAS hydrological products and uncertainties. Sci. Total Environ. 2020, 730, 138932. [Google Scholar] [CrossRef]
- Wu, Z.; Feng, H.; He, H.; Zhou, J.; Zhang, Y. Evaluation of Soil Moisture Climatology and Anomaly Components Derived from ERA5-Land and GLDAS-2.1 in China. Water Resour. Manag. 2021, 35, 629–643. [Google Scholar] [CrossRef]
- Bi, H.; Ma, J.; Zheng, W.; Zeng, J. Comparison of soil moisture in GLDAS model simulations and in situ observations over the Tibetan Plateau. J. Geophys. Res. Atmos. 2016, 121, 2658–2678. [Google Scholar] [CrossRef]
- Liu, Y.; Yang, Z.; Lin, P.; Zheng, Z.; Xie, S. Comparison and evaluation of multiple land surface products for the water budget in the Yellow River Basin. J. Hydrol. 2020, 584, 124534. [Google Scholar] [CrossRef]
- Liu, Y.; Liu, Y.; Wang, W. Inter-comparison of satellite-retrieved and Global Land Data Assimilation System-simulated soil moisture datasets for global drought analysis. Remote Sens. Environ. 2019, 220, 1–18. [Google Scholar] [CrossRef]
- Zuo, J.; Xu, J.; Li, W.; Yang, D. Understanding shallow soil moisture variation in the data-scarce area and its relationship with climate change by GLDAS data. PLoS ONE 2019, 14, e0217020. [Google Scholar] [CrossRef] [PubMed]
- Niu, B.; Li, Y.; Li Liu, D.; Xie, L.; Wang, L.; Jiang, X.; Feng, H.; Yu, Q.; He, J.; Lin, H. Improved identification and monitoring of meteorological, agricultural, and hydrological droughts using the modified nonstationary drought indices in the Yellow River Basin of China. J. Hydrol. 2024, 643, 131788. [Google Scholar] [CrossRef]
- Lv, M.; Ma, Z.; Lv, M. Effects of climate/land surface changes on streamflow with consideration of precipitation intensity and catchment characteristics in the Yellow River Basin. J. Geophys. Res. Atmos. 2018, 123, 1942–1958. [Google Scholar] [CrossRef]
- Dorigo, W.; Himmelbauer, I.; Aberer, D.; Schremmer, L.; Petrakovic, I.; Zappa, L.; Preimesberger, W.; Xaver, A.; Annor, F.; Ardö, J. The International Soil Moisture Network: Serving Earth system science for over a decade. Hydrol. Earth Syst. Sci. Discuss. 2021, 2021, 5749–5804. [Google Scholar] [CrossRef]
- Xue, S.; Wu, G. Causal inference of root zone soil moisture performance in drought. Agric. Water Manag. 2024, 305, 109123. [Google Scholar] [CrossRef]
- Hernandez, J.O. Ecophysiological Effects of Groundwater Drawdown on Phreatophytes: Research Trends During the Last Three Decades. Land 2022, 11, 2061. [Google Scholar] [CrossRef]
- Guo, Y.; Zhang, Z.; Dai, F. A model for root water uptake of alpine meadow on the Qinghai-Tibet Plateau considering soil temperature. Rhizosphere 2024, 31, 100943. [Google Scholar] [CrossRef]
- Gonzalez-Ollauri, A.; Hudek, C.; Mickovski, S.B.; Viglietti, D.; Ceretto, N.; Freppaz, M. Describing the vertical root distribution of alpine plants with simple climate, soil, and plant attributes. CATENA 2021, 203, 105305. [Google Scholar] [CrossRef]
- Yang, Y.; Donohue, R.J.; Mcvicar, T.R. Global estimation of effective plant rooting depth: Implications for hydrological modeling. Water Resour. Res. 2016, 52, 8260–8276. [Google Scholar] [CrossRef]
- Baudena, M.; von Hardenberg, J.; Provenzale, A. Vegetation patterns and soil–atmosphere water fluxes in drylands. Adv. Water Resour. 2013, 53, 131–138. [Google Scholar] [CrossRef]
- Zheng, H.; Gao, J.; Teng, Y.; Feng, C.; Tian, M. Temporal variations in soil moisture for three typical vegetation types in Inner Mongolia, Northern China. PLoS ONE 2015, 10, e0118964. [Google Scholar] [CrossRef] [PubMed]
- Shen, M.-S.; Zhang, J.-J.; Zhang, S.-H.; Zhang, H.-B.; Sun, R.-X.; Zhang, Y.-Z. Seasonal variations in the influence of vegetation cover on soil water on the loess hillslope. J. Mt. Sci. 2020, 17, 2148–2160. [Google Scholar] [CrossRef]
- Mei, X.-M.; Ma, L.; Zhu, Q.-K.; Wang, S.; Zhang, D.; Wang, Y. Responses of soil moisture to vegetation restoration type and slope length on the loess hillslope. J. Mt. Sci. 2018, 15, 548–562. [Google Scholar] [CrossRef]
- Gou, Q.; Zhu, Q. Response of deep soil moisture to different vegetation types in the Loess Plateau of northern Shannxi, China. Sci. Rep. 2021, 11, 15098. [Google Scholar] [CrossRef]
- Liang, H.; Xue, Y.; Shi, J.; Li, Z.; Liu, G.; Fu, B. Soil moisture dynamics under Caragana korshinskii shrubs of different ages in Wuzhai County on the Loess Plateau, China. Earth Environ. Sci. Trans. R. Soc. Edinb. 2018, 109, 387–396. [Google Scholar] [CrossRef]
- Ruichen, M.; Jinxi, S.; Bin, T.; Wenjin, X.; Feihe, K.; Haotian, S.; Yuxin, L. Vegetation variation regulates soil moisture sensitivity to climate change on the Loess Plateau. J. Hydrol. 2023, 617, 128763. [Google Scholar] [CrossRef]
- Fathi-Taperasht, A.; Shafizadeh-Moghadam, H.; Minaei, M.; Xu, T. Influence of drought duration and severity on drought recovery period for different land cover types: Evaluation using MODIS-based indices. Ecol. Indic. 2022, 141, 109146. [Google Scholar] [CrossRef]
- Liu, Y.; Yang, Y.; Song, J. Variations in global soil moisture during the past decades: Climate or human causes? Water Resour. Res. 2023, 59, e2023WR034915. [Google Scholar]
- Pettorelli, N.; Vik, J.O.; Mysterud, A.; Gaillard, J.M.; Tucker, C.J.; Stenseth, N.C. Using the satellite-derived NDVI to assess ecological responses to environmental change. Trends Ecol. Evol. 2005, 20, 503–510. [Google Scholar] [CrossRef]
- Wu, S.; Zhang, Y.; Kang, W. Employing NDVI as vegetation correction variable to improve soil moisture measurements of mobile cosmic-ray neutron sensor near the Qilian Mountains. Geoderma 2024, 441, 116764. [Google Scholar] [CrossRef]
- Kimaro, O.D.; Gebre, S.L.; Hieronimo, P.; Kihupi, N.; Feger, K.-H.; Kimaro, D.N. Handheld NDVI sensor-based rice productivity assessment under combinations of fertilizer soil amendment and irrigation water management in lower Moshi irrigation scheme, North Tanzania. Environ. Earth Sci. 2023, 82, 78. [Google Scholar] [CrossRef]
- Li, M.Y.; Cao, S.; Zhu, Z.C.; Wang, Z.; Myneni, R.B.; Piao, S.L. Spatiotemporally consistent global dataset of the GIMMS Normalized Difference Vegetation Index (PKU GIMMS NDVI) from 1982 to 2022. Earth Syst. Sci. Data 2023, 15, 4181–4203. [Google Scholar] [CrossRef]
- Sharma, S.; Swayne, D.A.; Obimbo, C. Trend analysis and change point techniques: A survey. Energy Ecol. Environ. 2016, 1, 123–130. [Google Scholar] [CrossRef]
- Hao Quang, N.; Huu Loc, H.; Park, E. Characterizing sediment load variability in the red river system using empirical orthogonal function analysis: Implications for water resources management in data poor regions. J. Hydrol. 2023, 624, 129891. [Google Scholar] [CrossRef]
- Zhao, Y.; Li, F.; Yao, R.; Jiao, W.; Hill, R.L. An Empirical Orthogonal Function-Based Approach for Spatially- and Temporally-Extensive Soil Moisture Data Combination. Water 2020, 12, 2919. [Google Scholar] [CrossRef]
- Wang, T.; Franz, T.E.; Li, R.; You, J.; Shulski, M.D.; Ray, C. Evaluating climate and soil effects on regional soil moisture spatial variability using EOF s. Water Resour. Res. 2017, 53, 4022–4035. [Google Scholar] [CrossRef]
- Perry, M.A.; Niemann, J.D. Analysis and estimation of soil moisture at the catchment scale using EOFs. J. Hydrol. 2007, 334, 388–404. [Google Scholar] [CrossRef]
- Green, J.K.; Konings, A.G.; Alemohammad, S.H.; Berry, J.; Entekhabi, D.; Kolassa, J.; Lee, J.-E.; Gentine, P. Regionally strong feedbacks between the atmosphere and terrestrial biosphere. Nat. Geosci. 2017, 10, 410–414. [Google Scholar] [CrossRef]
- Yang, Z.; Gong, J.; Wang, S.; Jin, T.; Wang, Y. Shifts bidirectional dependency between vegetation greening and soil moisture over the past four decades in China. Sci. Total Environ. 2023, 897, 166388. [Google Scholar] [CrossRef]
- Jia, X.; Ming’an, S.; Chencheng, Z.; Chunlei, Z. Variation and simulation of soil water content within different soil depths along the south-north transect of the Loess Plateau. Adv. Water Sci. 2016, 27, 520–528. [Google Scholar] [CrossRef]
- Tong, R.; Yang, X.; Ren, L.; Shen, H.; Shan, H.; Kong, H.; Lin, C. Spatio-temporal variation of surface soil moisture over the Yellow River basin during 1961–2012. Proc. Int. Assoc. Hydrol. Sci. 2015, 368, 391–396. [Google Scholar] [CrossRef][Green Version]
- Liu, L.; Gudmundsson, L.; Hauser, M.; Qin, D.; Li, S.; Seneviratne, S.I. Soil moisture dominates dryness stress on ecosystem production globally. Nat. Commun. 2020, 11, 4892. [Google Scholar] [CrossRef] [PubMed]
- Daly, E.; Porporato, A. A Review of Soil Moisture Dynamics: From Rainfall Infiltration to Ecosystem Response. Environ. Eng. Sci. 2005, 22, 9–24. [Google Scholar] [CrossRef]
- Tinley, K.L. The Influence of Soil Moisture Balance on Ecosystem Patterns in Southern Africa. In Ecology of Tropical Savannas; Springer: Berlin/Heidelberg, Germany, 1982; pp. 175–192. [Google Scholar]
- Kulmatiski, A. Water matching: An explanation for plant growth and coexistence in water-limited systems. Discov. Soil 2024, 1, 2. [Google Scholar] [CrossRef]
- Sharma, P.K.; Kumar, S. Soil Water and Plant Growth. In Soil Physical Environment and Plant Growth: Evaluation and Management; Springer International Publishing: Cham, Switzerland, 2023; pp. 33–71. [Google Scholar]
- Bachofen, C.; Tumber-Dávila, S.J.; Mackay, D.S.; Mcdowell, N.G.; Carminati, A.; Klein, T.; Stocker, B.D.; Mencuccini, M.; Grossiord, C. Tree water uptake patterns across the globe. New Phytol. 2024, 242, 1891–1910. [Google Scholar] [CrossRef]
- Zhang, H.; Zhao, T.; Ji, R.; Chang, S.; Gao, Q.; Zhang, G. The Decreased Availability of Soil Moisture and Canopy Conductance Dominate Evapotranspiration in a Rain-Fed Maize Ecosystem in Northeastern China. Agronomy 2023, 13, 2941. [Google Scholar] [CrossRef]
- Shi, P.; Hou, P.; Gao, J.; Wan, H.; Wang, Y.; Sun, C. Spatial-temporal variation characteristics and influencing factors of vegetation in the Yellow River Basin from 2000 to 2019. Atmosphere 2021, 12, 1576. [Google Scholar] [CrossRef]
- Kemppinen, J.; Niittynen, P.; Rissanen, T.; Tyystjaervi, V.; Aalto, J.; Luoto, M. Soil Moisture Variations From Boreal Forests to the Tundra. Water Resour. Res. 2023, 59, e2022WR032719. [Google Scholar] [CrossRef]
Disclaimer/Publisher’s Note: The statements, opinions and data contained in all publications are solely those of the individual author(s) and contributor(s) and not of MDPI and/or the editor(s). MDPI and/or the editor(s) disclaim responsibility for any injury to people or property resulting from any ideas, methods, instructions or products referred to in the content. |
© 2025 by the authors. Licensee MDPI, Basel, Switzerland. This article is an open access article distributed under the terms and conditions of the Creative Commons Attribution (CC BY) license (https://creativecommons.org/licenses/by/4.0/).