1. Introduction
Groundwater pollution has evolved into a global water environment problem [
1]. Fluoride, nitrate, iron, manganese, antibiotics, and even pathogenic microorganisms are present in groundwater systems in many parts of the world, leading to a deterioration in water quality [
2,
3,
4]. Industrialization, urbanization, and population concentration make groundwater quality threatened by complex pollution sources [
5,
6,
7]. In addition, a large number of studies have shown that the use of contaminated groundwater will significantly increase the probability of human disease [
8,
9,
10]. It is challenging to objectively determine water quality under complex external conditions, analyze pollution sources, assess the impact of groundwater on human health, and identify risk sources.
The water quality index (WQI) is a widely used comprehensive water quality assessment method [
11]. The water quality results are obtained by weighting and scoring the selected indicators, applying the aggregation function to calculate, and classifying them [
12]. Some early studies have shown that the WQI model is affected by the subjectivity of the researchers, and the water quality results are biased [
13]. Among them, due to the frequent use of the Delphi method [
14], the determination of the index weight link has strong subjectivity. As an advanced data processing method, machine learning has been gradually applied to determine the weight of water quality indicators to reduce the subjective bias in WQI models [
15].
Common validations of machine learning applications are mostly carried out in terms of results, based on metrics such as accuracy and R
2 [
16,
17]. For black-box models or high-dimensional models, it is inaccurate to test the effectiveness of model application by assessment metrics alone [
18]. The application of complex machine learning models still lacks transparency and interpretability, and researchers can only see the results of the model application and cannot explain the basis on which the model makes its judgments [
19,
20], which poses an uncontrollable and challenging situation for the deep application of machine learning in the groundwater domain. In WQI modeling, researchers often apply the weighting results obtained by machine learning algorithms targeting binary classification directly after assessment, ignoring the principles of the algorithms themselves in practice, which reduces the transparency and interpretability of water quality assessment results. Lee et al. [
21] used the random forest algorithm to assign weights and developed a standard process for the WQI model. Lap [
22] and others think that machine learning algorithms are very effective in dealing with complex nonlinear relational data. Four algorithms, including support vector machine, random forest, decision tree, and multi-layer perceptron, are studied. It is found that these methods have good effects in the process of water quality evaluation.
The weights of the water quality indicators, which are key for the model to determine the water quality status and make predictions, are obtained through the relationship between the water quality datasets. The degree to which a human can predict the outcome of a model or understand the reasons for its decisions is referred to as interpretability. Explainable machine learning (XAI) is able to deeply analyze the model’s learning results from both global and local perspectives, and demonstrate the basis of the model’s judgments through the data, which facilitates researchers to identify the key factors, thus making the application of machine learning more reasonable and explainable, which improves the credibility [
23,
24,
25]. Jeong et al. [
26] used interpretable machine learning to predict the salinity in groundwater, quantify the influence of pathogenic factors on the salinity in groundwater, and successfully determine the factors of groundwater salinization.
Unclean groundwater is hazardous to human health if it is used in scenarios such as agricultural irrigation, drinking, bathing and washing, and cooking [
7]. The accumulation of toxins from year to year can gradually affect human health conditions by inducing conditions such as skin diseases, diarrhea, muscle weakness, vomiting and allergic reactions, and even cancer [
27,
28]. Therefore, human health risk assessment for groundwater is necessary. Groundwater contamination is multi-source; industrial activities, agricultural activities, residential life, and plant and animal decay can contaminate groundwater [
29]. Industrialization, urbanization, and population activities are the main sources of pollution, which, together with the disturbances in the hydrogeological environment, make the sources of risk complex and difficult to find [
30]. The PMF (positive matrix factorization) model belongs to the multivariate statistical analysis model, the basic core of which is to distinguish the characteristics and contributions of different pollution sources in the mixed model. Although this method has not been applied much in the field of groundwater pollution traceability, it has been shown that the application is more effective and can be of great help in tracing the pollution sources.
The main purpose of this study is to apply interpretable machine learning algorithms to improve the water quality evaluation model, further explore the application and performance evaluation of machine learning in water quality evaluation, calculate and analyze the impact of multiple water quality indicators on human health in the study area, and determine the source of risk.
2. Materials and Methods
2.1. Study Area
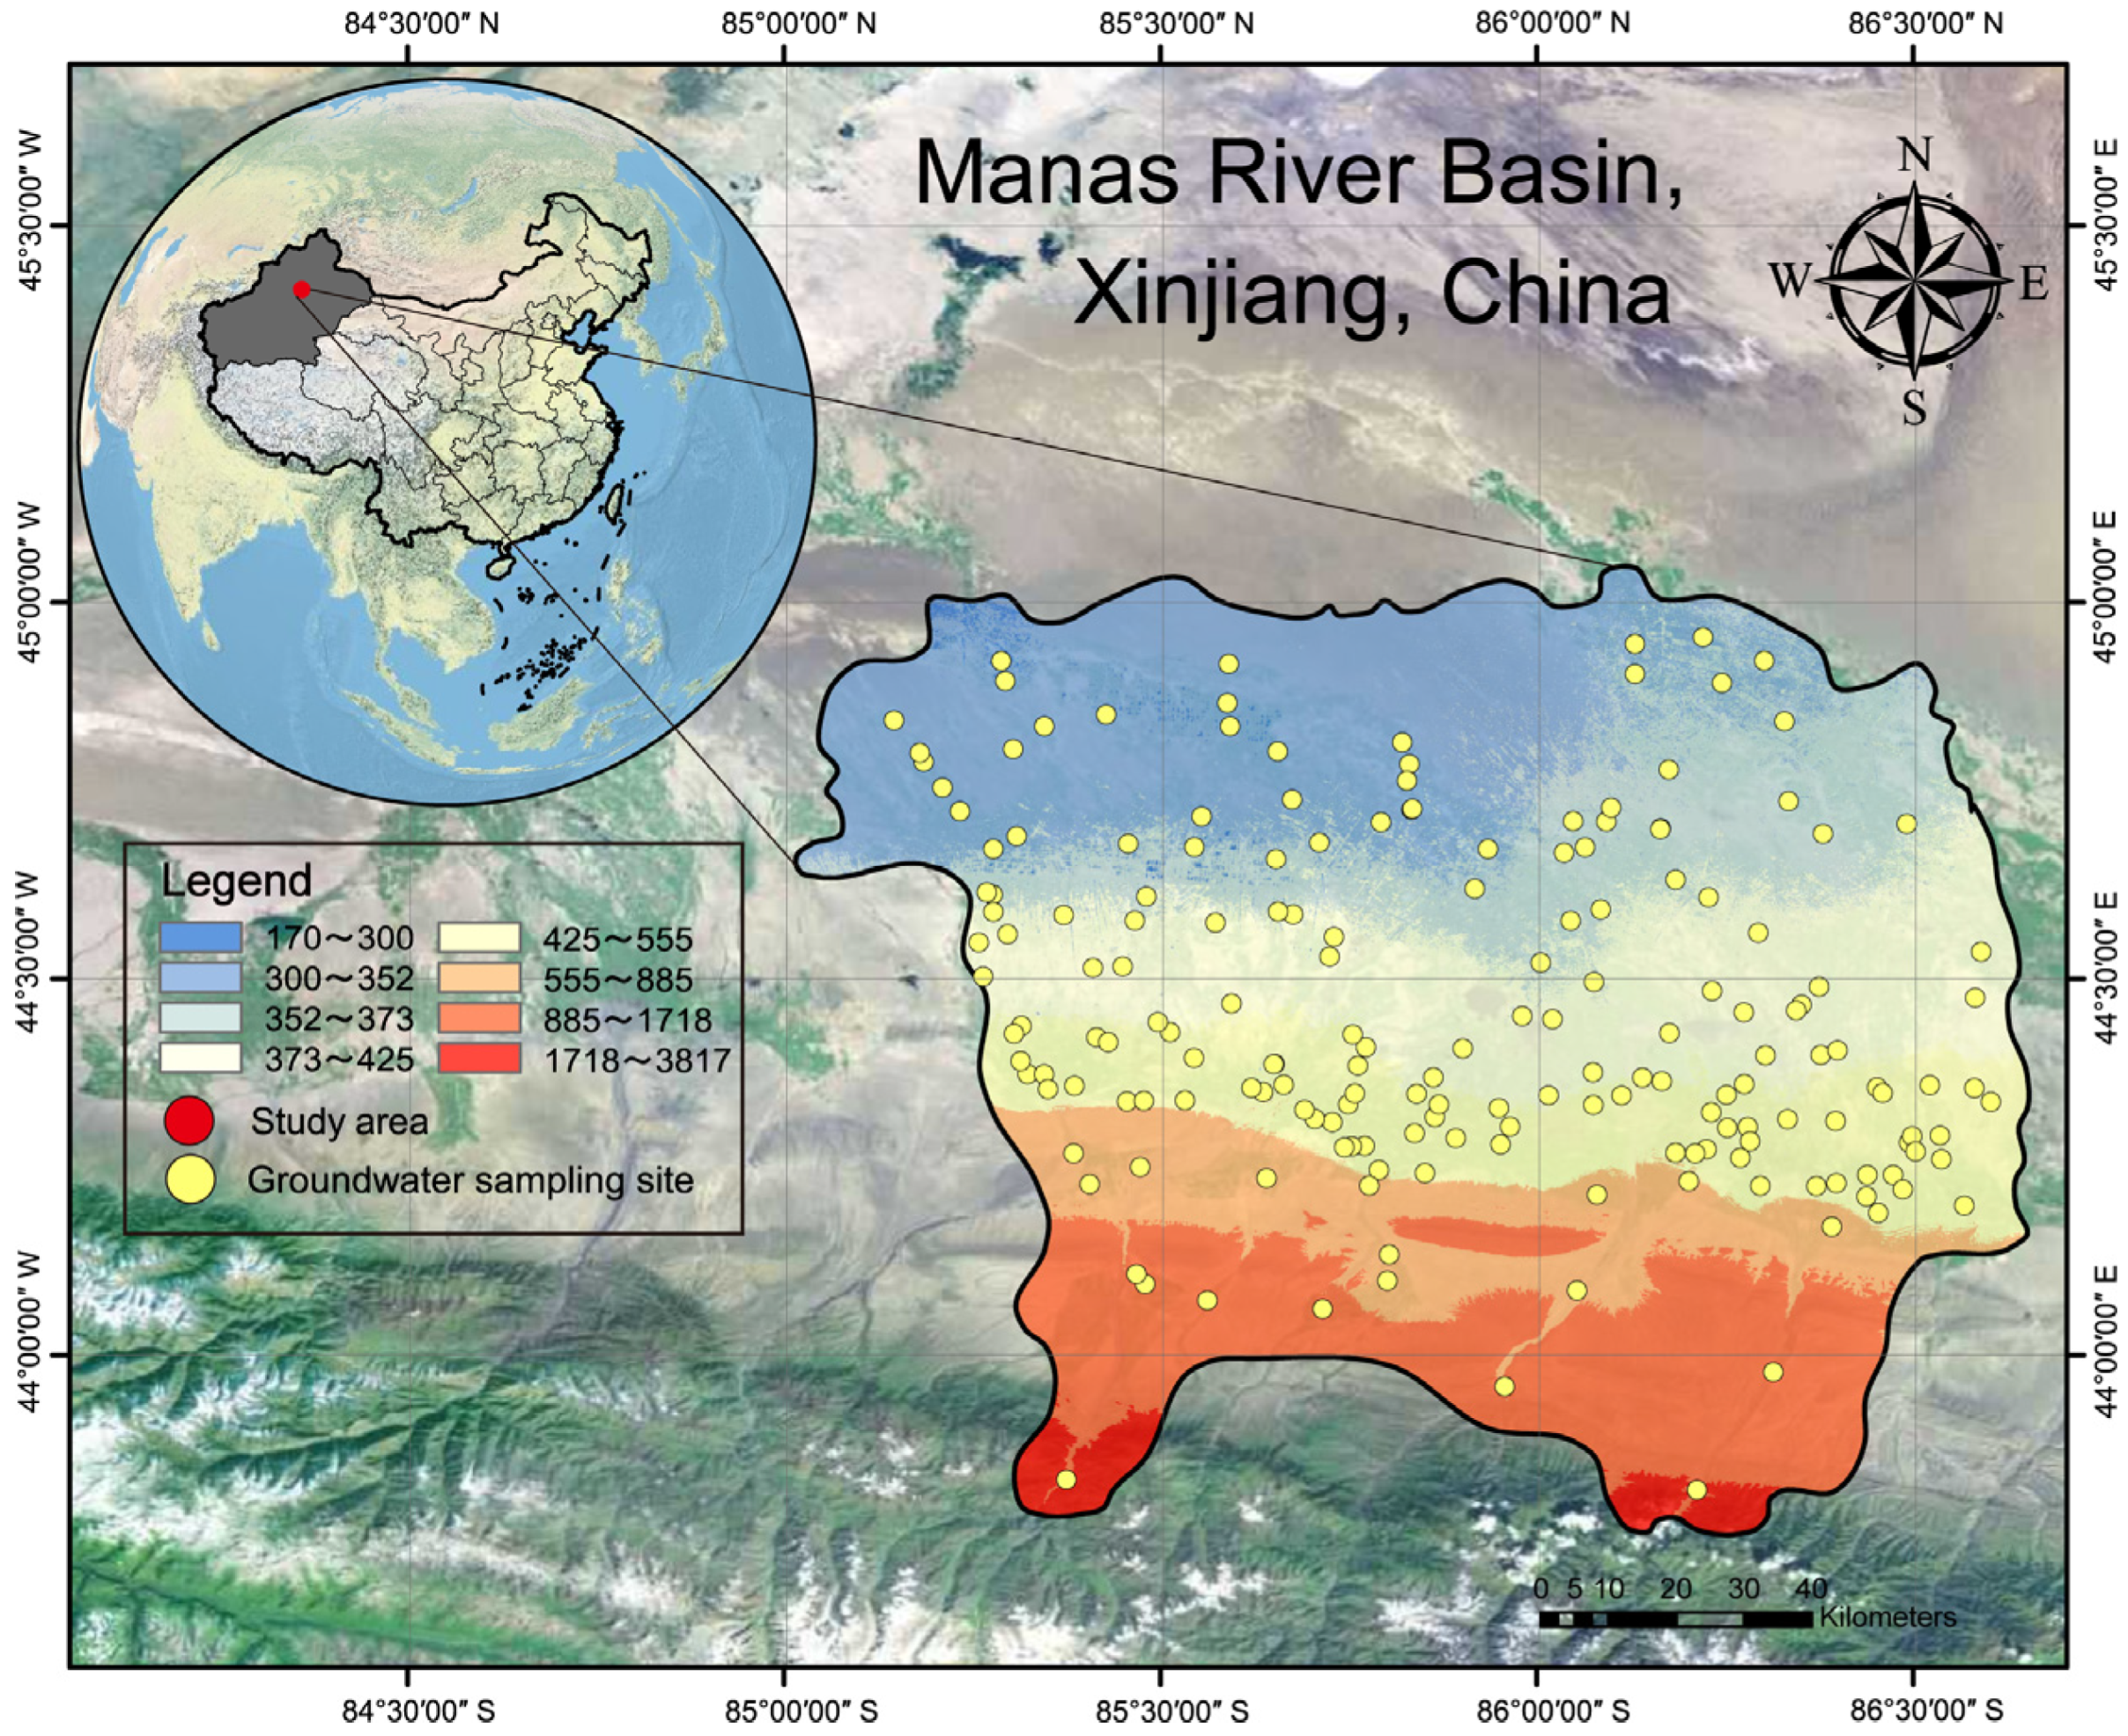
In this study, part of the Manas River Basin in Xinjiang Province, China, was used as the study area (
Figure 1). The Manas River Basin is located at the southern edge of the Junggar Basin and the middle part of the northern foothills of the Tianshan Mountains in the Xinjiang Uygur Autonomous Region. The surface conditions in the study area are complex, including a variety of landforms such as mountains, oases, and deserts [
31]. Precipitation in the region tends to decrease from south to north and is concentrated in April to August each year, accounting for 55% of the total annual precipitation. The length of the Manas River is about 400 km, the total annual runoff in the basin is 1.0~1.5 billion m
3, and 750 million m
3 of groundwater can be extracted under normal conditions [
32]. The study area is located in the economic zone of the northern slope of the Tianshan Mountains, which is a key economic zone for development, with rapid development of agriculture, animal husbandry, and industry, including industrial enterprises such as metal smelting and processing, leather processing, and mining extraction, and the population of inhabitants grows year by year [
33].
2.2. Sample Collection and Analysis
The data used in this study were obtained from groundwater samples collected from the Manas River Basin in 2019. Based on the results of the investigation of pollution sources and the investigation of the surrounding environment of groundwater in the study area, combined with the local hydrogeological conditions and the existing groundwater sampling points and information, sampling points were set up in the surrounding areas of various pollution sources, river systems, and areas that were not obviously affected. A total of 187 groundwater sampling sites were selected in the study area. To ensure that the water samples were representative, the monitoring wells were pumped and cleaned for sampling. Five 500 mL sampling bottles were used to collect water samples at each site, four for water quality testing and one for blank control, and were sent to the testing laboratory within 24 h. Sensory trait indicators such as pH, conductivity, and turbidity were measured in situ by an Aqua Troll 500 Multiparameter Sonde (In-Situ, Fort Collins, CO, USA), with an error of less than 10%; detection of the major anions and cations were analyzed using the laboratory’s in-house ion chromatograph (PIC-10), with an error of less than 5%.
2.3. XWQI Model Construction Based on Explainable Machine Learning
Based on the traditional WQI model, this study uses an explainable machine learning algorithm to improve it, enhance the overall interpretability of the water quality evaluation model, and deepen the application and understanding of machine learning in the water quality evaluation process, so as to construct a water quality index model based on explainable machine learning (XWQI). The XWQI model consists of a total of four basic steps [
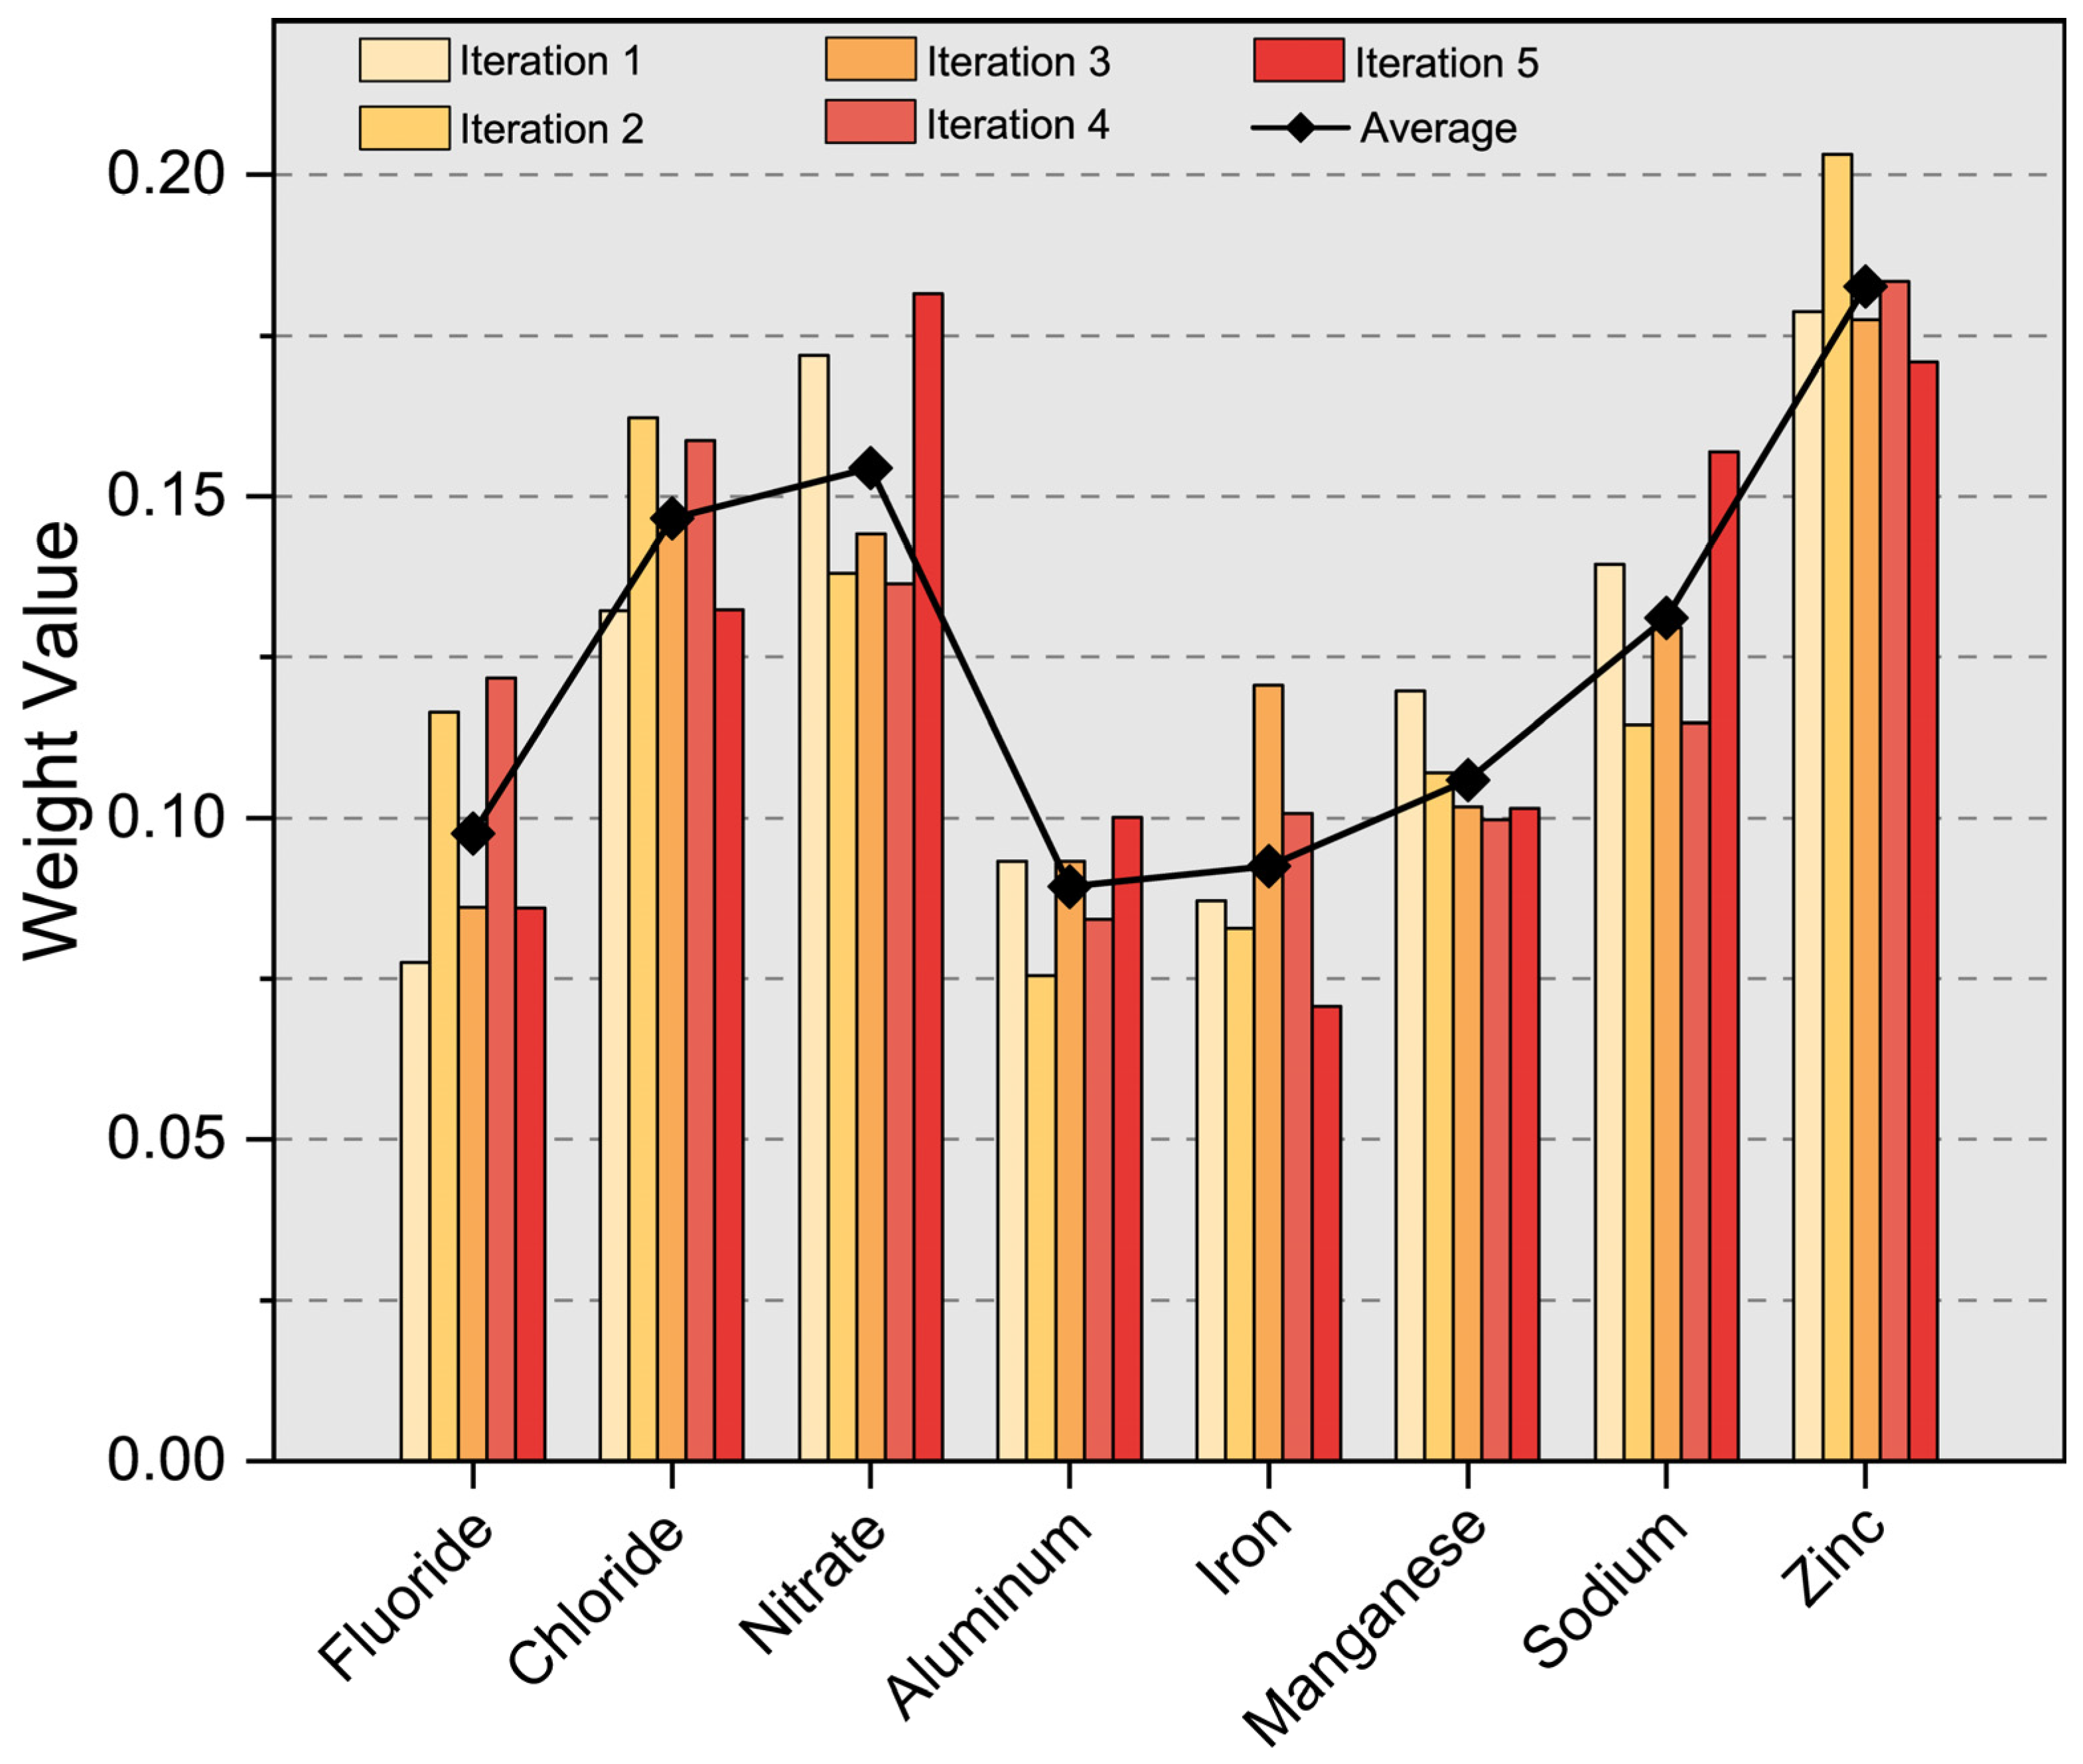
34]: (a) indicator selection, (b) subindicator scoring, (c) determination of indicator weights, and (d) aggregation. In this study, the determination of indicator weights is improved with advanced machine learning methods based on the traditional WQI.
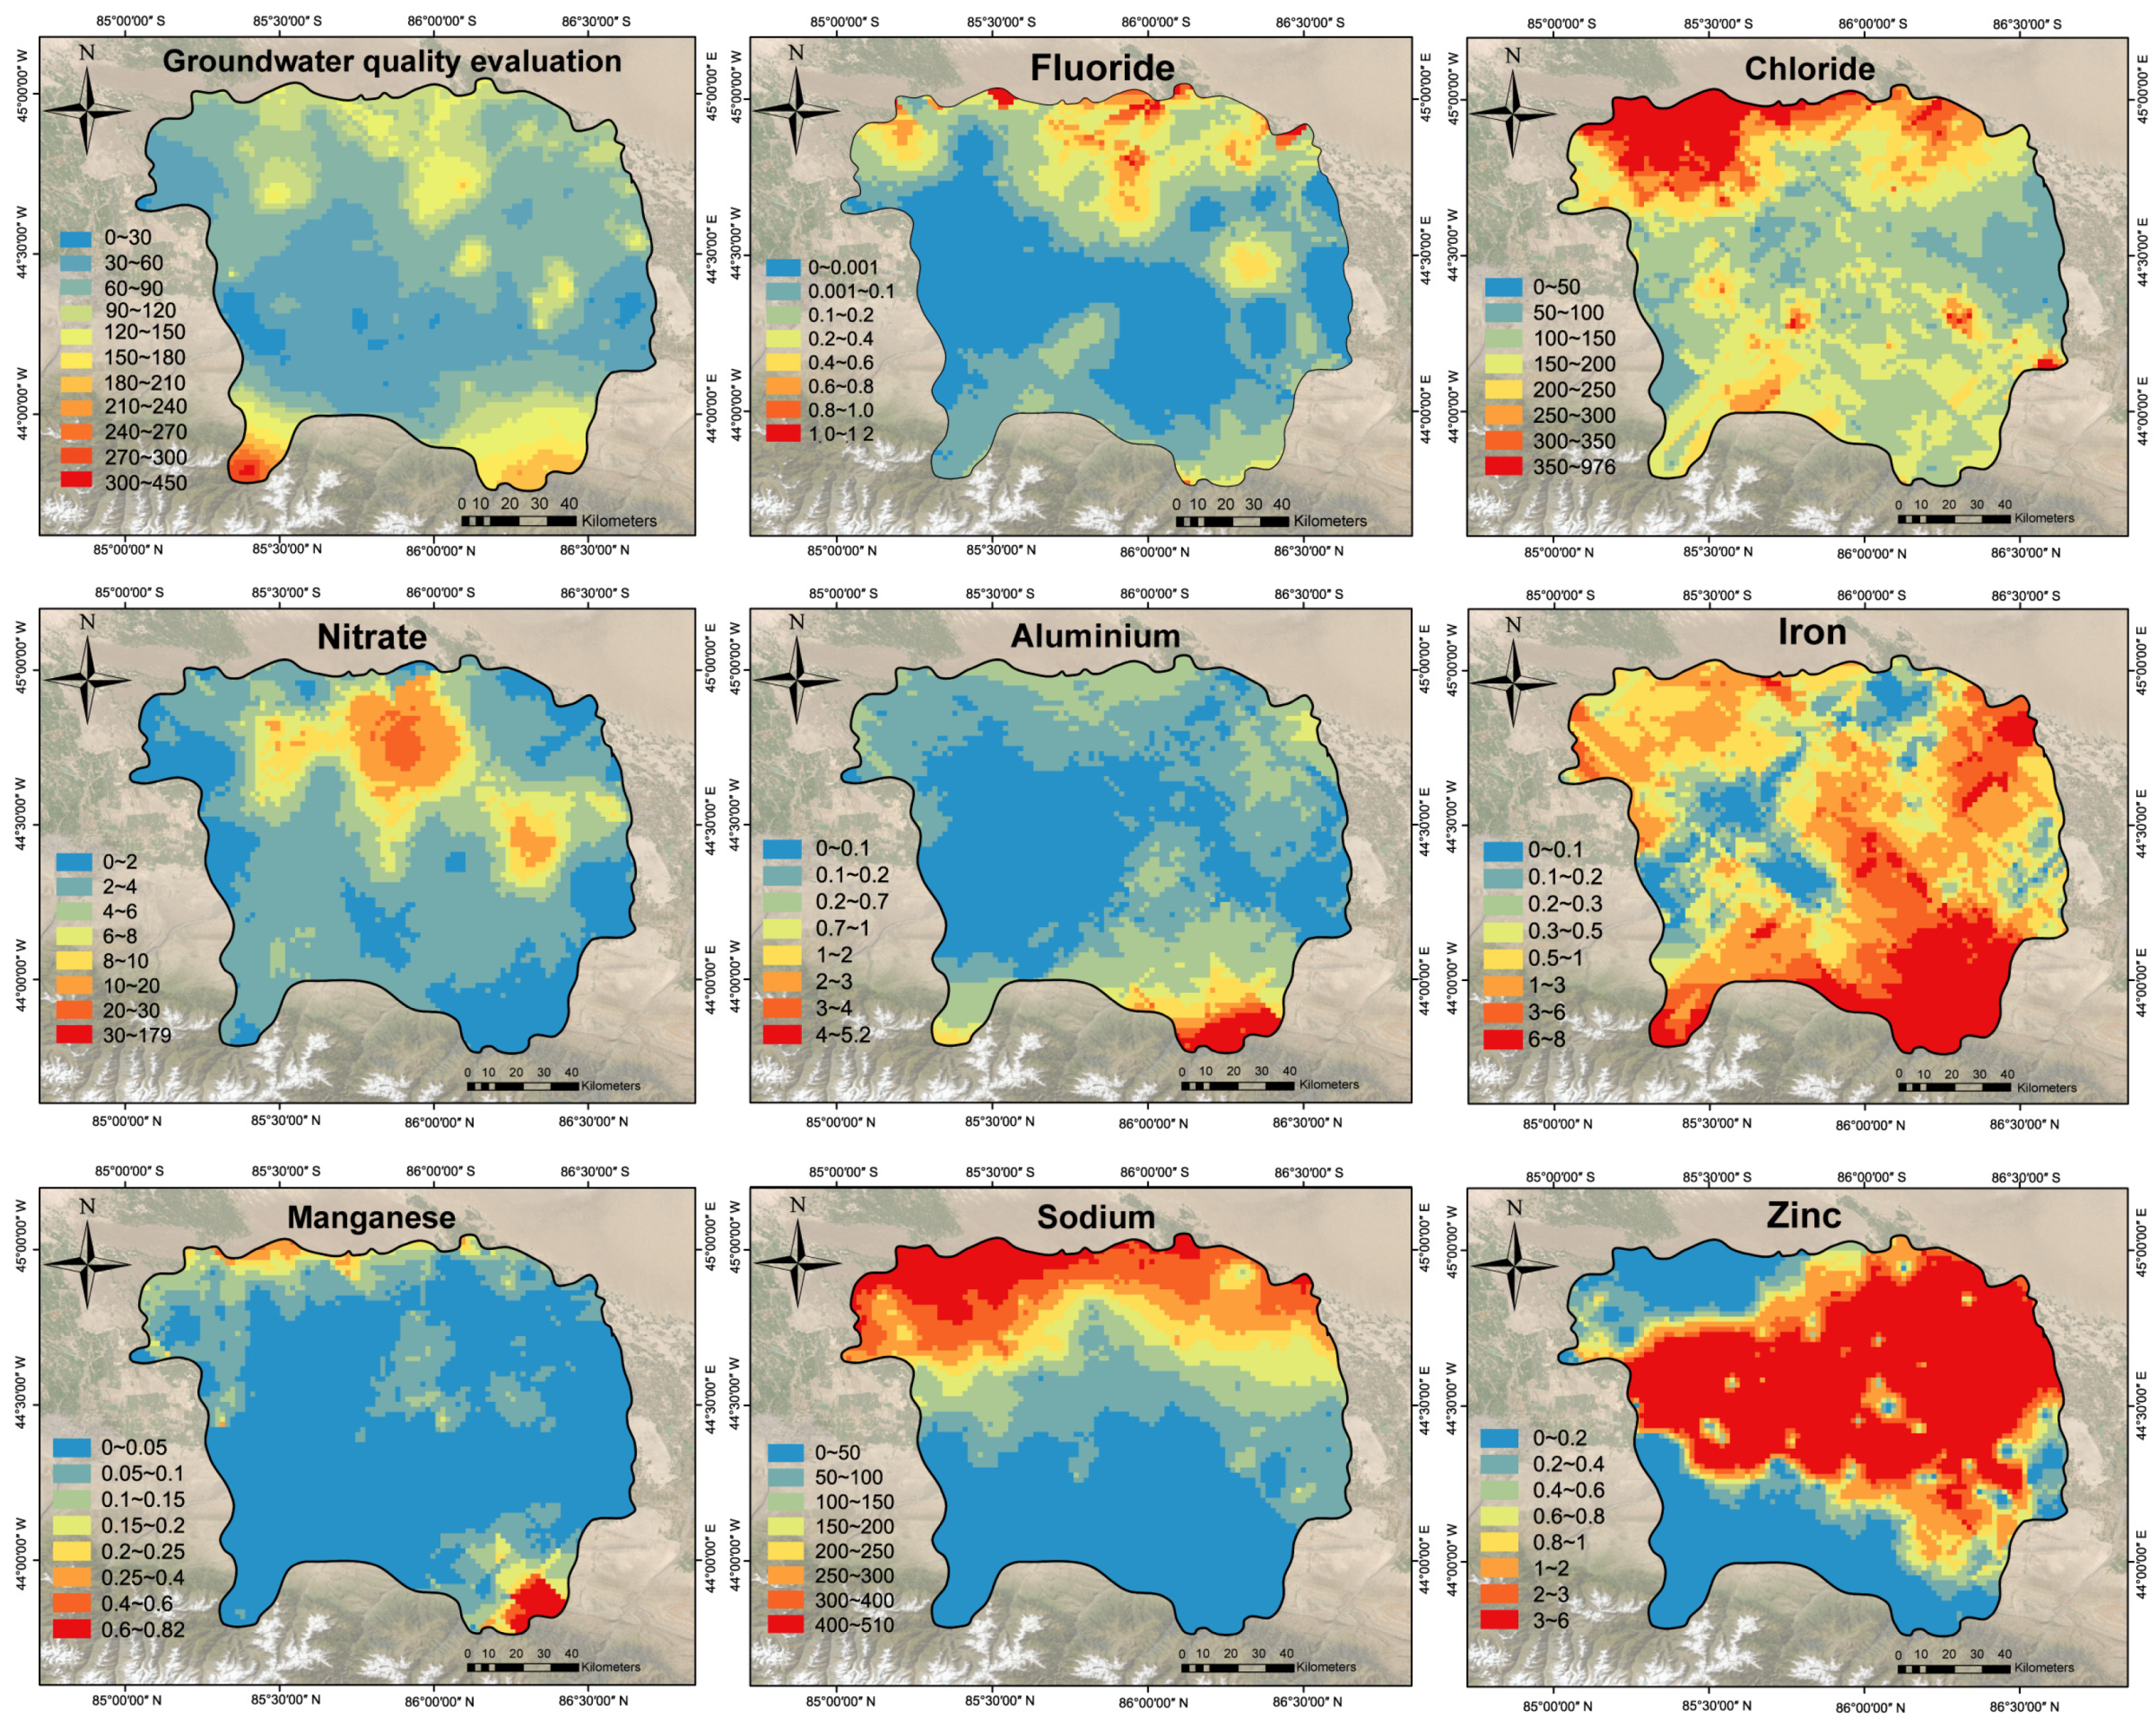
Through chemical analysis of groundwater quality samples, a dataset consisting of 35 water quality indicators including chloride, nitrate, and zinc was obtained. When there are too many water quality indicators, it is easy to disperse the weight value, reduce the impact of key water quality indicators on water quality, and interfere with the results of water quality evaluation. In order to reflect the impact of pollution indicators on water quality to the greatest extent, this study selected the indicators with over-standard phenomena as the dataset of water quality indicators for constructing the XWQI based on the groundwater quality standards promulgated by China.
In order to select a suitable machine learning algorithm to construct a water quality rating model, this study selected three white-box models: KNN, logistic regression, and support vector machines, and three black-box models: XGBoost, AdaBoost, and RNN, with accuracy as the key indicator for preliminary screening.
Preprocessing of the datasets is an important part of ensuring the effectiveness of machine learning and improving interpretability [
35]. The outliers of the indicators were screened to remove the noise due to non-water quality factors such as improper operation of the sampling process. The initial state of the points was determined by comparing the indicator measurements with the groundwater quality standards published in China, thus using a one-way discriminant method (
Table 1). The initial state of each point was used as an input term for binary classification by XGBoost. The sub-indicator function was used to convert the measured values of the water quality indicators to dimensionless values, with higher scores indicating higher concentrations of the indicator in the water body (Equation (1)), and the aggregation function was used to calculate the water-quality results (Equation (2)), where
Ci represents the concentration,
Pi represents the threshold,
SIi represents the indicator score, Score represents the water quality assessment result, and
Wi represents the indicator weight.
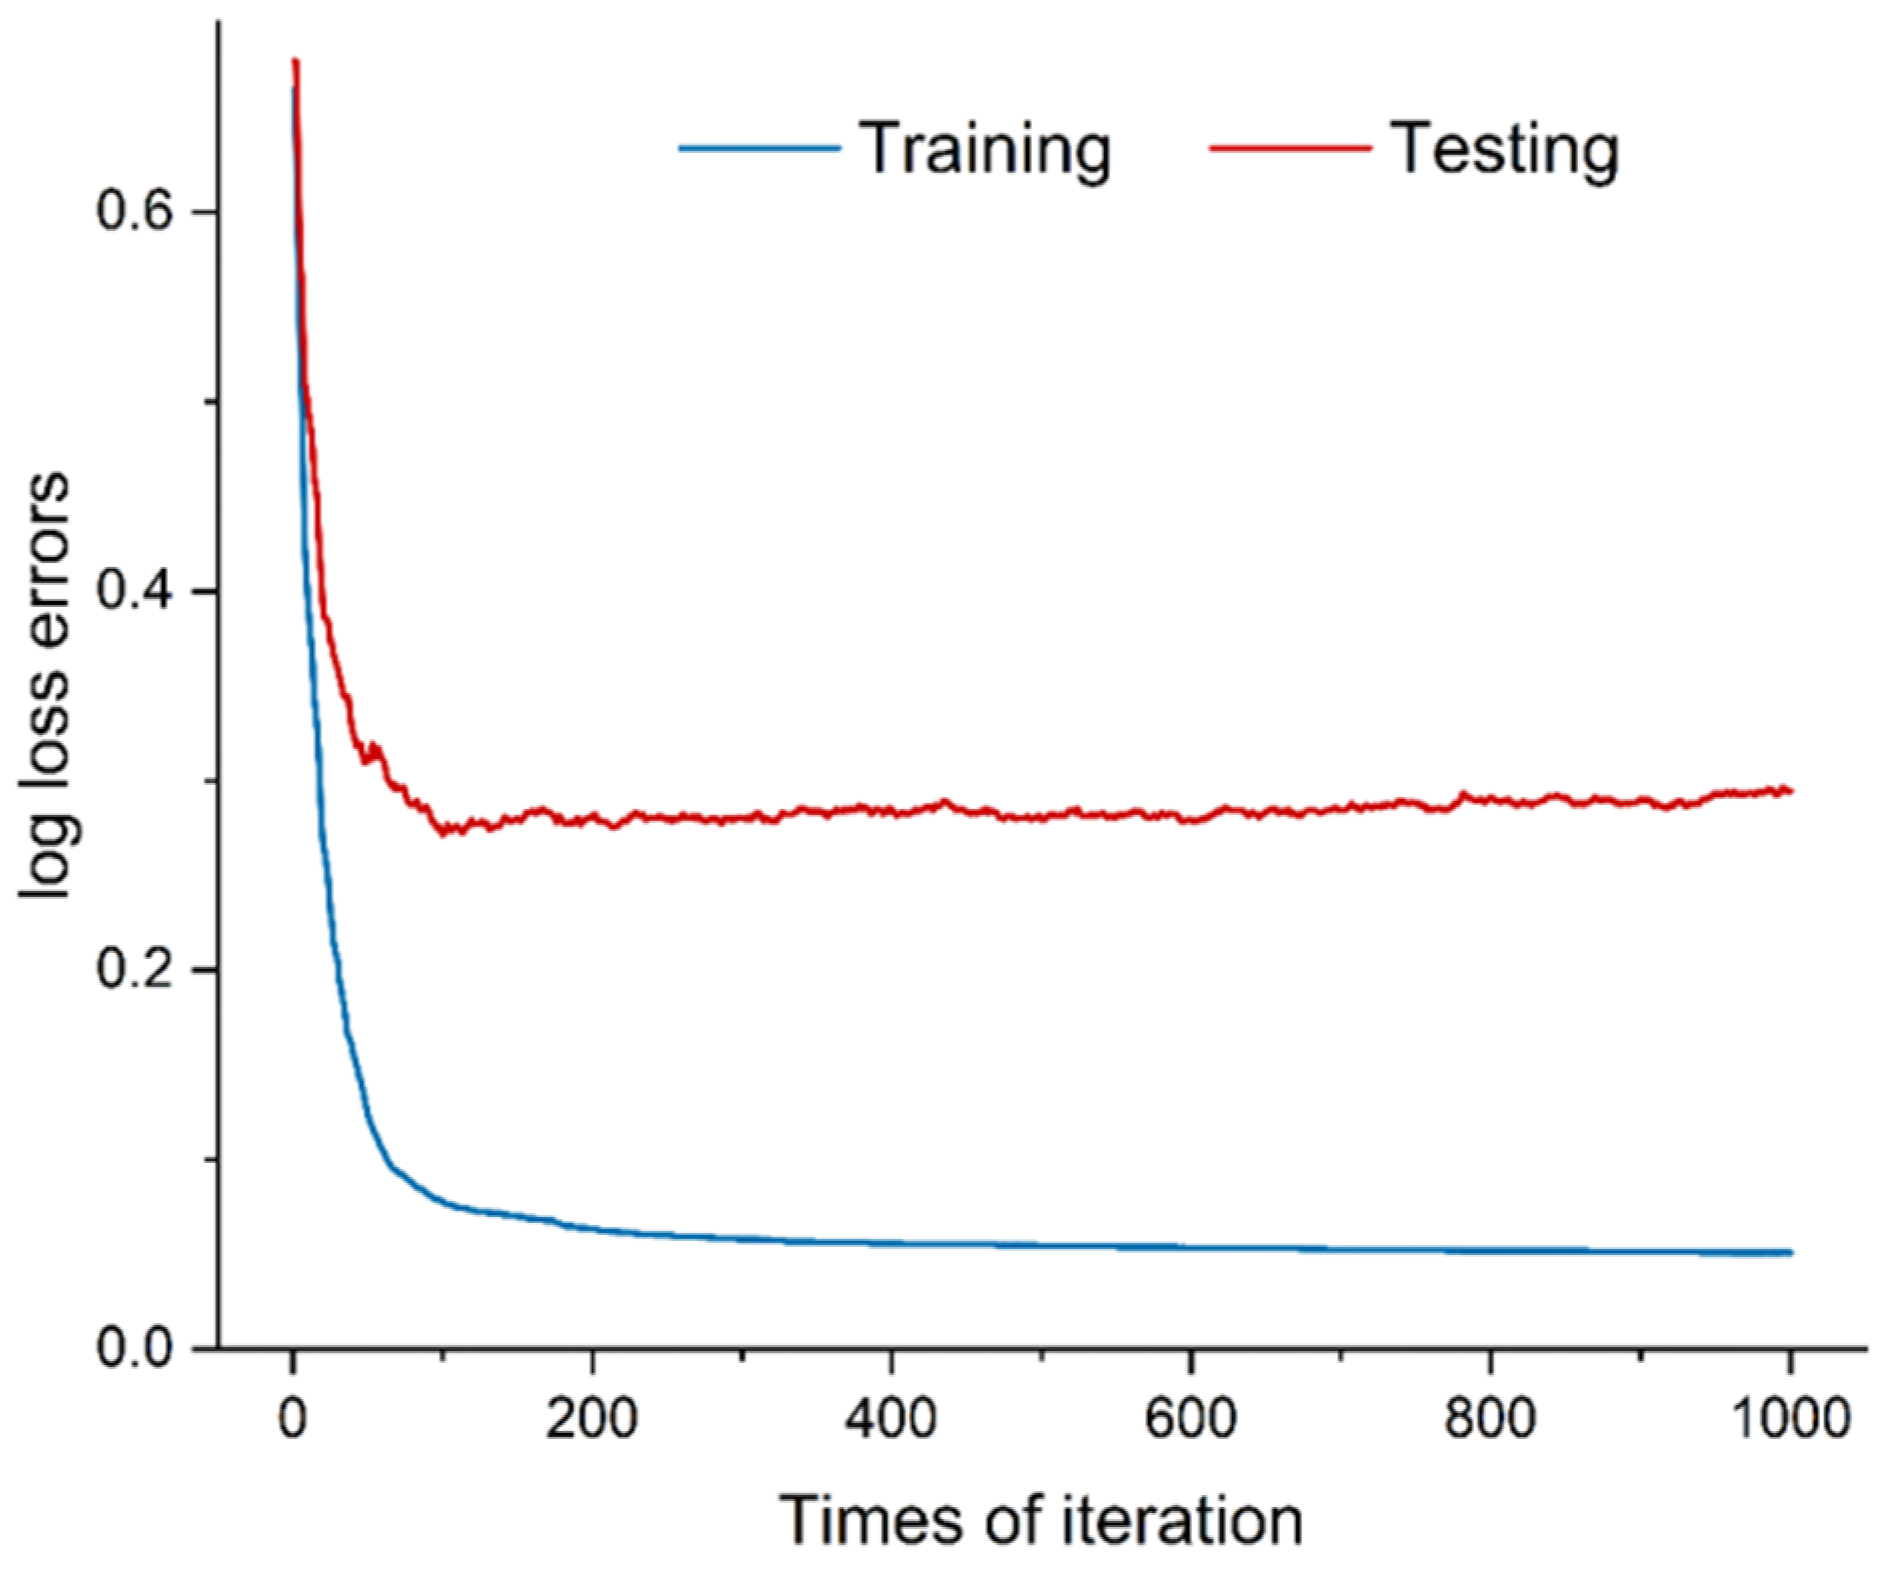
XGBoost is a more complex black-box model, which is prone to problems such as over-fitting and thus leads to a poor validation of the test set [
36]. The goal of XGBoost is to minimize the loss function under an additive predictive model. For a given dataset (
xi,
yi), where
xi is the feature vector and
yi is the objective value, the model can be represented as a combination of multiple weak learners (usually decision trees). A regularity term is set up for XGBoost, which is used to penalize the model complexity (Equation (4)) and a loss function Equation (3).
Based on the loss function and the regular term, the objective function is set as Equation (5).
After Taylor expansion and approximation as in Equation (6), the first- and second-order derivatives of the loss function are calculated at each step, the objective function is optimized, and the resulting tree model is summed.
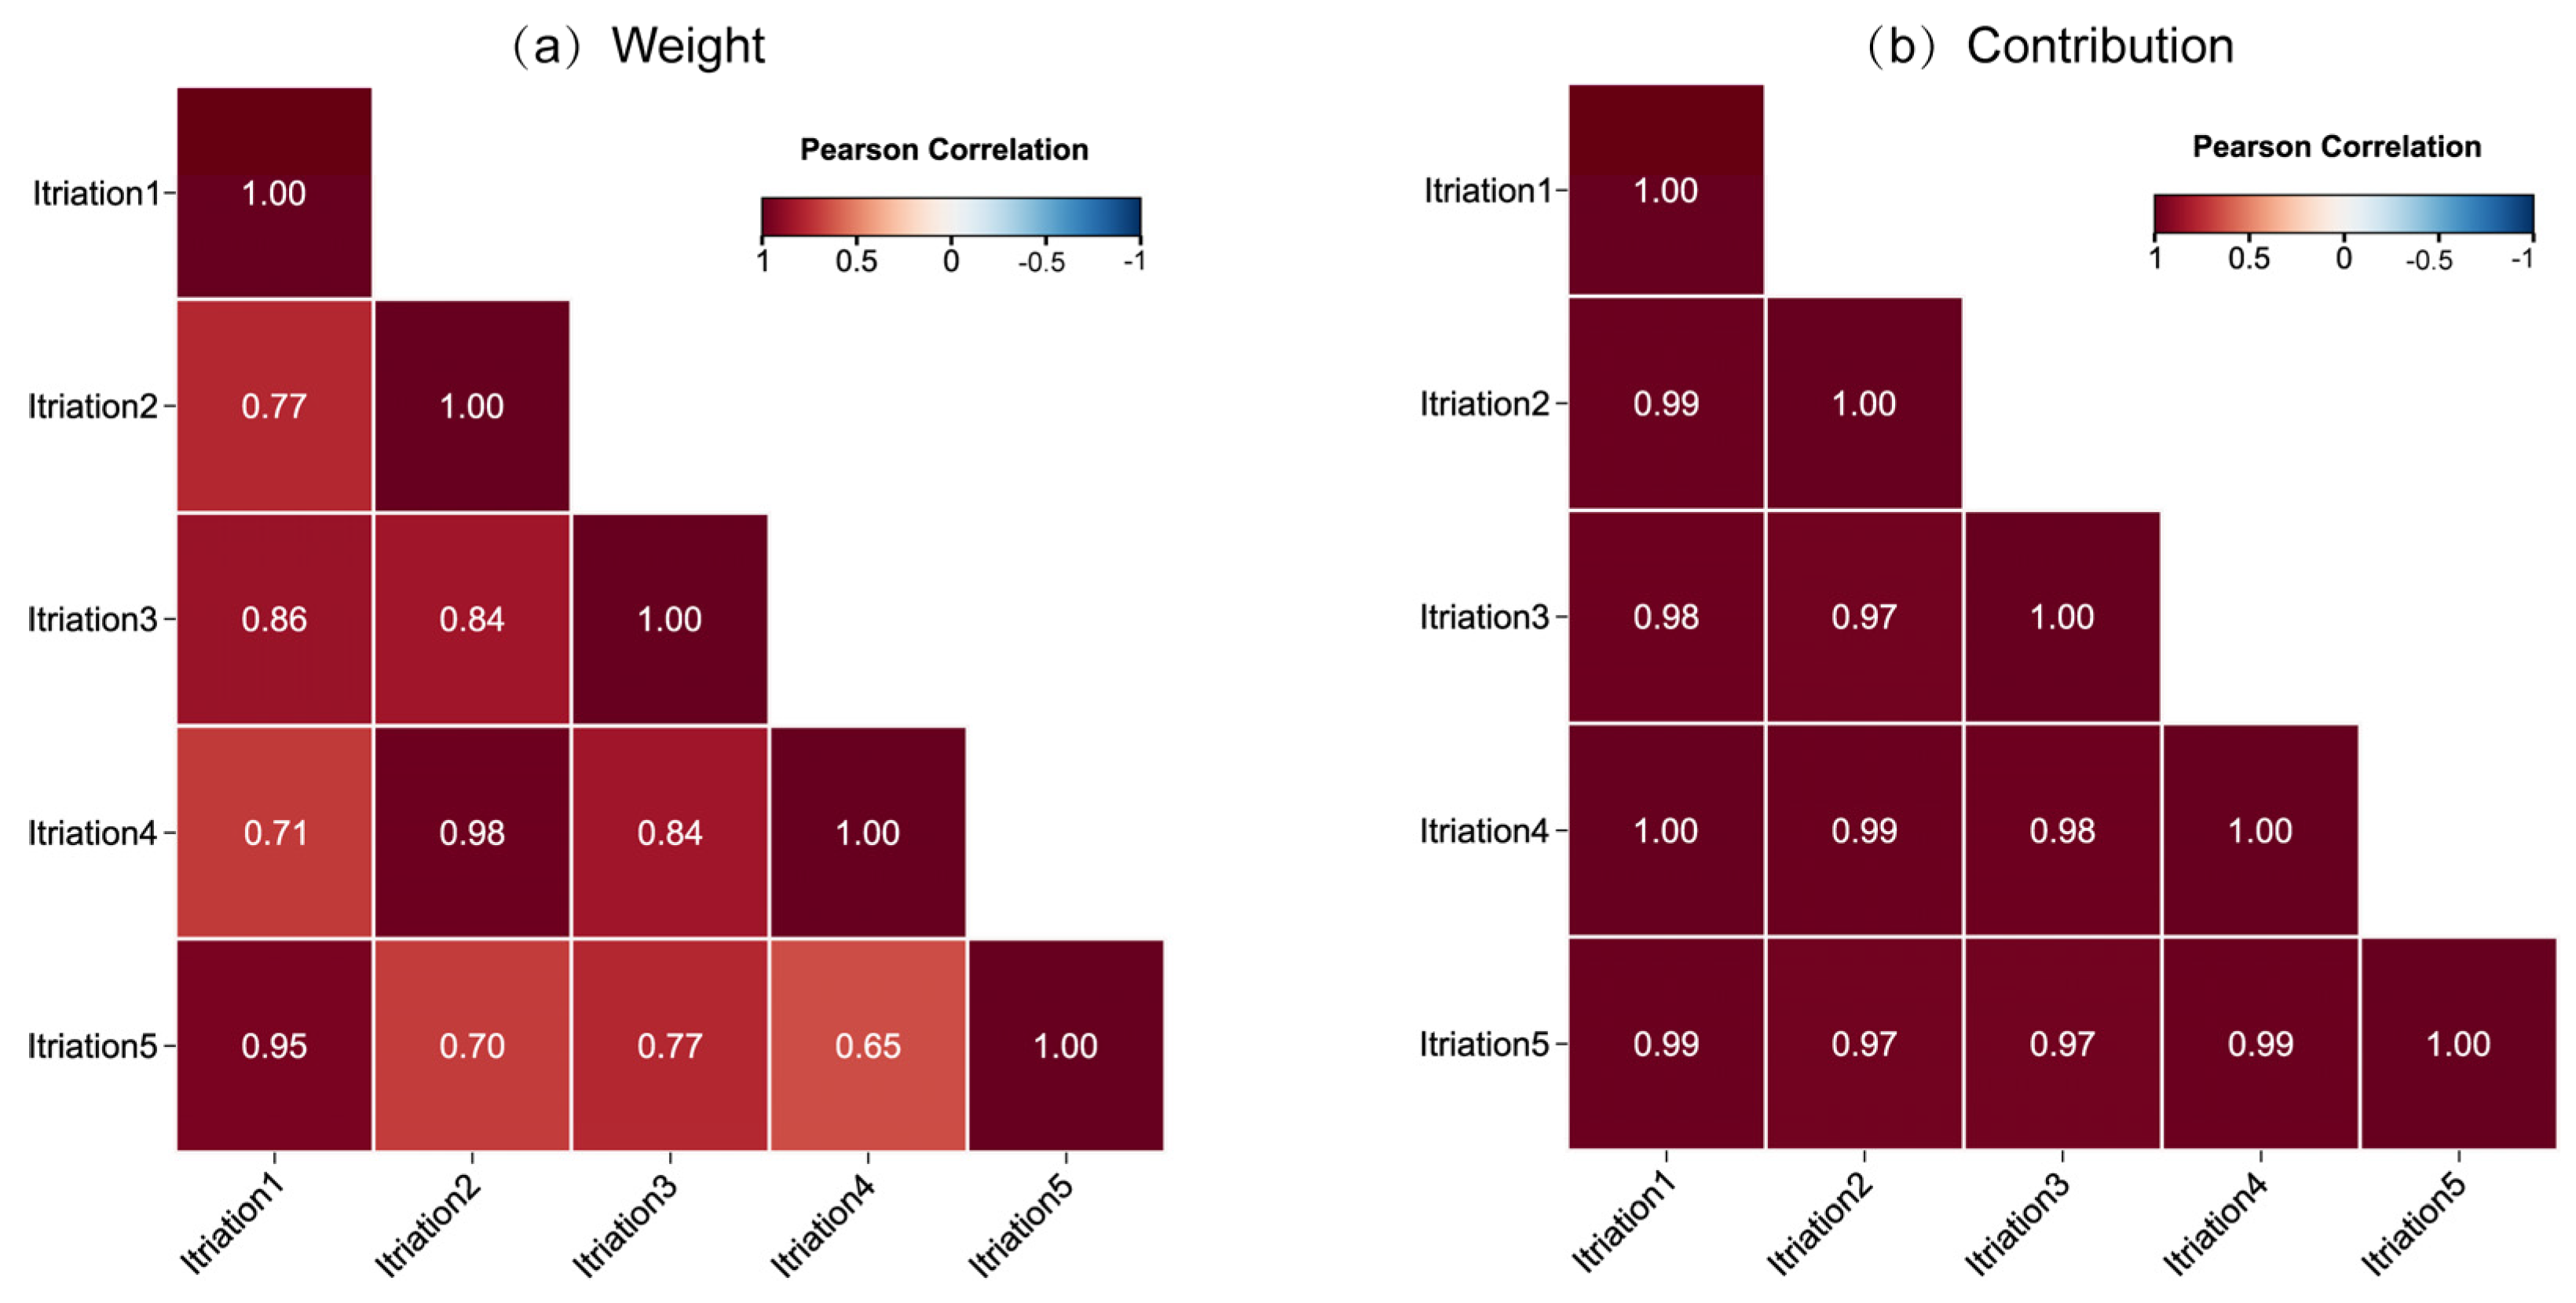
K-fold cross-validation is a common method to prevent overfitting. This method re-divides the new datasets for learning and testing within the training set and repeats it k times. To improve the model performance for the datasets, a grid search algorithm is used to adjust the hyper-parameters.
2.4. Interpretability Analysis
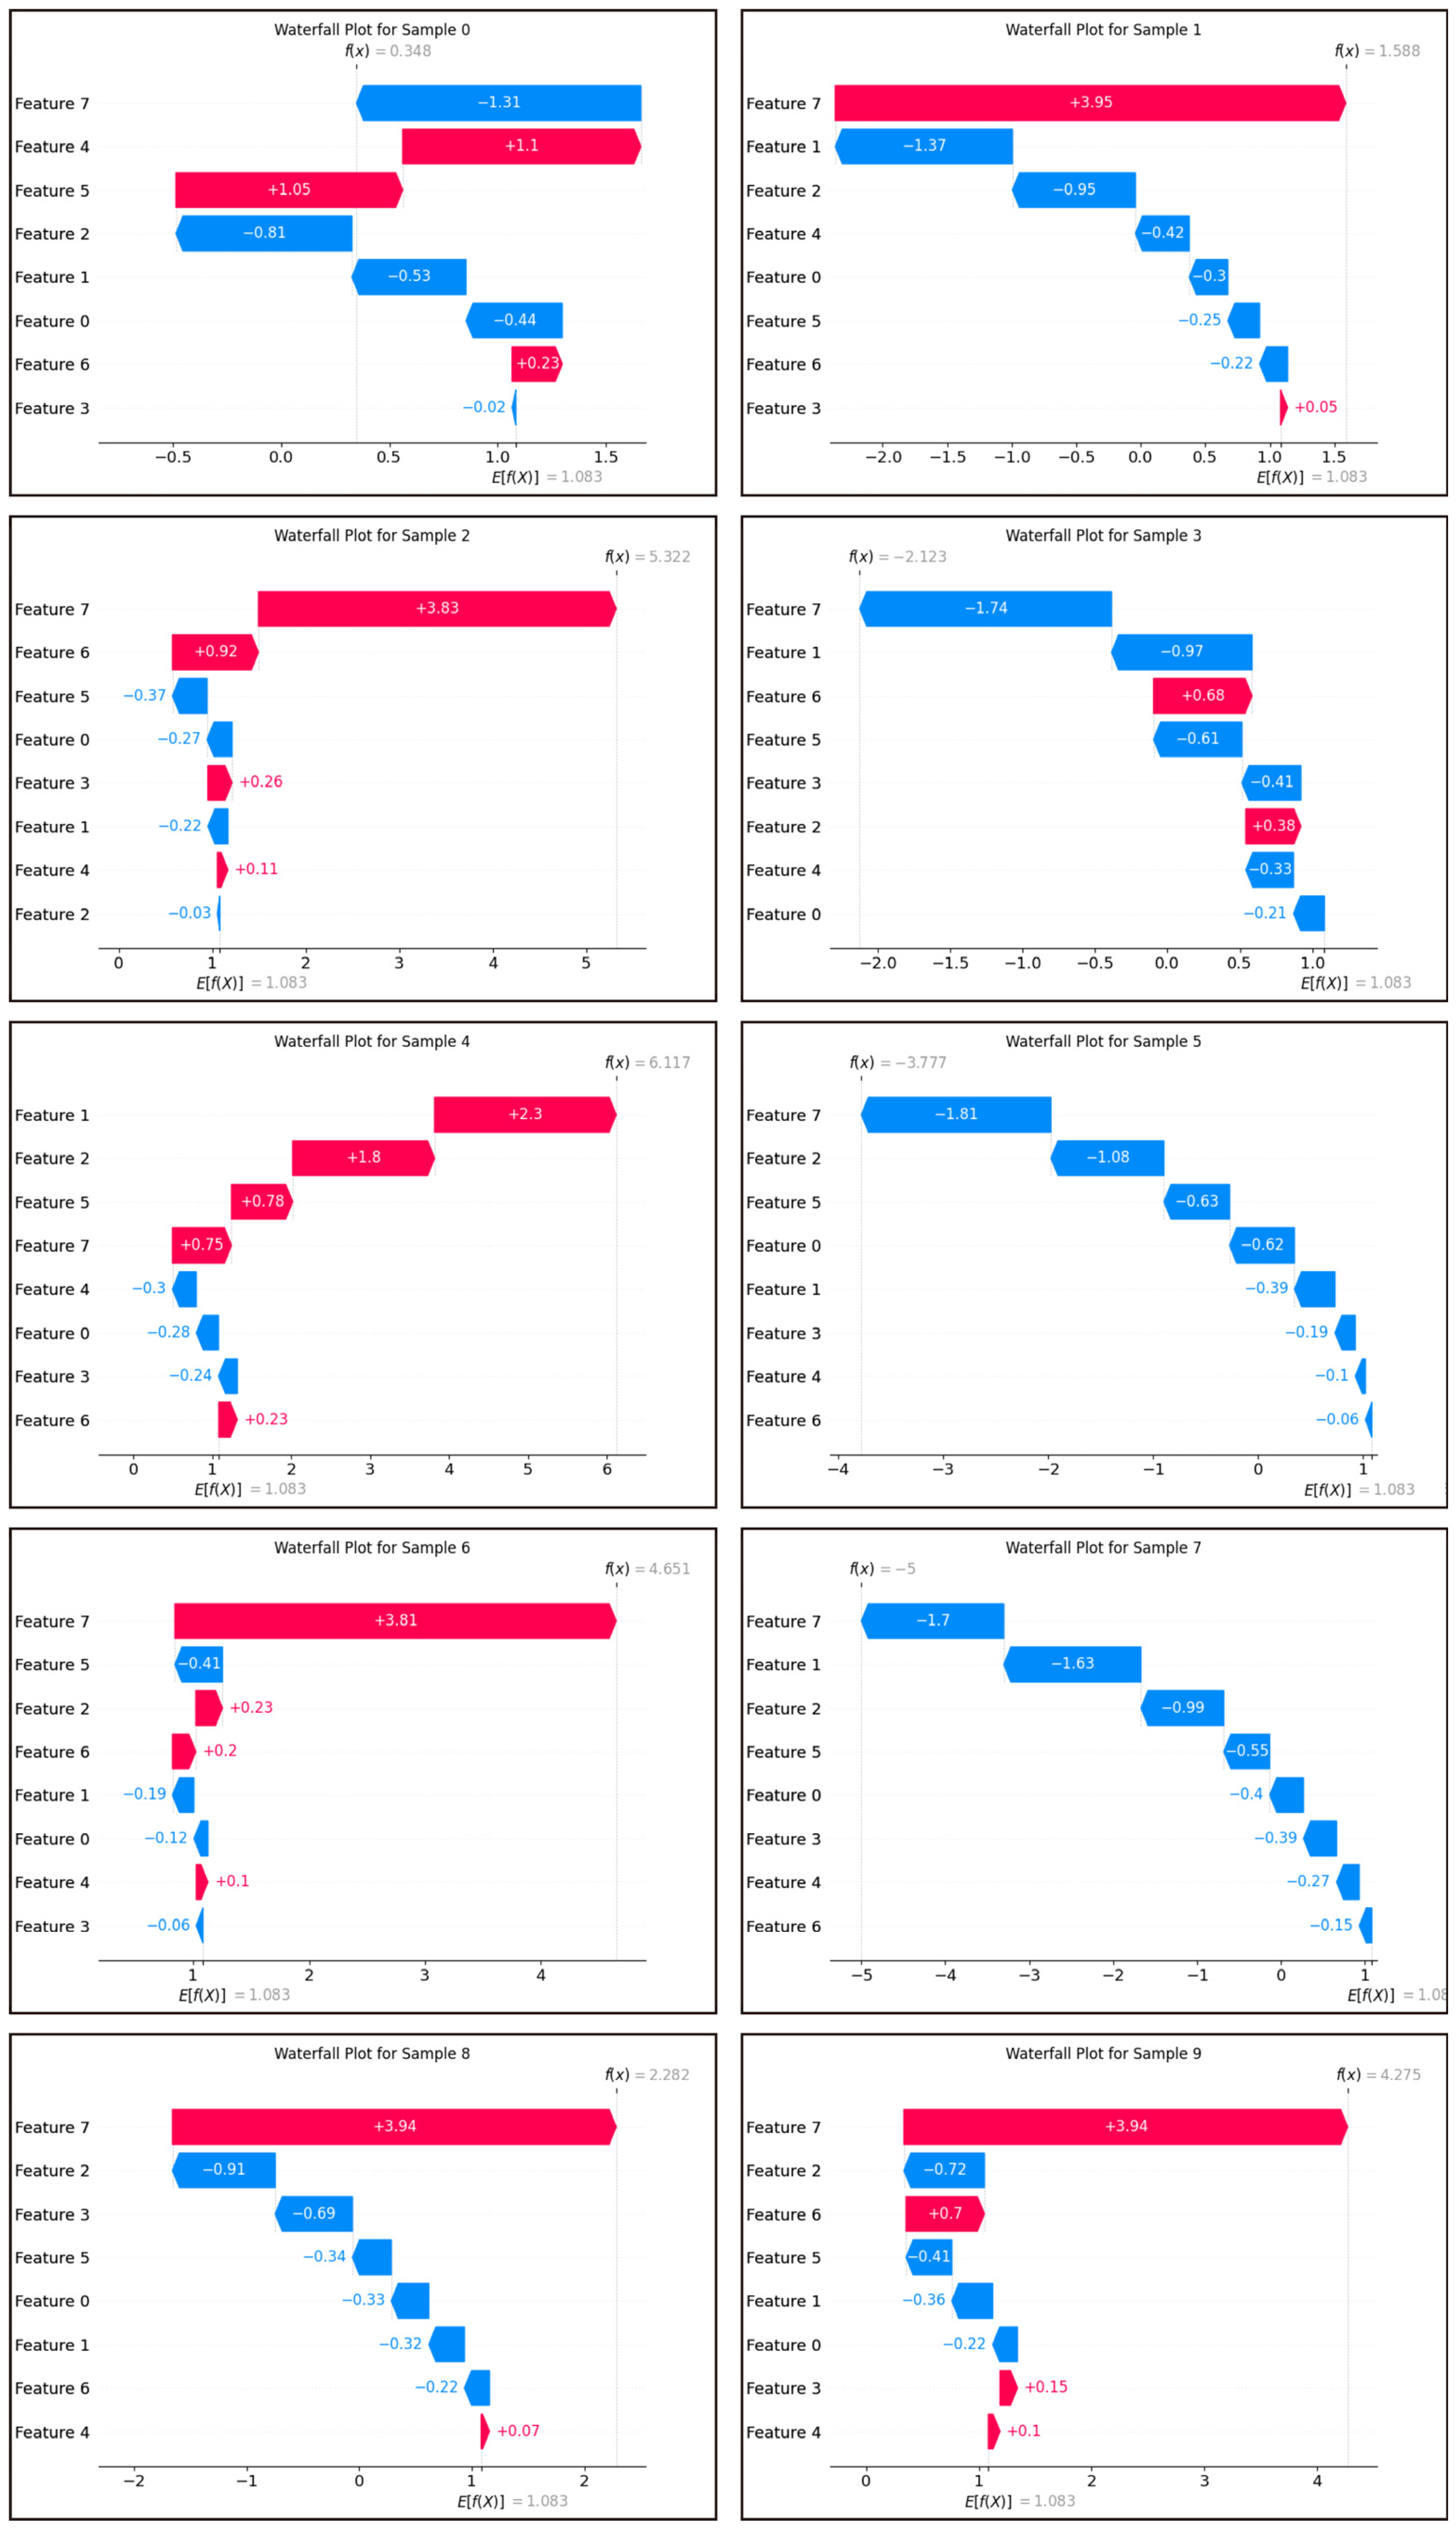
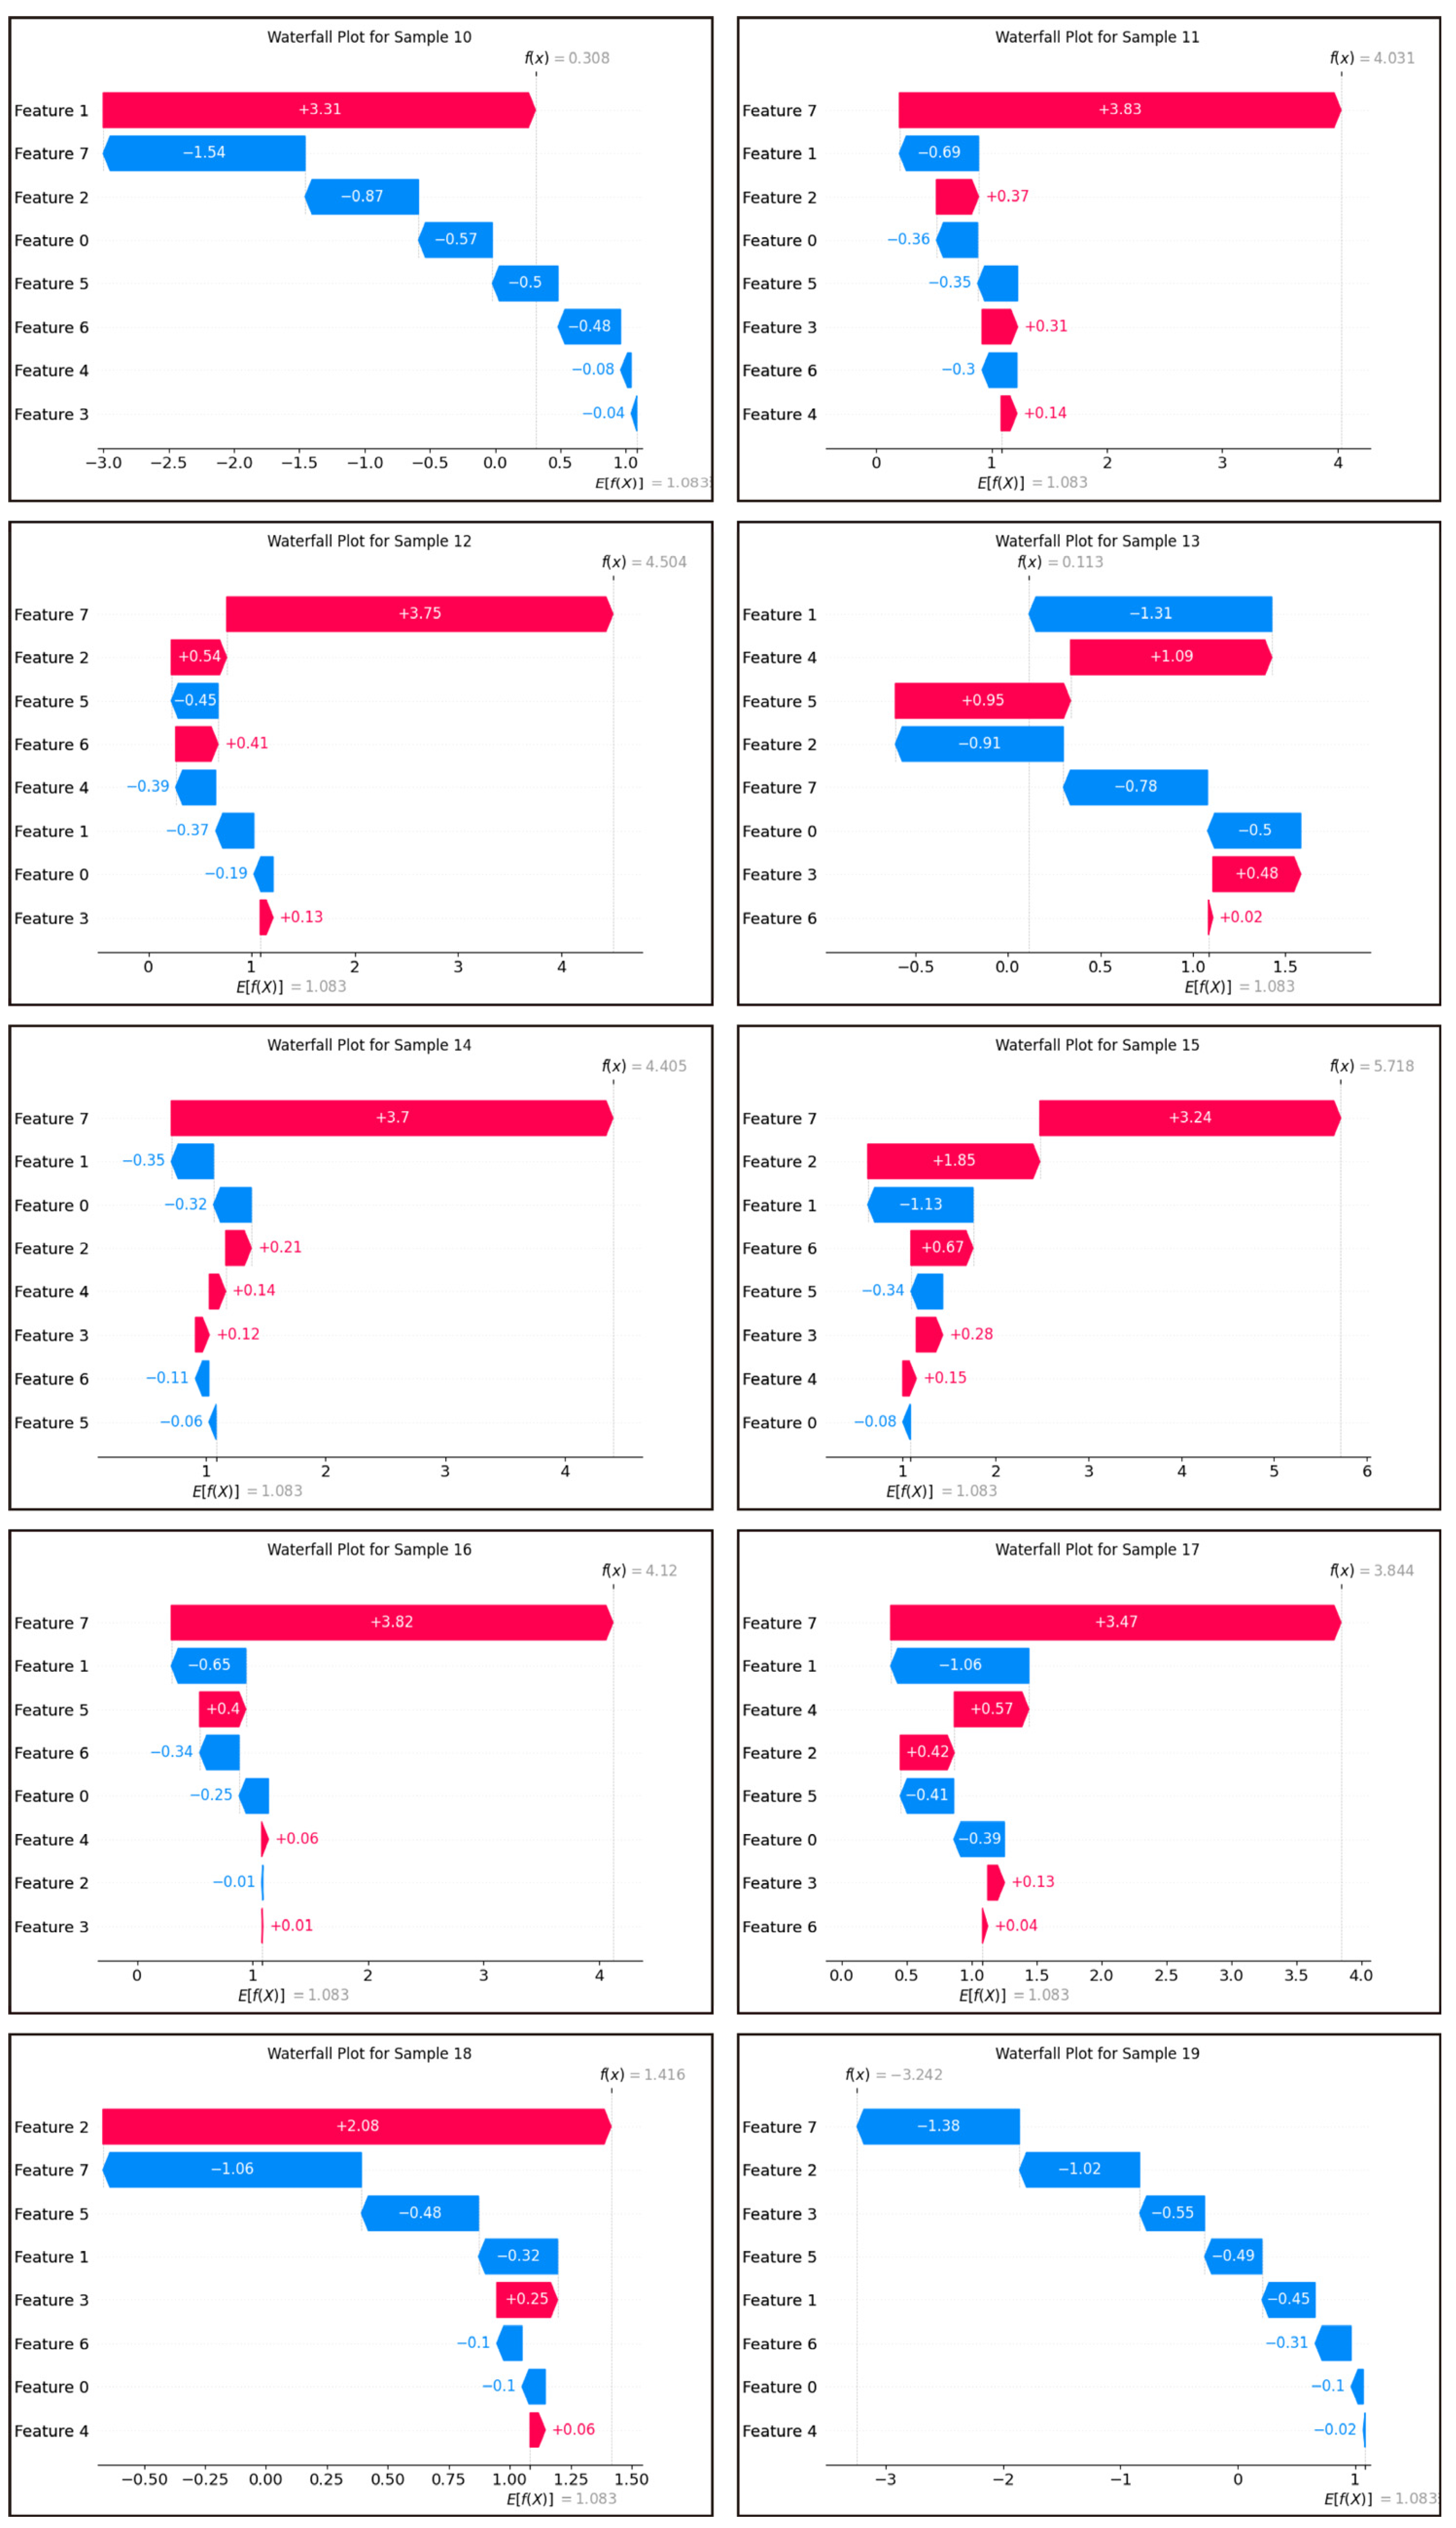
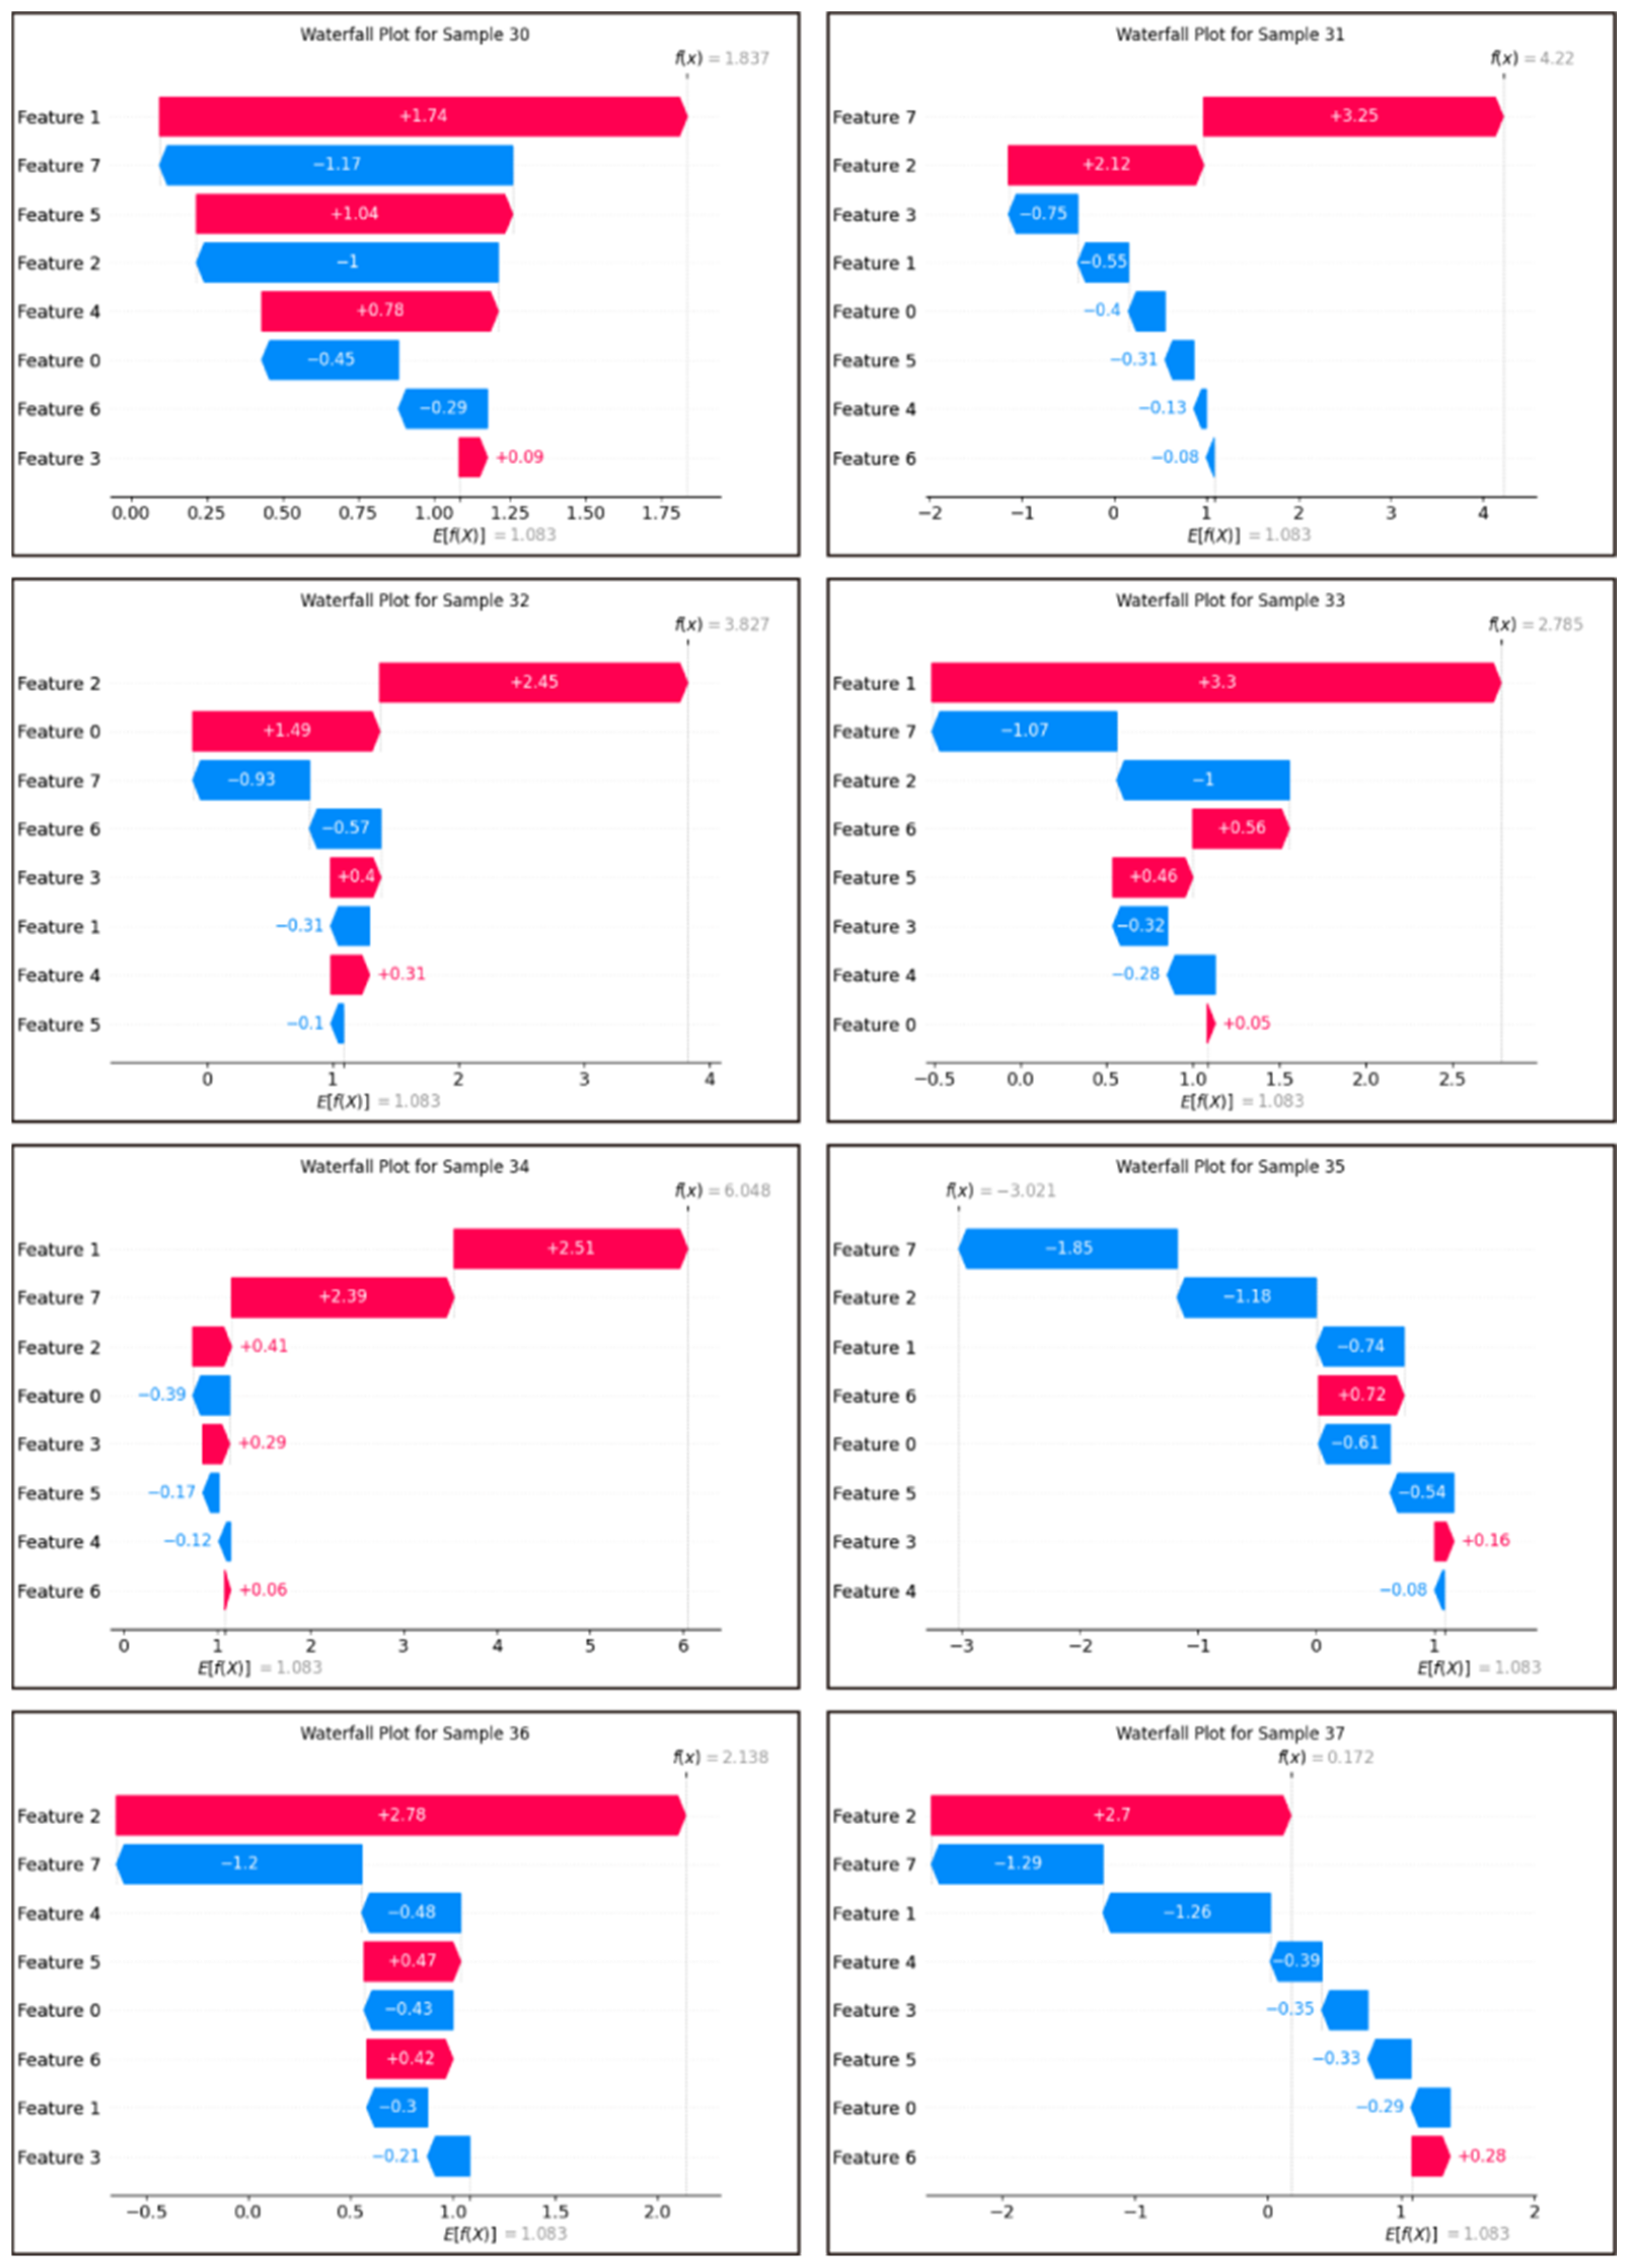
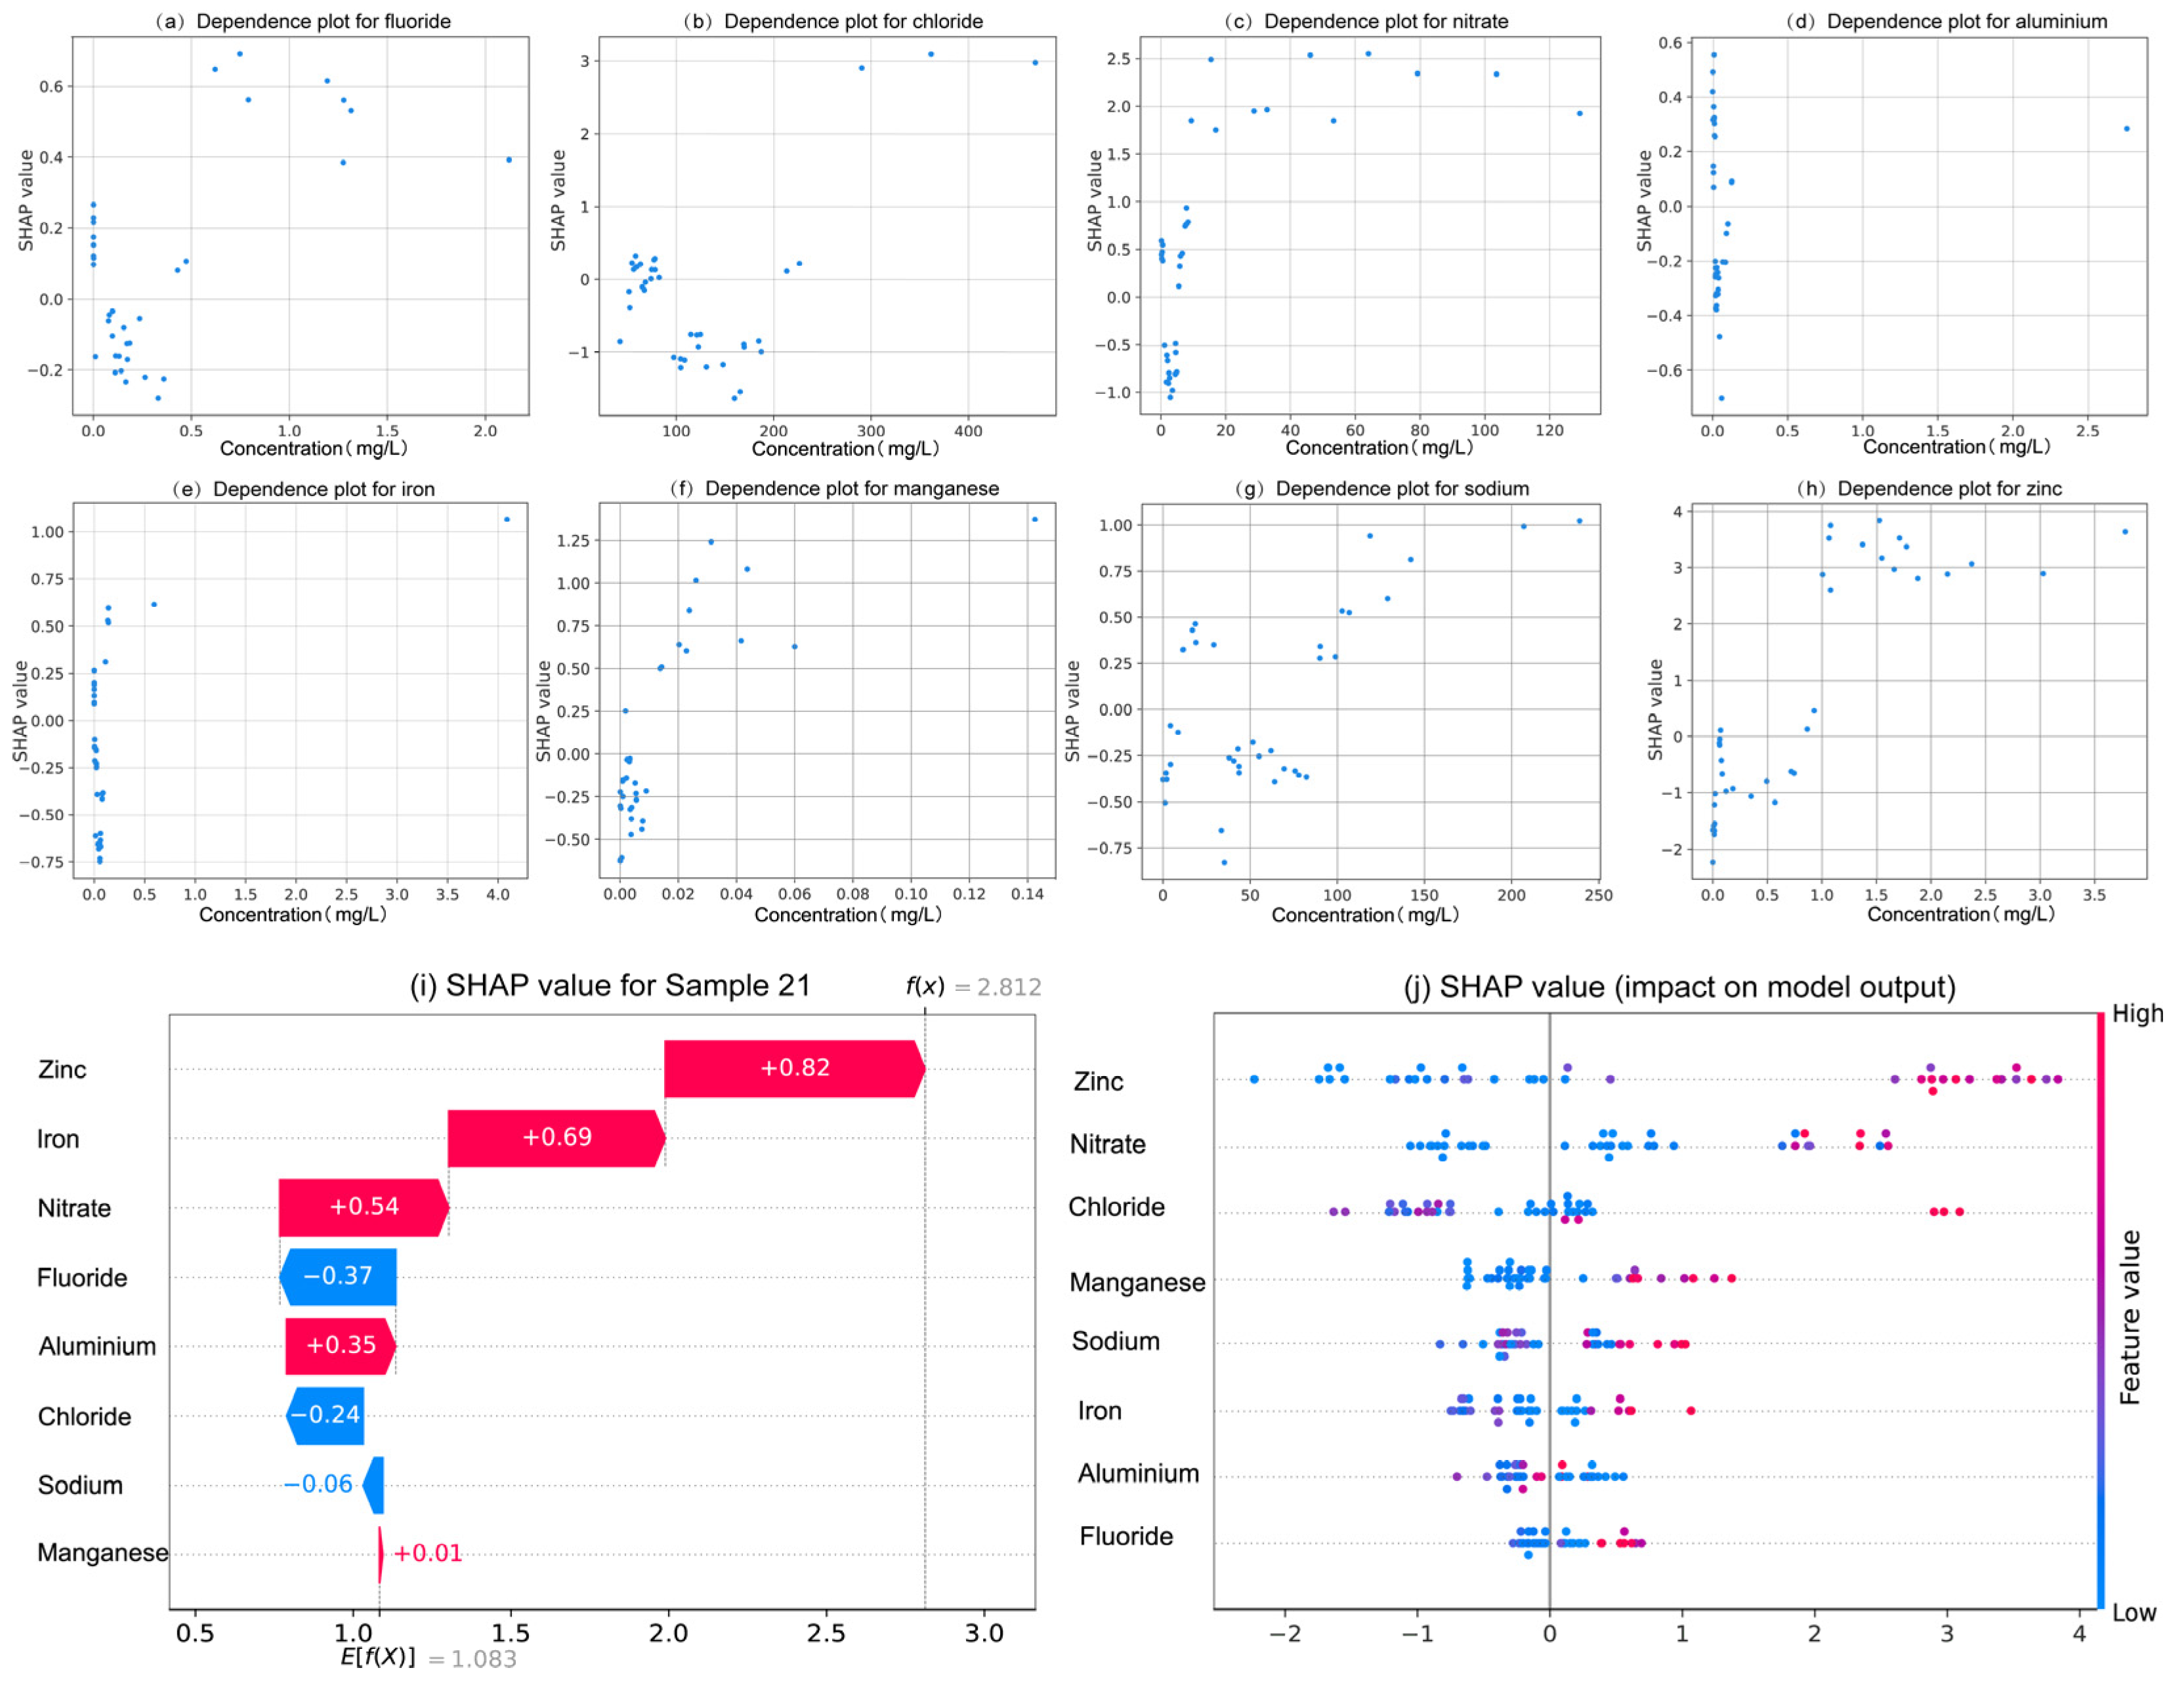
SHAP (Shapley additive explanation) is an ex-post explanation methodology that draws on game theoretic ideas and is able to explain black-box models by calculating the marginal contribution of each feature in the model to measure the magnitude of the influence of each feature [
37]. SHAP describes the influence of each feature on the results of the model by means of additivity.
For a single sample
x in the black-box model f, the expression for the ex-post explanatory model
g is:
where
M is the number of features in the black-box model,
is the average of the predicted values of
f with respect to all the samples, and
is the Shapley value of the
ith feature. The ex-post interpretation model
g has local accuracy. The predicted value of the ex-post interpretation model
g for a single sample is equal to the predicted value of the black-box model for a single sample. Thus, there is the following calculation:
where
S denotes the feature subset of {
M\
}, and different values represent different feature combinations;
denote the outputs of the model when
is modeled and not modeled under the feature combinations, respectively; and
denotes the corresponding probabilities under various combinations of features.
2.5. Human Health Risk Assessment
2.5.1. Deterministic Assessment of Human Health Risks
Human health risk assessment is a quantitative method used to assess the relationship between hazardous substances and human health. Human health risks are evaluated based on methods recommended by the U.S. Environmental Protection Agency (Washington, DC, USA). The potential risks from groundwater are primarily from direct ingestion (drinking) and dermal contact (bathing and swimming). The eight indicators used in this study are all non-carcinogens.
For non-carcinogenic effects of a single contaminant, the groundwater exposure corresponding to drinking was considered and calculated using Equation (10):
where
ADD is the average daily exposure dose of the pollutant,
IR is the amount of water consumed per day,
C is the concentration of the pollutant in the water body,
EF is the frequency of exposure,
ED is the duration of exposure,
BW is the average body weight, and
AT is the average duration of non-carcinogenic effects.
The groundwater exposure corresponding to dermal exposure was considered and calculated using Equation (11):
where
DAD is the average daily absorbed dose of pollutant by skin contact, TC is the duration of exposure,
K is the skin permeability coefficient of the hazardous substance,
SA is the surface area of exposed skin, and
EV is the average number of daily exposures. See
Table A1 and
Table A2 for relevant parameters.
The human health risk was calculated using Equations (12) and (13):
2.5.2. Source-Specific Human Health Risk Assessment
The receptor model is a mathematical method to analyze the source of pollutants based on environmental monitoring data. By analyzing the concentration characteristics of pollutants, the possible types, quantities, and contribution rates of emission sources can be deduced. Positive definite matrix factorization (PMF) is one of the receptor modeling methods recommended by the U.S. Environmental Protection Agency [
38]. Its use of correlation and covariance matrices to simplify high-dimensional variables does not rely on the original spectrum provided by the need for a priori knowledge in the parsing process, and can deal with imprecise data, making it a simple and effective method for pollutant source parsing [
39]. Its specific principles are described in
Appendix A.
4. Conclusions
The main goal of this study is to determine the key indicators affecting water quality through data analysis, to clarify the sources of human health risks, and to provide reference for water quality management departments. The XWQI was constructed by interpretable machine learning, and eight indicators were used to evaluate the groundwater quality in the study area. The human health risks of each indicator were calculated, and the pollution sources and health risk sources were identified by PMF. The overall groundwater situation in the study area is excellent. A total of 49% of the samples can be directly used as drinking water sources, 33% of the samples can also be drunk after simple treatment, and 18% of the samples are polluted and not suitable for drinking. The XWQI showed excellent performance, assigned weights to water quality indicators, and further confirmed zinc, chloride, and nitric acid as key pollution indicators through SHAP interpretability analysis. Among them, the contribution of zinc was the highest (0.82), and its concentration did not exceeded but was close to the critical value (0.968 mg/L), revealing the early warning value of “sub-threshold pollution risk”. The misjudgment case of the model further confirms the sensitivity characteristics of the water pollution boundary, and proves the rationality and reliability of XGBoost in the process of water quality evaluation. The PMF model analysis showed that the sources of pollution were agricultural activities, metal processing, metal smelting and mining, and natural sources. Among these, industrial pollution sources accounted for 82.2%, indicating that there is serious industrial pollution in the study area and that it should have a higher priority in governance. In addition, it was indicated that metal processing (57.22%) and smelting and mining (24.98%) were the two major sources of human health risks based on water quality.
This study greatly improves the credibility of the application of machine learning in water quality assessment. The inclusion of explainable analysis reveals the basis of judgment of black-box models, helps researchers to identify key indicators and quantify their influence, and improves the credibility of machine learning. The PMF intervention helped to identify groundwater pollution sources and human health risk sources, and successfully validated the correctness of the SHAP algorithm in identifying key water quality indicators and providing a reference for water quality management authorities.
