1. Introduction
The floating breakwater is an essential protective structure in the field of port and coastal engineering. It is crucial in preserving the stability of the water surface within its protected area, thereby facilitating the safe operation of ports and safeguarding coastlines against damage caused by wave activity [
1]. Consequently, the development and deployment of floating breakwaters have increased, as they facilitate improved water exchange, expedite construction timelines, and reduce the demand for construction materials. Recently, proposals have been put forward for the development of an artificial floating island in Baa Atoll, Maldives, which necessitates the implementation of a floating breakwater system to ensure the adequate protection for the island [
2]. Consequently, the planar layout emerges as a crucial factor in the design of the floating breakwater system that will encircle the central artificial island.
In recent decades, scholars have introduced a range of structural designs for floating breakwaters, notably including the pontoon-type, which constitutes the fundamental form of a reflective breakwater. Liu et al. [
3] employed Smoothed Particle Hydrodynamics (SPH) to investigate the hydrodynamic performance of submerged square box breakwaters. Meanwhile, Duan et al. [
4] developed a boundary element method grounded in Taylor expansion to evaluate and compare the hydrodynamic performance of perforated and box-type floating breakwaters. Dong et al. [
5] performed two-dimensional physical model tests to determine the wave transmission coefficients of three distinct breakwater types under regular wave conditions, both in the presence and absence of currents. The hydrodynamic behavior of floating breakwaters was examined by He et al. [
6] using a wave flume, both with and without the incorporation of pneumatic chambers. A two-dimensional experimental analysis to evaluate the hydrodynamic efficiency was conducted by Koraim and Rageh [
7], focusing on the wave transmission, reflection, and energy dissipation coefficients of a floating breakwater system consisting of a rectangular box and a series of plates. Furthermore, Shen et al. [
8] carried out an experimental investigation into the wave reduction capabilities of an innovative floating breakwater design that integrates twin pontoons and several porous vertical plates. Their findings indicated that this new design is more effective in wave reduction compared to the traditional single pontoon model. Similarly, Chen et al. [
9] demonstrated that the double-pontoon floating breakwater exhibits superior wave attenuation performance relative to the single-pontoon design. Gesraha [
10] conducted an investigation into the performance of a rectangular breakwater that was enhanced with two vertical side-boards, resembling the shape of the Greek letter A. The findings indicated that the modified breakwater exhibited reduced exciting forces and heave damping, while other hydrodynamic coefficients increased, resulting in decreased wave transmission. Several studies have also been conducted on the interactions between two floating bodies in wave conditions [
11,
12]. In a recent study, Qiu et al. [
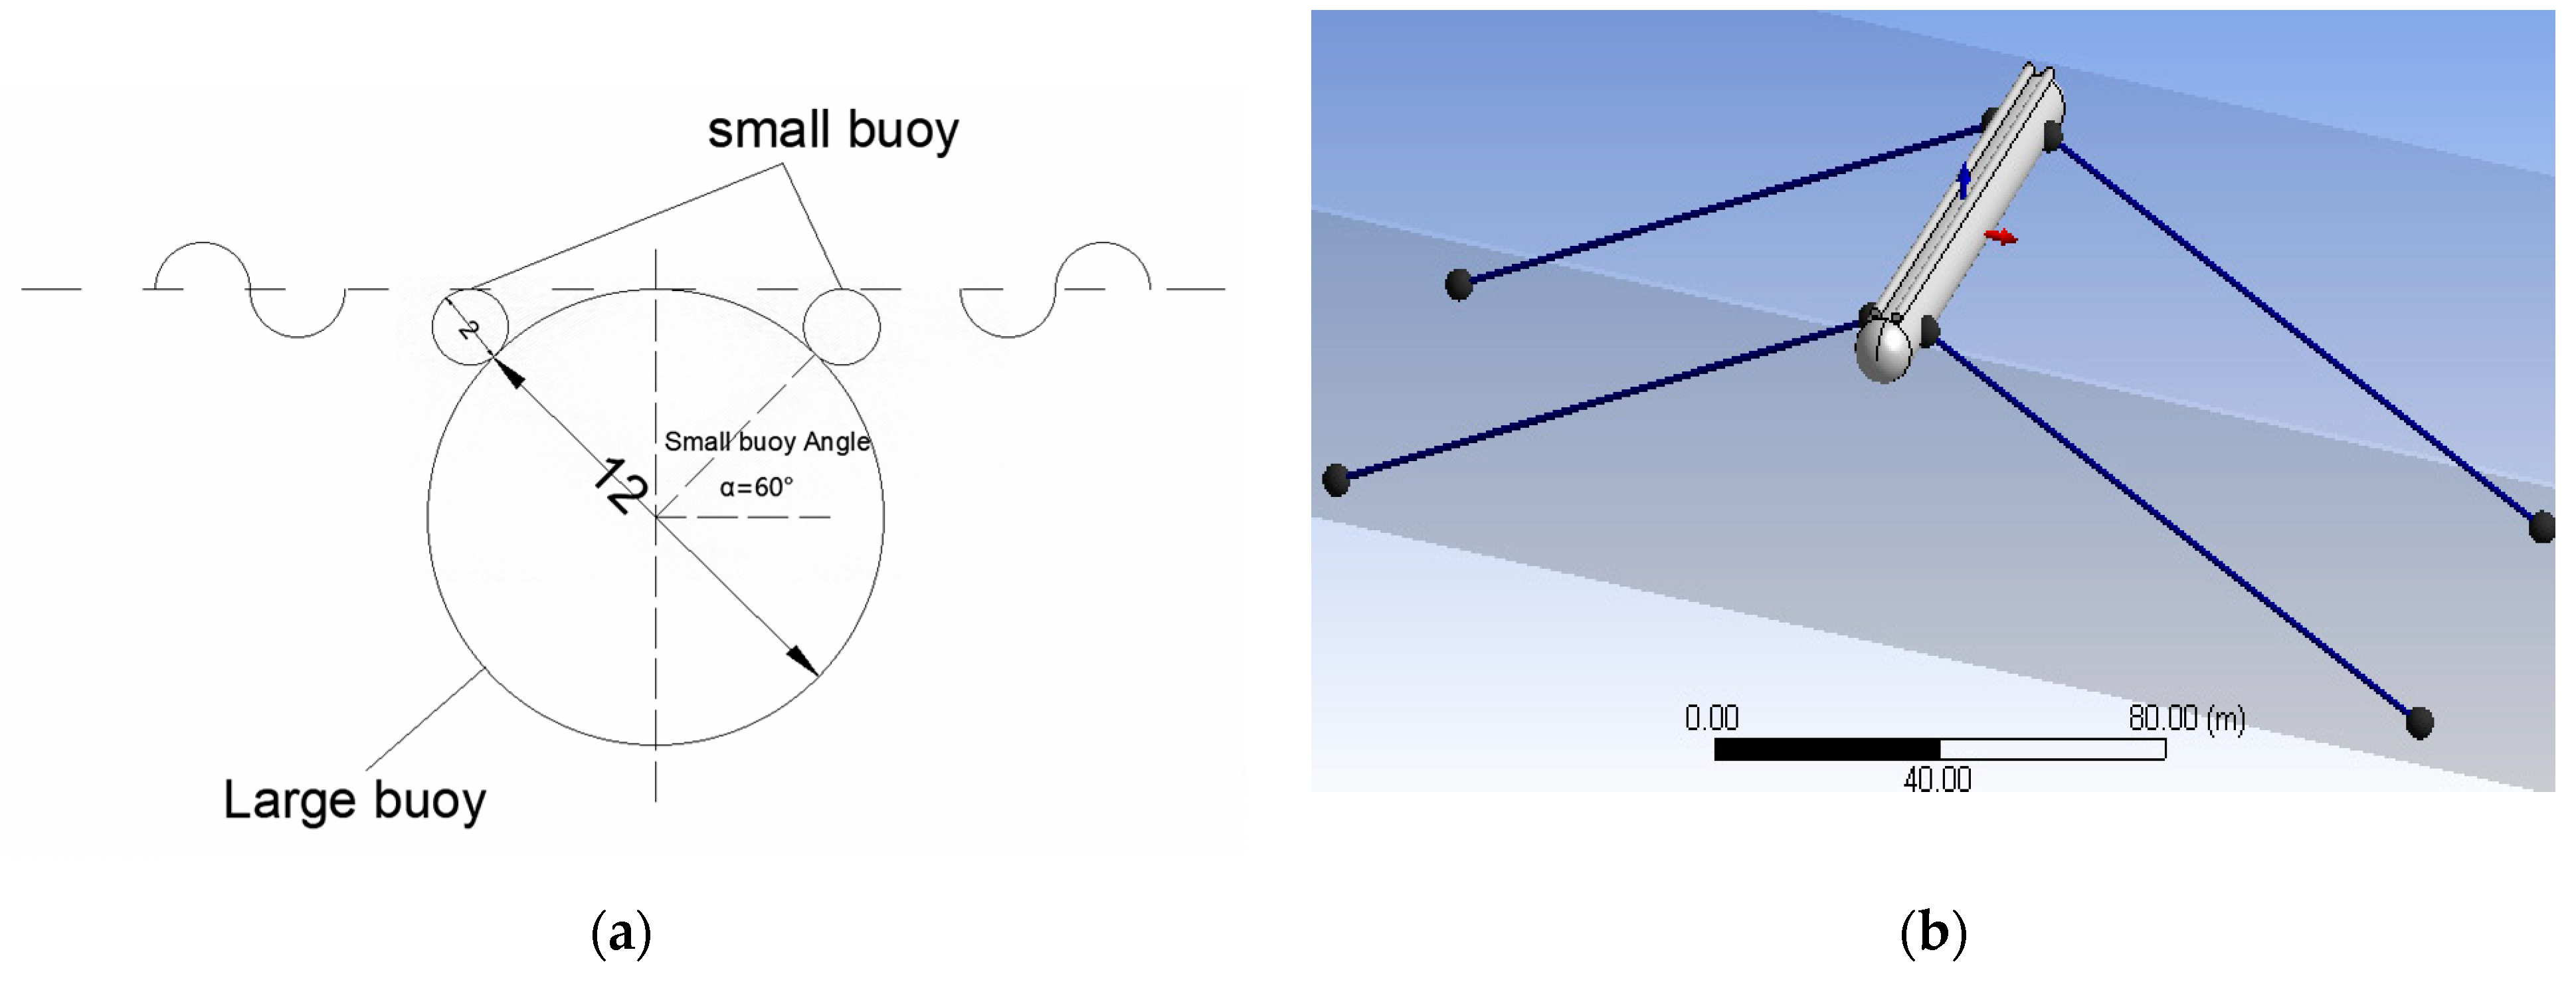
13] introduced an innovative floating breakwater design that incorporates multiple horizontal cylinders. This design includes a primary submerged cylinder intended to reflect wave energy and two smaller cylinders positioned near the surface to facilitate wave energy dissipation. The floating breakwater is distinguished by its simplicity, ease of installation, and effective wave dissipation capabilities, and it was temporarily employed during the construction of Ashdod Port in Israel. Subsequently, Zang et al. [
2] conducted an investigation into various parameters affecting the wave transmission coefficient of this type of floating breakwater and developed an empirical formula to quantify it. Additionally, their research examined factors influencing the maximum total mooring force and proposed an empirical formula for use in practical engineering applications.
The performance, stability, and safety of a floating breakwater are significantly influenced by its anchorage to the seabed through the mooring chain. Loukogeorgaki et al. [
14] conducted experiments demonstrating that the wave period has a substantial impact on the hydroelastic and structural behavior of a moored pontoon-type floating breakwater, whereas wave height and angle predominantly affect this response at low frequencies. Ozeren et al. [
15] carried out a laboratory study to investigate the interaction of cylindrical breakwaters with monochromatic waves in both deep and transitional water depths. López et al. [
16] showed that the configuration and characteristics of the mooring chain play a crucial role in determining the heaving amplitude of the floating breakwater. It is important to recognize that increasing the stiffness of the mooring system can modify the natural frequency of the entire system. Therefore, the natural frequency and motion displacement amplitude of the floating breakwater can be optimized by carefully designing the layout and material strength of the anchorage system. This strategy not only reduces the costs associated with the construction of the mooring system but also enhances wave energy absorption, thereby improving the wave attenuation process [
17,
18].
The aforementioned studies primarily focus on individual units of floating breakwaters. However, in practical applications, these units are typically interconnected. Ji et al. [
19] investigated a novel cylindrical floating breakwater system through three-dimensional experiments, which provided data on wave transmission, reflection, and motion responses under various sea conditions. Kou et al. [
20] examined a very large floating ocean structure that incorporates a navigation channel designed for storm avoidance. Their experimental findings indicate that, under head sea conditions, the channel’s width at the top exhibits minimal variation, and the flexible connecting loads are generally reduced. Additionally, the loads at the top of the channel are consistently lower compared to those at the middle and bottom, across all sea conditions. Conversely, when the channel is open, rigid connecting loads in the middle of the semi-ring structures increase. The study by Martinelli et al. [
21] demonstrates that floating breakwater configurations can mitigate wave impact and loads when subjected to oblique waves; however, complex configurations exert greater influence on moorings and connectors under perpendicular wave conditions. Landmann et al. [
22] conducted experiments on floating vegetation-based islands, assessing their efficacy in wave damping, stability, and water interaction. These islands, akin to traditional floating breakwaters, rely significantly on width for optimal layout in riverine and still water environments. Zhang et al. [
23] identified L-shaped and barge frame floating breakwaters as effective in wave attenuation and motion control, with oblique orientations enhancing their performance. Ge et al. [
24] proposed an arc configuration for floating breakwaters to enhance effectiveness across multiple wave directions. Their analysis indicates that linear configurations exhibit pronounced rocking in cross waves, whereas curved configurations offer stable motion and superior hydrodynamic performance in both normal and oblique wave scenarios. Mao et al. [
25] propose an arcuate layout for floating breakwaters, demonstrating that this configuration significantly reduces both first- and second-order wave forces compared to linear layouts, while also standardizing section loads across various wave directions. Cebada-Relea et al. [
26] conducted a numerical study on the forces exerted on module connectors in a modular pontoon breakwater under both regular and irregular oblique wave conditions. Their findings indicate that simulations considering only regular waves substantially underestimate the maximum connection forces. Tang et al. [
27] examined the influence of breakwater layouts on coastal waves, currents, sediment transport, and beach evolution, utilizing this analysis to investigate various breakwater configurations and their effects on coastal dynamics.
The current numerical model was developed utilizing ANSYS-AQWA software, similar to the approach employed by Zang et al. [
2]. This research examines the influence of planar configuration on the mean transmission coefficients within the area enclosed by the floating breakwaters, taking into account a variety of influential parameters. These parameters include the dimensions of the navigation channel opening, the planar dimensions of the floating breakwater system, the type of mooring chains, and the incident wave height, wave period, and wave directions, among others. Furthermore, this study assesses the effect of the shape of the floating gate in the navigation channel on the wave dissipation performance of the floating breakwater system.
3. Numerical Results and Discussion
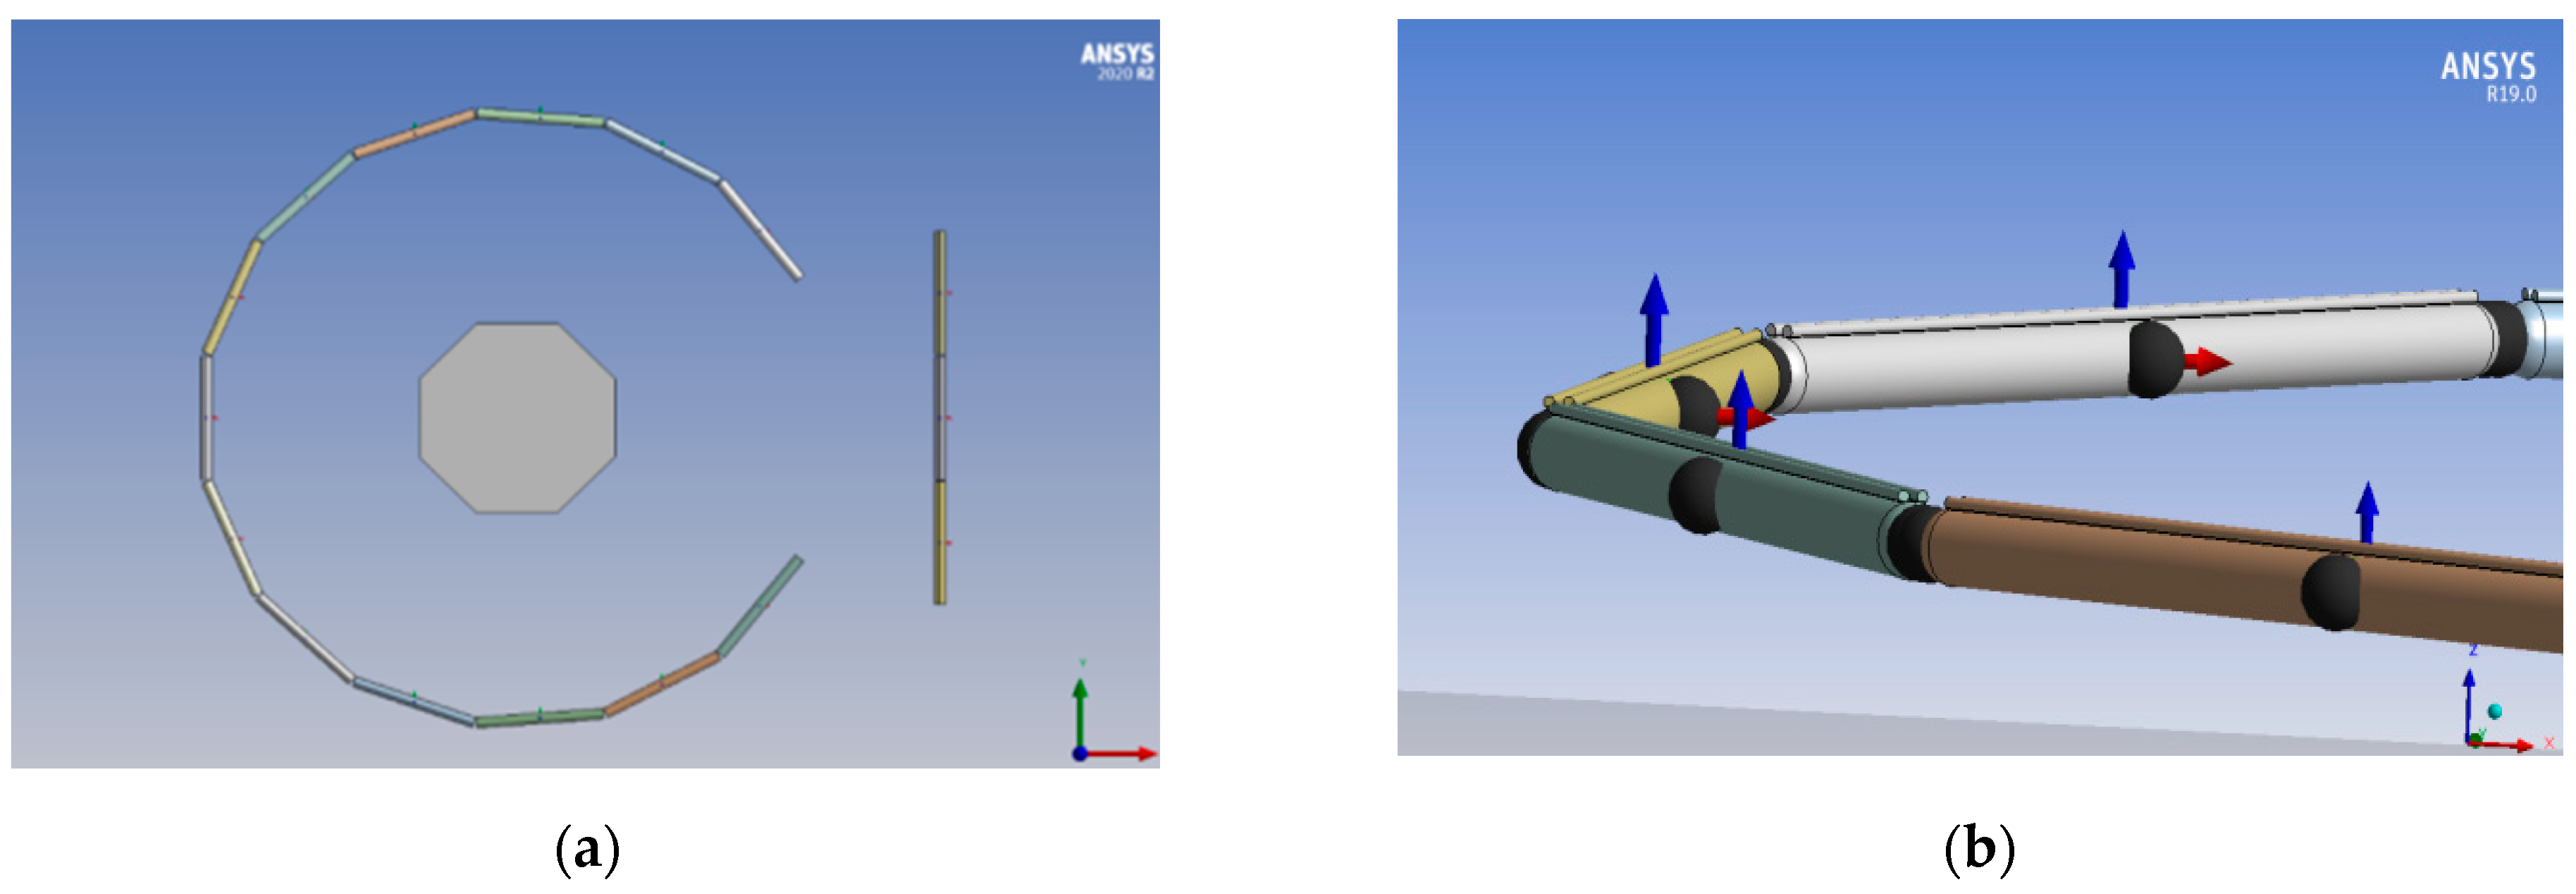
The numerical model for the floating breakwater surrounding an artificial floating island is established as shown in
Figure 2a, with a large buoy diameter of 12.0 m and a small buoy diameter of 2.0 m. Each unit of the breakwater has a length of 50.0 m. In this study, the wave field within the encompassed area of the artificial island by the floating breakwater is mainly analyzed, and the optimized planar layout of the floating breakwater system is investigated. The main influential parameters, including the opening size of the floating breakwater system, the planar size of the floating breakwater system, the wave direction, wave height, wave period, and the shape of the harbor gate on the transmission coefficient in the shielding area are investigated.
Unless otherwise specified, the simulations in the following sections utilized regular waves with a height of
Hi = 0.40 m and period
T = 6.0 s. These values align with typical wave conditions observed in the Baa Atoll, Maldives, ensuring relevance to the case study. The use of regular waves simplifies the analysis of wave-structure interactions and provides a baseline for evaluating the breakwater’s performance under moderate conditions. Extreme wave conditions (
Hi = 2.0~4.5 m) are explored in
Section 3.4 to assess the system’s robustness under severe environmental loads. In the present study, we based our conclusions on the average wave amplitude distribution and the resultant transmission coefficient in the sheltered area by the floating breakwater. The transmission coefficient is the most critical parameter for quantifying the wave dissipation performance of a breakwater, a parameter that has also been employed in numerous other studies [
5,
8].
3.1. Effect of the Opening Size of the Floating Breakwater System
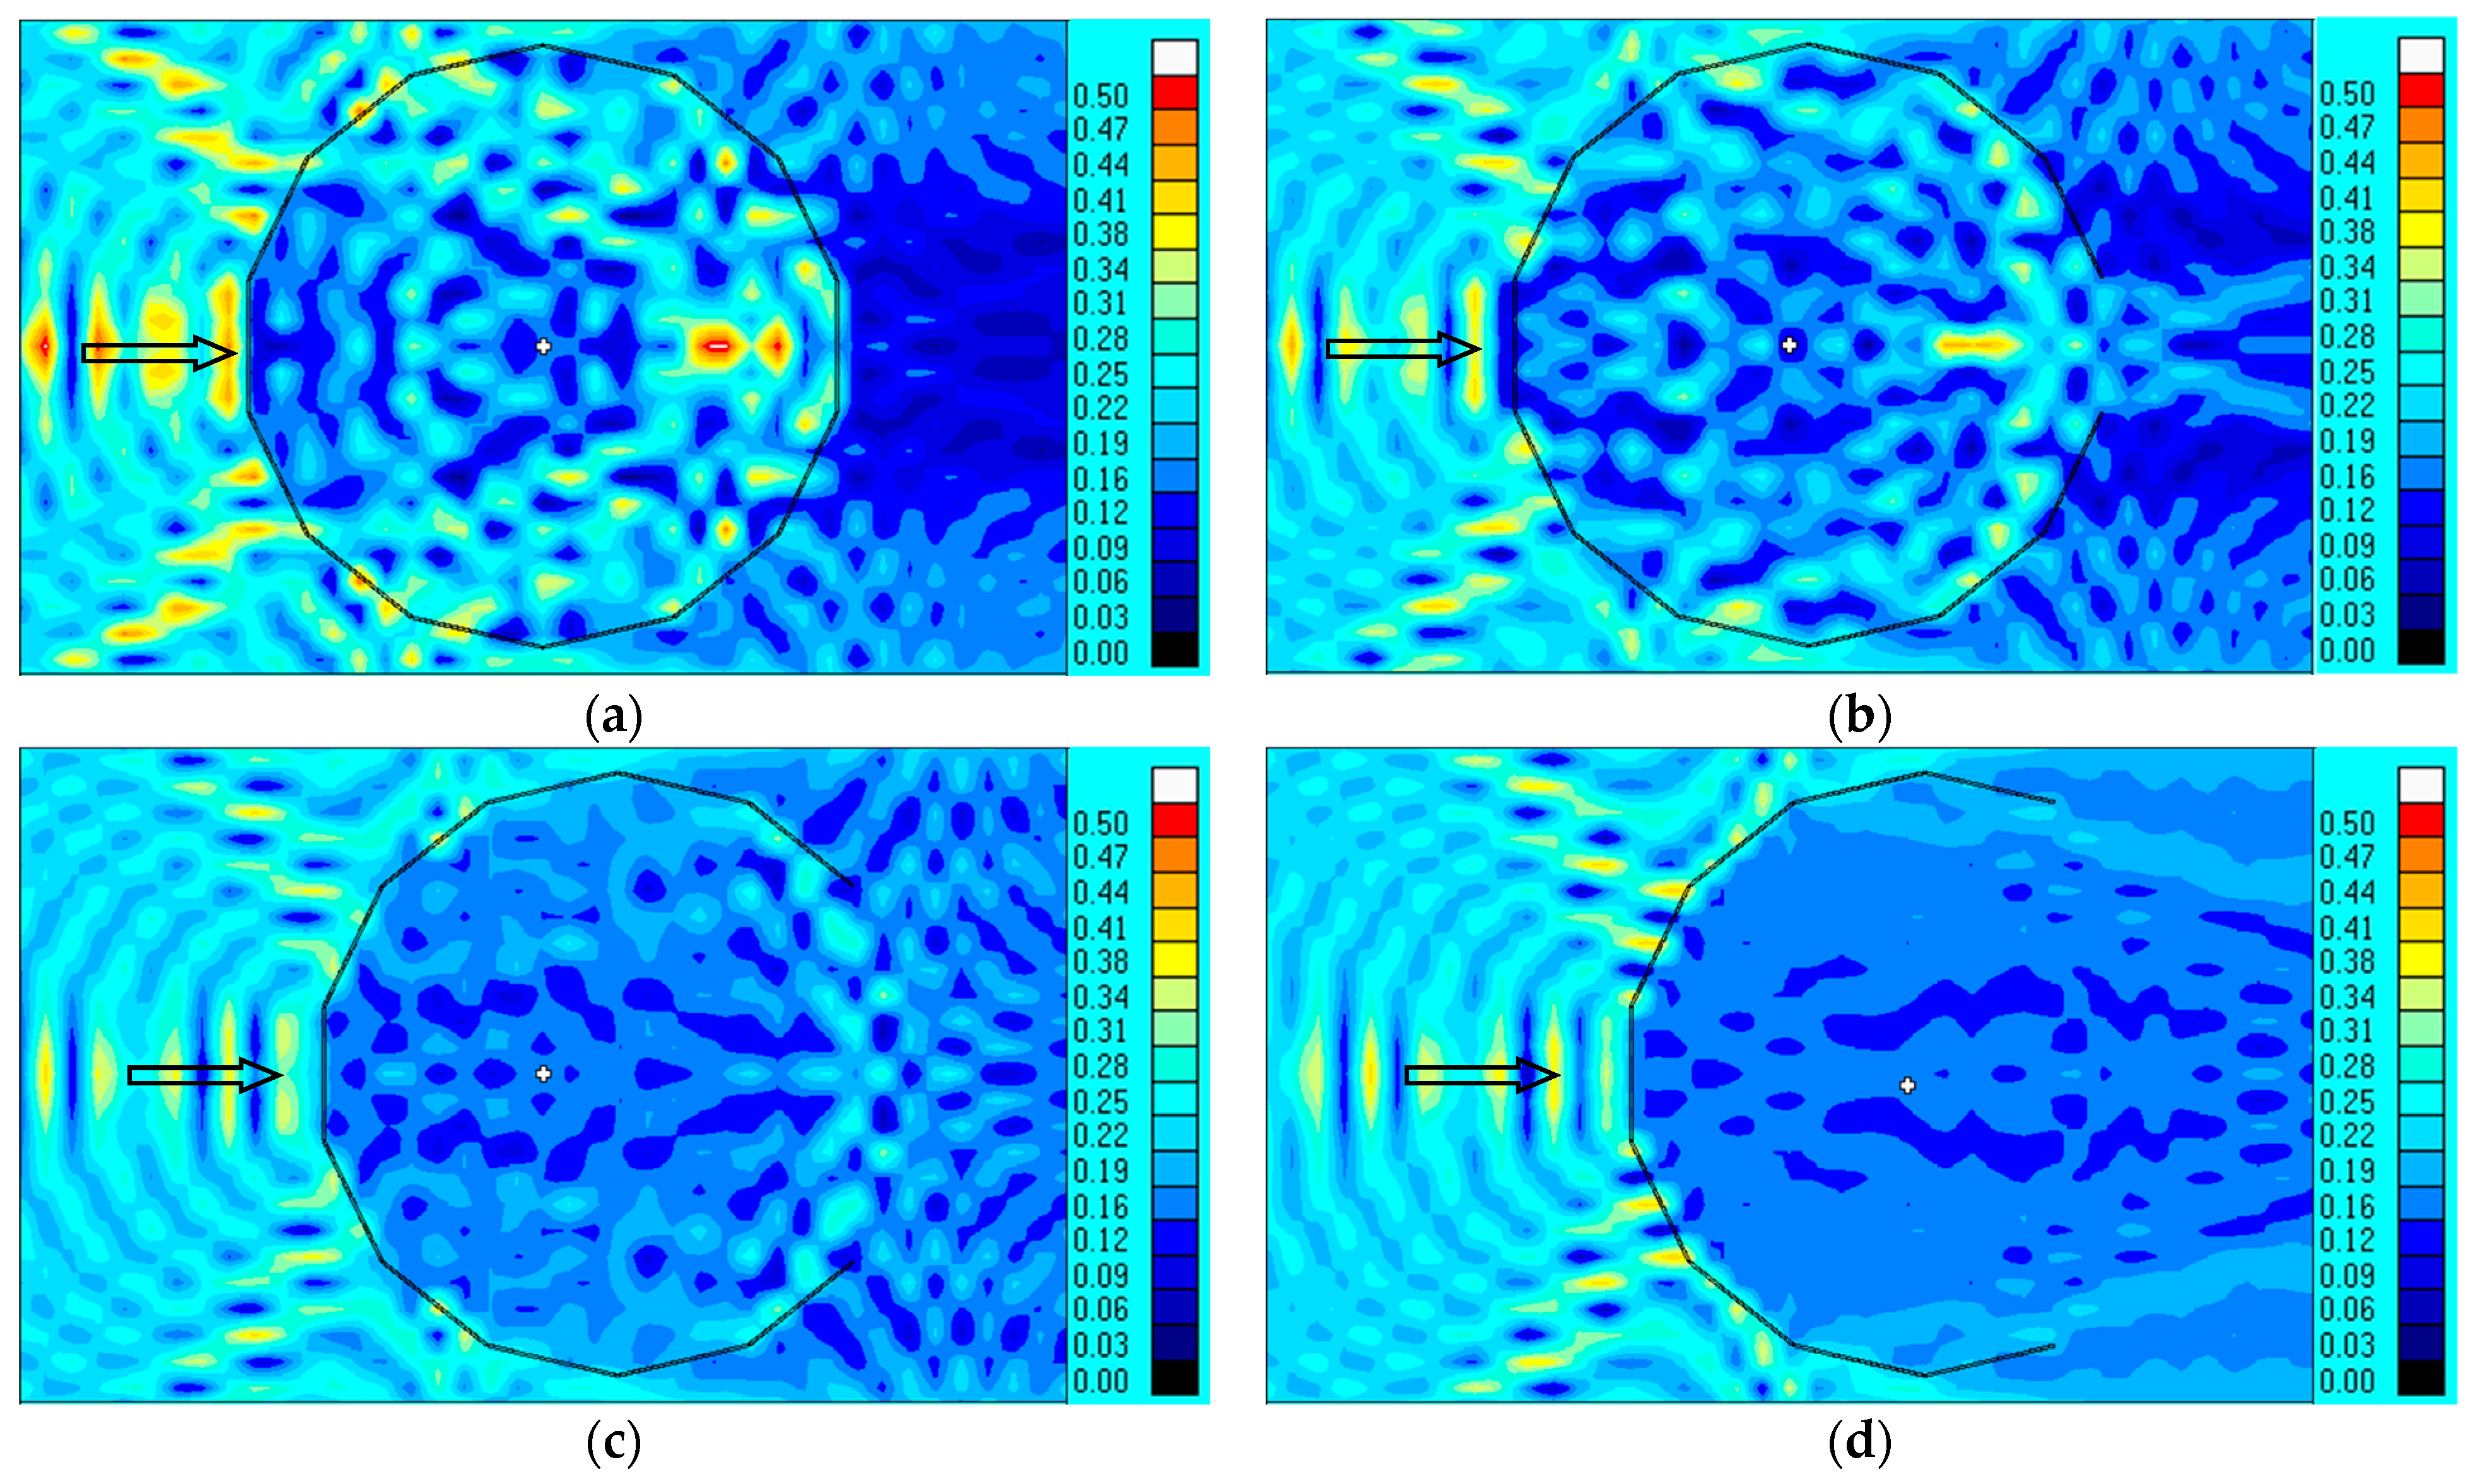
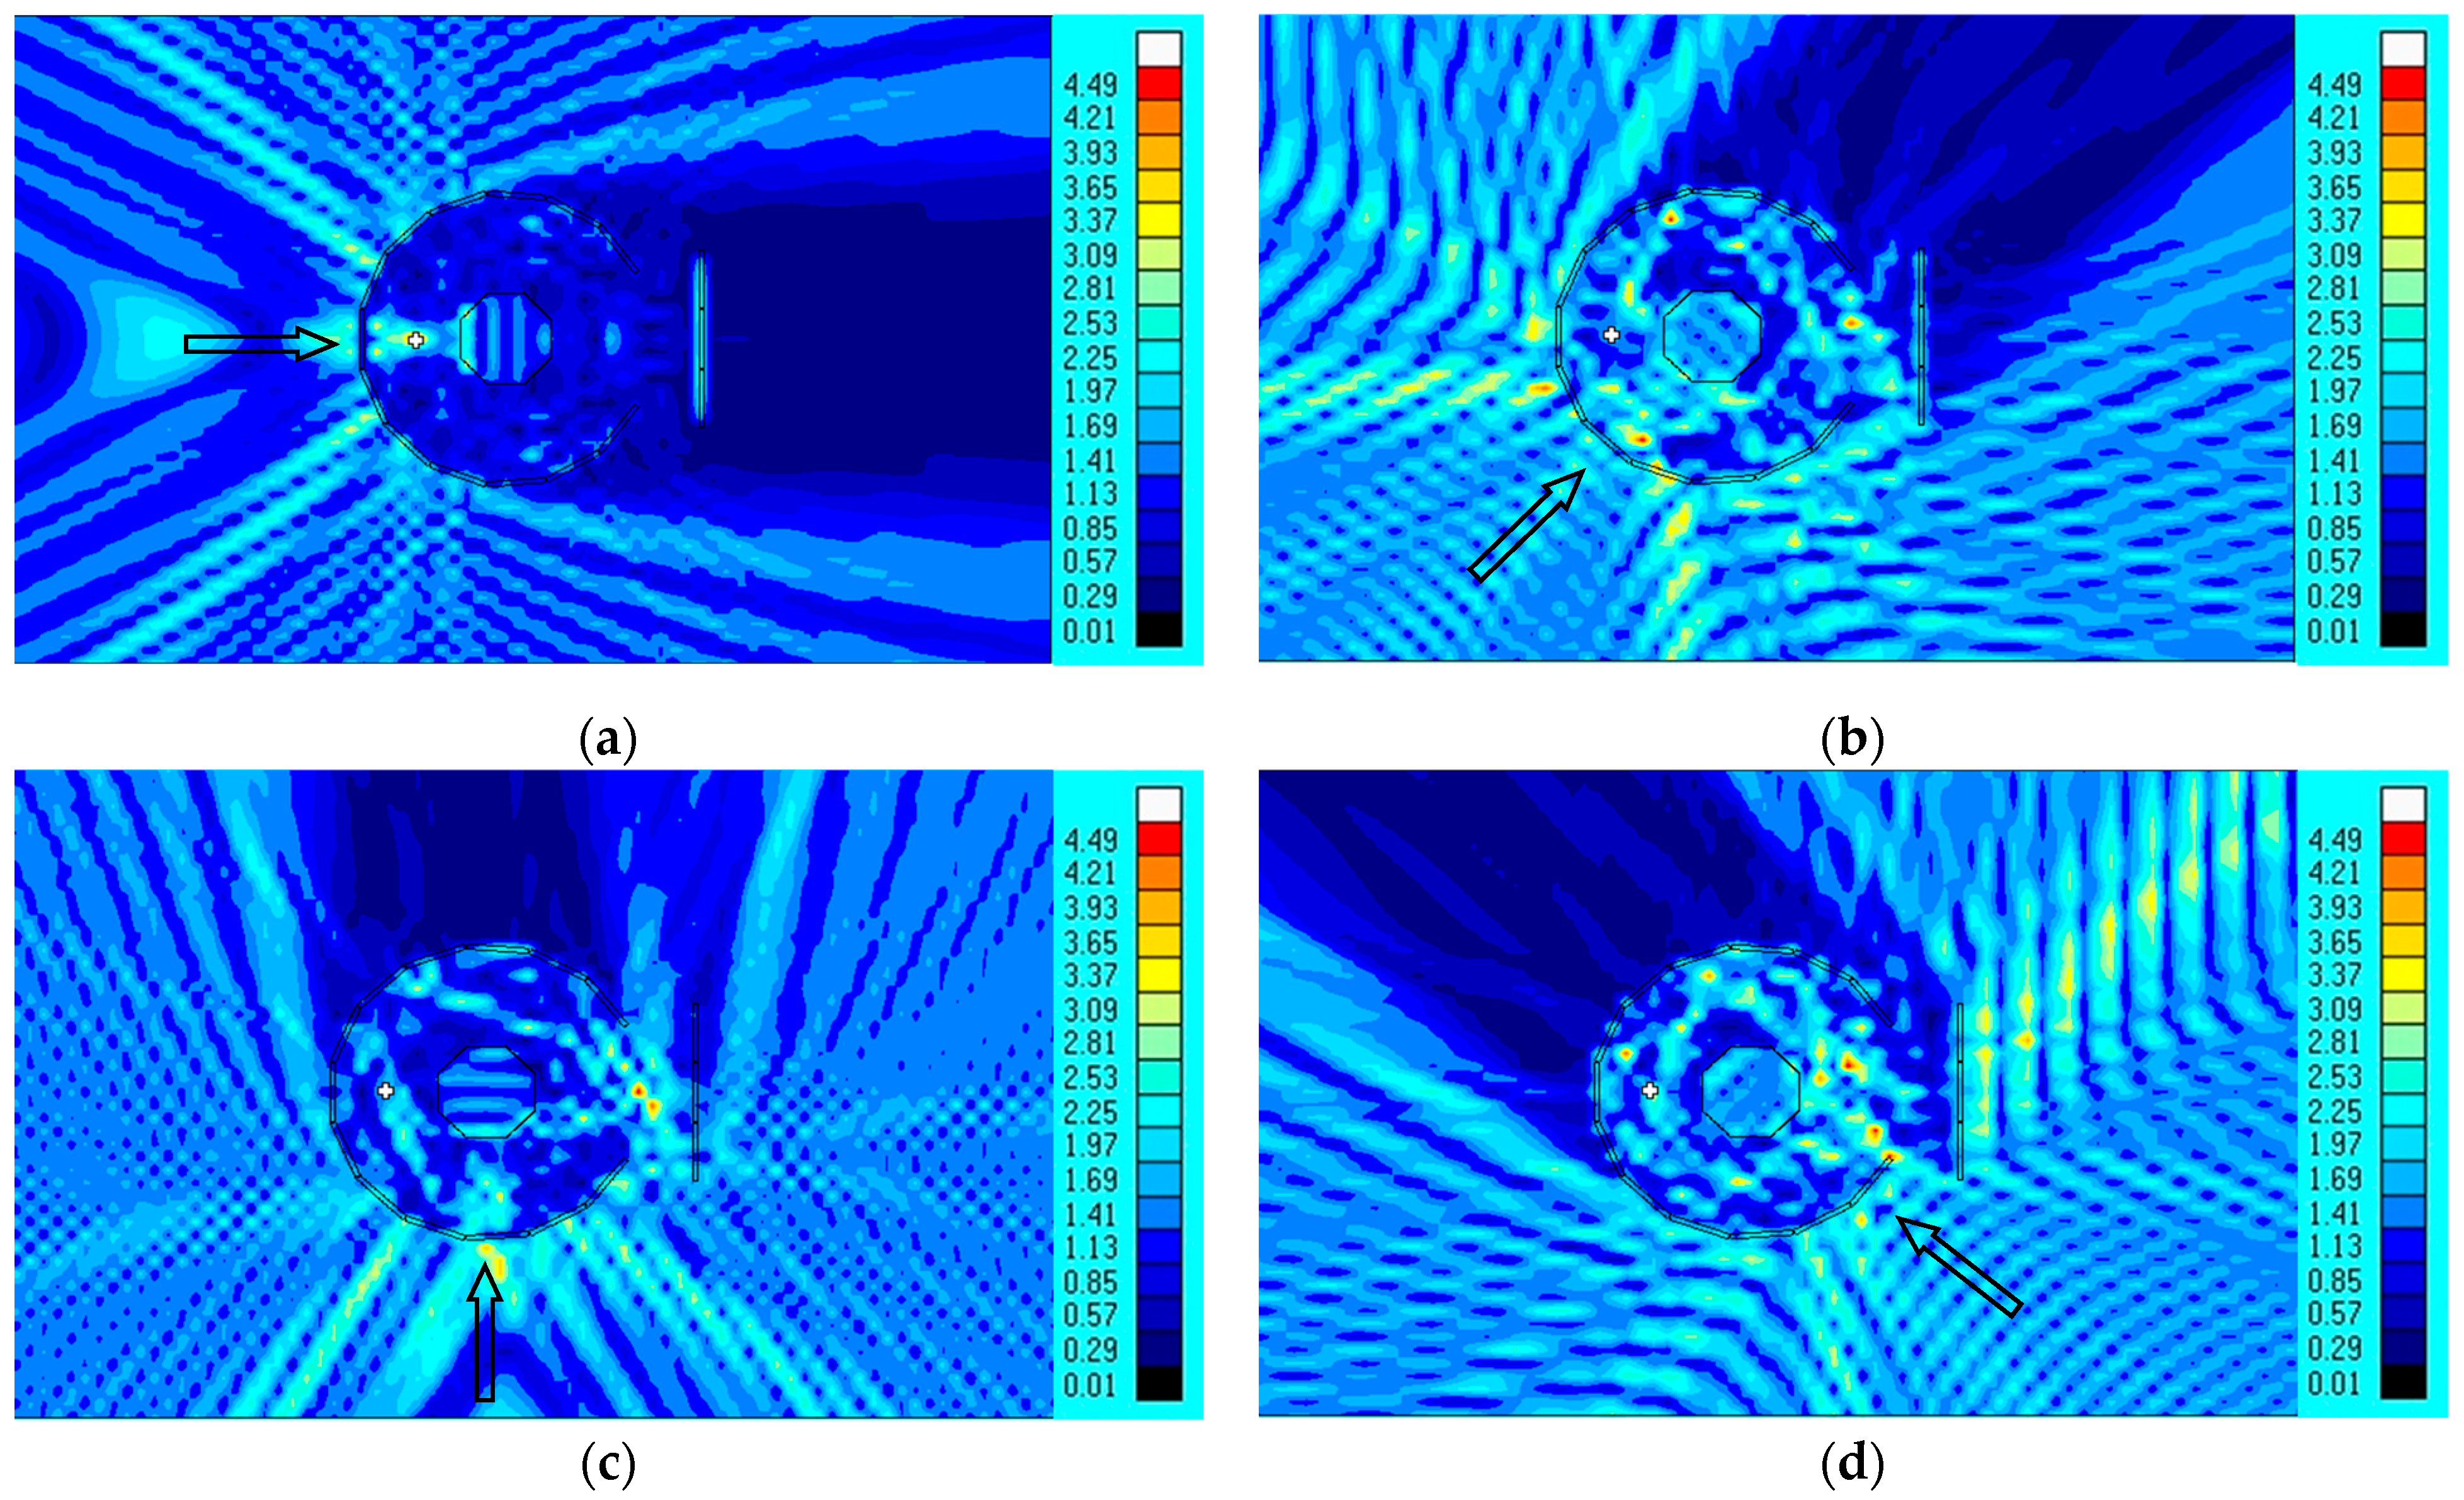
Firstly, the influence of the opening angle of the circular floating breakwater system was studied. The diameter of the floating breakwater system was 400 m. The opening angles, which are the arch angle of the opening on the floating breakwater system, were selected as 0°, 25°, 75°, and 125°, respectively. The contour map of the wave height inside and outside the floating breakwater for different opening angles are shown in
Figure 5. All simulations were conducted with a wave height of
Hi = 0.40 m, wave period of
T = 6.0 s, and a catenary mooring system.
As shown in
Figure 5a,b, wave heights increase significantly in the inner area and near the right half of the floating breakwater system when the opening angle is 0° or 25°. This is caused by the superposition of incident waves passing through the left half of the breakwater and waves reflected by the right half. The sudden increase in wave amplitude is not suitable to the stability and safety of the central floating island and cannot be used in actual engineering. As the opening angle increases (for example, when the opening angle equals 75° or 125°, as shown in
Figure 5c,d), some wave energy can be released outside the floating breakwater system through the opening, thereby alleviating the wave height inside the breakwater and causing the wave amplitude behind the floating island to gradually decrease or even be relatively flat.
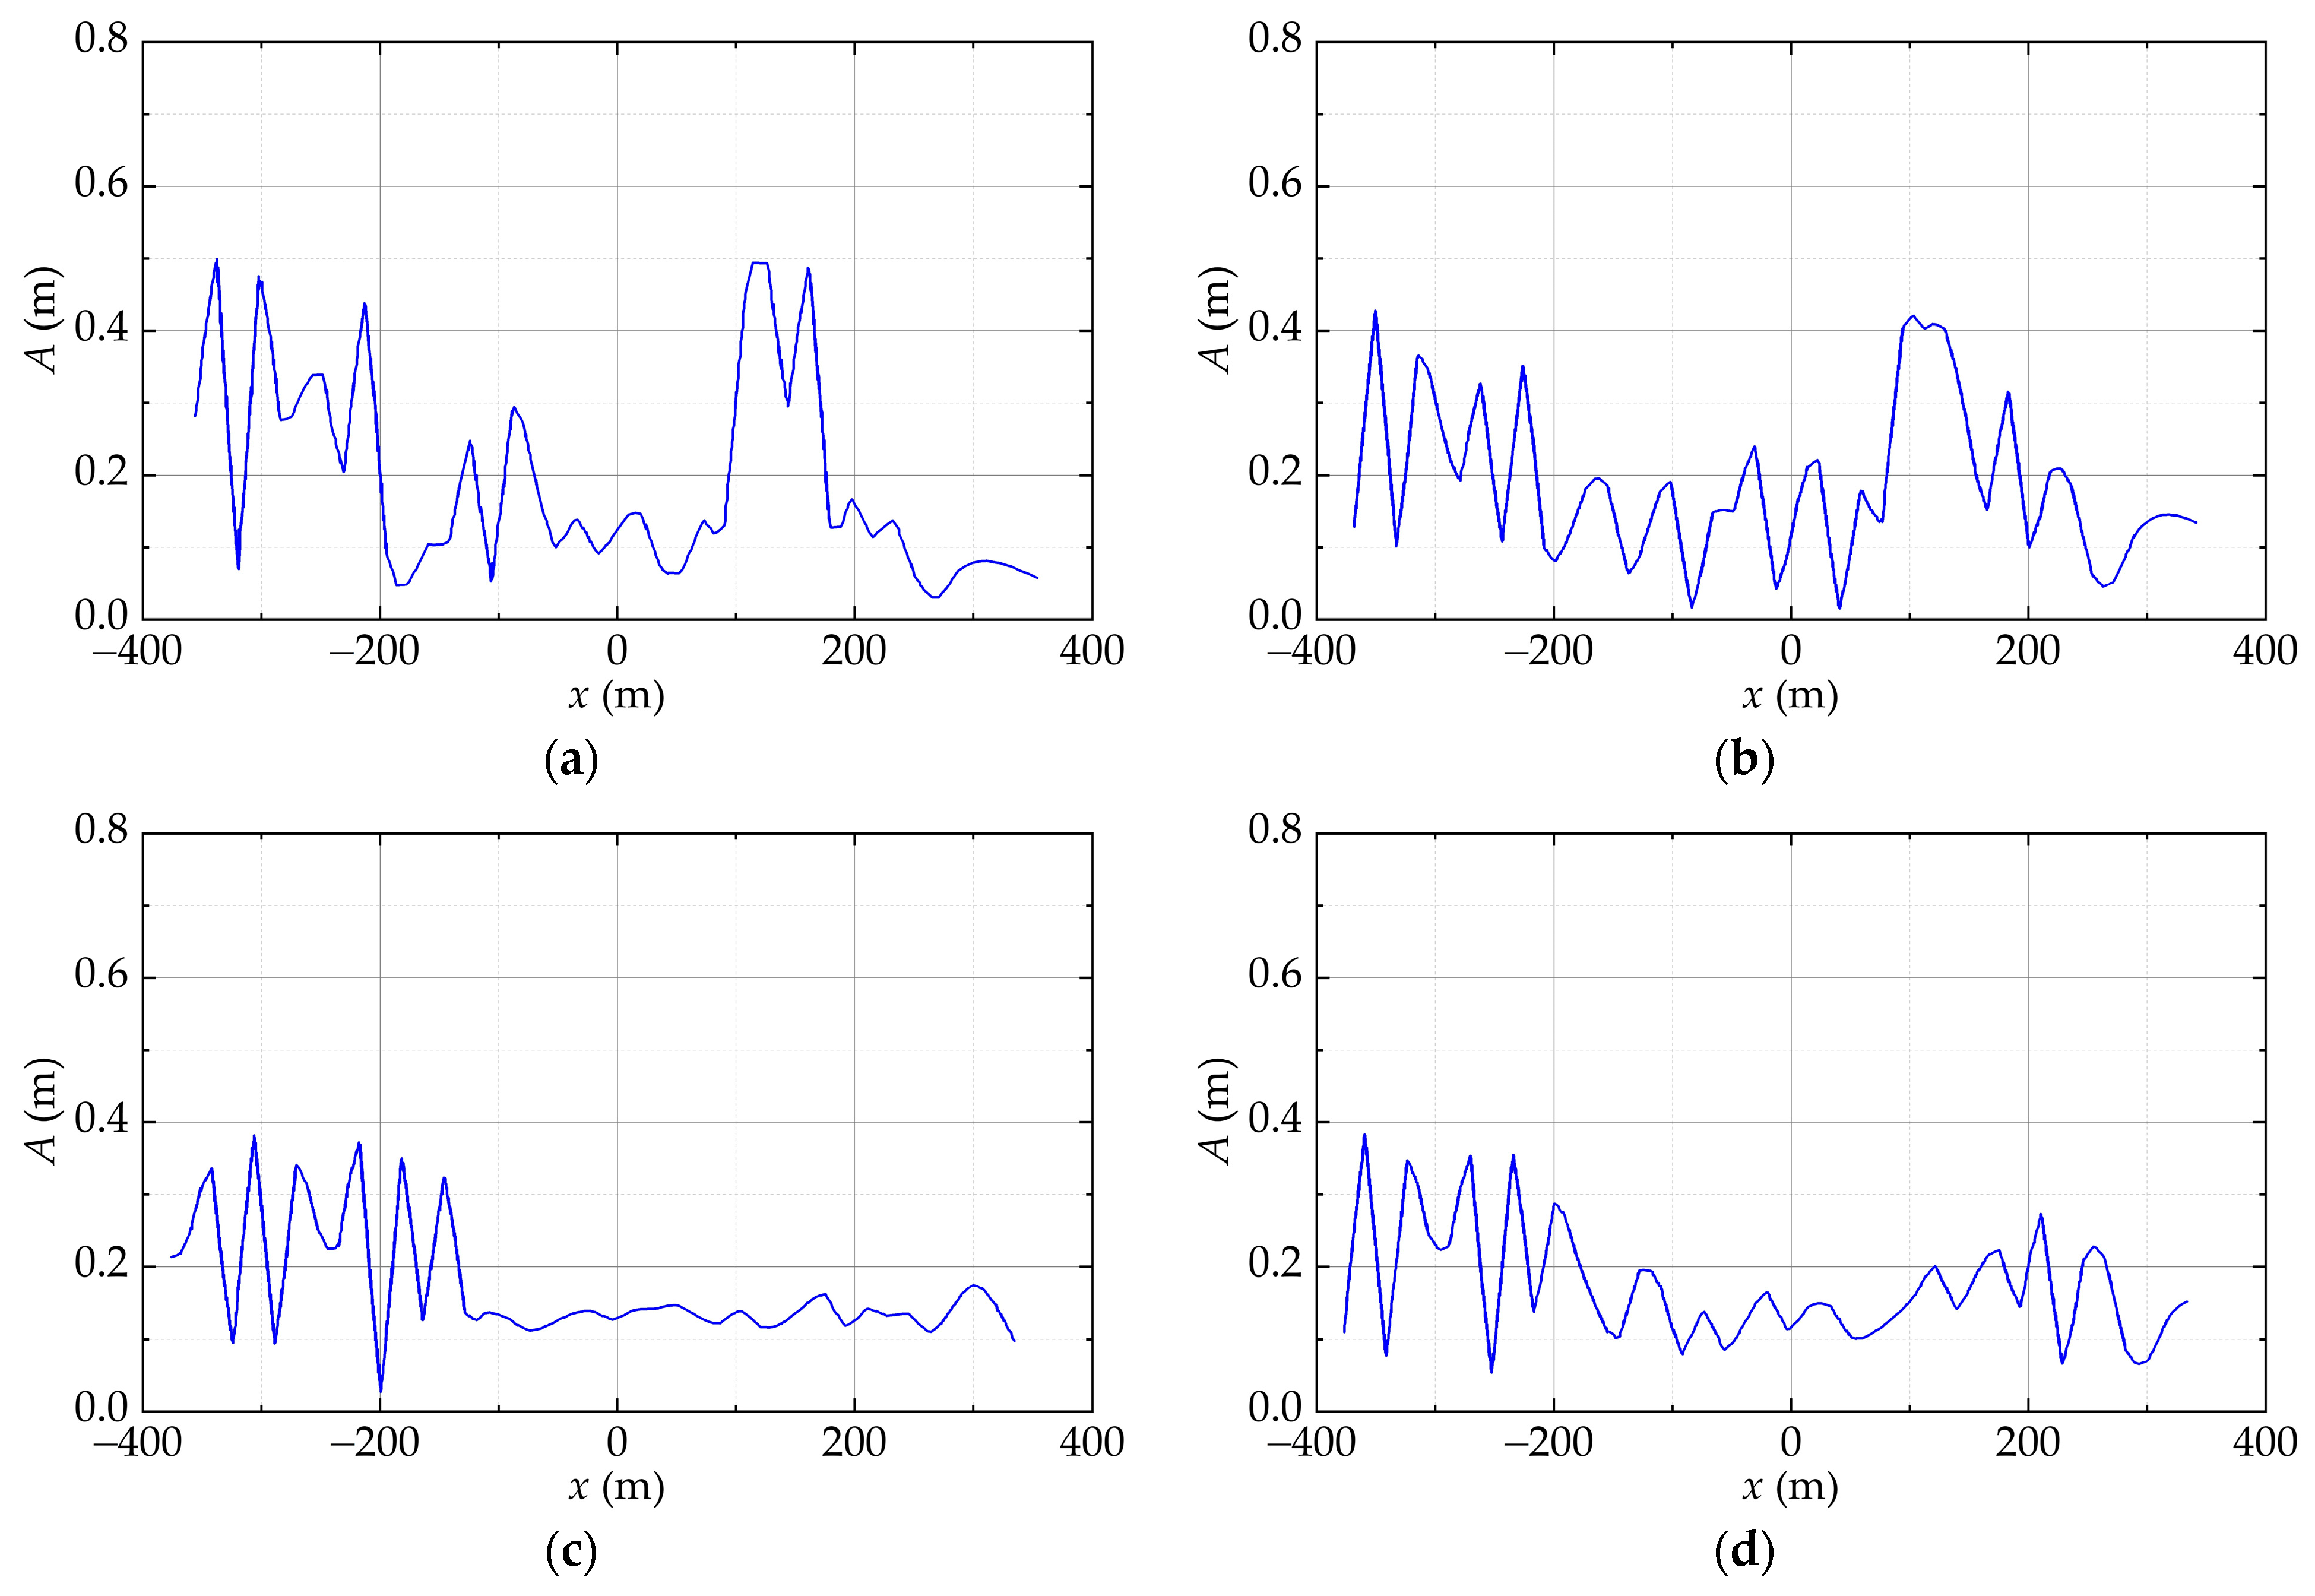
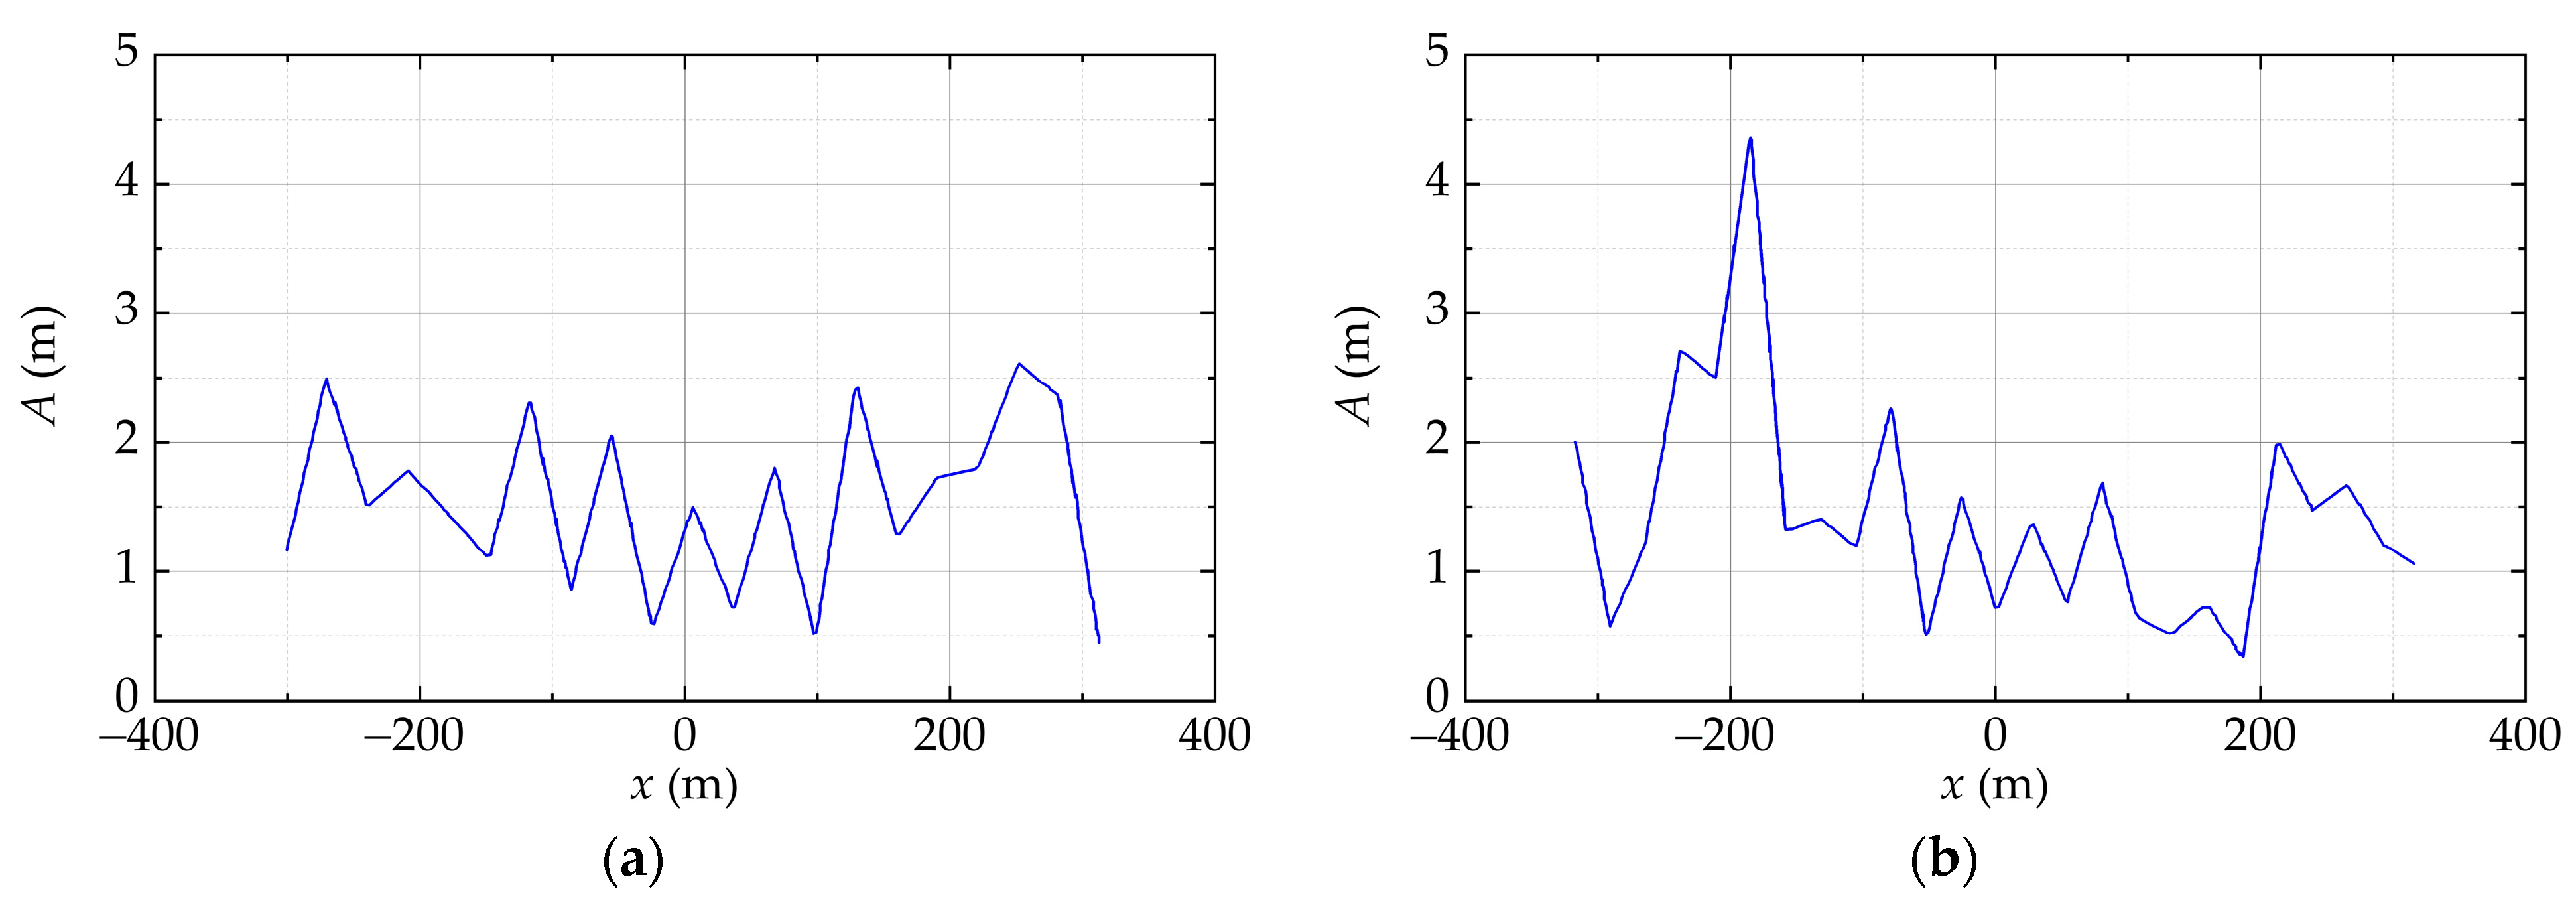
To quantitatively analyze the wave dissipation performance of the floating breakwater, the wave amplitude along the centerline of the floating breakwater is extracted from the contour map of the wave amplitude, as shown in
Figure 5. As shown in
Figure 6, the variations of the wave amplitude along the centerline when the waves propagate from left to right can be clearly seen. In
Figure 6, the range of −200 m to 200 m is the scope of the floating breakwater. When x < −200 m, i.e., the outside of the floating breakwater, the wave amplitudes are generally large (>0.40 m) for all cases, due to the superimposition of the incident waves and the reflected waves from the left half of the floating breakwater system. However, the wave amplitude shows different distributions within the scope of the floating breakwater (−200 m < x < 200 m). For the opening angles of 0° and 25°, as shown in
Figure 6a,b, the wave height reaches values exceeding 0.40 m within the range of 100 m to 200 m, due to the reflection of waves by the right half of the breakwater with a small opening. The corresponding wave transmission coefficients are 0.80 and 0.84, respectively. Generally, with the increases of the opening angle, the wave amplitude near the right half of the breakwater decreases. In this study, the mean values of the wave transmission coefficient, calculated within the spatial domain of the floating breakwater (−200 m < x < 200 m), are employed as the primary parameter for quantifying wave dissipation performance. For opening angles of 75° and 125°, the wave transmission coefficients are 0.64 and 0.62, respectively, as shown in
Figure 6c,d. The wave transmission coefficient for an opening angle of 75° is marginally higher compared to that of 125°. However, given that larger opening angles present increased challenges in the design of harbor gates, we have opted for an opening angle of 75° for the floating breakwater system. This decision balances the wave dissipation performance with the construction complexity of the harbor gate.
Overall, when the opening angle of the breakwater is around 75°, the semi-circular state has the best wave dissipation effect. As the opening angle increases, the effective coverage area decreases. However, the proposed area is located in the open sea, far from the land, and the sea conditions are very complex and variable. Factors such as wind, waves, and currents at sea, which affect the stability and safety of the breakwater and the central floating island usually come from various directions; therefore, as many coverage areas as possible are needed. On the contrary, if the opening angle is too small, it will generate secondary reflection, which will also affect the wave attenuation effect. From the perspective of this actual project, the opening size of the circular floating breakwater should not be too large, so the optimal opening angle is considered to be around 75°.
3.2. Effect of the Planar Size of the Floating Breakwater System
This section of the study aims to investigate the influence of the planar size of the floating breakwater on the efficacy of wave elimination. The diameter of the floating breakwater system has values of
L = 800 m, 500 m, 300 m, and 200 m. The performance of the floating breakwater system improves as the spacing between the floating island and the breakwater increases as shown in
Figure 7. This is attributed to the fact that larger spacing results in a greater breakwater radius, leading to increased energy consumption during the transmission of incident waves. Consequently, the average wave height at the center is elevated, thereby diminishing the system’s performance. However, it should be noted that a larger breakwater radius necessitates more construction materials and a larger water area, which may impede cost control measures for the breakwater. When the diameter of the floating breakwater system measures 300 m, the transmission coefficient is calculated to be 0.60, a value that is lower than those observed at other planar sizes. Under these conditions, the stability degree and cost angle of the wave field are found to satisfy the engineering requirements.
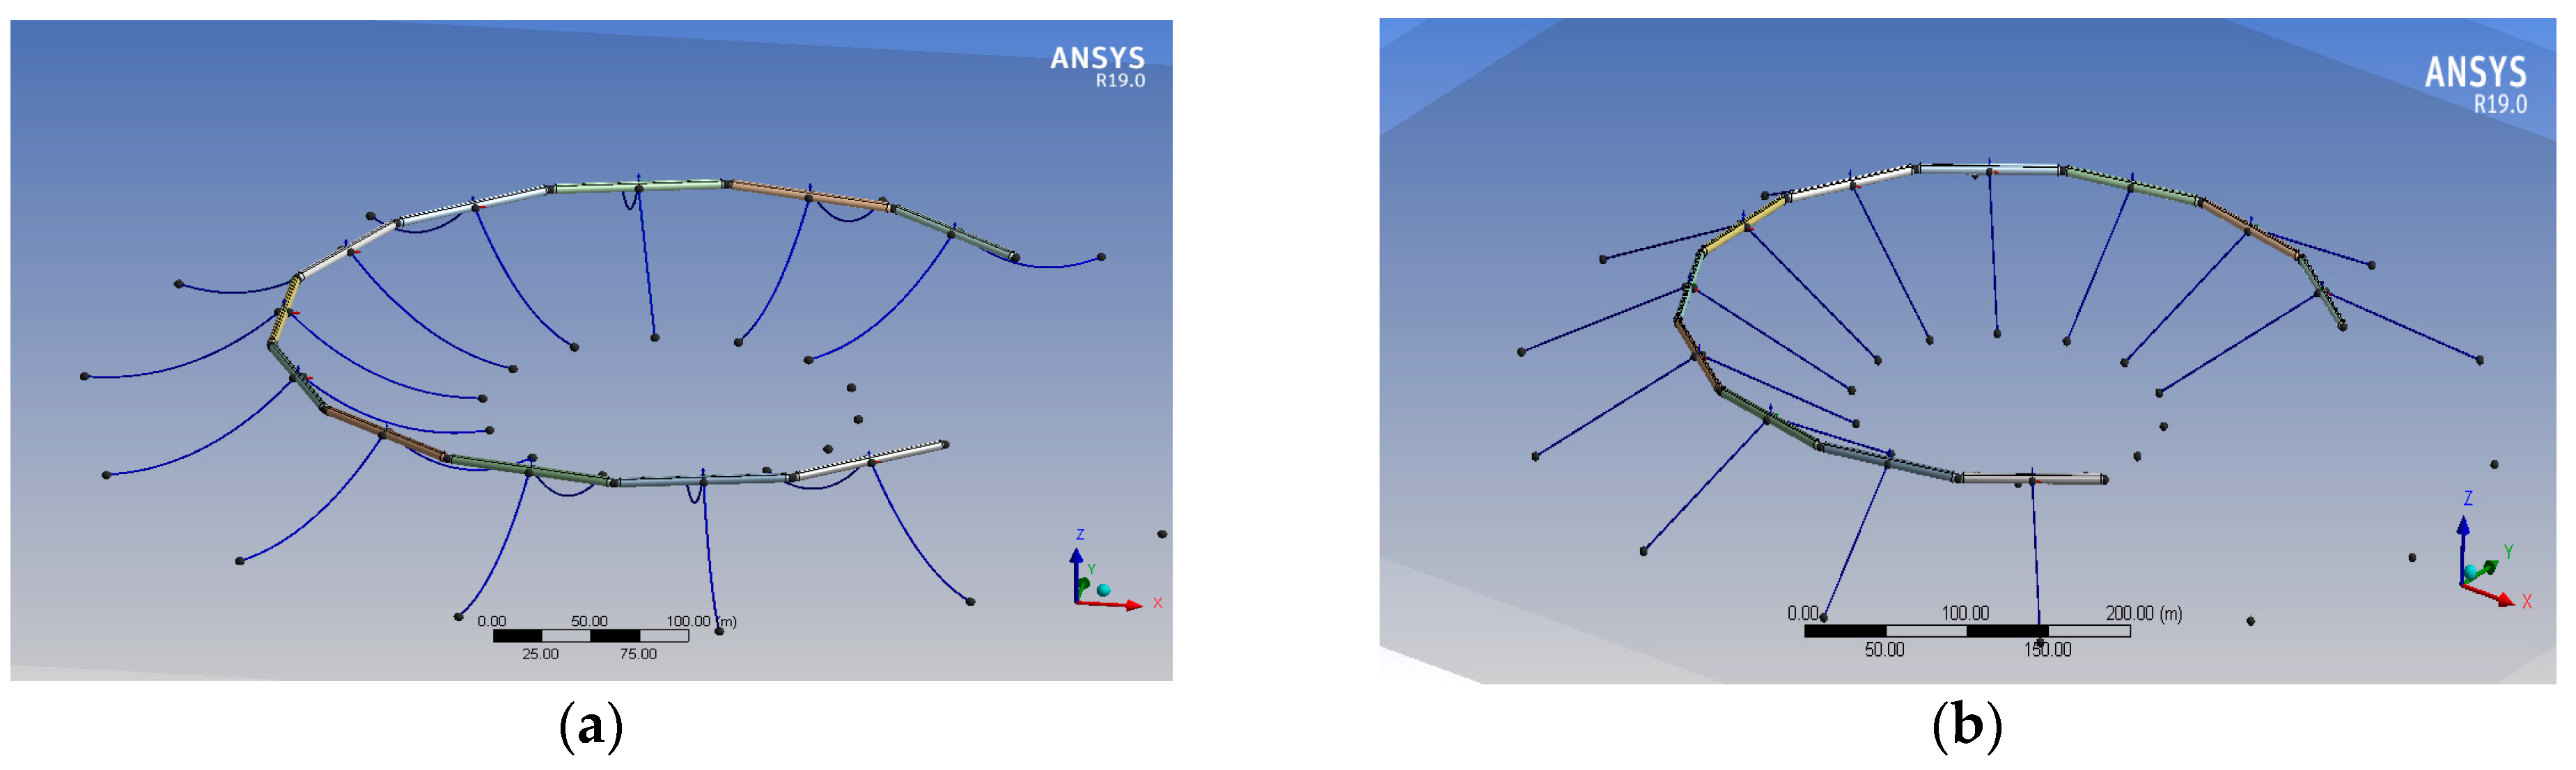
3.3. Effect of the Mooring System
Next, the effect of the type of the mooring system on the wave dissipation performance of the floating breakwater system is investigated. Two types of chain mooring methods, namely catenary and tensioning, are considered. The anchor chain parameters in the calculation are as follows: unit length mass:
W = 3.9 × 10
3 D2 kg/m; axial stiffness:
EA = 4.04 × 10
7 D2 kN; breaking strength:
BL = 6.3 × 10
4 D2 kN, where
D is the diameter of the anchor chain.
Figure 8a,b show the schematic diagrams of a floating breakwater model with a catenary mooring system and tensioned mooring system, respectively.
Given the negligible differences in wave field distribution within the floating breakwater when comparing the catenary mooring chain and the tensioned mooring chain methods, the wave transmission coefficients were calculated and are presented directly in
Table 1 and
Table 2, respectively. These tables illustrate the key parameters for assessing wave dissipation in floating breakwater systems for each of the two mooring methods. Both sets of the mooring systems have the same axial stiffness, i.e.,
EA = 1.16 × 10
8 N, 2.33 × 10
8 N, 2.33 × 10
8 N, and 2.33 × 10
8 N, respectively. The wave transmission coefficients inside the floating breakwater system are 0.63~0.67, while the wave transmission coefficients inside the floating breakwater with tensioned mooring system are 0.61~0.64, which is slightly smaller than the floating breakwater with a catenary mooring system.
3.4. Effect of Incident Wave Height
The wave dissipation performance of the floating breakwater system is analyzed for different incident wave heights by examining the contour maps of wave amplitude and calculating the averaged transmission coefficient in the shielding area surrounded by the floating breakwater (see
Table 3). The incident wave height ranges from
Hi = 2.0 to ~4.5 m, and the incident wave period is set at
T = 6.0 s. Generally, an increase in wave height results in a corresponding increase in the amplitude of the wave in the shielding area. The observed phenomenon of increasing waves can be attributed to the heightened amplitude of the incident wave and the influx of additional incident waves into the covered area from above the breakwater. This particular portion of the wave remains unaffected by the wave system’s attenuation and imparts a greater amount of energy into the water located behind the breakwater. In general, the averaged transmission coefficient within the breakwater ranges from
Kt = 0.35 to ~0.65 for incident wave heights (
Hi) of 2.0~4.5 m, as shown in
Table 3, resulting in relatively stable waves in the covered area.
3.5. Effect of Incident Wave Period
The wave dissipation performance of the floating breakwater system surrounding the floating island is examined across various incident wave periods. The range of incident wave periods considered is
T = 6.0~10.0 s, while the incident wave height is fixed at
Hi = 2.0 m. In general, an augmentation in wave period leads to a proportional rise in the wave amplitude within the shielding area. The average wave transmission coefficient within the breakwater falls within the range of
Kt = 0.30~0.65 for the wave period increasing from 6.0 s to 10.0 s, as shown in
Table 4. The efficacy of the floating breakwater in dissipating waves and the provision of a comparatively stable water environment within the shielding area is evident.
3.6. Effect of Incident Wave Direction
This subsection examines the distribution of wave height within the floating breakwater under varying wave incidence directions, as shown in
Figure 9. The incident wave has a period of
T = 6.0 s and a height of
Hi = 2.0 m. When the wave impacts the breakwater from the front or back of the navigation opening (
α = 0° or 180°), the wave field within the floating breakwater remains relatively stable, with the averaged transmission coefficient of
Kt = 0.35~0.40. However, when the waves attack the floating breakwater at other directions, the averaged wave transmission coefficient within the breakwater ranges between
Kt = 0.45 and ~0.65. If the opening is regarded as a navigation entrance to the floating island, it ought to be positioned on the opposite side of the main incident wave direction.
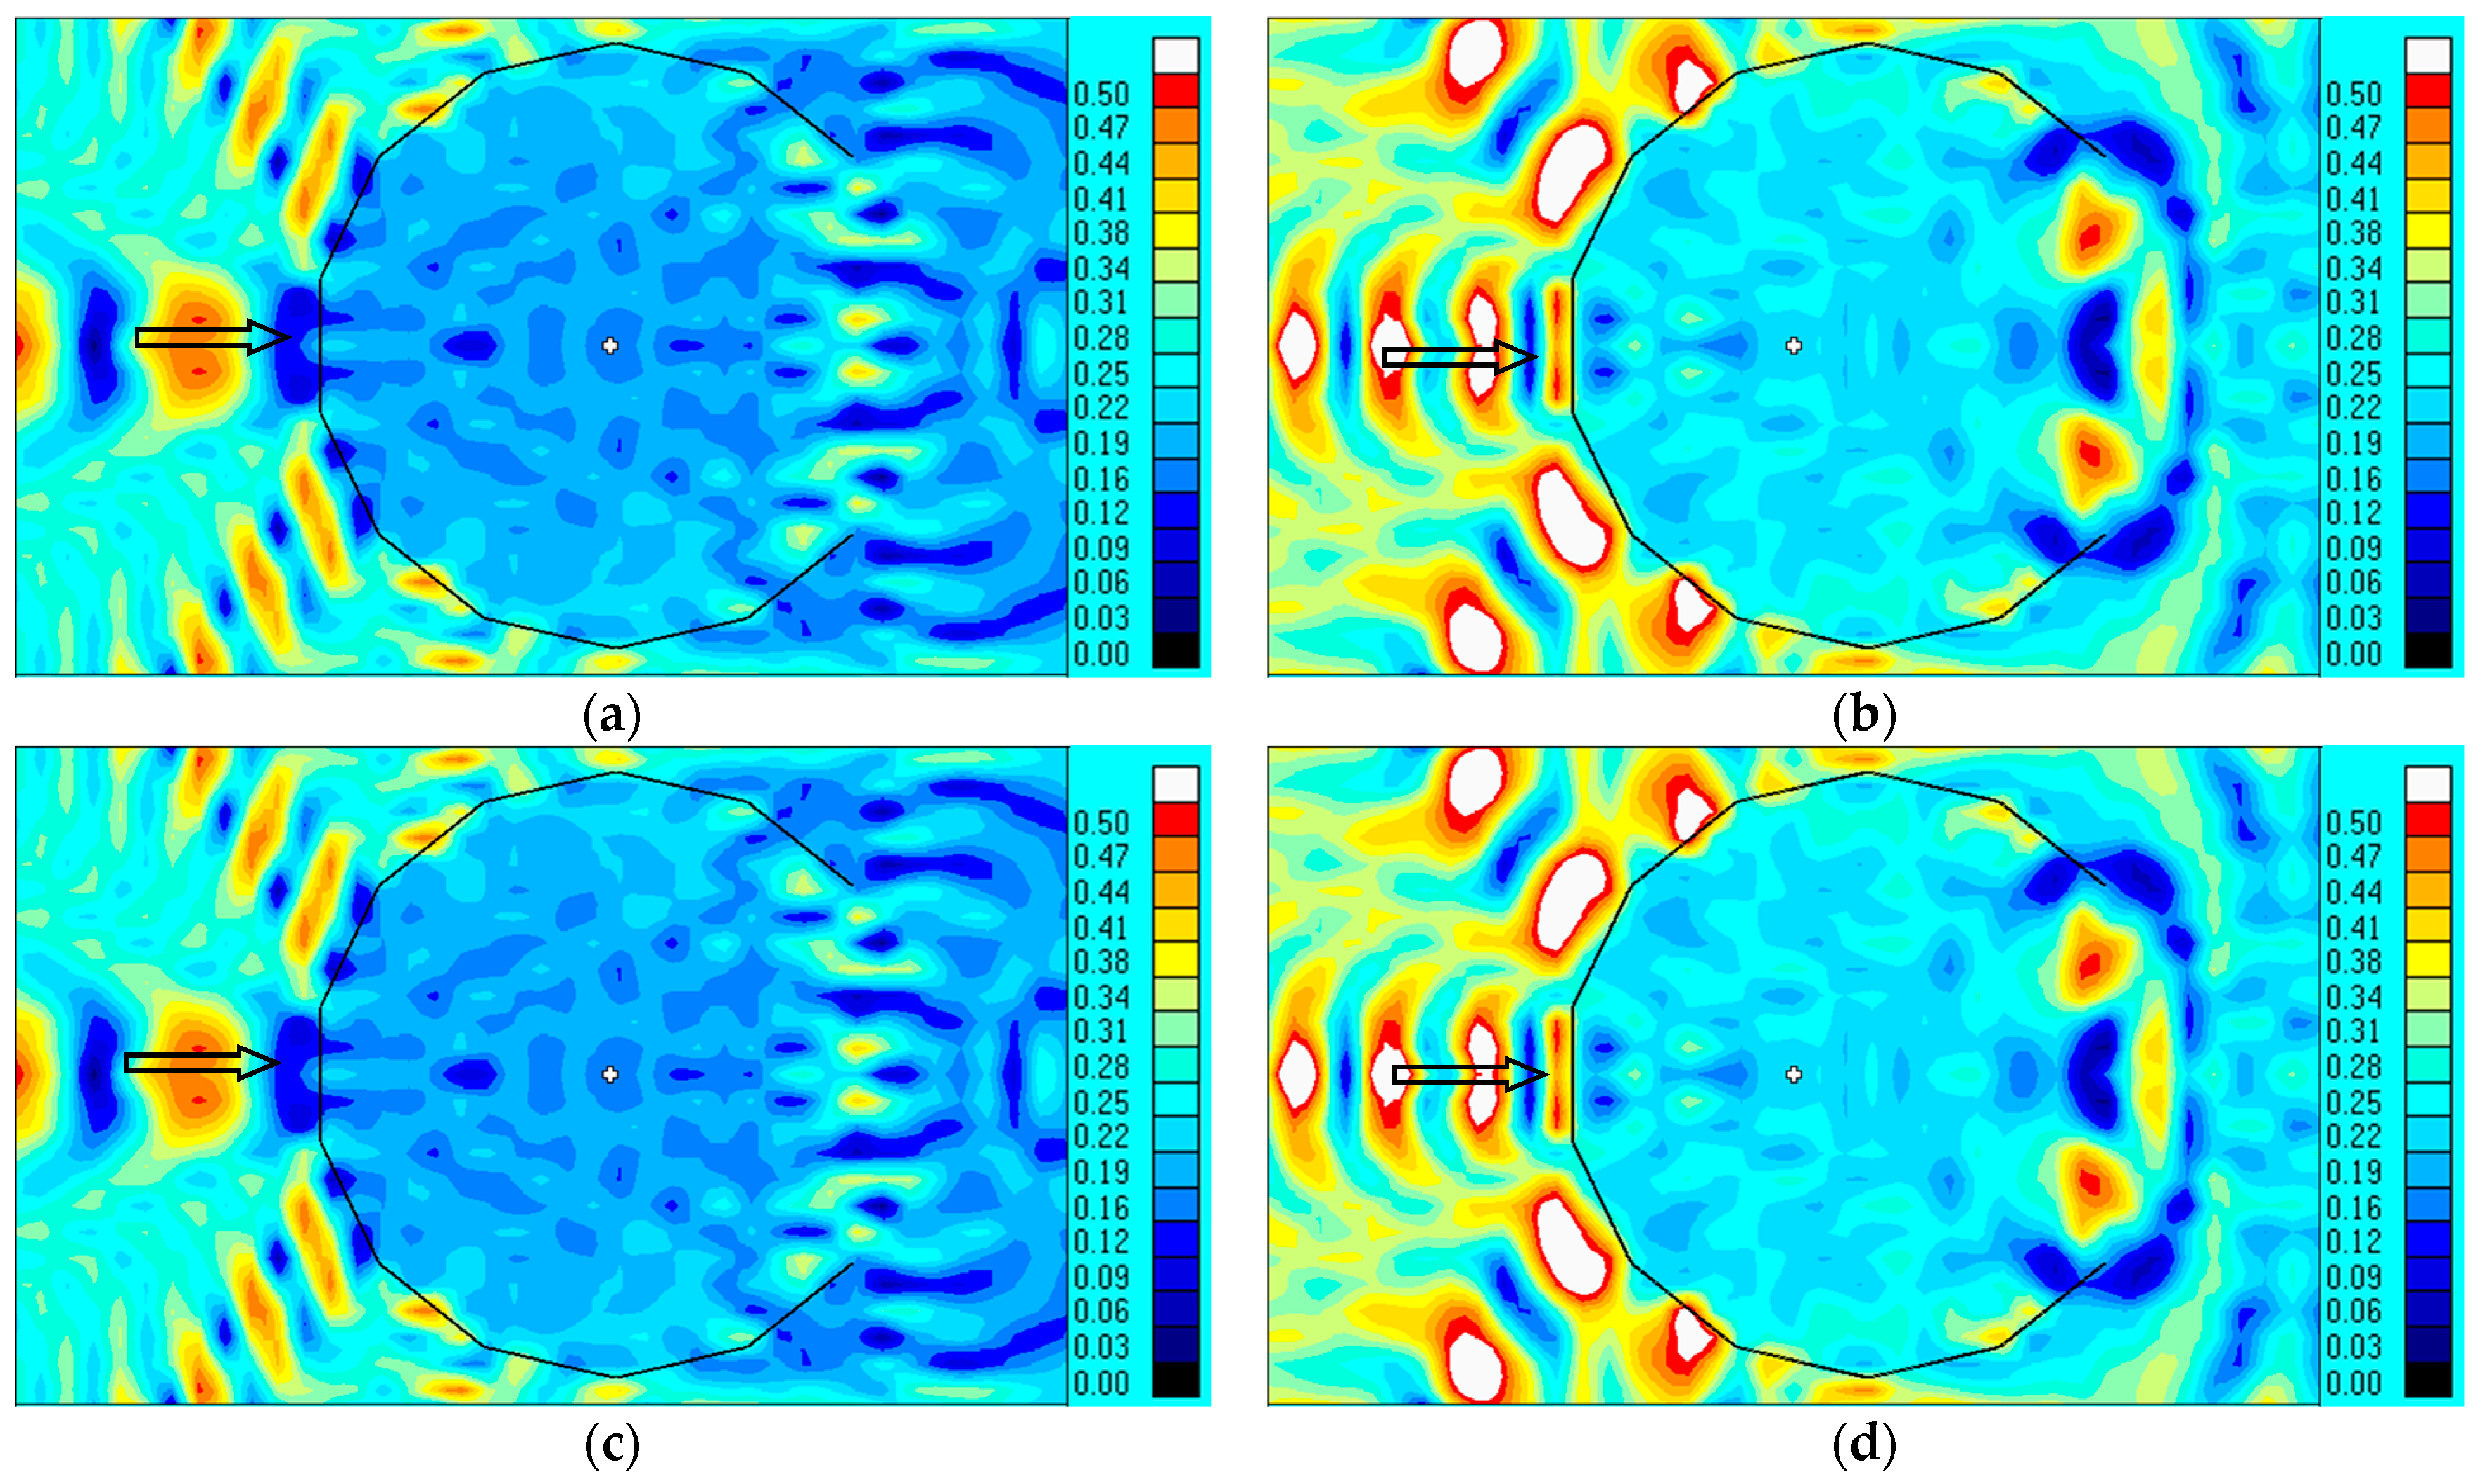
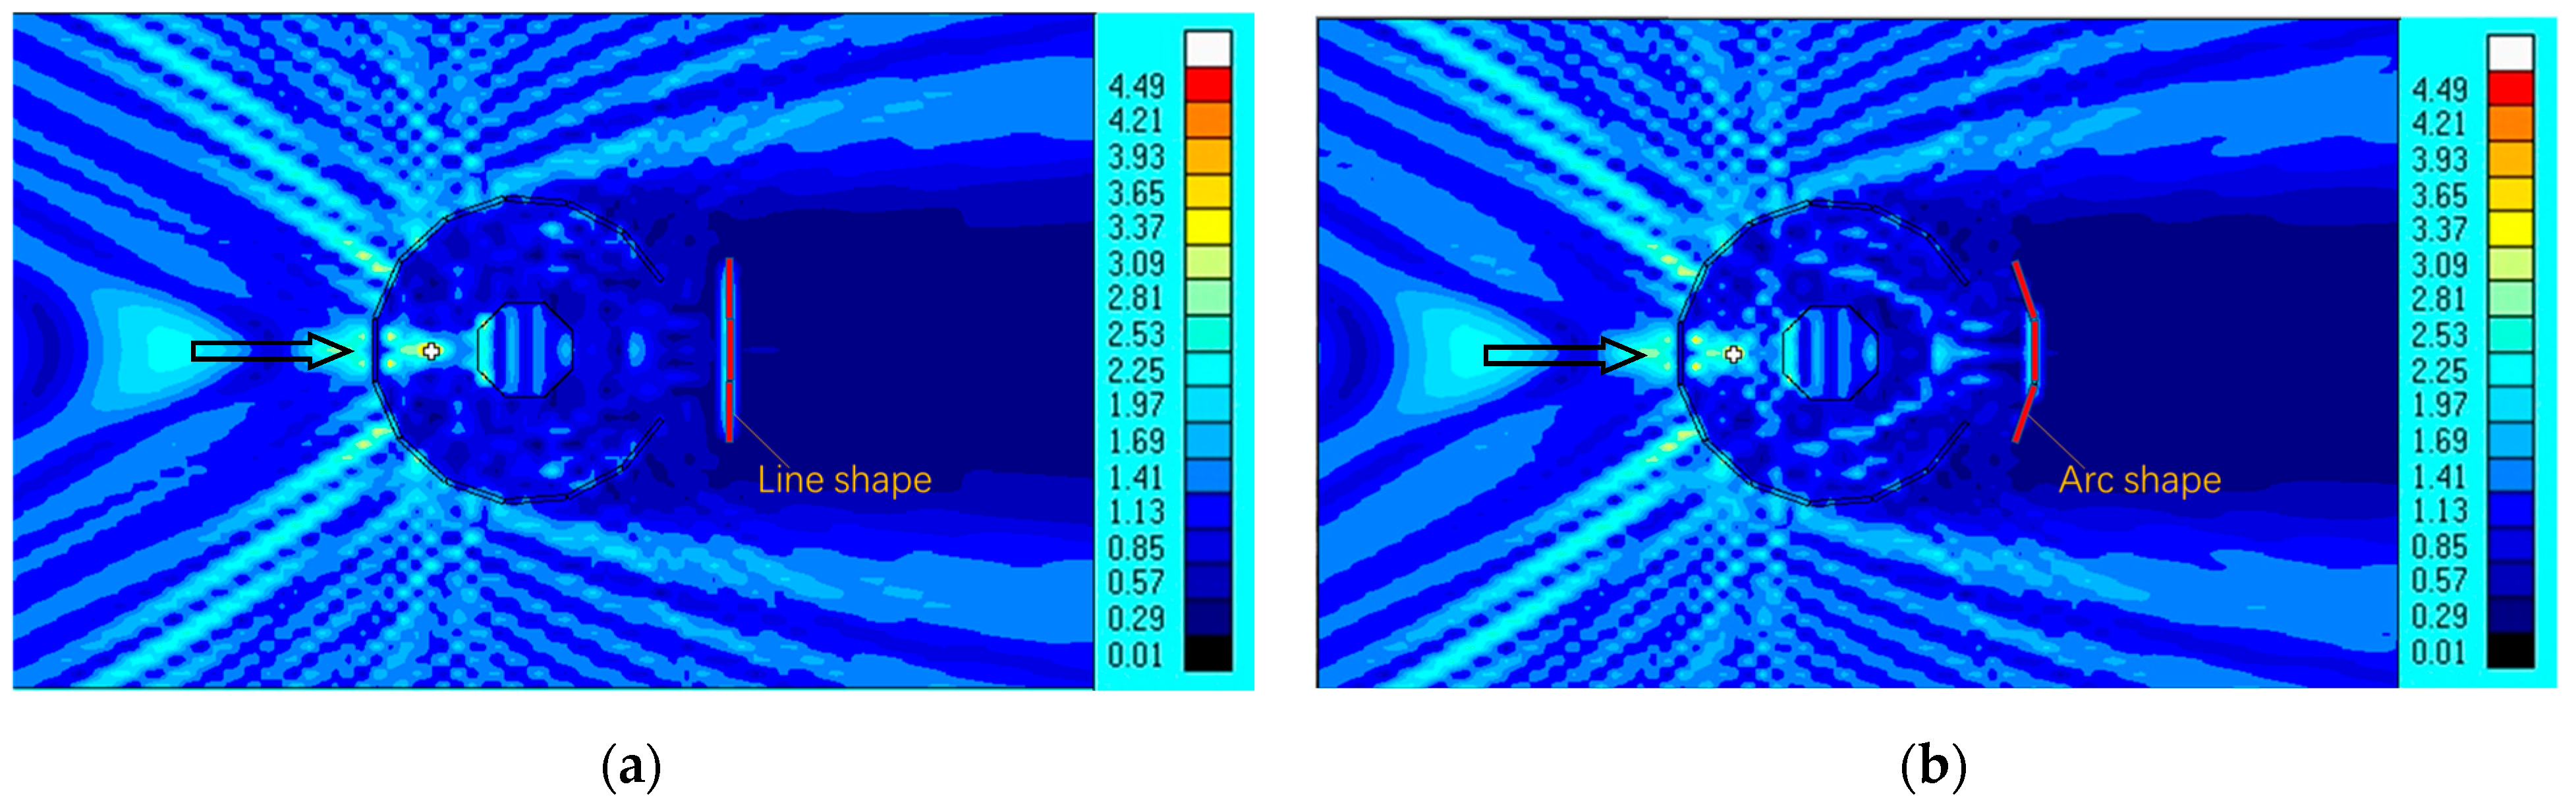
3.7. Effect of the Shape of the Harbor Gate
In this section, two different designs of the harbor gate were examined to study their effect on the wave dissipation performance of the floating breakwater system. Model 1 features a straight-line gate, while Model 2 adopts an arc-shaped gate. The parameters of the model can be seen in the previous chapter. The contour maps of the wave amplitudes around the floating breakwater system with the two harbor gates are presented in
Figure 10. The wave amplitude along the centerline across the floating breakwater are also extracted and plotted in
Figure 11.
Based on data calculation, the average wave height in the sheltered area after wave dissipation through the floating breakwater system with the straight-line gate is 1.32 m, corresponding to a transmission coefficient of Kt = 0.66. In contrast, the average wave height in the covered area for the floating breakwater system with the arc-shaped gate is 0.98 m, with a transmission coefficient of 0.49, which has a better wave dissipation effect. The reason may be that when the harbor gate and the inner ring breakwater are arranged in an arc shape, the reflection from the harbor gate will result in fewer waves entering the cover area again, resulting in a decrease in the average wave amplitude and a smaller transmission coefficient. This layout has a better wave dissipation effect and is more aesthetically pleasing than the straight-line layout of the harbor gate. The orientation of the harbor gate of the floating breakwater is aligned with the predominant wave direction in the design. Consequently, in the simulation, the ten-year design wave conditions, which follow the same orientation, are applied to the floating breakwater system. This ensures that the wave conditions and the resulting data are representative. Quantitative results can be derived from this representative simulation case. Further simulation cases and detailed quantitative analyses can be conducted when the floating breakwater system is implemented in the future.
4. Conclusions
This study provides a comprehensive numerical investigation into the hydrodynamic performance of a floating breakwater system designed to protect an artificial floating island in the Baa Atoll, Maldives. Using ANSYS-AQWA software, we evaluated the wave dissipation efficiency of a multi-cylinder floating breakwater under various wave conditions, including different wave heights, periods, directions, and opening configurations. The key findings and their implications are summarized as follows:
(1) A navigation channel opening angle of 75° was determined to be optimal, as it effectively balances wave dissipation performance with the construction complexity of the harbor gate. This configuration results in a wave dissipation coefficient of 0.62 within the sheltered area, thereby ensuring the stability and safety of the central floating island.
(2) When the separation between the breakwater and the central floating island measures 300 m, the transmission coefficient is calculated to be 0.60, a value that is lower than those observed at other distances.
(3) The tensioned mooring system outperformed the catenary system, achieving a transmission coefficient of 0.61 compared to 0.67. This improvement is attributed to the tensioned system’s ability to reduce breakwater motion and enhance energy absorption.
(4) Harbor gate design: the arc-shaped harbor gate reduced wave transmission by 26% compared to the linear gate, demonstrating the importance of gate geometry in minimizing wave reflection and improving overall system performance.
(5) Based on the results, we recommend the following design parameters for practical applications:
Navigation channel opening angle: 75°.
Tensioned mooring system with axial stiffness EA ≥ 2.33 × 10⁸ N.
Arc-shaped harbor gate to minimize wave reflection.
(6) This study advances the understanding of floating breakwater systems by providing a validated numerical model and empirical formulas for predicting wave transmission coefficients and mooring forces. The findings can guide the design of floating breakwaters for large-scale offshore structures, such as artificial islands, offshore airports, and floating cities. Future research should explore the performance of the system under irregular wave conditions and investigate the effects of environmental factors, such as wind and currents, on breakwater stability.


 ,
, 
