Article

Hydrochemical Characterization, Source Identification, and Irrigation Water Quality Assessment in the Voghji River Catchment Area, Southern Armenia

1
Scientific Center of Zoology and Hydroecology, National Academy of Sciences of the Republic of Armenia, Yerevan 0014, Armenia
2
Faculty of Biology, Yerevan State University, Yerevan 0025, Armenia
3
International Clean Water Institute, Applied Research, Manassas, VA 20110, USA
4
Ghitu IEEN, Academy of Sciences of Moldova, MD-2001 Chisinau, Moldova
5
Institutul de Cercetare al Universităţii din București, 050663 Bucharest, Romania
*
Authors to whom correspondence should be addressed.
Water 2025, 17(6), 854; https://doi.org/10.3390/w17060854
Submission received: 22 February 2025 / Revised: 8 March 2025 / Accepted: 13 March 2025 / Published: 17 March 2025

Abstract

:
Water quality is a fundamental parameter for assessing the suitability of surface waters. Likewise, the hydrochemical behavior is critically important to understand for rivers used in irrigation. This study aims to evaluate and characterize the surface water quality of the Voghji River catchment basin for irrigation, as it reveals the hydrochemical origins in the catchment basin. Nine key parameters, including EC, Cl, SO42−, Ca2+, Mg2+, Na+, K+, CO32−, and HCO3, were measured at seven sampling points in July and September 2017. The ion concentration patterns in July followed the sequence: Ca2+ > Na+ > K+ > Mg2+ and HCO3 > SO42− > Cl > CO32−, while in September, they were Ca2+ > Na+ > Mg2+ > K+ and HCO3 > SO42− > Cl > CO32−. The sequences were almost similar between the two months, with minor differences in cation distribution, particularly between Mg2+ and K+. Overall, Ca2+ and HCO3 were the dominant ions in the studied surface water samples. The concentrations of K+, Na+, Mg2+, Ca2+, Cl, SO42−, and HCO3 were found to be well below the FAO irrigation water standards, indicating that the waters of the Voghji River and its tributaries (Achanan, Vachagan, and Geghi) were generally safe for irrigation. However, the FAO threshold value was exceeded only for CO32− in the Vachagan River in Kapan Town. The chemical analysis of surface waters in the Voghji River catchment basin revealed dominant Ca2+-HCO3 and mixed Ca2+-K+-SO42−-Cl facies, with key geochemical processes including carbonate and gypsum dissolution, silicate weathering, and cation exchange. Ionic correlations indicated that Na+ and Cl sources were influenced by both natural (e.g., halite dissolution, weathering) and anthropogenic inputs, while Ca2+ and Mg2+ primarily originated from carbonate dissolution. The Gibbs diagram suggested that rock–water interactions were the primary natural mechanism controlling the water chemistry, with evaporation also playing a significant role. Various indices, including the Kelly index, magnesium adsorption ratio, sodium percentage, sodium adsorption ratio, permeability index, potential salinity, residual sodium carbonate, soluble sodium percentage, and irrigation water quality index, were applied, along with US Salinity Laboratory diagram and Wilcox diagram, to further assess the irrigation suitability. Most indices confirmed the suitability of the waters for irrigation; however, the Achanan River near the mouth and the Voghji River downstream of Kapan Town exhibited moderate salinity levels, underscoring the need for water management to prevent potential soil degradation.

1. Introduction

Agriculture plays a key role in sustaining both the economy and the quality of life (QoL) for the population. As the primary source of irrigation water, rivers are essential for socio-economic development and environmental protection [1,2,3]. Moreover, water security has become a critical global challenge [4], further complicating sustainable development in the agricultural sector. Limited water resources and pollution not only hinder yield growth but also impact the quality and quantity of agricultural products [5,6]. Insufficient water security also affects livelihoods, leading to food shortages and economic risks, which hinder the sustainable development of rural communities [3,7]. The availability of freshwater constrains sustainable development opportunities worldwide, particularly in semi-arid and arid regions [8]. As a mountainous country with an arid climate, Armenia, located on the northern edge of the subtropical zone, faces similar challenges. Under these conditions, surface waters become a critical resource, playing a key role in ecosystem maintenance. They not only support biodiversity but also provide essential ecosystem services vital for the country’s agricultural sector and sustainable regional development [9,10]. Surface water resources face significant challenges, including water quality degradation and freshwater depletion. These issues arise from both human activities and natural geological processes [11,12]. Key anthropogenic impacts include industrial and agricultural pollution, inadequate wastewater treatment, and inefficient water resource management [13]. Meanwhile, geological processes such as erosion, soil salinization, and the introduction of natural pollutants into water systems also contribute to the deterioration of surface water quality [14,15]. Consequently, these challenges threaten ecosystem stability, human health, and regional socio-economic development, highlighting the need for comprehensive and effective solutions for sustainable water resource management [16].
Sustainable agriculture plays a key role in managing Armenia’s water resources. By promoting the use of modern and efficient irrigation methods, environmentally friendly agricultural approaches, and the use of non-traditional water sources for agriculture, such as treated wastewater and brackish water, it is possible to significantly reduce water consumption in agriculture while maintaining or increasing crop yields. These approaches can reduce pressure on freshwater resources, ensuring their more sustainable and efficient use [17,18]. Such solutions not only enhance agricultural productivity but also mitigate the risks associated with inefficient water resource management, thus supporting Armenia’s long-term economic and environmental sustainability. The adoption of sustainable agricultural practices can improve water quality, ensure more reliable water supplies for agricultural communities, and contribute to the health of both agriculture and ecosystems [19]. Overall, the agricultural sector plays a crucial role in sustainable water resources management, ensuring that Armenia’s limited water resources are preserved for future generations. The approaches presented here are a significant contribution to the long-term strategic development of the country’s agriculture and water resources [20].
Water quality assessment is vital for monitoring and conserving surface water resources, which are highly vulnerable to physicochemical stresses caused by human activities [21]. Thus, an in-depth study of the physicochemical variables and geochemical processes that characterize surface water features is essential for advancing the hydrochemical understanding of ecosystems. This, in turn, can enhance sustainability and improve water quality management practices [22,23]. Integrated water quality indices have been developed by combining the physicochemical properties of rivers and streams to provide a more accurate assessment of water quality variations at different locations. These indices are useful for effectively describing water quality [24,25,26]. Therefore, they serve as key metrics for evaluating the overall water quality based on various variables. Among the most important water quality indicators for agricultural suitability are the irrigation water quality index, sodium adsorption ratio, sodium percentage, soluble sodium percentage, permeability index, potential salinity, residual sodium carbonate, and magnesium adsorption ratio, all of which collectively define the irrigation water quality status [27,28,29].
Recent advancements in hydrochemical research on irrigation water have increasingly focused on integrating traditional hydrogeochemical techniques with advanced modeling approaches to enhance water quality assessments and management strategies [30]. Despite these advancements, significant challenges persist. Unsustainable water management practices have exacerbated soil salinity and sodicity, leading to substantial agricultural productivity losses [31], highlighting the need for adaptable tools in irrigation water management. Addressing these challenges requires a systematic and multidimensional approach to hydrochemical assessments and monitoring frameworks. This study employed a comprehensive methodology, integrating graphical, mapping, and statistical methods to evaluate surface irrigation water quality in an anthropogenically influenced region. A detailed analysis of physicochemical parameters was conducted to assess the suitability of water for irrigation. By integrating multiple water quality indices, the study established a robust framework for capturing seasonal variations and spatial heterogeneity across different sites. Furthermore, geochemical relationship analysis was utilized to trace the evolution of water chemistry, offering critical insights into key hydrogeochemical processes such as mineral dissolution, ion exchange, and weathering dynamics. Beyond the results and conclusions, the study demonstrates that a comprehensive assessment of irrigation water quality can be effectively conducted at a regional scale with relatively limited effort and resources. There has been limited research on the irrigation properties of surface waters in the Republic of Armenia. While a few studies have reported on irrigation water quality in the Voghji River catchment basin [32,33,34], detailed information on surface water facies, hydrochemical origins, geochemical regulating mechanisms, and agroecological risks remains unpublished.

2. Materials and Methods

The materials and methods include site description, water sampling, sample and data analysis, and processing.

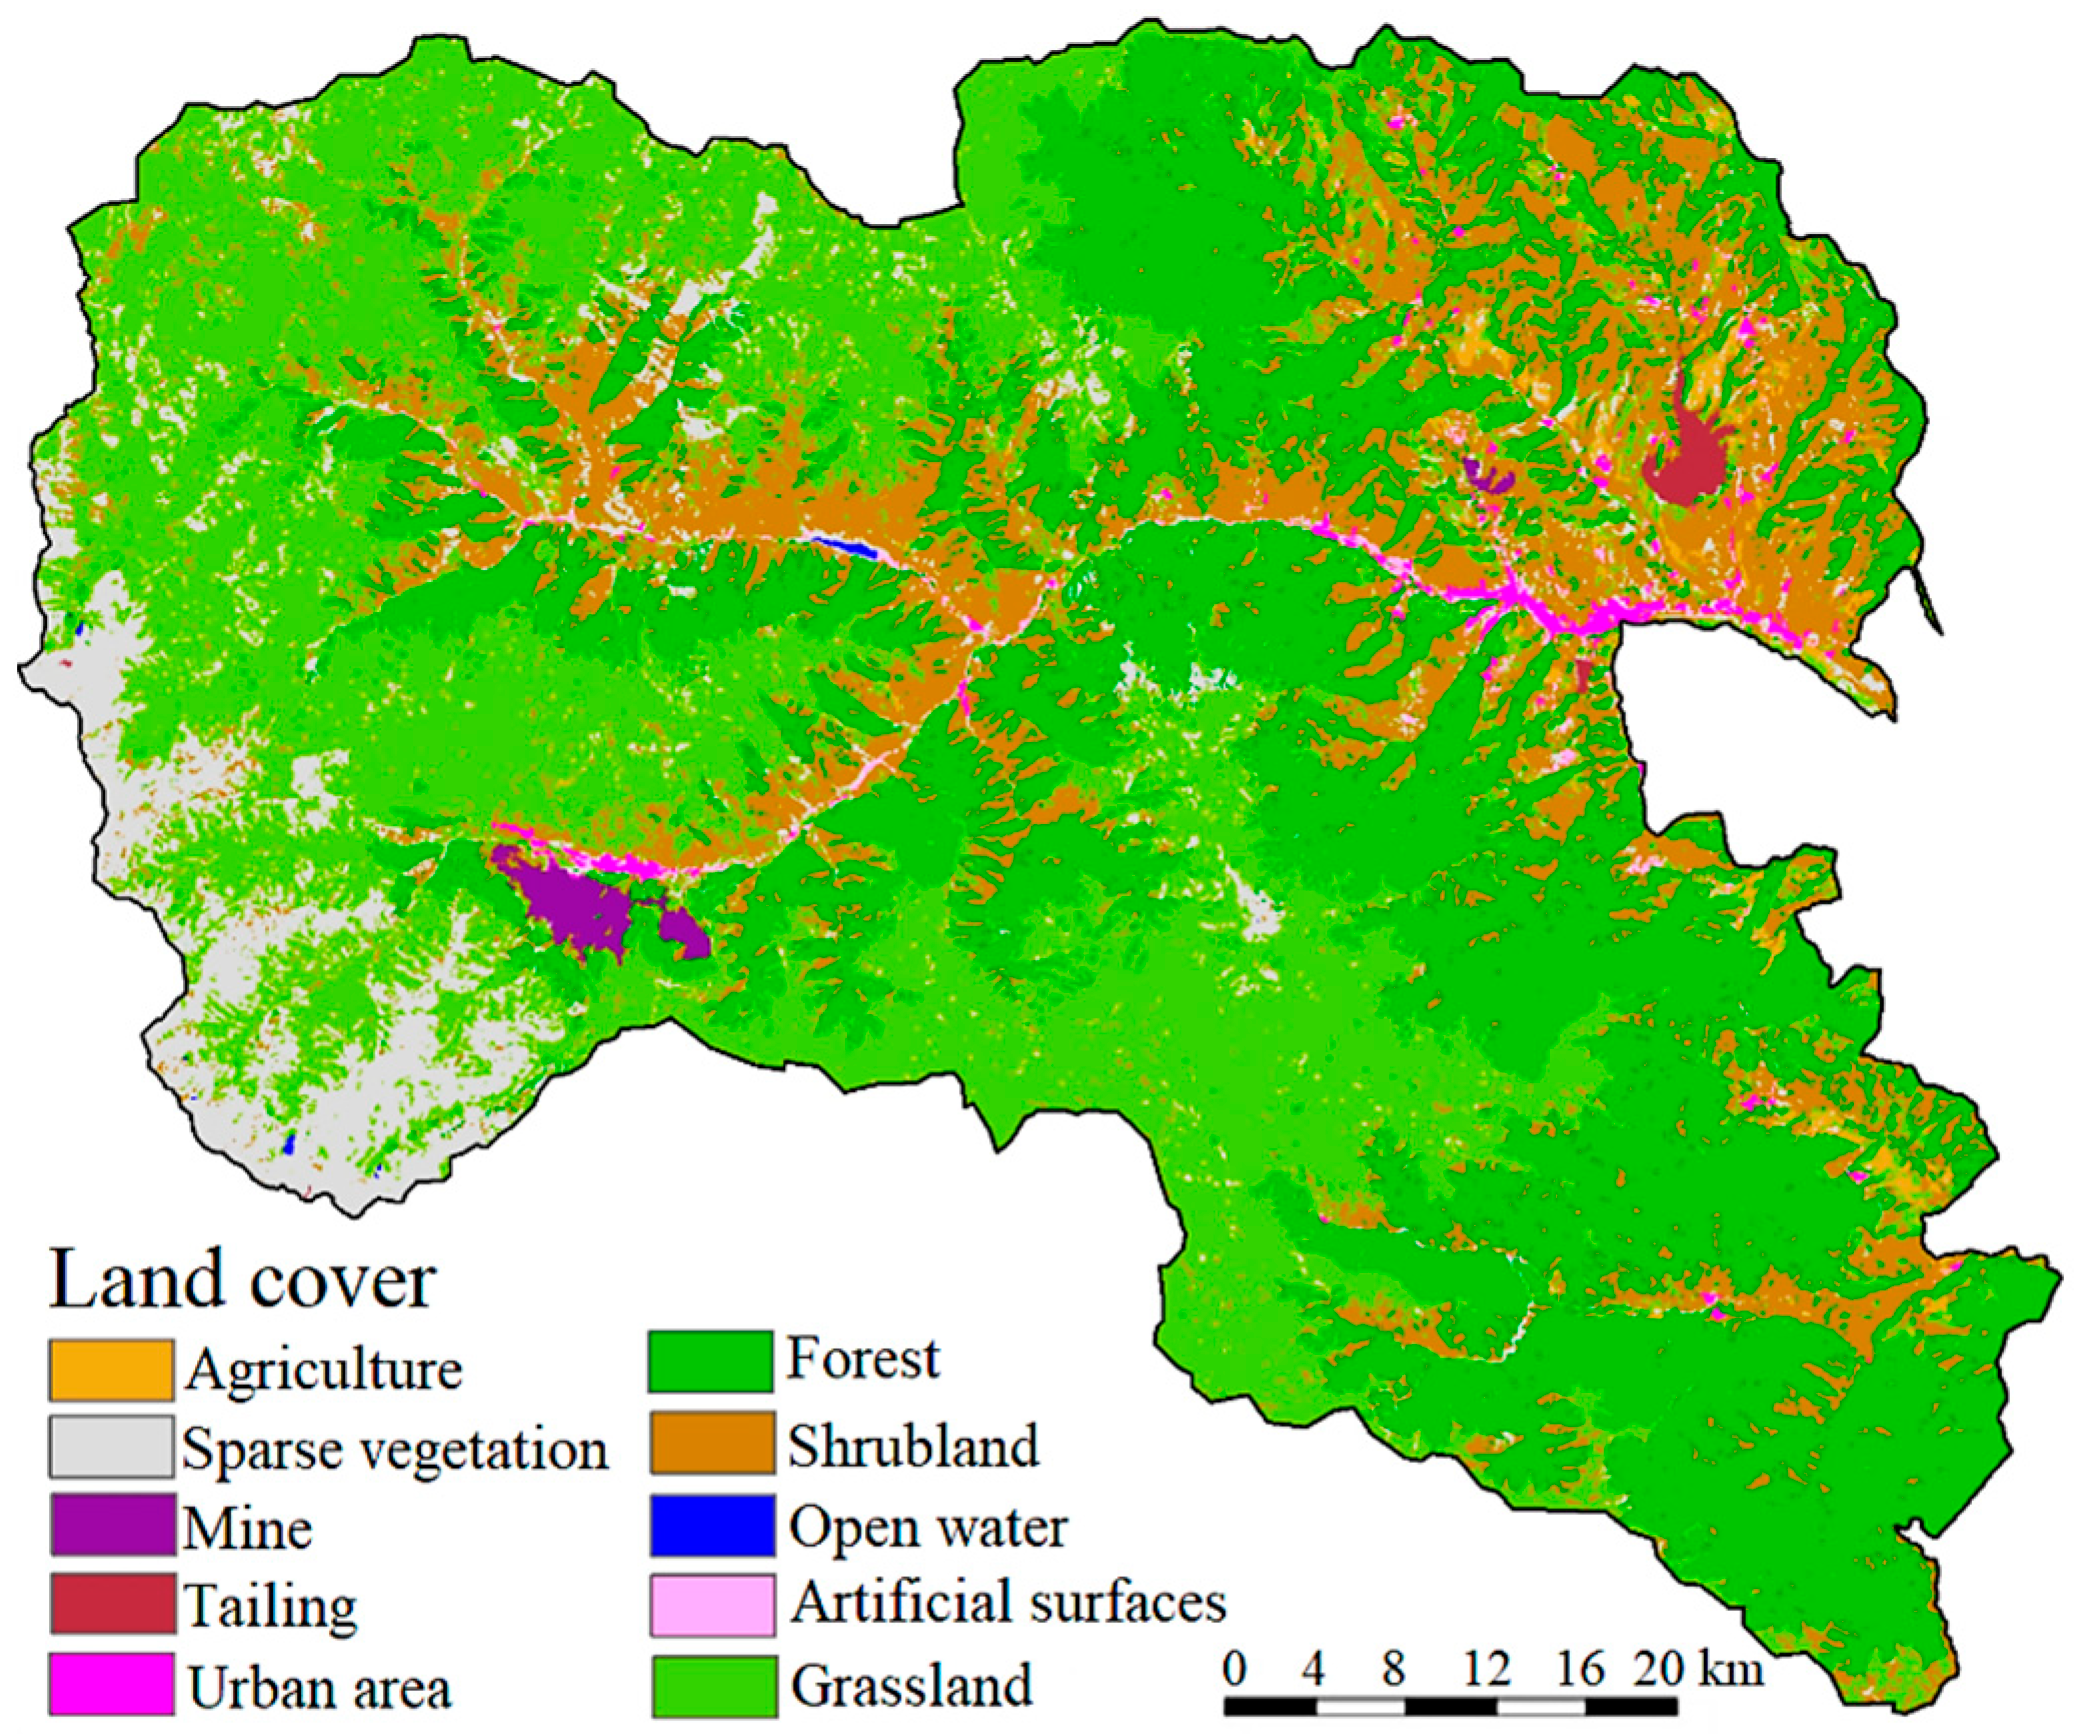
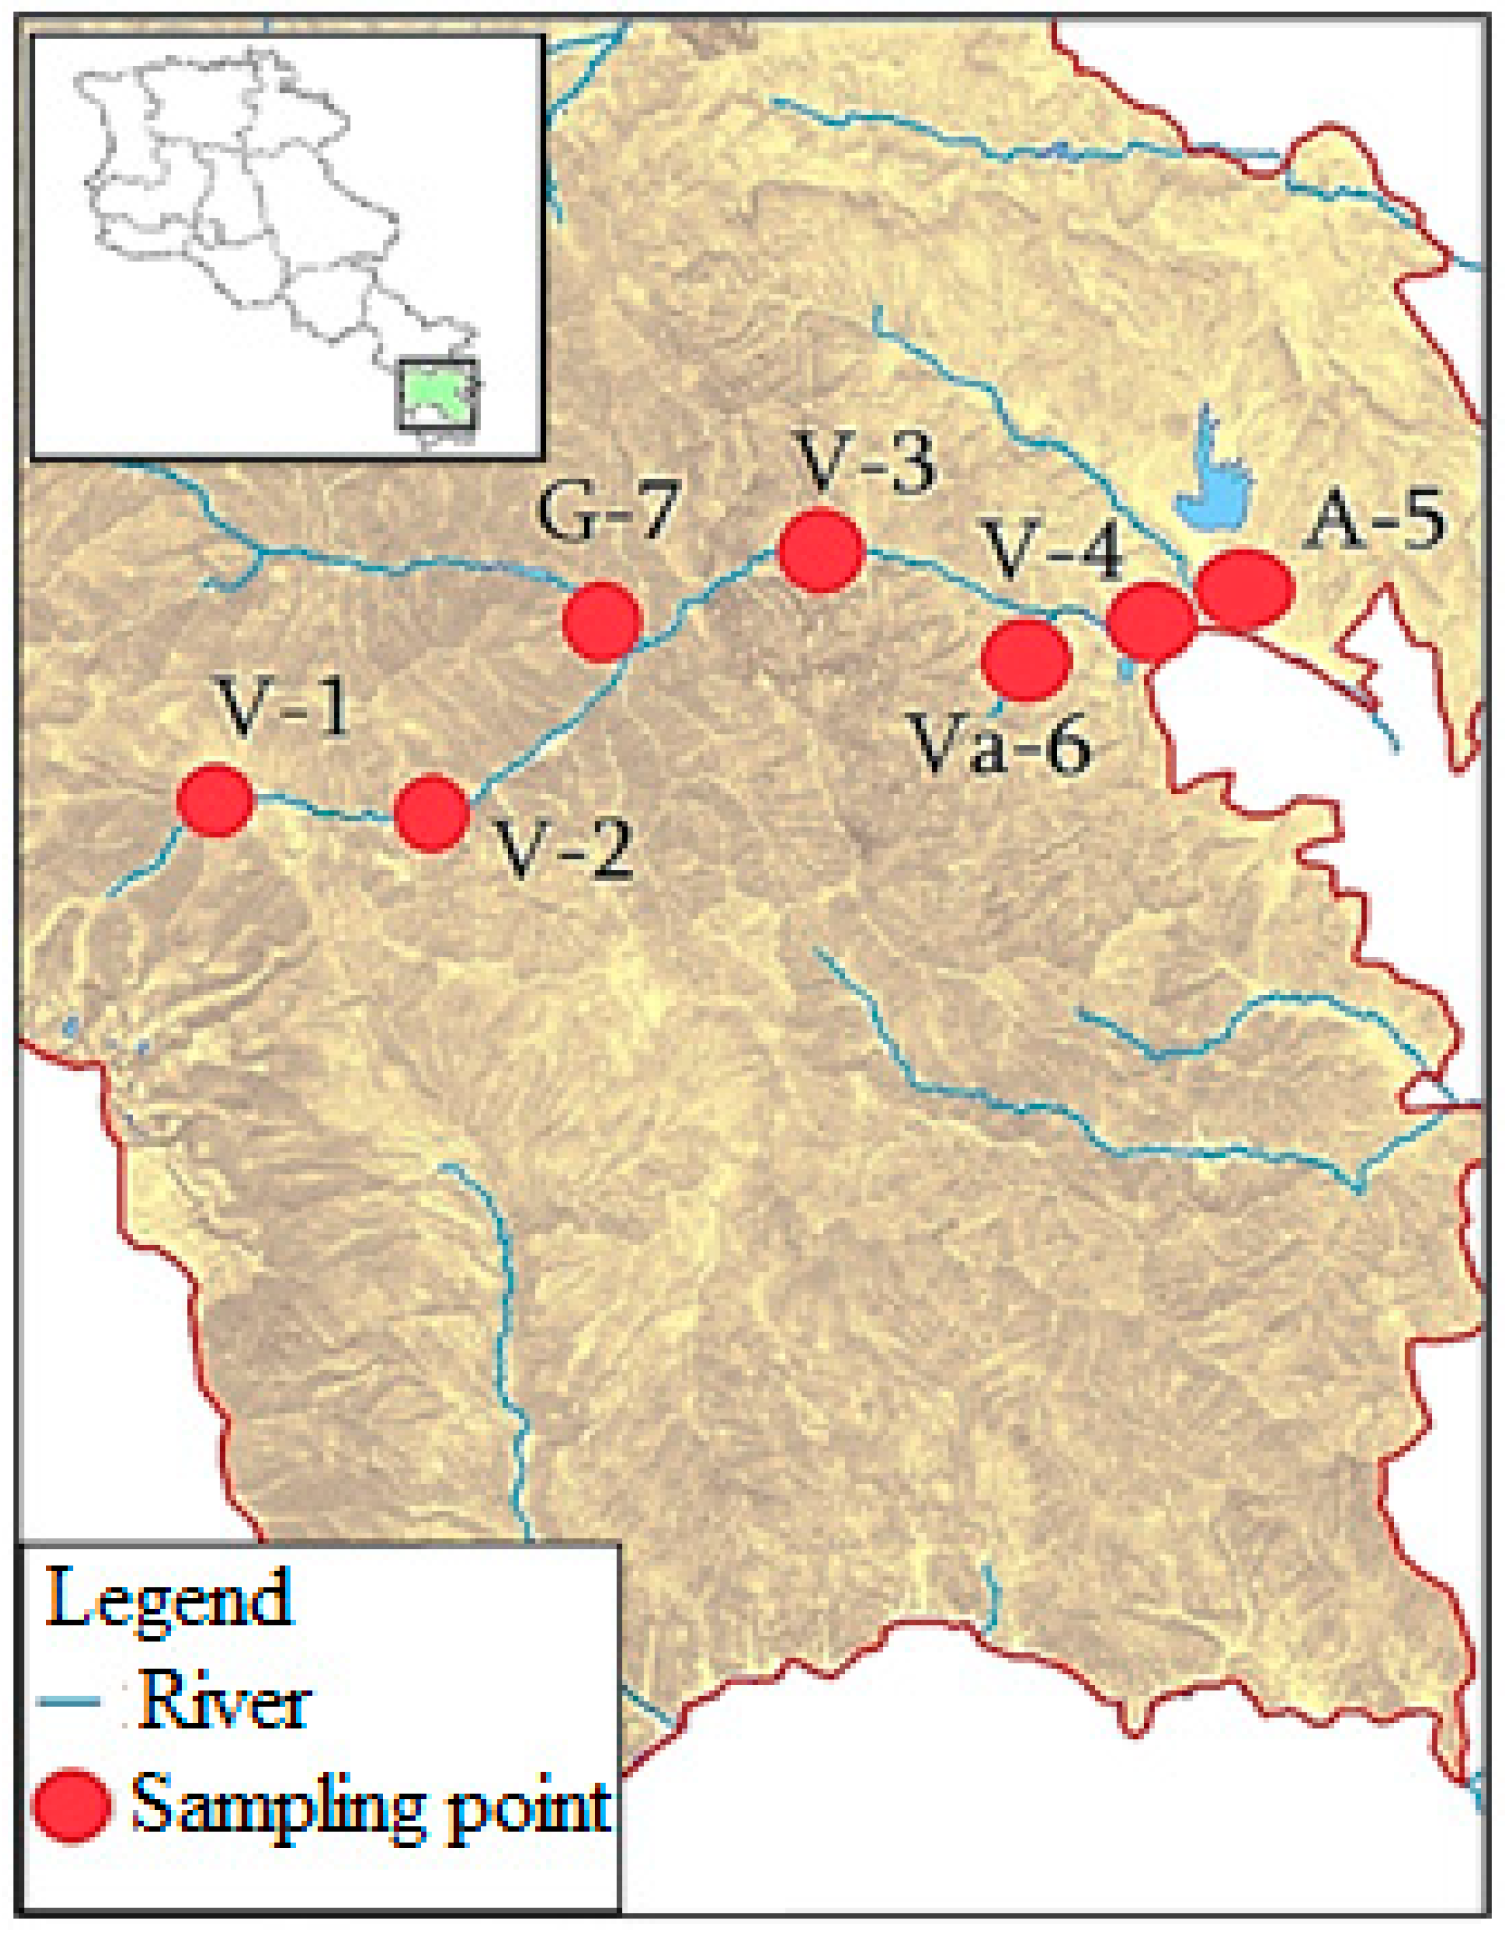
2.1. Sites Description

The Voghji River catchment basin is located between the high mountain ranges of the Bargushat and Meghri ranges in the southern part of the Republic of Armenia. The geological structure of the basin is primarily composed of volcanic-sedimentary rocks. The landscape features noticeable fragmentation, with numerous V-shaped valleys and gorges. Contemporary ecogenesis is largely influenced by fluvial processes. The soils in the region are classified as brown forest soils with a carbonate component [35]. The basin’s primary watercourse is the Voghji River, which originates on the slopes of Mount Kaputjugh and is fed by several tributaries. Within Armenia’s borders, the river spans a length of 56 km, with a catchment area of 1175 km2. The river has an average slope of 0.058, and its annual discharge is approximately 9.6 m3/s. The river network’s density coefficient varies from 1.5 to 2.0 km/km2, while the flow coefficient is 0.58. The river’s hydrological regime is primarily influenced by meltwater, followed by rainwater and groundwater contributions. Due to the mountainous terrain of the basin, there is a distinct vertical climatic variation. The region exhibits the following climate types: dry subtropical, moderately warm semi-arid, moderately cold forested, cold mountainous, and alpine tundra [36,37,38]. Surface waters in the Voghji River catchment area are used for irrigation, energy, industrial, and other purposes. As shown in Figure 1, the land use within the catchment basin is predominantly oriented towards agricultural activities, with a substantial portion of the area allocated for crop production and related farming practices. This highlights the critical role of agriculture in the region’s land management and irrigation water demand.

2.2. Water Sampling

Water samples were collected from seven sites across four rivers in July and September 2017 (Figure 2). River site V-1, located in an area with minimal anthropogenic influence, was used as a reference point for the river catchment basin, while the other sites were subject to noticeable human impact. Detailed information about the sampling sites and their corresponding names is provided in Table 1.
The water samples were collected in sterile sample containers and transported in a cool box under low-temperature conditions (4–8 °C). Electrical conductivity (EC) measurements were taken in the field using a conductometer (HI98129, Hanna Instruments, Nusfalau, Romania). The concentrations of total dissolved solids (TDS) were calculated from EC using a conversion factor of 0.65, following the approach described by Rusydi (2018) [39].

2.3. Sample Analysis

The quantitative analysis of Ca2+ and Mg2+ ions in water samples was performed using the ISO 7980:1986 method with an atomic absorption spectrometer (novAA 350, Analytik Jena, Jena, Germany) [40]. The concentrations of K+ and Na+ ions were measured using the same instrument but following the emission method [41].
The determination of CO32− and HCO3 ions in water samples was conducted according to the GOST 31957-2012 method [42], while SO42− and Cl ions were analyzed using the ISO 9297:2011 and GOST 4389-72 methods, respectively [43,44].
To ensure the accuracy and reliability of the surface water sample testing, several quality assurance measures were implemented. High-purity water was used throughout the analyses to avoid contamination. All glassware used was thoroughly pre-washed with a 10% nitric acid (HNO3) solution to remove any potential residues or contaminants. Afterward, the glassware was carefully rinsed with distilled water to ensure it was free from any remaining chemicals before use in the sample analysis. Additionally, reference measurements were conducted alongside the sample testing to validate the results and confirm the reliability of the data. These precautions were taken to maintain the highest standards of analytical quality and ensure the credibility of the findings.

2.4. Data Analysis and Processing

All statistical analyses were conducted using Excel, ver. 2016 (Microsoft, Redmond, WA, USA) and Origin, ver. 2018 (OriginLab Corporation, Northampton, MA, USA). Mapping was performed using ArcGIS, ver. 10.3 (Esri, Redlands, CA, USA). Graphs were generated using Origin, ver. 2018 (OriginLab Corporation, Northampton, MA, USA). Freely accessible satellite datasets were utilized for land cover and land use classification within the Voghji River catchment area. Data from the Sentinel-1 and Sentinel-2 missions were selected due to their superior spatial resolution. To minimize cloud cover, enhance reflectance in the near-infrared (NIR) spectrum from green vegetation, and prevent misclassification caused by snow, all scenes were acquired between July and early October 2021 (https://apps.sentinel-hub.com/eo-browser, accessed on 5 March 2025).

3. Assessment of Irrigation Water Quality and Agroecological Hazards

EC values and the concentrations of major ions were compared with the FAO irrigation water standards [45]. The suitability of water for irrigation was evaluated using the Kelly index (KI) [46], magnesium adsorption ratio (MAR) [47], sodium percentage (Na%) [48], sodium adsorption ratio (SAR) [49], potential salinity (PS) [50], permeability index (PI) [50,51], residual sodium carbonate (RSC) [52], soluble sodium percentage (SSP) [53], Gibbs ratio [54], irrigation water quality index (IWQI) [55], US Salinity Laboratory diagram [56], and Wilcox diagram [57]. Additionally, GIS zoning maps were used to visualize the data for each parameter, providing a spatial understanding of the water quality variability across the study area.
The alkaline hazard of irrigation water for soil was assessed using the KI, calculated with the following equation [46]:
K I = Na + Ca 2 +   Mg 2 + ,
A KI greater than 1 indicates an excessive concentration of Na+, rendering the water unsuitable for irrigation.
The magnesium hazard of irrigation water for soil was evaluated using the MAR, calculated with the following equation [47]:
M A R = Mg 2 + Ca 2 +   Mg 2 + ×   100 ,
For irrigation water to be considered suitable, MAR values should be below 50%. The salinity levels of irrigation water were estimated using Na%, calculated with the following equation [48]:
N a % = Na + + K + Ca 2 +   Mg 2 + + Na + + K + × 100 ,
Based on Na% values, irrigation water can be classified into five categories: excellent (Na% < 20), good (Na% = 20–40%), acceptable (Na% = 40–60%), questionable (Na% = 60–80%), and unsuitable (Na% > 80%).
The sodium hazard of irrigation water for crops was assessed using the SAR, calculated with the following equation [49]:
S A R = N a + C a 2 + + M g 2 + 2 ,
The SAR categorizes water into four hazard levels:
  • Low sodium hazard (S1): SAR < 10. Water in this category is generally safe for irrigation, posing minimal risk to soil structure.
  • Medium sodium hazard (S2): SAR = 10–18. This water may lead to moderate sodium accumulation, particularly in soils with low permeability, such as clay-rich soils.
  • High sodium hazard (S3): SAR = 18–26. Water in this range can significantly affect the soil structure by causing clay dispersion, reducing permeability, and restricting aeration.
  • Very high sodium hazard (S4): SAR > 26. Irrigation with such water is generally unsuitable without prior treatment, as it can lead to severe soil degradation, reduced infiltration rates, and long-term agricultural unsustainability.
The combined effect of SAR and EC determines the overall suitability of water for irrigation, as high sodium levels (SAR) can amplify the effects of salinity (EC), leading to reduced soil permeability and an increased risk of soil degradation. Based on this relationship, irrigation water is classified into four categories according to EC [56]:
  • Low salinity risk (C1): EC < 250 µS/cm. Water in this category is suitable for most crops and soil types, posing minimal risk to plant growth.
  • Medium salinity risk (C2): EC = 250–750 µS/cm. This water is generally suitable for soils with moderate drainage.
  • High salinity risk (C3): EC = 750–2250 µS/cm. Water in this range may be problematic for soils with poor drainage, as excessive salt buildup can reduce crop yields.
  • Very high salinity risk (C4): EC > 2250 µS/cm. This water is generally unsuitable for irrigation under normal conditions.
The risk of high salt concentrations, caused by Cl and SO42−, in irrigation water was determined using the PS, calculated with the following equation [47]:
P S = Cl + SO 4 2 2 ,
For soils with low permeability, irrigation water is classified based on PS (meq/L) into three risk categories: class I (low, <3 meq/L), suitable for most crops with minimal risk of salt accumulation; class II (moderate, 3–5 meq/L), requiring careful management to prevent salinity buildup; and class III (high, >5 meq/L), posing a significant risk that necessitates mitigation measures such as leaching and improved drainage to sustain soil productivity.
The permeability of irrigation water in soil was evaluated using the PI, calculated with the following equation [50,51]:
P I = ( Na + + HCO 3 )   ×   100 ( Ca 2 + + Mg 2 + +   Na + ) ,
PI levels are classified into three categories: class I (excellent) and class II (good), with values above 75% and between 25% and 75%, respectively, both considered suitable for irrigation. Class III, with values below 25%, is considered unsuitable for irrigation.
The sodicity risk of irrigation water for soil was estimated using the RSC, calculated with the following equation [52]:
R S C = ( HCO 3 + CO 3 2 ) ( Mg 2 + + Ca 2 + ) ,
When RSC < 1.25 meq/L, the water is safe for irrigation with minimal sodicity risk. RSC = 1.25–2.50 meq/L indicates marginal quality, and RSC > 2.5 meq/L poses a high sodicity risk.
The salinity of irrigation water was assessed using the SSP, calculated with the following equation [53]:
S S P = Na + Ca 2 + + Mg 2 + + Na + + K + ×   100 ,
SSP values above 50% indicate unsuitable water quality for irrigation, as they reduce soil permeability.
The chemical influence in irrigation water due to natural mechanisms was examined using Gibbs ratios, calculated with the following equations [54]:
G i b b s   r a t i o   ( I ) = Cl Cl + HCO 3 ,
G i b b s   r a t i o   ( I I ) = Na + + K + Na + + K + + Ca + ,
Irrigation water quality was evaluated using the IWQI, calculated with the following equation [55]:
I W Q I = i = 1 n q i w i ,
where qi represents the quality measurement value within the permissible range (Table 2), and wi denotes the specified weight of each data set (Table 3). The IWQI is classified into five categories, as shown in Table 4.
The qi values for the water quality parameters (qEC, qSAR, qNa+, qCl, and qHCO3−) were determined using the equation below:
q i = q max ( x ij x inf × q imap x amp )
where qmax is the upper value of the corresponding class of qi, xij represents the data points of the parameters (observed value of each parameter), xinf refers to the lower limit value of the class to which the observed parameter belongs, qimap represents the class amplitude for qi classes, and xamp corresponds to the class amplitude to which the parameter belongs.

4. Results and Discussion

4.1. Assessment of EC and Major Ions in Surface Waters

Figure 3 presents a summary of the results related to the physicochemical characteristics examined in this study. The average concentrations of K+, Na+, Mg2+, Ca2+, Cl, SO42−, HCO3, and CO32− in the Voghji River catchment area in July were 8.65, 19.43, 6.79, 29.18, 6.03, 85.51, 91.13, and 5.10 mg/L, respectively. In September, the concentrations were 9.26, 30.06, 12.13, 41.20, 11.93, 116.70, and 179.34 mg/L (Figure 3). In September, CO32− was not detected at any study site, while in July, it was recorded only at Va-6 and G-7 sites, with concentrations of 9 mg/L and 1.2 mg/L, respectively (Figure 3).
The ion concentrations in July followed the sequences: Ca2+ > Na+ > K+ > Mg2+ and HCO3 > SO42− > Cl > CO32−. In September, the sequences were: Ca2+ > Na+ > Mg2+ > K+ and HCO3 > SO42− > Cl > CO32−. The ion sequences in July and September were almost identical, with a slight difference observed in the cations, particularly between Mg2+ and K+. Overall, the findings indicated that Ca2+ and HCO3 were the dominant ions in the surface water samples studied.
EC values measured at seven locations in the Voghji River catchment basin ranged from 76 µS/cm to 834 µS/cm, with average values of 313 µS/cm in July and 491 µS/cm in September. The most abundant cation in the catchment basin was Ca2+, with concentrations ranging from 8.8 mg/L to 72.9 mg/L. The average concentrations were 29.18 mg/L in July and 41.20 mg/L in September. The second most dominant cation was Na+, with concentrations ranging from 0.20 mg/L to 80.09 mg/L, and average values of 19.43 mg/L in July and 30.06 mg/L in September. Mg2+ concentrations in the collected samples ranged from 3.9 mg/L to 17.9 mg/L, with average values of 6.79 mg/L in July and 12.13 mg/L in September. K+ concentrations ranged from 0.42 mg/L to 27.94 mg/L, with average values of 8.65 mg/L in July and 9.26 mg/L in September. HCO3 was the predominant anion in the surface waters of the Voghji River catchment basin, with concentrations ranging from 42.7 mg/L to 298.0 mg/L. The mean concentrations were 91.13 mg/L in July and 179.34 mg/L in September. The second most abundant anion was SO42−, with concentrations ranging from 17.9 mg/L to 350.4 mg/L and average values of 85.51 mg/L in July and 116.70 mg/L in September, followed by Cl, which ranged from 2.8 mg/L to 34.4 mg/L, with average values of 6.03 mg/L in July and 11.93 mg/L in September. These values indicate that the surface waters in the Voghji River catchment basin were suitable for irrigation, as they were well below the FAO threshold values (Figure 3). However, the CO32− levels between 0 mg/L and 9 mg/L, with an average of 1.46 mg/L in July and 0 mg/L in September, exceeded the FAO threshold value at the Va-6 site in July (Figure 3). The CO32− concentration was only detected at Va-6 and G-7 sites in July.

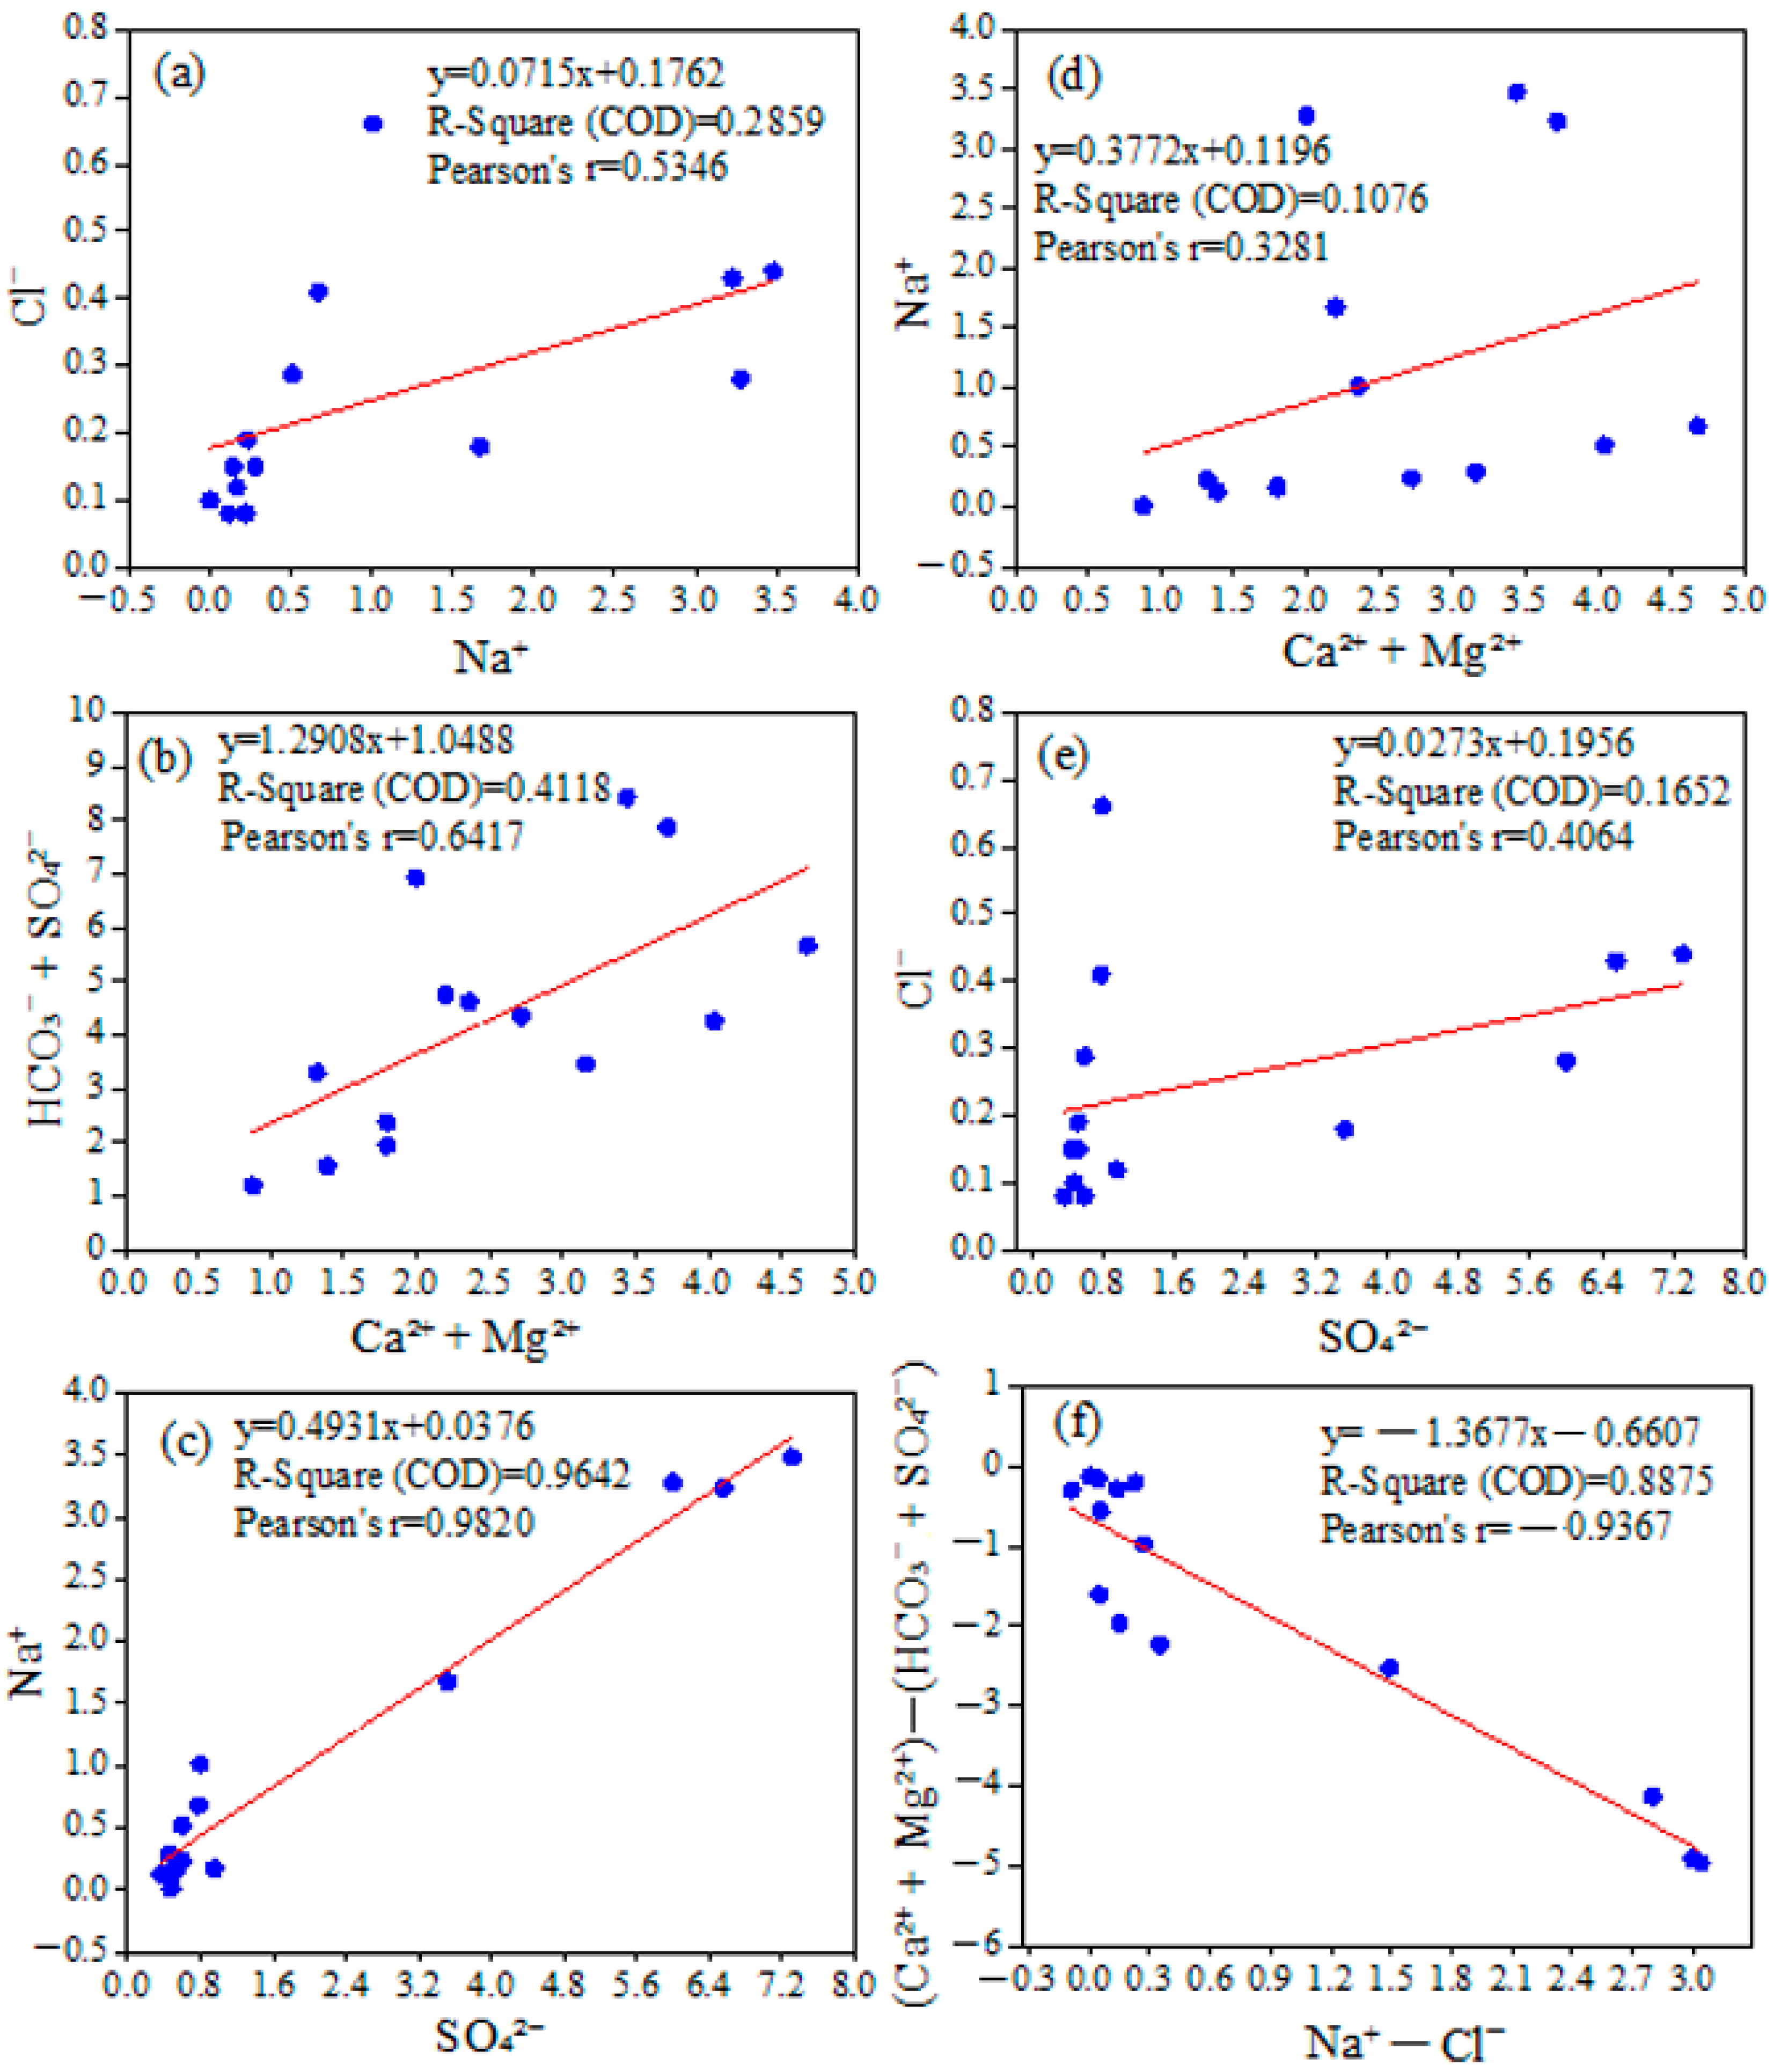
4.2. Hydrochemical Facies and Source Identification in Surface Waters

In the Voghji River catchment basin, surface water facies and geochemical factors were studied, revealing the dominance of HCO3 in cations and a more uniform distribution of Ca2+, Na+, and K+ in anions. The hydrochemical properties of the surface water samples indicated the presence of Ca2+-HCO3 and mixed Ca2+-K+- SO42−-Cl water facies.
Ionic relationships were used to track the evolution of geochemical factors in the surface waters of the Voghji River catchment basin. In particular, the relationship between Na+ and Cl is crucial for understanding the processes and mechanisms affecting water properties in the studied region. Surface water samples showed a moderate positive correlation (Figure 4a), suggesting that both ions likely originated from common sources such as halite dissolution or anthropogenic inputs. Most of the samples fell near or below the equiline, indicating that Cl levels in the surface waters were not primarily due to salt-bearing chlorides but may have been influenced by other sources, such as anthropogenic inputs or minor saline water intrusion. However, a subset of the samples plots above the equiline, pointing to additional geochemical processes such as silicate weathering and cation exchange. These processes resulted in Na+ enrichment, where Na+ ions were released through the weathering of silicate minerals or exchanged with Ca2+ and Mg2+ in soils and sediments. This deviation from the equiline further supports the role of these processes in influencing the water chemistry. The plot of HCO3 + SO42− vs. Ca2+ + Mg2+ revealed a strong positive correlation (Figure 4b), indicating that carbonate rock weathering (e.g., calcite, dolomite) and gypsum dissolution were likely the dominant geochemical processes in the region. This suggests that the release of Ca2+ and Mg2+ ions into the surface waters were primarily driven by the dissolution of these minerals. A nearly perfect correlation between Na+ and SO42− further strengthens the geochemical link between these two ions (Figure 4c), likely resulting from the dissolution of sodium sulfate minerals or from agricultural and industrial inputs that contributed Na+ and SO42− ions to the water system. The Na+ vs. (Ca2+ + Mg2+) plot showed a weak relationship (Figure 4d), suggesting that Na+ likely originated from different processes compared to Ca2+ and Mg2+. While Na+ may have derived from silicate weathering or anthropogenic sources, Ca2+ and Mg2+ were more likely released from carbonate dissolution processes. The weak correlation between Cl and SO42− suggests that these two ions had distinct sources (Figure 4e). SO42− was likely influenced by gypsum dissolution or human activities, while Cl may reflect saline water intrusion into the catchment basin. Finally, the negative correlation in the plot of (Ca2+ + Mg2+) − (HCO3 + SO42−) vs. (Na+ − Cl) highlights the role of cation exchange processes (Figure 4f). In this case, Na+ was likely replacing Ca2+ and Mg2+ in soils or clays, leading to the observed negative correlation between these variables.
Figure 5 shows that most of the samples were located in the atmospherically dominated field of the rocks, indicating that the primary natural mechanism determining the water chemistry was the interaction between water and rocks. Additionally, the diagram suggests that evaporation influenced the waters. The Cl/(Cl + HCO3) ratios ranged from 0.02 meq/L to 0.69 meq/L in July, with an average of 0.28 meq/L, and from 0.14 meq/L to 0.64 meq/L in September, with an average of 0.35 meq/L, indicating strong anion exchange in the water system. The Na+/(Na+ + Ca2+) ratios ranged from 0.06 meq/L to 0.23 meq/L in July, with an average of 0.12 meq/L, and from 0.03 meq/L to 0.29 meq/L in September, with an average of 0.13 meq/L (Figure 5).

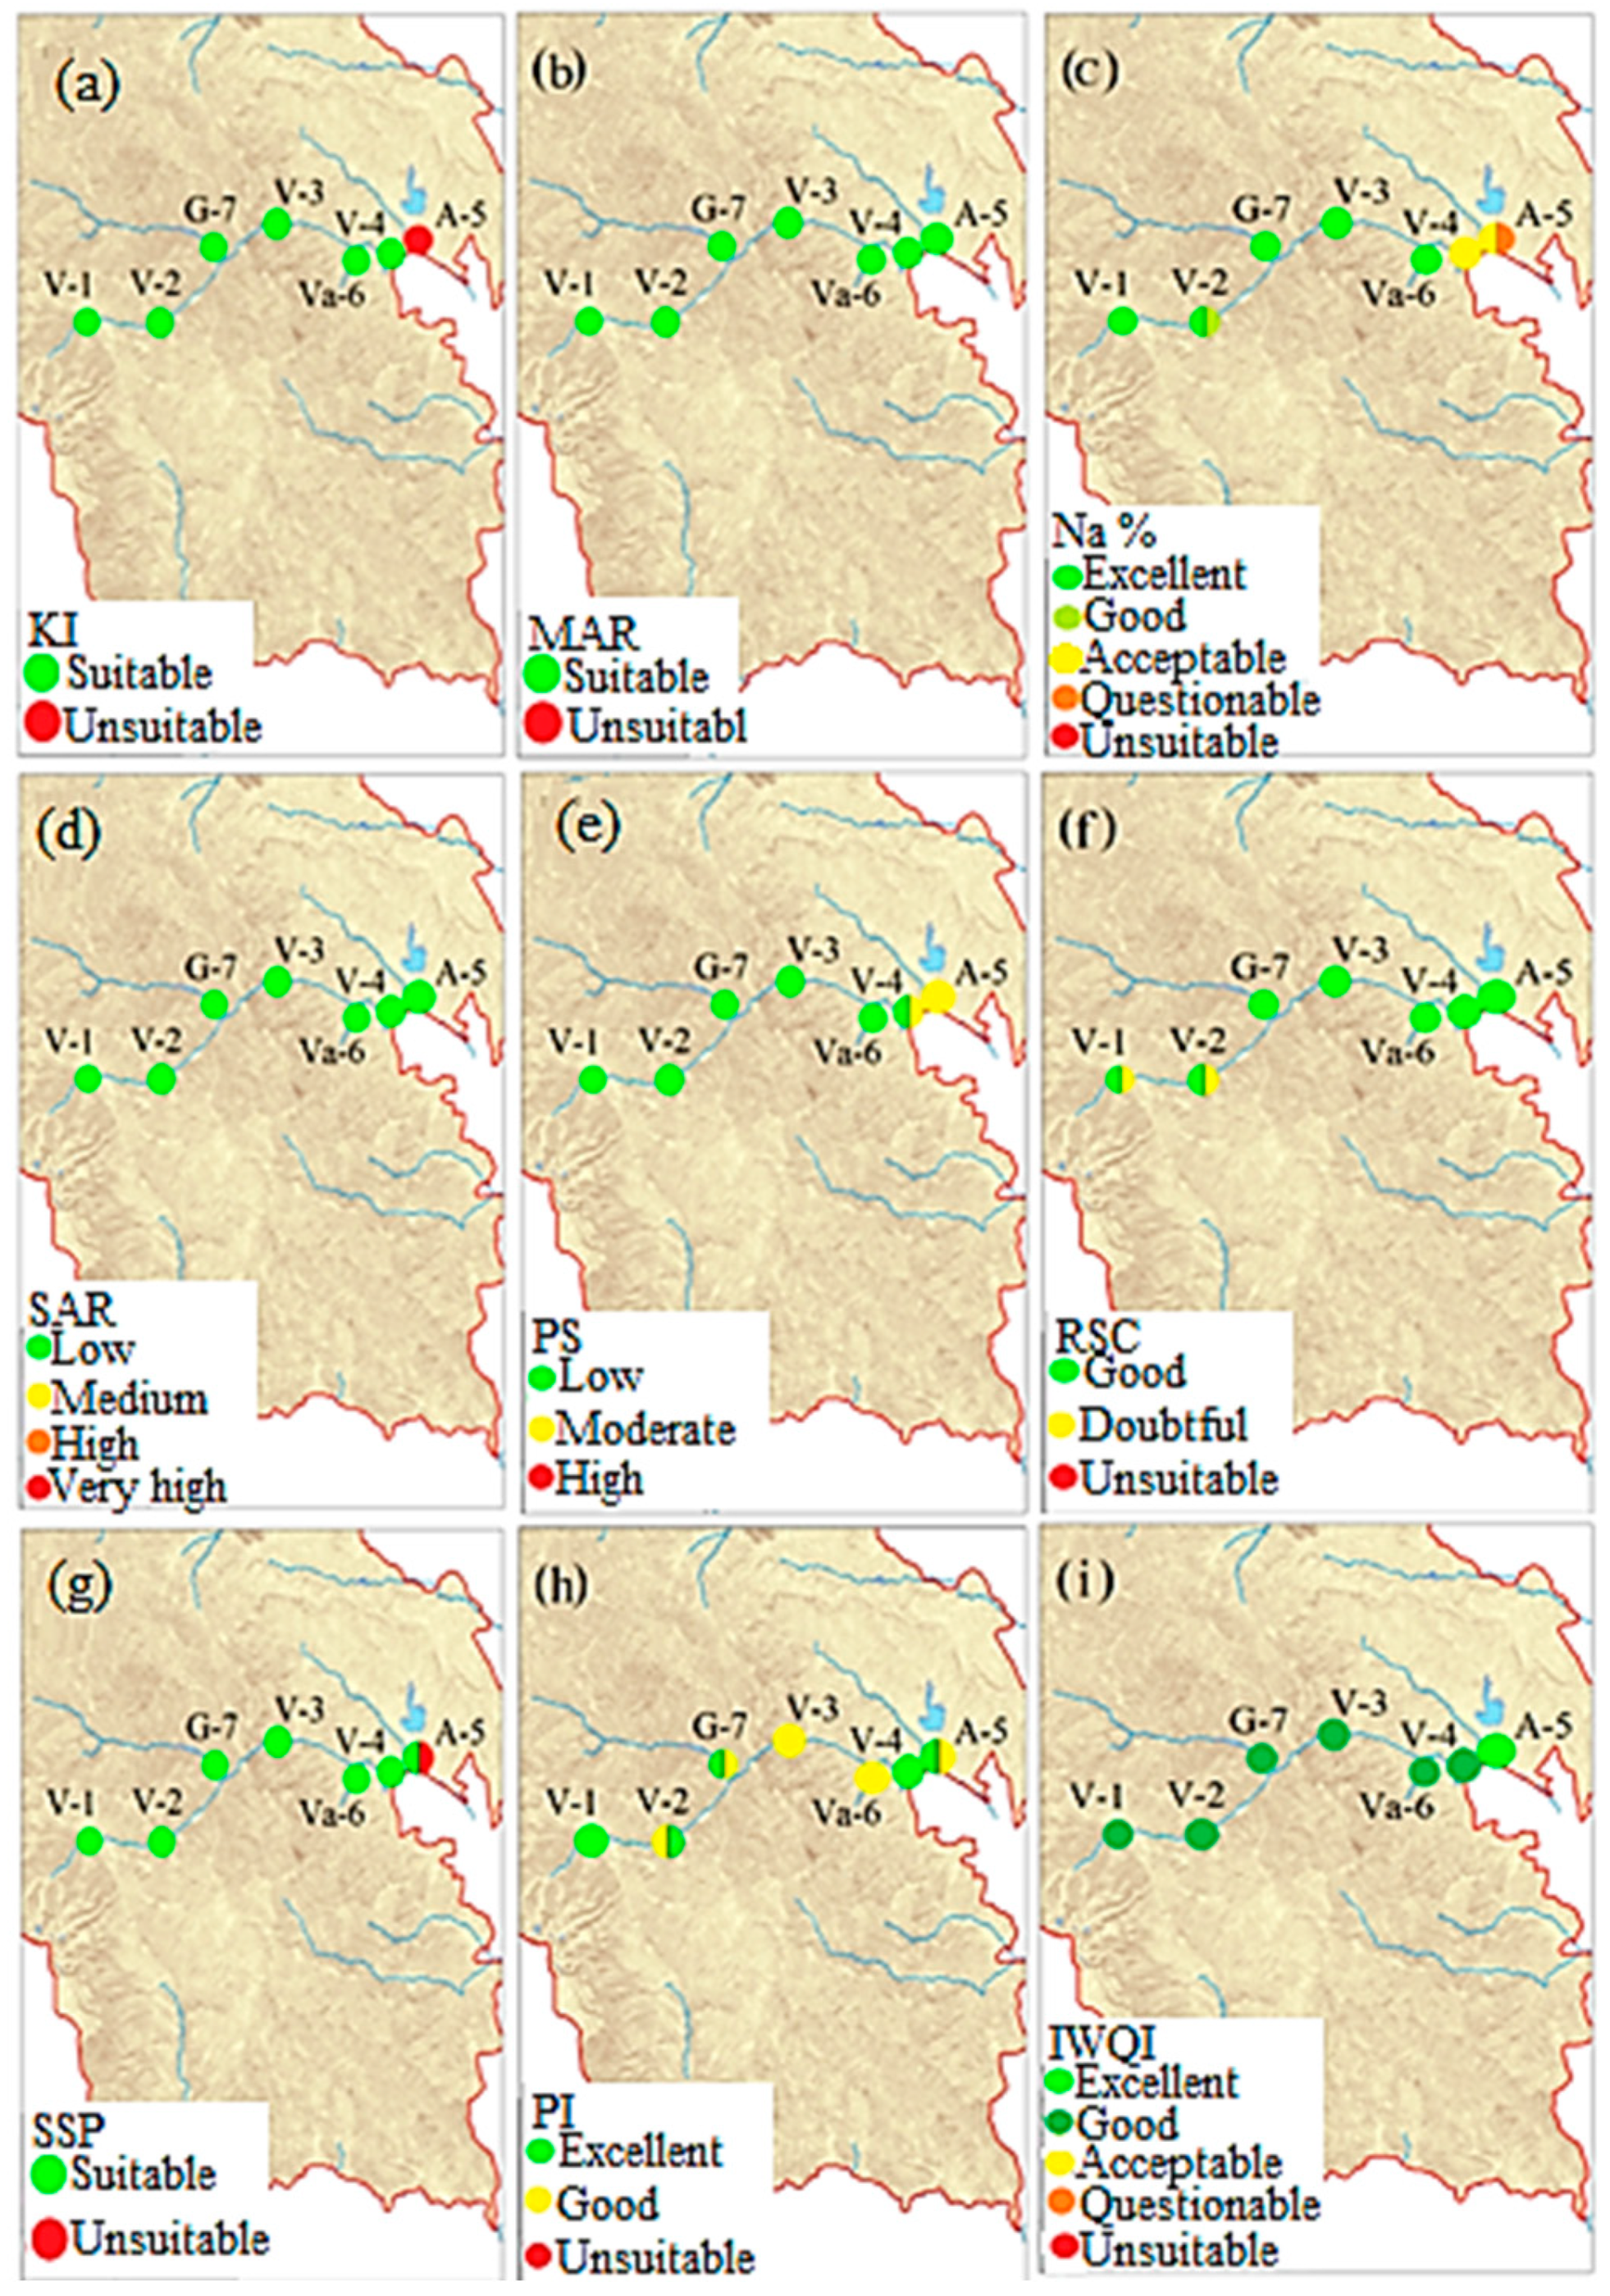
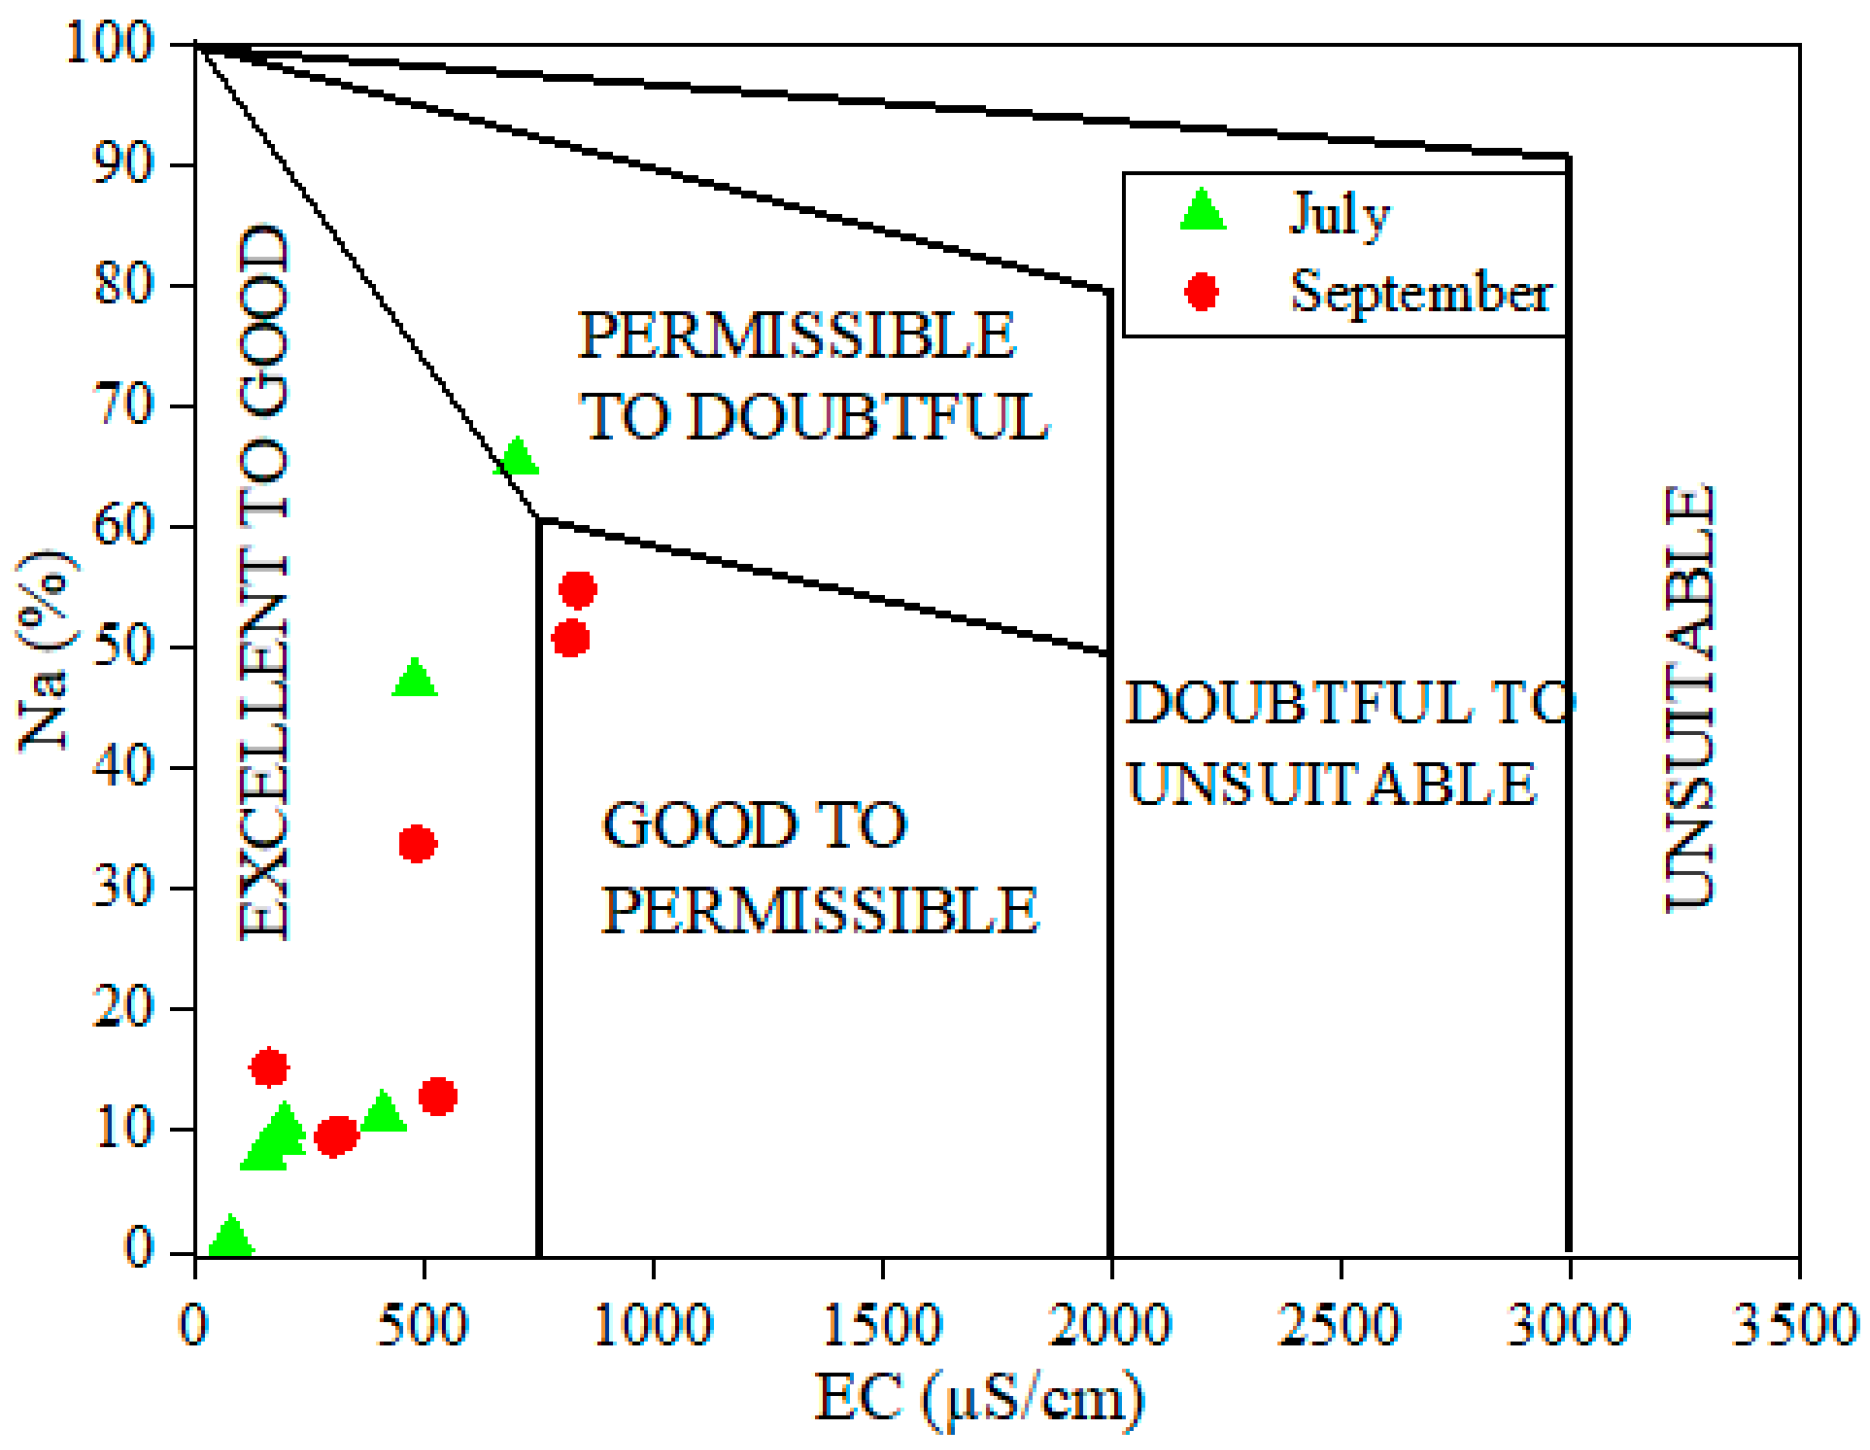
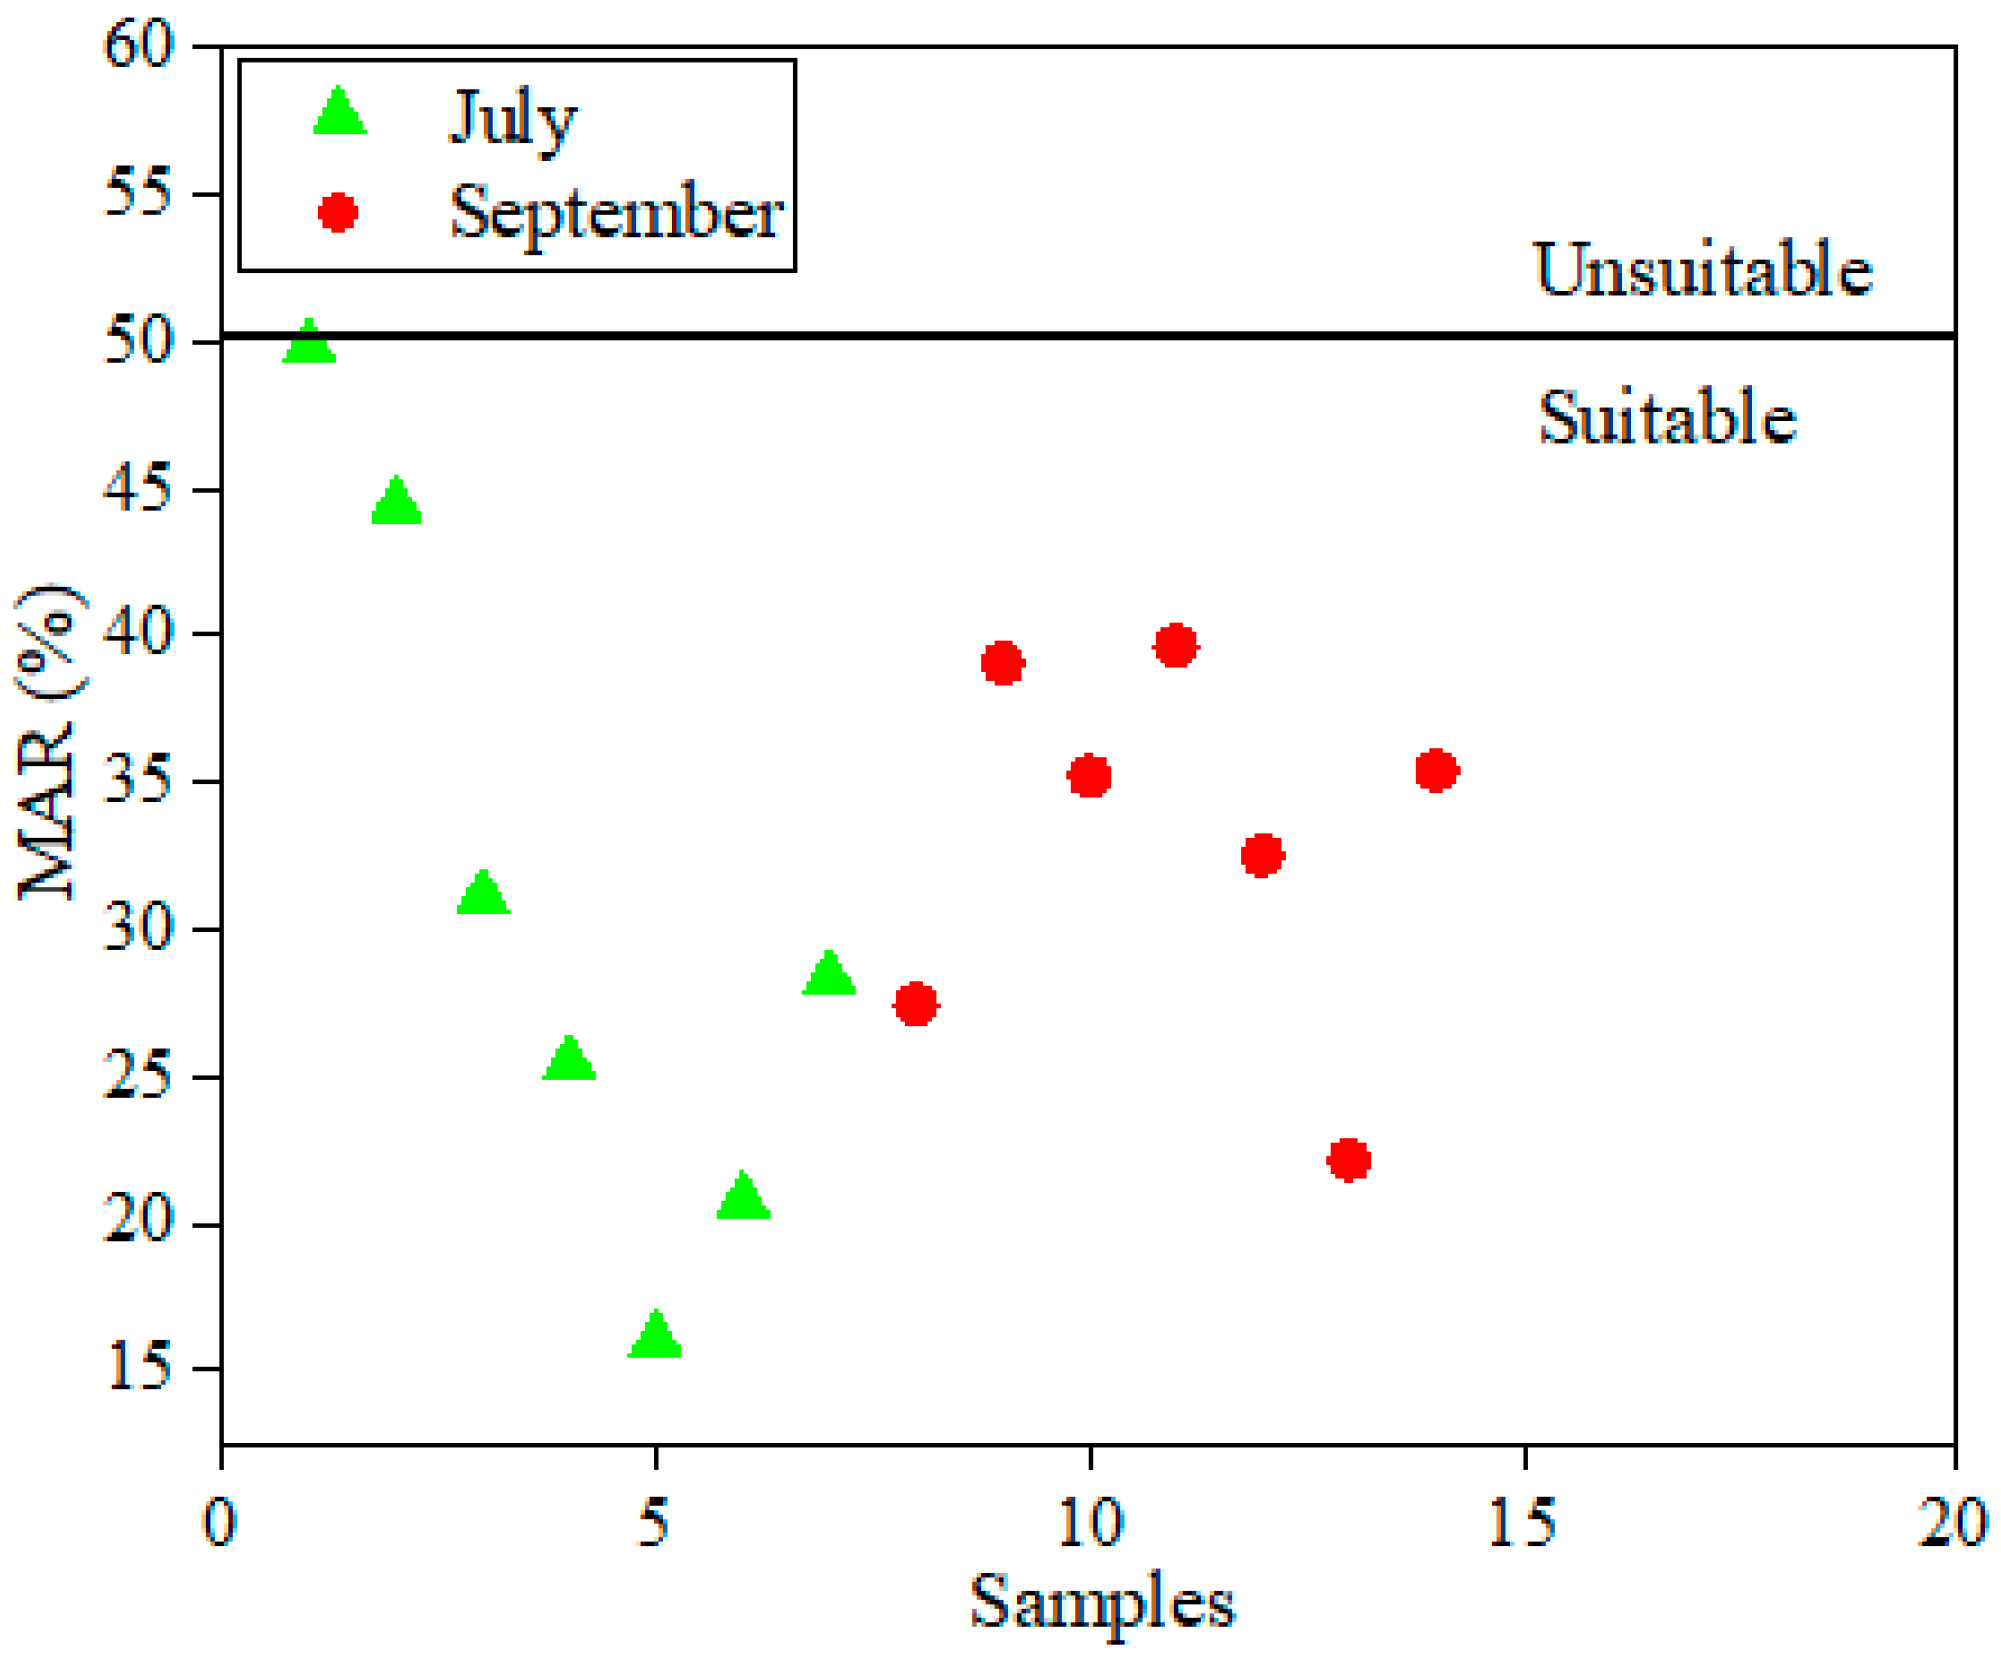
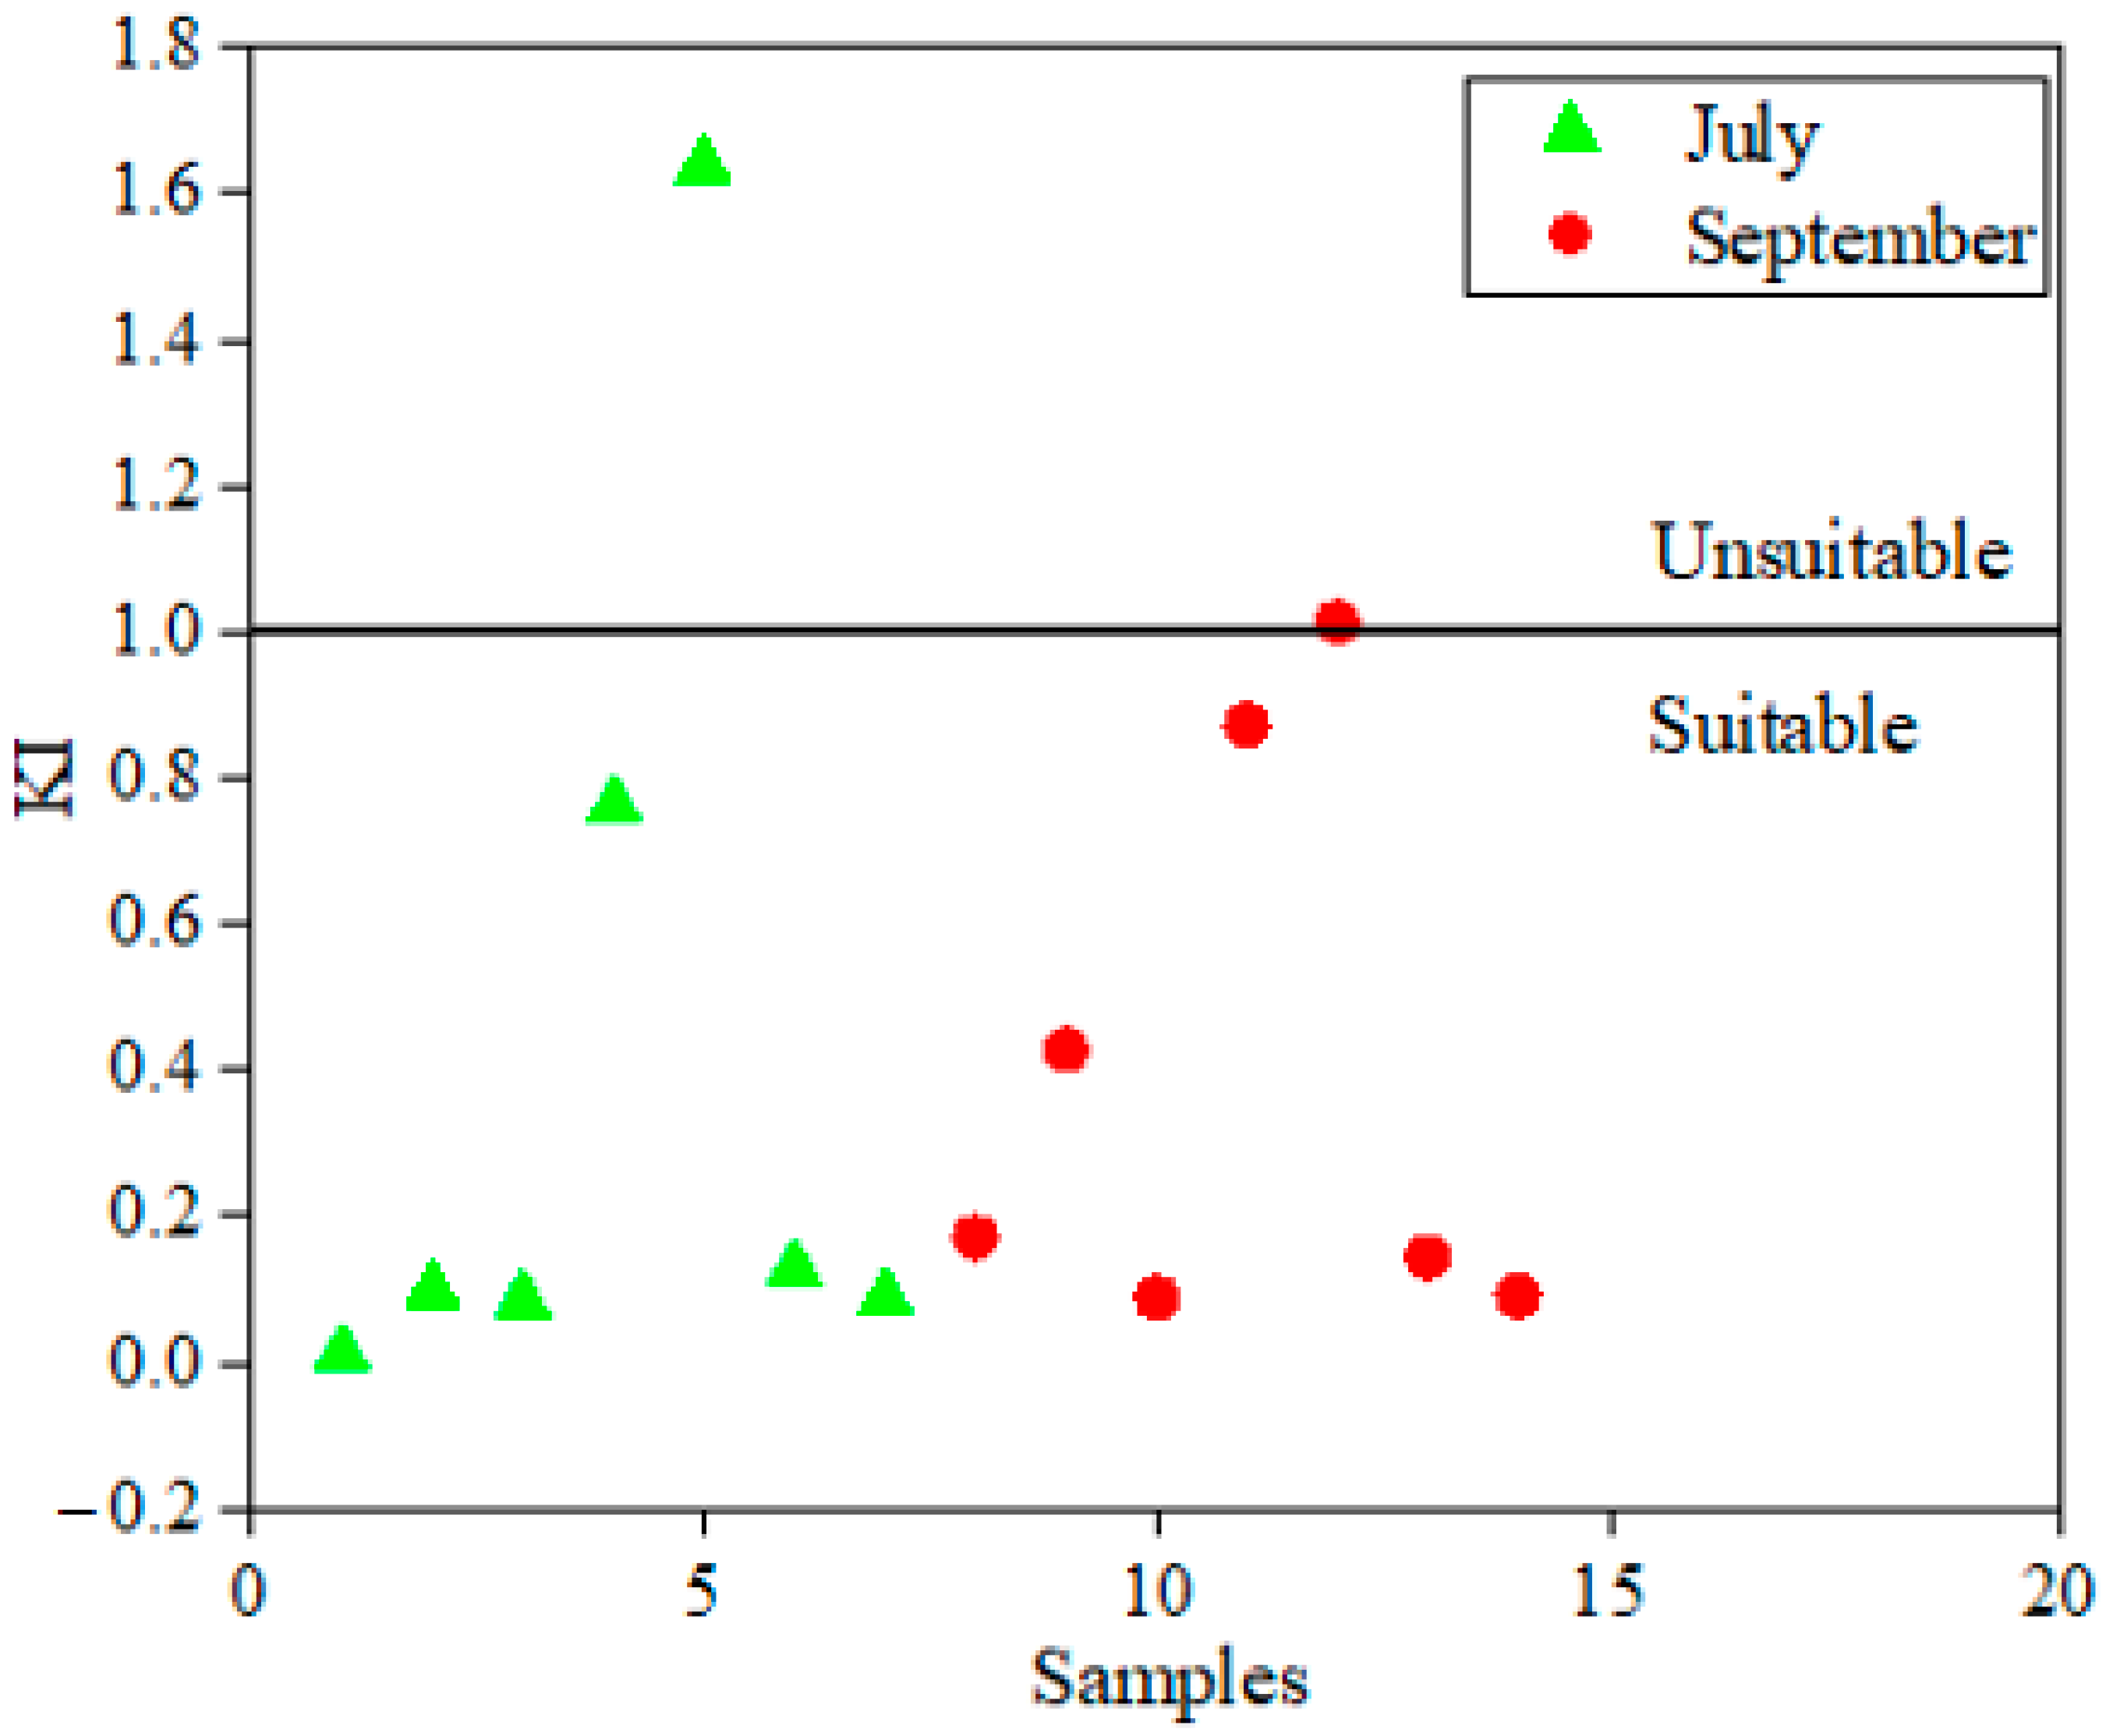
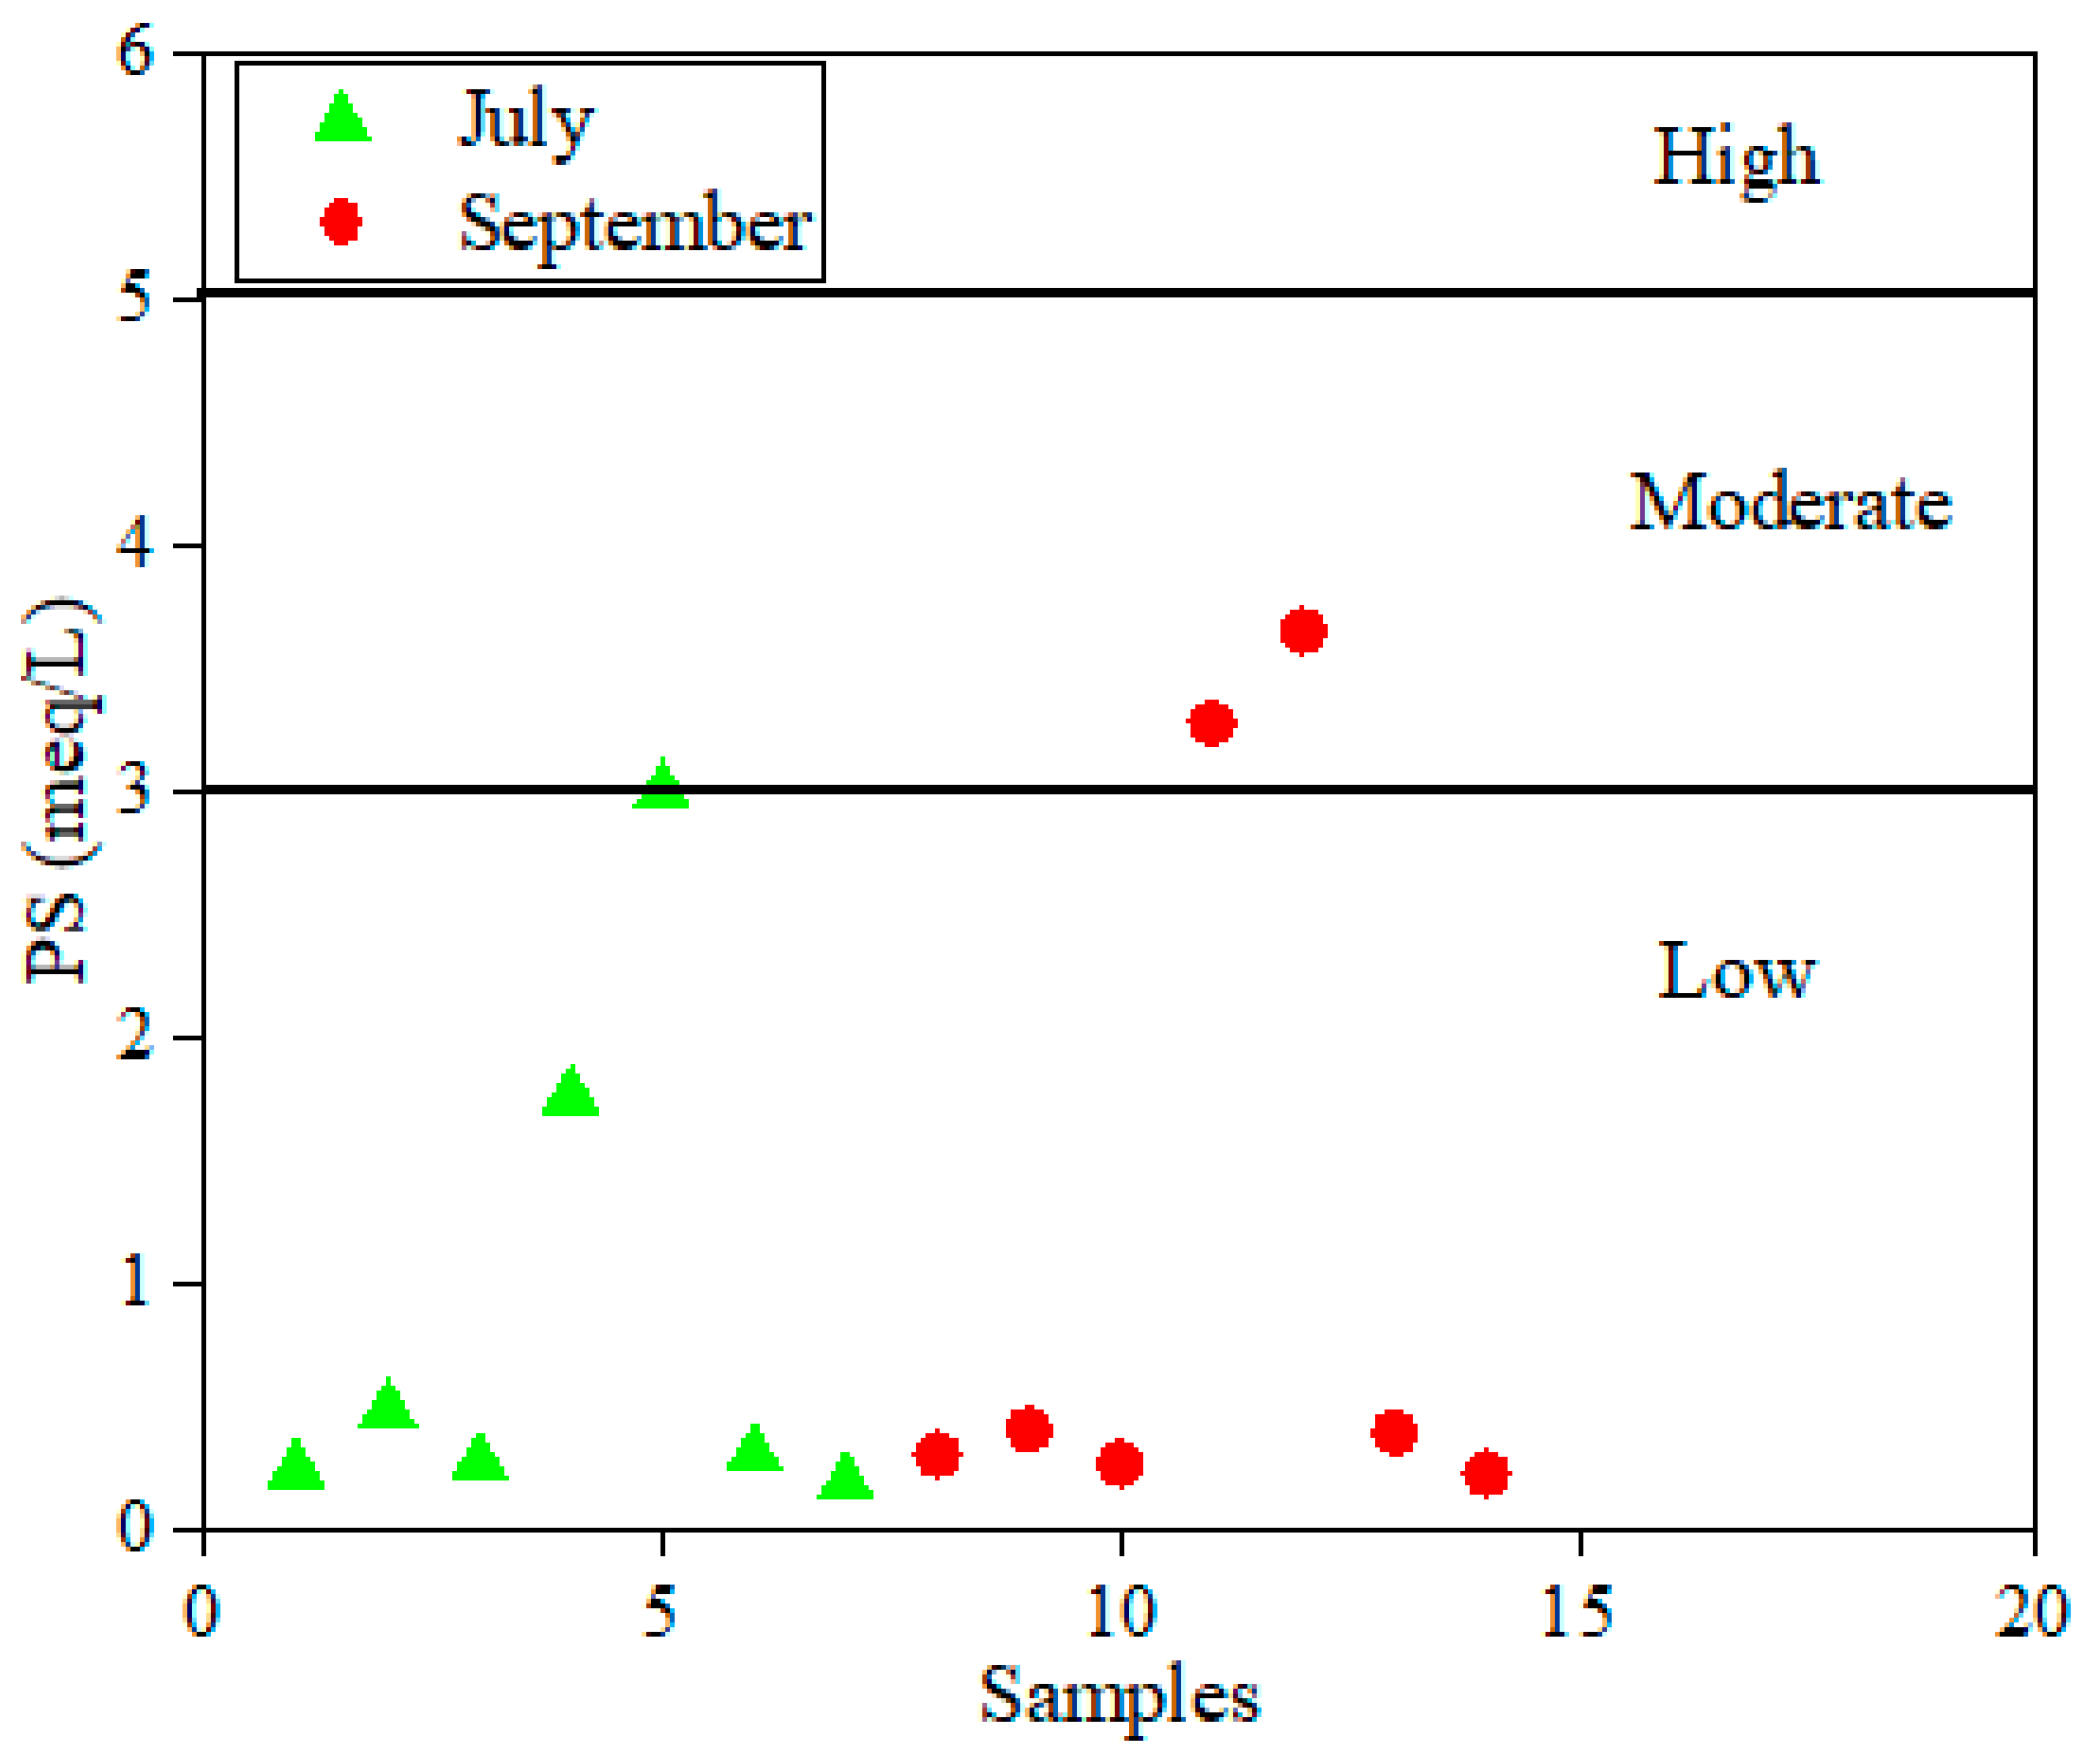
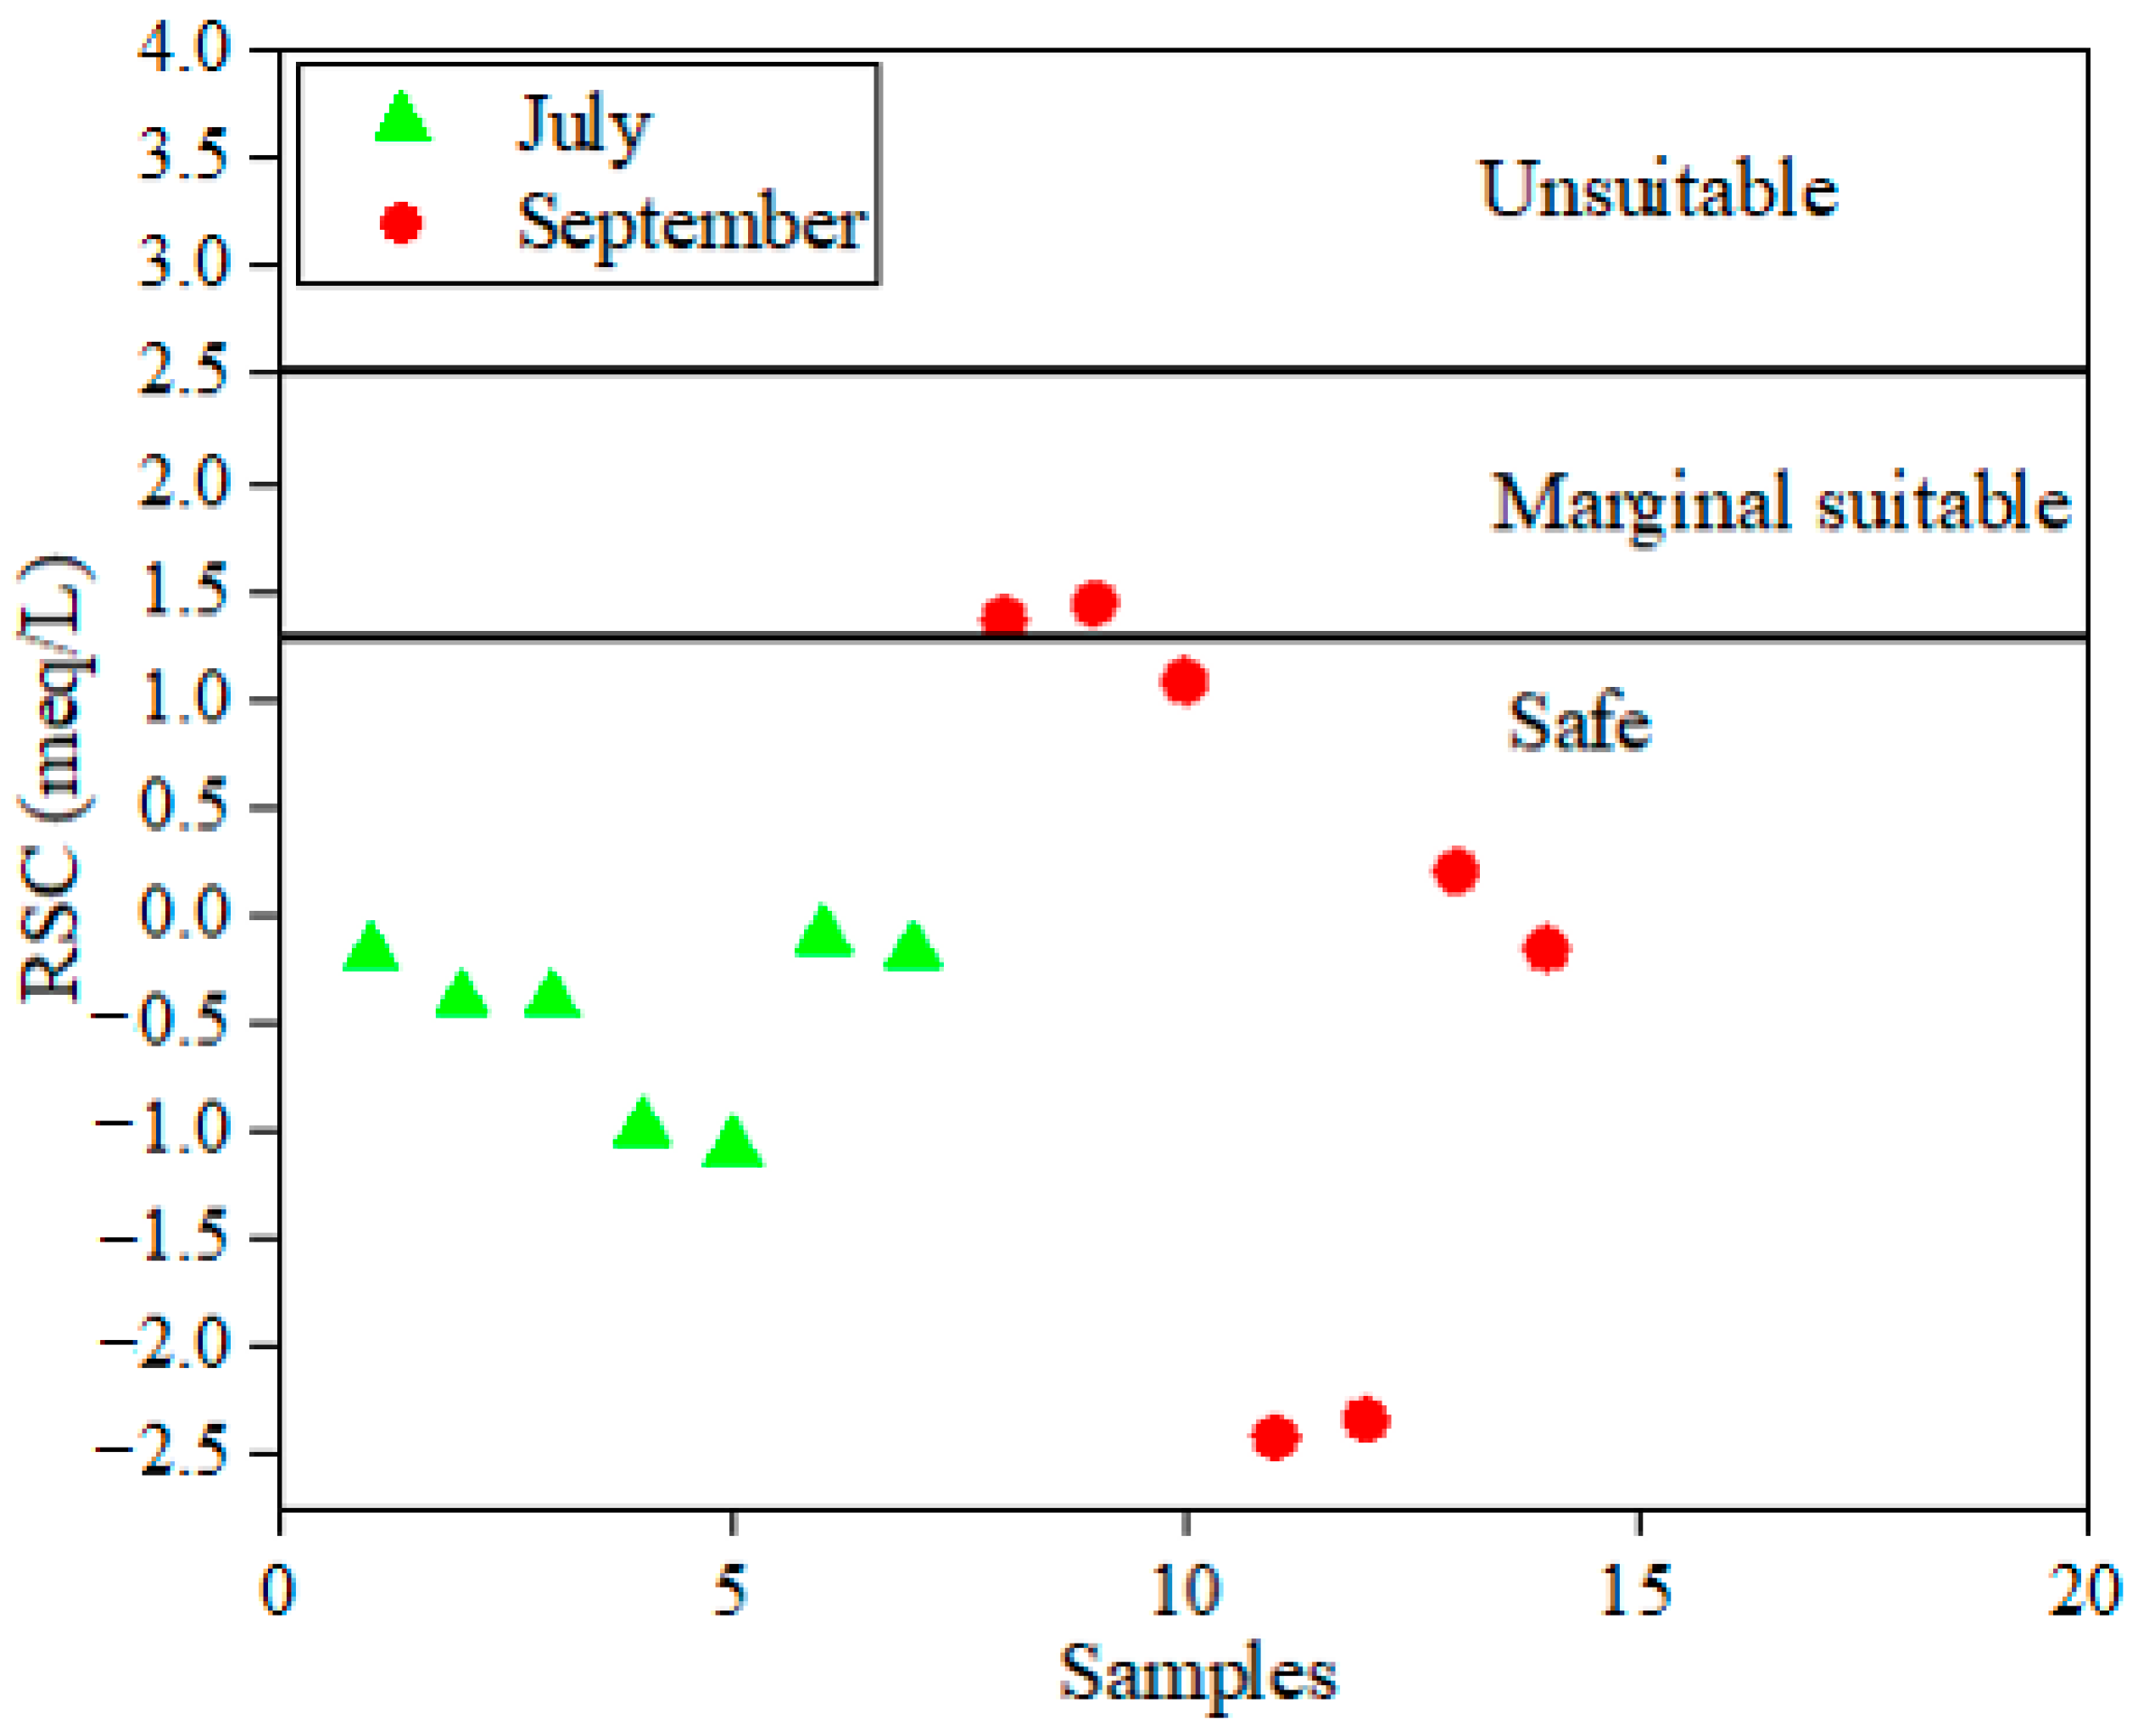
4.3. Assessment of Irrigation Surface Water Quality

Figure 6 illustrates the distribution of several integrated water quality indices based on physicochemical characteristics, revealing a significant variation in the surface water quality within the Voghji River catchment basin for irrigation purposes. This variability was likely influenced by a combination of geological factors and anthropogenic impacts, which contributed to the differing water quality across the region.
SAR values ranged from 0.02 to 3.28 in July, with an average of 0.82, and from 0.21 to 2.66 in September, with an average of 1.02. As shown in Figure 4d, the surface waters were classified as excellent quality, indicating their suitability for irrigation without posing any alkalinity risk to crops. Furthermore, the SAR spatial distribution map demonstrates that the quality of the surface waters for irrigation remained consistent from upstream to downstream (Figure 6d). To classify irrigation water, the SAR was plotted against the EC, revealing that most surface water points were categorized within the C1-S1 and C2-S1 groups, characterized by medium salinity, low sodium content, and high suitability for irrigation (Figure 7). However, in September, the C3-S1 group included V-4 and A-5 sampling points. This indicates that an effective drainage system and adequate soil permeability are essential to optimize agricultural irrigation and mitigate salinity risks.
The Na% ranged from 1.01% to 65.53% in July, with an average of 21.81%, and from 9.75% to 54.94% in September, with an average of 26.71% (Figure 8). The surface water quality for crop irrigation varied from excellent to questionable (Figure 6c). Based on the Wilcox classification [48], the surface waters ranged from excellent to good and good to acceptable quality for irrigation, indicating that the waters were unlikely to cause soil alkalization and were suitable for irrigation (Figure 8).
SSP values of the collected surface water samples ranged from 1.13% to 65.50% in July, with a mean of 21.82%, and from 9.46% to 54.98% in September, with a mean of 26.73%. Based on the SSP classification, the surface water samples with SSP levels below 60% were considered safe for irrigation (Figure 6g and Figure 9). However, one exception was observed at the A-5 site in July, where the SSP value reached 65.5%, classifying the water as poor quality and unsuitable for irrigation. At the same site in September, the SSP value decreased to 54.98%, remaining high but within the acceptable limit (Figure 9).
MAR values of the sampled water points ranged from 16.03% to 49.83% in July, with an average of 30.85%, and from 22.17% to 39.64% in September, with an average of 33.06% (Figure 10). These results indicate that the surface waters in all sampling points were suitable for irrigation (Figure 6b).
KI values of the sampled water points ranged from 0.01 to 1.64 in July, with an average of 0.40, and from 0.09 to 1.01 in September, with an average of 0.40 (Figure 11). Comparing the data of two months, KI values generally increased at most stations in September, with the largest rise at V-2 (+0.33) and V-1 (+0.16), while A-5 exhibited a notable decrease (−0.63), indicating possible seasonal or local influences. In July, the A-5 station had the highest KI value, making it unsuitable for irrigation, while all other stations had KI values below 1, indicating their waters were suitable for irrigation. In September, A-5 remained unsuitable with a KI value of 1.01, but the other stations continued to show suitability for irrigation, as their KI values remained below 1 (Figure 11). Overall, except for A-5, all other stations had waters suitable for irrigation (Figure 6a).
PS values of the sampled water points ranged from 0.34 meq/L to 3.28 meq/L in July, with an average of 1.06 meq/L, and from 0.37 meq/L to 4.10 meq/L in September, with an average of 1.55 meq/L (Figure 12). In July, all stations except V-4 and A-5 remained in class I (low risk), indicating that the waters at V-1, V-2, V-3, Va-6, and G-7 had low salinity and posed minimal risk for crops. V-4 and A-5 were in class II (moderate risk), with PS values of 1.94 meq/L and 3.28 meq/L, respectively, suggesting a moderate risk that requires careful management to avoid salt buildup. In September, V-1, V-2, V-3, Va-6, and G-7 continued to be in class I, with PS values ranging from 0.26 meq/L to 0.80 meq/L. V-4 and A-5 showed an increase in PS, reaching 3.71 meq/L and 4.10 meq/L, respectively, placing them in class II (moderate risk), requiring ongoing monitoring and careful management to prevent salinity issues. No station fell into class III (high risk), meaning there was no immediate severe threat of excessive salinity accumulation. Overall, the waters from most stations were suitable for irrigation with minimal salinity concerns, though V-4 and A-5 need careful management due to their moderate salinity levels (Figure 6e).
RSC values of the sampled water points ranged from −1.08 meq/L to −0.1 meq/L in July, with an average of −0.50 meq/L, and from −2.42 meq/L to 1.44 meq/L in September, with an average of −0.20 meq/L (Figure 13). In July, all stations had negative RSC values, placing them in the safe category and indicating no risk of sodicity, making the waters suitable for irrigation. However, while negative RSC values suggest sufficient Ca2+ and Mg2+ to counteract Na+ accumulation, a slight risk of Na+ buildup remained. In contrast, positive RSC values indicate that HCO3 and CO32− may have precipitated Ca2+ and Mg2+, creating space for Na+ accumulation. In September, most stations remained in the safe category. However, V-1 and V-2 recorded RSC values of 1.37 meq/L and 1.44 meq/L, respectively, placing them in the borderline category and requiring close monitoring to prevent long-term soil degradation. The remaining stations maintained safe RSC levels. Notably, no site exceeded the 2.5 meq/L threshold, indicating no immediate risk of high Na+ accumulation. Overall, while the irrigation waters remained largely suitable, the increasing RSC values at V-1 and V-2 in September warrant attention and proactive irrigation management to mitigate potential long-term soil quality issues (Figure 6f).
PI values of the sampled water points ranged from 53.23% to 95.12% in July, with an average of 73.96%, and from 53.86% to 97.1% in September, with an average of 72.28% (Figure 14). In July, three stations (V-1, A-5, and G-7) exhibited excellent class, indicating minimal restrictions on irrigation. Four stations (V-2, V-3, V-4, and Va-6) fell into good class, indicating good but moderately suitable irrigation waters. In September, V-1 remained in excellent class, while V-2 improved from good to excellent class, reflecting the improvement in water quality at this location. However, A-5 and G-7 moved from excellent to good class, suggesting a slight decline in water quality. The other stations (V-3, V-4, and Va-6) remained in a good class, indicating stable but moderately suitable irrigation waters. Overall, the findings showed that all sites were classified as excellent and/or good (Figure 6h). Most of the water samples exhibited 75–100% of maximum permeability, while only two samples indicated 25% of maximum permeability (Figure 14).

5. Limitations and Future Outlook

The study of irrigation water quality in the Voghji River catchment basin is limited by its spatial coverage, as the sampling sites may not fully represent the entire river basin, particularly the upper reaches. However, the selected sampling locations encompass key areas that are most likely to be influenced by both anthropogenic and natural contamination sources. It is important to note that the study may not comprehensively account for all human-made and natural impacts on water quality. Additionally, variations in water flow dynamics and contamination sources may further affect the results. Future research that includes groundwater sampling, alongside surface water, would provide a clearer understanding of the interactions between surface water and groundwater, and their combined impact on water quality [58,59]. Given that this study focused on the lower basin of the Voghji River catchment in Armenia, the findings may not be directly applicable to regions with different environmental and demographic characteristics. The upper basin, which may exhibit distinct characteristics, could be the focus of future studies to broaden the scope and applicability of the findings.
Additionally, the study focused on a specific set of physicochemical parameters related to water quality. To provide a more comprehensive assessment of water quality and its potential effects on both agriculture and human health, it would be beneficial to include additional factors, such as heavy metals, pesticides, and microbiological indicators. Expanding the scope to include these elements would enhance the overall understanding of water quality. Furthermore, integrating socioeconomic aspects, such as water demand, land use, and socio-cultural practices, into future studies could improve water quality management and inform decision-making processes.

6. Conclusions

This study evaluated the chemical characteristics of river waters in the Voghji River catchment basin for irrigation purposes, with samples taken from seven different locations. The findings indicated that Ca2+ and HCO3 were the dominant ions in the surface water samples. The hydrochemical analysis of the Voghji River catchment basin revealed that surface water facies were dominated by HCO3 in cations and exhibited a mixed Ca2+-HCO3 and Ca2+-K+-SO42−-Cl composition. Geochemical processes such as carbonate and gypsum dissolution, silicate weathering, and cation exchange played a key role in shaping the water chemistry. The Na+-Cl relationship suggests contributions from both natural and anthropogenic sources, while ionic correlations highlight distinct geochemical pathways, including sodium enrichment and cation exchange mechanisms.
The study also assessed the suitability of waters from various sampling points for irrigation, considering key parameters such as Na+, Ca2+, Mg2+, Cl, SO42−, and others. The results revealed that the waters from most stations were suitable for irrigation, with low salinity and no immediate risk of soil alkalization or sodicity. However, the Achanan River near the mouth (A5) and the Voghji River downstream of Kapan Town (V4) exhibited moderate salinity levels, requiring careful management. The A-5 site, in particular, may have been impacted by potential effluent from the Artsvanik tailing dam, the largest tailings storage facility in Armenia, which could have subsequently influenced water quality at the V-4 station. Furthermore, water quality at the V-4 site may have been affected by domestic and mining discharges from Kapan Town and its surrounding areas. SAR and PI values indicated that most of the water sources had low salinity, high permeability, and minimal risk to soil quality. RSC values for the majority of stations were within the safe range.
The Gibbs diagram highlighted that the primary natural mechanisms influencing the water chemistry were rock–water interactions, with evaporation also playing a significant role. In conclusion, the study suggests that most of the analyzed water sources were generally suitable for irrigation, although A-5 and V-4 sites require careful management to avoid potential salinity and sodicity issues.

Author Contributions

Conceptualization, G.G. and A.V. (Ashok Vaseashta); methodology, G.G., G.K., A.V. (Anita Varagyan), and V.V.; software, G.K. and G.G.; validation, G.G., G.K., and A.V. (Ashok Vaseashta); formal analysis, G.K. and G.G.; investigation, G.G., A.V. (Anita Varagyan), V.V., and G.K.; resources, G.G.; data curation, G.G., G.K., A.V. (Anita Varagyan), and V.V.; writing—original draft preparation, G.K. and G.G.; writing—review and editing, G.G. and A.V. (Ashok Vaseashta); visualization, G.K., G.G., and A.V. (Ashok Vaseashta); supervision, G.G.; project administration, G.G.; funding acquisition, G.G. All authors have read and agreed to the published version of the manuscript.

Funding

This work was partly supported by the Higher Education and Science Committee of the Ministry of Education, Science, Culture, and Sports (MESCS) of the Republic of Armenia under research project No. 23LCG-1F005.

Data Availability Statement

All data are presented in the article. If additional information is needed, it is available via the corresponding author, upon reasonable request.

Conflicts of Interest

The authors declare no conflict of interest—financial or otherwise.

Abbreviations

The following abbreviations used in this manuscript may be helpful to readers.
ECElectroconductivity
FAOFood and Agriculture Organization
GISGeographic Information System
IWQIIrrigation Water Quality Index
KIKelly Index
MARMagnesium Absorption Ratio
MESCMinistry of Education, Science, Culture, and Sports
SARSodium Adsorption Ratio
SSPSoluble Sodium Percentage
PIPermeability Index
RSCResidual sodium carbonate
TDSTotal Dissolved Solids

References

  1. Ingrao, C.; Strippoli, R.; Lagioia, G.; Huisingh, D. Water Scarcity in Agriculture: An Overview of Causes, Impacts and Approaches for Reducing the Risks. Heliyon 2023, 9, e18507. [Google Scholar] [CrossRef]
  2. Feng, T.; Xiong, R.; Huan, P. Productive Use of Natural Resources in Agriculture: The Main Policy Lessons. Resour. Policy 2023, 85, 103793. [Google Scholar] [CrossRef]
  3. Pawlak, K.; Kołodziejczak, M. The Role of Agriculture in Ensuring Food Security in Developing Countries: Considerations in the Context of the Problem of Sustainable Food Production. Sustainability 2020, 12, 5488. [Google Scholar] [CrossRef]
  4. Vaseashta, A. Introduction to Water Safety, Security and Sustainability. In Water Safety, Security and Sustainability; Advanced Sciences and Technologies for Security Applications; Vaseashta, A., Maftei, C., Eds.; Springer International Publishing: Cham, Switzerland, 2021; pp. 3–22. ISBN 978-3-030-76007-6. [Google Scholar]
  5. Mishra, B.; Kumar, P.; Saraswat, C.; Chakraborty, S.; Gautam, A. Water Security in a Changing Environment: Concept, Challenges and Solutions. Water 2021, 13, 490. [Google Scholar] [CrossRef]
  6. Hanjra, M.A.; Qureshi, M.E. Global Water Crisis and Future Food Security in an Era of Climate Change. Food Policy 2010, 35, 365–377. [Google Scholar] [CrossRef]
  7. Okello, C.; Githiora, Y.W.; Sithole, S.; Owuor, M.A. Nature-Based Solutions for Water Resource Management in Africa’s Arid and Sem-Arid Lands (ASALs): A Systematic Review of Existing Interventions. Nat.-Based Solut. 2024, 6, 100172. [Google Scholar] [CrossRef]
  8. Shemer, H.; Wald, S.; Semiat, R. Challenges and Solutions for Global Water Scarcity. Membranes 2023, 13, 612. [Google Scholar] [CrossRef]
  9. Smith, P.; Ashmore, M.R.; Black, H.I.J.; Burgess, P.J.; Evans, C.D.; Quine, T.A.; Thomson, A.M.; Hicks, K.; Orr, H.G. REVIEW: The Role of Ecosystems and Their Management in Regulating Climate, and Soil, Water and Air Quality. J. Appl. Ecol. 2013, 50, 812–829. [Google Scholar] [CrossRef]
  10. Musie, W.; Gonfa, G. Fresh Water Resource, Scarcity, Water Salinity Challenges and Possible Remedies: A Review. Heliyon 2023, 9, e18685. [Google Scholar] [CrossRef]
  11. Baggio, G.; Qadir, M.; Smakhtin, V. Freshwater Availability Status across Countries for Human and Ecosystem Needs. Sci. Total Environ. 2021, 792, 148230. [Google Scholar] [CrossRef]
  12. Cosgrove, W.J.; Loucks, D.P. Water Management: Current and Future Challenges and Research Directions. Water Resour. Res. 2015, 51, 4823–4839. [Google Scholar] [CrossRef]
  13. Bashir, I.; Lone, F.A.; Bhat, R.A.; Mir, S.A.; Dar, Z.A.; Dar, S.A. Concerns and Threats of Contamination on Aquatic Ecosystems. In Bioremediation and Biotechnology; Hakeem, K.R., Bhat, R.A., Qadri, H., Eds.; Springer International Publishing: Cham, Switzerland, 2020; pp. 1–26. ISBN 978-3-030-35690-3. [Google Scholar]
  14. Issaka, S.; Ashraf, M.A. Impact of Soil Erosion and Degradation on Water Quality: A Review. Geol. Ecol. Landsc. 2017, 1, 1–11. [Google Scholar] [CrossRef]
  15. Anh, N.T.; Can, L.D.; Nhan, N.T.; Schmalz, B.; Luu, T.L. Influences of Key Factors on River Water Quality in Urban and Rural Areas: A Review. Case Stud. Chem. Environ. Eng. 2023, 8, 100424. [Google Scholar] [CrossRef]
  16. Dinar, A. Challenges to Water Resource Management: The Role of Economic and Modeling Approaches. Water 2024, 16, 610. [Google Scholar] [CrossRef]
  17. Levidow, L.; Zaccaria, D.; Maia, R.; Vivas, E.; Todorovic, M.; Scardigno, A. Improving Water-Efficient Irrigation: Prospects and Difficulties of Innovative Practices. Agric. Water Manag. 2014, 146, 84–94. [Google Scholar] [CrossRef]
  18. Mishra, S.; Kumar, R.; Kumar, M. Use of Treated Sewage or Wastewater as an Irrigation Water for Agricultural Purposes- Environmental, Health, and Economic Impacts. Total Environ. Res. Themes 2023, 6, 100051. [Google Scholar] [CrossRef]
  19. Stagnari, F.; Jan, S.; Angelica, G.; Michele, P. Sustainable Agricultural Practices for Water Quality Protection. In Water Stress and Crop Plants; Ahmad, P., Ed.; Wiley: Hoboken, NJ, USA, 2016; pp. 75–85. ISBN 978-1-119-05436-8. [Google Scholar]
  20. World Bank. Armenia—General Water Security Assessment; Europe and Central Asia Region: Yerevan, Armenia, 2024; p. 48. [Google Scholar]
  21. Varol, M.; Tokatli, C. Evaluation of the Water Quality of a Highly Polluted Stream with Water Quality Indices and Health Risk Assessment Methods. Chemosphere 2023, 311, 137096. [Google Scholar] [CrossRef]
  22. Mohammed, M.A.A.; Szabó, N.P.; Szűcs, P. Multivariate Statistical and Hydrochemical Approaches for Evaluation of Groundwater Quality in North Bahri City-Sudan. Heliyon 2022, 8, e11308. [Google Scholar] [CrossRef]
  23. Gevorgyan, G.; Mamyan, A.; Boshyan, T.; Vardanyan, T.; Vaseashta, A. Heavy Metal Contamination in an Industrially Affected River Catchment Basin: Assessment, Effects, and Mitigation. Int. J. Environ. Res. Public Health 2021, 18, 2881. [Google Scholar] [CrossRef]
  24. Mammeri, A.; Tiri, A.; Belkhiri, L.; Salhi, H.; Brella, D.; Lakouas, E.; Tahraoui, H.; Amrane, A.; Mouni, L. Assessment of Surface Water Quality Using Water Quality Index and Discriminant Analysis Method. Water 2023, 15, 680. [Google Scholar] [CrossRef]
  25. Chan Kujiek, D.; Sahile, Z.A. Water Quality Assessment of Elgo River in Ethiopia Using CCME, WQI and IWQI for Domestic and Agricultural Usage. Heliyon 2024, 10, e23234. [Google Scholar] [CrossRef]
  26. Ushurhe, O.; Ozabor, F.; Onyeayana, W.V.; Adekunle, O.; Christabel, I.C.; Chike, D.F. Seasonal Sodium Percentage (%NA), Absorption Ratio (SAR) and Irrigation Water Quality Index (IWQI) Determination for Irrigation Purposes Along River Ethiope, Southern Nigeria. J. Water Resour. Prot. 2024, 16, 523–537. [Google Scholar] [CrossRef]
  27. Satish Kumar, V.; Amarender, B.; Dhakate, R.; Sankaran, S.; Raj Kumar, K. Assessment of Groundwater Quality for Drinking and Irrigation Use in Shallow Hard Rock Aquifer of Pudunagaram, Palakkad District Kerala. Appl. Water Sci. 2016, 6, 149–167. [Google Scholar] [CrossRef]
  28. Mokhtar, A.; Elbeltagi, A.; Gyasi-Agyei, Y.; Al-Ansari, N.; Abdel-Fattah, M.K. Prediction of Irrigation Water Quality Indices Based on Machine Learning and Regression Models. Appl. Water Sci. 2022, 12, 76. [Google Scholar] [CrossRef]
  29. Eid, M.H.; Elbagory, M.; Tamma, A.A.; Gad, M.; Elsayed, S.; Hussein, H.; Moghanm, F.S.; Omara, A.E.-D.; Kovács, A.; Péter, S. Evaluation of Groundwater Quality for Irrigation in Deep Aquifers Using Multiple Graphical and Indexing Approaches Supported with Machine Learning Models and GIS Techniques, Souf Valley, Algeria. Water 2023, 15, 182. [Google Scholar] [CrossRef]
  30. Gevorgyan, G.; Varagyan, V.; Varagyan, A. Agricultural Risk Assessment of the Heavy Metal and Mineral Salt Pollution of River Ecosystems in the Voghji River Catchment Area, Armenia. Biol. J. Armen. 2016, 4, 92–97. [Google Scholar]
  31. Gad, M.; Saleh, A.H.; Hussein, H.; Elsayed, S.; Farouk, M. Water Quality Evaluation and Prediction Using Irrigation Indices, Artificial Neural Networks, and Partial Least Square Regression Models for the Nile River, Egypt. Water 2023, 15, 2244. [Google Scholar] [CrossRef]
  32. Kramer, I.; Mau, Y. Review: Modeling the Effects of Salinity and Sodicity in Agricultural Systems. Water Resour. Res. 2023, 59, e2023WR034750. [Google Scholar] [CrossRef]
  33. Varagyan, A.L.; Gevorgyan, G.A.; Varagyan, V.M. Mineral Salt Content in the Water of the Voghji River Catchment Basin (Armenia): Assessment of Potential Effects on Irrigated Soils and Crops. Proc. YSU B Chem. Biol. Sci. 2018, 52, 204–210. [Google Scholar] [CrossRef]
  34. Viktorovich Larionov, M.; Haykaram Galstyan, M.; Garnik Ghukasyan, A.; Gagik Matevosyan, L.; Lendrush Hakobjanyan, I.; Arayik Gharibyan, P.; Yakhsibek Sayadyan, H.; Shahen Sargsyan, K. The Ecological and Sanitary-Hygienic Assessment of the River Systems Located in the Technogenic Polluted Zone of the Caucasus. Egypt. J. Aquat. Res. 2024, 50, 189–199. [Google Scholar] [CrossRef]
  35. Mkrtchyan, S.S.; Gabrielyan, A.H.; Maghakyan, H.G.; Pafengolts, K.N.; Vardanyants, L.A. (Eds.) Geology of the Armenian SSR, Volume I: Geomorphology; Academy of Sciences Press: Yerevan, Armenia, 1962. (In Russian) [Google Scholar]
  36. Fichtner Water & Transportation GmbH; Jrtuc LLC. Armenian Small Municipalities Water Project: Environmental Impact Assessment—Kapan; Project No. 610-1182; AWS CJSC: Yerevan, Armenia, 2013. [Google Scholar]
  37. Gabrielyan, A.V.; Shahnazaryan, G.A.; Minasyan, S.H. Distribution and Identification of Sources of Heavy Metals in the Voghji River Basin Impacted by Mining Activities (Armenia). J. Chem. 2018, 2018, 7172426. [Google Scholar] [CrossRef]
  38. Gevorgyan, G. Ecological Assessment of the Voghji and Meghriget Rivers and Their Catchment Basins. Ph.D Thesis, Yerevan State University, Yerevan, Armenia, 2011. [Google Scholar]
  39. Rusydi, A.F. Correlation between Conductivity and Total Dissolved Solid in Various Type of Water: A Review. IOP Conf. Ser. Earth Environ. Sci. 2018, 118, 012019. [Google Scholar] [CrossRef]
  40. ISO 9964-3:1986; Water Quality—Determination of Calcium and Magnesium—Atomic Absorption Spectrometric Method. International Organization for Standardization ISO: London, UK, 1986.
  41. ISO 9964-3:1993; Water Quality—Determination of Sodium and Potassium—Part 3: Determination of Sodium and Potassium by Flame Emission Spectrometry. International Organization for Standardization ISO: London, UK, 1993.
  42. GOST 31957-2012; Water—Methods for Determination of Alkalinity and Mass Concentration of Carbonates and Hydrocarbonates. Interstate Council for Standardization, Metrology, and Certification (ISC): Moscow, Russia, 2012.
  43. ISO 9297:2011; Water Quality—Determination of Chloride—Silver Nitrate Titration with Chromate Indicator (Mohr’s Method). International Organization for Standardization: London, UK, 2011.
  44. GOST 4389-72; Drinking Water—Methods for Determination of Sulfate Content. Interstate Council for Standardization, Metrology, and Certification (ISC) Standard Publishing House: Moscow, Russia, 1972.
  45. Ayers, R.; Westcott, D. Water Quality for Agriculture—Food and Agricultural Organization of the United Nations; Food and Agricultural Organization of the United Nations: Rome, Italy, 1994. [Google Scholar]
  46. Kelly, W.P. Permissible Composition and Concentration of Irrigation Water. Trans. Am. Soc. Civ. Eng. 1941, 106, 849–855. [Google Scholar] [CrossRef]
  47. Szabolcs, I.; Darab, C. The Influences of Irrigation Water of High Sodium Carbonate Contents on Soils. In Proceedings of the 8th International Congress Soil Science Sodic Soils, Bucharest, Romania, 31 August–9 September 1964; pp. 802–812. [Google Scholar]
  48. Wilcox, L.V. Classification and Use of Irrigation Waters; Department of Agriculture: Washington, DC, USA, 1955. [Google Scholar]
  49. Richards, L.A. Diagnosis and Improvement of Saline and Alkali Soils. Soil Sci. 1954, 78, 154. [Google Scholar] [CrossRef]
  50. Doneen, L.D. Notes on Water Quality in Agriculture; University of California: Davis, CA, USA, 1964. [Google Scholar]
  51. Doneen, L.D. The Influence of Crop and Soil on Percolating Waters. In Proceedings of the 1961 Biennial Conference Groundwater Recharge, Bekley, CA, USA, 26–27 June 1962; pp. 156–163. [Google Scholar]
  52. Eaton, F.M. Significance of Carbonates in Irrigation Waters. Soil Sci. 1950, 69, 123–134. [Google Scholar] [CrossRef]
  53. Todd, D.K. Groundwater Hydrology; Wiley: Hoboken, NJ, USA, 1980; ISBN 13: 9788126508365. [Google Scholar]
  54. Gibbs, R.J. Mechanisms Controlling World Water Chemistry. Science 1970, 170, 1088–1090. [Google Scholar] [CrossRef]
  55. Meireles, A.C.M.; Andrade, E.M.D.; Chaves, L.C.G.; Frischkorn, H.; Crisostomo, L.A. A New Proposal of the Classification of Irrigation Water. Rev. Ciênc. Agron. 2010, 41, 349–357. [Google Scholar] [CrossRef]
  56. McGeorge, W.T. Diagnosis and Improvement of Saline and Alkaline Soils: By Staff of U. S. Salinity Laboratory, Agriculture Handbook No. 60 U. S. Dept. Agric., Supt. Documents, U.S. Government Printing Office Washington 25, D.C., 1954, 160 Pages, $2.00. Soil Sci. Soc Amer. J. 1954, 18, 348. [Google Scholar] [CrossRef]
  57. Wilcox, L.V. The Quality of Water for Irrigation Use; United States Department of Agriculture (USDA): Washington, DC, USA, 1948. [Google Scholar] [CrossRef]
  58. Vaseashta, A.; Gevorgyan, G.; Kavaz, D.; Ivanov, O.; Jawaid, M.; Vasović, D. Exposome, Biomonitoring, Assessment and Data Analytics to Quantify Universal Water Quality. In Water Safety, Security and Sustainability; Advanced Sciences and Technologies for Security Applications; Vaseashta, A., Maftei, C., Eds.; Springer International Publishing: Cham, Switzerland, 2021; pp. 67–114. ISBN 978-3-030-76007-6. [Google Scholar]
  59. Vaseashta, A.; Duca, G.; Travin, S.O. Handbook of Research on Water Sciences and Society; Engineering Science Reference: Hershey, PA, Canada, 2022; ISBN 978-1-79987-356-3. [Google Scholar]
Figure 1. Land cover and land use classification within the Voghji River catchment area.
Water 17 00854 g001
Figure 2. Location of the Voghji River and its catchment area in Armenia, along with the river observation sites as listed in Table 1.
Water 17 00854 g002
Figure 3. Quantitative values of EC and major ions at observation points in the Voghji River catchment basin in comparison with FAO regulatory thresholds [45].
Water 17 00854 g003
Figure 4. The relationships between major ions and their ionic ratios for the water samples acquired (meq/L): (a) Cl vs. Na+, (b) HCO3 + SO42− vs. Ca2+ + Mg2+, (c) Na+ vs. SO42−, (d) Na+ vs. Ca2+ + Mg2+, (e) Cl vs. SO42−, and (f) (Ca2+ + Mg2+) − (HCO3 + SO42−) vs. (Na+ − Cl).
Water 17 00854 g004
Figure 5. Chemical characteristics of surface waters in the Voghji River catchment basin based on Gibbs diagram: (a) Na+/(Na+ + Ca2+), (b) Cl/(Cl + HCO3) [54].
Water 17 00854 g005
Figure 6. Maps showing the distribution of integrated water quality indices within the Voghji River catchment basin: (a) KI, (b) MAR, (c) Na%, (d) SAR, (e) PS, (f) RSC, (g) SSP, (h) PI, and (i) IWQI.
Water 17 00854 g006
Figure 7. Irrigation water quality in the Voghji River catchment basin based on US Salinity Laboratory diagram [56].
Water 17 00854 g007
Figure 8. Irrigation water quality in the Voghji River catchment basin based on Wilcox diagram [57].
Water 17 00854 g008
Figure 9. SSP values in the Voghji River catchment basin.
Water 17 00854 g009
Figure 10. MAR values in the Voghji River catchment basin.
Water 17 00854 g010
Figure 11. KI values in the Voghji River catchment basin.
Water 17 00854 g011
Figure 12. PS values in the Voghji River catchment basin.
Water 17 00854 g012
Figure 13. RSC values in the Voghji River catchment basin.
Water 17 00854 g013
Figure 14. PI values in the Voghji River catchment basin based on the Doneen classification [51].
Water 17 00854 g014
Table 1. Sampling point details for rivers.
River Sampling PointThe Location of the Sampling PointGeographic Coordinates
VoghjiV-1Upstream of Kajaran Town39°09′26.9″ N 46°06′47.4″ E
VoghjiV-2Downstream of Kajaran Town39°09′01.8″ N 46°11′34.3″ E
VoghjiV-3Upstream of Kapan Town39°13′27.7″ N 46°20′19.4″ E
VoghjiV-4Downstream of Kapan Town39°11′53.0″ N 46°28′05.9″ E
AchananA-5Near the river mouth39°11′54.9″ N 46°28′02.8″ E
VachaganVa-6In Kapan Town39°11′53.5″ N 46°23′43.8″ E
GeghiG-7Near the river mouth39°11′58.3″ N 46°15′31.8″ E
Table 2. Irrigation water quality parameters and their limiting values.
qiEC (µS/cm)SAR (meq/L)Na+ (meq/L)Cl (meq/L)HCO3 (meq/L)
High85–100200–750<32–3<41.0–1.5
Medium60–85750–15003–63–64–71.5–4.5
Low35–601500–30006–126–97–104.5–8.5
Very low0–35<200 or >3000>12<2 or >9>10<1.0 or >8.5
Table 3. The weights of the IWQI parameters.
Parameterswi
EC0.211
Na+0.204
HCO30.202
Cl0.194
SAR0.189
Total1.000
Table 4. Classification of water quality for the investigated sites based on IWQI.
IWQI Values and Type of RestrictionRecommendations for Crops and Soil
Type of PlantsSoil
85–100 (no restriction)No toxicityWater can be used for all types of soils as a low risk of soil salinity and sodicity prevails.
70–85 (low restriction)Avoid the use of salt-sensitive plantsWater can be used for light soil texture with high sand content and moderate to high permeability.
55–70 (moderate restriction)Moderate salt-tolerance plantsWater can be used for moderate to high permeable soil taking into consideration moderate soil leaching processes.
40–55 (high restriction)Moderate to high salt-tolerance plantsWater can be used for permeable soil without compact layers and taking into consideration the high frequency of the irrigation schedule for irrigation water with EC > 2000 µS/cm and SAR > 7.
0–40 (severe restriction)High salt-tolerance plants onlyWater cannot be used to irrigate soil under normal conditions.
Disclaimer/Publisher’s Note: The statements, opinions and data contained in all publications are solely those of the individual author(s) and contributor(s) and not of MDPI and/or the editor(s). MDPI and/or the editor(s) disclaim responsibility for any injury to people or property resulting from any ideas, methods, instructions or products referred to in the content.

