Article

Study of Bacterial Growth in Drinking Water Distribution Pipes as a Function of the Water Quality

1
Aix-Marseille Univ., CNRS, Centrale Med., M2P2, Equipe Procédés Membranaires (EPM), 13451 Marseille, France
2
Eau de Paris, Direction de la Recherche du Développement et de la Qualité de l’Eau, 33 Avenue Jean Jaurès, 94200 Ivry-Sur-Seine, France
*
Author to whom correspondence should be addressed.
Water 2025, 17(6), 835; https://doi.org/10.3390/w17060835
Submission received: 28 January 2025 / Revised: 27 February 2025 / Accepted: 12 March 2025 / Published: 14 March 2025
(This article belongs to the Section Water Use and Scarcity)

Abstract

:
This study examines the impact of water produced by membrane processes on bacterial dynamics within drinking water distribution systems. Employing a closed-loop pilot plant designed to replicate real-world conditions, the research focused on two primary objectives. First, it assessed the effects of different water compositions, which vary in their nutrient concentrations, including tap water, softened water, ultrafiltered water, and low-pressure reverse osmosis (LPRO) water, on bacterial development in pipes over successive 30-day phases. The findings indicated that water produced by LPRO, characterized by low nutrient levels, reduced microbial concentrations and altered the composition of bacterial communities, leading to the lowest overall bacterial counts during stationary phases. Second, the study investigated the behavior of established biofilms in response to changes in water type (tap water/LPRO water), revealing that after a certain duration, aging biofilms maintained their structural integrity and diversity despite variations in water quality. The presence of a robust biofilm could buffer the microbial community against drastic shifts associated with different water types, suggesting that pipe history plays a critical role in microbial dynamics within distribution systems. These results highlight the complex interplay between water quality and biofilm characteristics in the drinking water distribution systems.

1. Introduction

Water pollution is a global challenge that can significantly affect drinking water sources. Ensuring the provision of clean and safe drinking water is a priority for health agencies and utilities worldwide. In Europe, various treatments, such as ozonation, membrane filtration, and chlorine disinfection, are commonly used to guarantee the biological quality of the drinking water produced [1]. Additionally, most countries limit the growth of microorganisms in drinking water by maintaining a residual disinfectant, typically chlorine or chloramine, during distribution [2]. However, even in treated systems, drinking water distribution networks, whether in urban or rural areas, regularly contain a biological ecosystem, with several microorganisms such as bacteria, fungi, yeasts, protozoa, and viruses, mainly bacteriophages. These microorganisms exist in different phases within the distribution network: planktonic cells, attachment of cells or bacteria to surfaces, suspended particles, and mobile deposits [3,4]. The planktonic phase, which has the most direct impact on drinking water quality, typically exhibits total cell concentrations ranging from 103 to 105 cells mL−1 [5,6]. However, this planktonic phase represents less than 2% of the total bacteria in a distribution network [7]. It serves as a medium for the transport of nutrients, microbes, and particles throughout the entire system. As water moves through the main pipes, a layer of microorganisms, commonly referred to as biofilm, forms along surfaces in contact with water, particularly on the inner walls of pipes. This biofilm provides a protective environment against oxidative and hydraulic stress, creating microbial ecosystems that are difficult to eliminate [8]. Cell concentrations in pipe-associated biofilms can range from 104 to 107 cells cm−2, representing more than 90% of the total bacteria in drinking water distribution systems [9,10]. Nevertheless, various factors can impact the biological quality of drinking water, with the composition of the water being one of the most critical determinants of stability. For instance, nocturnal stagnation contributes to bacterial accumulation and heightened microbial metabolic activity in drinking water distribution systems [11]. This stagnation leads to the degradation of residual chlorine [12], consumption of carbon sources [13], release of bacteria from biofilms [14], and elevated water temperatures [15]. Several of these processes are influenced by the nutrient content, chemical properties, and microbial load of the type of water. Changes in water quality can result in public health risks, including human diseases, with the growth of opportunistic premise plumbing pathogens [12,16], taste or odor issues [17], or corrosion of pipe materials [2]. Therefore, the overall composition of the water plays a pivotal role in driving microbial dynamics during distribution. Understanding these dynamics and the mechanisms behind the growth and presence of bacterial communities within the network is crucial to prevent water quality deterioration and mitigate associated risks. Membrane processes, such as ultrafiltration (UF) and reverse osmosis (RO), are increasingly used to produce high-quality drinking water. Low-pressure reverse osmosis (LPRO), known for its ability to remove viruses and other contaminants, has the potential to significantly reduce the microbial load in distributed water [18,19,20]. However, such improvements in water quality may also result in a significant shift in bacterial dynamics, particularly influencing the development conditions of biofilms within distribution systems.
The aim of this study was to investigate the bacterial dynamics of recirculating water in a closed-loop pilot plant designed to replicate the real conditions of an operational drinking water distribution systems. The study applied a two-phase hydraulic flow profile based on actual drinking water distribution systems in Paris (France), consisting of a dynamic cycle during the day (recirculation) and a static cycle at night (stagnation). Spot sampling was conducted to analyze and monitor various microbiological and physicochemical parameters, including the concentration of intact and active cells, microbial flora, bacterial concentration, total organic carbon (TOC), ion concentrations (NH4+, NO3−, PO43−), active/total chlorine, conductivity, and pH. In the first phase of the study, the influence of different water matrices was tested using four types of water: tap water (Paris), softened water, ultrafiltered water, and LPRO water. In the second phase, the behavior of biofilm and bacterial growth following a change in water type was studied by monitoring bacterial growth in a pipe already containing a developed biofilm.

2. Materials and Methods

2.1. Experimental Pilot-Plant and Protocol

2.1.1. Pilot-Plant

The study of bacterial growth as a function of water quality in distribution pipes was conducted using a pilot system specifically designed to simulate the real conditions of an operational drinking water distribution network (Figure 1a,b). The pilot included a 180 L tank, a variable-speed pump, various sensors for monitoring physico-chemical parameters, and a closed-loop recirculation system with a volume of 18 L (10% of the total volume). The loop, with a total length of 11 m, was composed of PVC pipes: (i) 4 m with a nominal diameter of 110 mm and (ii) 7 m with a nominal diameter of 40 mm.
In this study, a two-phase hydraulic flow profile was applied, modeled after actual drinking water distribution systems in Paris (France): a dynamic phase, with recirculation, during the day (7–21 h) and a static phase, without recirculation at night (21–7 h). Several hydraulic parameters were kept constant throughout the experiments, including a water volume of 180 L, an average circulation speed of 0.44 m s−1 (for DN110 pipes), and a pressure of 2.2 bar. The temperature was controlled at 20 ± 1 °C using a control system (T-Controller Twin, Aqua medic, Bispingen, Germany), which included a heating probe (Digital Titanium Heater 500 W, Prime aquatic, Dongguang, China) and a cryoprobe (Dip Cooler RU-200, Techne, Cambridge, UK).

2.1.2. Protocol

Initially, four different types of water were selected to evaluate the impact of the water quality on bacterial growth: tap water, softened water, ultrafiltered water, and LPRO water. LPRO water was produced by the LPRO pilot laboratory described in a previous work [18], softened water by the pre-treatment system of the same LPRO pilot (i.e., 25 µm cartridge filter, softener, granular activated carbon filter, 1 µm filter cartridge), ultrafiltered water by a drinking water production plant in Paris (France), and finally tap water from the Paris network fed by treated water. The characteristics of these waters are shown in Table 1. It is important to note that only tap water contained residual chlorine when introduced. Each experiment lasted 30 days and was conducted sequentially, with intermediate cleanings using a 1200 ppm sodium hypochlorite solution, considered effective in eliminating any presence of microorganisms. Replicate tests were carried out on the same type of water, to check the repeatability of results and guarantee the reliability of measurements. A second series of tests explored the impact of a change in water type on an already established microbiome. These tests consisted of three consecutive 50-day phases: an initial period of bacterial development with tap water, followed by the replacement of this water by LPRO water, then a return to tap water, and then LPRO water again. This approach was defined in order to simulate microbiological behavior within the pipes of a distribution network, replicating a scenario where drinking water would be produced by an LPRO process.

2.2. Microbiological and Physico-Chemical Parameters

The pilot plant was equipped with a series of sensors to monitor the following physico-chemical parameters: conductivity, UV absorbance, pH, total chlorine, free chlorine, and temperature. In addition, a 2 L sample was taken every 3 to 4 days, enabling various microbiological and physico-chemical analyses to be carried out in order to visualize changes in the parameters monitored. A further 2 L of water (1.1% of the total volume) was added after sampling to maintain a constant volume of 180 L.

2.2.1. Microbiological Parameters

Various microbiological parameters were analyzed, including the concentration of total and intact cells, the concentration of metabolically active cells, the suspended microbial flora estimated by counting revivifiable heterotrophic microorganisms, and the concentration of specific bacterial pathogens.
The concentration of total and intact cells was measured using a Cube8 flow cytometer (SYSMEX, Tokyo, Japan). A 900 µL sample was mixed with 100 µL of CyStain™ BacCount Viable kit (Gorlitz, Germany), which includes CyStain Green and Red fluorochromes along with a dilution buffer. All biological particles are stained green, while cells with damaged or permeable membranes (considered dead) are additionally stained red.
The concentration of metabolically active cells was analyzed using a fully automated Red One™ (Red Berry, Atlanta, GA, USA) system, based on solid-phase cytometry technology, combined with cell labeling. A 1 mL sample was filtered through a membrane (0.3 µm pore), and a viability marker was injected, which diffuses through microbial membranes and is hydrolysed by intracellular esterases, enzymes that indicate active metabolism. The cleavage of the substrate releases a fluorescent molecule that accumulates in the cells’ cytoplasm. The fluorescence signal, amplified by the accumulation of the fluorochrome, is detected when excited at 492 nm. The fluorescence kinetics are used to distinguish metabolically active microorganisms from inert particles.
The suspended microbial flora was estimated by counting revivable heterotrophic microorganisms on agar plates. This was done in triplicate by incorporating 1 mL of sample (or appropriate dilution) into non-selective culture medium (PCA) and selective culture medium (R2A), which were poured into Petri dishes. A colony, typically resulting from the growth of a single bacterium, was quantified and expressed as Colony Forming Units (CFU) per mL for PCA and per 150 µL for R2A. Colony counts were performed for total flora at 36 °C and 22 °C, after incubation for 44 ± 4 h at 36 ± 2 °C on nutrient-rich PCA agar, and for 68 ± 4 h at 22 ± 2 °C. R2A agar, containing low nutrient concentrations (yeast extract, casein hydrolysate, peptone, and glucose), allows the growth of a broader range of bacteria, preventing fast-growing species from dominating. It was incubated at 22 ± 2 °C for 7 days.
The concentration of specific bacterial pathogens, including Legionella spp., Legionella pneumophila, Pseudomonas aeruginosa, and Mycobacterium spp., was analyzed using digital PCR. The process involved four key steps: (i) a 1 L sample was concentrated on a polycarbonate membrane with a pore size of less than 0.45 µm; (ii) the concentrate was lysed chemically with TRIzol (Thermo, Waltham, MA, USA) and mechanically through bead beating to disrupt bacterial membranes and release nucleic acids, followed by centrifugation (10,000× g, 10 min at 4 °C); (iii) total nucleic acids were extracted and purified using a QIAsymphony automatic extractor (Qiagen, Hilden, Germany) and the DSP Pathogen Midi kit (Qiagen); (iv) bacterial nucleic acids were amplified, detected, and quantified using a digital PCR instrument (QIAcuity, Qiagen). A summary of the various microbiological analyses performed, along with detection and quantification limits, is presented in Table 2.
Bacteria genomes were quantified by digital RT-PCR in multiplex reaction. Reactions were performed using QIAcuity One-Step Advanced Viral RT-PCR mastermix (Qiagen) with 400 nM of each primer and 200 nM of each probe in 26k-Nanoplates. Amplification was performed after an activation step at 95 °C for 2 min and included 45 cycles of incubation at 95 °C for 15 s and 58 °C for 60 s. Negative and positive control were included in each experiment to ensure no contamination and to set up the thresholds for considering three fluorescent partitions as positive results. Partitions with less than three fluorescent partitions have been considered as negative. The use of these nanoplates provided a minimum of 24 k valid partitions for each sample and an estimated detection limit of 60 copies/L (considering the volume of nucleic acids used per reaction and the concentration factor of the sample). Multiplexed assay has been validated according to the dMIQE guidelines [23]. Oligonucleotides are reported in Table 3.
To compare the effect of the two types of water on biofilm formation, PVC coupons samples were introduced at the beginning of each phase into the tank and the pilot’s pipelines. They were progressively recovered throughout the phases, sonicated to detach attached organic matter, then analyzed by flow cytometry and solid-phase cytometry. To compare biofilm growth kinetics, a ratio is calculated. This ratio compares biofilm growth in two types of water over the same period, using cell concentration, according to Equation (1) where ΔCfirst water type is the difference of cell concentrations of a given water type between 20 and 30 days (Δt20–30) and ΔCsecond water type is the difference of cell concentrations of another water type between 20 and 30 days.
G r o w t h   r a t i o = Δ C f i r s t   w a t e r   t y p e Δ t 20 30 Δ C s e c o n d   w a t e r   t y p e Δ t 20 30
Sequencing was performed based on 16S amplicon library preparation. Five microliters of extracted total nucleic acids from each sample were used to generate amplicon targeting hypervariable regions V3 and V4 of 16S rDNA. Amplification was performed using Q5 high Fidelity Master Mix (New England Biolabs, NEB, Ipswich, MA, USA) and the universal primers 341_F and 805_R previously described [27]. Amplicons were purified and an amplicon-based library was prepared using NEBNext Ultra II DNA library Prep kit (NEB). Sequencing was performed with the MiSeq V3 chemistry with 2 × 300 cycles according to the manufacturer’s protocol. Data analysis was performed using the Galaxy Europe tools. Briefly, paired-end reads were filtered (Q > 20) and merged using Pear (Galaxy version 0.9.6.4). Assembled reads with lengths comprised between 150 and 600 bp have been considered for assigning taxonomic labels using the Kraken 2 (Galaxy version 2.1.3) against the SILVA 16S ver138 database. Assembled reads identified as bacteria have been isolated using the seqtk_subseq tool (Galaxy version 1.4) and reassigned for taxonomic labels using the Kraken 2 against the SILVA database. An abundance at bacteria family level has been re-estimated from the Kraken report using Bracken (Galaxy version 3.0). Shannon’s alpha diversity has been calculated from the Bracken abundance estimation file.

2.2.2. Physico-Chemical Parameters

The quantification of various ions (ammonium, nitrate, and orthophosphate), TOC, conductivity, active and total chlorine were estimated. The methods used, their characteristics, and their QLs are presented in Table 4.

2.3. Data Analysis

Results were analyzed using GraphPad Prism 9.5.0 (GraphPad Software, San Diego, CA, USA). This software enables statistical analyses to be carried out in order to establish correlations or evolutions according to different parameters. This software also enables curve modeling to find a model corresponding to the data, and to define a 95% confidence interval. To enhance clarity and avoid overloading the graphs, these 95% confidence intervals were applied only to certain graphs to improve the readability of the observed trends.

3. Results and Discussions

3.1. Effect of the Type of Water

The evolution of intact cell concentration and TOC over time, representing global parameters and not specific to any single species, was illustrated for each water type in Figure 2. The results were modeled using the GraphPad software “exponential plateau” model, which provides a way to visualize an initial phase of exponential growth or decline, followed by a plateau indicating stabilization of the values. This model is characterized by the equation: Y = Y M Y M Y 0 × e k × X , where Y0 represents the initial population, YM the maximum population, k the rate constant and X the unit of time.
The evolution of intact cell concentration, regardless of water type, followed distinct phases: an initial exponential growth phase followed by a stationary phase, which supported the appropriateness of the chosen model (R2 > 0.76 for each water type and parameter). These trends were consistent with the findings in recent studies [31], which observed similar phases when studying bacterial development in surface water using flow cytometry, with water recirculating through in three 100 m loops. Additionally, the results indicated that the stationary phase is reached at a lower bacterial concentration in water produced by LPRO compared to other water types. This observation was consistent with the fact that LPRO water is ultrapure, containing fewer nutrients, which limits bacterial growth. Liu et al. (2007) [32] demonstrated that water treated by RO membranes exhibited higher purification grade, in terms of both inorganic and organic compounds, than water treated by conventional systems. Specifically, LPRO has been shown to efficiently remove assimilable organic carbon and biodegradable dissolved organic carbon (BDOC) from drinking water [31,33]. As a result, water produced by LPRO had a lower bacterial growth potential compared to water from conventional treatment systems [34]. Moreover, a clear trend emerged from the evolution of these two parameters: tap water showed higher concentrations of intact cells and TOC compared to ultrafiltered water, which in turn exceeded those of LPRO water. It is important to note that both tap water and ultrafiltered water were produced using similar processes. However, tap water, which was chlorinated at the UF drinking water production plant, was conveyed to the pilot system via the distribution network. In contrast, ultrafiltered water was collected directly from the plant without undergoing any chlorination. As a result, despite the presence of residual chlorine—evidenced by the absence of intact cells after three days across all water types—tap water may have been exposed to living or dead microorganisms during distribution, possibly due to biofilm detachment within the network, which could have facilitated bacterial growth [34,35]. Interestingly, the concentrations observed in softened water were higher than those in tap water, even though tap water was the source for the softened water. This anomaly could be explained by the softening process, which involved three stages: a softener, a 25 µm filter, and a granular activated carbon (GAC) filter. The literature associates GAC filters with conditions favorable for the growth of environmental bacteria, as microbial communities tend to colonize the surface of GAC particles [36]. Additionally, several studies have shown that GAC filters, after a few months of use, can release significant quantities of microorganisms [37,38,39], which could explain the high concentrations of intact cells and TOC observed in this study. Furthermore, the results suggested that the stationary phase (or equilibrium) was reached more quickly for LPRO water, although this observation was not clearly discernible in Figure 2. Therefore, growth kinetics were calculated for each type of water, allowing us to estimate the time required for each type to reach the bacterial concentration corresponding to its stationary phase (Table 5).
First, it is important to note that for tap water, the stationary phase did not appear to be fully reached, making it difficult to precisely define the characteristics of this phase, unlike the other three types of water. A comparison between ultrafiltered water and tap water suggested that passing through the drinking water distribution network had a considerable impact on its bacterial growth potential, likely due to the biofilm present in the pipes. Furthermore, by comparing the different types of water, it was confirmed that equilibrium was reached more quickly and at a lower bacterial concentration in water produced by LPRO. As expected, these observations supported the notion that LPRO water has a lower bacterial growth potential than water produced by conventional treatment processes. The evolution of the various physico-chemical parameters measured during this study further reinforced this observation, indicating that LPRO water was less nutrient-rich, thus limiting bacterial growth. Changes in nitrate and orthophosphate concentrations, as well as conductivity, are shown in Figure 3. The evolution of ammonium concentration is not presented, as the results were consistently below the QLs (0.03 ppm) for all types of water.
Three main elements, often considered essential, were required and consumed for bacterial development: carbon, nitrogen, and phosphorus [40]. Figure 3 highlighted the superior initial quality of LPRO-produced water, reinforcing the notion that LPRO-treated water was initially nutrient-deprived, which should theoretically limit bacterial growth. For each parameter, no downward trend was observed, suggesting that the consumption of these resources was either slow or negligible over time. The effect of various nutrients on bacterial growth, both in circulating water and biofilms, was studied in [36], using a pilot that simulated a drinking water distribution network. After adding three different inorganic elements (ammonium, phosphorus, and sulfate) to the network, their results showed no impact on bacterial growth, either in the circulating water or on the pipe surfaces. In contrast, the addition of organic carbon led to an increase in the number of circulating bacteria, while the number of bacteria in the biofilms remained constant. These results, presented in Figure 3, aligned with the observations of Frias et al. (2001) [41] and may explain the absence of a decrease in nitrate and orthophosphate concentrations. These nutrients likely remained in excess, and did not become growth-limiting factors, as suggested by studies from Bott et al. (1985) [42] and Volk et al. (2005) [43]. However, orthophosphate concentrations increased during the exponential growth phase and then stabilized for all water types except tap water. This increase might be linked to the development of bacteria during the exponential growth phase, such as Proteobacteria and/or Firmicutes, which are known to produce phosphorus [41,42]. Becerra-Castro et al. (2016) [44] also showed that Proteobacteria become predominant when bacterial growth resumes after water disinfection. This increase was particularly pronounced in LPRO water, where orthophosphate concentrations in the stationary phase reached levels 18 times higher than in ultrafiltered water. This difference could be explained by pH variations depending on the type of water studied (Figure 4).
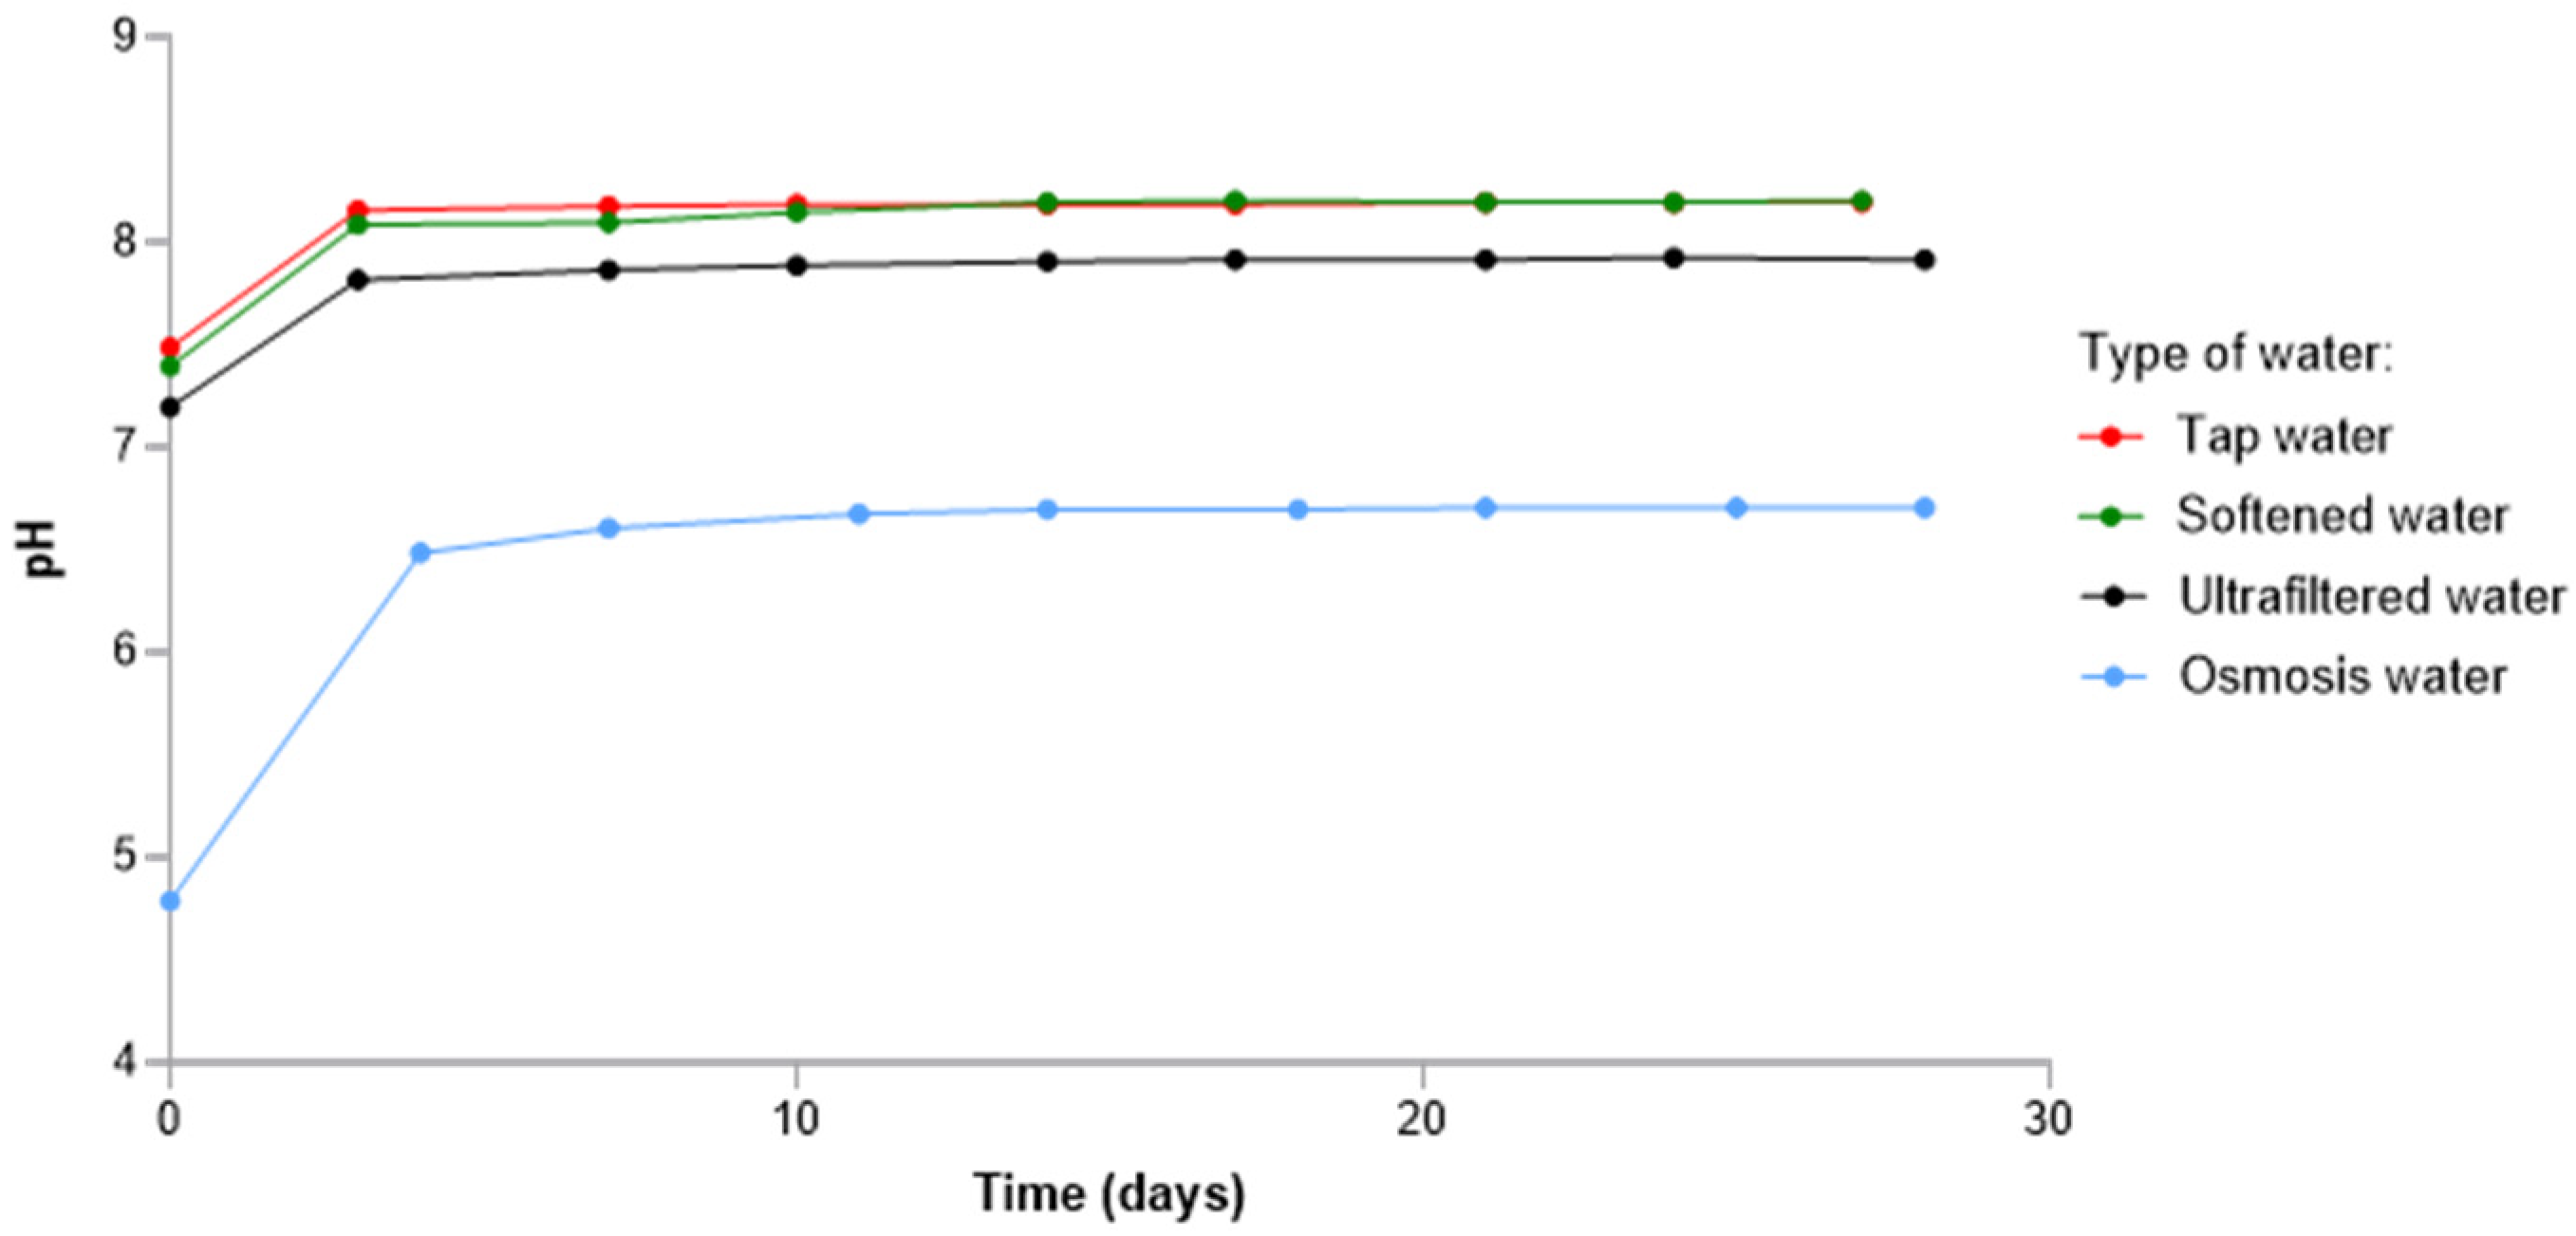
The increase followed by the stabilization of pH is well known [44,45] and resulted from an equilibrium between the water and air, where carbon dissolved in the water formed carbonic acid, which then escaped into the atmosphere, raising the pH until this equilibrium was reached. The initial pH of LPRO water, around 4.8, was significantly lower, potentially favoring the development of phosphorus-producing microorganisms during the exponential growth phase. Yuan et al. (2015) [46] studied the distribution of bacterial communities in sludge fermentation systems at different pH levels (4 and 10). At pH 4, Proteobacteria (28.8%) and Firmicutes (27.1%) were predominant, whereas at pH 10, their presence decreased (19.8% and 14%, respectively), with Chlorobacteria becoming more prevalent (30.1%). Considering the specific microbial species that could develop depending on the type of water, it became relevant to examine the evolution of total flora, analyzed by enumeration on PCA or R2A medium, which are often used in the sanitary monitoring of distributed water, indicating the potential presence of revivable heterotrophic microorganisms (Figure 5).
It is important to note that the total flora grown on PCA or R2A medium represented only a subset of the microorganisms present in the water, specifically revivable heterotrophs, and therefore did not reflect the overall bacterial development of the studied water [47]. No significant differences were observed between the different types of water during the stationary phase for any of the measured parameters. Indeed, the overlapping 95% confidence intervals further confirmed the absence of significant differences, suggesting that all water types reached a comparable plateau in bacterial development. There was a convergence towards similar values of cultivable bacterial flora during the stationary phase, regardless of water type and enumeration conditions (culture medium and incubation temperature). Total flora concentrations on the PCA medium at 22 °C and 36 °C, as well as on the R2A medium, were (7 ± 3) × 104 CFU mL−1, (1.3 ± 0.6) × 105 CFU mL−1, and (1.0 ± 0.3) × 105 CFU mL−1, respectively, further reinforcing the negligible impact of water composition on culturable bacterial populations. When comparing these values with the concentrations of intact cells measured by flow cytometry in the stationary phase (>1 × 10⁶ cells mL−1), the revivable heterotrophic microorganisms on agar represented only a fraction of the intact cells, accounting for less than 10%.

3.2. Behavior of Water Containing a Previously Developed Biofilm

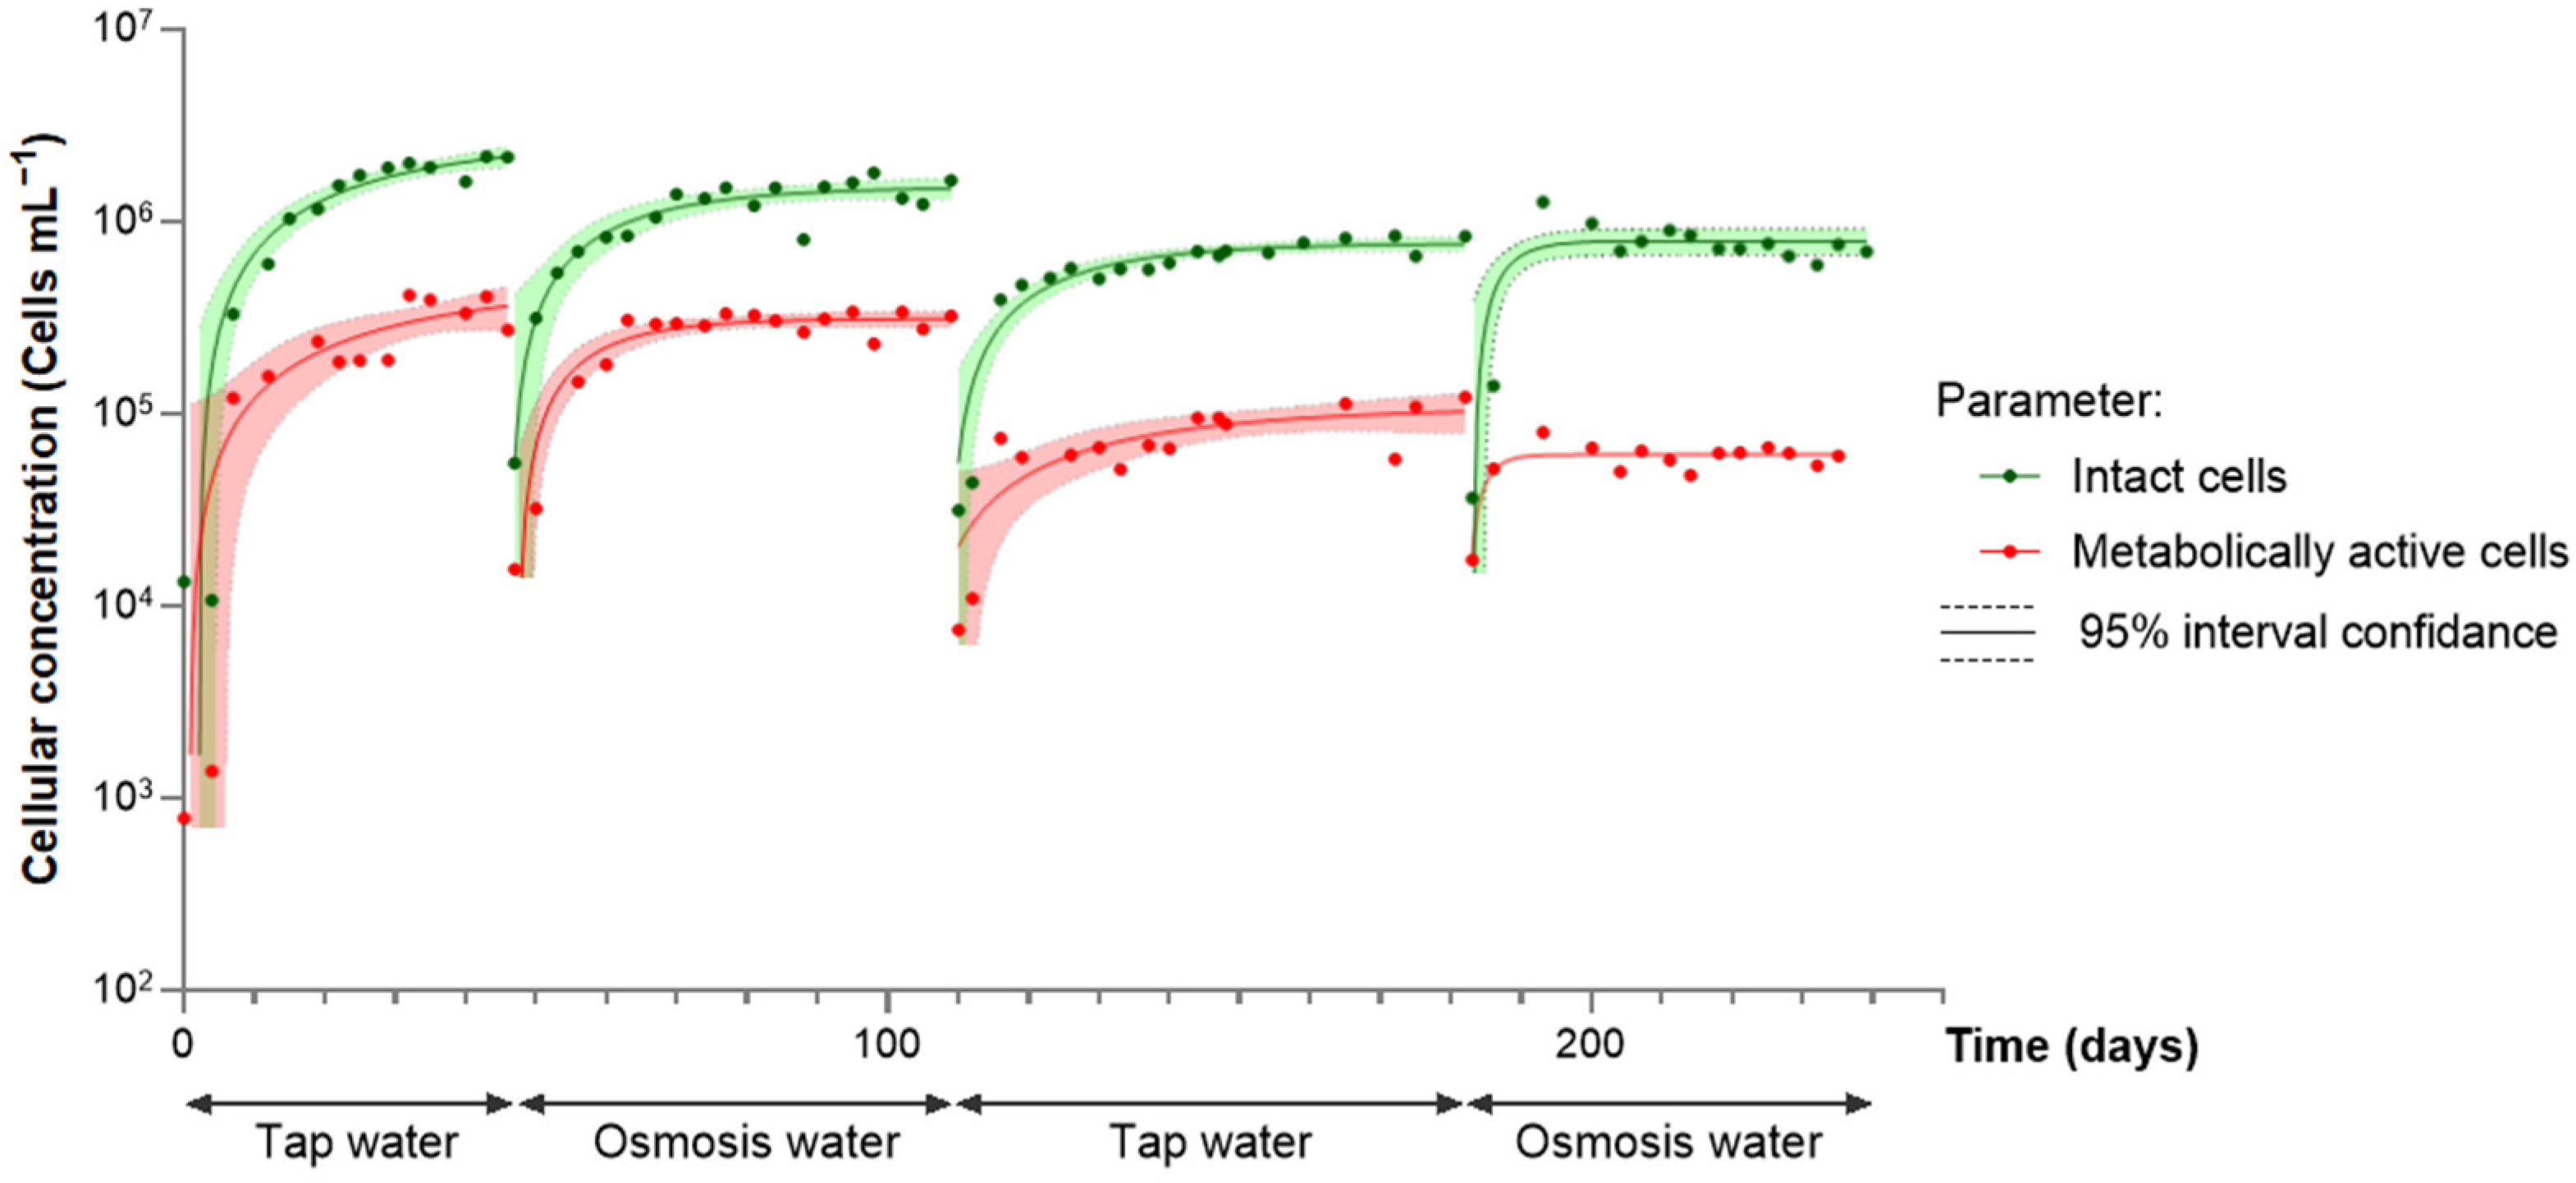
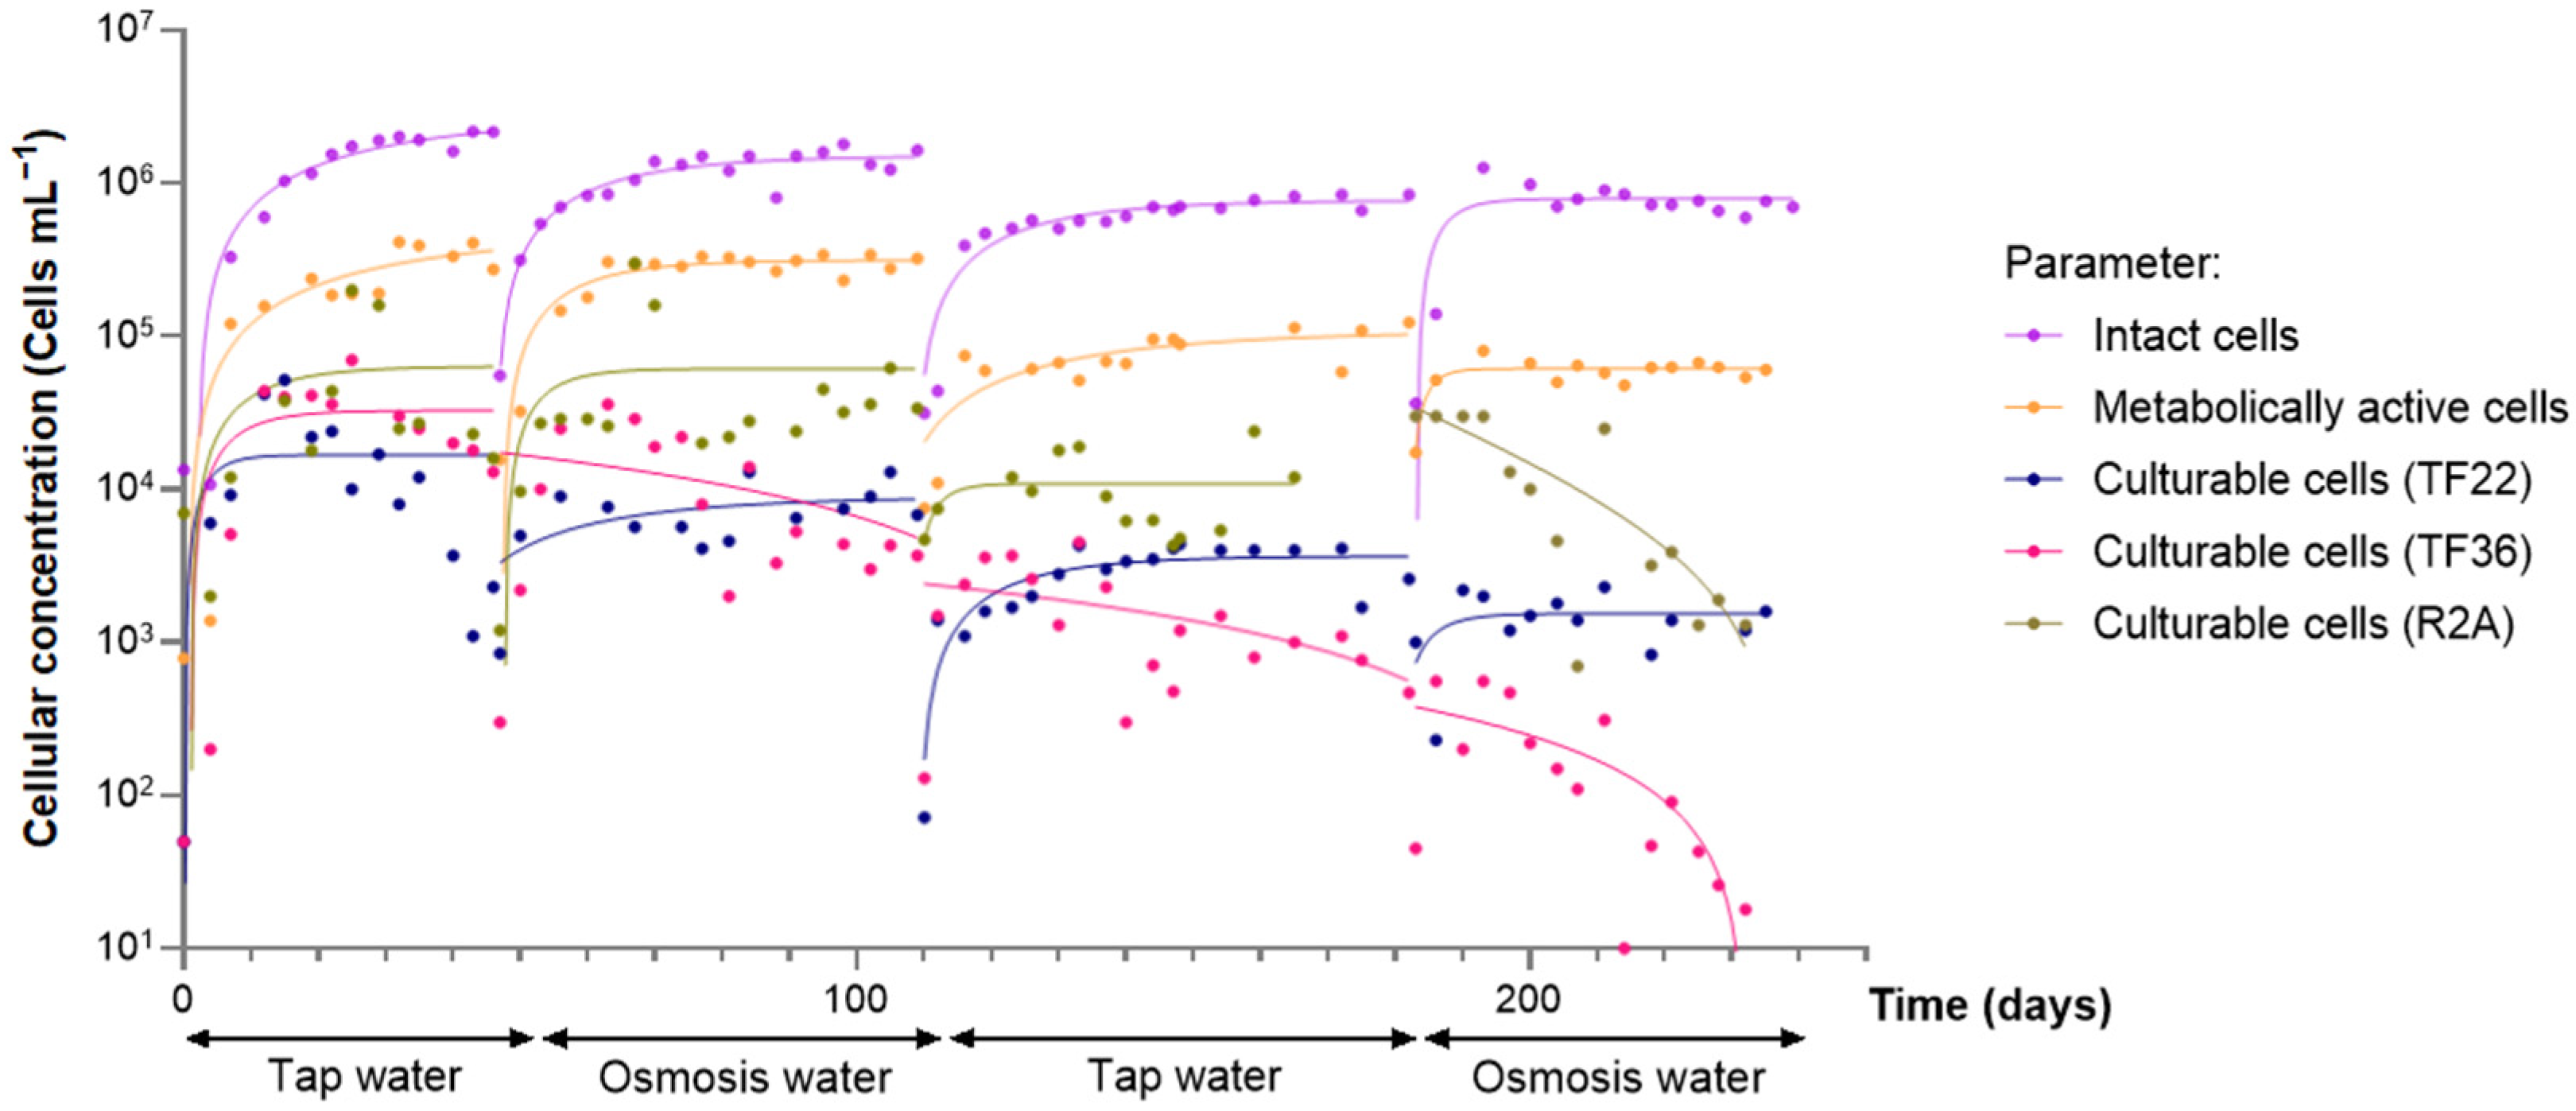
The impact of a change in water type on a biofilm already developed in the pipes was studied through four successive phases lasting around 60 days, without cleaning. These phases involved the use of tap water (phase 1), followed by LPRO water (phase 2), then tap water again (phase 3), and finally LPRO water (phase 4). The PVC coupons placed in the tank and in the pipes were used to determine biofilm growth kinetics and then the ratios between these growth kinetics, according to Equation (1). Only the ratios between phases 1 and 2 could be calculated. The ratio was 5.9 for tank coupons and 5.3 for pipe coupons. These ratios, well above 1, indicated that biofilm growth was much greater with tap water than with LPRO water. The higher ratio in the tank could be explained by lower flow velocities, which increased residence time and favored particle deposition, creating more favorable conditions for bacterial growth [48,49,50]. In this study, all the analyses focused on the evolution of the circulating phase. However, the literature established a close link between planktonic circulating bacteria and those present in biofilms, with exchanges forming the basis of a dynamic microbial cycle. Indeed, biofilms were not static structures but constantly evolving ecosystems, sustained by continuous interactions with circulating bacteria [51]. Bacterial cells could transition from the circulating to the sessile state by attaching to a surface to form a biofilm, then detaching again to re-enter the circulating phase, depending on environmental conditions or specific signals [46]. Van de Wende et al. (1989) [52] even suggested that biofilm growth and detachment accounted for most, if not all, of the planktonic cells present in the water of a chlorine-free distribution system. Thus, although bacterial cells growing in biofilms differed physiologically from circulating cells [53], the approach adopted in this study, which focused on in-depth analysis of the circulating phase, could provide insights into the overall bacterial dynamics of the network and be linked to the bacterial communities present in biofilms. The concentration of intact, metabolically active cells over time within the circulating phase is shown in Figure 6. Results were presented using the same “exponential plateau” model, including 95% confidence intervals.
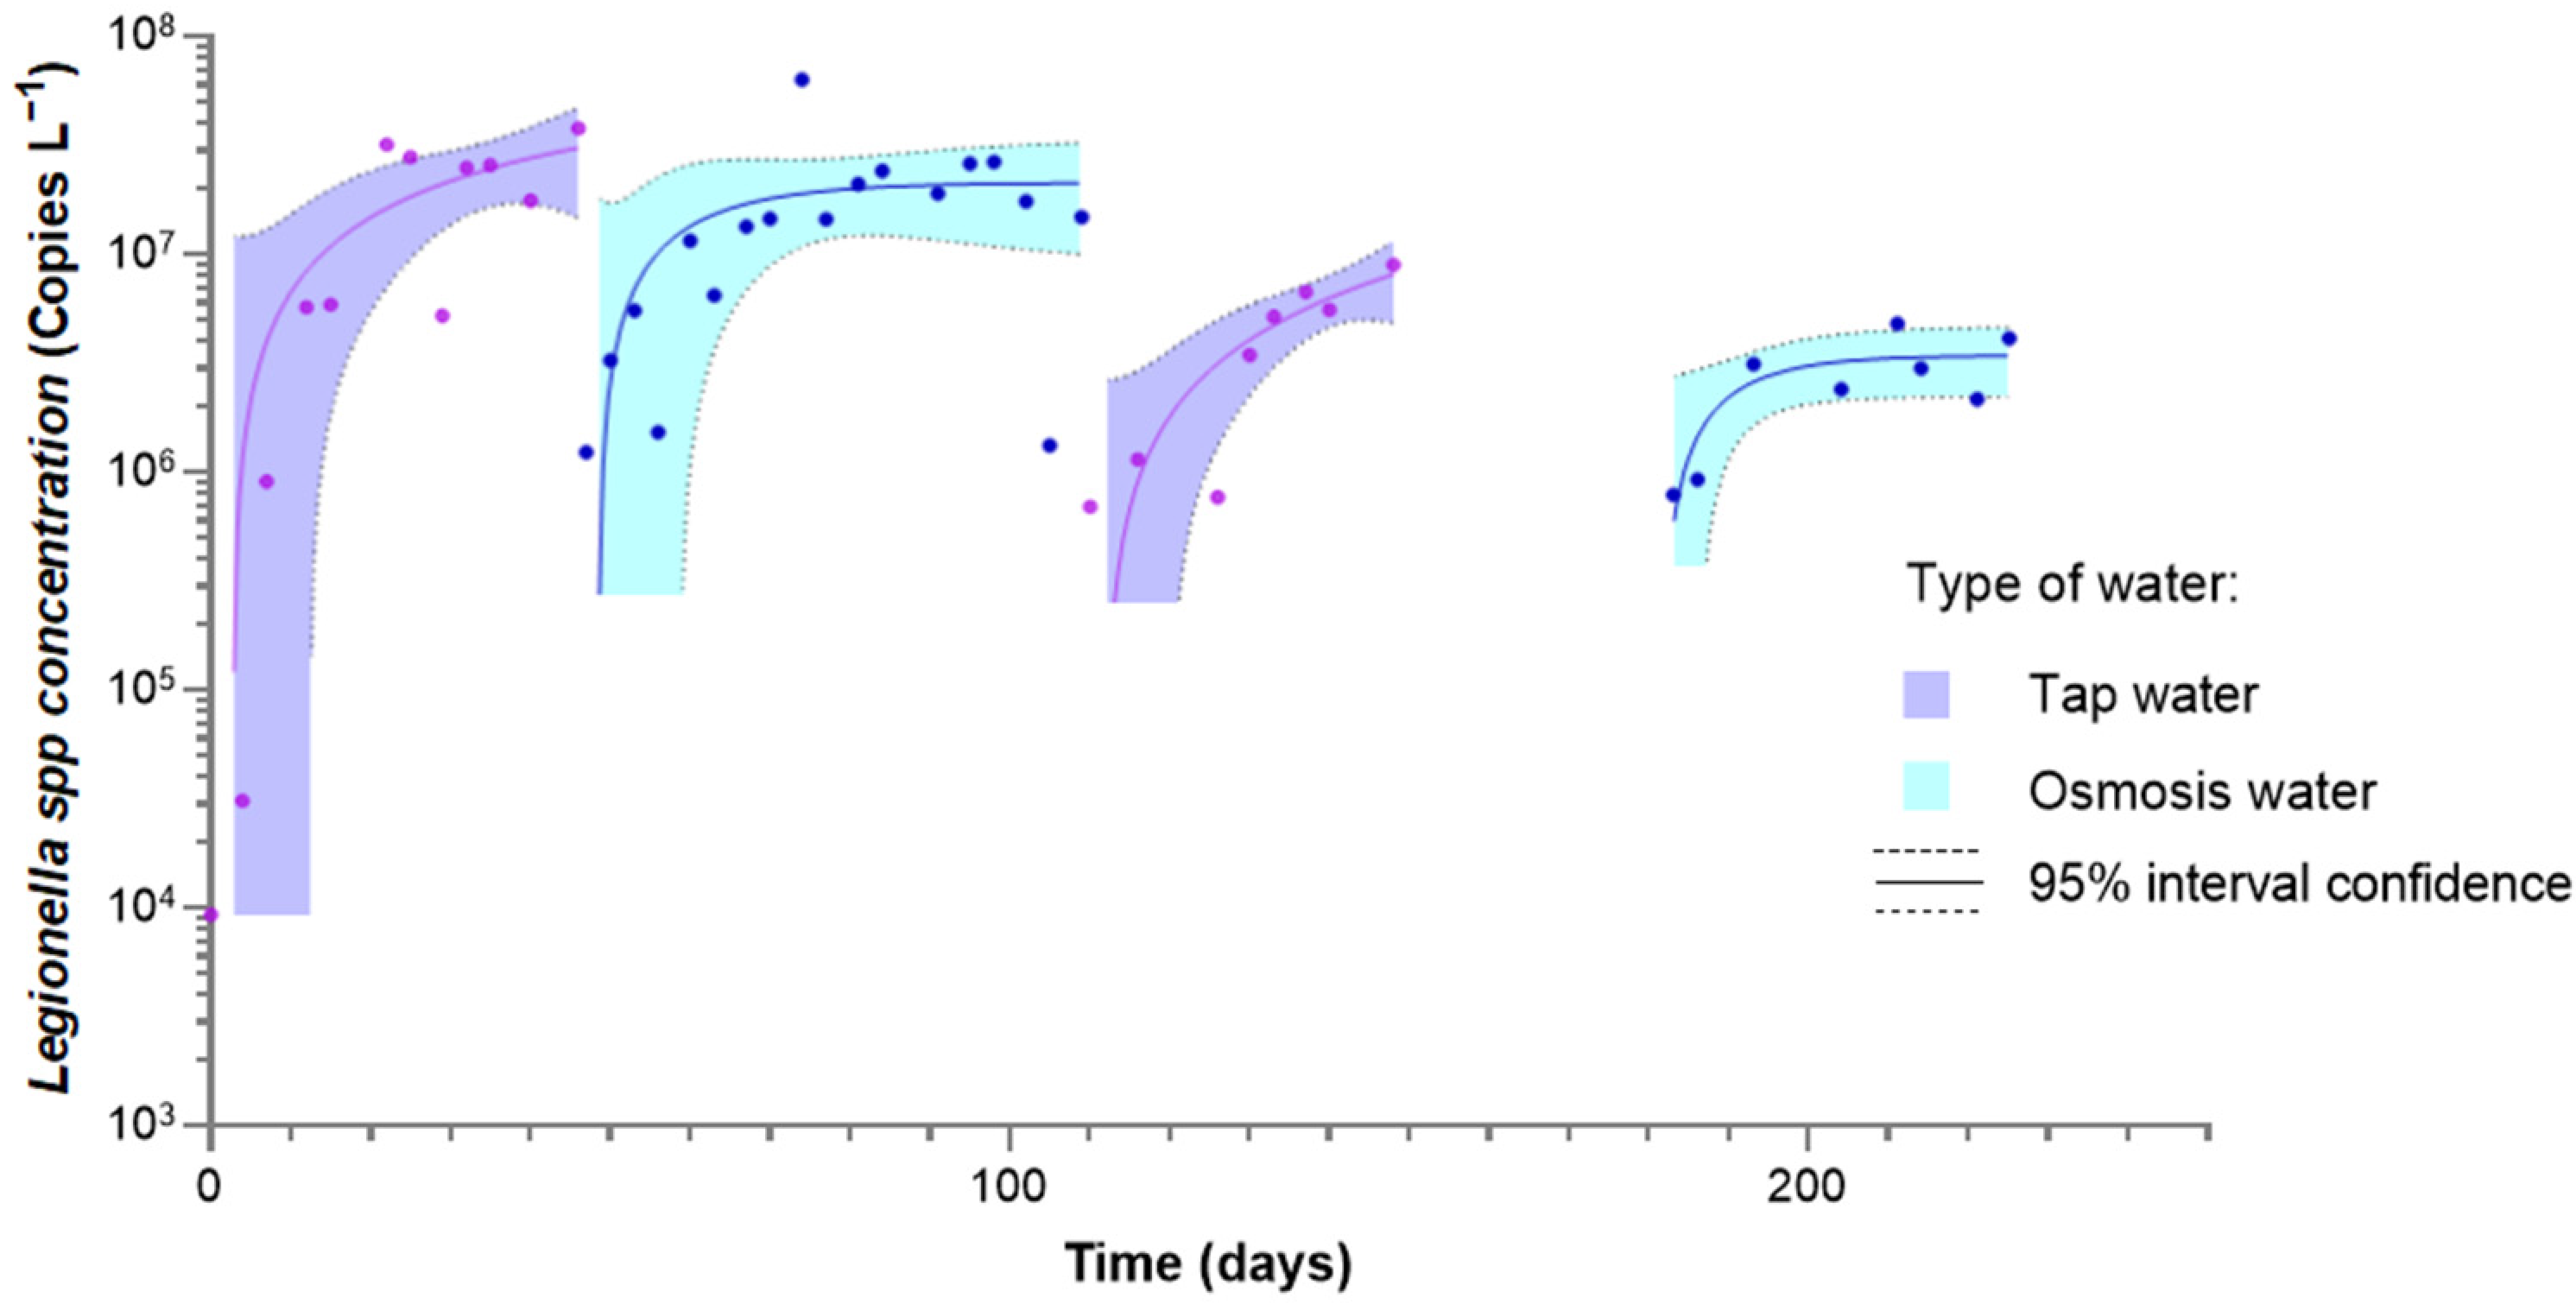
Initial samples from phases 2, 3, and 4 show a cell concentration at least ten times higher than at the start of phase 1, reflecting the release of bacterial cells by a well-developed biofilm in the pipes. Thus, biofilm appeared to be a factor influencing the circulating phase. When comparing successive phases, a slight decrease in intact and metabolically active cells was observed after each change in water type, with the exception of intact cells in the final phase. The same trend was observed for Legionella spp. concentration, as shown in Figure 7.
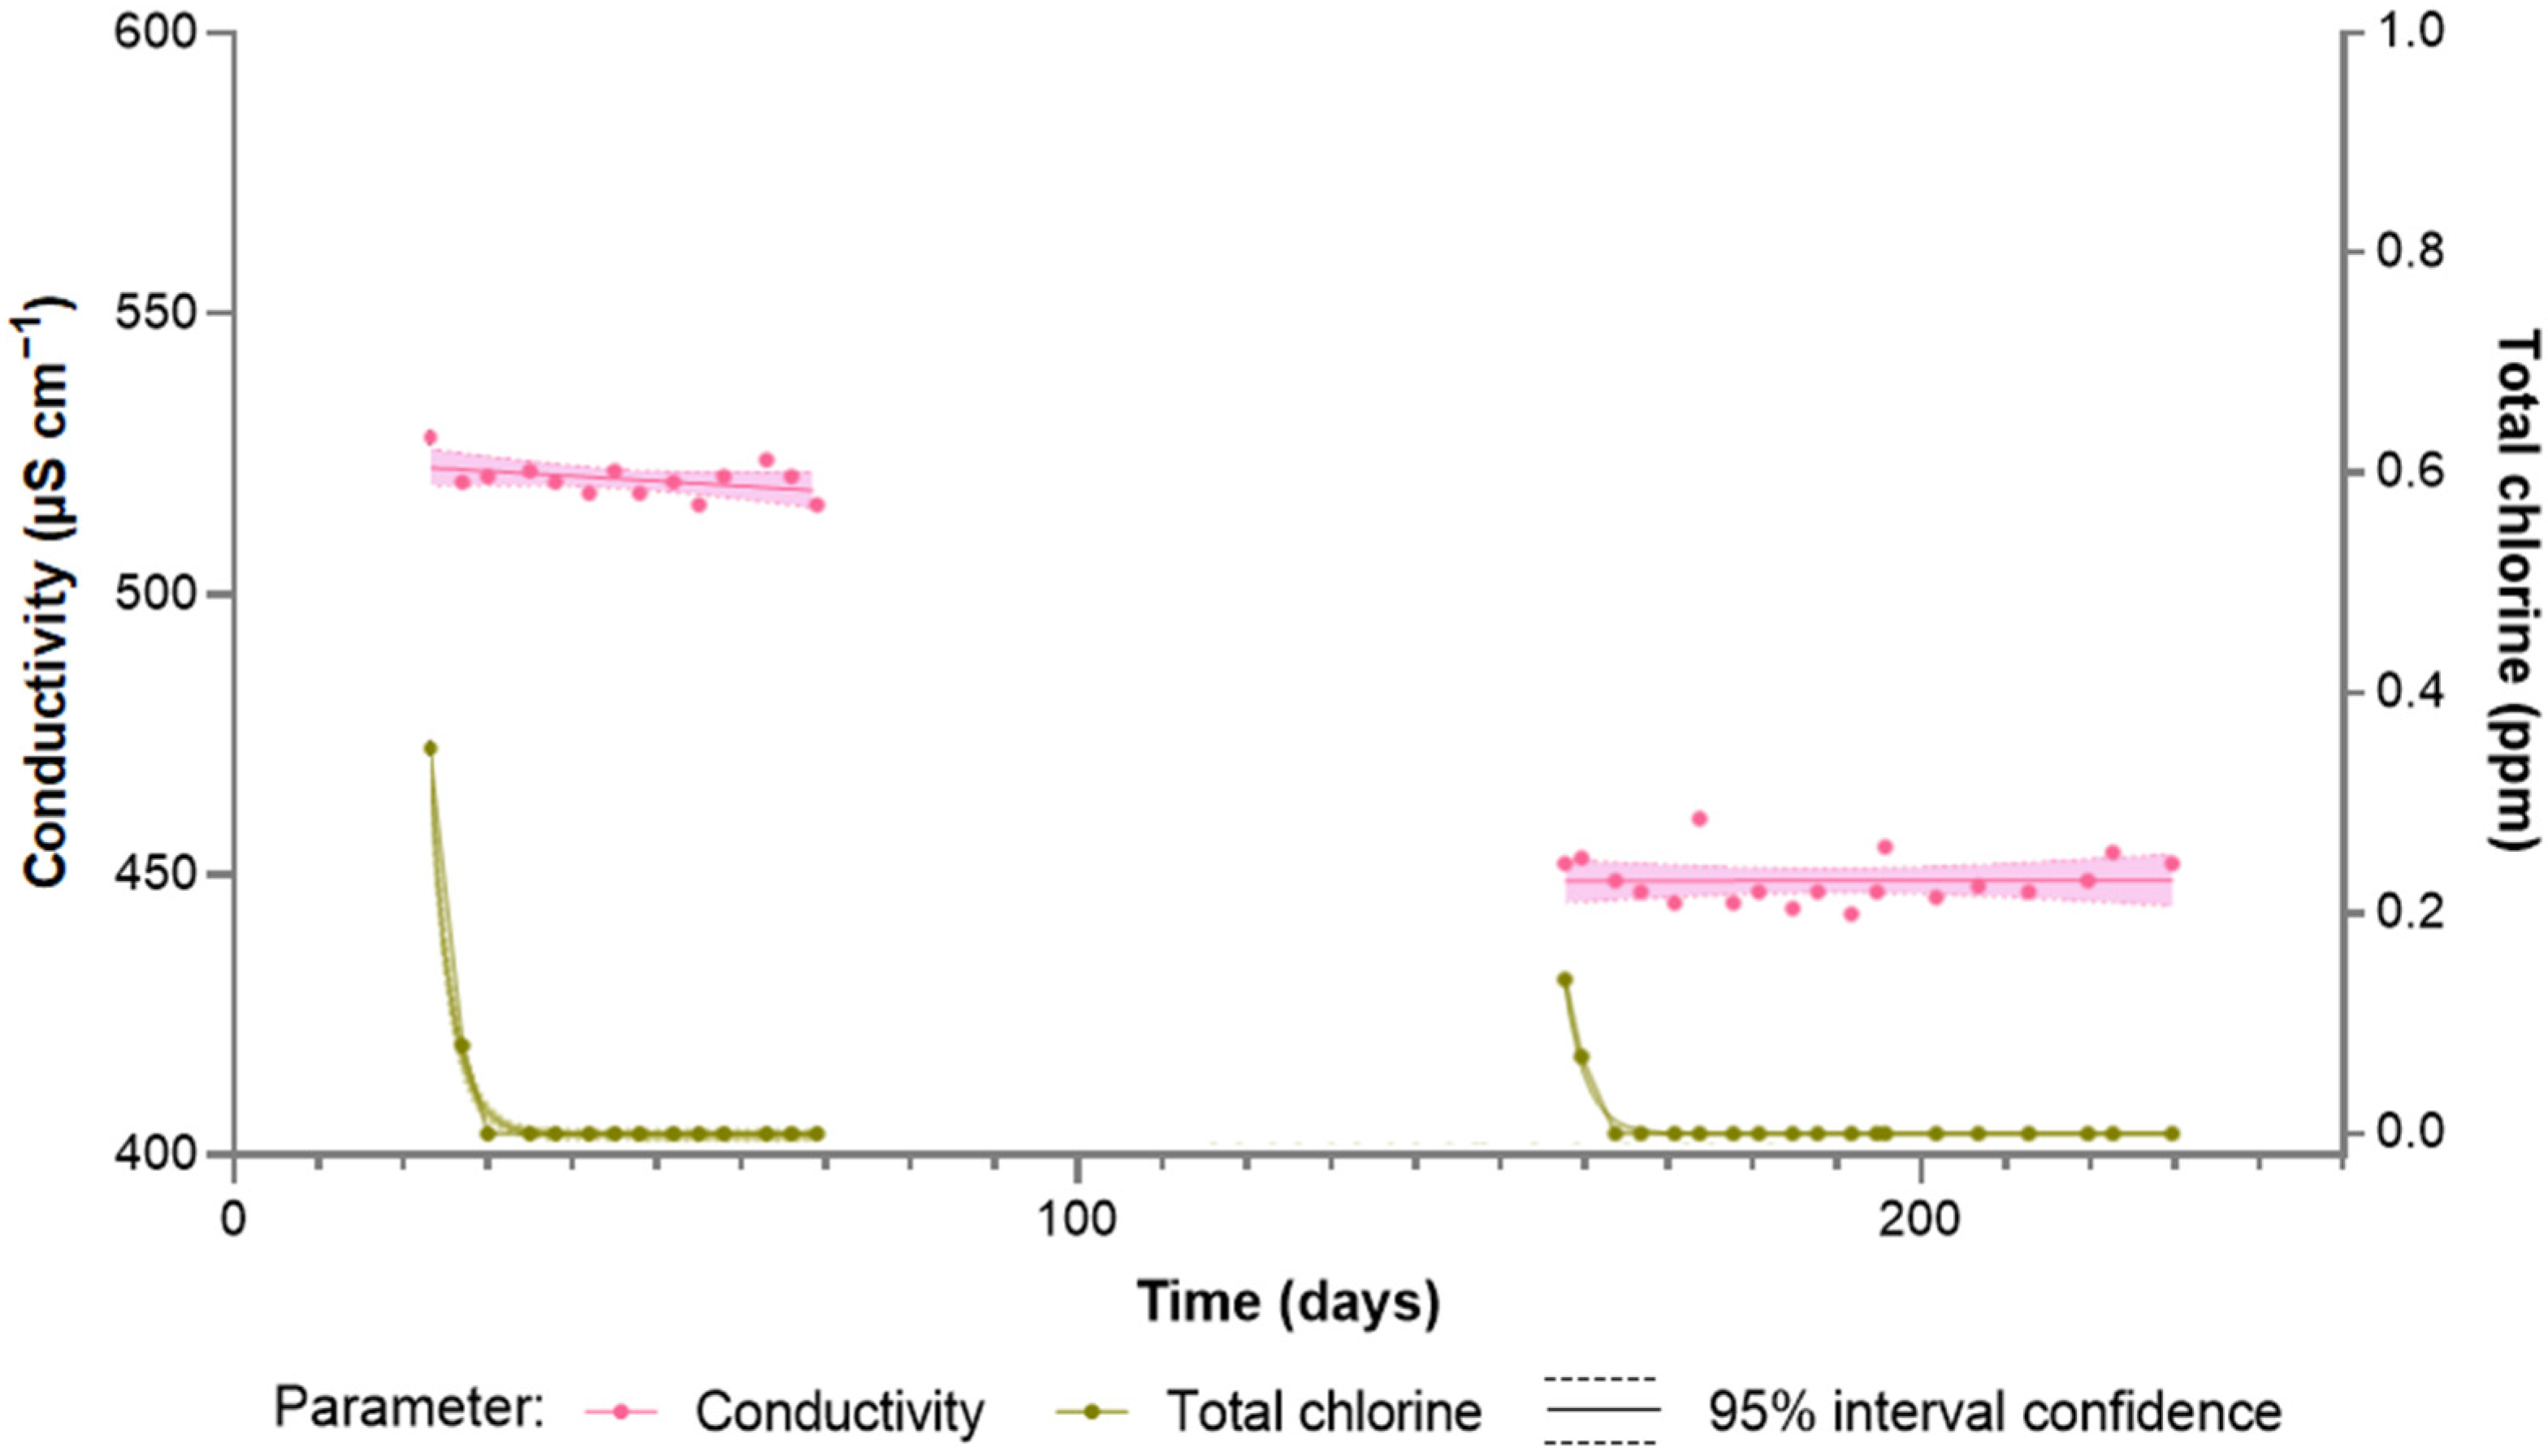
It is important to note that only the evolution of Legionella spp. concentration was presented, due to the high variability of Mycobacteria, Legionella pneumophila, and Pseudomonas aeruginosa, with large fluctuations and below LoD values, which complicated the identification of trends. Furthermore, it was expected that the switch from tap water to LPRO water, which is less rich in nutrients, would have a greater impact on cell concentration. However, the results indicated a certain resilience of the biofilm over time. This finding corroborated the observations of Edwald et al. (2011) [54], who suggested that in some cases, LPRO water may have a limited effect on the density of heterotrophic bacterial populations in biofilms. Additionally, when comparing the results in Figure 6 and Figure 7, pair-wise grouping phases 1 and 2 on the one hand, and 3 and 4 on the other, a more marked variation is observed when moving from phase 2 to phase 3. This difference between the tap water periods could also be attributed to a variability in network water quality, linked to the seasonal nature of the Paris surface water catchment (Figure 8).
The analyses showed that conductivity and total chlorine were higher at the start of phase 1 than at the start of phase 3, probably for the same reason. A lower presence of minerals and total chlorine could explain why the stationary phase was reached more quickly in phase 3 than in phase 1. However, these parameters did not seem to account for the lower bacterial concentration observed in the stationary phase of phase 3. TOC analysis (Figure 9) provided further explanations.
The evolution of TOC showed an increase during each phase, correlated with the rise in cell concentration, suggesting the production of organic carbon during bacterial growth [55]. However, when comparing the two phases using the same type of water (1 vs. 3 and 2 vs. 4), growth kinetics were found to be twice as high in the first phase as in the second. This could be explained by the biofilm’s gradual adaptation to changing conditions, making it less vulnerable to environmental changes. (i) An older, robust biofilm could have functioned almost independently, adapting to changes in the water without being significantly disturbed. Indeed, Stewart et al. (2008) [55] demonstrated bacterial adaptation in biofilms to varying local environmental conditions. (ii) A mature biofilm may have also favored certain predominant species, limiting the development of a wide diversity of other species, reinforcing the overall structure of the biofilm [54]. Wingender et al. (1999) [56] also showed that under favorable steady conditions, the various species of biofilms maintain an ecological balance. However, when environmental factors disrupted this equilibrium, such as a reduction in nutrient availability, a dominant growth of certain species was observed. This hypothesis can also be supported by the evolution of orthophosphate concentration over the course of this study (Figure 10).
The evolution of orthophosphate concentration showed a decrease during the tap water phases, while the LPRO water phases showed an increase during the exponential phase. This increase could have been due to the growth of phosphorus-producing Proteobacteria and Firmicutes, favored by an acidic environment, this hypothesis was strengthened by sequencing, as shown in the next section. This behavior highlighted the specific dynamics of biofilm as a function of environmental conditions, with LPRO water probably favoring certain ecological niches [57,58]. Nevertheless, the maximum orthophosphate concentration during phase 4 in LPRO water was half that of phase 2 in LPRO water, suggesting that the age of the biofilm had an impact on its ability to grow. Finally, Figure 11 presented all the results of the microbiological analyses carried out during the course of the study, including the concentrations of integral, metabolically active, and cultivable cells on different mediums. These results provided an overview of the impact of the various experimental phases on microbial community dynamics.
Comparing all the results of the different microbiological analyses, a progressive decrease in cell concentration was observed, whatever the state of the cells. This phenomenon was particularly marked for cultivable cells counted on PCA medium at 36 °C, whose concentration continuously decreased over the 240 days of the experiment, independently of water changes. Thus, all the observations concerning the different parameters analyzed showed that the impact of environmental changes seemed to have an attenuated effect over time and suggested that the increasing age of the biofilm may have played a more decisive role than the type of water on the dynamics of microbial communities [59]. This could have indicated that, over time, biofilm became more competitive and selective. The results of the sequencing served to reinforce these hypotheses and are presented in Figure 12. It should be noted that due to the cost and duration of these analyses, sequencing was carried out on a few samples taken at regular intervals after each water change. The sequencing results revealed significant changes in bacterial composition and alpha diversity throughout the different phases of the study, which corresponded to the fluctuations observed for cultivable cells on PCA and R2A mediums. In phase 1, the high initial bacterial diversity corresponded to the richness of the tap water, which likely formed the “primitive” biofilm. It must be noted that the observed bacterial diversity is slightly different from previous study on the Parisian network [47], probably due to history of the used pilot. This biofilm, comprising various species adapted to the conditions of the distribution system, seemed to establish the foundation for the microbial community in subsequent phases. During the phase 2, the introduction of LPRO water, with its low nutrient content and lack of new bacterial species, did not reduce alpha diversity substantially (1.68 ± 0.02 vs. 1.72 for the first phase), suggesting the biofilm’s role in maintaining a stable core community. Although LPRO water led to a loss of diversity in the planktonic phase, the biofilm appeared to preserve overall diversity, likely dominated by species such as Ferrimonadaceae and Pseudonocardiaceae, which may thrive in the low-nutrient, acidic environment of LPRO water. This stability highlights the biofilm’s capacity to uphold a stable core community homeostasis despite changes in water type. However, a predominant development of Sporomusaceae, a family within the Firmicutes phylum, was noted, which may indicate phosphorus production in the acidic environment of the LPRO water, as mentioned in relation to the evolution of orthophosphate concentration in Figure 10. In phase 3, the reintroduction of tap water led to an evolution of the bacterial diversity, followed by a rapid return to equilibrium. However, the relative abundance of species shifted, as the established biofilm exerted an influence over the circulating microbial community. This phase highlighted the resilience exerted by the biofilm, as it adapted to the influx of new species while maintaining its structural integrity. The reappearance of network-associated species, such as those from the Listeriaceae family, supports the idea that biofilm dynamics are influenced by external water changes but regulated by internal biofilm mechanisms related to the history of the pipe/biofilm. In phase 4, the return to LPRO water had a minimal impact on bacterial diversity and species abundance, which is similar to phase 2. This suggested that the biofilm had matured over time, becoming more competitive and selective. These observations underscored the significance of biofilm age in regulating microbial community dynamics, outweighing the effects of changing water types.

4. Conclusions

The results of this study demonstrated the significant impact of the water type on bacterial development and circulation. Membrane processes that produced different water qualities led to distinct bacterial growth patterns for each type of water. As a result, the water produced by the LPRO process allowed for less bacterial growth, with a lower bacterial concentration reached during the stationary phase compared to the other types of water studied. The equilibrium in LPRO water, reached most rapidly, also indicated limited bacterial development, characterized by a plateau at the end of day 15. These observations correlated with the initially low presence of essential nutrients for bacterial development, such as TOC, nitrate, and phosphate. However, no nutrient consumption was observed, likely due to their presence in excess, rendering them non-limiting to bacterial growth. Conversely, an increase in orthophosphate concentration was noted, possibly due to the development of certain phosphorus-producing bacteria, which are favored under the lower pH conditions of LPRO water. Furthermore, no significant differences were observed in the water qualities concerning revivable heterotrophic microorganisms. However, these species represented only a very small fraction of the bacterial community (<10%) and were therefore not fully representative of overall bacterial development, underlining the limited information given by such type of normalized measurements methods to observe bacterial evolution into a network. Therefore, the LPRO process holds promise for limiting the proliferation of microorganisms in drinking water distribution networks, even if, for example, Legionella spp. concentration at the plateau were not impacted by the water quality. These findings also raised questions about the potential for reducing or eliminating the chlorine dose currently added prior to the distribution of drinking water. Finally, the differences observed between ultrafiltered water and tap water highlighted the impact of water passing through a distribution system that already contained a biofilm and a developed bacterial community, suggesting downstream bacterial growth as well as the presence of residual chlorine during the initial days of the study. However, LPRO water, despite limiting bacterial growth, appeared to have a limited effect on pre-existing biofilms in pipes. Due to their age and resilience acquired over a period of 250 days, these biofilms developed adaptive capacities that enabled them to maintain diversity and function, even with a change in water type. Thus, the established microbial ecosystem, composed on average of Pseudonocardiaceae (38.8%), Streptosporangiaceae (28.3%), Sporomusaceae (13.0%), and Mycoplasmataceae (8.7%) was not significantly disrupted by the introduction of LPRO water. This study highlighted the need to consider the current state of infrastructure and associated microbial communities when making changes to water quality, as mature biofilms may reduce the effectiveness of new water management strategies. Further investigation into biofilm development in pipes supplied exclusively with LPRO water over several months was identified as a promising avenue for future research.

Author Contributions

Methodology, P.M., L.M., M.M. and S.W.; validation, P.M., L.M., M.M. and S.W.; investigation, H.T., J.G. and C.B.; data curation, H.T.; writing—original draft preparation, H.T.; writing—review and editing, P.M., L.M., S.W., M.M., C.B. and J.G.; supervision, S.W., M.M., L.M. and P.M.; project administration, P.M. All authors have read and agreed to the published version of the manuscript.

Funding

This research received no external funding.

Data Availability Statement

The original contributions presented in this study are included in the article. Further inquiries can be directed to the corresponding authors.

Conflicts of Interest

The authors declare no conflicts of interest.

Abbreviations

The following abbreviations are used in this manuscript:
BDOCBiodegradable dissolved organic carbon
CFUColony forming units
DLDetection limit
GACGranular activated carbon
LPROLow-pressure reverse osmosis
QLQuantification limit
ROReverse osmosis
TTemperature
TOCTotal organic carbon
UFUltrafiltration
UVUltraviolet

References

  1. Hammes, F.; Berney, M.; Wang, Y.; Vital, M.; Köster, O.; Egli, T. Flow-Cytometric Total Bacterial Cell Counts as a Descriptive Microbiological Parameter for Drinking Water Treatment Processes. Water Res. 2008, 42, 269–277. [Google Scholar] [CrossRef] [PubMed]
  2. van der Kooij, D.; van der Wielen, P.W.J.J. Microbial Growth in Drinking-Water Supplies: Problems, Causes, Control and Research Needs; IWA Publishing: London, UK, 2013; Volume 12. [Google Scholar] [CrossRef]
  3. Prest, E.I.; Hammes, F.; van Loosdrecht, M.C.M.; Vrouwenvelder, J.S. Biological Stability of Drinking Water: Controlling Factors, Methods, and Challenges. Front. Microbiol. 2016, 7, 45. [Google Scholar] [CrossRef] [PubMed]
  4. Proctor, C.R.; Hammes, F. Drinking Water Microbiology—From Measurement to Management. Curr. Opin. Biotechnol. 2015, 33, 87–94. [Google Scholar] [CrossRef] [PubMed]
  5. Liu, G.; Verberk, J.Q.J.C.; Van Dijk, J.C. Bacteriology of Drinking Water Distribution Systems: An Integral and Multidimensional Review. Appl. Microbiol. Biotechnol. 2013, 97, 9265–9276. [Google Scholar] [CrossRef]
  6. Lautenschlager, K.; Hwang, C.; Liu, W.-T.; Boon, N.; Köster, O.; Vrouwenvelder, H.; Egli, T.; Hammes, F. A Microbiology-Based Multi-Parametric Approach towards Assessing Biological Stability in Drinking Water Distribution Networks. Water Res. 2013, 47, 3015–3025. [Google Scholar] [CrossRef]
  7. Liu, G.; Bakker, G.L.; Li, S.; Vreeburg, J.H.G.; Verberk, J.Q.J.C.; Medema, G.J.; Liu, W.T.; Van Dijk, J.C. Pyrosequencing Reveals Bacterial Communities in Unchlorinated Drinking Water Distribution System: An Integral Study of Bulk Water, Suspended Solids, Loose Deposits, and Pipe Wall Biofilm. Environ. Sci. Technol. 2014, 48, 5467–5476. [Google Scholar] [CrossRef]
  8. Fass, S.; Dincher, M.L.; Reasoner, D.J.; Gatel, D.; Block, J.-C. Fate of Escherichia coli Experimentally Injected in a Drinking Water Distribution Pilot System. Water Res. 1996, 30, 2215–2221. [Google Scholar] [CrossRef]
  9. Inkinen, J.; Kaunisto, T.; Pursiainen, A.; Miettinen, I.T.; Kusnetsov, J.; Riihinen, K.; Keinänen-Toivola, M.M. Drinking Water Quality and Formation of Biofilms in an Office Building during Its First Year of Operation, a Full Scale Study. Water Res. 2014, 49, 83–91. [Google Scholar] [CrossRef]
  10. Lehtola, M.J.; Laxander, M.; Miettinen, I.T.; Hirvonen, A.; Vartiainen, T.; Martikainen, P.J. The Effects of Changing Water Flow Velocity on the Formation of Biofilms and Water Quality in Pilot Distribution System Consisting of Copper or Polyethylene Pipes. Water Res. 2006, 40, 2151–2160. [Google Scholar] [CrossRef]
  11. Ayoub, G.M.; Malaeb, L. Impact of Intermittent Water Supply on Water Quality in Lebanon. Int. J. Environ. Pollut. 2006, 26, 379. [Google Scholar] [CrossRef]
  12. Ling, F.; Whitaker, R.; LeChevallier, M.W.; Liu, W.-T. Drinking Water Microbiome Assembly Induced by Water Stagnation. ISME J. 2018, 12, 1520–1531. [Google Scholar] [CrossRef] [PubMed]
  13. Park, J.W.; Kim, H.-C.; Meyer, A.S.; Kim, S.; Maeng, S.K. Influences of NOM Composition and Bacteriological Characteristics on Biological Stability in a Full-Scale Drinking Water Treatment Plant. Chemosphere 2016, 160, 189–198. [Google Scholar] [CrossRef]
  14. Chan, S.; Pullerits, K.; Keucken, A.; Persson, K.M.; Paul, C.J.; Rådström, P. Bacterial Release from Pipe Biofilm in a Full-Scale Drinking Water Distribution System. npj Biofilms Microbiomes 2019, 5, 9. [Google Scholar] [CrossRef]
  15. Zlatanović, L.; Van Der Hoek, J.P.; Vreeburg, J.H.G. An Experimental Study on the Influence of Water Stagnation and Temperature Change on Water Quality in a Full-Scale Domestic Drinking Water System. Water Res. 2017, 123, 761–772. [Google Scholar] [CrossRef]
  16. Payment, P.; Siemiatycki, J.; Richardson, L.; Renaud, G.; Franco, E.; Prevost, M. A Prospective Epidemiological Study of Gastrointestinal Health Effects Due to the Consumption of Drinking Water. Int. J. Environ. Health Res. 1997, 7, 5–31. [Google Scholar] [CrossRef]
  17. Hoehn, R. Biological Causes of Tastes and Odors in Drinking Water Supplies. Water Qual. Bull. 1988, 13, 46–51. [Google Scholar]
  18. Taligrot, H.; Wurtzer, S.; Monnot, M.; Geslin, J.; Moulin, L.; Moulin, P. Effect of Volumetric Concentration Factor on Virus Removal for Low-Pressure Reverse Osmosis Membrane in Drinking Water Production: A Study on Different Scales. Water Res. 2024, 267, 122536. [Google Scholar] [CrossRef] [PubMed]
  19. Ladeia Ramos, R.; Rodrigues Dos Santos, C.; Pinheiro Drumond, G.; Valéria De Souza Santos, L.; Cristina Santos Amaral, M. Critical Review of Microplastic in Membrane Treatment Plant: Removal Efficiency, Environmental Risk Assessment, Membrane Fouling, and MP Release. Chem. Eng. J. 2024, 480, 148052. [Google Scholar] [CrossRef]
  20. Diawara, C.K.; Diop, S.N.; Diallo, M.A.; Farcy, M.; Deratani, A. Performance of Nanofiltration (NF) and Low Pressure Reverse Osmosis (LPRO) Membranes in the Removal of Fluorine and Salinity from Brackish Drinking Water. J. Water Resour. Prot. 2011, 3, 912–917. [Google Scholar] [CrossRef]
  21. ISO 6222; Water Quality—Enumeration of Culturable Micro-organisms—Colony Count by Inoculation in a Nutrient Agar Culture Medium. International Organization for Standardization: Geneva, Switzerland, 1999.
  22. ISO 8199; Water Quality—General Requirements and Guidance for Microbiological Examinations by Culture. International Organization for Standardization: Geneva, Switzerland, 2018.
  23. The dMIQE Group; Whale, A.S.; De Spiegelaere, W.; Trypsteen, W.; Nour, A.A.; Bae, Y.-K.; Benes, V.; Burke, D.; Cleveland, M.; Corbisier, P.; et al. The Digital MIQE Guidelines Update: Minimum Information for Publication of Quantitative Digital PCR Experiments for 2020. Clin. Chem. 2020, 66, 1012–1029. [Google Scholar] [CrossRef]
  24. Radomski, N.; Roguet, A.; Lucas, F.S.; Veyrier, F.J.; Cambau, E.; Accrombessi, H.; Moilleron, R.; Behr, M.A.; Moulin, L. atpE Gene as a New Useful Specific Molecular Target to Quantify Mycobacterium in Environmental Samples. BMC Microbiol. 2013, 13, 277. [Google Scholar] [CrossRef] [PubMed]
  25. Anuj, S.N.; Whiley, D.M.; Kidd, T.J.; Bell, S.C.; Wainwright, C.E.; Nissen, M.D.; Sloots, T.P. Identification of Pseudomonas Aeruginosa by a Duplex Real-Time Polymerase Chain Reaction Assay Targeting the ecfX and the gyrB Genes. Diagn. Microbiol. Infect. Dis. 2009, 63, 127–131. [Google Scholar] [CrossRef]
  26. Nazarian, E.J.; Bopp, D.J.; Saylors, A.; Limberger, R.J.; Musser, K.A. Design and Implementation of a Protocol for the Detection of Legionella in Clinical and Environmental Samples. Diagn. Microbiol. Infect. Dis. 2008, 62, 125–132. [Google Scholar] [CrossRef]
  27. Herlemann, D.P.R.; Labrenz, M.; Jürgens, K.; Bertilsson, S.; Waniek, J.J.; Andersson, A.F. Transitions in Bacterial Communities along the 2000 Km Salinity Gradient of the Baltic Sea. ISME J. 2011, 5, 1571–1579. [Google Scholar] [CrossRef] [PubMed]
  28. ISO 15923-1; Water Quality—Determination of Selected Parameters by Discrete Analysis Systems. International Organization for Standardization: Geneva, Switzerland, 2013.
  29. NF EN 1484; Water Analysis—Guidelines for the Determination of Total Organic Carbon (TOC) and Dissolved Organic Carbon (DOC). Association Française de Normalisation: Saint-Denis, France, 1997.
  30. NF EN 27888; Water Quality—Determination of Electrical Conductivity. Association Française de Normalisation: Saint-Denis, France, 1994.
  31. García-Timermans, C.; Malfroot, B.; Dierendonck, C.; Mol, Z.; Pluym, T.; Waegenaar, F.; Arends, J.B.A.; Demeestere, K.; Walgraeve, C.; Boon, N.; et al. Pilot-Scale Drinking Water Distribution System to Study Water Quality Changes during Transport. npj Clean Water 2023, 6, 52. [Google Scholar] [CrossRef]
  32. Liu, S.; LePuil, M.; Taylor, J.S.; Randall, A.A. Nanofiltration and Reverse Osmosis Biostability Relative to Alternative Methods of Water Treatment. J. Water Supply Res. Technol.-Aqua 2007, 56, 25–40. [Google Scholar] [CrossRef]
  33. Escobar, I.C.; Hong, S.; Randall, A.A. Removal of Assimilable Organic Carbon and Biodegradable Dissolved Organic Carbon by Reverse Osmosis and Nanofiltration Membranes. J. Membr. Sci. 2000, 175, 1–17. [Google Scholar] [CrossRef]
  34. Park, S.; Hu, J.Y. Assessment of the Extent of Bacterial Growth in Reverse Osmosis System for Improving Drinking Water Quality. J. Environ. Sci. Health Part A 2010, 45, 968–977. [Google Scholar] [CrossRef]
  35. Meckes, M.C.; Haught, R.C.; Kelty, K.; Blannon, J.C.; Cmehil, D. Impact on Water Distribution System Biofilm Densities from Reverse Osmosis Membrane Treatment of Supply Water. J. Environ. Eng. Sci. 2007, 6, 449–454. [Google Scholar] [CrossRef]
  36. Fish, K.E.; Osborn, A.M.; Boxall, J. Characterising and Understanding the Impact of Microbial Biofilms and the Extracellular Polymeric Substance (EPS) Matrix in Drinking Water Distribution Systems. Environ. Sci. Water Res. Technol. 2016, 2, 614–630. [Google Scholar] [CrossRef]
  37. Zhang, J.; Li, W.; Chen, J.; Qi, W.; Wang, F.; Zhou, Y. Impact of Biofilm Formation and Detachment on the Transmission of Bacterial Antibiotic Resistance in Drinking Water Distribution Systems. Chemosphere 2018, 203, 368–380. [Google Scholar] [CrossRef]
  38. Velten, S.; Boller, M.; Köster, O.; Helbing, J.; Weilenmann, H.-U.; Hammes, F. Development of Biomass in a Drinking Water Granular Active Carbon (GAC) Filter. Water Res. 2011, 45, 6347–6354. [Google Scholar] [CrossRef] [PubMed]
  39. Lin, T.; Chen, W.; Wang, L. Particle Properties in Granular Activated Carbon Filter during Drinking Water Treatment. J. Environ. Sci. 2010, 22, 681–688. [Google Scholar] [CrossRef] [PubMed]
  40. Mallon, K. The Release of Particles from GAC Filter-Adsorbers and Their Effect on Disinfection. Master’s Thesis, University of North Carolina at Chapel Hill, Chapel Hill, NC, USA, 1990. [Google Scholar]
  41. Frias, J.; Ribas, F.; Lucena, F. Effects of Different Nutrients on Bacterial Growth in a Pilot Distribution System. Antonie van Leeuwenhoek 2001, 80, 129–138. [Google Scholar] [CrossRef] [PubMed]
  42. Bott, T.L.; Kaplan, L.A. Bacterial Biomass, Metabolic State, and Activity in Stream Sediments: Relation to Environmental Variables and Multiple Assay Comparisons. Appl. Environ. Microbiol. 1985, 50, 508–522. [Google Scholar] [CrossRef]
  43. Volk, C.; Joret, J.C.C. Paramètres prédictifs de l’apparition des coliformes dans les réseaux de distribution d’eau d’alimentation. Rev. Sci. Eau 2005, 7, 131–152. [Google Scholar] [CrossRef]
  44. Becerra-Castro, C.; Macedo, G.; Silva, A.M.T.; Manaia, C.M.; Nunes, O.C. Proteobacteria Become Predominant during Regrowth after Water Disinfection. Sci. Total Environ. 2016, 573, 313–323. [Google Scholar] [CrossRef]
  45. Tao, A.; Su, C.; Liu, X.; Wang, K.; Zhang, Y.; Chen, Z.; Wang, Q.; Gao, S. Effects of Carbon Sources on Phosphorus Speciation Transformation Process, Characteristics of Extracellular Polymeric Substances, and Microecology in Anaerobic Systems. J. Water Process Eng. 2023, 53, 103606. [Google Scholar] [CrossRef]
  46. Yuan, Y.; Wang, S.; Liu, Y.; Li, B.; Wang, B.; Peng, Y. Long-Term Effect of pH on Short-Chain Fatty Acids Accumulation and Microbial Community in Sludge Fermentation Systems. Bioresour. Technol. 2015, 197, 56–63. [Google Scholar] [CrossRef]
  47. Perrin, Y.; Bouchon, D.; Héchard, Y.; Moulin, L. Spatio-Temporal Survey of Opportunistic Premise Plumbing Pathogens in the Paris Drinking Water Distribution System. Int. J. Hyg. Environ. Health 2019, 222, 687–694. [Google Scholar] [CrossRef]
  48. Barbeau, B.; Julienne, K.; Carriere, A.; Gauthier, V. Dead-End Flushing of a Distribution System: Short and Long-Term Effects on Water Quality. J. Water Supply Res. Technol.-Aqua 2005, 54, 371–383. [Google Scholar] [CrossRef]
  49. Servais, P.; Billen, G.; Laurent, P.; Levi, Y.; Randon, G. Studies of BDOC and Bacterial Dynamics in the Drinking Water Distribution System of the Northern Parisian Suburbs. Rev. Sci. Eau 2005, 5, 69–89. [Google Scholar] [CrossRef]
  50. Gauthier, V.; Gérard, B.; Portal, J.-M.; Block, J.-C.; Gatel, D. Organic Matter as Loose Deposits in a Drinking Water Distribution System. Water Res. 1999, 33, 1014–1026. [Google Scholar] [CrossRef]
  51. Sade, Z.; Hegyi, S.; Halevy, I. Equilibration Times of Dissolved Inorganic Carbon During pH Transitions. Front. Earth Sci. 2022, 9, 792858. [Google Scholar] [CrossRef]
  52. Van Der Wende, E.; Characklis, W.G.; Smith, D.B. Biofilms and Bacterial Drinking Water Quality. Water Res. 1989, 23, 1313–1322. [Google Scholar] [CrossRef]
  53. Hall-Stoodley, L.; Costerton, J.W.; Stoodley, P. Bacterial Biofilms: From the Natural Environment to Infectious Diseases. Nat. Rev. Microbiol. 2004, 2, 95–108. [Google Scholar] [CrossRef]
  54. American Water Works Association. Water Quality & Treatment: A Handbook on Drinking Water, 6th ed.; Edzwald, J.K., Ed.; McGraw-Hill: New York, NY, USA, 2011; ISBN 978-0-07-163011-5. [Google Scholar]
  55. Stewart, P.S.; Franklin, M.J. Physiological Heterogeneity in Biofilms. Nat. Rev. Microbiol. 2008, 6, 199–210. [Google Scholar] [CrossRef]
  56. Wingender, J.; Neu, T.R.; Flemming, H.-C. What Are Bacterial Extracellular Polymeric Substances? In Microbial Extracellular Polymeric Substances; Wingender, J., Neu, T.R., Flemming, H.-C., Eds.; Springer: Berlin/Heidelberg, Germany, 1999; pp. 1–19. ISBN 978-3-642-64277-7. [Google Scholar]
  57. Boyd, C.E. Water Quality: An Introduction; Springer International Publishing: Cham, Switzerland, 2020; ISBN 978-3-030-23334-1. [Google Scholar]
  58. Røder, H.L.; Sørensen, S.J.; Burmølle, M. Studying Bacterial Multispecies Biofilms: Where to Start? Trends Microbiol. 2016, 24, 503–513. [Google Scholar] [CrossRef]
  59. Delafont, V.; Perrin, Y.; Bouchon, D.; Moulin, L.; Héchard, Y. Targeted Metagenomics of Microbial Diversity in Free-Living Amoebae and Water Samples. In Legionella; Buchrieser, C., Hilbi, H., Eds.; Methods in Molecular Biology; Springer: New York, NY, USA, 2019; Volume 1921, pp. 421–428. ISBN 978-1-4939-9047-4. [Google Scholar]
Figure 1. Representation of the bacterial growth pilot: (a) photography and (b) PID diagram.
Water 17 00835 g001
Figure 2. Evolution of (a) the concentration of intact cells and (b) TOC over time as a function of the type of water.
Water 17 00835 g002
Figure 3. Evolution of the concentration of (a) nitrate, (b) orthophosphate, and (c) the conductivity over time as a function of the type of water.
Water 17 00835 g003
Figure 4. Evolution of pH over time as a function of the type of water.
Water 17 00835 g004
Figure 5. Evolution of suspended microbial flora over time as a function of type of water, counted on (a) PCA medium at 22 °C (b) PCA medium at 36 °C and (c) R2A medium at 22 °C.
Water 17 00835 g005
Figure 6. Impact of a change in water type on the concentration of intact, metabolically active cells over time.
Water 17 00835 g006
Figure 7. Impact of a change in water type on the Legionella spp. concentration over time.
Water 17 00835 g007
Figure 8. Evolution of conductivity and total chlorine over time, during the two tap water phases.
Water 17 00835 g008
Figure 9. Impact of a change in water type on the TOC over time.
Water 17 00835 g009
Figure 10. Impact of a change in water type on the orthophosphate concentration over time.
Water 17 00835 g010
Figure 11. Impact of a change in water type on microbiological parameters over time.
Water 17 00835 g011
Figure 12. Microbial community composition and diversity over time: (a) Relative abundance of the majority bacterial species (>0.5%) and (b) evolution of alpha diversity (Shannon index).
Water 17 00835 g012
Table 1. Average physico-chemical characteristics of waters.
ParameterTap WaterSoftened WaterUltrafiltered WaterLPRO Water
pH7.497.407.204.79
Conductivity (µS cm−1)488501513<50
TOC (mgC L−1)0.811.090.39<0.20
Nitrate (mg L−1)19.622.428.4<2.0
Ammonium (mg L−1)<0.03<0.03<0.03<0.03
Orthophosphate (mg L−1)0.670.840.120.09
Total Chlorine (mg L−1)0.220.000.000.00
Active Chlorine (mg L−1)0.060.000.000.00
Table 2. Characteristics of microbiological analyses carried out on the bacterial development pilot plant.
ParameterMethodUnitDetection Limit (DL)Quantification Limit (QL)
Total cells and intact cellsFlow cytometryCells mL−1200100
Metabolically active cellsSolid phase cytometryCells mL−1110
Total Flora on PCA mediumNF EN ISO 6222 [21]CFU mL−135
Total flora on R2A mediumNF EN ISO 8199 [22]CFU 150 µL−134
Specific bacteriaDigital PCRCopies L−12060
Table 3. Oligonucleotides of bacteria studied.
ATPE-FCGGYGCCGGTATCGGYGAatpEMycobacteria[24]
ATPE-RCGAAGACGAACARSGCCAT
ATPE-PROX-ACSGTGATGAAGAACGGBGTRAA-QXL610
ecfX-FCGCATGCCTATCAGGCGTTecfXPseudomonas aeruginosa[25]
ecfX-RGAACTGCCCAGGTGCTTGC
ecfX-PTAMRA-ATGGCGAGTTGCTGCGCTTCCT-BHQ2
Leg23SF forwardCCCATGAAGCCCGTTGAA23S rRNALegionella[26]
Leg23SR reverseACAATCAGCCAATTAGTACGAGTTAGC
Lsp23SPFAM-TCCACACCTCGCCTATCAACGTCGTAGT-BHQ1
LmipF forwardAAAGGCATGCAAGACGCTATGmip
LmipR reverseGAAACTTGTTAAGAACGTCTTTCATTTG
LmipPHEX-TGGCGCTCAATTGGCTTTAACCGA-BHQ1
Table 4. Characteristics of physico-chemical analyses carried out on the bacterial development pilot plant.
ParameterApparatusMethodUnitQuantification Limit (QL)
Ammonium (NH4+)Gallery plus, Thermo (Waltham, USA)NF EN ISO 15923-1 [28]mg L−10.03
Nitrates (NO3)2
Orthophosphates (PO43−)Smartchem 450 (Rome, Italy), AMS0.05
TOCAnalytikjena 3100 (Jean, Germany)NF EN 1484 [29]mgC L−10.2
Conductivity855 robotic titrosampler, Metrohm (Herisau, Switzerland)NF EN 27888 [30]µS cm−150
Active ChlorineDR300, Hach (Loveland, CO, USA)USEPA DPD Methodmg L−10.01
Total Chlorine0.01
Table 5. Characteristics of stationary phases observed during bacterial growth as a function of the type of water.
ParameterTap WaterSoftened WaterUltrafiltered WaterLPRO Water
Bacterial concentration at stationary phase (cells mL−1)>2 × 1062 × 1061.5 × 1061.1 × 106
Time to stationary phase (days)>30211715
Disclaimer/Publisher’s Note: The statements, opinions and data contained in all publications are solely those of the individual author(s) and contributor(s) and not of MDPI and/or the editor(s). MDPI and/or the editor(s) disclaim responsibility for any injury to people or property resulting from any ideas, methods, instructions or products referred to in the content.