Article

Stable Water Isotopes Across Marsh, River, and Lake Environments in the Zoige Alpine Wetland on the Tibetan Plateau

1
State Key Laboratory of Wetland Conservation and Restoration, Institute of Ecological Conservation and Restoration, Chinese Academy of Forestry, Beijing 100091, China
2
Center for Ecological and Environmental Accounting, Chinese Academy of Environmental Planning, Beijing 100041, China
3
Beijing Fangshan Forest and Fruit Science and Technology Service Centre, Beijing 102499, China
*
Author to whom correspondence should be addressed.
Water 2025, 17(6), 820; https://doi.org/10.3390/w17060820
Submission received: 24 January 2025 / Revised: 4 March 2025 / Accepted: 6 March 2025 / Published: 12 March 2025

Abstract

:
Water isotope studies in alpine wetlands have revealed the dynamic characteristics of the hydrological cycle and evapotranspiration processes in the Zoige region through hydrogen and oxygen isotope ratios. However, the hydrological continuity between marshes, rivers, and lakes in wetlands is relatively understudied. The study found that the Zoige Alpine Wetland local meteoric water line (LMWL) is δD = 8.33δ18O + 14.52 (R2 = 0.92) by using linear regression analysis to confirm the Craig temperature effect equation backwards. Comparison with the global and Chinese LMWLs revealed that the slope of the Zoige LMWL is significantly higher than those of the global and Chinese LMWLs, indicating that the oceanic warm and humid airflow and the southwest monsoon significantly influence this region. The δ18O ranges of rivers, lakes, and marshes in the Zoige wetland were −12.86‰ to −2.02‰, −12.9‰ to −2.22‰, and −15.47‰ to −7.07‰, respectively. In terms of δD, marshes had the lowest δD values, with a mean value of −89.58‰, while rivers and lakes had close δD values of about −72‰. Rivers had the most dramatic variation in d-excess values, ranging from −34.16‰ to 3.68‰, while marshes and lakes had more concentrated d-excess values, with particularly negative values in marshes. Regression analysis yielded a trend line of δD = 5.41δ18O − 29.57 for evaporation from the water bodies, further demonstrating the importance of evaporation effects in this region. By using the Rayleigh fractionation model and estimating the climatic conditions, we found that the lake water had the highest evaporation intensity (41%). Those of the river and marsh water were 40% and 36%, respectively. The results of this study provide new scientific insights into the hydrological connectivity, evaporation processes, and water source characteristics in the Zoige wetland. Future studies can shed more light on how climate change affects wetland hydrological systems and how they change over time and space. This will help to manage water resources in the region and protect the environment.

1. Introduction

Water stable isotopes (δ18O and δD) are essential indicators for studying complex hydrological, climatic, and ecological processes in different spatial and temporal data series [1]. Hydrological connectivity refers to the exchange of water, matter, and energy, and their interactions between different bodies of water, especially in the case of precipitation, rivers, lakes, and wetlands, which are linked by water flows [2]. Water-stable isotopes offer significant potential for studying hydrological connectivity. They enable the labeling and tracking of individual water sources and mixed water bodies, including quantifying water balances, evaporation, and water residence times. Additionally, they reveal flow paths, connectivity levels, and exchange processes between water bodies. As a result, they provide critical information for hydrological modeling. They also support efficient water resource management and the study of ecosystem water dynamics [3]. Water isotopes can be effectively used to detect the hydrological distribution of water sources over extended periods of time. This approach helps to quantify changes in water sources across different seasons and years, revealing the seasonal variations among various water bodies [4]. Different water bodies have specific isotopic signatures, and differences in the isotope ratios of different water bodies can aid in the determination of their connectivity. Surface water is more influenced by precipitation, and groundwater typically has lower δ18O and δD values [4]. This information is essential for understanding the hydrological cycle, assessing the sustainability of water resources, predicting water flow changes, protecting ecosystems, and developing effective water resource management policies.
Alpine wetlands are usually situated in mountainous and highland areas and are often the headwater areas of major rivers. They have an essential function in water conservation [5,6]. Water in wetlands can regulate the water table, maintaining the water supply of the surrounding area, especially during the dry season, which is crucial for the water supply of downstream areas [5]. Alpine wetlands can regulate the hydrological cycle through evapotranspiration and water retention via their wetland vegetation [7]. Water bodies within wetlands can store and release water during seasonal snowmelt or rainfall during the dry season. This process helps to mitigate fluctuations in water resources due to extreme climate change [8]. Alpine wetlands can act as flood retention areas during heavy rains or snowmelt [8]. The soil and vegetation structures of wetlands can absorb large amounts of precipitation and reduce the risk of flooding in downstream areas through the slow release of water [9]. Alpine wetlands typically have a high carbon storage capacity due to their low temperature and precipitation characteristics [10]. These wetlands play an active role as carbon sinks in global climate change, reducing atmospheric carbon dioxide concentrations [11]. In addition, the plants and microorganisms in a wetland can effectively remove pollutants from the water and improve the water quality [12]. Hydrological processes in alpine wetlands directly impact the wetland’s ecological functions. They also play critical roles on a larger scale, including in water resource management, climate change regulation, and biodiversity conservation.
Alpine wetlands refer to wetland ecosystems located at high latitudes or high altitudes. The climatic conditions in these areas are exceptional, with significant cold and wet characteristics, and therefore, water isotope studies in these areas are of great scientific significance [13]. Precipitation in alpine regions consists mainly of snow, rain, and meltwater [14]. Water isotope ratios are relatively stable at such low temperatures, due to the corresponding weak evaporation. However, evaporation increases with increasing temperature, which affects the isotope ratios of water, providing clues on climate change [15,16]. By analyzing water isotope ratios, it is possible to trace the origin of the water in a water body and to distinguish the contributions of different water sources (e.g., precipitation, meltwater, and groundwater) [17]. Such analyses help to improve the understanding of the hydrological cycle and sources of water recharge in alpine wetlands and to reveal the dynamics of water bodies. The ratios of oxygen isotopes (18O/16O) and deuterium isotopes (2H/1H) are usually closely correlated with air temperature [18]. In alpine regions, the proportion of light isotopes (e.g., light isotopes of hydrogen and oxygen) in precipitation is more prominent due to lower temperatures [10]. Water isotopes can reflect the nature of water sources, evaporation processes, and local precipitation patterns, making them an important tool for studying the hydrological connectivity of wetlands. By analyzing the water isotope compositions of different water bodies (e.g., marshes, rivers, and lakes) in alpine wetland regions, the hydrological connectivity between water bodies in wetlands and their responses to external climate change can be revealed. Studying the relationship between water isotopes and wetland hydrological connectivity offers valuable insights. It enhances the understanding of water resource trends in alpine wetlands due to climate change and clarifies the potential impacts of these trends on the ecosystem. This research provides a scientific foundation for sustainable wetland conservation and restoration efforts.
The Zoige wetland, as an important ecological water-holding area in the eastern part of the Tibetan Plateau, has abundant water resources and complex hydrological processes. It plays an important role in regulating the climate and maintaining the water cycle and atmospheric circulation; however, in recent years, due to human activities and climate change, the water resources of the wetland have gradually become under threat, and the problems of declining water levels and ecological degradation have become increasingly severe. In order to address water resource management issues in the Zoige wetland and alpine wetlands, in this study, we collected hydrogen and oxygen isotope data from marshes, rivers, and lakes in this region. Based on these data, we conducted hydrological interpretations and obtained related information. The main objectives of this study were (1) to investigate the manifestation of atmospheric precipitation isotopes and evaporation processes in the local hydrological characteristics; (2) to determine the water sources and their isotopic signatures of the marshes, rivers, and lakes in the Zoige wetland; and (3) to elucidate the hydrological connectivity among the marshes, rivers, and lakes and their impact on the stable isotopes of water.

2. Materials and Methods
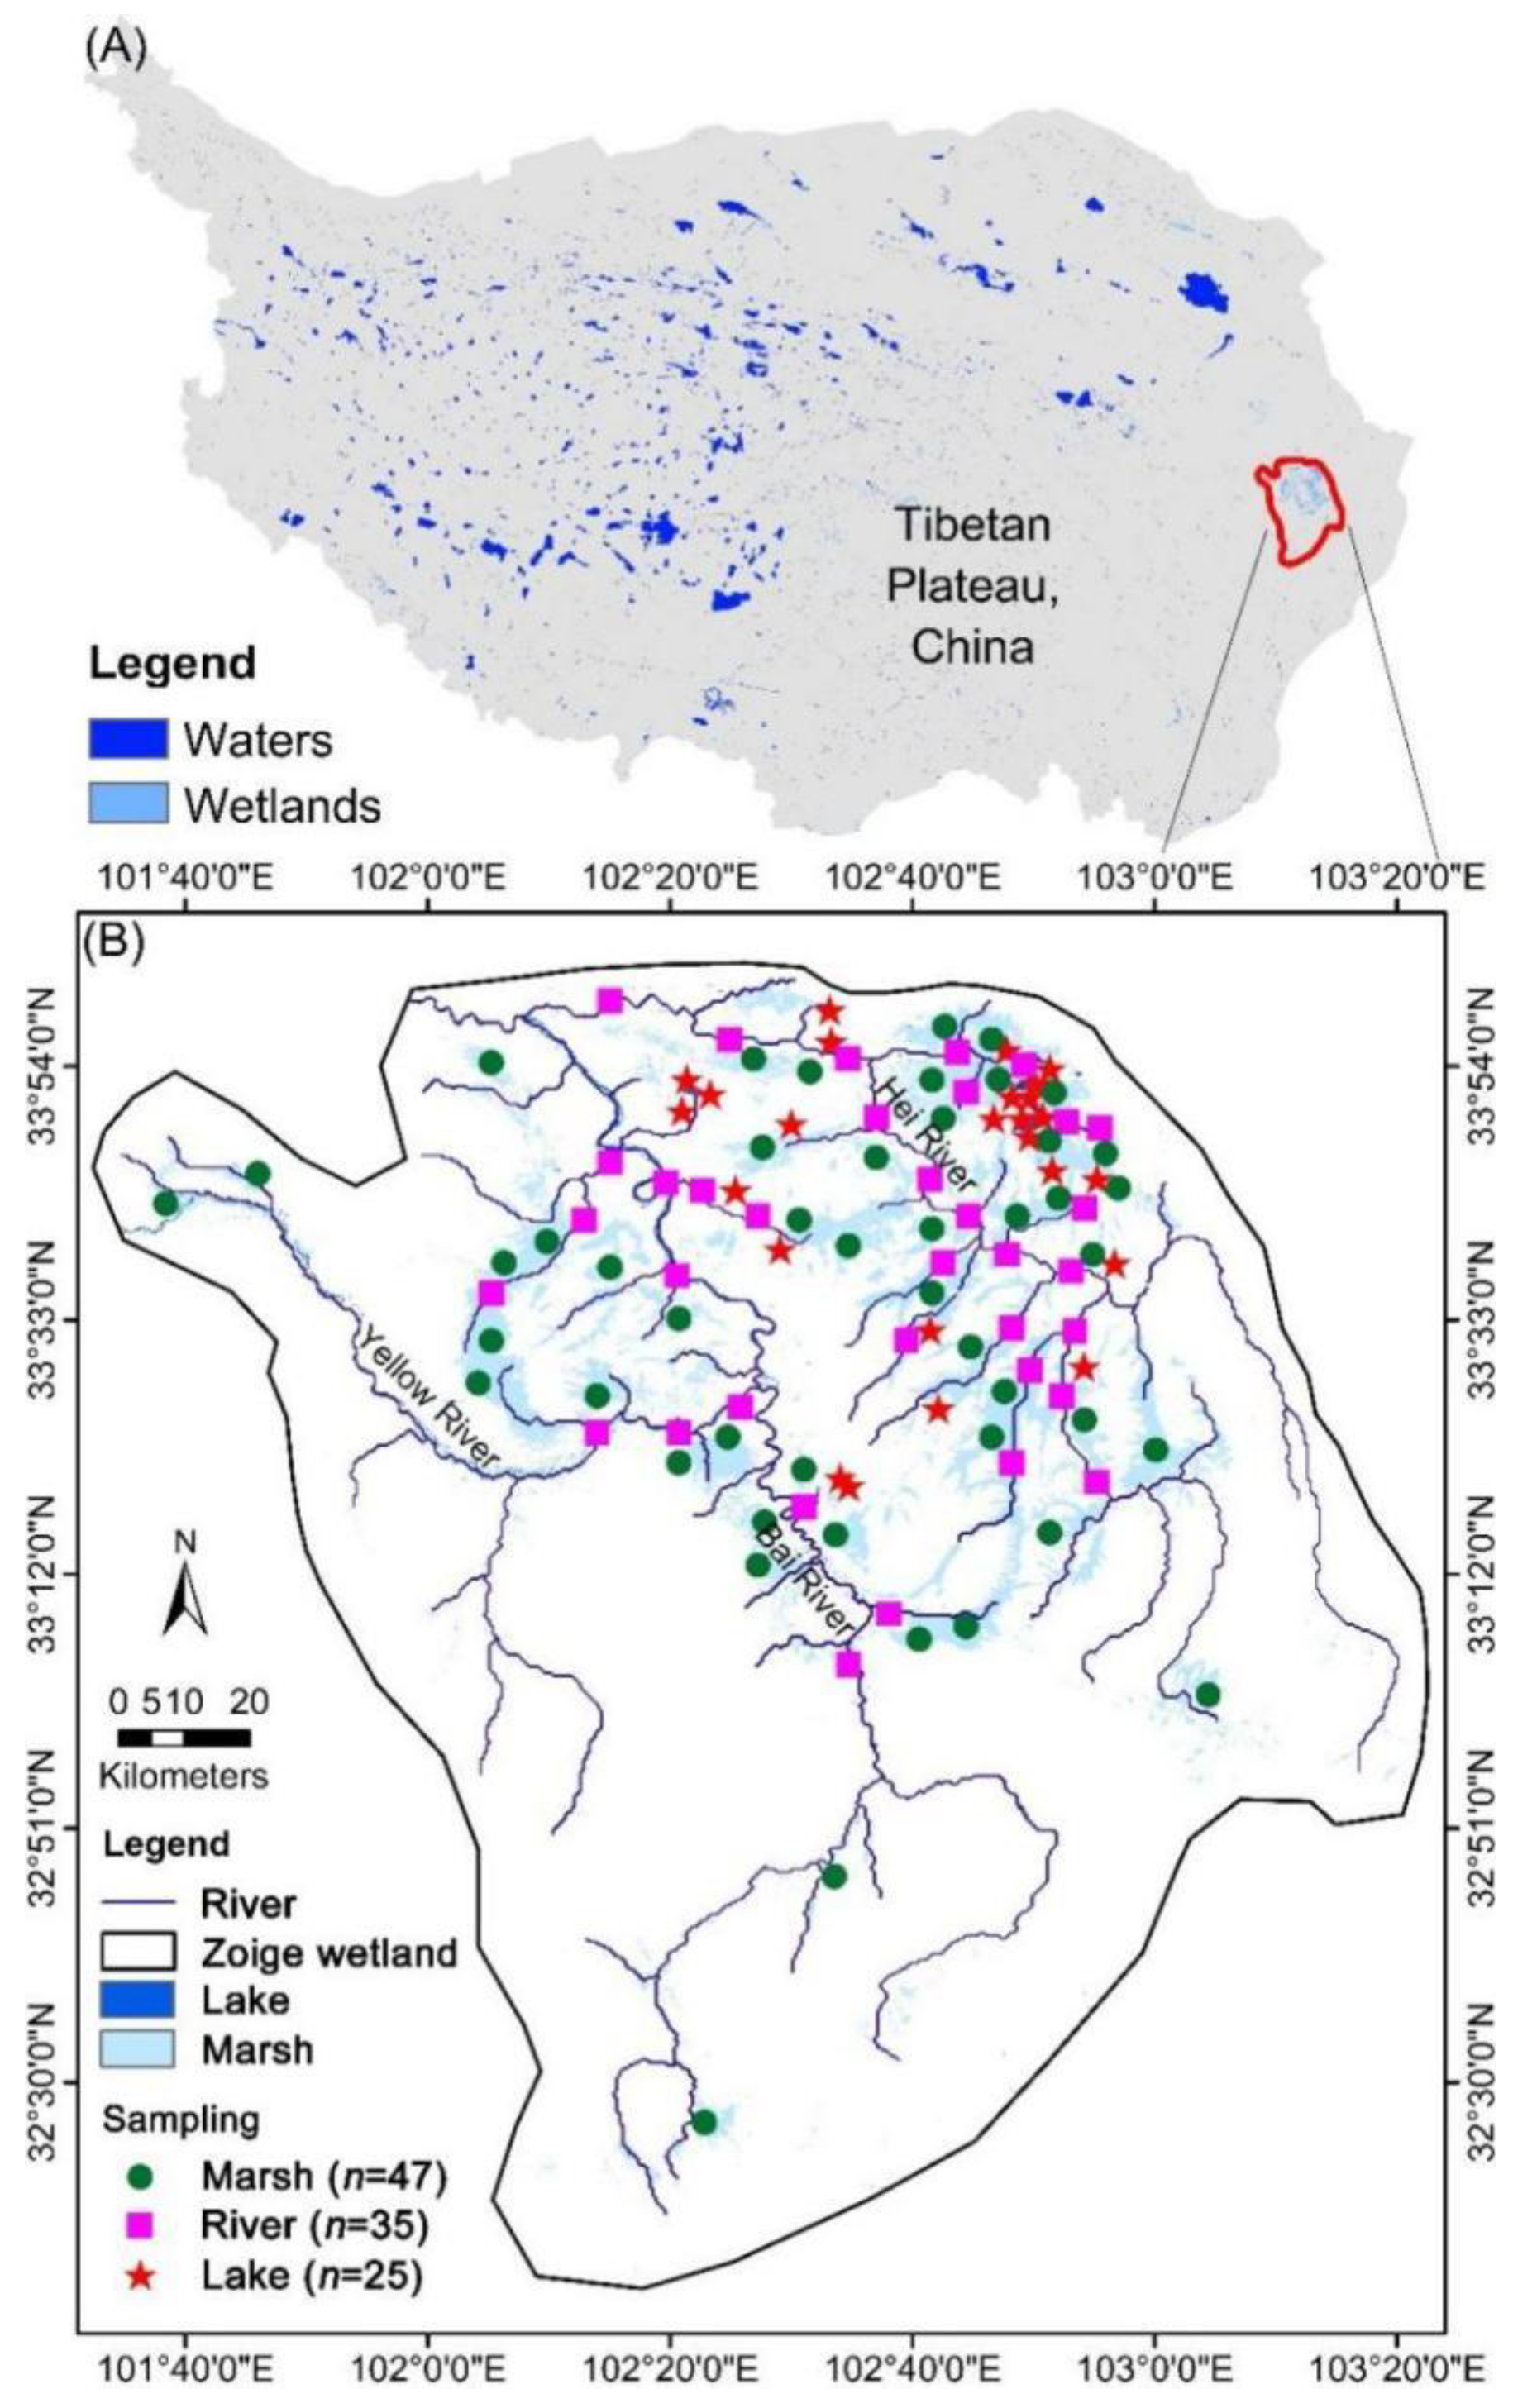
2.1. Study Area

The study area is located in the Zoige Alpine Wetland in the northeastern part of the Tibetan Plateau, China’s main concentrated distribution area of alpine wetlands. With an average elevation of 3500 m above sea level and a total area of 16,670.6 km2, the Zoige Alpine Wetland is the largest plateau peatland in the world. The Zoige Alpine Wetland has a plateau cold temperate humid monsoon climate. The average annual precipitation is 600–750 mm, which is primarily concentrated in autumn. The average annual temperature is 0.96 °C; the highest temperature occurs in July, and the lowest temperature occurs in January.
The main tributaries in the region are the Hei River and the Bai River, both of which are tributaries of the Yellow River and join the Yellow River from south to north. The upper reaches of the Hei River are characterized by higher topography and larger sediment particles, which have a more robust drainage capacity. In contrast, the middle and lower reaches are flatter, with meandering channels and poor drainage, forming extensive alpine swamp wetlands. The White River is much more smoothly drained, with good drainage in the upper reaches and gentle terrain in the middle and lower reaches, which are the main distribution areas of the wetlands in the White River Basin [19]. Swamps are widely distributed, and numerous lakes are present in the study area. The primary wetland swamps include the Kharkhalcho, Heqingcho, Elegna, and Rishijocho swamps, and the ecologically important lakes include the Huahu, Tsolajian, Hachu, and Mo’u Cholge lakes.

2.2. Field Sampling

This study collected samples from water bodies in the study area. These samples provide a foundation for further analyses. Specifically, they will help examine the effects of hydrological connectivity on water isotopes and elucidate the connections between lakes, marshes, and rivers regarding water recharge. The distribution of the sampling sites was arranged as follows: the river sampling sites were evenly distributed along the main streams of the Black River and the White River and their significant tributaries. The marsh wetland sampling sites were distributed in various parts of the study area, and most of the samples were located in the wetland zones in the middle and lower reaches of the Black River and the White River. The lake wetland sampling sites were selected from the lake areas in the middle and lower reaches of the Black River and the White River. We collected the samples for this paper in July 2023 from several typical areas of the Zoige wetland. These included the upper, middle, and lower reaches of the river, the littoral zone, the central area of the lake, and the different vegetation zones of the marshes. This was carried out to ensure that the samples were geographically representative and ecologically diverse. In total, 107 water samples were collected, of which 47 were marsh water samples, 35 were lake water samples, and 25 were river water samples. The specific locations of the sampling points are shown in Figure 1.
Representative and uncontaminated sampling points were selected to prevent interference from localized contamination during the sampling process. The river water was collected in a state of natural water flow, and the sampling depth was 30 cm below the water surface to avoid disturbing the bottom sediments. The sampling areas with flowing water were selected from as far away from the shore as possible to ensure that the samples were representative. When sampling bog water, we decided to avoid areas susceptible to disturbances. We entered the depth of the bog, allowed the water to return to its natural state for 2 min, and then used a long-handled scoop to sample the water at a depth of about 30 cm below the surface to ensure that the profile, live root layer, and peat layer of the bog were not disturbed. The lake water was preferentially sampled from the center or the main flow area. We used a long-handled dipper to collect samples at a depth of 30 cm, so as to avoid disturbing the bottom sediments.

2.3. Laboratory Analysis of Water Stable Isotopes

Regarding sample processing, ice packs were used during the transport of water samples to prevent their deterioration. All of the water samples (including river, marsh, and lake water) were collected using a triple-rinsed syringe and were filtered through a 0.45 μm filter membrane to remove solid particles from the water. The collected water samples were stored in 20 mL brown, narrow-mouthed polyethylene bottles and cold-sealed containers.
The isotope analysis of the water samples was conducted using a Picarro L2130-i ultra-high precision liquid water and water vapor isotope analyzer. The instrument was capable of providing precise determinations of the δD and δ18O values of the water samples, with measurement accuracies of ±0.1‰ and ±0.5‰, respectively. Specific measures ensured the accuracy and reliability of the liquid water isotope data. The obtained data were compared to Vienna Standard Mean Ocean Water (V-SMOW). Additionally, the data were expressed in terms of thousandths of a percent difference [20]. The specific calculation formula is as follows:
δsample = ((Rsample − Rstandard) − 1) × 1000‰
where Rsample is the ratio of the abundance of heavy stable isotopes to light stable isotopes (e.g., D/H, 18O/16O) in the sample and Rstandard is the value of the ratio of the isotope abundance in the standard V-SMOW water sample.

2.4. Statistical Analysis

The data were collated using Excel 2016 and the results of the stable hydrogen and oxygen isotope analyses were statistically analyzed using the SPSS 28.0 software. Correlation and one-way regression analyses were the main analytical methods applied. The graphs of the analyzed results were plotted using Origin 2018 software.
There is a specific linear relationship between the hydrogen and oxygen isotope values of the atmospheric precipitation and the mean annual temperature of the region, and this relationship is described using the Craig temperature effect Equation [21]:
δ18O = 0.695T − 13.6, δD = 5.6T − 100
where T is the local multi-year average temperature (°C).
The values for different deuterium excesses (d-excesses) were calculated from the stable oxygen and hydrogen isotope data according to the formula proposed by Dansgaard (1964) [21].
d-excess = δD − 8δ18O
The magnitude of the d-excess value represents the intercept of the atmospheric precipitation in a region when the slope of the atmospheric precipitation is 8. This value reflects the degree of oxygen isotope exchange between the water and rocks in the region.
During the evaporation of a body of water, the composition of the stable hydrogen and oxygen isotopes changes, because evaporation is a selective fractionation process. The evaporative fractionation effect is closely related to the temperature, and the light isotopes are more easily evaporated in a high-temperature environment. Hence, the remaining water in the water body contains a higher proportion of heavy isotopes. Therefore, evaporative losses from water bodies can be estimated using the Rayleigh equilibrium fractionation Equation [22]:
δ = (δ0 + 1) fα − 1
where δ is the stable isotope value of the remaining water body; δ0 is the stable isotope value of the water body before evaporation; α is the fractionation factor, which indicates the fractionation factor of the isotopes under a given set of conditions; and f is the proportion of the isotope in the water body after evaporation or condensation.
The fractionation factor must be determined when calculating the proportion of evaporation from a body of water. Temperature is the main factor affecting the isotope fractionation process, and a change in temperature leads to a change in the fractionation factor. When the temperature is lower, the evaporation rate of the water body is slower, the fractionation coefficient is larger, and the fractionation effect is more significant. Thus, the relationships between the 18O and D isotope fractionation coefficients and thermodynamic temperature are as follows [23]:
α18O = e{(1.137/T/T) × 1000 − (0.4156/T) − 2.0667/1000}
αD = e{(24.844/T/T) × 1000 − (76.248/T) + 52.612/1000}
where α is the isotopic fractionation factor during water condensation and T is the thermodynamic temperature.

3. Results

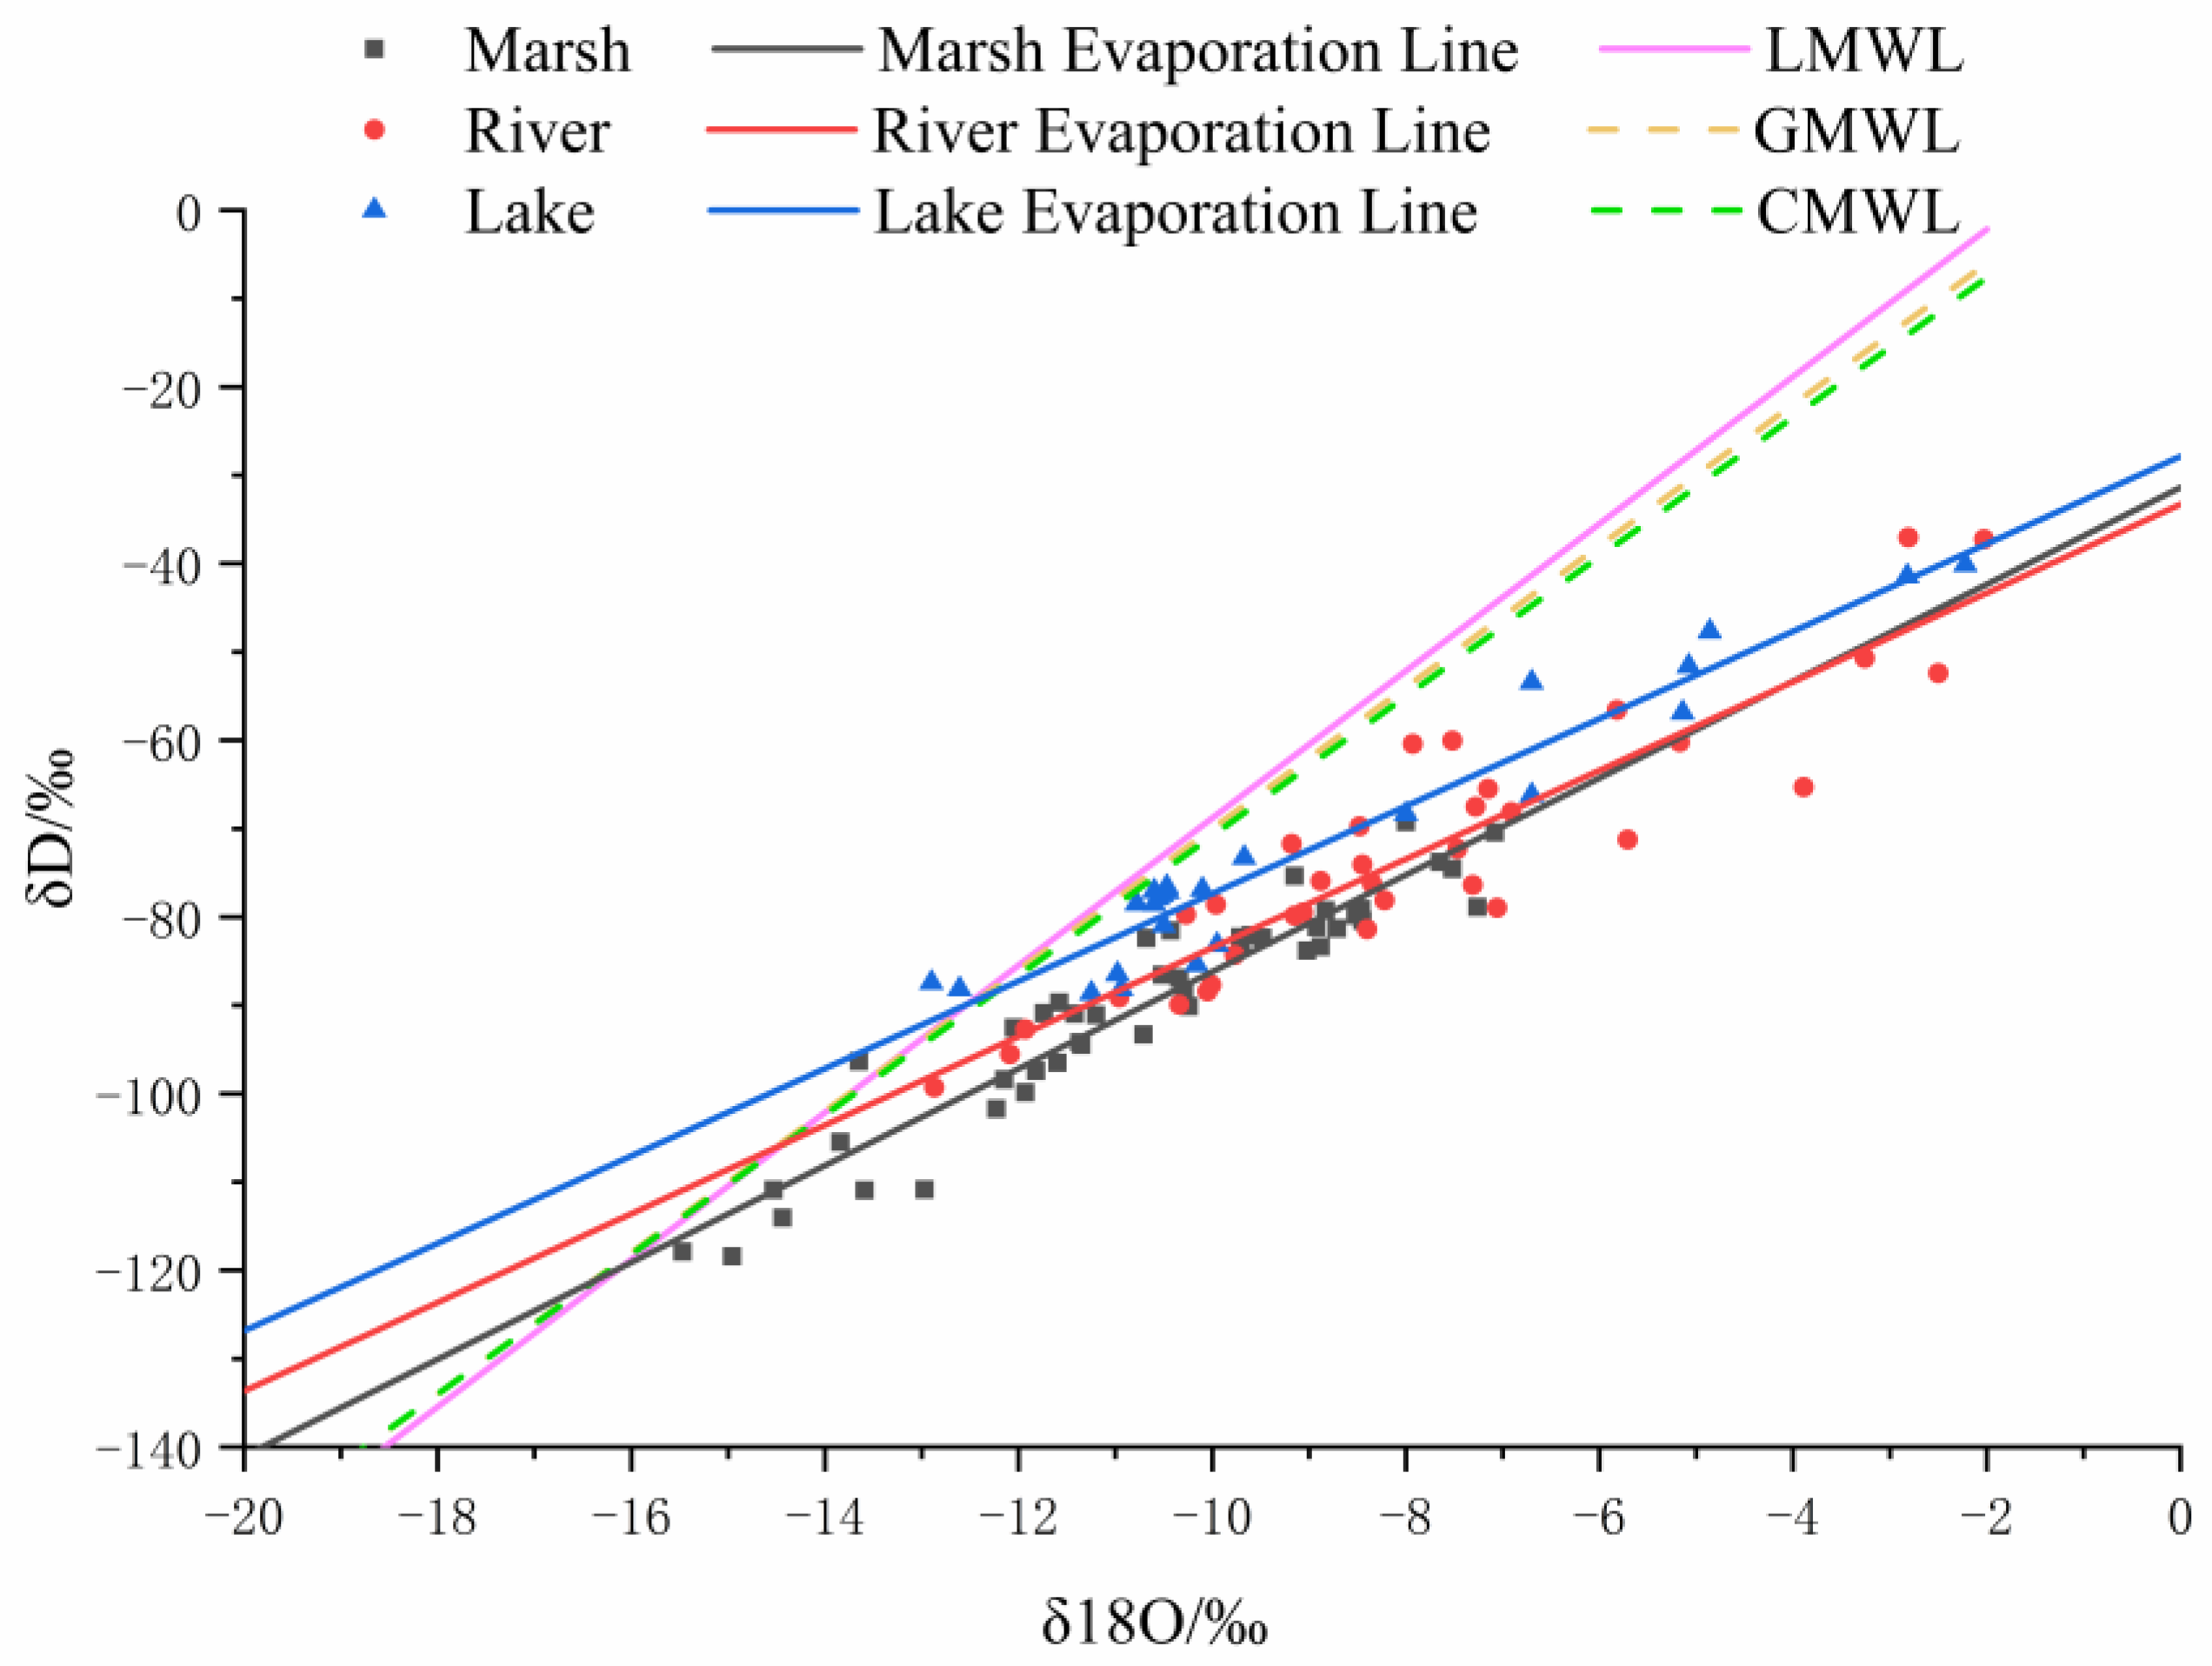
3.1. Isotopic Characteristics of Atmospheric Precipitation in the Study Area

The hydrogen and oxygen isotope compositions of atmospheric precipitation are usually stable within a certain range, so the atmospheric precipitation line in the same region can be expressed using a simple equation [24]. In order to study the hydrological characteristics of the Zoige wetland and the recharge of the water body, we analyzed the relationship between the δD and δ18O values of the precipitation in the region using linear regression. The local meteoric precipitation line (LMWL) was obtained: δD = 8.33δδ18O + 14.52, with a correlation coefficient of R2 = 0.92 and significance level of p < 0.01 [25]. The LMWL was verified inversely using Craig’s temperature effect equation, and the average multi-year air temperature in the study area (0.96 °C) was substituted into the formula, which yielded δ18O = −12.93‰ and δD = −94.62‰. By substituting δ18O = −12.93‰ into the LMWL equation, it was calculated that δD = −93.19‰, and the absolute error between the two was calculated to be 1.43‰, indicating that the LMWL can better represent the atmospheric precipitation line in the study area.
Figure 2 illustrates the atmospheric precipitation line in the Zoige region. The global meteoric water line (GMWL) is an equation proposed by Craig [22] and is expressed as follows: δD = 8δ18O + 10. The Chinese meteoric water line (CMWL) was calculated by Zheng: δD = 7.9δ18O + 8.2 [26]. Among these atmospheric precipitation lines, the slope of the LMWL in the Zoige region (8.33) is higher than that of the GMWL (8.00) and the CMWL (7.90). Several factors can explain this phenomenon. We primarily collected the atmospheric precipitation samples in the Zoige region during the summer months of July and August. During this period, precipitation mainly originates from warm and humid ocean currents, and the water vapor content in the air is high. As the temperature increases, the water vapor saturation in the air increases significantly, and the precipitation increases sharply. In this case, the non-equilibrium fractionation effect of stable hydrogen and oxygen isotopes during precipitation is weaker, which increases the slope of the precipitation line. The larger slopes and intercepts of the LMWL for the Zoige region indicate that this area is less affected by local water vapor and secondary evaporation, and that the evaporation is strong. The slope is close to that of the global atmospheric water line, indicating that the Zoige region is significantly affected by the precipitation effect of the southwest monsoon.

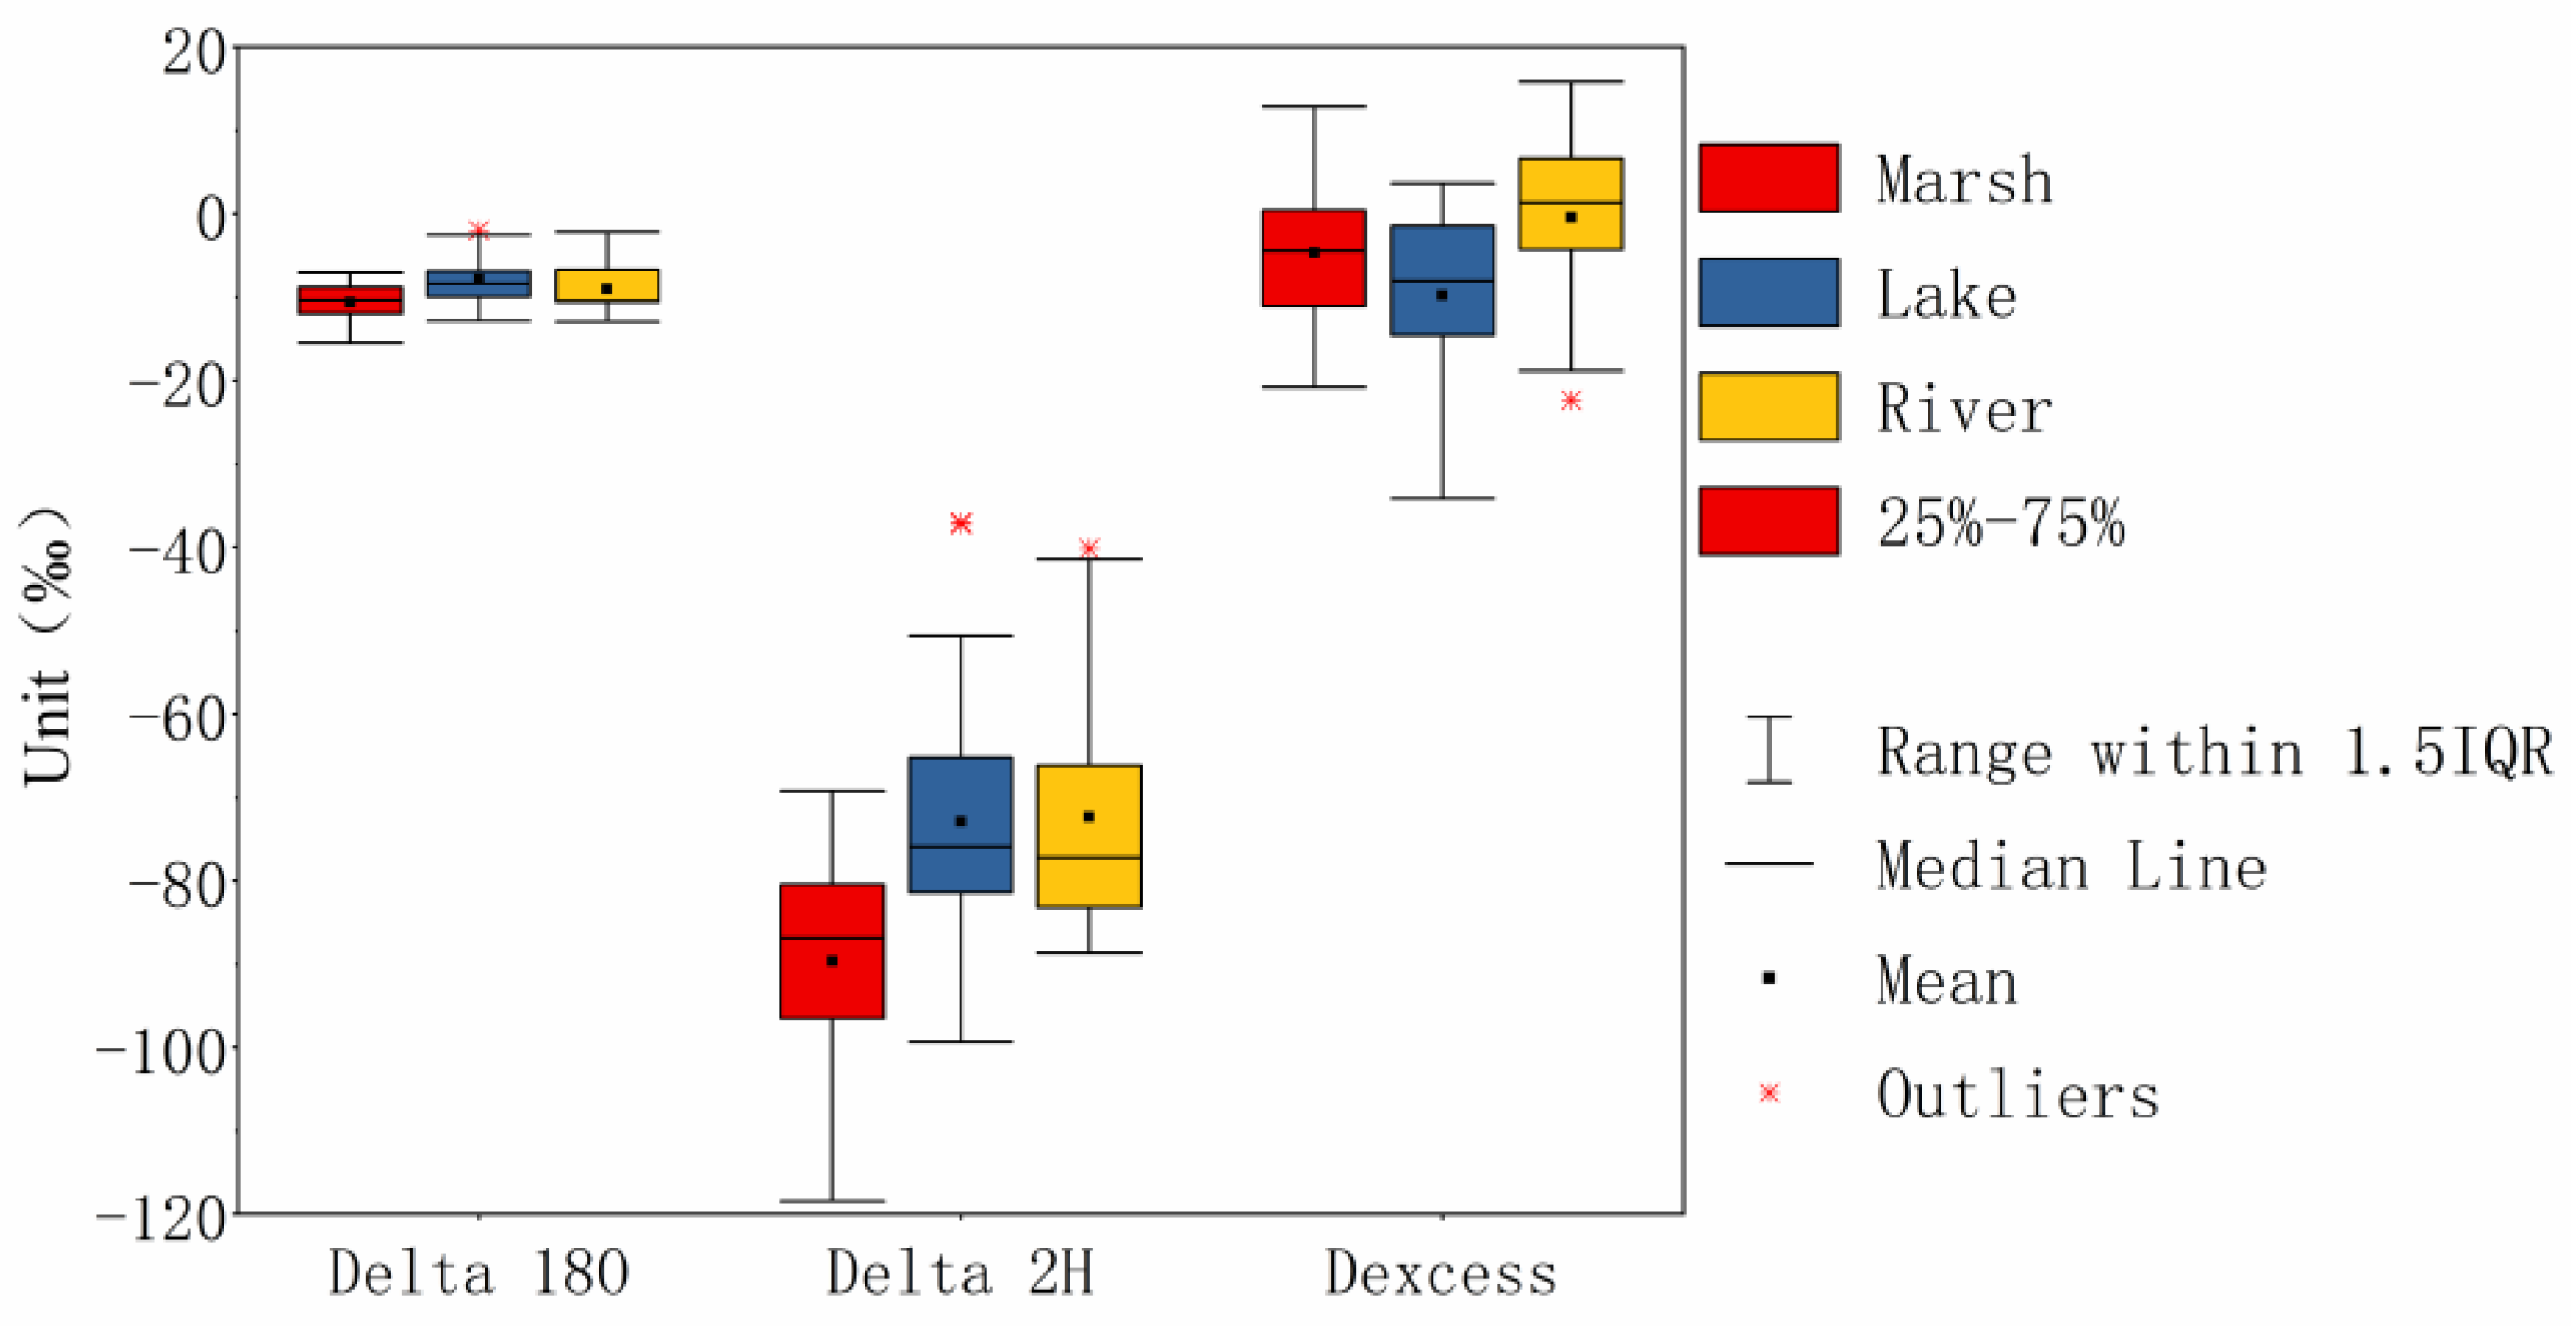
3.2. Statistical Analysis of δD, δ18O, and d-Excess

The δD and δ18O values of the 107 water samples from the study area exhibited wide ranges. Specifically, the maximum δD value was −37.04‰ and the minimum value was −118.41‰. The maximum δ18O value was −2.03‰ and the minimum value was −15.47‰. Regarding the standard deviation, the fluctuation of the δD value (16.19‰) was more significant than that of the δ18O value (2.79‰), indicating that the range of variation in the δD values was more extensive. In contrast, the δ18O value was more stable. The mean δD and δ18O values were −80.09‰ and −9.35‰, respectively. As shown in Figure 2, the δD and δ18O values of the rivers were more dispersed than those of the lake and marsh water. In contrast, most of the δD and δ18O values of the marsh water samples are plotted below and to the left of the samples from the rivers and lakes, which suggests that the isotope values of the marsh water were more depleted. Based on the hydrogen and oxygen isotope compositions of the water samples, the d-excess values of the lakes ranged from −34.16‰ to 3.68‰, with a mean value of −9.76‰; the d-excess values of the rivers ranged from −22.34‰ to 15.79‰, with a mean value of −0.44‰; and the d-excess values of the wetland marshes ranged from −20.79‰ to 12.88‰, with a mean value of −4.63‰. Most of the d-excess values of the water samples were lower than the global average of d = 10‰. The enrichment of light isotopes was evident due to the high altitude and continental effect in the Tibetan Plateau region. The d-excess values of the lake water were significantly negative, reflecting a more obvious evaporation characteristic.
The distribution of the hydrogen and oxygen isotopes in water bodies is the result of the interactions among many factors, which are mainly influenced by the climate conditions (e.g., temperature, precipitation, and precipitation type), evaporation processes, water source characteristics, basin topography, and human activities [27]. The δD and δ18O values of the three types of water bodies are presented in Table 1. The differences in the stable isotope compositions of the water bodies may be related to their recharge sources. The results of one-way ANOVA showed that the δD and δ18O values of the three types of water bodies were significantly different [δD: F(2, 104) = 19.59, p < 0.01; δ18O: F(2, 104) = 11.85, p < 0.01]. Among them, the differences in the δD values of the rivers and marshes were insignificant, while the differences in the δ18O values of the marshes and lakes were more noticeable. Comparison of the overall enrichment of the δD and δ18O values of the different water bodies revealed that the rivers had the highest δD values, followed by the lakes, and the marshes had the lowest δD values. The δD and δ18O values of the three types of water bodies exhibited the same trends.
The balance between atmospheric precipitation and evaporative water vapor condensation can be assessed via the deuterium surplus (d-excess). Specifically, a positive and more negligible d-excess value indicates a lower precipitation–evaporation balance in the region. In contrast, a negative d-excess value with a more considerable absolute value indicates a higher regional balance [28]. Once the atmospheric precipitation line for a particular region is determined, the corresponding d-excess value of the precipitation deuterium excess parameter can also be determined. Theoretically, the d-excess value for a region should remain stable and should be unaffected by other factors. The lower d-excess values of the lake water samples indicate greater evaporation from the lake water, since the d-excess value decreases during evaporation and remains constant during mineral dissolution [2]. In addition, the standard deviations of the δD, δ18O, and d-excess values of the marsh water were generally higher than those of the lake and river water, suggesting that the isotope compositions of the marsh water were more spatially variable and more susceptible to factors such as climate and topography [29].

3.3. δD/δ18O Ratios

Based on the δD and δ18O data for the 107 water samples, the evaporation trend line in the study area was fitted: δD = 5.41δ18O − 29.57 (R2 = 0.874) (Figure 3). The slope (5.41) and intercept (−29.57) of the evaporation line for the study area were lower than those of the Chinese atmospheric precipitation line (slope of 7.9 and intercept of 8.2) [25]. The δD and δ18O values of all of the water samples are plotted below and to the right of the Chinese atmospheric precipitation line. This can be attributed to the occurrence of isotopic enrichment during evaporation, which resulted in higher proportions of D and 18O isotopes in the water bodies, and thus, the δD-δ18O relationship deviated from the global atmospheric precipitation line [30]. Due to the diversity of the types of water bodies in nature, their δD and δ18O patterns vary, so the δD-δ18O relationships established based on Rayleigh’s fractionation principle and the law of conservation of mass will be different for different water bodies. The surface runoff rate and evapotranspiration area affect the intensity of evapotranspiration. The isotopes of water bodies are more susceptible to evapotranspiration when the surface runoff rate is low and the evapotranspiration area is large, which varies among water bodies [30].
In order to further analyze the evaporation trend lines of the lakes, rivers, and wetland marshes in the study area, regression fitting of the hydrogen and oxygen isotope compositions of these water bodies was carried out separately. The following evaporation trend equations were obtained: δD = 5.48 δ18O − 31.368 (n = 47, R2 = 0.906) for the marsh water, δD = 4.95 δ18O − 27.855 (n = 35, R2 = 0.801) for the river water, and δD = 5.02 δ18O − 33.638 (n = 25, R2 = 0.932) for the lake water. The slopes and intercepts of the evapotranspiration trend equations for the lakes, marshes, and rivers were significantly lower than those of the atmospheric precipitation line for China. In particular, the slope for the marsh water was closer to the atmospheric precipitation line, suggesting that the δD and δ18O values of the marsh water were more susceptible to atmospheric precipitation than those of the lakes and rivers.
In alpine wetland ecosystems, δD, δ18O, and d-excess values profoundly affect hydrological connectivity through various aspects such as water source identification, the quantification of evapotranspiration, the analysis of water mixing and flow paths, hydrological partitioning effects, spatial–temporal variability, and climatic and environmental indications (Figure 3). Marsh has low and stable δD and δ18O values and high d-excess values. This shows that groundwater and rain are the primary water sources for the ecosystem, with little evaporation. The isotopic compositions of the marshes are very different from those of the lakes and rivers, so there is not much hydrological connectivity. Rivers and lakes may have high and changing δD and δ18O values, which means that they may lose a lot of water through evaporation, or mix with water from other sources. On the other hand, the δD/δ18O slopes and d-excess values are close, suggesting a hydraulic link between them [31]. Differences in evapotranspiration are a key factor in hydrological connectivity. Lakes usually exhibit a strong hydrological separation effect due to their stronger evaporation, resulting in lower hydrological connectivity with the surrounding water bodies (e.g., rivers, and marshes) [32]. In contrast, marsh areas experience weaker evapotranspiration effects due to higher water levels and longer water retention times, which lead to higher hydrological connectivity [33].

3.4. Estimation of Evaporation Losses from Different Water Bodies

Evaporation is a key link in the hydrological cycle and one of the leading causes of water loss. Among the various modes of water loss, the evaporative loss of surface water occupies an important position [34]. Isotopic fractionation refers to the redistribution of the isotopes of an element in different portions of the total substance during physical, chemical, and biological processes. It is, for example, the concentration of light oxygen and hydrogen in the evaporated portion of a water body compared to the remaining unevaporated portion. This phenomenon can reflect the equilibrium state of the isotope distribution among minerals or molecules and provide information such as the temperature and substance formation process, making it an important tool in hydrogeochemical studies. In this study, we used the Rayleigh equilibrium fractionation equation to estimate the evaporation proportions of the various types of water bodies in the study area. Based on the meteorological data, the average multi-year temperature in the study area was 0.96 °C, from which the equilibrium fractionation coefficient α was calculated to be 1.01.
In order to determine the average isotope composition of the water source of the vapor, in this study, we analyzed the intersections of the local atmospheric precipitation line and the evaporation lines of the three different water bodies. Specifically, the isotope composition of the marsh water was δ18O = −16.1‰ and δD = −119.478‰; that of the river water was δ18O = −12.55‰ and δD = −90.15‰; and that of the lake water was δ18O = −14.54‰ and δD = −106.74‰. When calculating the evaporation ratio, δ18O is more stable than δD [35]. Therefore, δ18O was used as the main indicator when we calculated the evaporation ratio. The results of the calculation of the evaporated proportions of the marsh water, river water, and lake water are presented in Table 2, and the order of the evaporated proportions of the three types of water bodies in the study area is as follows: lake water (41%) > river water (40%) > marsh water (36%). This shows that the evaporation of lake water was most significant. Lakes usually have a larger water surface area, which provides more water for conversion into vapor in the atmosphere, and deeper lakes absorb more heat. In contrast, rivers have a relatively small water surface area, resulting in a limited area for evaporation and a flowing current that carries away heat, thus reducing evaporation. The water surface of marshes is usually covered by vegetation and can even be partially covered by sediment or silt, which reduces the surface area directly exposed to the air.
The strength of evaporation from a water body can also be assessed using the slope and intercept of the d-excess and δ18O values, which are usually linearly related. The slope represents the rate of change between the two, with larger slopes indicating more substantial evaporation, and vice versa. The intercept reflects the initial isotope levels in the water column, with higher intercepts generally implying less evaporative influence. Analyzing the slope and intercept helps to infer the strength of evaporation. Figure 4 shows that lake water had the strongest evaporation intensity, followed by river water, and that the evaporation intensity of marsh water was the weakest.

4. Discussion

4.1. Isotope Analysis of Water Bodies Reveals Evaporation and Water Source Relationships

The d-excess value in the Zoige wetland study had a low mean value (−5.3°), which was very different from that in other studies that looked at the same area. The study was conducted by Sun et al. [36]. However, this study was based only on river and marsh samples and lacked data on lake samples. The Zoige wetland has a special geographical location, located inland of Eurasia, far from the ocean, and its water vapor is mainly influenced by the westerly wind circulation. In summer, the strengthening of the westerly wind belt brings warm and humid airflow from the North Atlantic Ocean, and this airflow feature leads to low d-excess values of precipitation in the region [36]. The d-excess value of the Yarlung Tsangpo River Grand Canyon, which is in the southeast of the Tibetan Plateau, was also about 13° higher than that of the Ruoerge wetland. When water vapor from the Indian Ocean rises and enters the Tibetan Plateau through uplifted land, the temperature and humidity drop sharply [37]. This is because of stronger evaporation and local vapor recirculation at high elevations. The higher d-excess value (8.41°) in the Loess Hills is closely linked to the changing seasonal sources of water vapor in the area, as well as the effect of evaporation and isotope exchange during rainfall [38]. Meanwhile, the Guanzhong Plain’s d-excess value approaches 0‰, suggesting that non-equilibrium fractionation significantly influences precipitation in this region [38]. The d-excess values in subtropical China are generally high (16‰ on average), a phenomenon that is closely related to the region’s geographic location near the ocean [39]. As oceanic water vapor sources move across the subtropics, hydrogen and oxygen isotopes slowly decrease in precipitation [39]. This is why the eastern part of the subtropics has higher d-excess values, and the western part, which is farther from the ocean, has lower d-excess values. Regarding international comparisons, such as with the Middle East and North Africa, the d-excess values in these regions are generally lower, due to strong evaporative fractionation effects, and the isotope signatures of water bodies also exhibit significant evaporation effects [38,40]. In contrast, tropical regions, such as India and Southeast Asia, have higher d-excess values, indicating weaker evapotranspiration effects, and water recharge there is mainly from precipitation.
The relationship between d-excess and δ18O is affected by multiple factors. In particular, evapotranspiration, precipitation sources, and climatic conditions play key roles [38]. In a study of the Zoige wetland, the d-excess and δ18O data of the water body indicate that the water body is mainly derived from atmospheric precipitation. However, mild evaporation occurs during the recharge process, indicating that the evaporative effect is relatively small under humid climatic conditions in this region, and that water recharge is still dominant [36]. In arid regions, the d-excess of river water is lower because of the light isotope concentration caused by strong evaporation. In humid regions, the d-excess of river water is higher, suggesting that the effect of evaporation is weaker [41]. The d-excess and δ18O values of lake water are closely related to evaporation processes. In other words, the evaporation of lake water usually shifts the δ18O values in the negative direction, and the d-excess values may be even lower. Lakes in tropical and subtropical regions may have higher d-excess values, while lakes in colder regions usually have lower d-excess values [42]. The d-excess and δ18O values of marsh water are more specific because of the complex hydrological conditions in marshes, and the d-excess values of marsh water may be higher, especially in areas where water mainly comes from precipitation, which itself has a higher d-excess value [43]. In addition, the δ18O values of marsh water may be affected by evaporation and water exchange processes, resulting in negative δ18O values [34].
The isotope data for river, lake, and marsh water indicate that they are primarily recharged by atmospheric precipitation and undergo slight evapotranspiration during the recharge process. This is similar to the phenomenon in closed basins, where water bodies are primarily dependent on precipitation recharge and are not susceptible to water loss or drainage, resulting in evapotranspiration having a greater impact on the water bodies in the catchment [44,45]. Since rivers, lakes, and swamps are usually confined or semi-confined water bodies, evaporation causes the isotope values of these water bodies to deviate from the atmospheric precipitation line [11]. As shown in Figure 2, the isotopic points of the river, lake, and marsh water samples are plotted below and to the right of the atmospheric precipitation line and are more depleted in δD than in δ18O, suggesting that the recharge of these water bodies was influenced by evaporative fractionation [46]. Despite the overlap in the isotope values of the river, lake, and marsh water, there were still significant differences between them. That is, the lake water typically experienced stronger evaporation, resulting in higher isotope values, while the marsh water was subjected to weaker evaporation, resulting in lower isotope values [47]. The isotopic compositions of river and lake water were the most similar, which suggests that there may be a recharge relationship between the two. When lake and river water are in the same watershed, their circulation and the processes of evaporation and precipitation are linked, which makes the isotopic compositions similar [48]. The isotopic differences between water from rivers, lakes, and marshes show how the water moves, how much water evaporates, and where the water comes from to be recharged [47]. These differences are very helpful for learning more about the hydrological processes in the area.

4.2. Factors Influencing Variations in δD and δ18O Values

Hydrogen isotopes (δ18O) and oxygen isotopes (δD) in water bodies in the Zoige region have mean values of −80.1‰ and −9.3‰, which are both very low. The alpine climatic characteristics of the region, such as lower temperatures, limited evaporation, and precipitation primarily consisting of snow water, are responsible for this phenomenon [36]. This is because snow water has lighter isotopes, like low δ18O and δD values. Together, these two factors mean that the waters in the Zoige region have lower isotope values [37]. However, Sun et al. found that the average values of the hydrogen and oxygen isotopes in the area were −7.5‰ and −0.91‰, respectively. This difference may be because they only used a few samples and chose different times to collect them. Specifically, a large overlap between the sample collection period and the precipitation period may lead to bias in the results [37]. Also, the air masses that carry the precipitation go through different climate zones before they reach the Zoige area. Additionally, they might undergo a process known as fractionation, which could alter the values of the hydrogen and oxygen isotopes [6,25]. The low isotope values observed in the Zoige region likely result from multiple factors. Further research is essential to fully understand this phenomenon. Specifically, studying the origin of air masses and precipitation history is crucial. The impact of climate change on isotope variability is of academic importance in water resource management and protection. It offers a tool to identify changes in the sources of water bodies, which helps optimize resource allocation. Additionally, it improves the accuracy of hydrological predictions, supporting risk assessment. Furthermore, it provides a basis for ecosystem health monitoring, which assists in policy formulation and promotes sustainable water resource management and protection.
Unlike the Zoige region, the hydrogen and oxygen isotope values of water bodies in non-alpine regions show different characteristics. For example, the study data from the Kunming region of Yunnan Province show a mean value of −10.73‰ for δ18O and −73.97‰ for δD, values similar to the results from the Zoige region. This study looks at the annual rainfall in the Kunming area. The warm climate, stronger evaporation, and source of the rainfall that is dominated by the evaporation–condensation process all have an effect on the isotopic signature [39]. In the Kunming area, evapotranspiration is very important. This causes the precipitation to have a heavy isotopic composition, with higher δD and δ18O values [26]. Even though it is colder, the isotopic distributions of water bodies show complex spatial variability in other low-latitude plateau areas, such as the wetlands of the Tibetan Plateau [37]. This is because of differences in the precipitation sources, altitude, and seasonal precipitation. For example, Wu et al. (2022) suggested that the isotopic signatures of wetland water bodies in the Tibetan Plateau region are influenced by a variety of factors and show a more complex pattern of variation [37]. In China, climatic differences in different regions have significantly affected the distribution characteristics of water isotopes, with noticeable differences between humid and arid regions. Wet regions such as the Yangtze River Basin, East China, and South China are enriched by lighter isotopes (e.g., lower δ18O values) due to the high precipitation and weak evaporation in these regions [49]. This phenomenon is closely related to the abundant precipitation, lower evaporation intensity, and overall humid climatic conditions in these regions [10]. Water bodies in arid regions, such as the Tarim Basin and the Inner Mongolian Grassland, exhibit distinct isotopic characteristics. These regions experience scarce precipitation and significant evaporation, which result in higher isotope values and elevated δ18O levels [2].
The Zoige wetland is located in a relatively humid plateau region, and the primary source of precipitation is summer monsoon precipitation, so its water isotope characteristics are similar to those of coastal areas [7]. In other humid areas, such as Dongting Lake and Poyang Lake, the precipitation input mainly determines the isotopic changes in the water bodies, and the influence of groundwater is relatively weak due to abundant precipitation and small evaporation effects [4]. However, groundwater recharge is the primary source of water resources in arid areas such as Gansu and Ningxia. Water isotope analyses have shown that the influence of groundwater is more significant in these areas, especially in the case of insufficient water supply, and that groundwater recharge contributes more to the isotope compositions of the water bodies [48]. In addition, the influences of artificial activities on water isotope characteristics should not be neglected. In particular, in some wetlands, such as Dongting Lake and Poyang Lake, the values of water isotopes may change due to anthropogenic interventions such as water resource management and irrigation, resulting in anthropogenic disturbances to the isotope characteristics [28]. In contrast, relatively fewer artificial activities occur in the Zoige wetland, so its water isotope characteristics can reflect the natural hydrological cycle process more realistically, and it has become an important area for studying the natural hydrological cycle [19]. Human activities affect the δD, δ18O, and d-excess values by altering the water cycle and evapotranspiration through water resource development (reservoirs, groundwater extraction), agriculture (irrigation, fertilizer use), urbanization (water supply, wastewater discharges), and land use (wetland drainage, deforestation). Globally, alpine wetlands such as those in the Alps and the Andes also exhibit similarly low δD and δ18O values, but with variations due to latitude, geographic location, and hydrological conditions [50]. For example, alpine wetlands in the Alps and Andes generally show low δD and δ¹⁸O values, consistent with observations in the Zoige wetland, reflecting the typical characteristics of precipitation sources in high-altitude regions. However, the high-elevation regions of the Alps, which are subject to a temperate climate, usually have higher water isotope values than the Zoige wetland, which may be related to the more substantial evaporative effects and different water vapor sources in the Alps [11]. In contrast, the alpine wetlands of Banff National Park in North America, although also exhibiting low δD and δ¹⁸O values, differ in isotopic composition from the Zoige wetland due to their unique precipitation patterns (e.g., westerly belt-dominated water vapor transport) [40].

4.3. Influence of Hydrological Connectivity on Water Stable Isotopes in Alpine Wetlands

The hydrological connectivity of the Zoige wetland shows some regional differences, in which the hydrological connectivity between the lake and the marsh water is weak, while the connectivity between the river water and other water bodies is strong. The unique topographic and climatic environment of the Tibetan Plateau region is closely related to this feature. The region is affected by the extremes of the plateau climate, seasonal variations in water flow, and the presence of permafrost, which makes the mobility of water bodies more restricted [31]. The southeast coastal region, on the other hand, has strong hydrological connectivity. This is especially true during the monsoon season, when there is a lot of stable rainfall, which makes it easier for rivers and lakes to connect with each other [29,39]. However, extreme weather events like typhoons and floods often disrupt the region [49]. Hydrological connectivity in the hilly areas of the Panshan Mountains is mainly affected by topographic relief and water distribution, with weak local water connections and complex hydrological processes [24]. These variations in hydrological connectivity between regions show how different the landscape, climate, and water conditions are. They also show how flexible and complicated hydrological connectivity is in different ecosystems.
Compared with foreign studies, the hydrological connectivity of the Zoige wetland shows significant geographical characteristics. Taking the wetlands in the Mississippi River Basin in North America as an example, the hydrological connectivity in the region is strong, and hydrological regulation mainly relies on the management of large river basins and man-made hydraulic facilities [40]. The influence of water flow regulation and management on wetland hydrological processes is critical. The Zoige wetland, on the other hand, relies more on natural hydrological processes, and its hydrological connectivity shows strong seasonal fluctuations, which are influenced by both topographic and climatic fluctuations [12]. The wetlands along the Baltic Sea in Europe show a more stable and continuous hydrological connectivity, due to the influence of the oceanic climate [51]. The monsoon changes in the plateau have a big impact on the Zoige wetland’s hydrological connectivity [12]. There are bigger changes in water level and flow, which is typical of the plateau region’s hydrology. So, the differences in hydrological connectivity between regions are caused by both the geography and climate of those regions, as well as the complexity of the patterns of water recharge, which helps us to learn more about the regional hydrological system.
Water isotopes can be used to effectively calibrate the origins of water bodies, which in turn reveals their hydrological processes and helps us to understand their flow paths, exchange rates, and interdependence with external water bodies in the wetland hydrological cycle [52]. By analyzing water isotopes, researchers can delve into the interrelationships between precipitation, soil water, groundwater, and surface water and their dynamics [51]. In alpine regions, climate conditions exhibit strong seasonal characteristics. These include changes in precipitation, evaporation, and snowmelt water sources. Such variations contribute to water isotope differences across temporal and spatial scales. Such variability makes water isotopes a powerful tool for analyzing wetland hydrological systems. Specifically, they help us to assess hydrological connectivity and the time scales for water body exchange [32]. More importantly, water isotope variations, including changes in precipitation, evapotranspiration intensity, and freeze–thaw cycles, reflect the effects of climate change on hydrological processes, which may have potential impacts on the stability and function of wetland hydrological systems [32,51]. Water isotope analysis has multiple important purposes. It helps trace the sources and flow patterns of water bodies and reveals the dynamics of wetland hydrological systems. This study provides a key scientific basis for understanding hydrological connectivity and enhances insights into the relationship between hydrological connectivity and wetland ecosystem stability.

5. Conclusions

This study examined the relationship between the hydrological characteristics of and evapotranspiration in the Zoige wetland by analyzing the hydrogen and oxygen isotopes (δD, δ18O) of precipitation and water samples. The linear equation for atmospheric precipitation in the Zoige wetland was δD = 8.33δ18O + 14.52 (R2 = 0.92, p < 0.01), indicating that this equation accurately reflects isotopic characteristics. The slope of the Zoige precipitation line is higher than that of the global and Chinese lines, likely due to oceanic humid airflow and rising air temperatures. Water sample analysis showed significant variations in the δD values (SD = 16.19‰), with the δ18O values being more stable. River water samples had more dispersed isotopic values, while marsh water showed stronger depletion. Most water samples had d-excess values lower than those of the global average, indicating significant evaporation effects. Regression analysis of evaporation showed that δD = 5.41δ18O − 29.57 (R2 = 0.874), with a lower slope and intercept than those of the Chinese precipitation line, suggesting isotopic enrichment due to evaporation. Evaporation was influenced by water body size and runoff rate, with marsh water being more affected by precipitation and lakes and rivers showing slower isotopic changes. Evaporation loss estimates were highest in lakes (41%), followed by rivers (40%), and lowest in marshes (36%), with lakes experiencing significant evapotranspiration due to larger surface areas, and marshes being influenced more by vegetation and sediment cover. The study of water isotopes in different bodies of water in the Zoige wetland shows how hydrological processes, climate change, and ecological succession affect each other. This gives us a scientific basis for protecting wetland ecosystems and managing water resources. Future research should focus on applying isotope hydrology in climate modeling or long-term monitoring work.

Author Contributions

Y.Z. (Yangying Zhan): writing—original draft, data collection, and curation, C.L.: writing—original draft and funding acquisition, Y.N.: review and editing, G.R.: review and editing, Y.Z. (You Zhou): conceptualization, K.L.: data collection and curation, J.L.: data collection and curation, H.W.: conceptualization. All authors have read and agreed to the published version of the manuscript.

Funding

This research was funded by the Fundamental Research Funds for the Central Non-profit Research Institution of the Chinese Academy of Forestry (CAFYBB2020SZ006).

Data Availability Statement

The data are contained within the article.

Conflicts of Interest

The authors declare no conflicts of interest.

References

  1. Gao, Y.; Beamish, R. Isotopic composition of otoliths as a chemical tracer in population identification of sockeye salmon (Oncorhynchus nerka). Can. J. Fish. Aquat. Sci. 1999, 56, 2062–2068. [Google Scholar] [CrossRef]
  2. Yin, Y.; Xia, R.; Liu, X.; Chen, Y.; Song, J.; Dou, J. Spatial response of water level and quality shows more significant heterogeneity during dry seasons in large river-connected lakes. Sci. Rep. 2024, 14, 8373. [Google Scholar] [CrossRef] [PubMed]
  3. Gibson, J.J.; Holmes, T.; Stadnyk, T.A.; Birks, S.J.; Eby, P.; Pietroniro, A. Isotopic constraints on water balance and evapotranspiration partitioning in gauged watersheds across Canada. J. Hydrol. Reg. Stud. 2021, 37, 100878. [Google Scholar] [CrossRef]
  4. Li, C.; Lian, E.; Yang, C.; Deng, K.; Qian, P.; Xiao, S.; Liu, Z.; Yang, S. Seasonal variability of stable isotopes in the Changjiang (Yangtze) river water and its implications for natural climate and anthropogenic impacts. Environ. Sci. Eur. 2020, 32, 84. [Google Scholar] [CrossRef]
  5. Wang, X.; Yang, J.; Gao, Y.; Li, J.; Yang, Y.; Wang, P. Allocation, morphology, physiology: Multiple aspects of above-and below-ground responses to water table stress, duration of drainage in alpine wetland plants (Carex muliensis). Plant Soil 2024, 505, 703–718. [Google Scholar] [CrossRef]
  6. Zeng, W.; He, Z.; Bai, W.; He, L.; Chen, X.; Chen, J. Identification of ecological security patterns of alpine wetland grasslands based on landscape ecological risks: A study in Zoigê County. Sci. Total Environ. 2024, 928, 172302. [Google Scholar] [CrossRef]
  7. Yu, D.-W.; Liu, Y.; Xie, D.-J.; Mu, C.-L.; Sun, Z.-Y.; Zhou, M.-J.; Rao, J.-P.; Suolang, D.; Xiong, Y.-Q.; Chen, J.-S. Effects of driving factors on water supply function under different basins and spatial scale in Zoige alpine wetland, China. Ecol. Indic. 2024, 158, 111403. [Google Scholar] [CrossRef]
  8. Carlson, B.Z.; Hébert, M.; Van Reeth, C.; Bison, M.; Laigle, I.; Delestrade, A. Monitoring the Seasonal hydrology of alpine wetlands in response to snow cover dynamics and summer climate: A novel approach with sentinel-2. Remote Sens. 2020, 12, 1959. [Google Scholar] [CrossRef]
  9. Balwan, W.K.; Kour, S. Wetland-An Ecological Boon for the Environment. East Afr. Sch. J. Agric. Life Sci. 2021, 4, 38–48. [Google Scholar] [CrossRef]
  10. Kang, X.; Li, Y.; Wang, J.; Yan, L.; Zhang, X.; Wu, H.; Yan, Z.; Zhang, K.; Hao, Y. Precipitation and temperature regulate the carbon allocation process in alpine wetlands: Quantitative simulation. J. Soils Sediments 2020, 20, 3300–3315. [Google Scholar] [CrossRef]
  11. Yang, A.; Kang, X.; Li, Y.; Zhang, X.; Zhang, K.; Kang, E.; Yan, Z.; Li, M.; Wang, X.; Niu, Y. Alpine wetland degradation reduces carbon sequestration in the Zoige Plateau, China. Front. Ecol. Evol. 2022, 10, 980441. [Google Scholar] [CrossRef]
  12. Fan, S.; Qin, J.; Sun, H.; Jia, Z.; Chen, Y. Alpine soil microbial community structure and diversity are largely influenced by moisture content in the Zoige wetland. Int. J. Environ. Sci. Technol. 2022, 19, 4369–4378. [Google Scholar] [CrossRef]
  13. Shi, F.; Rao, Z.; Cao, J.; Huang, C.; Wu, D.; Yang, W.; Sun, W. Meltwater is the dominant water source controlling α-cellulose δ18O in a vascular-plant-dominated alpine peatland in the Altai Mountains, Central Asia. J. Hydrol. 2019, 572, 192–205. [Google Scholar] [CrossRef]
  14. Feng, M.; Zhang, W.; Zhang, S.; Sun, Z.; Li, Y.; Huang, Y.; Wang, W.; Qi, P.; Zou, Y.; Jiang, M. The role of snowmelt discharge to runoff of an alpine watershed: Evidence from water stable isotopes. J. Hydrol. 2022, 604, 127209. [Google Scholar] [CrossRef]
  15. Chazette, P.; Flamant, C.; Sodemann, H.; Totems, J.; Monod, A.; Dieudonné, E.; Baron, A.; Seidl, A.; Steen-Larsen, H.C.; Doira, P. Experimental investigation of the stable water isotope distribution in an Alpine lake environment (L-WAIVE). Atmos. Chem. Phys. 2021, 21, 10911–10937. [Google Scholar] [CrossRef]
  16. Dogramaci, S.; Skrzypek, G.; Dodson, W.; Grierson, P.F. Stable isotope and hydrochemical evolution of groundwater in the semi-arid Hamersley Basin of subtropical northwest Australia. J. Hydrol. 2012, 475, 281–293. [Google Scholar] [CrossRef]
  17. Cao, S.; Cao, G.; Wang, Z.; Hou, Y.; Wang, Y.; Kang, L. Isotopic hydrological links among precipitation, river water and groundwater in an alpine mountain basin, NE Qinghai–Tibet Plateau in warm seasons. Environ. Earth Sci. 2022, 81, 366. [Google Scholar] [CrossRef]
  18. Yang, K.; Han, G. Controls over hydrogen and oxygen isotopes of surface water and groundwater in the Mun River catchment, northeast Thailand: Implications for the water cycle. Hydrogeol. J. 2020, 28, 1021–1036. [Google Scholar] [CrossRef]
  19. Hou, M.; Ge, J.; Gao, J.; Meng, B.; Li, Y.; Yin, J.; Liu, J.; Feng, Q.; Liang, T. Ecological risk assessment and impact factor analysis of alpine wetland ecosystem based on LUCC and boosted regression tree on the Zoige Plateau, China. Remote Sens. 2020, 12, 368. [Google Scholar] [CrossRef]
  20. Coplen, T.B. New guidelines for reporting stable hydrogen, carbon, and oxygen isotope-ratio data. Geochim. Cosmochim. Acta 1996, 60, 3359–3360. [Google Scholar] [CrossRef]
  21. Dansgaard, W. Stable isotopes in precipitation. Tellus 1964, 16, 436–468. [Google Scholar] [CrossRef]
  22. Craig, H. Isotopic variations in meteoric waters. Science 1961, 133, 1702–1703. [Google Scholar] [CrossRef] [PubMed]
  23. Majoube, M. Fractionnement en oxygène 18 et en deutérium entre l’eau et sa vapeur. J. Chim. Phys. 1971, 68, 1423–1436. [Google Scholar] [CrossRef]
  24. Qiao, Y.; Meng, Z.; Zhang, C.; Cheng, Y.; Shi, L.; Xu, A.; Zhang, Q.; Li, Y. Characteristics of mine aquifer with complex structure and identification of its hydraulic connection. J. China Coal Soc. 2021, 46, 4010–4020. [Google Scholar]
  25. Wu, Z.S.R.; Zhang, W. Hydrochemistry and Isotopic Characteristics of Various Types of Water Bodies in Zoige Wetland and their Water Recharge Relationship. Wetl. Sci. 2024, 22, 418–427. [Google Scholar]
  26. Zheng, S.H.; Hou, F.G.; Ni, B.L. The studies of hydrogen and oxygen stable isotopes in atmospheric precipitation in China. Chin. Sci. Bull. 1983, 13, 801–806. [Google Scholar]
  27. George Darling, W.; Bath, A.H.; Gibson, J.J.; Rozanski, K. Isotopes in Water; Springer: Berlin/Heidelberg, Germany, 2006. [Google Scholar]
  28. Xia, Z.; Winnick, M.J. The competing effects of terrestrial evapotranspiration and raindrop re-evaporation on the deuterium excess of continental precipitation. Earth Planet. Sci. Lett. 2021, 572, 117120. [Google Scholar] [CrossRef]
  29. Mao, H.; Wang, G.; Shi, Z.; Liao, F.; Xue, Y. Spatiotemporal variation of groundwater recharge in the lower reaches of the Poyang Lake Basin, China: Insights from stable hydrogen and oxygen isotopes. J. Geophys. Res. Atmos. 2021, 126, e2020JD033760. [Google Scholar] [CrossRef]
  30. Wang, R.; Gentine, P.; Yin, J.; Chen, L.; Chen, J.; Li, L. Long-term relative decline in evapotranspiration with increasing runoff on fractional land surfaces. Hydrol. Earth Syst. Sci. 2021, 25, 3805–3818. [Google Scholar] [CrossRef]
  31. Jiang, H.; Liu, W.; Li, Y.; Zhang, J.; Xu, Z. Multiple Isotopes Reveal a Hydrology Dominated Control on the Nitrogen Cycling in the Nujiang River Basin, the Last Undammed Large River Basin on the Tibetan Plateau. Environ. Sci. Technol. 2022, 56, 4610–4619. [Google Scholar] [CrossRef]
  32. Vystavna, Y.; Harjung, A.; Monteiro, L.R.; Matiatos, I.; Wassenaar, L.I. Stable isotopes in global lakes integrate catchment and climatic controls on evaporation. Nat. Commun. 2021, 12, 7224. [Google Scholar] [CrossRef] [PubMed]
  33. Xin, P.; Wilson, A.; Shen, C.; Ge, Z.; Moffett, K.B.; Santos, I.R.; Chen, X.; Xu, X.; Yau, Y.Y.Y.; Moore, W.; et al. Surface Water and Groundwater Interactions in Salt Marshes and Their Impact on Plant Ecology and Coastal Biogeochemistry. Rev. Geophys. 2022, 60, e2021RG000740. [Google Scholar] [CrossRef]
  34. Zhang, L.; Lan, S.; Zhao, L.; Yi, H.; Han, G. Temporal variation of water-use efficiency and water sources of Phragmites australis in the coastal wetland: Based on stable isotopic composition (δ13C and δ18O). Ecol. Indic. 2022, 139, 108957. [Google Scholar] [CrossRef]
  35. Jiang, Z.; Xu, T.; Mallants, D.; Tian, H.; Owen, D.D. Numerical modelling of stable isotope (2H and 18O) transport in a hydro-geothermal system: Model development and implementation to the Guide Basin, China. J. Hydrol. 2019, 569, 93–105. [Google Scholar] [CrossRef]
  36. Sun, Z.; Zhu, G.; Zhang, Z.; Xu, Y.; Yong, L.; Wan, Q.; Ma, H.; Sang, L.; Liu, Y. Identifying surface water evaporation loss of inland river basin based on evaporation enrichment model. Hydrol. Process. 2021, 35, e14093. [Google Scholar] [CrossRef]
  37. Wu, H.; Zhang, C.; Li, X.-Y.; Fu, C.; Wu, H.; Wang, P.; Liu, J. Hydrometeorological Processes and Moisture Sources in the Northeastern Tibetan Plateau: Insights from a 7-Yr Study on Precipitation Isotopes. J. Clim. 2022, 35, 2919–2931. [Google Scholar] [CrossRef]
  38. Wei, H.; Wang, J.; Li, M.; Wen, M.; Lu, Y. Assessing the Applicability of Mainstream Global Isoscapes for Predicting δ18O, δ2H, and d-excess in Precipitation across China. Water 2023, 15, 3181. [Google Scholar] [CrossRef]
  39. Guo, X.; Gong, X.; Shi, J.; Guo, J.; Dominguez-Villar, D.; Lin, Y.; Wang, H.; Yuan, D. Temporal variations and evaporation control effect of the stable isotope composition of precipitation in the subtropical monsoon climate region, Southwest China. J. Hydrol. 2021, 599, 126278. [Google Scholar] [CrossRef]
  40. Hathaway, J.M.; Westbrook, C.J.; Rooney, R.C.; Petrone, R.M.; Langs, L.E. Quantifying relative contributions of source waters from a subalpine wetland to downstream water bodies. Hydrol. Process. 2022, 36, e14679. [Google Scholar] [CrossRef]
  41. Kohfahl, C.; Rodriguez, R.F.; Bermudo, F.R.; Vadillo, I. Vapour source and spatiotemporal variation of precipitation isotopes in Southwest Spain. Hydrol. Process. 2021, 35, e14445. [Google Scholar] [CrossRef]
  42. Wu, L.; Zhang, M.; Xie, X.; Lv, J.; Zhou, X.; Shen, N. Effect of wetland hydrological connectivity on runoff based on a basin comparison. J. Hydrol. 2023, 619, 129348. [Google Scholar] [CrossRef]
  43. Zhu, X.; Wu, T.; Zhao, L.; Yang, C.; Zhang, H.; Xie, C.; Li, R.; Wang, W.; Hu, G.; Ni, J.; et al. Exploring the contribution of precipitation to water within the active layer during the thawing period in the permafrost regions of central Qinghai-Tibet Plateau by stable isotopic tracing. Sci. Total Environ. 2019, 661, 630–644. [Google Scholar] [CrossRef] [PubMed]
  44. Çolak, M.A.; Öztaş, B.; Özgencil, İ.K.; Soyluer, M.; Korkmaz, M.; Ramírez-García, A.; Metin, M.; Yılmaz, G.; Ertuğrul, S.; Tavşanoğlu, Ü.N. Increased water abstraction and climate change have substantial effect on morphometry, salinity, and biotic communities in lakes: Examples from the semi-arid burdur Basin (Turkey). Water 2022, 14, 1241. [Google Scholar] [CrossRef]
  45. Herrera, C.; Urrutia, J.; Gamboa, C.; Salgado, X.; Godfrey, L.; Rivas, A.; Jódar, J.; Custodio, E.; León, C.; Sigl, V. Evaluation of the impact of the intensive exploitation of groundwater and the mega-drought based on the hydrochemical and isotopic composition of the waters of the Chacabuco-Polpaico basin in central Chile. Sci. Total Environ. 2023, 895, 165055. [Google Scholar] [CrossRef]
  46. Warter, M.M.; Tetzlaff, D.; Ring, A.-M.; Christopher, J.; Kissener, H.L.; Funke, E.; Sparmann, S.; Mbedi, S.; Soulsby, C.; Monaghan, M.T. Environmental DNA, hydrochemistry and stable water isotopes as integrative tracers of urban ecohydrology. Water Res. 2024, 250, 121065. [Google Scholar] [CrossRef]
  47. Ala-aho, P.; Soulsby, C.; Pokrovsky, O.S.; Kirpotin, S.N.; Karlsson, J.; Serikova, S.; Vorobyev, S.N.; Manasypov, R.M.; Loiko, S.; Tetzlaff, D. Using stable isotopes to assess surface water source dynamics and hydrological connectivity in a high-latitude wetland and permafrost influenced landscape. J. Hydrol. 2018, 556, 279–293. [Google Scholar] [CrossRef]
  48. Lu, C.; Wu, C.; Sun, Q.; Wu, X.; Yan, L.; Qin, T. Seasonal river–lake-groundwater coupling simulation and groundwater overexploitation and ecological environment assessment in the Aiding Lake Basin, NW China. J. Hydrol. 2024, 632, 130896. [Google Scholar] [CrossRef]
  49. Wu, H.; Huang, Q.; Fu, C.; Song, F.; Liu, J.; Li, J. Stable isotope signatures of river and lake water from Poyang Lake, China: Implications for river–lake interactions. J. Hydrol. 2021, 592, 125619. [Google Scholar] [CrossRef]
  50. Arnold, T.E.; Hillman, A.L.; Abbott, M.B.; Werne, J.P.; McGrath, S.J.; Arkush, E.N. Drought and the collapse of the Tiwanaku Civilization: New evidence from Lake Orurillo, Peru. Quat. Sci. Rev. 2021, 251, 106693. [Google Scholar] [CrossRef]
  51. Halder, J.; Terzer, S.; Wassenaar, L.; Araguás-Araguás, L.; Aggarwal, P. The Global Network of Isotopes in Rivers (GNIR): Integration of water isotopes in watershed observation and riverine research. Hydrol. Earth Syst. Sci. 2015, 19, 3419–3431. [Google Scholar] [CrossRef]
  52. Li, X.; Weng, B.; Yan, D.; Qin, T.; Wang, K.; Bi, W.; Yu, Z.; Dorjsuren, B. Anthropogenic effects on hydrogen and oxygen isotopes of river water in cities. Int. J. Environ. Res. Public Health 2019, 16, 4429. [Google Scholar] [CrossRef]
Figure 1. (A) A map showing the distribution of wetlands on the Tibetan Plateau, China, is provided by National Tibetan Plateau Data Center (http://data.tpdc.ac.cn (accessed on 1 March 2025)); (B) a map illustrating the study area location and the sampled marsh-river-wetland continuum.
Water 17 00820 g001
Figure 2. Compare δ18O and δ2H values of river, lake, and marsh samples and show their respective evaporation lines. Also, compare the local atmospheric precipitation line (LMWL), the global atmospheric precipitation line (GMWL), and the Chinese atmospheric precipitation line (CMWL).
Water 17 00820 g002
Figure 3. Box plots of δD, δ18O, and d-excess for the lakes, rivers, and marshes analyzed in this study.
Water 17 00820 g003
Figure 4. Linear fitting models of d-excess and δ18O along the marsh–fluvial–limnic continuum: (A) all samples, (B) marshes, (C) rivers, and (D) lakes.
Water 17 00820 g004
Table 1. Water δD and δ18O isotope values along the marsh–fluvial–limnic continuum.
Water BodiesδD (‰)δ18O (‰)δD/δ18Od-Excess
MarshesMin−118.4−15.477.05−20.78
Max−69.23−7.0710.8612.88
Mean−89.58 a−10.61 a8.56 b−4.63
STD12.452.160.766.64
RiversMin−99.27−12.867.61−34.16
Max−37.03−2.0220.913.68
Mean−72.89 b−7.89 b10.14 a−9.75
STD14.832.713.1910
LakesMin−88.66−12.96.77−22.34
Max−40.14−2.2218.0415.78
Mean−72.31 b−8.98 b8.75 b−0.44
STD15.072.942.579.79
Note: In statistical analysis, “a” indicates no significant difference between groups, while “b” indicates a significant difference.
Table 2. Statistical characteristics of the proportion of surface water remaining and the proportion evaporated.
WatersMarshesRiversLakes
Average proportion of water remaining (%)646059
Maximum evaporated proportion (%)599191
Minimum evaporated proportion (%)4−312
Average evaporated proportion (%)364041
Disclaimer/Publisher’s Note: The statements, opinions and data contained in all publications are solely those of the individual author(s) and contributor(s) and not of MDPI and/or the editor(s). MDPI and/or the editor(s) disclaim responsibility for any injury to people or property resulting from any ideas, methods, instructions or products referred to in the content.

