1. Introduction
Ecological security is key to ensuring the health and sustainability of the community of life between man and nature [
1]. Water is the most sensitive natural resource in the ecosystem [
2]. Stream resources are the most important corridors and critical systems for the formation and delivery of stream water [
3]. As the process of globalization accelerates and the population continues to grow, ecological and environmental issues are increasingly prominent [
4]. The international community is gradually recognizing the close link between economic development and environmental protection, and many countries are promoting the transition to a green economy in order to reduce negative impacts on the environment [
5]. China attaches high importance to the protection of water resources and the management of the environment and has successively introduced policies and laws on water environment management in key river basins [
6,
7,
8,
9]. However, China’s water resources are unevenly distributed, and water pollution is a serious and long–standing problem [
10]. Since the twenty–first century, with the gradual expansion of the urban scale, China’s water demand has been expanding, resulting in serious water pollution, waste, and shortages, which seriously affect China’s ecological security [
11,
12,
13]. Therefore, scientific assessments and the management of the health status of water environment ecosystems are of great practical guidance.
In response to the issue of regional water security, the issue of water security has attracted extensive attention from the academic community. The USA, UK, and other countries are maturing in their research on environmental auditing, focusing on the selection of evaluation indicators and assessing the weights of evaluation indicators [
14,
15,
16,
17,
18,
19]. In China, townships, counties, and municipalities are mostly used as the basic evaluation units and are evaluated primarily in terms of the allocation of indicators and the evaluation model. The entropy weight method (EWM) [
20] and combination weight method (CWM) [
21] are extensively used, with major evaluation models including the PSR model and its extensions [
22,
23,
24], the Object Element Model (OEM) [
25], and TOPSIS model (TOPSIS) [
26,
27]. The synthesis of Principal Component Analysis (PCA) [
28], fuzzy hierarchical analysis [
29], GIS10.8.1 [
30], the Barrier Degree Model (BDM), and the PSR model provide more exact quantitative technical means for the study of regional ecological safety.
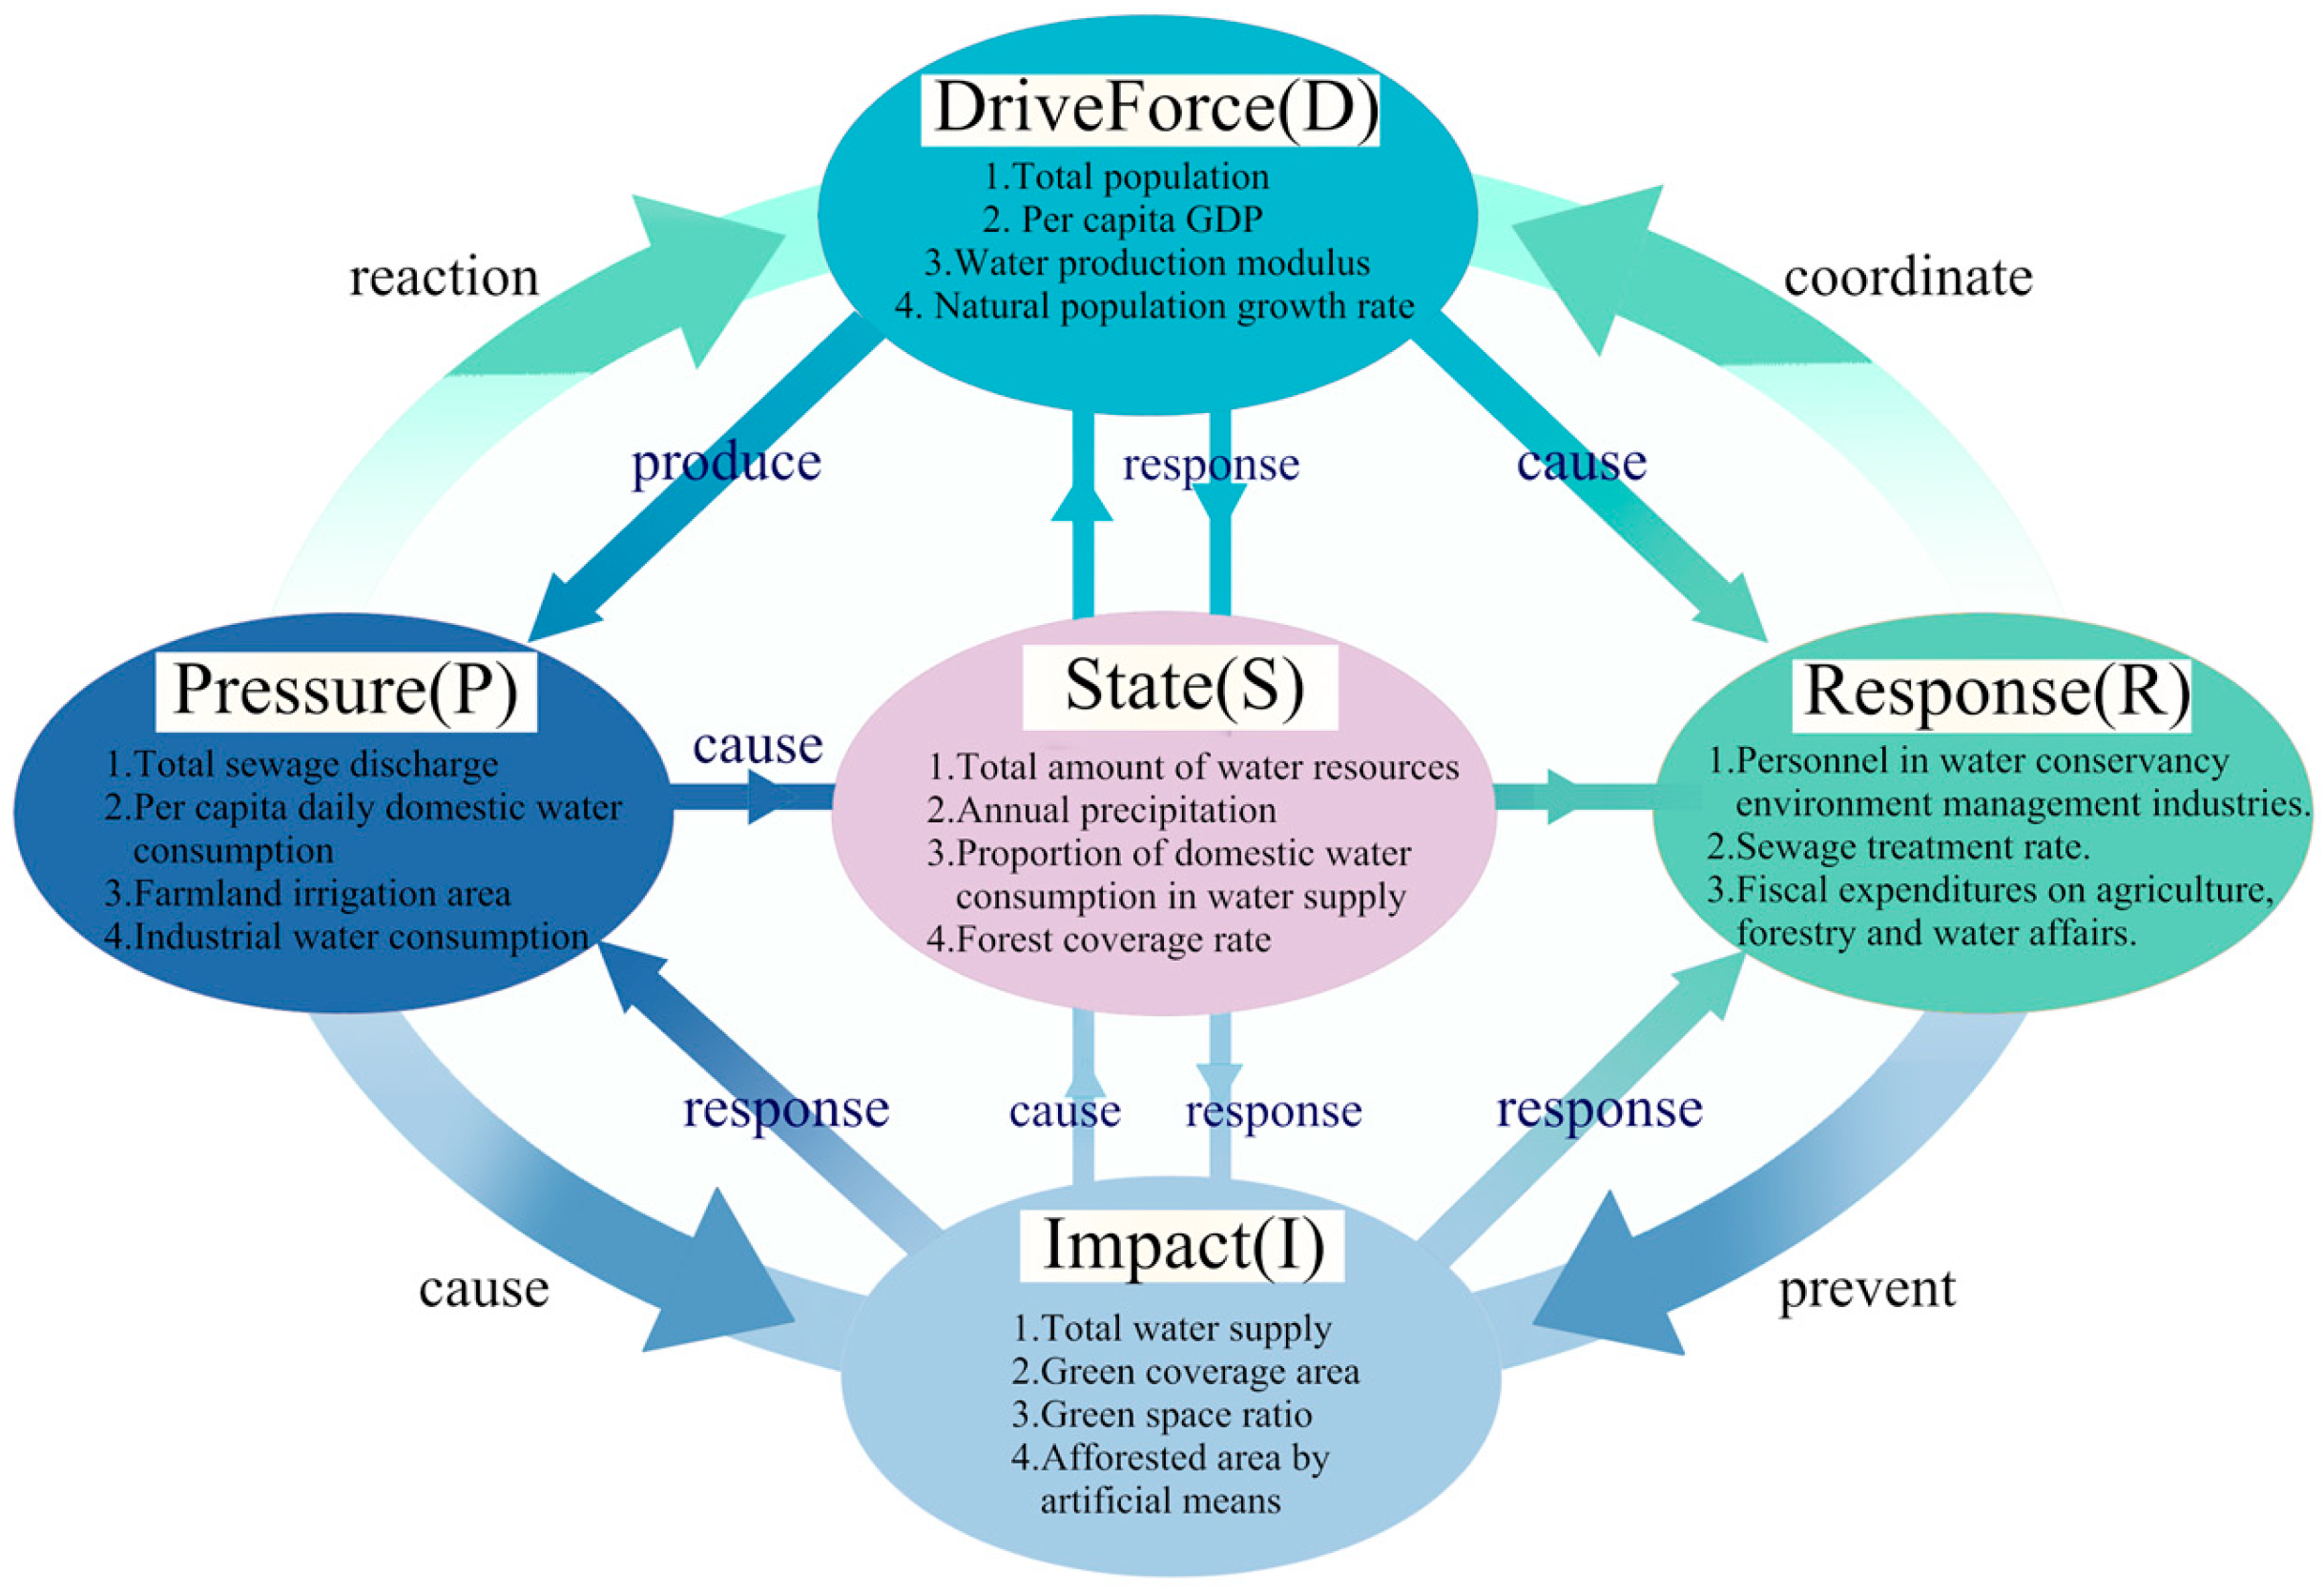
The DPSIR framework, together with entropy TOPSIS and gray correlation analysis, has proven to be very effective in assessing ecosystem stability and in making scientifically sound management decisions under different geographical and ecological conditions [
31]. In North America (Dougherty Plain), several conservation programs in the United States and Canada (Prince Edward Island) have used DPSIR models to evaluate the ecological condition of forests, rivers, and wetlands and to promote the sustainable development of ecological resources [
32,
33,
34]. Within this context, an entropic TOPSIS approach was adopted to optimize the decision–making processes by assigning weights to the effectiveness of different managerial scenarios. In Caribbean coastal countries such as Mexico and Cuba, the DPSIR framework was used to conduct a comprehensive assessment of the marine ecosystem, identifying key environmental stressors such as marine pollution and overexploitation [
35,
36]. Gray correlation analysis is then used to analyze the degree of association between different management strategies and ecosystem health. Thus, vulnerable ecological areas are protected, and the stability of marine ecosystems is maintained. The DPSIR model has already been utilized to assess the health of mangrove ecosystems in Southeast Asian countries such as Vietnam and Cambodia, particularly in light of pressures from aquaculture and industrial development [
37,
38]. In China, studies have achieved similar results; for example, Ding Xiaowen et al. [
39] evaluated the water ecological environmental safety of the drinking water source area in Heshan, Jiangmen City, Guangdong Province, and the results were highly consistent with the actual situation, which further verified the effectiveness of the method. By integrating the entropy weight–TOPSIS method and the gray correlation analysis method, the researchers were able to effectively prioritize the protection areas and propose targeted ecological restoration measures. These research tables provide an important reference for this paper and also lay the foundation for the optimization and innovation of future water environment evaluation methods.
As a key water source and economic pillar of the Yangtze River Delta region, water quality is directly related to the safety of drinking water and ecological balance in downstream areas of the Xin’an River [
40]. Despite three rounds of pilot treatment, the regional water environment still faces problems such as insufficient hydrological regulation and neglected water quality purification. Existing studies on the water environment of Xin’an River mostly focus on the implementation mechanism, compensation standards, and policy effects of ecological compensation in the basin. Usually, localized areas are selected for empirical evaluation, which lacks the comprehensiveness of the basin’s scope and the selection of indicators. Factors such as regional economic benefits, social benefits, and environmental pollution reduction should also be included in the water environment evaluation system to enhance the systematicity and practicality of the study. In summary, this paper takes Xin’an River Basin as the research object and constructs a comprehensive evaluation model of the ecological status of the water environment in the basin based on the DPSIR framework, which can systematically reveal the causal relationship among the driving force, pressure, state, impact, and response, and is applicable to the comprehensive evaluation of complex basin ecosystems. Combined with the entropy weight–TOPSIS model, it overcomes the limitations of the traditional subjective assignment method, avoids human bias through objective assignment, effectively handles the evaluation problems of multiple indicators and dimensions, and improves the accuracy of evaluation. Gray correlation analysis can explore the potential relationship between factors, identify the key factors affecting ecological security, and make up for the shortcomings of other methods in dealing with complex relationships and incomplete information.
2. Study Area and Data Sources
The Xin’an River originates from Xiuning County, Huangshan City, in Anhui Province, China, and passes through Chun’an County to Jiande City, where it joins the Qiantang River. The latitude and longitude ranges are 29°25′~30°16′ north latitude and 117°38′~118°56′ east longitude [
41]. It ranks as the third largest river in the Anhui Province, next to the Yangtze River and the Huaihe River. The Xin’an River has a total length of 373 km, a river area of 11,000 km
2, and excellent water quality. It is characterized by abundant water resources and the high density of the river network and has an important ecological nourishment function for the cities in the watershed area. The watershed has a subtropical monsoon climate with an average annual temperature of 15–17 °C, mild winters, and warm summers [
41]. The annual precipitation is abundant at around 1500–1800 mm [
42]. The relative humidity is high, with an average annual humidity between 75 and 80%, providing favorable conditions for vegetation growth and water recharge. The favorable climatic conditions and ecological characteristics make the Xin’an River Basin an ideal area for synergistic ecological protection and economic development.
4. Analysis of the Results
4.1. Characterization of the Temporal Evolution of the Basin’s Water Environment
The relative proximity of the basin’s water environment is shown in
Table 3. The relative vicinity of the water environment in ten years during the study period is generally shown as the “M” fluctuation trend.
Relative proximity underwent growth between 2014 and 2016. Since 2012, China has included ecological civility construction in its overall layout of socialist undertakings with Chinese characteristics. Subsequently, the Xin’an River Basin Ecological Compensation Scheme Project was formally implemented. Before the implementation of the pilot project, the Xin’an River Basin water environment faced problems of deteriorating water quality and ecosystem destruction. On the one hand, the cities in the basin were in a stage of accelerated industrialization and urbanization the water quality eutrophication was obvious, and cyanobacteria bloomed. On the other hand, treatment facilities for urban and rural agricultural and industrial production activities were imperfect, and wastewater and polluted solids entered the Xin’an River directly, exacerbating water pollution. Downstream of Qiandao Lake is a deep–water lake, the self–purification capacity of which is weak, where the intensification of eutrophication is a serious threat to the ecological balance of the entire basin. Within three years of the implementation of the pilot project, Anhui and Zhejiang provinces signed an agreement to clarify the distribution and use of funds. The two rounds of compensation between the two provinces, driven by the state, invested a total of CNY 3.6 billion. The focus was on industrial point source management, increasing vegetation cover, and limiting development activities. During the three–year period, water quality within the Xin’an River Basin improved significantly, reaching the standard for Class II surface water. Between 2017 and 2018, relative proximity showed a sharp decline. The total amount of water resources over the two years showed a more obvious decline; however, the water supply to the city failed to be reasonably regulated. Per capita residential water consumption increased rather than decreased, showing a trend that runs counter to water conservation goals.
After 2018, the water quality assessment criteria for the third round of pilots was further optimized to strengthen the regulation and control of water quality in the basin. The relative proximity of the basin’s water environment gradually rebounded and reached a high–quality level in 2020. The ecological protection and economic development of the Xin’an River Basin have taken on a new dimension. With Huangshan City joining the Hangzhou Metropolitan Area, the opening of the “Hangzhou–Huangzhou” high–speed railway has facilitated in–depth cooperation between the Anhui and Zhejiang provinces in the field of eco–tourism, and the signing of a cooperation agreement on eco–compensation in October 2019, which marked the expansion of the cooperation from a single water treatment to a wider range of co–construction areas. For example, in 2020, both Chun’an County and Shexian County of Huangshan City carried out joint salvage, effectively preventing garbage along the river from washing into Qiandao Lake. The construction and accumulation of the Yuetan Lake Reservoir, a major national water conservancy project, has also provided important support for water resource regulation in the basin. However, from 2021 onwards, the assessed value once again showed a significant decline, falling to the alert level of 0.362 in 2023. Within two years, the drought period in the basin was prolonged, and the scarce precipitation led to a significant reduction in the amount of water replenished by the river. The growth of urbanization has led to an increasingly acute conflict between the need for and the supply of water resources. Overall, the assessment value was maintained at a high level between 2019 and 2020. Although the two provinces have established a joint governance mechanism, there are still problems in the actual implementation process. On the one hand, cross–regional coordination faces difficulties due to differences in administrative divisions and management systems; on the other hand, the imperfect mechanism of sectoral collaboration within the basin affects conservation work.
The relative proximity of the five criterion layers during the study period is shown in
Figure 3. The time point at which the peak value was reached varied between the guideline layers. For the stress layer, the values have been slowly decreasing since 2014. It shows that the Xin’an River Basin has achieved remarkable results in the rational utilization of water sources, and the management measures have matured gradually. The fluctuation in the lines in each criterion layer shows that the driver, state, and response layers show large fluctuations. In 2020, the relative proximity of these three layers reached a high numerical level. This is in line with the trend of the overall water environment in the basin. It can be indirectly proved that the key point to maintaining the quality of the water environment in the Xin’an River Basin is to consider the many factors that can affect the water environment as an organic whole. This is the correct and scientific way to implement human regulation initiatives. Currently, a balance has been achieved between the total water resources within the basin and the water used for urban industry, agriculture, and households, ensuring that there is no obvious threat to water resources. This has been achieved through effective water allocation strategies, water conservation measures, and recycling techniques. At the same time, a fundamental change in public awareness of environmental protection has played a key role.
4.2. Comparison of Similarities and Differences Between Districts and Counties
The average relative proximity of each district and county in the basin is mainly concentrated at a medium level of about 0.414 (
Table 3). The fluctuation of the values in different years is obvious in all counties, and the related indicators do not show stable development; meanwhile, the differences in economic development, policy priorities, resource allocation, and population base lead to different degrees of optimization of the state of the water environment in all counties. Qimen County, Jiande County, and Huining County have excellent water environments, while Huizhou District and Jixi County have relatively poor water environments; the changes are shown in
Table 4. In addition,
Figure 4 reveals that most counties have larger box widths, a phenomenon that reflects perhaps a certain degree of instability in the management of the water environment in each district and county.
Jiande City has shown the most significant improvement in its water environment over the past ten–year period. Its water environment has gradually changed from an alert status to a good level and is relatively close to the average value of a healthy level in the five–year period of 2019–2023. This is thanks to the fact that HCM City’s special funds for ecological compensation have been aimed towards districts and counties that have made great efforts and inputs and produced results in ecological protection in the lower reaches of the watershed. Water conservancy projects have been able to advance smoothly. In addition, Jiande City is located at the confluence of the three rivers, which itself has a good ecological foundation for the water system and is prone to achieving remarkable results. At the same time, the city is actively exploring the development of the new “water conservancy +” model. This will give full play to the comprehensive functions of rivers and lakes and promote the development of natural drinking water, leisure tourism, ecological agriculture, and other green industries along the river. The transformation and upgrading of traditional industries have further improved the productivity and pollution control level of enterprises.
The water environment of Huizhou District runs counter to the overall upward trend and currently faces more water resource protection problems. The first reason for this is the low utilization rate and development of water resources; most of the water resources are flowing downstream. The second is the existence of short boards in water conservancy infrastructure. The problem of small farmland water conservancy facilities remains outstanding, and agricultural surface pollution control needs to be far–reaching. The third is that the phenomenon of water resources waste is still serious. The people in water–rich areas in the south have a weaker concept of water conservation, and there is a general pattern of rough water supply and use. This is particularly evident for small and micro–enterprises, backward production processes, and water–saving equipment and facilities. In cities, water is basically used from the tap, wasting high–quality water. Fourth, the overall strength of the water resource management and protection team is insufficient. On the one hand, this has led to inadequate emergency response mechanisms, making it difficult to respond effectively in the event of emergencies such as water pollution; on the other hand, the lack of specialized personnel for operations and management has resulted in weak monitoring capacity [
50].
4.3. Water Environment Impact Factors in Xin’an River Basin
From the ordering status of the subsystem layers, the influencing factors in the Xin’an River basin are sequentially ordered as follows: state layer, response layer, pressure layer, influence layer, and driving force layer. Among them, the state layer and the response layer are the primary key factors determining the state of the basin’s water environment. The three indicators, namely the water production modulus, total water resources, and annual precipitation are the primary indicators used to measure the overall status of the basin’s water environment. Human activities are closely related to changes in these three indicators, which, in turn, lead to changes in the water quantity, water quality, and ecological functions in the basin. This shows that the key point for the protection and maintenance of the basin’s water environment is the coordinated and rational allocation and management of all kinds of resources. In terms of the natural population growth rate and afforestation area, the impact of the two on the overall water environment of the Xin’an River Basin is relatively small. The reason for this is that there is a certain time lag and buffer effect on the changes in population and afforestation. In the short term, it will not have a strong impact on the overall water environment of the basin. Moreover, there are buffer mechanisms in society that can effectively cope with the pressure brought about by population growth. For example, the natural increase in population is accompanied by an increase in economic activity. In this case, it is very likely to drive the progress of sewage treatment technology development while promoting the environmental protection industry to move forward.
Commonalities and differences in the main influential factors coexist in each district and county (
Figure 5). In Anhui Province, the rate of green space, the amount of green space in built–up areas, and forest coverage are the three indicators with the highest frequency of occurrence. These three factors act together in the water environment. On the one hand, they improve the quality of the water environment through water conservation, water purification, and the maintenance of ecological balance. On the other hand, it regulates the climate to minimize the adverse impact on the water environment and provides strong support for water environment protection. The area covered by green space and trees reflects, to a certain extent, the contradiction between urban land construction and the area of natural water conservation area. The primary focus on optimization can begin with the following three aspects: First, clearly enhance the green coverage, increase greening construction investment, and carefully design the urban green space layout. Secondly, strictly control the disorderly expansion of urban land use, avoid excessive occupation of natural water conservation areas, and improve land use efficiency. Third, improve the monitoring and evaluation of machinery through regular monitoring and assessments to ensure that the optimization work is implemented to achieve a sustained positive water environment. For Hangzhou, Chun’an, and Jiande counties, the water environment is in good condition, with most indicators showing a high degree of importance. The overall development is balanced with significant advantages. The two places should actively explore innovative ecological protection models. Utilizing the brand effect of Qiandao Lake, they should develop eco–tourism and other green industries to realize the benign interaction between economic development and environmental protection (see
Table 5).
4.4. Differences in the Spatial and Temporal Water Environment Carrying Capacities of Counties and Cities
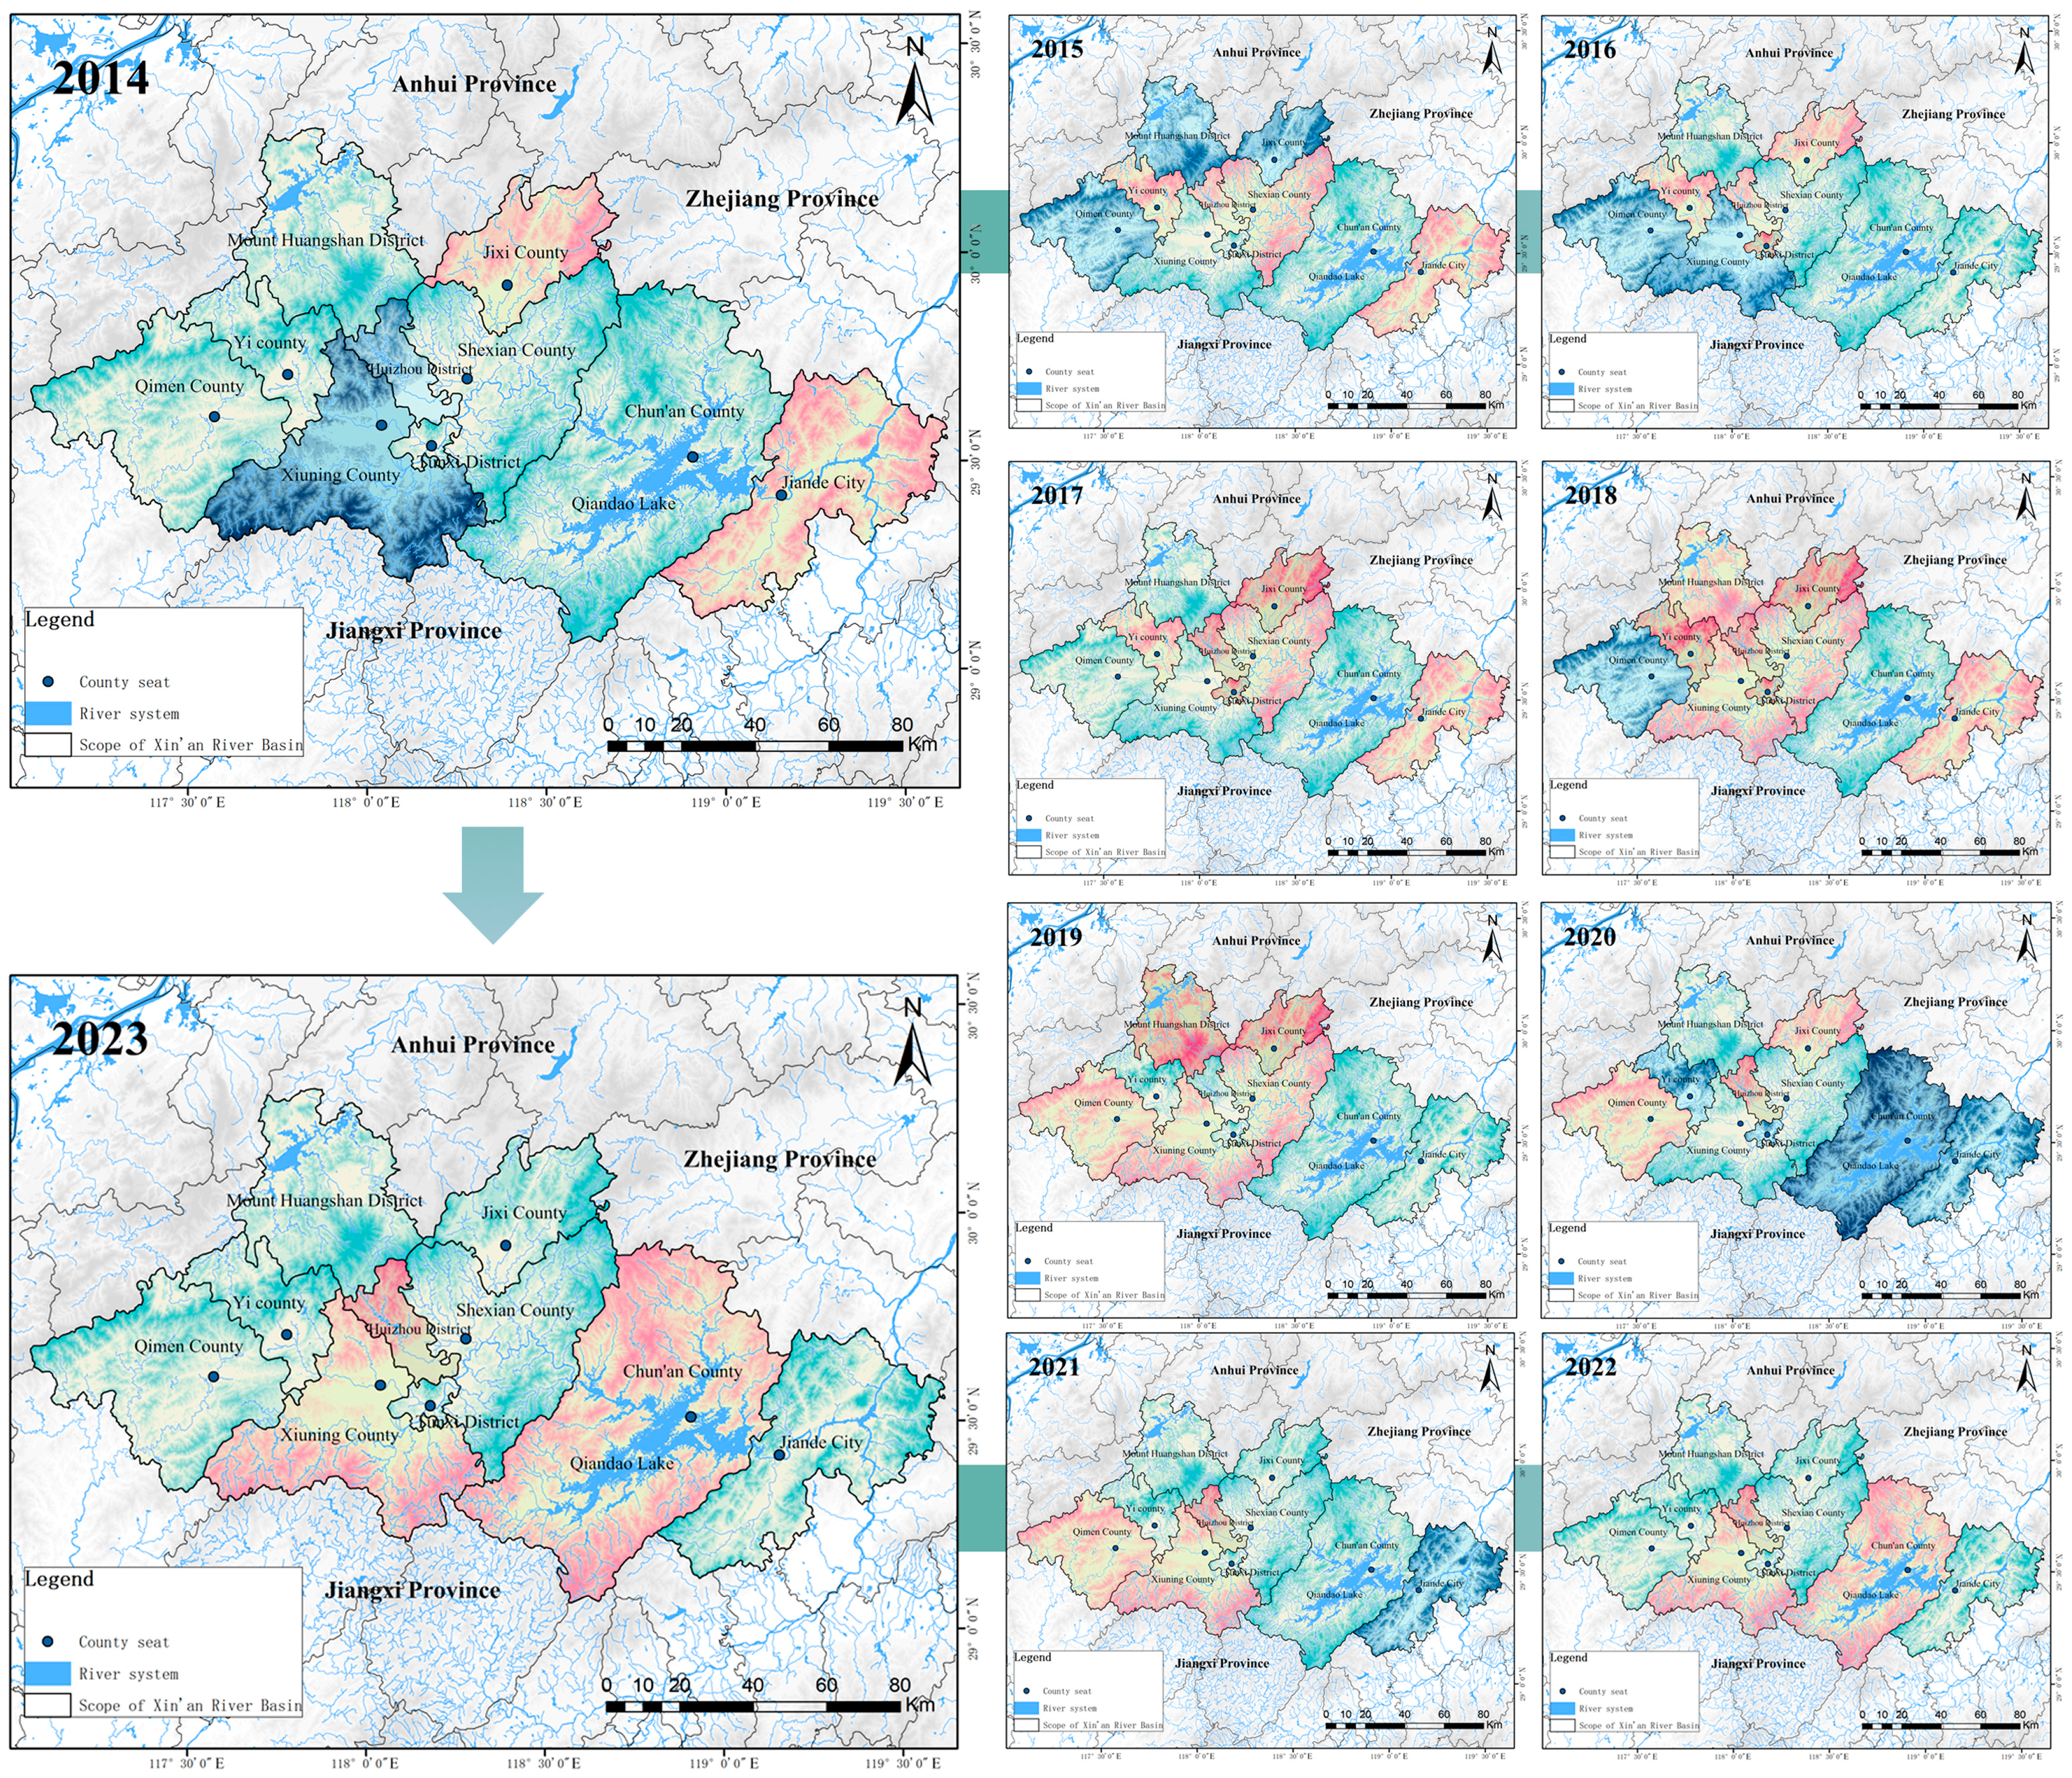
Observing the spatial and temporal changes in the districts and counties during the study period, the overall quality of Xin’an River Basin’s water environment has improved (
Figure 6). The overall situation shows a regional difference in “east is high, west is low”. During the ten–year period, the water environment of Chun’an County and Jiande City, which are adjacent to the Thousand Island Lake of the Xin’an River reservoir, became more and more stable. In Anhui Province, the water environment in eight counties fluctuated greatly in time and space, and the stability was not good.
Qimen County, Jiande City, and Chun’an County, as national key ecological function areas, have excellent natural ecological roots. Qimen County has rolling hills and lush natural vegetation. As the hometown of Chinese black tea, the mountain ecosystem is solid and plays an important role in guaranteeing the water quality of the important tributaries of the Xin’an River. Secondly, these three places have abundant water resources. Jiande City and Chun’an County are located in a key location of the Xin’an River basin, with low–intensity human activities and low–pollution discharge. The Qiandao Lake in Chun’an County has a vast water area with clear water. A good ecological environment makes the water body self–purified, maintains a high–water environment quality, and supports the stable survival of the regional ecosystem. Qiandao Lake and other waters also have a strong water storage function. It plays a vital role in regulating the amount of water in rivers and preventing floods and droughts. In the rainy season, water is stored to prevent flooding, and in the dry season, water is slowly released to protect downstream water demands. In terms of man–made environmental management, the state and government have detailed regulations on land use and industrial development in the surrounding area, strictly controlling the construction of projects that may pollute water bodies. Therefore, the industrial structure of the three locations is more scientific and reasonable. For example, Qimen County vigorously develops the eco–tea industry and eco–tourism industry, and the eco–tea industry adopts an organic planting mode, which reduces the risk of agricultural surface pollution; Jiande City focuses on the integration of eco–industry and eco–tourism, and the development of green industry, which realizes the benign interaction between the economy and the environment.
Shexian County, Huizhou District, and Tunxi District are located in the middle and upper reaches of the Xin’an River. All three areas have the natural disadvantages of uneven precipitation distribution and topographical constraints that are prone to soil erosion. Moreover, they are important agricultural production areas in the region, generating a large number of pollutants in the process of agricultural production and livestock breeding. Precipitation and irrigation processes have led to the eutrophication of water bodies, affecting water quality. Secondly, in recent years, the GDP of the three areas has increased rapidly, and the population density has increased, so the amount of domestic sewage discharged has continued to increase. However, the construction of sewage treatment facilities in these areas is lagging behind the growth rate of sewage discharge. Some of the old urban and rural areas in these three regions have inadequate sewage pipe networks, and some domestic sewage is discharged directly into rivers without treatment. There are problems in the construction of rainwater and sewage diversion systems, and the incomplete diversion of rainwater and sewage has increased the pollution load of the rivers. On the whole, the industrial structure of these places is not optimized enough, and high–pollution and high–energy–consumption industries account for a certain proportion of the total, which puts greater pressure on the environment. The root cause of the poor water environment lies in the shortcomings of the construction of the grid and the end of the management system, as well as the weak awareness of environmental protection in townships.
5. Discussion
5.1. Results of Ecological Compensation
This study utilized the entropy weight–TOPSIS method to assess the water environment of the Xin’an River Basin. The results show that the relative proximity of the water environment in the Xin’an River Basin increased between 2014 and 2016 due to the implementation of the pilot project of the ecological compensation mechanism. However, from 2017 to 2018, the adjustment of the original policy, as well as the negotiation of a new round of compensation agreements and water resource use, may have exacerbated the pressure on the water environment. Fortunately, after 2018, thanks to the policy upgrades of the cooperation agreement between the two provinces and the promotion of multiple compensations, the relevant values rebounded and peaked in 2020. This evaluation suggests that policy coherence is the core driver of water environment improvement in the Xin’an River Basin, while regional collaboration strengthens the effectiveness of cross–provincial governance. Analyzing the five criteria layers, the total water resources in the basin were balanced with the water demand of industry, agriculture, and domestic use, effectively avoiding the overconsumption of resources. The relative proximity of the state and response layers to the basin as a whole is almost synchronized, which indirectly proves that water resource allocation and water conservation policies have been effectively implemented. Ecological compensation has initially realized the synergistic development of ecological and economic benefits. In the next step, effective ways to transform ecological benefits into economic benefits should be actively explored.
During the study period, spatial and temporal characteristics and trends of the carrying capacity of the Xin’an River Basin were analyzed with the help of ArcMap 10.8.1 software to further compare the differences between districts and counties. The study found that the economic and ecological benefits of the Xin’an River Basin continued to improve, and the cross–provincial economic compensation had a positive impact on the economic development of the upstream areas and caused improvement in environmental quality in the downstream areas. However, there is an unevenness in the effect of ecological compensation, and there is still a lack of synergy in development among different regions. From the point of view of the relative proximity of the districts and counties, there are obvious differences in the water environment of the Hangzhou and Anhui sections, with the Hangzhou section being better than the Anhui section as a whole. Both the maintenance focus and direction need to be tailored to local conditions. The Hangzhou section is close to Qiandao Lake, and in order to maintain the advantage, it is necessary to accurately monitor the water quality of tributaries, strengthen the construction of ecological buffer zones, and innovate eco–tourism mode; the Huangshan section should balance the urban construction and green coverage, focusing on the planning of reserved green space, and exploring synergistic modes such as rain gardens, to improve the rainwater management and self–purification ability of the aquatic environment, and to ensure the harmony between urban development and nature. In terms of the spatial and temporal water environment evaluation, the districts and counties show a regional trend of “east high and west low”, with Qimen County, Jiande City, and Xiuning County having excellent water environments, and Huizhou District and Jixi County having relatively poor water environments. Different regions have both opportunities and challenges in water resource management and environmental protection. In order to achieve the goal of the sustainable use of water resources and environmental protection, it is necessary to strengthen the synergistic cooperation between counties, summarize and learn from the same experience, and achieve resource sharing and complementary advantages. The current environmental management system is based on administrative divisions and single elements and lacks comprehensive management of the basin as a whole and all elements. In order to guarantee the ecological safety of Xin’an River Basin, we can learn from the management mode of the Yangtze River Basin [
51,
52] and set up a cross–provincial coordinating body with the direct participation of national ministries and commissions to coordinate the cooperation between the two provinces to improve the water quality of Qiandao Lake.
5.2. Existing Problems
Although the Xin’an River Basin has achieved certain results in ecological management and protection, there are still a lot of gaps against the requirements of high–level protection and high–quality development, which are specifically reflected in the following aspects: Firstly, the stability of water quality is not good enough: during the flood season, some sections of the mainstream are significantly affected by rainfall, and the total phosphorus and other indicators exceed the standard in individual months. Rainfall will bring pollutants from the surface into the water body, thus affecting the water quality. Second, the infrastructure needs to be improved: the Huangshan urban and rural infrastructure is relatively behind, not only in the construction of facilities and short boards, but the operation of facilities and maintenance management level also needs to be improved. Such infrastructure makes it difficult to meet the growing demand for environmental protection, while the lower level of operation and maintenance management leads to the inefficient operation of facilities, unable to give full play to their role. Third, the lack of prevention and control of surface pollution should be considered: agricultural pollution load, where the surface of organic matter easily enters the water body, leads to fluctuations in water quality in rivers and lakes. Fertilizers and pesticides used in the process of agricultural production, as well as livestock and poultry breeding waste, etc., in the absence of effective control, may become a source of surface pollution. Fourth, there is insufficient development momentum in the watershed: the region is in the economic depression area of the Yangtze River Delta and Hangzhou metropolitan area, with a small economic volume and a declining residential population in recent years. This has led to a lack of sufficient funds and human resources to invest in ecological protection and economic development and the rich natural resources such as green water and green mountains have not been fully transformed into economic advantages.
5.3. Suggestion
In a watershed ecological compensation system, the choice of compensation method is a key factor in the effectiveness of the policy. If we only rely on a single form of compensation, not only is it difficult to meet the needs of water environment protection, but it is also impossible to realize the value of ecosystem services, which will easily lead to part of the ecological protection work being neglected, and it is difficult to give full play to the effectiveness of the synergistic cooperation between the regions. At present, the Xin’an River Basin mainly relies on central and local financial transfers to implement compensation policies [
53], which have achieved some positive results in the short term. However, in the long run, this model has limitations. The cause of this lies in deep–rooted problems such as lagging local economic development and reduced employment opportunities, and it is impossible to solve the problem fundamentally by relying solely on economic compensation. It is necessary to explore more diversified compensation paths on the basis of retaining financial compensation superimposed on policy guidance, technical empowerment, project–driven and talent support, and other compensation methods in order to create a self–developing and regulatory compensation mechanism. It is known in this article that the water environment in Anhui Province is mainly affected by green land forests, based on which we can make full use of rich forest land resources and explore ways to transform ecological resources into economic benefits. Vigorously developing eco–tourism service industries such as “farm and countryside tourism” and “countryside vacation” can focus on improving the added value of agriculture and agricultural products and building a specialty industry represented by tea. A virtuous cycle of ecological protection and economic development can be formed to promote each other and drive the water environment to undergo sustained positive development.
Due to the differences in geography and water resources between the two provinces, the strategies for water resources management should also be adapted to the local conditions. Zhejiang Province is located in the southeast coast, where rainfall is abundant, but there is the problem of uneven spatial and temporal distribution. Therefore, the intelligent water conservancy system can be used to build a “1+1+N” intelligent water management system, realizing the real–time monitoring and analysis of the data of all elements of the water environment, so as to allocate water resources more efficiently [
54]. Rainfall in Anhui Province shows obvious differences between the north and the south, and it should focus on promoting flood control and management projects in Xin’anjiang River Basin to improve the flood control standard, and at the same time, strengthen soil and water conservation in the mountainous areas to reduce soil and water erosion, and reduce the potential flooding hazards. In addition, the promotion of water–saving agriculture and industry and the improvement of water resource utilization efficiency are also key initiatives to alleviate the pressure on water resources.
5.4. Limitations of the Study
At present, the DPSIR theory and entropy–weighted TOPSIS model have been effective in revealing the macroscopic characteristics of the water environment in the Xin’an River Basin. However, there is still room for future research, especially at the micro level.
There are some limitations to this paper; in the selection of indicators in the Xin’an River basin, the data on water quality itself is not included, but this reflects the relationship between society and water to a greater level. In order to compensate for the lack of a subjective initiative in residential data samples, field surveys and social interviews can be added to obtain more accurate data so that this study has more room for optimization. In terms of temporal continuity, this paper only explores the changes in the decade from 2014 to 2023. In order to obtain a more comprehensive and in–depth understanding of the water environment and ecological and economic development of this region, a long–term dynamic assessment should be carried out in the future. In addition, with the gradual increase in people’s awareness of biodiversity conservation, the proportion of education and awareness in the relevant research and assessment system is likely to increase significantly, which also needs to be paid attention to and taken into account in the subsequent research.
6. Conclusions
The study constructed an index system for assessing the state of the water environment in the Xin’an River Basin, using the entropy weight–TOPSIS method combined with gray correlation analysis to assess the development status of the districts and counties, identify non–synergistic difference factors in the data, and analyze the differences in the impact of the indicators of the districts and counties. After comprehensive analysis, the following conclusions were drawn:
During the ten years of the study period, the relative proximity of the water environment in the Xin’an River Basin showed an overall “M” fluctuation trend, and the overall level was improved. In 2020, the relative proximity of the water environment in the basin reached 0.576, which is the optimal solution. The order of influential factors in the Xin’an River basin is as follows: state layer, response layer, pressure layer, influence layer, and driving force layer. Changes in the state layer and response layer are the main factors affecting the overall water environment condition of the basin, and the pressure layer has basically realized the balance with the environment. However, there are still problems in the actual implementation of the joint management mechanism established by the two provinces, and the future improvement of the sectoral collaboration mechanism in the basin will be an important direction.
Differences in water environments reflect the balance between economic development and ecological protection. During the study period, the mean values of relative proximity in Qimen County, Jiande City, and Chun’an County were 0.448, 0.445, and 0.439, respectively, and the three regions reached the medium level. The water environment of Huizhou District and Jixi County is relatively poor, and the mean values of proximity are 0.337 and 0.371, respectively, at the alert level. Currently, synergistic development in narrowing the gap between regions has not yet achieved significant results, which may be attributed to the uneven distribution of compensation funds between regions and the different efficiencies of the transformation of various types of protection measures. It is recommended that a more reasonable ecological compensation standard be explored in the future ecological compensation policy, which may take into account the differences in population density, the nature of regional industries, and topographic conditions to adjust the compensation standard.
The water environment in various districts and counties has both commonality and differences in the factors affecting the water environment. In Anhui Province, the water environment is relatively weak and unstable, where the green space rate, which refers to built–up areas of green space and forest coverage, is the core indicator, and a balance needs to be found between urban construction and the protection of natural water sources. Chun’an County and Jiande City in Hangzhou have a good water environment status, balancing development and significant advantages, and can rely on the brand effect of Qiandao Lake to promote the synergistic development of economy and ecology.


