Article

Anaerobic Enrichment and Succession of Microcystin-Degrading Bacterial Communities from Shrimp Pond Sediment and Shrimp Intestine

Key Laboratory of Aquatic-Ecology and Aquaculture of Tianjin, College of Fisheries, Tianjin Agricultural University, Tianjin 300384, China
*
Author to whom correspondence should be addressed.
These authors contributed equally to this work.
Water 2025, 17(6), 774; https://doi.org/10.3390/w17060774
Submission received: 7 February 2025 / Revised: 3 March 2025 / Accepted: 5 March 2025 / Published: 7 March 2025
(This article belongs to the Special Issue Microalgae Control and Utilization: Challenges and Perspectives)

Abstract

:
Under anaerobic conditions, microcystins (MCs)-degrading bacteria from shrimp pond sediment and the shrimp intestine were repeatedly enriched using Widdel medium with MCs as the sole source of carbon and nitrogen. The succession of two bacterial communities during anaerobic enrichment was compared, and anaerobic MC-degrading bacterial strains were isolated from the final enriched bacterial communities. The results showed that, with the increase in the enrichment time, the alpha diversity indices of the bacterial communities from the pond sediment and shrimp intestine decreased significantly at first ( p < 0.05 ) and then increased gradually, but the difference was not significant ( p > 0.05 ). The composition of the dominant genera changed significantly at first and then gradually stabilized. After six instances of enrichment, the bacterial communities from the pond sediment and shrimp intestine had similar microbial diversity and essentially the same dominant genera. Principal coordinate analysis (PCoA) revealed the significant differentiation of the original bacterial communities between the pond sediment and shrimp intestine, but no significant separation of the final enriched communities. Compared with the original bacterial communities, the degradation rates of MCs by the final enriched communities from the pond sediment and shrimp intestine were increased by 1.01 times and 1.42 times, respectively. Three anaerobic MC-degrading bacterial strains were isolated from the final enriched bacterial communities and identified as Shewanella algae, Serratia marcescens, and Bacillus flexu. They could all degrade MCs, but there were significant differences in their degradation rates, which could differ by more than 100 times. Our results suggest that a common native anaerobic MC-degrading bacterial community exists at different sites in the shrimp pond, and anaerobic biodegradation plays an important role in eliminating MC pollution in shrimp ponds.

1. Introduction

Litopenaeus vannamei, also known as Pacific white shrimp, is the most farmed aquaculture species in the world, with its annual global production exceeding three million tons. Since its introduction, L. vannamei has quickly become one of the most important aquaculture species in China. Currently, the freshwater farming of L. vannamei in ponds is a common practice [1,2], but it can easily cause the occurrence of cyanobacteria blooms [3,4]. Microcystis is the most prevalent bloom-forming cyanobacterium. Toxic Microcystis can secrete microcystins (MCs), which are heptapeptides with a stable cyclic structure; they are chemically stable and not easily eliminated [5,6]. More than 300 MC isomers have been found, among which microcystin-LR (MC-LR), microcystin-RR (MC-RR), and microcystin-YR (MC-YR) are most frequently detected [7,8]. MCs pose a direct threat to aquaculture species and ultimately endanger public health through the food chain [9].
In the natural environment polluted by MCs, MC-degrading bacteria are ubiquitous [10,11], and they play an important role in the natural degradation and removal of MCs [12,13]. Biodegradation is considered an economical and environmentally friendly way to eliminate MCs [14,15]. However, previous studies have mainly focused on aerobic biodegradation [16,17,18]. In addition to aerobic biodegradation, the anaerobic biodegradation of MCs is also involved in the removal of MCs in the natural environment [19,20,21].
In the aquaculture pond, MCs can accumulate in water, sediment, and aquatic animals during cyanobacteria blooms [22]. Bacteria in sediment (particularly at the sediment–water interface) are likely to be simultaneously exposed to anoxic conditions and high concentrations of MCs [23,24]. L. vannamei, as a benthic omnivorous feeder, can ingest not only dissolved MCs and suspended cyanobacteria in water but also MC-containing organic debris and cyanobacteria in sediments. The intestine is the first organ to face MC contamination. Bacteria are relatively prevalent in both anaerobic sediments and the intestines of aquatic animals [25,26]; these places are also the major accumulation sites for MCs [11,22,27,28]. There are unique MC-degrading indigenous bacterial communities in anaerobic environments [29]. Ding et al. (2022) found that the microbial community in the sludge of Taihu Lake could completely degrade MC-LR ( 1 mg / L ) under anaerobic conditions [25]. There are few studies on anaerobic MC-degrading bacterial communities in aquaculture ponds, and no anaerobic MC-degrading bacterial strains have been isolated and identified.
In this study, samples of water, sediment, and shrimp were collected from a culture pond of L. vannamei in September 2023 and the MC accumulation was analyzed. In addition, anaerobic MC-degrading bacteria were repeatedly enriched from pond sediment and the shrimp intestine using Widdel medium with MCs as the sole source of carbon and nitrogen. On the basis of comparing structural succession and analyzing the MC-degrading capacity of the bacterial communities from the pond sediment and shrimp intestine, MC-degrading bacterial strains were isolated and identified from the final enriched bacterial communities. The results lay the foundation for the elimination of MCs by anaerobic degradation technology in aquaculture ponds.

2. Results

2.1. MC Accumulation in Pond and Shrimp

As shown in Table 1, MC-RR was the dominant MC isomer in all samples. MC-LR and MC-YR were not detected in the pond water, sediment, hepatopancreas, or muscles of shrimp.

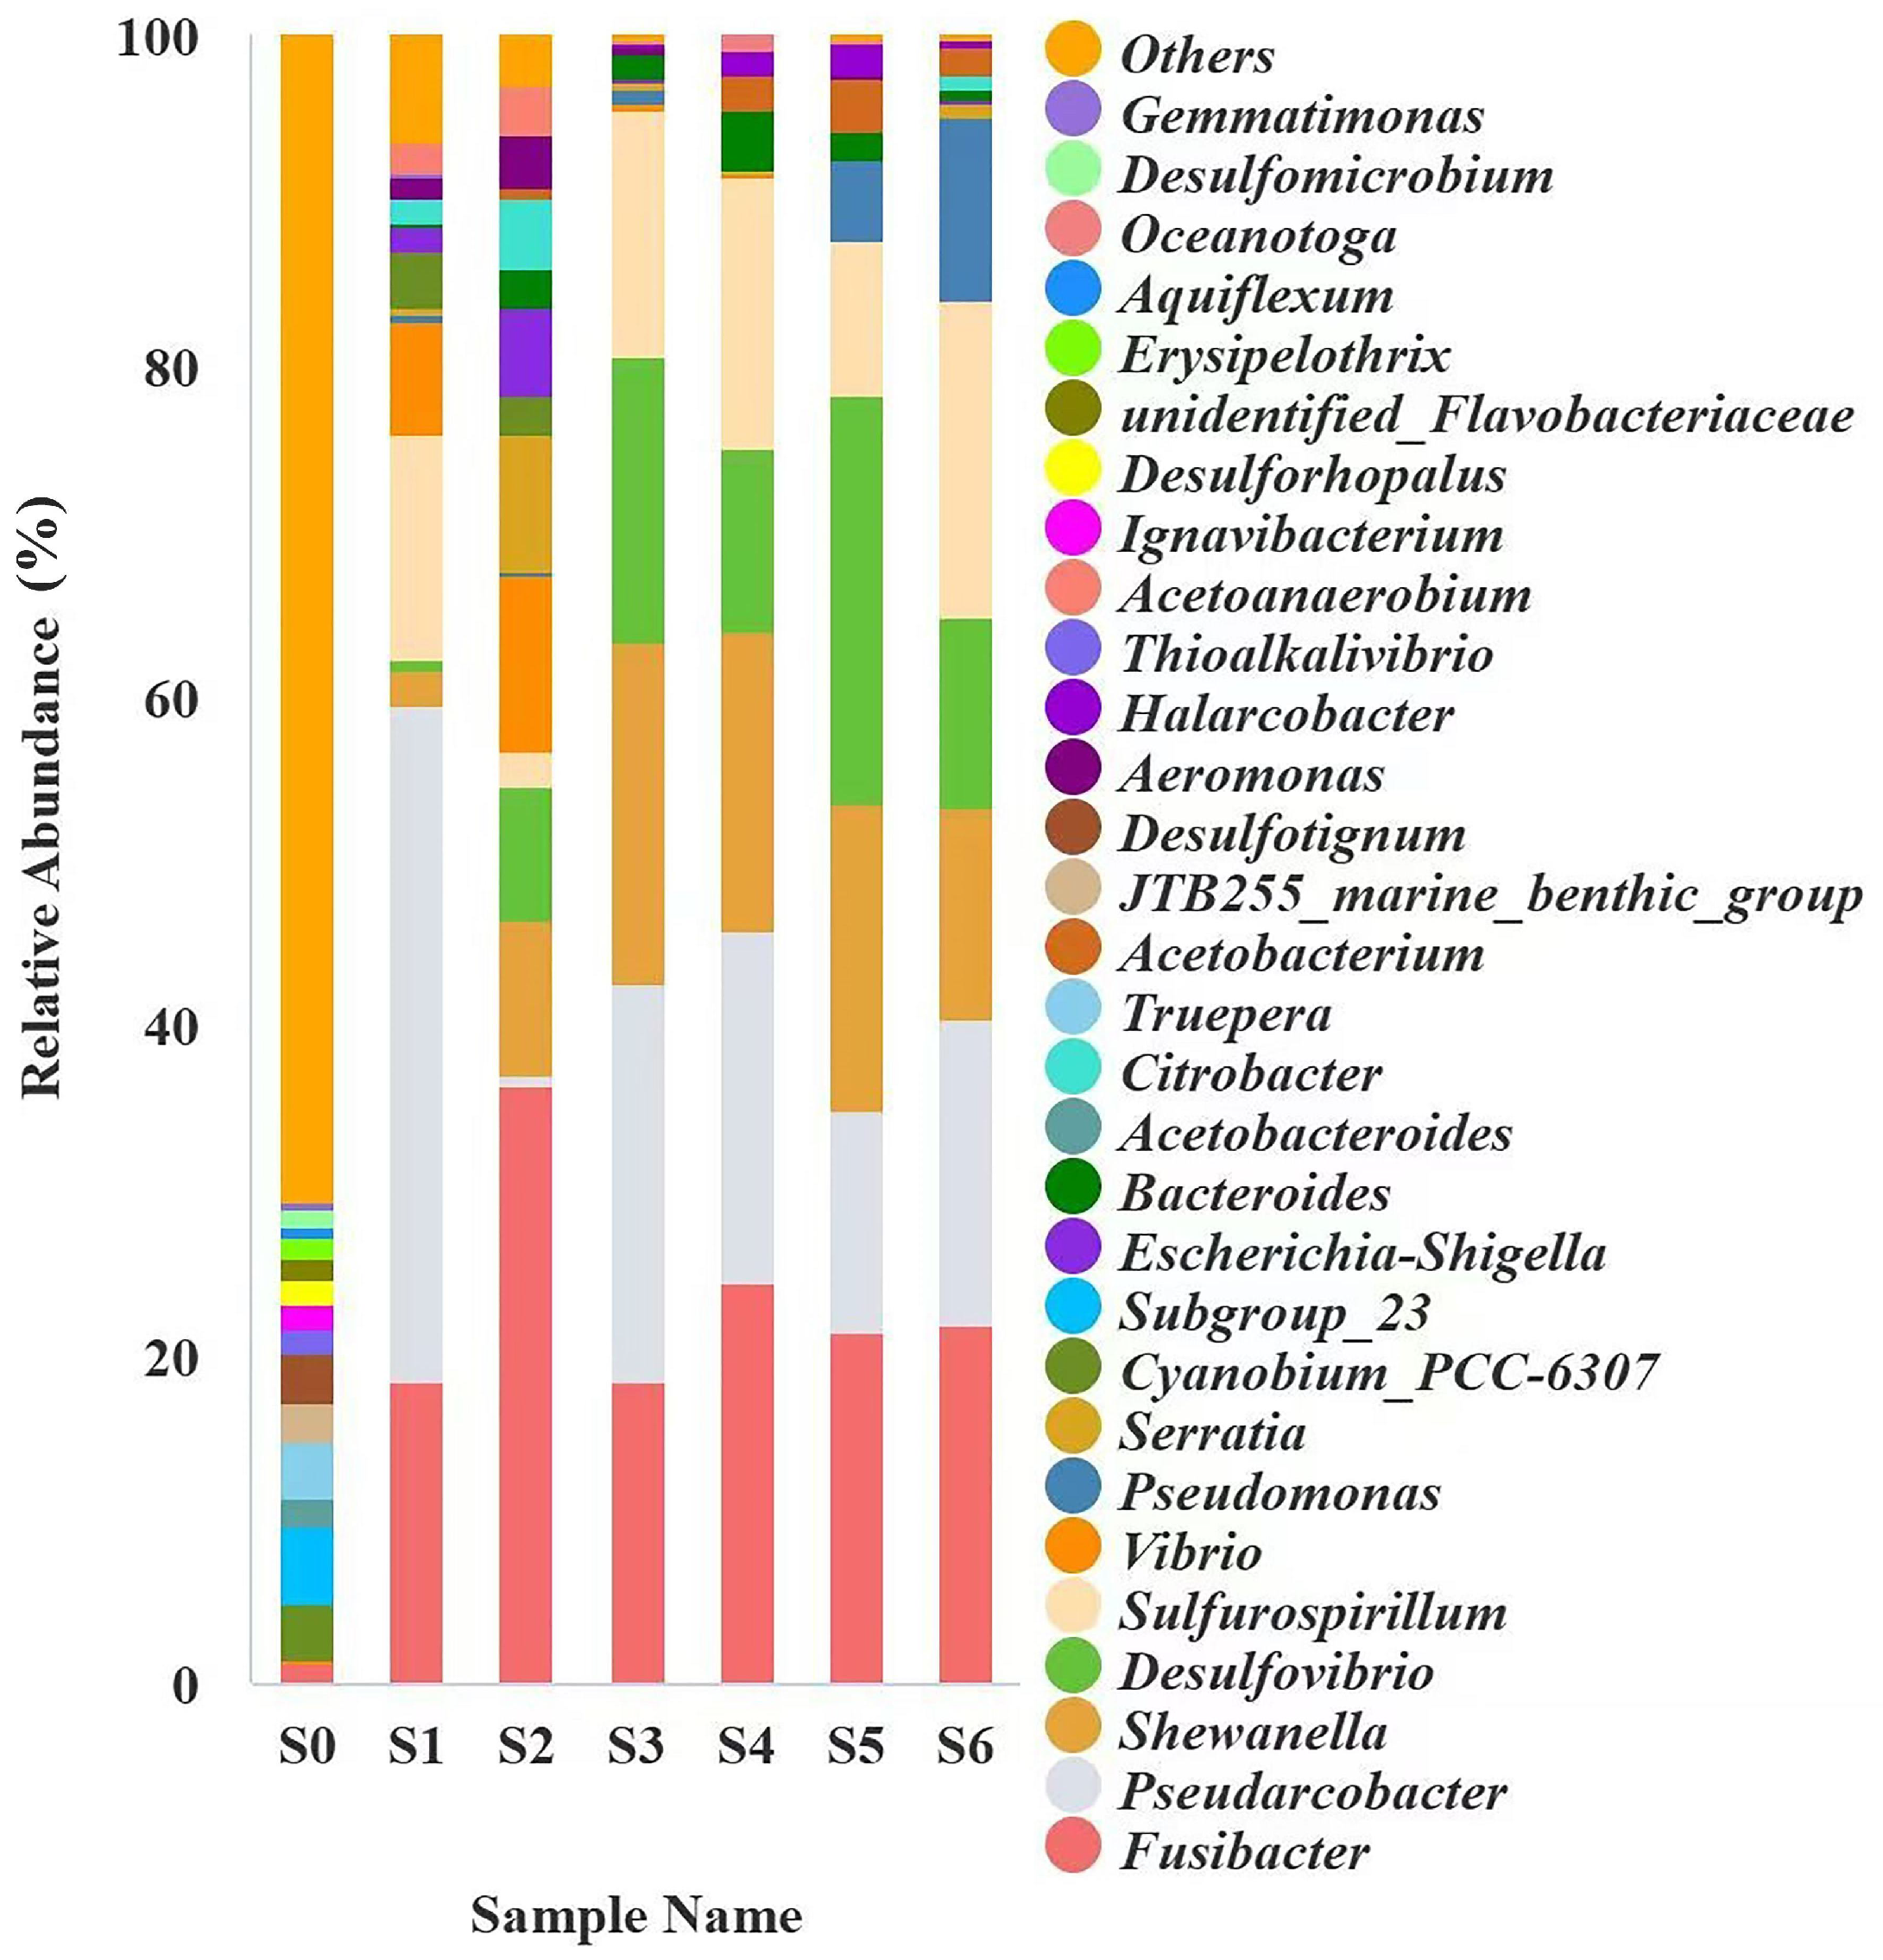
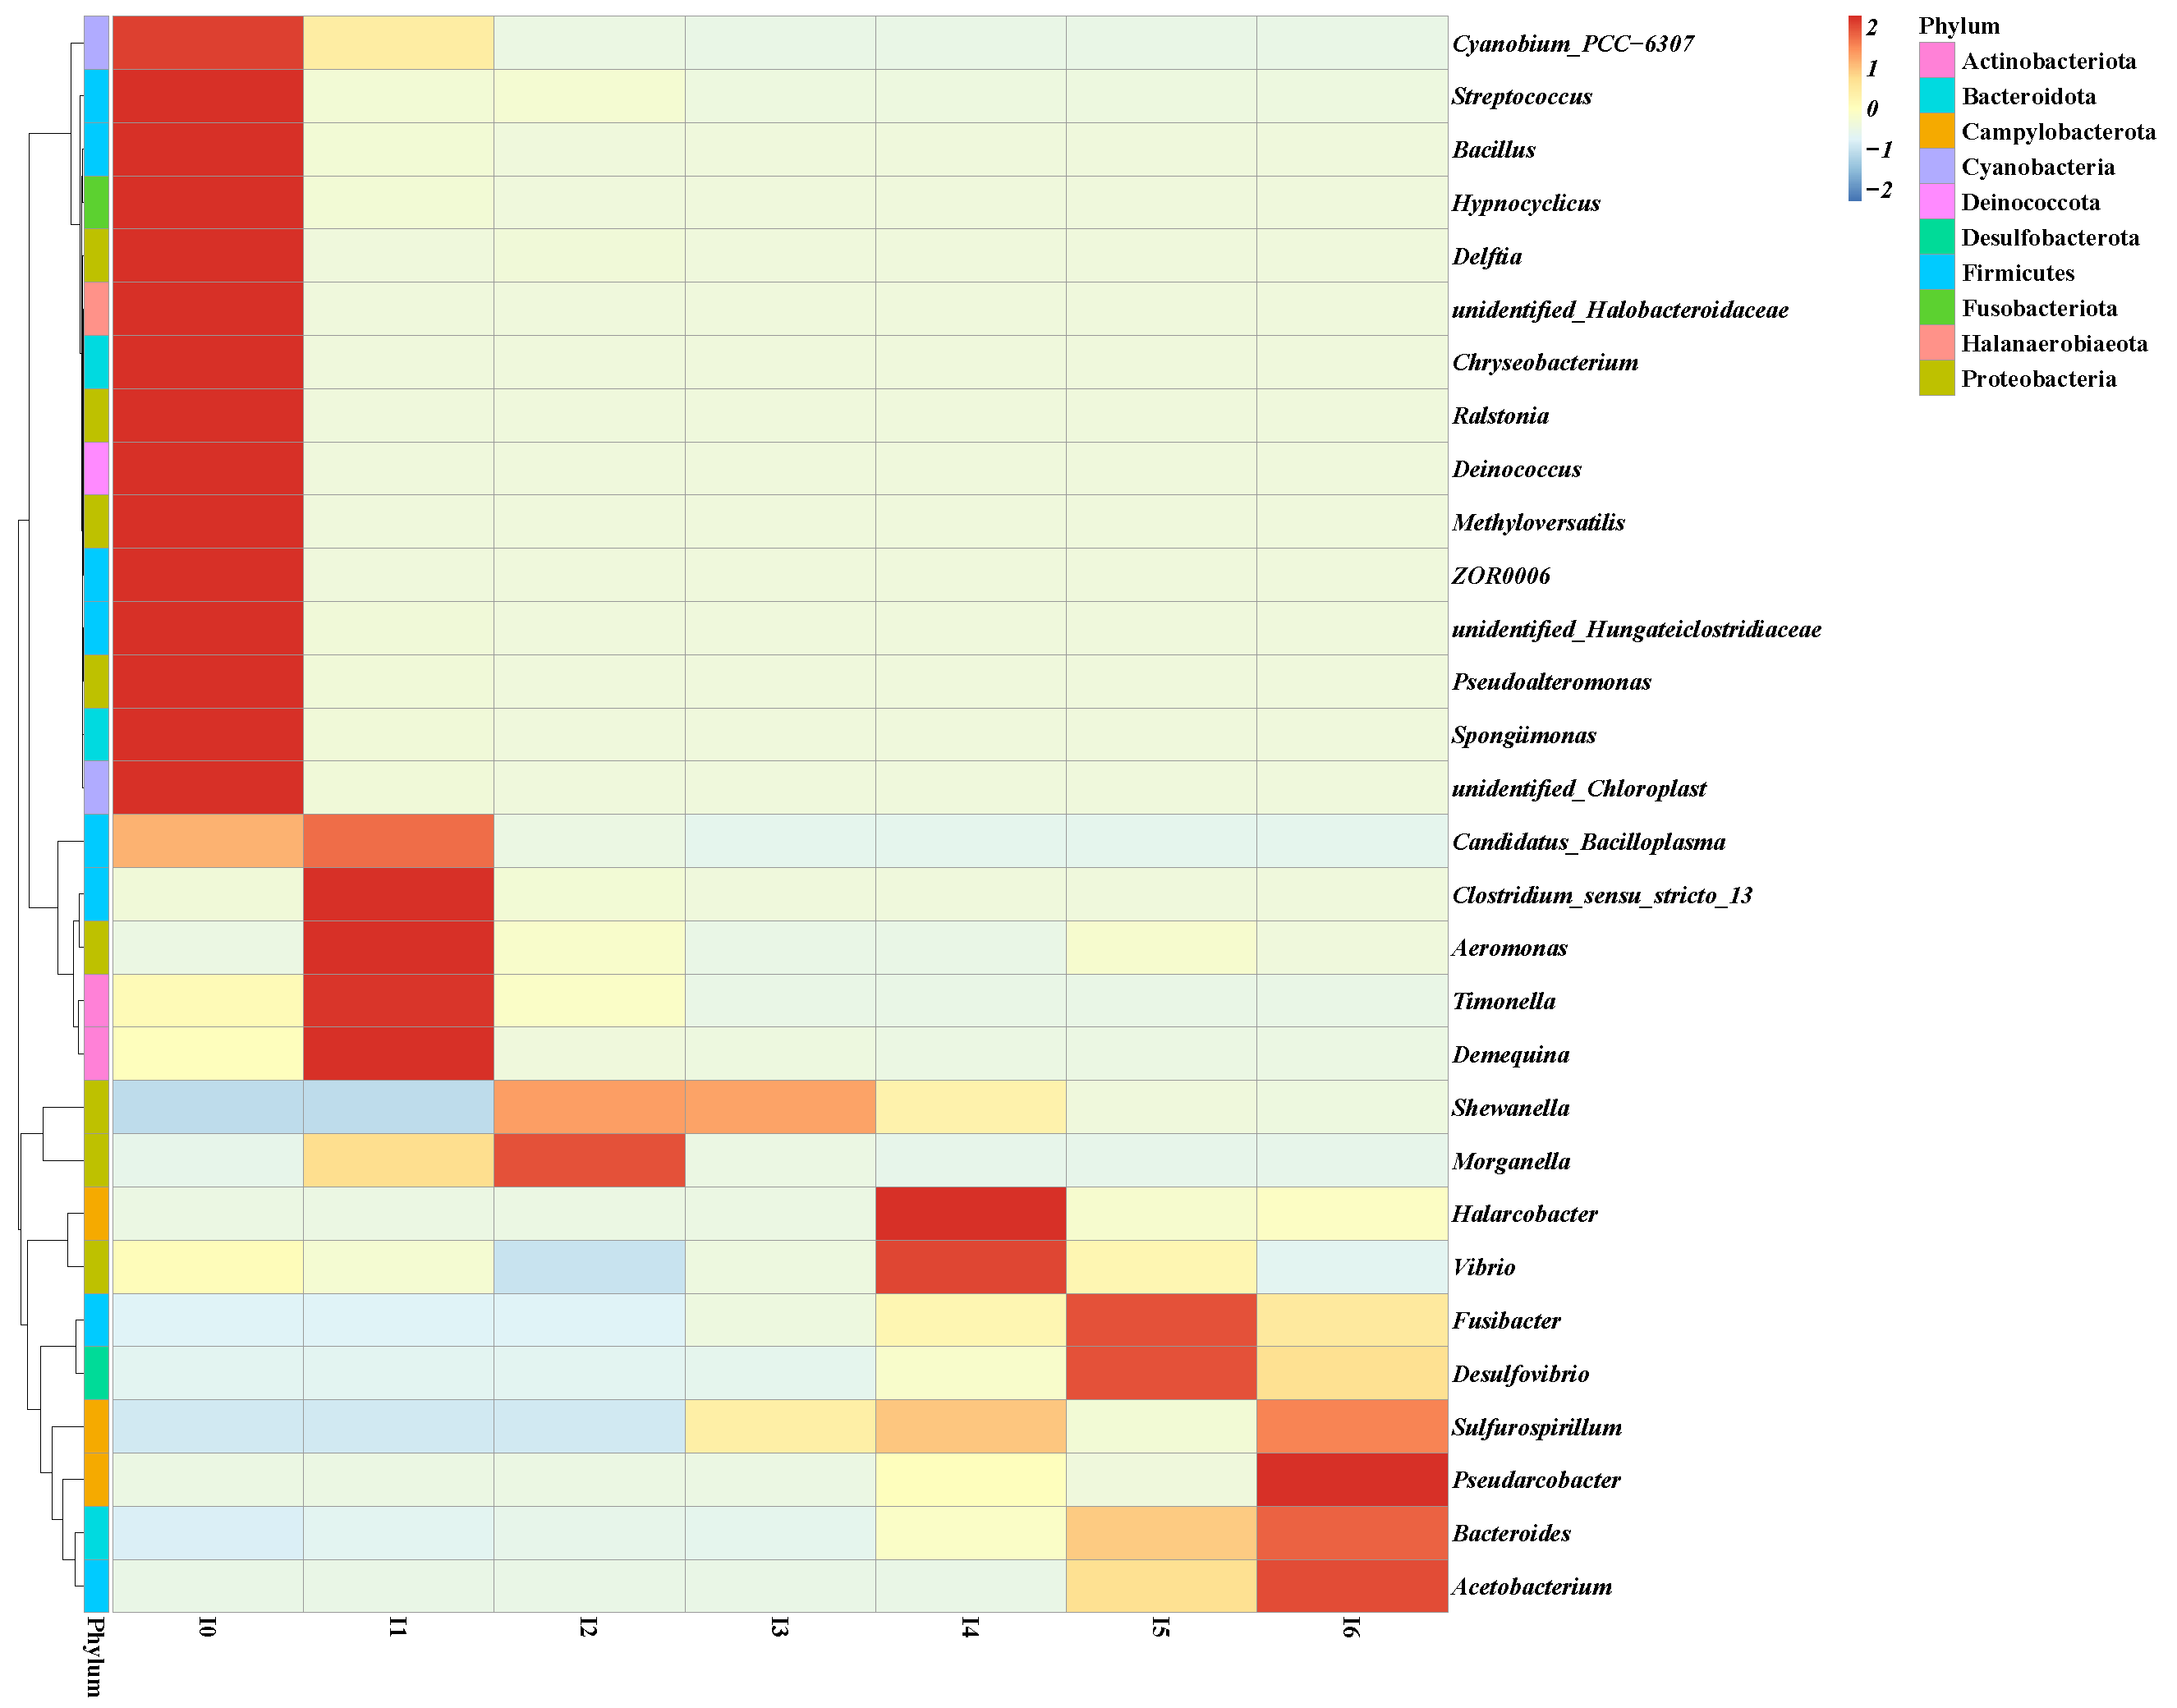
2.2. Bacterial Community Structure Enriched in Pond Sediment and Shrimp Intestine

As shown in Table 2, with the increase in the enrichment time, the alpha diversity indices of the anaerobic MC-degrading bacterial community in the pond sediment decreased first and then increased, but there was no significant difference ( p > 0.05 ). With the increase in the enrichment time, the changes in most alpha diversity indices of the shrimp intestinal bacteria community were the same as those in the pond sediment (Table 3). The alpha diversity indices (Observed_species, Chao1, ACE, and PD_whole_tree) of the original bacterial community in the pond sediment were significantly higher than those of the shrimp intestine ( p < 0.05 ). After enrichment with MCs six times, there was no significant difference in any of the alpha diversity indices between the pond sediment and shrimp intestine bacterial communities ( p > 0.05 ).
The top 30 dominant genera in the anaerobic MC-degrading bacterial communities from the pond sediment are shown in Figure 1. The original bacterial community (S0) in the pond sediment consisted of 65 phyla, 141 classes, and 520 genera. After 6 steps of anaerobic enrichment, there were 11 phyla, 14 classes, and 56 genera in bacterial community S6. The most dominant genera were Pseudarcobacter (S1), Fusibacter (S2), Pseudarcobacter (S3), Fusibacter (S4), Desulfovibrio (S5), and Fusibacter (S6), accounting for 41.01 % ,   36.36 % ,   24.18 % ,   24.31 % , 24.75 % , and 21.75 % of the total genera, respectively. The top five dominant bacterial genera in S3 to S6 remained stable; they were Fusibacter, Pseudarcobacter, Shewanella, Sulfurospirillum, and Desulfovibrio, accounting for 95.61 % (S3), 91.43% (S4), 87.51 % (S4), and 83.96 % (S6) of the total genera.
The top 30 dominant genera in anaerobic MCs-degrading bacteria communities enriched from shrimp intestine is shown in Figure 2. The original bacterial community (I0) in the shrimp intestine consisted of 33 phyla, 76 classes, and 260 genera. After six steps of selective enrichment, the intestinal bacterial community (I6) included 13 phyla, 18 classes, and 63 genera. From bacterial communities I2 to I4, Shewanella was the most dominant genus, with the highest relative abundances of 82.09 % (I2), 80.80 % (I3), and 46.01 % (I4). From bacterial communities I4 to I6, the top five dominant genera remained stable, and they were Shewanella, Fusibacter, Sulfurospirillum, Desulfovibrio, and Pseudarcobacter, accounting for 83.03 % (I4), 84.98 % (I5), and 90.33 % (I6) of the total genera. After four steps of enrichment by MCs, the bacterial communities from the pond sediment and shrimp intestine had the same five most dominant genera (Fusibacter, Pseudarcobacter, Shewanella, Sulfurospirillum, and Desulfovibrio).
Changes in the relative abundances of the top five dominant genera in S0–S6 and I0–I6 are shown in Figure 3. Except for Sulfurospirillum, the highest relative abundances of the top five dominant genera in the bacterial communities from the pond sediment appeared before the final enrichment. The relative abundances of the top five dominant genera ranged from 0.60 to 41.01 % in S1, 0.60 to 36.36 % in S2, 15.09 to 24.18 % in S3, 11.04 to 24.31 % in S4, 9.29 to 24.75 % in S5, and 11.73 to 21.75% in S6. The relative abundances of Pseudarcobacter and Sulfurospirillum were the highest in I6, and the highest relative abundances of the other three dominant genera appeared before the final enrichment. The relative abundances of the top five dominant genera ranged from 0.00 to 0.01 % in I1, 0.00 to 82.09 % in I2, 0.00 to 80.80 % in I3, 3.30 to 46.01 % in I4, 0.58 to 29.13 % in I5, and 13.20 to 24.12% in I6. With the increase in the enrichment time, the differences in the relative abundances of the five dominant bacterial genera decreased gradually.
There were four types of trends in the relative abundance of the bacterial genera from the pond sediment (Figure 4): (1) from Cyanobium_PCC-6307 to Acetobacteroides, the relative abundance in the original bacterial community S0 was the highest and then decreased with repeated enrichment, indicating that these bacteria could not use MCs as a source of carbon and nitrogen; (2) from Vibro to Escherichia–Shigella, the relative abundance increased from S0 to S2 and then gradually decreased. From Halarcobacter to Oceanotoga, the relative abundance first increased and then decreased with enrichment, and the relative abundances of S5, S3, S2, and S4 were the highest, respectively; (3) the relative abundance of Pseudomonas increased overall with enrichment; (4) the relative abundances of Sulfurospirillum and Pseudarcobacter increased from S0 to S1, decreased to a low level in S2, and remained high in S3 to S6.
There were three types of trends in the relative abundance of the bacteria from the shrimp intestine (Figure 5): (1) from Cyanobium_PCC-6307 to unidentified_Chloroplast, the relative abundance in the original bacterial community I0 was the highest and then decreased with enrichment, suggesting that these bacteria had no ability to degrade MCs; (2) from Candidatus_Bacilloplasma to Desulfovibrio, the relative abundance increased first with enrichment, including from I0 to I1, from I0 to I2, from I0 to I4, or from I0 to I5, and then gradually decreased; (3) from Sulfurospirillum to Acetobacterium, the relative abundance increased overall with enrichment, and that in I6 was the highest.
As shown in Figure 6, principal coordinate 2 (PCoa1) and principal coordinate 2 (PCoa2) explained 26.29 % and 10.42 % of the variance, respectively. S3, S4, S5, S6, I3, I4, I4, and I6 were relatively close together and named Group 1, while S0, S1, S2, I 0 ,   I 1 , and I2 were further away from Group 1 and classified as Group 2. In Group 1, only S3 was distantly separated from the other communities. The distance between two successive communities from the pond sediment decreased as follows: S3–S4 > S4–S5 > S5–S6. In Group 2, except for I1 and I2, all communities were distantly separated. When the enrichment time was the same, the communities from the pond sediment and shrimp intestine in Group 1 were closer to each other than those in Group 2, and S6 and I6 were the closest.

2.3. Degradation Performance of MCs in Bacterial Communities from Pond Sediment and Shrimp Intestine Under Anaerobic Conditions

As shown in Table 4, with the increase in the enrichment time, the MC degradation rates of the enriched bacterial communities from the pond sediment and shrimp intestine increased significantly first and then increased, but the difference was not significant. Bacterial communities S6 and I6 had the highest degradation rates of MCs, which were 1.01 times and 1.42 times higher than those of S0 and I0, respectively.

2.4. Isolation and Identification of MC-Degrading Bacterial Strains

Three MC-degrading strains (I6-1, I6-2, and I6-3) were isolated from I6-1, and two MC-degrading strains (S6-1 and S6-2) were isolated from S6. Isolates I6-1 and S6-1 had the same morphological and biochemical characteristics (Table 5). They had circular colony forms, with entire edges, convex surfaces, and yellow colony colors. The 16S rDNA sequences of S6-1 and I6-1 showed 100 % identity; they were deposited in GenBank with accession numbers PP264740 and PQ496540, respectively. S6-1 and I6-1 shared 99.64 % identity with the 16S rDNA sequence of the type strains of Shewanella algae deposited in GenBank. The colonies of I6-2 and S6-2 were circular and white with intact edges and convex surfaces. The 16S rDNA sequences of S6-2 and I6-2, with 100 % homology, were deposited in GenBank with accession numbers PP264739 and PQ496539, respectively. S6-2 and I6-2 had 100% identity with the type strains of Serratia marcescens. For isolate I6-3, the colony was circular and milky white, with uneven edges and minor elevation. I6-3 shared 100 % identity with the type strains of Bacillus flexus, and its 16S rDNA sequence was deposited in GenBank with accession number PP264708.

2.5. Comparison of MC-Degrading Ability of Isolated Bacterial Strains

As shown in Table 6, the three isolated bacterial strains had different degradation abilities regarding MCs. B. flexus showed the best MC-degrading ability, with a 100 % degradation rate at 72 h. The MC degradation rate of S. algae was less than 1 % within 72 h. With the extension of the sampling time, the degradation rates of MCs among the three isolated bacterial strains showed an increasing trend.

3. Discussion

In the sampled shrimp pond, MC-LR and MC-YR were not detected, but MC-RR was detected in all samples, including water, sediment, and shrimp tissue. The dissolved MC content in the water ( 3.70 μ g / L ) was higher than that detected in other natural waters, such as lakes and rivers [30,31], but lower than that in other shrimp ponds [9,32]. The deposition and dissolution of MC-producing algal cells in sediment, as well as the physical adsorption and sedimentation of MC-containing particles, contribute to the accumulation of MCs in the sediment [28]. MCs can be detected in sediments from different waters where cyanobacteria blooms occur. The MC content in the sediment of the shrimp pond was 0.27 μ g / g . In our previous study, we found that the MC concentrations in the sediment of a fish pond ranged from 1.34 to 5.90 μ g / g [22]. The content of MCs in the sediment of Taihu Lake was 0.074 μ g / g [28]. MC contamination in aquaculture environments is generally more severe than in non-aquaculture environments due to eutrophication caused by unconsumed feed and the continuous deposition of organic debris during aquaculture [33].
The long-term selective pressure of MCs could change the structure of the microbial community towards greater efficacy in the biodegradation of MCs [34]. MC-degrading bacteria can only be found in environments that have been chronically contaminated with MCs. The MC content in the shrimp intestine is easily affected by the MCs ingested during sampling. Whether the intestine is chronically contaminated with MCs before sampling cannot be reflected by the intestinal MC content. Shrimp mainly ingest MCs through the intestine [35]. The accumulation of MCs in the hepatopancreas and muscle of shrimps indicated that the intestine had experienced long-term contamination with MCs. Our results showed that the indigenous bacterial communities in the pond sediment and shrimp intestine could degrade MCs from 0.38 mg / L to 0.24 mg / L and 0.25 mg / L , respectively, within 3 days, indicating the widespread existence of anaerobic MC-degrading bacteria in these two native bacterial communities. Chen et al. (2010) evaluated the anaerobic degradation of MC-LR by an indigenous sediment microbial community in Lake Dianchi [36]. They found that 5 mg / L of MC-LR could be completely degraded within 2 days after a lag phase of 2 days. Holst et al. (2003) found that MCs in anoxic sediment slurries could be degraded from 105 mg / L to about 62 mg/L within 6 days [37]. In addition to environmental factors, such as the temperature and pH, the composition and abundance of MC-degrading bacteria in the indigenous bacterial community are also major factors affecting anaerobic degradation.
Ding et al. (2020) found that, under anaerobic conditions, when the bacterial community in lake sediment was repeatedly treated with 1 mg / L MC-LR, the microbial diversity was first suppressed and then gradually recovered [34]. Consistent with Ding’s results, the alpha diversity indices of the anaerobic MC-degrading bacterial communities in the pond sediment and shrimp intestine decreased significantly from S0 to S4 and from I0 to I3/I5 and then increased, but the difference was not significant. When the bacterial community was repeatedly treated with MC-LR for 7 days, the alpha diversity decreased to the lowest values at the early stage and then recovered from group G1 or G2 [36]. In our study, each stage of enrichment lasted 3 days, and the alpha diversity declined to its lowest value in the middle stage and recovered from communities S5 and I4. Repeated enrichment led to the gradual elimination of MC-sensitive bacteria that could not use MCs as the sole carbon and nitrogen sources, while bacteria that were resistant to MCs rapidly proliferated, using the MCs as a growth substance. Therefore, the suppression–recovery pattern of the bacterial community diversity was due to the combined effect of changes in the abundance of MC-sensitive and MC-degrading bacteria populations.
With the increase in the enrichment time, not only did the microbial diversity decrease significantly at first and then increase with no significant difference, but also the composition of the dominant genera changed significantly at first and then remained stable. The top five dominant bacterial genera (Fusibacter, Pseudarcobacter, Shewanella, Sulfurospirillum, and Desulfovibrio) in S3 to S6 accounted for 83.96–95.61% of the total genera. The top five dominant bacterial genera of I4–I6 were the same as those of S3–S6, accounting for 83.03–90.33% of the total genera. Meanwhile, with the increase in the enrichment time, the relative abundance differences of the five dominant bacterial genera decreased gradually. The PCoA showed that the communities in I3–I6 and S3–S6 were closer to each other as compared to S0–S2 and I0–I2. I2 was relatively close to I3. Repeated selective enrichment with MCs gradually enhanced the degradation rates of the bacterial communities from the pond sediment and shrimp intestine. Interestingly, according to the differences in the degradation rates of MCs, the bacterial communities could be divided into three groups: S0 (37.17%) and I0 (33.66%), SI–S2 (48.40–52.26%) and I1-I2 (43.49–46.65%), and S3–S6 (62.09–74.87%) and I3–I6 (63.85–81.43%). When the enriched bacterial communities gradually stabilized from S3 to S6 or from I3 to I6, the change in their ability to degrade MCs gradually decreased.
The alpha diversity of the original bacterial community in the shrimp intestine was significantly lower than that in the pond sediment. Meanwhile, the genus composition analysis and PCoA showed the significant differentiation of the original bacterial communities between the pond sediment and shrimp intestine. However, after enrichment with MCs six times, the alpha diversity of the bacterial communities in the shrimp intestine and pond sediment was similar, and bacterial communities I6 and S6 had essentially the same dominant genera. Although there were significant differences in the composition of the native bacterial communities between the shrimp intestine and pond sediment, the composition of anaerobic MC-degrading bacteria was similar between the two communities, suggesting that a common native anaerobic MC-degrading bacterial community might exist at different sites in the shrimp pond.
Compared with aerobic MC-degrading bacteria, fewer anaerobic MC-degrading bacterial strains have been isolated and identified at present. Huang et al. (2019) isolated an anaerobic MC-degrading bacterium, Enterobacter sp. YF3, which degraded MCs via a pathway independent of mlrABCD genes [20]. Zhu et al. (2019) combined MC-LR degradation with microbial community analysis and deduced that Candidatus Cloacamonas acidaminovorans str. Evry might play an important role in the degradation of MC-LR under anaerobic conditions [19]. The mechanism involved in the anaerobic degradation of MCs might be more diverse than that of aerobic biodegradation [19]. The highest relative abundances of Enterobacter and Candidatus were only 0.27 % and 0.07 % in the indigenous and enriched bacterial communities of the shrimp intestine and pond sediment. We isolated two identical MC-degrading bacterial strains (S. algae and S. marcescens) from the shrimp intestine and pond sediment, while B. flexus was isolated only from the shrimp intestine. These three strains all belonged to the dominant bacterial genera of S6 and I6. Anaerobic bacteria communities in Lake Tai sediments dominated by Bacillus spp. (Gemmatimonas) were able to open the cyclic MC-LR through a new site, and new intermediate products were produced during degradation [25]. Aerobic B. flexus isolated from a Saudi eutrophic lake could degrade 10 mg / L MC-RR completely within 4 days [16]. In our study, compared with S. algae and S. marcescens, anaerobic B. flexus showed the best MC-degrading ability. Hong et al. (2018) isolated a bacterial strain with algicidal activity against M. aeruginosa from eutrophic water and identified it as Serratia sp. [38]. Wei et al. (2020) found that the prodigiosin extracted from S. marcescens LTH-2 in Lake Taihu could kill Microcystis while inhibiting MC synthesis [39]. Shewanella sp. Lzh-2, with strong algicidal properties against M. aeruginosa, was isolated from Lake Taihu, and this bacterium could secrete two substances with algicidal activity [40]. Serratia and Shewanella were isolated as anaerobic MC-degrading bacterial genera for the first time. The MC-degrading activity of S. algae was significantly lower than that of S. marcescens and B. flexus. In our following experiment, we found that the MC degradation rate of S. algae ( 2.96 × 10 8 CFU / mL ) could reach 73.04 % at 72 h. The degradation abilities of different anaerobic bacterial strains varied greatly. This should be fully taken into account when applying single anaerobic MC-degrading bacterial strains or complex anaerobic bacteria to remove MCs in the future.

4. Conclusions

Although the microbial diversity and dominant genera compositions of the original bacterial communities in the pond sediment and shrimp intestine were quite different, after repeated enrichment in a selective medium, their microbial diversity was similar, and the composition of dominant genera also became similar. There were common original anaerobic MC-degrading bacterial communities in the pond sediment and shrimp intestine. With the increase in the enrichment time, the bacterial community structure gradually stabilized and the difference in their degradation capacity regarding MCs gradually decreased. When applying enriched anaerobic bacterial communities to remove MCs in aquaculture, it is not necessary to conduct several steps of enrichment to improve their degradation capacity.

5. Materials and Methods

5.1. MC Standards and Extracted Crude MCs

The standards of MC-RR, MC-LR, and MC-YR were purchased from Beijing Pushi Technology Co., LTD. (Beijing, China) Crude MCs were extracted by our laboratory from Microcystis collected in a fish pond with content of 1.3 mg / mL , which mainly contained two MC isomers, MC-RR and MC-LR, accounting for 85.42 % and 14.58 % , respectively.

5.2. Sample Collection

The culture pond of L. vannamei was located in the Binhai New Area, Tianjin, China (E 1178° 48 36.95 , N 38 ° 87 37.8 ). This pond suffers from Microcystis blooms frequently in the summer. The water column, sediment, and shrimp were sampled on 23 September 2023. Water column samples were collected using a specially designed cylindrical organic glass sampler from three sites located 10 m away. Mixed water samples were filtered through a 0.22 μ m Millipore polycarbonate membrane to prepare the filtrate for dissolved MC analysis. Sediment samples (0–10 cm ) were collected using a columnar sediment sampler from 3 sites. Sixty shrimp (body length 118.41 ± 17.78 , body weight 10.15 ± 5.40 ) were randomly collected from the pond.

5.3. MC Extraction and Determination

MCs in the water filtrate were concentrated using a Sep-Pak SPE C18 (Waters, Milford, MA, USA) cartridge pretreated with 10 mL methanol and 10 mL Milli-Q water at a flow rate of 8 mL / min . The cartridge was rinsed with 20 % methanol solution and then the bound MCs were eluted using 10 mL methanol solution containing 0.1 % TFA. The MC-containing elution was evaporated to dryness under a stream of nitrogen gas, and the residue was dissolved in 1 mL 50 % methanol and then filtered through a 0.22 μ m nylon membrane (COMYBION, Tianjin, China) for high-performance liquid chromatography (HPLC) analysis. The hepatopancreas and muscle of every 20 shrimp were pooled together. Three replicate hepatopancreas/muscle samples were lyophilized and ground and then extracted with 90 % methanol aqueous solution at a 1:20 mass to volume ratio. Each sediment sample was freeze–thawed 3 times, lyophilized, and ground and then extracted with 35 mL 0.1 % trifluoroacetic acid (TFA) (Macklin, Shanghai, China) with a solid–liquid ratio of 1:35. The mixtures obtained from the shrimp tissue and sediment samples were ultrasonicated three times (1 min each time, 10 s interval) at 60 % amplitude and then centrifugated at 12,000× g for 10 min. The MCs in the supernatants were concentrated as described above.
The MC concentration was analyzed using an SPD-M20A HPLC system (Shimadzu, Kyoto, Japan) equipped with a Shim-Pack VP-OD column ( 250 mm × 4.6 mm) and a DAD detector set at 238 nm. The mobile phase was 60 % aqueous methanol with 0.02 % trifluoroacetic acid, set at a flow rate of 1 mL / min . The column temperature was maintained at 40   ° C , and the injection volume was 5 μ L. According to the relationship between the analyte concentration and chromatographic peak area, the linear calibration curves of MC-LR, MC-RR, and MC-YR were obtained using serially diluted solutions of corresponding standard products (Pushi, Beijing, China). The concentrations of MC-LR, MC-RR, and MC-YR were calculated by comparing the peak area of the sample with its linear calibration curve.

5.4. Selective Enrichment of Anaerobic MC-Degrading Bacterial Community

The pond sediment/shrimp intestine were mixed with sterilized water at a mass to volume ratio of 1:20. The mixtures were stirred magnetically at 60 r / min for 1 h and then left untouched for 1 h. The above procedures were completed under anaerobic conditions using an AnaeroPack-Anaero package system (Mitsubishi Gas Chemical, Tokyo, Japan) to absorb O 2 and produce CO 2 . The supernatants were filtered through a 0.22 μ m nylon membrane. To prepare the bacterial solution, a nylon membrane was rotated in sterilized water for 3–5 min. After the concentration of the bacterial solution was adjusted to the bacteria quantity contained in 10 g sediment or 1 shrimp intestine per 2 mL, the original bacterial communities were prepared and named S0 and I0, respectively, and then inoculated in Widdel medium with the extracted crude MCs as the sole carbon and nitrogen source. Based on the detection results of this study and our previous investigation of the maximum environmental exposure concentration of MCs in the sediments of other aquaculture ponds and in the intestines of farmed animals [22], the initial MC concentration of 0.38 mg / L was selected at each enrichment step. The anaerobic culture was performed in a sealed incubator at 120 r / min , 30   ° C , sheltered from light, using an AnaeroPack-Anaero package system. S0 and I0 were cultured for 3 days, and two new bacterial communities were generated, named S1 and I1, respectively. S1 and I1 were inoculated and cultured for another 3 days, and S2 and I2 were generated. After repeated enrichment 6 times, a total of 12 new bacterial communities (S1–S6 and I1–I6) were generated. All samples had three replicates, and re-inoculation was performed every 3 days. The inoculation rate (bacteria subculture to Widdel medium) was 4 % per inoculation. Autoclaved S0 and I0 was used to monitor the non-biological degradation or adsorption of MCs.

5.5. Analysis of MC-Degrading Activity of Enriched Bacterial Community

First, 5 mL enriched bacteria subcultures were filtrated through 0.22 μ m nylon membranes. The bacterial communities collected on the nylon membranes (S1–S6 and I1–I6) were used for subsequent high-throughput sequencing. Original bacterial communities S0 and I0 were also prepared using the same method. The filtrates were used to analyze the final MC concentrations to calculate the MC degradation rates for S0–S5 and I0–I5. S6 and I6 were inoculated and their MC-degrading activity was analyzed using the same method. Autoclaved S0 and I0 were inoculated and the final MC level was analyzed. It was proven that S0 and I0 had no non-biological degradation or adsorption of MCs.
The MC degradation rate was calculated as follows:
V ( % ) = C 1 C 2 C 1 × 100 %
C 1 is the initial concentration of MCs at each enrichment step, and C 2 is the final concentration of MCs at each enrichment step.

5.6. High-Throughput Sequencing and Data Analysis of Bacterial Community

DNA was extracted using the Soil DNA Isolation Kit (OMEGA, Norcross, GA, USA). The 16S rDNA V3-V4 was amplified with the primers 515F 5′-CCTAYGGGRBGCASCAG-3′ and 806R 5′-GGACTACNNGGGTATCTAAT-3′. The 25 μ L PCR system contained 15 μ L Phusion (6) High-Fidelity PCR Master Mix (New England Biolabs), 0.2 μ M primers, and 10 ng template DNA. The PCR reaction conditions were 98   ° C for 1 min, followed by 30 cycles of 98   ° C for 10 s , 50   ° C for 30 s, 72   ° C for 30 s, and extension at 72   ° C for 5 min. The PCR products were purified using an Agencourt AMPure XP Kit (Biomedical Science, Inc., Tokyo, Japan). Deep sequencing was performed on the Illumina NovaSeq PE250 platform at the Novogene Company (Beijing, China).
Data splitting, sequence assembly, data filtration, and chimera removal were performed according to the reported methods [41,42,43]. Sequence analyses were performed using the Uparse software (Uparse v7.0. 1001, http://drive5.com/uparse/, accessed on 3 January 2025) [44]. Sequences with 97 % similarity were assigned to the same OTUs. A representative sequence for each OTU was screened for further annotation. For each representative sequence, the Silva Database (https://www.arb-silva.de, accessed on 3 January 2025) was used based on the Mothur algorithm to annotate taxonomic information [45]. OTU abundance information was normalized using a standard sequence number corresponding to the sample with the fewest sequences. The top 30 taxa of each sample at the genus level were selected to plot the distribution histogram of the relative abundance in Perl through the SVG function. The abundance information of the top 30 taxa of each sample at the genus level was used to draw a heatmap, which was achieved in R through the pheatmap function. Alpha diversity was applied in analyzing the complexity of the species diversity through 6 indices (Observed_species, Shannon, Simpson, ACE indexes, Chao1, and PD_whole_tree). All indices were calculated with QIIME (Version 1.9.1) and displayed with the R software (Version 4.0.3). Principal coordinate analysis (PCoA) was performed using QIIME2 (version 2019.10) and displayed using the ade4 package and ggplot2 package in the R software (Version 4.0.3).

5.7. Isolation and Identification of Anaerobic MC-Degrading Strains from Bacterial Communities S6 and I6

The bacterial community S6/I6 was diluted in a 10-fold gradient, and the diluted solutions were spread on selective Widdel plates with 15 g / L agar. The incubation was conducted at 30   ° C for 7 days under anaerobic and dark conditions. Individual and distinguishable colonies were picked up, inoculated in an LB plate, and purified 4–8 times. All isolates were identified on the basis of their morphological and biochemical characteristics, as well as their 16S rDNA sequences amplified with the primers 27F 5′-AGTTTGATCMTGGCTCAG-3′ and 1492R 5′-GGTTACCTTGTTACGACTT-3′.

5.8. Analysis of MC-Degrading Activity of Anaerobic MC-Degrading Bacterial Strains

The isolated anaerobic MC-degrading bacterial strains were inoculated in Widdel medium with 0.47 mg / L extracted MCs as the sole carbon and nitrogen sources, incubated at 30   ° C under anaerobic and dark conditions for 72 h. The initial bacterial density was 3.55 × 10 6 CFU / mL . The concentration of MCs was detected by the HPLC system as described above, and the MC degradation rate was calculated every 24 h.

5.9. Statistical Analysis

The results are expressed as the mean ± SD ( n = 3 ) . The least significant difference multiple-range test was used to examine whether there were significant differences between 7 groups. A T-test was used to examine whether there were significant differences in the alpha diversity index between S0 and I0 and between S6 and I6. Statistical significance was established at p < 0.05 .

Author Contributions

W.Z. (Data Curation, Methodology, Project Administration); X.B. (Formal Analysis, Methodology, Writing—Original Draft); X.W. (Writing—Original Draft); C.L. (Formal Analysis); D.Z. (Formal Analysis); and W.D. (Conceptualization, Funding Acquisition, Writing—Review and Editing). All authors have read and agreed to the published version of the manuscript.

Funding

This research was funded by the National Natural Science Foundation of China (No. 32172978, No. 31772857), the Natural Science Foundation Grant of Tianjin (22JCYBJC00430), the Tianjin Science and Technology Planning Project (22ZYCGSN00050, 24ZYCGSN0014022ZYCGSN00050, 24ZYCGSN00140), the Fundamental Research Funds of Tianjin Universities (No. 2020ZD06, No. 2021KJ110), and the Gansu Science and Technology Project (No. 24CXNP005, 2023ZZ1NC006).

Data Availability Statement

The datasets generated during and/or analyzed during the current study are available from the corresponding author on reasonable request.

Conflicts of Interest

The authors declare no conflicts of interest related to this study.

References

  1. Roy, L.A.; Davis, D.A.; Whitis, G.N. Pond-to-pond variability in post-larval shrimp, Litopenaeus vannamei, survival and growth in inland low-salinity waters of west Alabama. Aquaculture 2009, 40, 1823–1829. [Google Scholar] [CrossRef]
  2. Zhao, Q.; Xie, F.X.; Zhang, F.F.; Zhou, K.; Sun, H.B.; Zhao, Y.J.; Yang, Q. Analysis of bacterial community functional diversity in late-stage shrimp (Litopenaeus vannamei) ponds using Biolog EcoPlates and PICRUSt2. Aquaculture 2022, 546, 737288. [Google Scholar] [CrossRef]
  3. Santhana, K.V.; Pandey, P.K.; Anand, T.; Bhuvaneswari, R.; Kumar, S. Effect of periphyton (aquamat) on water quality, nitrogen budget, microbial ecology, and growth parameters of Litopenaeus vannamei in a semi-intensive culture system. Aquaculture 2017, 479, 240–249. [Google Scholar] [CrossRef]
  4. Pease, S.K.; Egerton, T.A.; Reece, K.S.; Sanderson, M.P.; Onofrio, M.D.; Yeargan, E. Co-occurrence of marine and freshwater phycotoxins in oysters, and analysis of possible predictors for management. Toxicon 2023, 19, 100166. [Google Scholar] [CrossRef]
  5. Buratti, F.M.; Manganelli, M.; Vichi, S.; Stefanelli, M.; Funari, E. Cyanotoxins: Producing organisms, occurrence, toxicity, mechanism of action and human health toxicological risk evaluation. Arch. Toxicol. 2017, 91, 1049–1130. [Google Scholar] [CrossRef]
  6. Massey, I.Y.; Yang, F.; Ding, Z.; Shu, Y.; Jian, G.; Clara, T. Exposure routes and health effects of microcystins on animals and humans: A mini-review. Toxicon 2018, 151, 156–162. [Google Scholar] [CrossRef] [PubMed]
  7. Jones, A.B. Infant health impacts of freshwater algal blooms: Evidence from an invasive species natural experiment. J. Environ. Econ. Manag. 2019, 96, 36–59. [Google Scholar] [CrossRef]
  8. Miles, C.O.; Strand, D.A.; Rusch, J.C.; Ballot, A.; Haande, S.; Lvberg, K.L.E. Microcystin profiles in European noble crayfish Astacus astacus and water in Lake Steinsfjorden, Norway. Environ. Res. 2024, 242, 117623. [Google Scholar] [CrossRef]
  9. Zimba, P.V.; Camus, A.; Allen, E.H.; Burkholder, J.A.M. Co-occurrence of white shrimp, Litopenaeus vannamei, mortalities and microcystin toxin in a southeastern USA shrimp facility. Aquaculture 2006, 261, 1048–1055. [Google Scholar] [CrossRef]
  10. Shen, R.Y.; Chen, Z.H.; Dong, X.N.; Shen, H.; Zhang, W. Biodegradation kinetics of microcystins-LR crude extract by Lysinibacillus boronitolerans strain CQ5. Ann. Microbiol. 2019, 69, 1259–1266. [Google Scholar] [CrossRef]
  11. Santosa, A.; Rachid, C.; Pacheco, A.B.; Magalhes, V. Biotic and abiotic factors affect microcystin-LR concentrations in water/sediment interface. Microbiol. Res. 2020, 236, 126452. [Google Scholar] [CrossRef]
  12. Bukowska, A.; Kaliński, T.; Chróst, R.J. Degradation of microcystins by water and bottom sediment bacterial communities from a eutrophic freshwater lake. Aquat. Microb. Ecol. 2018, 82, 129–144. [Google Scholar] [CrossRef]
  13. Massey, I.Y.; Yang, F. A mini review on microcystins and bacterial degradation. Toxins 2020, 12, 268. [Google Scholar] [CrossRef] [PubMed]
  14. Qin, L.; Zhang, X.X.; Chen, X.G.; Wang, K.; Shen, Y.; Li, D. Isolation of a novel microcystin-degrading bacterium and the evolutionary origin of mlr gene cluster. Toxins 2019, 11, 269. [Google Scholar] [CrossRef]
  15. Yang, F.; Huang, F.; Feng, H.; Wei, J.; Pu, Y. A complete route for biodegradation of potentially carcinogenic cyanotoxin microcystin-LR in a novel indigenous bacterium. Water Res. 2020, 174, 115638. [Google Scholar] [CrossRef]
  16. Alamri, S. Biodegradation of microcystin-RR by Bacillus flexus isolated from a Saudi freshwater lake. Saudi. J. Biol. Sci. 2012, 19, 435–440. [Google Scholar] [CrossRef] [PubMed]
  17. Jia, L.; Cheng, X.; Fang, L.; Huang, X. Flocculation and lysis of Microcystis aeruginosa by Paebubacillus sp. A9 and inhibition of microcystin release. Environ. Technol. Innov. 2023, 31, 103512. [Google Scholar] [CrossRef]
  18. Silva, F.; Lopes, D.; Hector, R.; Nascimento, M.; Miguel, T.; Kuroda, E.; Nóbrega, G.; Harada, K.; Hirooka, E. Microcystin-detoxifying recombinant Saccharomyces cerevisiae expressing the mlrA gene from Sphingosinicella microcystinivorans B9. Microorganisms 2023, 11, 575. [Google Scholar] [CrossRef]
  19. Zhu, F.; Han, Z.; Duan, J.; Shi, X.; Wang, T.; Sheng, G.; Wang, S.; Yuan, X. A novel pathway for the anaerobic biotransformation of microcystin- LR using enrichment cultures. Environ. Pollut. 2019, 247, 1064–1070. [Google Scholar] [CrossRef]
  20. Huang, F.; Feng, H.; Li, X.; Yi, X.; Yang, F. Anaerobic degradation of microcystin-LR by an indigenous bacterial Enterobacter sp. YF3. J. Toxicol. Environ. Health 2019, 82, 1120–1128. [Google Scholar] [CrossRef]
  21. Zhang, Y.; Li, Z.; Tian, X.; Xu, P.; Sun, K.; Ren, N. Acute toxic effects of microcystin-LR on crayfish (Procambarus clarkii): Insights from antioxidant system, histopathology and intestinal flora. Environ. Sci. Pollut. Res. 2023, 30, 56608–56619. [Google Scholar] [CrossRef] [PubMed]
  22. Bi, X.; Dai, W.; Wang, X.; Dong, S.; Zhang, S.; Zhang, D. Microcystins distribution, bioaccumulation, and Microcystis genotype succession in a fish culture pond. Sci. Total Environ. 2019, 688, 380–388. [Google Scholar] [CrossRef] [PubMed]
  23. Babica, P.; Kohoutek, J.; Bláha, L.; Adamovský, O.; Maršálek, B. Evaluation of extraction approaches linked to ELISA and HPLC for analyses of microcystin-LR, -RR and -YR in freshwater sediments with different organic material contents. Anal. Bioanal. Chem. 2006, 385, 1545–1551. [Google Scholar] [CrossRef]
  24. Maerki, M.; Muller, B.; Dinkel, C.; Wehrli, B. Mineralization pathways in lake sediments with different oxygen and organic carbon supply. Limnol. Oceanogr. 2009, 54, 428–438. [Google Scholar] [CrossRef]
  25. Ding, Q.; Song, X.; Yuan, M.; Sun, R.; Zhang, J.; Yin, L. Multiple pathways for the anaerobic biodegradation of microcystin-LR in the enriched microbial communities from Lake Taihu. Environ. Pollut. 2022, 297, 118787. [Google Scholar] [CrossRef] [PubMed]
  26. Kurniawinata, M.; Sukenda, S.; Wahjuningrum, D.; Widanarni, W. Bacterial diversity and community composition in the gut and rearing water of pacific white shrimp Penaeus vannamei during an outbreak of white feces disease. Aquaculture 2022, 559, 738431. [Google Scholar] [CrossRef]
  27. Jia, J.; Luo, W.; Lu, Y.; Giesy, J. Bioaccumulation of microcystins (MCs) in four fish species from Lake Taihu, China: Assessment of risks to humans. Sci. Total Environ. 2014, 487, 224–232. [Google Scholar] [CrossRef]
  28. Cheng, C.; Steinman, A.; Zhang, K.; Lin, Q.; Xue, Q.; Wang, X. Risk assessment and identification of factors influencing the historical concentrations of microcystin in Lake Taihu, China. J. Environ. Sci. 2023, 127, 1–14. [Google Scholar] [CrossRef]
  29. Lukhele, T.; Msagati, T. Evaluating the microcystin-LR-degrading potential of bacteria growing in extreme and polluted environments. Arch. Microbiol. 2023, 205, 205–213. [Google Scholar] [CrossRef]
  30. Zhao, X.; Liu, Y.; Guo, Y.; Xu, C.; Chen, L.; Codd, G.; Chen, J.; Wang, Y.; Wang, P.; Yang, L.; et al. Meta-analysis reveals cyanotoxins risk across African inland waters. J. Hazard. Mater. 2023, 451, 131160. [Google Scholar] [CrossRef]
  31. Mutoti, M.; Edokpayi, J.; Mutileni, N.; Durowoju, O.; Munyai, F. Cyanotoxins in groundwater; occurrence, potential sources, health impacts and knowledge gap for public health. Toxicon 2023, 226, 107077. [Google Scholar] [CrossRef] [PubMed]
  32. Zhang, R.; Deng, Z.; Wu, C.; Jin, M.; Hu, M. Characteristic of the temporal distribution of dissolved microcystins and its relationships with environmental factors in a typical fresh water shrimp aquaculture pond in south Taihu area. Freshw. Fish. 2018, 48, 43–49. (In Chinese) [Google Scholar]
  33. Affan, A.; Khomayis, H.; Al-Harbi, S.; Haque, M.; Khan, S. Effect of environmental factors on cyanobacterial abundance and cyanotoxins production in natural and drinking water, Bangladesh. Pak. J. Biol. Sci. 2015, 18, 50–58. [Google Scholar] [CrossRef]
  34. Ding, Q.; Liu, K.; Song, Z.; Sun, R.; Zhang, J.; Yin, L.; Pu, Y. Effects of microcystin-LR on metabolic functions and structure succession of sediment bacterial community under anaerobic conditions. Toxins 2020, 12, 183. [Google Scholar] [CrossRef]
  35. Jia, J.; Chen, Q.; Lauridsen, T. A systematic investigation into the environmental fate of microcystins and the potential risk: Study in Lake Taihu. Toxins 2016, 8, 170. [Google Scholar] [CrossRef] [PubMed]
  36. Chen, X.; Yang, X.; Yang, L.; Xiao, B.; Wu, X.; Wang, J. An effective pathway for the removal of microcystin LR via anoxic biodegradation in lake sediments. Water Res. 2010, 44, 1884–1892. [Google Scholar] [CrossRef]
  37. Holst, T.; Jørgensen, N.; Jørgensen, C.; Johansen, A. Degradation of microcystin in sediments at oxic and anoxic, denitrifying conditions. Water Res. 2003, 38, 4748–4760. [Google Scholar] [CrossRef]
  38. Hong, G.; Ma, S.; Wang, J.; Zhang, J. Isolation and identification of an efficient algicidal bacteria strain and algicidal characteristics on Microcystis aeruginosa. China Environ. Sci. 2018, 38, 4269–4275. (In Chinese) [Google Scholar]
  39. Wei, J.; Xie, X.; Huang, F.; Xiang, L.; Yang, F. Simultaneous Microcystis algicidal and microcystin synthesis inhibition by a red pigment prodigiosin. Environ. Pollut. 2020, 256, 113444. [Google Scholar] [CrossRef]
  40. Li, Z.; Lin, S.; Liu, X.; Tan, J.; Pan, J.; Yang, H. A freshwater bacterial strain, Shewanella sp. Lzh-2, isolated from Lake Taihu and its two algicidal active substances, hexahydropyrrolo[1,2-a] pyrazine-1,4-dione and 2, 3-indolinedione. Appl. Microbiol. Biotechnol. 2014, 98, 4737–4748. [Google Scholar] [CrossRef]
  41. Edgar, R.; Haas, B.; Clemente, J.; Quince, C.; Knight, R. UCHIME improves sensitivity and speed of chimera detection. Bioinformatics 2011, 27, 2194–2200. [Google Scholar] [CrossRef] [PubMed]
  42. Magoc, T.; Salzberg, S. FLASH: Fast length adjustment of short reads to improve genome assemblies. Bioinformatics 2011, 27, 2957–2963. [Google Scholar] [CrossRef] [PubMed]
  43. Bokulich, N.; Subramanian, S.; Faith, J.; Gevers, D.; Gordon, J.; Knight, R.; Mills, D.; Caporaso, J. Quality-filtering vastly improves diversity estimates from Illumina amplicon sequencing. Nat. Methods 2012, 10, 57–59. [Google Scholar] [CrossRef] [PubMed]
  44. Edgar, R. UPARSE: Highly accurate OTU sequences from microbial amplicon reads. Nat. Methods 2013, 10, 996–998. [Google Scholar] [CrossRef]
  45. Quast, C.; Pruesse, E.; Yilmaz, P.; Gerken, J.; Schweer, T.; Yarza, P.; Peplies, J.; Glöckner, F. The SILVA ribosomal RNA gene database project: Improved data processing and web-based tools. Nucleic Acids Res. 2012, 27, D590–D596. [Google Scholar] [CrossRef]
Figure 1. Relative abundances of the top 30 dominant genera in the anaerobic microcystin-degrading bacterial communities from pond sediment.
Water 17 00774 g001
Figure 2. Relative abundances of the top 30 dominant genera in the anaerobic microcystin-degrading bacterial communities from the shrimp intestine.
Water 17 00774 g002
Figure 3. The changes in the relative abundances of the top five genera in the anaerobic microcystin-degrading bacterial communities from pond sediment and shrimp intestines (A) Shewanella, (B) Fusibacter, (C) Pseudarcobacter, (D) Sulfurospirillum, and (E) Desulfovibrio. Letters above the bars show statistically significant differences according to the LSD test ( p < 0.05 ).
Water 17 00774 g003
Figure 4. Heatmap of the 30 most abundant bacterial genera in the anaerobic microcystin-degrading bacterial communities from pond sediment.
Water 17 00774 g004
Figure 5. Heatmap of the 30 most abundant bacterial genera in the anaerobic microcystin-degrading bacterial communities from the shrimp intestine.
Water 17 00774 g005
Figure 6. The beta diversity of the anaerobic microcystin-degrading bacterial communities from pond sediment and shrimp intestines ( n = 3 ). The square represents the anaerobic microcystin-degrading bacterial community from pond sediment, and the circle represents the anaerobic microcystin-degrading bacterial community from the shrimp intestine. Each color represents a different enrichment time.
Water 17 00774 g006
Table 1. Microcystins accumulated in pond and shrimp.
MC
Isomer
Pond Water
(μg/L)
Pond Sediment
(μg/g)
Shrimp Hepatopancreas
(μg/g)
Shrimp Muscle
(μg/g)
MC-RR 3.70 ± 1.49 0.27 ± 0.01 0.66 ± 0.05 0.18 ± 0.01
MC-LR----
MC-YR----
Note: - indicates not detected.
Table 2. The alpha diversity indices of the anaerobic microcystin-degrading bacterial community in pond sediment.
Observed_SPECIESShannonSimpsonChao1ACEPD_Whole_Tree
S0 2525.33 ± 102.05  a 8.72 ± 0.07  a 0.99 ± 0.00  a 3000.67 ± 258.19  a 3002.11 ± 208.54  a 217.06 ± 16.16  a
S1 604.33 ± 49.44  b 3.69 ± 0.13  c 0.80 ± 0.03  c 928.02 ± 77.24  b 1005.37 ± 108.30  b 73.70 ± 4.56  b
S2 476.67 ± 49.34  c 3.97 ± 0.27  b 0.86 ± 0.05  b 717.55 ± 89.47  c 815.89 ± 63.05  c 62.38 ± 3.55  b
S3 110.67 ± 4.04  d 3.13 ± 0.08  d 0.85 ± 0.01  b 162.41 ± 3.88  d 190.31 ± 6.62  d 18.93 ± 2.61  c
S4 62.67 ± 8.02  d 2.90 ± 0.07  d 0.83 ± 0.01  bc 84.25 ± 1.78  d 91.27 ± 12.72  d 15.54 ± 5.91  c
S5 74.33 ± 12.50  d 3.08 ± 0.11  d 0.85 ± 0.01  b 116.22 ± 22.09  d 110.89 ± 16.28  d 14.67 ± 3.90  c
S6 72.00 ± 21.07  d 3.04 ± 0.12  d 0.85 ± 0.01  b 103.77 ± 22.20  d 109.03 ± 37.46  d 19.57 ± 4.78  c
Note: Values within columns sharing the same letters are not significantly different ( p > 0.05 ) , while those with different letters are significantly different ( p < 0.05 ).
Table 3. The alpha diversity indices of the anaerobic microcystin-degrading bacterial community from the shrimp intestine.
Observed_SpeciesShannonSimpsonChao1ACEPD_Whole_Tree
I0 360.00 ± 145.92  a 4.78 ± 1.64  a 0.87 ± 0.10  a 405.92 ± 173.30  a 410.48 ± 191.97  a 50.12 ± 16.30  a
I1 273.33 ± 74.97  a 2.62 ± 0.04  bc 0.67 ± 0.09  b 358.80 ± 82.82  ab 371.88 ± 82.42  ab 39.80 ± 13.39  a
I2 218.00 ± 43.28  a 2.12 ± 0.45  bc 0.57 ± 0.06  b 248.67 ± 32.05  b 253.81 ± 31.00  b 35.25 ± 15.79  ab
I3 44.00 ± 1.73  b 1.73 ± 0.11  c 0.58 ± 0.03   b 87.81 ± 64.27  c 61.35 ± 8.86  c 9.98 ± 2.35   b
I4 50.33 ± 4.62  b 2.87 ± 0.04  b 0.81 ± 0.02   a 63.98 ± 13.69  c 70.66 ± 15.30  c 15.22 ± 10.95   b
I5 48.33 ± 4.51  b 2.81 ± 0.12  bc 0.81 ± 0.01  a 63.04 ± 16.82  c 66.34 ± 19.80  c 7.55 ± 0.92  b
I6 82.67 ± 21.78  b 3.03 ± 0.11  b 0.84 ± 0.02  a 118.81 ± 42.74  bc 124.65 ± 41.40  bc 19.71 ± 6.59  b
Note: Values within columns sharing the same letters are not significantly different ( p > 0.05 ) , while those with different letters are significantly different ( p < 0.05 ).
Table 4. Degradation performance of anaerobic microcystin-degrading bacterial communities enriched in pond sediment and shrimp intestine.
Initial
Concentration
(mg/L)
SamplePond SedimentSampleShrimp Intestine
Final Concentration
(mg/L)
Degradation
Rate (%)
Final Concentration
(mg/L)
Degradation
Rate (%)
S0 0.24 ± 0.01  e 37.17 ± 3.22  eI0 0.25 ± 0.01  e 33.66 ± 2.79  e
S1 0.20 ± 0.01  d 48.40 ± 3.65  dI1 0.22 ± 0.02  c 43.49 ± 6.17  c
S2 0.18 ± 0.01  d 52.26 ± 3.22  dI2 0.20 ± 0.01  c 46.65 ± 3.22  c
0.38S3 0.12 ± 0.01  bc 67.36 ± 1.82  bcI3 0.10 ± 0.04  ab 72.97 ± 11.36  ab
S4 0.14 ± 0.01  c 62.09 ± 3.65  cI4 0.14 ± 0.01  b 63.85 ± 1.61  b
S5 0.10 ± 0.02  ab 72.62 ± 7.37  abI5 0.08 ± 0.01  a 78.24 ± 3.22  a
S6 0.10 ± 0.02  a 74.87 ± 4.01  aS6 0.07 ± 0.02  a 81.43 ± 4.22  a
Note: Values within columns sharing the same letters are not significantly different ( p > 0.05 ), while those with different letters are significantly different ( p < 0.05 ).
Table 5. Biochemical characterization of isolated bacterial strains.
ItemI6-1/S6-1I6-2/S6-2I6-3
Gram stain+
Glucose++
Arabinose
Mannose++
Mannitol++
Maltose++
Xylose+
Sucrose++
Lactose+
Chlorhexidine+
Nitrate reduction
Indole test
Voges–Proskauer test
Methyl red test+
Note: + indicates that the reaction was positive; − indicates that the reaction was negative.
Table 6. Microcystin degradation rates of the isolated bacterial strains (%).
Bacterial Strain24 h48 h72 h
S. marcescens26.3166.1587.72
B. flexus35.9064.65100
S. algae0.360.520.76
Disclaimer/Publisher’s Note: The statements, opinions and data contained in all publications are solely those of the individual author(s) and contributor(s) and not of MDPI and/or the editor(s). MDPI and/or the editor(s) disclaim responsibility for any injury to people or property resulting from any ideas, methods, instructions or products referred to in the content.

