Article

Investigating Groundwater–Surface Water Interactions and Transformations in a Typical Dry–Hot Valley Through Environmental Isotopes Analysis

1
Kunming General Survey of Natural Resources Center, China Geological Survey, Kunming 650100, China
2
Technology Innovation Center for Natural Carbon Sink, Ministry of Natural Resources, Kunming 650100, China
3
State Key Laboratory of Geomicrobiology and Environmental Changes, China University of Geosciences, Beijing 100083, China
4
Research Center of Applied Geology of China Geological Survey, Chengdu 610036, China
*
Author to whom correspondence should be addressed.
Water 2025, 17(6), 775; https://doi.org/10.3390/w17060775
Submission received: 4 February 2025 / Revised: 23 February 2025 / Accepted: 5 March 2025 / Published: 7 March 2025

Abstract

:
This study investigates the hydrological processes and water body transformation mechanisms in the Yuanmou dry–hot valley, focusing on precipitation, well water, spring water, river water, and reservoir water, during both wet and dry seasons. The spatiotemporal characteristics and significance of the hydrogen and oxygen stable isotopes across these water bodies were analyzed. Key findings included the following: (i) Seasonal variations in precipitation, river water, and shallow groundwater were minimal, and were primarily driven by differences in water vapor sources and transport distances during wet and dry seasons. The seasonal effects of mid-deep groundwater and reservoir water were influenced by leakage recharge from deep aquifers and temperature variations, respectively. (ii) The groundwater line-conditioned excess (lc-excess) deviated significantly from the Local Meteoric Water Line, indicating that precipitation recharge occurred primarily through slow infiltration piston flow with significant isotopic fractionation. (iii) River water was recharged by precipitation, deep groundwater, and spring water; well water by precipitation and lateral groundwater inflow; spring water by deep groundwater; and reservoir water by precipitation, groundwater, and water transfer, with strong evaporation effects. (iv) Using a binary isotope mass balance model, the recharge ratios of precipitation and groundwater to surface water were calculated to be 40% and 60%, respectively. Additionally, during the wet season, the proportion of groundwater recharge to river water increased. This study provides valuable insights into hydrological cycle processes in dry–hot valleys and offers a scientific basis for the sustainable development and management of water resources in arid regions.

1. Introduction

Water is a fundamental component of regional life, environmental processes, and human activities [1,2,3]. The water cycle drives material and energy exchange in nature [4,5,6]. However, climate change and human activities have profoundly altered the physical–chemical–biological processes within regional water cycles [7,8,9,10], resulting in various ecological changes. A comprehensive understanding of regional hydrological processes is essential for the sustainable management of water resources in arid regions [11,12,13]. Hydrogen and oxygen stable isotopes, essential tracers in natural water bodies, exhibit differences across water sources due to isotope fractionation during phase transitions and mixing processes [14,15]. These isotopes are highly sensitive to environmental changes and provide valuable records of water cycle evolution [16,17,18,19,20,21,22,23]. Stable hydrogen and oxygen isotopes have been widely used to investigate hydrological processes, including groundwater recharge estimation [24], river water contributions to groundwater [25], surface water-groundwater balance assessment [26], and water source tracing with evaporation analysis [27]. These studies provide valuable insights into regional water cycles and their responses to environmental changes [22,23,24,25].
The dry–hot valley is a unique ecological landscape in southwestern China and one of the world’s three major arid regions [28,29]. It features an arid and hot climate with low, uneven rainfall, where annual evaporation exceeds precipitation by approximately six times, creating a severe water–heat imbalance [30,31,32,33]. In China, dry–hot valleys are primarily found in Yunnan and Sichuan, with the densest concentrations in the basins of the Jinsha, Lancang, Nujiang, and Yuanjiang rivers [31]. Among them, the Jinsha River dry–hot valley stands out as an extreme example, recognized as one of the most ecologically fragile and soil-eroded regions in the upper Yangtze River [34,35,36,37,38]. The Yuanmou dry–hot valley, a representative section of the Jinsha River dry–hot valley, is characterized by high evaporation, low rainfall, distinct wet and dry seasons, sparse vegetation, severe soil erosion, and notable vertical climate variation [39,40,41]. Facing critical environmental challenges, including desertification, soil erosion, water scarcity, and frequent natural disasters [42], it remains one of the most ecologically fragile and degraded regions in southwestern China, as well as a key area for desertification control.
In recent years, land use and the ecological environment in the study area have undergone gradual changes, altering the interaction between surface water and groundwater. Rapid economic and societal development, coupled with intensified climate change impacts, have exacerbated water-related challenges such as drought, water scarcity, frequent disasters, ecological damage, and water pollution. The Yuanmou dry–hot valley, home to 70% of Yuanmou County’s population, is approaching its environmental carrying capacity. Moreover, uneven spatial–temporal distribution of precipitation, complex topography, and difficulties in water resource utilization further complicate water formation and management. The region’s developed plateau-specialized agricultural industry has intensified the existing water–heat and light–fertilizer imbalances. Overcoming the water resource bottleneck is critical for regional development. Despite these challenges, previous studies on the conversion relationships between surface water and groundwater in the dry–hot valleys and Yuanmou region remain limited. This study employs stable isotopes to examine the conversion relationships between surface water and groundwater in typical dry–hot valley areas, investigates the circulation patterns of precipitation, surface water, and groundwater, and provides a basis for the sustainable management of water resources in these regions. Additionally, it offers essential data support for economic and social development, as well as ecological protection, within the upper Yangtze River Economic Belt.

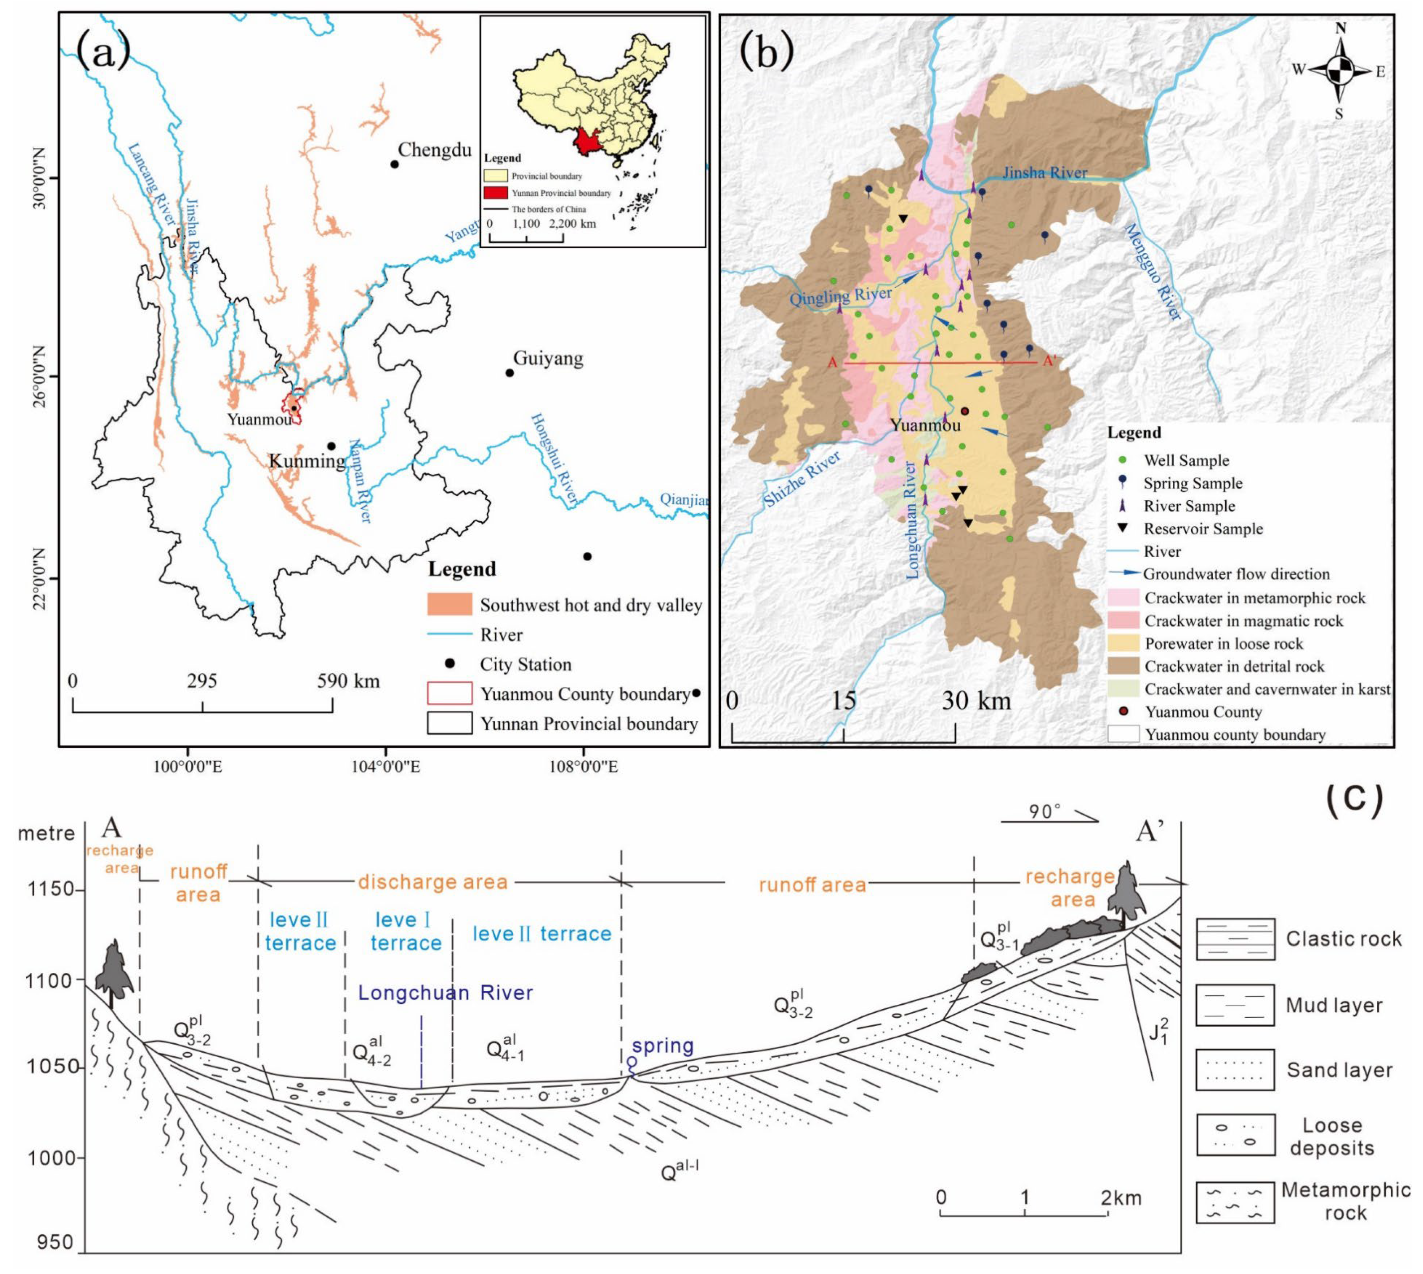
2. Overview of the Study Area

The Yuanmou Dry Hot Valley is situated in Chuxiong Yi Autonomous Prefecture, northern central Yunnan Plateau, along the middle and lower reaches of the Longchuan River, a primary tributary of the Jinsha River. The region has a dry climate with abundant solar radiation and thermal resources, and the basin remains frost-free year-round, earning it the title of a “natural greenhouse”. It is one of Yunnan’s largest production areas for winter and early spring vegetables. The terrain slopes from high in the southeast to low in the northwest, with the highest elevation reaching 2835.9 m and the lowest at 898 m. The Dry Hot Valley mainly occupies valley areas below 1350 m in elevation. The study area has a subtropical dry monsoon climate, with an average annual temperature of 21.9 °C and 2677 h of sunshine, resulting in a sunshine rate above 60%. The region has distinct dry and rainy seasons, a marked monsoon climate, and prominent “three-dimensional climate” features. The main tributaries of the Jinsha River in Yuanmou County, from west to east, include the Qingling, Shizhe, and Longchuan rivers. All these rivers flow from south to north, forming a dendritic and parallel water system.
The study area lies in the eastern segment of the Yuanmou Uplift, part of the Yangtze Platform-Sichuan-Yunnan Anticline-Central Yunnan Platform Depression. The basin’s bedrock consists mainly of metamorphic rocks from the Late Archaean to Early Proterozoic, along with shallowly metamorphosed sedimentary and volcanic-sedimentary rocks from the Middle to Late Proterozoic. The exposed strata are incomplete and mainly consist of river-lake facies sediments deposited continuously during the basin’s faulting and subsidence, from the oldest to youngest, including the Lower Proterozoic, Sinian, Triassic, Jurassic, Cretaceous, and Quaternary, with the Jurassic, Cretaceous, and Quaternary strata being most extensively exposed. Based on groundwater occurrence conditions, hydrologic properties, and hydraulic characteristics, the area can be divided into three categories: pore water in loose rock, crack water in bedrock (including crack water in detrital, metamorphic, and magmatic rock), and crack-cavern water in karst (Figure 1a–c).

3. Materials and Methods

3.1. Sample Collection and Testing

Water samples were collected from major wells, springs, rivers, and reservoirs in the Yuanmou region during the wet season (July 2022) and the dry season (November 2022). During the wet season, a total of 65 water samples were collected, including 1 atmospheric precipitation sample, 38 well samples, 9 spring samples, 13 river samples, and 4 reservoir samples. In the dry season, 55 water samples were collected, including 33 well samples, 7 spring samples, 12 river samples, and 3 reservoir samples. Figure 1a,b showed the spatial distribution of the sampling sites. The well water samples were primarily from dug wells or boreholes used for domestic and agricultural purposes, with water table depths ranging from 0.25 to 84.8 m. Spring samples were collected from descending springs, which experienced a significant reduction in flow due to rising water demand. These springs typically had flow rates below 1 L/s. River samples were primarily collected from the main stream of the Longchuan River, the middle reaches of the Jinsha River, the Qingling River, and seasonal streams. Reservoir samples were collected from medium-sized reservoirs that supply water to the main towns of Yuanmou County.
For well water sampling, pump for at least 30 min to eliminate stagnant water. Sampling should only proceed once the water has stabilized. For spring, river, and reservoir water, samples should be taken from flowing water, avoiding turbulent zones. Before collection, rinse the sampling bottle at least three times with the water to be sampled. Water samples were collected in colorless plastic bottles and stored in a refrigerator during transportation (4 °C). To minimize seasonal sampling differences, samples from both wet and dry periods were collected over a 5-day window, along with water level measurements. δD and δ18O measurements were conducted at the Southwest China Supervision and Inspection Center of Mineral Resources, Ministry of Natural Resources, using an L2130i water isotope analyzer (Picarro. Inc, USA). During the analysis of water samples, standard materials were inserted for quality control, with parallel sample analysis conducted at a proportion of no less than 10%. The standard materials used included international standards V-SMOW, GISP, and SLAP2 (IAEA, Vienna). In the analytical process, quality controls were ensured by employing at least three types of standard materials and conducting replicate analyses. The correlation coefficients of the calibration curves for δ18O and δD of the standard materials were all greater than 0.999. The δD, δ18O values in the samples are expressed as isotope ratios (Equation (1)).
δ = R s a m p l e R s t a n d a r d 1 × 1000 .
Here, Rsample represents the isotope ratio of the sample, and Rstandard represents the isotope ratio of the standard material. The precision of δD is better than 1‰, δ18O is better than 0.2‰.

3.2. Analytical Methods

The simulation of the water vapor source in Yuanmou was traced using the backward trajectory model (HYSPLIT Version 4, NOAA), simulating moisture transport during precipitation sample collection in 2010, 2011, and 2022. Air trajectories were tracked from three altitudes (2000 m, 3000 m, and 4000 m) at Yuanmou’s Huangguayuan Town (101.8635° N, 25.8216° E) over a 72 h period.
The differences in δD and δ18O values, were used to determine the transformation relationships and ratios of different water bodies based on the principle of isotopic mass balance [26]. To classify into n types of water sources, n − 1 tracers are required. The equation for estimating the mixing ratios of end members using a ternary linear mixing model is
δm = f1 · δ1 + f2 · δ2 + f3 · δ3,
βm = f1 · β1 + f2 · β2 + f3 · β3,
f1 + f2 + f3 = 1,
where δm and βm are the δD and δ18O values of the mixed water body, δ1, δ2, δ3 and β1, β2, β3 are the δD and δ18O values of the different recharge sources, and f1, f2, f3 are the conversion factors.

4. Results

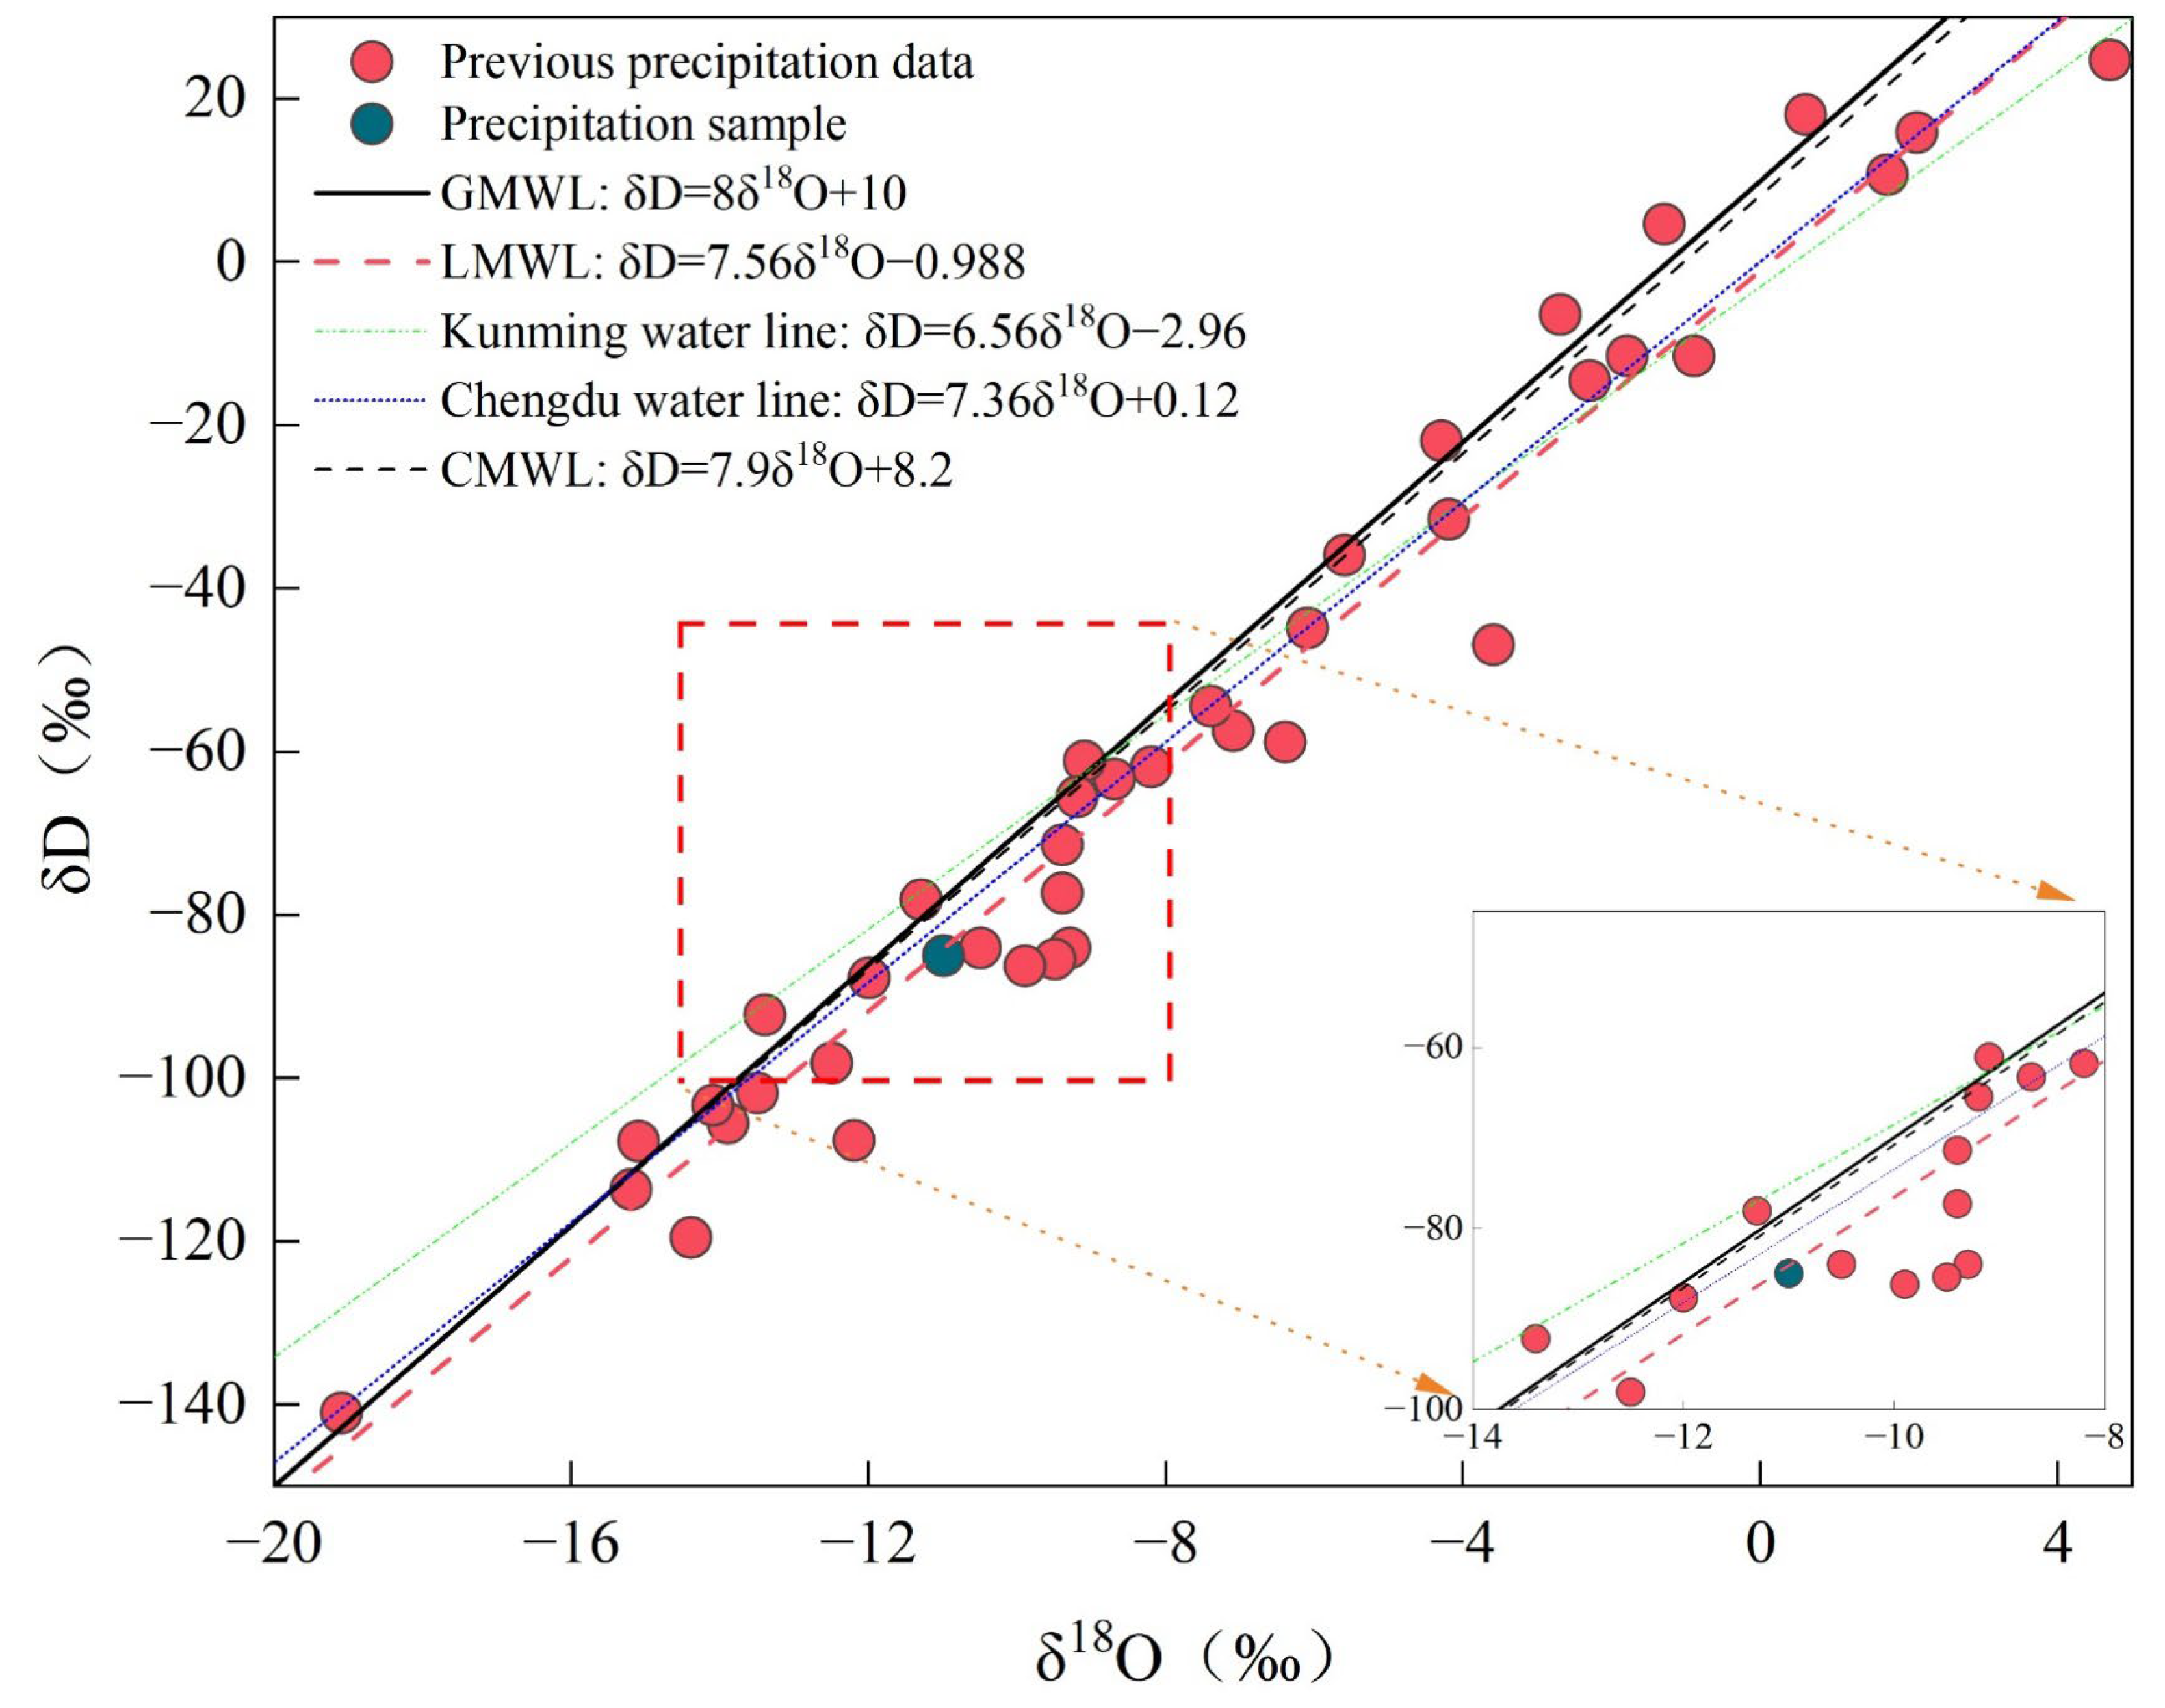
4.1. Characteristics of Hydrogen and Oxygen Stable Isotopes in Atmospheric Precipitation

Atmospheric precipitation is a primary source of recharge for both surface water and groundwater systems, and its isotopic composition is essential for understanding the isotopic characteristics and migration processes of surface water and groundwater [43]. As only one isotopic sample of precipitation was collected during the wet season of 2022, the hydrogen and oxygen isotopic characteristics of atmospheric precipitation in this study area were analyzed alongside previous research. Luo Fangfang collected precipitation samples from each event in Yuanmou County between June 2010 and October 2011, totaling 39 samples. The δD and δ18O values ranged from −105.66‰ to 12.18‰ and from −15.04‰ to 2.18‰, respectively. The fitting resulted in the following Yuanmou precipitation line equation: δD = 7.56δ18O − 0.988 (R2 = 0.984, n = 39) [44]. The δD and δ18O values of the precipitation collected during the 2022 wet season were −85‰ and −11‰, respectively. These values lay within the depleted region of the Yuanmou atmospheric precipitation δD and δ18O values (close to the lower quartile) and closely aligned with the fitted Yuanmou precipitation line (Figure 2). It suggests that the precipitation samples accurately reflect the local climate conditions and water cycle characteristics.
The δ18O values of atmospheric precipitation in Yuanmou ranged from −20.6‰ to −3.6‰ during the wet season and from −13.8‰ to 4.7‰ during the dry season. Atmospheric precipitation in the wet season was generally more depleted in δD and δ18O than in the dry season, showing greater variation. The stable isotopic composition of atmospheric precipitation was influenced by factors such as the water vapor source, its transport, and the local climate [45,46]. The opposite-season effect, where precipitation isotopes were more depleted in the wet season than in the dry season, aligned with isotopic patterns observed in cities such as Kunming, Guiyang, and Chengdu, but contrasts with those from the Tibetan Plateau and northwest regions [47].
In general, the wet season in the southwest region was primarily influenced by warm, moist air from the oceanic monsoon. As water vapor moves inland, precipitation depleted heavy isotopes in the residual water vapor, leading to lower δD and δ18O values. In contrast, the dry season was influenced more by continental air masses, with lower precipitation and stronger evaporation, which favored the fractionation of hydrogen and oxygen isotopes, enriching the heavy isotopes. Wei et al. [48] also noted that the opposite-season effect was common in precipitation from monsoon regions at mid-to-low latitudes and was linked to water vapor sources and evaporation levels during the wet and dry seasons. Therefore, the absence of seasonal effects was closely tied to factors such as water vapor sources, precipitation, and evaporation. The greater variability observed in the wet season compared to the dry season was linked to the complex oceanic water vapor sources during the wet season.
Craig [49] and Zheng et al. [50] proposed the Global Meteoric Water Line (GMWL: δD = 8δ18O + 10) and the China Meteoric Water Line (CMWL: δD = 7.74δ18O + 6.48). The Local Meteoric Water Line (LWML) of Yuanmou had a slightly smaller slope and a much smaller intercept compared to the GMWL and CMWL. Furthermore, all Yuanmou precipitation data points lay below the GMWL and CMWL (Figure 2), suggesting that secondary evaporation influences the atmospheric precipitation process, causing significant hydrogen and oxygen isotope fractionation and relative enrichment of heavy isotopes. Additionally, the slope of the precipitation line represented the fractionation rate between δD and δ18O, while the intercept reflected the deviation of δD from the equilibrium state [15]. The slope of the precipitation line in the study area was similar to that of the CMWL, likely due to its proximity to the water vapor source region, where the water vapor undergoes minimal dynamic fractionation during transport. The lower intercept of the precipitation line was likely due to the dry climate in the study area, where evaporation greatly exceeded precipitation, resulting in the influence of local evaporation.
Zhu et al. [47] analyzed the monitoring data from the Kunming and Chengdu stations of the Global Network for Isotopes in Precipitation (GNIP). The precipitation equation for the Kunming station is δD = 6.56δ18O − 2.96 (R2 = 0.91), while for the Chengdu station, it is δD = 7.36δ18O + 0.12 (R2 = 0.93). Figure 2 showed that the LMWL was nearly parallel to that of Chengdu, with a similar intercept, but deviates from the Kunming precipitation line. It suggests that the Yuanmou study area may be influenced by atmospheric circulation and water vapor sources similar to those of Chengdu, in contrast to Kunming. It is hypothesized that precipitation in Chengdu and Yuanmou originates from water vapor from the southwest and South China Sea pathways, while precipitation in Kunming is likely primarily sourced from the southeast pathway.

4.2. Characteristics of Hydrogen and Oxygen Stable Isotopes in Surface Water

Table 1 presented the relationship between δD and δ18O for surface water (river and reservoir water) during the wet season (July) and the dry season (November). For river water, δD values in the wet season ranged from −103‰ to −79‰ (average: −89.4‰), and in the dry season, they ranged from −107‰ to −74‰ (average: −87.7‰). δ18O values during the wet season ranged from −13.9‰ to −9.9‰ (average: −11.6‰), while during the dry season, they ranged from −14.7‰ to −8.9‰ (average: −11.5‰). For reservoir water, δD values in the wet season ranged from −76‰ to −69‰ (average: −71.5‰), and in the dry season, they ranged from −88‰ to −71‰ (average: −78.7‰). δ18O values during the wet season ranged from −9.5‰ to −8.1‰ (average: −8.6‰), while during the dry season, they ranged from −11.3‰ to −8.4‰ (average: −9.6‰).
The δD and δ18O values of surface water during the wet and dry seasons exhibited the following characteristics: (1) The δD and δ18O values during both the wet and dry seasons fell within the range observed for Yuanmou precipitation, suggesting that atmospheric precipitation was the primary source of recharge for surface water. Isotopic fluctuations in surface water were smaller than in precipitation, due to factors such as evaporation, mixing, and water vapor recycling, which reduced the amplitude of isotopic changes. (2) The δD and δ18O values for river water were similar between the wet and dry seasons, with slight enrichment in the dry season compared to the wet season. This reflected an opposite-season effect consistent with atmospheric precipitation, suggesting that evaporation influenced interannual isotopic variations in rivers of dry hot valleys. In contrast, the isotopic values for reservoir water were significantly more depleted during the dry season than in the wet season, which is consistent with findings from other regions [26,51]. The differences between the wet and dry seasons reflected the influence of seasonal and temperature factors on the isotopic values of surface water. (3) The δD and δ18O values for river water were lower than those for reservoir water during both the wet and dry seasons, which may be linked to stronger evaporation in reservoirs, leading to significant isotopic fractionation.
The average δD values during the wet season for the main rivers—Longchuan, Qingling, Jinsha, and seasonal streams were −87.4‰, −88‰, −102.5‰, and −84.5‰, respectively. The average δD values during the dry season were −84‰, −84‰, −107‰, and −83‰, respectively. Although no water samples were collected from Shizhe River, a dug well with a 4.55 m diameter was sampled along the river, reflecting its isotopic composition. The δD values during the wet and dry seasons were −90‰ and −87‰, respectively. The isotopic values of rivers in the study area followed this order: Jinsha River < Shizhe River < Qingling River/Longchuan River < seasonal streams. This was likely due to the Jinsha River being closer to the basin’s drainage area, where longer runoff paths led to the gradual depletion of heavy isotopes during transport. In contrast, seasonal streams were closer to the recharge area, with shorter runoff paths, leading to relatively more positive isotopic values. The isotopic values of Shizhe, Qingling, and Longchuan Rivers were similar, indicating that these rivers were influenced by similar vapor sources, evaporation, and geological processes.
Analysis of the δD and δ18O values in the upper, middle, and lower reaches of Longchuan River revealed an initial decrease, followed by a gradual increase, and then a sharp decline (Figure 3). Overall, the isotopic values in the lower reaches were lower than those in the upper reaches. Longchuan River had a topography that sloped from north to south, with the lower reaches near the southern side experiencing stronger evaporation, which would typically lead to more enriched isotopes. However, the opposite was observed. The isotopic composition of the surface was influenced by both evaporation and water sources. The isotopic depletion in the lower reaches of Longchuan River and the Jinsha River region might be due to the influx of groundwater with a negative isotopic bias. Groundwater samples from the study area did not show this depletion, suggesting that the source of the depletion is groundwater from higher altitudes outside the surface watershed.
Additionally, seasonal streams were direct products of precipitation, unlike surface and groundwater, which were influenced by the mixing of various sources. Therefore, seasonal streams more accurately represented the isotopic composition of atmospheric precipitation. The average δD and δ18O values for seasonal streams collected during the wet season were −84.5‰ and −11.1‰, respectively. These values were consistent with the atmospheric precipitation values (δD = −85‰, δ18O = −11‰) within the measurement’s precision. Therefore, in areas where atmospheric precipitation is unavailable, seasonal stream samples could serve as a substitute.
All surface water samples lay below the GMWL, indicating that atmospheric precipitation was the primary recharge source for surface water, though evaporation also played a varying role (Figure 4). The reservoir water samples were characterized by enrichment during the wet season and dilution in the dry season. The seasonal difference was more pronounced in reservoirs than in river water and groundwater, likely due to their location in mountainous regions at higher altitudes. These areas experienced greater seasonal temperature variations than plains, shorter water flow paths, and less human impact, which made temperature effects on isotopic values more pronounced than in other water bodies. Furthermore, reservoir water in the study area was the most enriched in heavy isotopes. The sampled reservoirs had large water storage capacities, extensive catchment areas, and substantial groundwater recharge, resulting in strong evaporation and higher isotopic enrichment. This enrichment may also be related to isotopically enriched water sources transferred from outside the basin. Through irrigation and domestic water use, interactions with local rivers and groundwater may further influence the isotopic composition of regional water bodies.

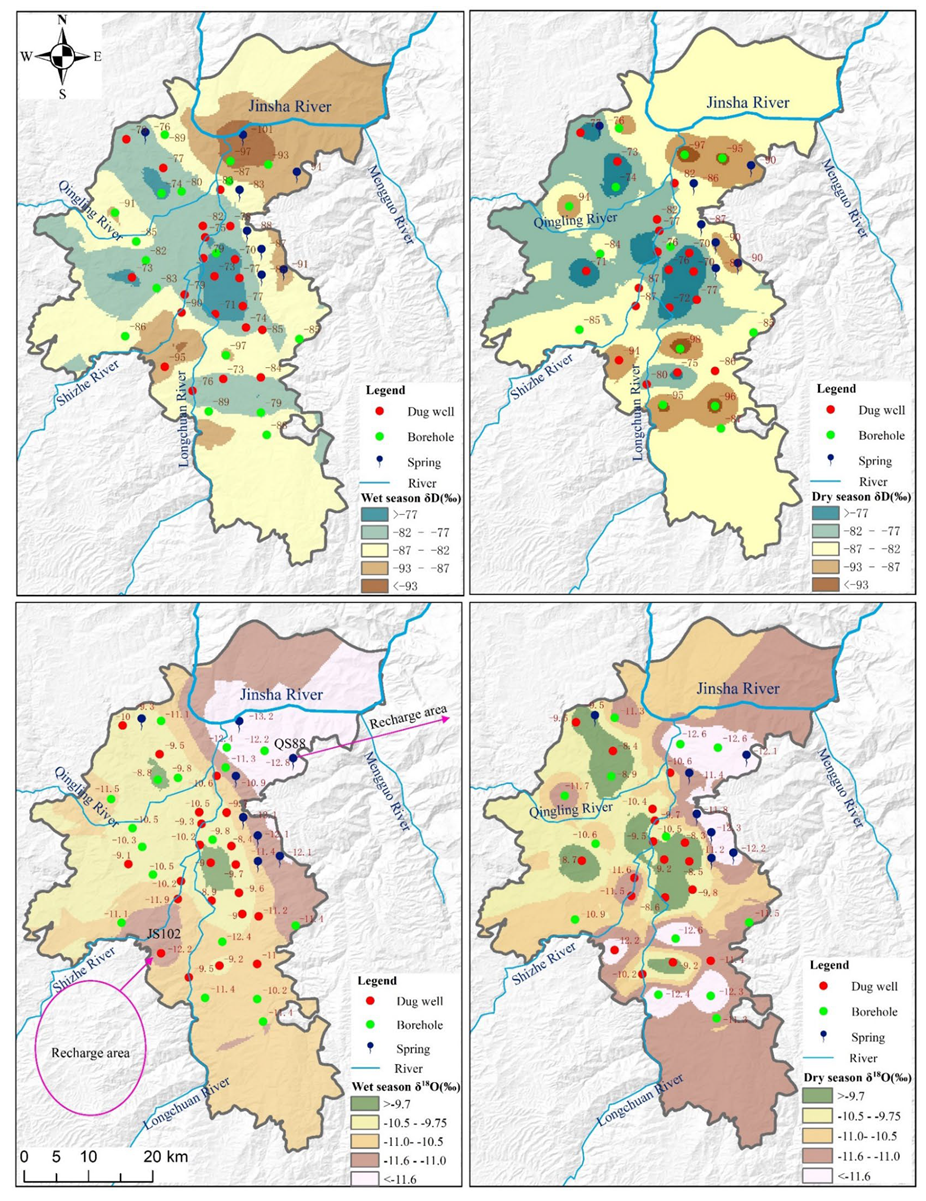
4.3. Characteristics of Hydrogen and Oxygen Stable Isotopes in Groundwater

Groundwater samples were collected from wells and springs with varying lithologies in the study area. The water levels and elevations of the well water were recorded, and the flow rates of the spring water were measured. During the wet season, the average δD value of groundwater was −82.9‰, and −83.8‰ during the dry season, showing a slight seasonal effect with isotopic depletion in the dry season (Table 2). The average δ18O value during the wet season was −10.6‰, and −10.7‰ during the dry season. For well water, the average δD values were −82‰ in the wet season and −83.2‰ in the dry season. For spring water, the average δD values were −86.7‰ in the wet season and −86.1‰ in the dry season. The average δ18O values for well water were −10.4‰ in the wet season and −10.6‰ in the dry season. For spring water, the average δ18O values were −11.5‰ during both seasons.
Well water was significantly more enriched in heavy isotopes than spring water. This enrichment was attributed to the wells being located in a flat plain area, where higher temperatures and evaporation, compared to the mountainous regions of the springs, promote heavy isotope enrichment through the combined effects of temperature, evaporation, and altitude. No significant seasonal effects were observed in either spring or well water. As previously noted, atmospheric precipitation and river water showed no seasonal or anti-seasonal effects, likely due to the minimal temperature differences between the wet and dry seasons in the dry–hot river valley. In contrast, the seasonal effect observed in reservoir water may be due to its location in a mountainous area with significant seasonal climate differences, or the isotope composition of water sources transferred from outside the basin.
Groundwater can be classified based on aquifer lithology. The average isotopic values for loose rock pore water (wet/dry season δD = −80.4‰/−81.3‰, δ18O = −10.1‰/−10.2‰) and clastic rock fracture water (wet/dry season δD = −88.5‰/−87.5‰, δ18O = −11.7‰/−11.5‰) were similar to those of well and spring water, respectively. The analysis indicated that loose rock pore water, similar to well water, was primarily found in plain areas, while clastic rock fracture water, resembling spring water, was predominantly located in mountainous regions. Therefore, classifying groundwater by lithology or by well/spring type yielded similar results. This also suggested that the isotopic composition of groundwater in the study area was more influenced by topography and recharge sources than by lithology or water–rock interactions. Notably, the only two instances of magmatic rock fracture water and carbonate rock fracture–cave water in the study area exhibited significantly positive isotopic values, differing from typical bedrock fracture waters. Both were located at the boundary between bedrock and the Quaternary, suggesting that their positive isotopic values resulted from the influence of loose rock pore water.
In the study area, wells were classified into dug wells and boreholes. The water level depth of dug wells ranged from 0 to 17 m, with most wells being less than 10 m deep. In contrast, borehole depths ranged from 4 to 85 m, with most exceeding 20 m. The average δD and δ18O values for dug wells during the wet and dry seasons are −78.6‰, −78.6‰ and −9.9‰, −9.9‰, respectively. In contrast, the δD and δ18O values for boreholes during the wet and dry seasons were −86.2‰, −89.5‰ and −10.9‰, −11.5‰, respectively. These values were significantly lower than those for dug wells, indicating that deeper wells were less affected by evaporation, likely due to their greater depth. Additionally, dug wells showed no seasonal variation, whereas boreholes exhibited significantly higher values in the wet season compared to the dry season. Based on previous analysis, it can be concluded that seasonal effects on river water and shallow groundwater, which were more strongly influenced by precipitation, were minimal. However, deep groundwater still showed seasonal variations, suggesting that its recharge source may differ from that of surface and shallow groundwater.
Groundwater can be further classified by depth into shallow (0–10 m), intermediate (10–30 m), and deep (>30 m) intervals (Table 2). As water samples moved from shallow to deep layers, the isotopic values gradually became more depleted. This was due to the decreasing impact of evaporation on groundwater with increasing depth. Additionally, deep groundwater exhibited slow flow, a more confined aquifer, and weaker hydraulic exchange with external sources. The lateral recharge of older groundwater significantly contributed to its isotopic depletion [51]. The isotopic values of shallow groundwater remained consistent across wet and dry seasons, while those of intermediate and deep groundwater were more enriched during the wet season. This suggested that shallow groundwater was less affected by seasonal changes, while intermediate and deep groundwater showed seasonal variations.
Figure 5 showed the relationship between δD and δ18O values of groundwater and the GMWL and LMWL in the Yuanmou dry–hot valley. The scatter plot of δD and δ18O values for groundwater samples from the wet and dry seasons generally clustered around the LMWL, indicating that regional atmospheric precipitation was the primary source of groundwater recharge. All groundwater samples lay below the GMWL, suggesting that groundwater recharge by precipitation underwent significant evaporation, and that evaporation also influenced the groundwater. Spring water mostly lay above the LMWL, implying that regional precipitation was not the primary source of recharge. Additionally, spring water was located in the lower-left, more negative region, suggesting that its primary recharge source may be deeper, more depleted groundwater. Well water samples were clustered around the LMWL, indicating that precipitation was the main recharge source. During the wet season, well water exhibited a steeper slope than in the dry season, suggesting that it was less influenced by evaporation. The wet season was primarily influenced by equilibrium fractionation, while the dry season was mainly affected by kinetic fractionation [26].
The spatial distribution of δD and δ18O values in groundwater during the wet and dry seasons (Figure 6) showed relatively consistent patterns. Overall, groundwater δD and δ18O values were higher in the central basin and lower in the Jinsha River Valley and southwestern mountainous areas. The central areas with higher values mainly included the lower Longchuan River basin and the Qingling River basin. The lower Longchuan River basin featured simple topography, primarily receiving recharge from the mountainous areas on the east and west, with significant evaporation. In contrast, the Qingling River basin had complex topography, with surrounding recharge areas (hilly and mountainous regions) of varying orientations. The surface and groundwater runoff paths were long and dispersed, leading to lower isotopic values in the Qingling River basin compared to the lower Longchuan River basin. The slightly enriched shallow groundwater in this area was primarily influenced by temperature, atmospheric precipitation, and mixed seepage from surface water bodies. Isotopic values in the Jinsha River Valley and southwestern mountainous areas were lower, possibly due to recharge from the eastern and southern sides, respectively.
The QS88 point in the Jinsha River Valley had a groundwater elevation of 2242 m and a δ18O value of −12.8‰, in contrast to the atmospheric precipitation δ18O value of −11‰. The recharge elevation can be calculated using the global average δ18O gradient for precipitation (−0.25‰/100 m) as follows: hrecharge = hgroundwater + (δgroundwater − δprecipitation)/elevation gradient. The recharge elevation for the Jinsha River Valley groundwater was likely from the Malutang alpine area, east of the Mengguo River, at elevations above 2900 m. The JS102 point in the southwestern mountainous area had a groundwater elevation of 1305 m and a δ18O value of −12.2‰. Using the same calculation, the recharge elevation for groundwater in the southwestern mountainous area was likely from the western mountainous regions at elevations above 1800 m.

5. Discussion

5.1. Isotope Effect and Water Vapor Source in the Study Area

The atmospheric precipitation, river water, and shallow groundwater in the study area did not exhibit significant seasonal variations, with δD and δ18O values being lower in the wet season than in the dry season. In contrast, reservoir water and mid-to-deep groundwater displayed distinct seasonal effects, with higher δD and δ18O values during the wet season. The seasonal effect in reservoir water may be due to its higher elevation, where temperature variations were more pronounced, leading to enriched isotope values during the wet season. The seasonal effect in mid-to-deep groundwater might be linked to the confined aquifer and recharge from downward groundwater flow. Therefore, it can be concluded that atmospheric precipitation, river water, and shallow groundwater, which were more influenced by precipitation, did not exhibit distinct seasonal effects, whereas mid-to-deep groundwater showed significant seasonal effects.
Differences in recharge sources and processes can lead to both seasonal and inverse seasonal effects in water bodies across regions, preventing generalization. For instance, Xiao et al. [52] investigated the seasonal variation in water isotopes in the Xiang River Basin, located in the East Asian Monsoon region. The δD values of river water exhibited clear seasonal changes, with maximum positive values in the spring flood period (March–April) and maximum negative values in the summer drought period (July–September), aligning with precipitation patterns. Xu et al. [53] monitored Taihu Lake water from 2012 to 2014, observing that δ18O values were highest in summer and lowest in winter. Tao et al. [54] analyzed stable isotopes in Poyang Lake and river water, finding that isotopes in precipitation and river water were most enriched in April, depleted from May to July, and then became enriched again. Yin et al. [55] examined hot springs and rivers in the high-altitude snowmelt recharge area of Daocheng, Sichuan, observing an inverse seasonal effect due to isotopic depletion caused by melting processes.
Liu et al. [56] analyzed nearly 60 years of dry-wet conditions and temperature variations in Yuanmou, revealing that the average summer temperature was consistently 5 °C higher than that of autumn. Thus, the inverse seasonal effect in river water and shallow groundwater is not linked to temperature. Luo et al. [57] estimated potential evapotranspiration in Yuanmou from 1956 to 2019 using the Penman–Monteith model. The average potential evapotranspiration from June to August and September to November was 465.4 mm and 332.4 mm, respectively, with higher values in summer than autumn. However, data from the Yuanmou County Water Affairs Bureau on evaporation at Bingjian Reservoir (2017–2021) showed that evaporation in July was not consistently higher than in November. For instance, evaporation in July and November 2019 was 204.2 mm and 217.1 mm, respectively. Therefore, the inverse seasonal effect in river water and shallow groundwater may primarily reflect the inverse seasonal pattern of atmospheric precipitation or be influenced by evaporation differences. This also suggests that atmospheric precipitation plays a dominant role in the isotopic composition and water cycle of shallow groundwater and surface water in the region. In contrast, mid-to-deep groundwater responds more slowly to atmospheric precipitation and is influenced by recharge from deeper aquifers, leading to continued seasonal effects.
Gao et al. [58] investigated the relationship between hydrogen and oxygen stable isotopes in atmospheric precipitation across China. They found that the slope of the precipitation line varied regionally, with distinct partitions that are closely linked to local moisture sources. Based on moisture sources for precipitation, mainland China was divided into several regions based on the slopes of the precipitation line, including the southeastern coastal and southwestern regions. The boundaries between these regions aligned with the geographic divides. He proposed that the primary moisture sources for the southwestern region are the Bay of Bengal and the Arabian Sea. During moisture transport, minimal kinetic fractionation occurs, resulting in a precipitation line slope, similar to the global standard line.
The simulation of the water vapor source showed that during the dry season, moisture at all three altitudes in the study area primarily originated from southwestern monsoon transport. In contrast, during the wet season, moisture sources are more complex, possibly including the southwestern monsoon, southeastern monsoon, and Siberian continental air masses (Figure 7). Therefore, the southwestern moisture source during the dry season undergoes minimal kinetic fractionation, resulting in relatively enriched heavy isotopes. In contrast, moisture from the southeastern monsoon or continental air masses during the wet season, due to the longer transport distance, may be isotopically depleted, leading to inverse seasonal effects in local precipitation.
In addition to the inverse seasonal effect observed during the wet and dry seasons, other isotopic effects were also evident in the study area. Consistent with the inverse seasonal effect, the long-term average temperature in Yuanmou was higher in summer (25.9 °C) than in autumn (20.9 °C) [56]. Consequently, the Yuanmou dry–hot valley also exhibited an inverse temperature effect during the wet and dry seasons. The elevation effect was significant in the region, particularly for groundwater isotopic values. For example, spring water in mountainous areas was more depleted compared to well water in valleys. Along the Longchuan and Qingling Rivers, the groundwater isotopic enrichment generally increased from the mountainous areas to the dam regions (Figure 8, where symbol size represents isotope values). Water samples from the Longchuan and Qingling Rivers showed more depleted isotopic values than nearby well samples. This may result from joint recharge by nearby groundwater and more distant, depleted groundwater, suggesting a multi-level recharge system in both local and regional groundwater systems. The elevation effect was more pronounced in the east–west direction but not in the north–south direction, likely due to the small elevation gradient in the latter. In the study area, water isotopes were more negative near moisture sources [26,51], reflecting a coastal zone effect. As moisture sources migrate inland, heavier isotopes entered precipitation, leaving remaining moisture sources more depleted.

5.2. The Influencing Factors of Hydrogen and Oxygen Stable Isotopes in Water Bodies

Student’s t-test was employed to examine whether there were significant differences in δD and δ18O between the wet and dry seasons.The results for the δ18O showed a significance value of 0.672, with homogeneity of variances, and a p-value of 0.585, indicating no significant difference between wet and dry seasons. For the δD, the significance value was 0.844, with a p-value of 0.601, also indicating no significant difference between wet and dry seasons. Furthermore, Pearson’s correlation analysis was conducted to examine the relationship between hydrogen and oxygen isotopes in the water bodies and factors such as longitude, latitude, and water level elevation. The correlation among the 11 indicators was shown in Figure 9. The water level elevation data represents the elevation at the time of the survey, including the river surface elevation during water sampling and the well water level, calculated as the wellhead elevation minus the water depth. The water level elevation data for rivers and groundwater also allowed for a qualitative assessment of the conversion relationship between surface water and groundwater. δD and δ18O exhibited a significant positive correlation, suggesting that the isotopic fractionation of both was consistent in the study area. δD and δ18O showed weak negative correlations with both longitude and latitude. The negative correlation with longitude was primarily due to the combined effects of elevation, as the study area was closer to the higher-elevation eastern mountains, which led to more depleted isotopes, whereas the western side mainly consisted of low hills.
As previously analyzed, the elevation effect was not observed in the north–south direction. However, correlation analysis showed that the isotopes became more negative as one moved toward the northern downstream areas. The more negative isotopic values observed in the northeastern region and the Jinsha River suggested that these areas were influenced by groundwater recharge from elevations >2900 m. Thus, the latitude effect in the region was linked to the expansion of groundwater recharge in the northern areas. Overall, the recharge area expanded from south to north, and the isotopic composition became more complex. δ18O also showed a weak negative correlation with water level elevation, suggesting that isotopes were gradually enriched from deep groundwater, to shallow groundwater, river water, and finally to spring and reservoir water in the study area. However, the correlation between δD and water level elevation was not significant (p < 0.05), possibly due to the relative instability of δD compared to δ18O, which made δD more susceptible to other influencing factors. Neither δD nor δ18O showed a significant correlation with TDS or dissolved oxygen, suggesting that the solutes and dissolved oxygen content were unrelated to the isotopes. δD and δ18O showed a positive correlation with air temperature but no significant correlation with water temperature, suggesting that an increase in air temperature likely promoted isotopic fractionation.

5.3. Relationship Between δD and δ18O of Precipitation, Surface Water, and Groundwater and Its Significance

An analysis of hydrogen and oxygen isotopes in surface water and groundwater in the study area revealed the following trend: river water < spring water < well water < reservoir water. The enrichment of heavy isotopes in reservoirs was linked to intense evaporation and slow water flow, both of which promote isotopic fractionation. The relative depletion of spring water was likely due to its location in bedrock mountain areas and recharge from deep confined aquifers. River water isotopes were generally lower than those of well water and were the most depleted in the area, indicating that surface water was more depleted than groundwater. River water was mainly found in valley areas, where evaporation was intense and temperatures were high. The relatively negative isotopic values were likely linked to recharge from deeper confined aquifers. Excluding river water samples from the Jinsha River (which may represent external recharge to the study area), the isotopic values closely resembled those of spring water and boreholes deeper than 30 m. This suggests that these two sources are key contributors to river water recharge.
Well water isotopes were generally more positive, with shallow wells showing more enriched values. In contrast, some deep wells with significant depths showed more negative isotopic values, suggesting that the overall isotopic value of well water is mainly influenced by shallow wells. Shallow wells in the study area were primarily located in the dam region, where the climate was arid and hot, with annual evaporation exceeding six times the precipitation. Under these dry and hot conditions, groundwater evaporation was rapid, and the evaporation limit depth for shallow groundwater was notably deep. For instance, Shao’s study [59] on the North China Plain found that the evaporation limit depth for shallow groundwater is below 4 m. In the study area, many shallow wells had water table depths between 0 and 6 m. Additionally, the dry, low-moisture soil in the arid valleys enhanced capillary action, contributing to the enrichment of heavy isotopes in well water due to evaporation, temperature, and other factors.
The distribution of δD and δ18O in different water bodies in the study area, and their relationship with the precipitation line, revealed that river and spring waters were mostly located in the lower-left part of the diagram (more negative), while well and reservoir waters were primarily in the upper-right part (more positive) (Figure 10). Most water sample points fell below the GMWL, suggesting that atmospheric precipitation was the main source of water body recharge in the study area, though all samples were affected by evaporation. The slope of the water bodies in the study area was smaller than that of the GMWL, indicating a stronger influence of evaporation. In contrast, the slopes of spring and reservoir waters deviated more from the GMWL, suggesting that evaporation had a greater impact on these water bodies than on river and well waters. Overall, all water sample points cluster around the LMWL, indicating that the water bodies in the study area predominantly originate from local precipitation.
The distribution of spring water in the study area differed from other water types, with some spring points located above the GMWL. This suggested that these springs may have additional sources, such as groundwater from outside the study area. Groundwater in the study area did not show significant oxygen isotope migration, as the fitted line was approximately parallel to the x-axis. This suggested that the groundwater had not undergone notable water–rock interactions with surrounding bedrock. The intersection of the extended isotopic fitting line and the atmospheric precipitation line likely represented the initial source of water vapor. The diagram showed that the intersection is near the Jinsha River water sample point, with δD and δ18O values of approximately −107‰ and −14.6‰, indicating that the initial water vapor source is relatively negative. Subsequent local water vapor, after further evaporation, became more enriched in δD and δ18O.

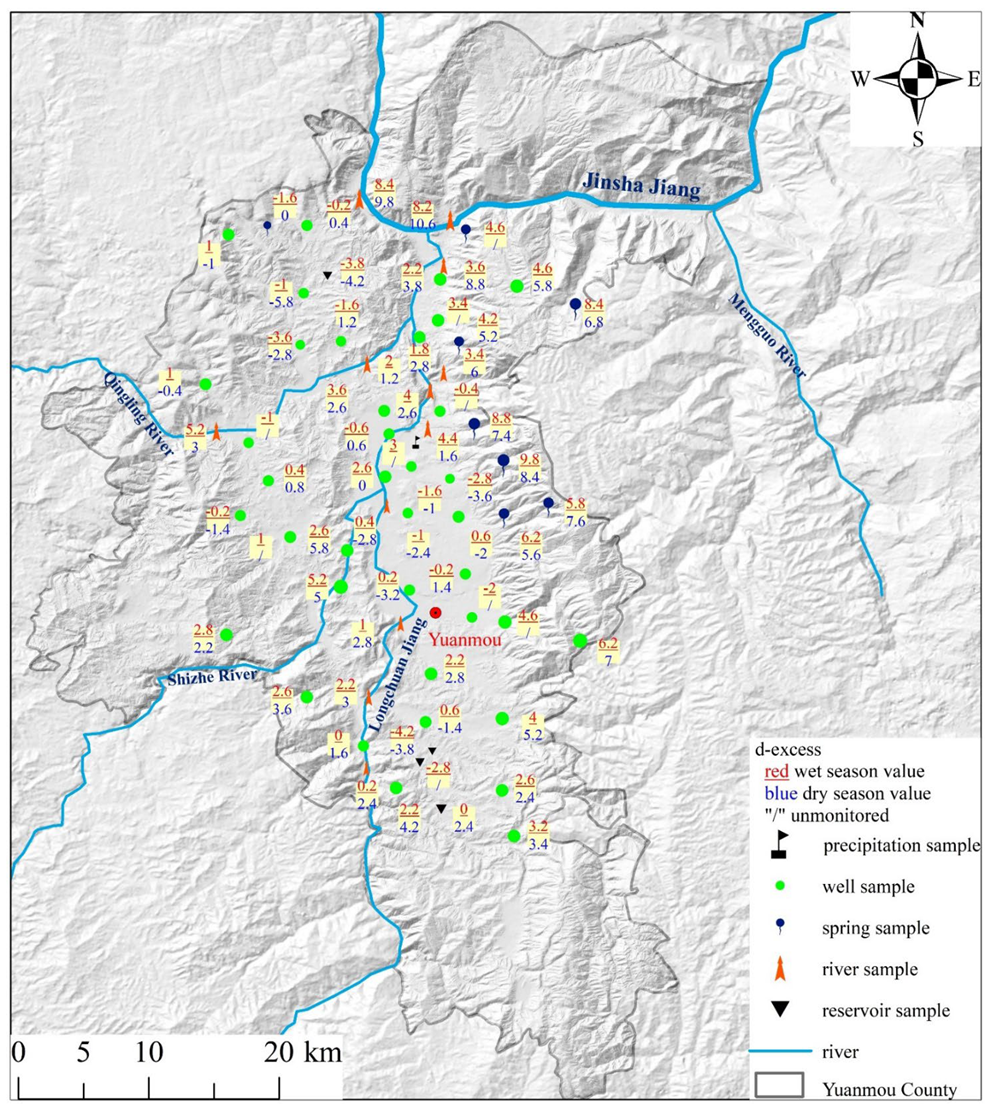
5.4. Characteristics of Deuterium Excess and Line-Conditioned Excess

Dansgaard [60] introduced the deuterium excess (d-excess), defined by the intercept of the δD-δ18O relationship, which indicates the extent to which a water body deviates from the GMWL. A smaller deuterium excess indicates stronger evaporation fractionation. Table 1 showed that reservoir water had the smallest deuterium excess, while spring water had the largest. It suggested that reservoir water was most influenced by evaporation fractionation, while spring water was less affected. Well water and river water fell between these extremes, with well water exhibiting a smaller deuterium excess than river water, indicating that under the specific climatic conditions of the dry hot valley, shallow well water was more affected by evaporation than river water. The correlation diagram also showed a significant negative correlation between deuterium excess and δD/δ18O.
Reservoir water and some well water in the river valley exhibited a deuterium excess below 0, significantly deviating from the GMWL average. Samples near the Longchuan River, with relatively shallow water table depths, were more influenced by evaporation than the surrounding river water (Figure 11). Some borehole waters also exhibited negative values. Compared to nearby shallow wells, the isotope values were more depleted, indicating that the negative d-excess may result from the upward recharge of shallow groundwater. The spatial distribution of d-excess in the study area suggests that the Longchuan and Qingling River valleys are more strongly influenced by evaporation.
The deuterium excess is commonly used to qualitatively assess the evaporation conditions of oceanic water vapor. Line-conditioned excess (lc-excess) is also used to describe the shift and isotopic differences between surface and groundwater samples and local meteoric water. lc-excess = δD − aδ18O − b (where a and b represent the slope and intercept of the LMWL). This followed a similar pattern to d-excess, with spring water > river water > well water > reservoir water. Reservoir water deviated more from the LMWL than river water, indicating a stronger influence of local evaporation. The lc-excess value of the groundwater reflects the degree of evaporation and non-equilibrium fractionation during the recharge process [61]. Most groundwater lc-excess values were significantly lower than that of regional precipitation (lc-excess = 0‰), suggesting that evaporation fractionation occurred during groundwater recharge.
Groundwater recharge by precipitation can generally be categorized into two processes: piston flow and dominant flow. Piston flow involves slow infiltration with significant isotopic fractionation, while dominant flow involves rapid recharge through fractures and other channels, with less noticeable isotopic fractionation [62]. Isotopic fractionation in the study area was evident, deviating from the LMWL, indicating that piston flow is the primary recharge mechanism. The lc-excess range for groundwater in the study area spanned from −6.5 to 2.2, with significant regional variations influenced by topography and climate. Groundwater recharge is predominantly slow infiltration, although localized areas may experience faster dominant flow recharge.

5.5. Transformation Relationship Between Precipitation–Surface Water–Groundwater

The hydrological cycle of a watershed governs the complex recharge and exchange processes of various water bodies across spatial and temporal scales. Quantifying the proportions of precipitation, groundwater, and surface water, along with their transformations, provides a foundation for water resource management and improvement in arid, water-scarce regions. Sun et al. [15] studied the transformation relationships among precipitation, river water, and groundwater in the upper Xilin River basin during the rainy season. They found that precipitation and shallow groundwater are the primary sources of river water recharge, with deep groundwater also playing a significant role in replenishment. Gu et al. [63] examined the differential transformation relationships between surface water and groundwater in the upstream and downstream areas of the Liujang Basin. In the upstream area, river water was replenished by groundwater, whereas in the downstream area, river water recharged groundwater. A study by Sun et al. [64] in the Haihe source area found that during the wet season, river water and precipitation significantly replenish groundwater, whereas during the dry season, hydraulic connectivity between water bodies weakens. The average contribution of river water to groundwater recharge is 48.72%.
RTK was employed to measure water elevation during sampling. The piezometric map for the wet season indicated two primary groundwater flow directions: the eastern side of the mountainous area was dominated by the east and southeast directions, and the western side of the hills was dominated by the southwest and northwest directions, consistent with the direction of isotope enrichment (Figure 12). Comparing groundwater flow with the surface stream network suggested that the characteristic of groundwater recharge to surface water, though localized surface water recharge to groundwater may occur, such as in the southwest side. Since the hydrogen and oxygen isotopes did not show significant differences between the dry and wet seasons (as discussed in the previous section), groundwater flow direction and recharge characteristics during the dry season were assumed to be consistent with those of the wet season.
Analysis of water level elevations in rivers and adjacent groundwater during both wet and dry periods revealed groundwater recharge of river water in both periods. Consequently, precipitation and groundwater were identified as recharge sources, while surface water (river and reservoir water) was considered a mixed source. The binary isotope mass balance model was employed to calculate the proportions of δD and δ18O contributions from each source. Precipitation sample data were primarily collected by Luo between 2011 and 2012, with wet season samples from June to September and dry season samples from October to December. During the wet season, surface water was replenished by atmospheric precipitation and groundwater at proportions of 46.8% and 53.3%, respectively, with groundwater slightly dominating river water recharge. In the dry season, surface water was replenished by atmospheric precipitation and groundwater at proportions of 33.1% and 66.9%, respectively. Compared to the wet season, groundwater’s contribution to river water recharge increased further (Table 3).
In summary, the primary sources of surface water recharge in the Yuanmou dry–hot valley during both wet and dry periods are precipitation and groundwater, with recharge proportions ranging from 33.1% to 46.8% for precipitation and 53.3% to 66.9% for groundwater. The average recharge proportions are 40% for precipitation and 60% for groundwater. Field investigations of water level elevations revealed that groundwater flow in the study area follows the topography, moving from the mountainous areas on the east and west toward the central low-lying river valley. Previous analyses also indicated that certain rivers, with particularly negative isotope values, may receive recharge from external, deep groundwater sources. Field observations of spring overflow confirmed the contribution of deep groundwater to river recharge. Yin’s study [65] on groundwater in northwest inland river basins suggested frequent exchange between groundwater and surface water, with a close hydraulic connection. The study area is highly arid, with severe water scarcity and a significant water–heat imbalance. The δD and δ18O distributions of surface water and groundwater are closely clustered and overlap, indicating strong exchange between surface water and groundwater, similar to that observed in inland river basins.

6. Conclusions

(1)
The seasonal effects of precipitation, river water, and shallow groundwater are minimal, while those of reservoir water and mid-deep groundwater are more pronounced. River water and shallow groundwater mainly reflect the inverse seasonal effect of precipitation and are influenced by evaporation. In the dry season, precipitation moisture originates from the southwest and does not undergo significant kinetic fractionation. In the wet season, the moisture transport route is longer, resulting in more depleted isotopes. Mid-deep groundwater responds to precipitation with a delay, and its seasonal variation is linked to leakage recharge from deeper aquifers.
(2)
The groundwater lc-excess deviates from the LMWL, indicating that precipitation recharge occurs primarily through piston flow, with significant isotope fractionation. Groundwater isotope values show no clear distinction based on aquifer lithology, and the δD-δ18O relationship diagram lacks an oxygen shift, indicating a weak water–rock interaction.
(3)
The recharge sources of different water bodies in the region can be summarized as follows: river water is recharged by precipitation, deep groundwater, and spring water. Spring water is mainly recharged by deep groundwater. Well water is chiefly recharged by precipitation and lateral groundwater inflow. Reservoir water is recharged by precipitation, groundwater, and water transfer, with notable evaporation effects. Multiple lines of evidence indicate frequent exchanges between surface water and groundwater in the region.
(4)
Water level elevations of rivers and groundwater show that, during both wet and dry periods, groundwater recharges river water. Using a binary isotope mass balance model, the recharge ratios of precipitation and groundwater to surface water are 35% and 65%, respectively. Compared to the dry season, the proportion of groundwater recharge to river water increases in the wet season.

Author Contributions

Conceptualization, all authors; data curation, J.L.; supervision, Y.S.; investigation, H.L.; methodology, K.S.; visualization, D.H.; software, Z.Z. and X.D.; writing—original draft, J.L.; writing—review and editing, all authors. All authors have read and agreed to the published version of the manuscript.

Funding

This research was funded by Geological Survey Project of China Geological Survey (ZD20220128, DD20230512, DD20242312).

Data Availability Statement

Data are contained within the article.

Conflicts of Interest

The authors declare no conflicts of interest.

References

  1. Lerman, A. Geochemical Processes: Water and Sediment Environments; John Wiley: Hoboken, NJ, USA, 1979. [Google Scholar]
  2. Zhang, X.; Zhang, Y.; Qi, J.; Wang, Q. Evaluation of the Stability and Suitable Scale of an Oasis Irrigation District in Northwest China. Water 2020, 12, 2837. [Google Scholar] [CrossRef]
  3. Zhang, Q.; Wang, R.; Qi, Y.; Wen, F. A watershed water quality prediction model based on attention mechanism and BI-LSTM. Environ. Sci. Pollut. Res. 2022, 29, 75664–75680. [Google Scholar] [CrossRef] [PubMed]
  4. Chen, J.; Wen, J.; Tian, H. Representativeness of The Ground Observational Sites and Up-Scaling of The Point Soil Moisture Measurements. J. Hydrol. 2016, 533, 62–73. [Google Scholar] [CrossRef]
  5. Wan, W.; Xie, H.; Hasan, E.; Hong, Y. Editorial for Special Issue “Remote Sensing Water Cycle: Theory, Sensors, Data, and Applications”. Remote Sens. 2019, 11, 1210. [Google Scholar] [CrossRef]
  6. Sheng, Y.; Hu, J.; Kukkadapu, R.; Guo, D.; Zeng, Q.; Dong, H. Inhibition of Extracellular Enzyme Activity By Reactive Oxygen Species Upon Oxygenation of Reduced Iron-Bearing Minerals. Environ. Sci. Technol. 2023, 57, 3425–3433. [Google Scholar] [CrossRef]
  7. Yin, S.; Gao, G.; Li, Y.; Xu, Y.J.; Turner, R.E.; Ran, L.; Wang, X.; Fu, B. Long-Term Trends of Streamflow, Sediment Load and Nutrient Fluxes From the Mississippi River Basin: Impacts of Climate Change and Human Activities. J. Hydrol. 2023, 616, 128822. [Google Scholar] [CrossRef]
  8. Hao, S.; Li, F.; Li, Y.; Gu, C.; Zhang, Q.; Qiao, Y.; Jiao, L.; Zhu, N. Stable Isotope Evidence for Identifying the Recharge Mechanisms of Precipitation, Surface Water, and Groundwater in the Ebinur Lake Basin. Sci. Total Environ. 2019, 657, 1041–1050. [Google Scholar] [CrossRef]
  9. Sheng, Y.; Wang, G.; Zhao, D.; Hao, C.; Liu, C.; Cui, L.; Zhang, G. Groundwater microbial communities along a generalized flowpath in Nomhon Area, Qaidam Basin, China. Groundwater 2018, 56, 719–731. [Google Scholar] [CrossRef]
  10. Jiang, W.; Sheng, Y.; Wang, G.; Shi, Z.; Liu, F.; Zhang, J.; Chen, D. Cl, Br, B, Li, and Noble Gases Isotopes to Study the Origin and Evolution of Deep Groundwater in Sedimentary Basins: A Review. Environ. Chem. Lett. 2022, 20, 1497–1528. [Google Scholar] [CrossRef]
  11. Zhang, Z.; Bianchette, T.A.; Meng, C.; Xu, Q.; Jiang, M. Holocene Vegetation-Hydrology-Climate Interactions of Wetlands on the Heixiazi Island, China. Sci. Total Environ. 2020, 743, 140777. [Google Scholar] [CrossRef]
  12. Fossey, M.; Rousseau, A.N. Can Isolated and Riparian Wetlands Mitigate the Impact of Climate Change on Watershed Hydrology? A Case Study Approach. J. Environ. Manag. 2016, 184 Pt 2, 327–339. [Google Scholar] [CrossRef] [PubMed]
  13. Jia, R.; Jiang, X.; Shang, X.; Wei, C. Study on the Water Resource Carrying Capacity in the Middle Reaches of the Heihe River Based on Water Resource Allocation. Water 2018, 10, 1203. [Google Scholar] [CrossRef]
  14. Hürkamp, K.; Zentner, N.; Reckerth, A.; Weishaupt, S.; Wetzel, K.-F.; Tschiersch, J.; Stumpp, C. Spatial and temporal variability of snow isotopic composition on Mt. Zugspitze, Bavarian Alps, Germany. J. Hydrol. Hydromech. 2018, 67, 49–58. [Google Scholar] [CrossRef]
  15. Sun, J.; Wang, Y.; Yang, L.; Duan, L.; Chu, S.; Zhang, G.; Zhang, B.; Liu, T. Relationship between precipitation, river water, and groundwater conversion in the upper reaches of xilin river during the rainy season. Environ. Sci. 2023, 44, 6754–6766. [Google Scholar]
  16. Clark, I.D.; Fritz, P. Environmental Isotopes in Hydrogeology; CRC Press: Boca Raton, FL, USA, 2013. [Google Scholar]
  17. Chen, F.; Zhang, M.; Wu, X.; Wang, S.; Chen, J. A stable isotope approach for estimating the contribution of recycled moisture to precipitation in lanzhou city, China. Water 2021, 13, 1783. [Google Scholar] [CrossRef]
  18. Gualli, A.; Galvão, P.; Buenaño, M.; Conicelli, B. Estimating groundwater recharge and precipitation sources of the zamora river basin, southeastern ecuador, using gis and stable isotopes. Environ. Earth Sci. 2023, 82, 400. [Google Scholar] [CrossRef]
  19. Zhu, G.; Liu, Y.; Shi, P.; Jia, W.; Zhou, J.; Liu, Y.; Ma, X.; Pan, H.; Zhang, Y.; Zhang, Z.; et al. Stable water isotope monitoring network of different water bodies in shiyang river basin, a typical arid river in China. Earth Syst. Sci. Data 2022, 14, 3773–3789. [Google Scholar] [CrossRef]
  20. Jiang, W.; Wang, G.; Sheng, Y.; Shi, Z.; Zhang, H. Isotopes in groundwater (2H, 18O, 14C) revealed the climate and groundwater recharge in the Northern China. Sci. Total Environ. 2019, 666, 298–307. [Google Scholar] [CrossRef]
  21. Guo, X.; Gong, X.; Shi, J.; Guo, J.; Domínguez-Villar, D.; Lin, Y.; Wang, H.; Yuan, D. Temporal Variations and Evaporation Control Effect of the Stable Isotope Composition of Precipitation in the Subtropical Monsoon Climate Region, Southwest China. J. Hydrol. 2021, 599, 126278. [Google Scholar] [CrossRef]
  22. Yang, J.; Yu, Z.; Yi, P.; Frape, S.K.; Zhang, Y. Evaluation of Surface Water and Groundwater Interactions in the Upstream of Kui River and Yunlong Lake, Xuzhou, China. J. Hydrol. 2020, 583, 124549. [Google Scholar] [CrossRef]
  23. Jiang, W.; Sheng, Y.; Shi, Z.; Guo, H.; Chen, X.; Mao, H.; Liu, F.; Ning, H.; Liu, N.; Wang, G. Hydrogeochemical Characteristics and Evolution of Formation Water in the Continental Sedimentary Basin: A Case Study in the Qaidam Basin, China. Sci. Total Environ. 2024, 957, 177672. [Google Scholar] [CrossRef] [PubMed]
  24. Song, X.; Liu, X.; Xia, J.; Yu, J.; Tang, C. A Study of interaction between surface water and groundwater using environmental isotope in huaisha river basin. Sci. China Ser. D Earth Sci. 2006, 49, 1299–1310. [Google Scholar] [CrossRef]
  25. Hamidi, M.D.; Gröcke, D.R.; Joshi, S.K.; Greenwell, H.C. Investigating groundwater recharge using hydrogen and oxygen stable isotopes in kabul city, a semi-arid region. J. Hydrol. 2023, 626, 130187. [Google Scholar] [CrossRef]
  26. Lu, X.; Wang, M.; Gong, X.; Wu, X.; Zhang, H.; Wei, Y. Hydrogen and Oxygen Isotope Based Transformation Studies of Surface Water and Groundwater in Plains Lakes and Swamps. J. Hydraul. Eng. 2024, 55, 416–427. [Google Scholar]
  27. Ren, X.; Li, P.; He, X.; Zhang, Q. Tracing the Sources and Evaporation Fate of Surface Water and Groundwater Using Stable Isotopes of Hydrogen and Oxygen. Sci. Total Environ. 2024, 931, 172708. [Google Scholar] [CrossRef]
  28. Guo, Y.; Wang, Q.; Fan, M. Exploring the Relationship Between the Arid Valley Boundary’s Displacement and Climate Change During 1999–2013 in the Upper Reaches of the Min River, China. ISPRS Int. J. Geo-Inf. 2017, 6, 146. [Google Scholar] [CrossRef]
  29. Rong, L.; Duan, X.; Feng, D.; Zhang, G. Soil Moisture Variation in A Farmed Dry-Hot Valley Catchment Evaluated by A Redundancy Analysis Approach. Water 2017, 9, 92. [Google Scholar] [CrossRef]
  30. Luo, Y.; Shi, C.; Yang, S.; Liu, Y.; Zhao, S.; Zhang, C. Characteristics of Soil Calcium Content Distribution in Karst Dry-Hot Valley and Its Influencing Factors. Water 2023, 15, 1119. [Google Scholar] [CrossRef]
  31. Ma, H.; Jack, A.M. The Dry-Hot Valleys and Forestation in Southwest China. J. For. Res. 2001, 12, 35–39. [Google Scholar]
  32. Liu, X.; Ma, Y.; Wan, Y.; Li, Z.; Ma, H. Genetic Diversity of Phyllanthus Emblica From Two Different Climate Type Areas. Front. Plant Sci. 2020, 11, 580812. [Google Scholar] [CrossRef]
  33. Zhao, Y.; Zhang, B.; He, Y.; Luo, J.; Wang, L.; Deng, Q.; Liu, H.; Yang, D. Influence of geological conditions on gully distribution in the dry–hot valley, SW China. Catena 2022, 214, 106274. [Google Scholar] [CrossRef]
  34. Xiong, D.; Zhou, H.; Yang, Z.; Zhang, X. Slope Lithologic Property, Soil Moisture Condition and Revegetation in Dry-Hot Valley of Jinsha River. Chin. Geogr. Sci. 2005, 15, 186–192. [Google Scholar] [CrossRef]
  35. Lin, Y.; Cui, P.; Ge, Y.; Chen, C.; Wang, D.; Wu, C.; Li, J.; Yu, W.; Zhang, G.; Lin, H. The Succession Characteristics of Soil Erosion During Different Vegetation Succession Stages in Dry-Hot River Valley of Jinsha River, Upper Reaches of Yangtze River. Ecol. Eng. 2014, 62, 13–26. [Google Scholar] [CrossRef]
  36. Zhang, X.; Fan, J.; Liu, Q.; Xiong, D. The Contribution of Gully Erosion to Total Sediment Production in A Small Watershed in Southwest China. Phys. Geogr. 2018, 39, 246–263. [Google Scholar] [CrossRef]
  37. Dong, Y.; Xiong, D.; Su, Z.a.; Li, J.; Yang, D.; Shi, L.; Liu, G. The distribution of and factors influencing the vegetation in a gully in the Dry-Hot Valley of Southwest China. Catena 2014, 116, 60–67. [Google Scholar] [CrossRef]
  38. Chen, G.; Wang, Y.; Wen, Q.; Zuo, L.; Zhao, J. An Erosion-Based Approach Using Multi-Source Remote Sensing Imagery for Grassland Restoration Patterns in A Plateau Mountainous Region, SW China. Remote Sens. 2023, 15, 2047. [Google Scholar] [CrossRef]
  39. Yang, D.; Xiong, D.; Guo, M.; Su, Z.; Zhang, B. Impact of Grass Belt Position on the Hydraulic Properties of Runoff in Gully Beds in the Yuanmou Dry-Hot Valley Region of Southwest China. Phys. Geogr. 2015, 36, 408–425. [Google Scholar] [CrossRef]
  40. Peng, S.; Chen, A.; Fang, H.; Wu, J.; Liu, G.; Peng, S.; Chen, A.; Fang, H.; Wu, J.; Liu, G. Effects of Vegetation Restoration Types on Soil Quality in Yuanmou Dry-Hot Valley, China. Soil Sci. Plant Nutr. 2013, 59, 347–360. [Google Scholar] [CrossRef]
  41. Chen, A.; Zhang, D.; Yan, B.; Lei, B.; Liu, G. Main Types of Soil Mass Failure and Characteristics of Their Impact Factors in the Yuanmou Valley, China. Catena 2015, 125, 82–90. [Google Scholar] [CrossRef]
  42. Yang, D.; Xiong, D.; Zhang, B.; Guo, M.; Su, Z.; Dong, Y.; Zhang, S.; Xiao, L.; Lu, X. Effect of Grass Basal Diameter on Hydraulic Properties and Sediment Yield Processes in Gully Beds in the Dry-Hot Valley Region of Southwest China. Catena 2017, 152, 299–310. [Google Scholar] [CrossRef]
  43. Matiatos, I.; Wassenaar, L.I. Stable isotope patterns reveal widespread rainy-period-biased recharge in phreatic aquifers across Greece. J. Hydrol. 2019, 568, 1081–1092. [Google Scholar] [CrossRef]
  44. Luo, F. The Research About Water Environmental Isotope in Yuanmou Dry-Hot Valleys. Master’s Thesis, Yunnan University, Kunming, China, 2012. [Google Scholar]
  45. Jing, Z.; Yu, W.; Lewis, S.; Thompson, L.G.; Xu, J.; Zhang, J.; Xu, B.; Wu, G.; Ma, Y.; Wang, Y. Inverse Altitude Effect Disputes the Theoretical Foundation of Stable Isotope Paleoaltimetry. Nat. Commun. 2022, 13, 4371. [Google Scholar] [CrossRef] [PubMed]
  46. Dar, S.S.; Ghosh, P.; Swaraj, A.; Kumar, A. Craig–Gordon Model Validation Using Stable Isotope Ratios in Water Vapor over the Southern Ocean. Atmos. Chem. Phys. 2020, 20, 11435–11449. [Google Scholar] [CrossRef]
  47. Zhu, X.; Fan, T.; Guan, W. The Analysis of Stable Isotopes of Precipitation in Kunming. Yunnan Geogr. Environ. Res. 2013, 25, 90–95. [Google Scholar]
  48. Wei, K.; Lin, R. The Influence of the Monsoon Climate on the Isotopic Composition of Precipitation in China. Geochimica 1994, 23, 33–41. [Google Scholar]
  49. Craig, H. Isotopic Variations in Meteoric Waters. Science 1961, 133, 1702–1703. [Google Scholar] [CrossRef]
  50. Zheng, S.; Hou, F.; Ni, B. Study on Stable Isotopes of Atmospheric Precipitation in China. Chin. Sci. Bull. 1983, 28, 801–806. [Google Scholar]
  51. Zhang, J.; Liu, F.; Zou, J.; Lv, C. Application of Hydrogen and Oxygen Isotopes to Trace Groundwater Circulation in A Typical Groundwater Exploitation Reduction Area, North China Plain. South-to-North Water Transf. Water Sci. Technol. 2022, 20, 385–392. [Google Scholar]
  52. Xiao, X.; Zhang, X. Seasonal Variation and Influence Factors of River Water Isotopes in the East Asian Monsoon Region: A Case Study in the Xiangjiang River Basin Spanning 13 Hydrological Years. Hydrol. Earth Syst. Sci. 2023, 27, 3783–3802. [Google Scholar] [CrossRef]
  53. Xu, J.; Xiao, W.; Xiao, Q.; Wang, W.; Wen, X.; Hu, C.; Liu, C.; Liu, S.; Li, X. Temporal Dynamics of Stable Isotopic Composition in Lake Taihu and Controlling Factors. Environ. Sci. 2016, 37, 2470–2477. [Google Scholar]
  54. Tao, S.; Zhang, X.; Xia, J.; Xiao, Y.; Xiong, X.; Xu, J. Variations of Stable Isotopic Characteristics of Shallow Lake-River Water System and Its Indicative Significance in Lake Poyang Wetland, China. J. Lake Sci. 2024, 36, 487–498. [Google Scholar]
  55. Yin, G.; Ni, S.; Fan, X.; Wu, H. Isotopic effect and the deuterium excess parameter evolution in ice and snow melting process: A case study of isotopes in the water body of daocheng, sichuan province. Acta Geosci. Sin. 2004, 25, 157–160. [Google Scholar]
  56. Liu, Y.; Wang, S.; Tu, X.; Yang, Q. Characteristic analysis of dry-wet condition and temperature trend in yuanmou dry-hot valley (dhv) in recent 60 years. J. Drain. Irrig. Mach. Eng. 2018, 36, 172–178. [Google Scholar]
  57. Luo, Z.; He, Z.; Ou, Z.; Qi, D.; Peng, L.; Sun, Y. The variation and influencing factors of potential evapotranspiration in the yuanmou dry-hot valley from 1956 to 2019. J. Northeast. For. Univ. 2024, 52, 89–93. [Google Scholar]
  58. Gao, Z.; Yu, C.; Tian, Y.; Zhang, H. Slope zoning of atmospheric precipitation line and its water vapor source in mainland China. Ground Water 2017, 39, 149–152. [Google Scholar]
  59. Shao, J.; Zhao, Z.; Cui, Y.; Wang, R.; Li, C.; Yang, Q. Application of groundwater modeling system to the evaluation of groundwater resources in north china plain. Resour. Sci. 2009, 31, 361–367. [Google Scholar]
  60. Dansgaard, W. Stable isotopes in precipitation. Tellus 1964, 16, 436–468. [Google Scholar] [CrossRef]
  61. Luo, Z.; Guan, H.; Zhang, X.; Xu, X.; Dai, J.; Hua, M. Examination of the ecohydrological separation hypothesis in a humid subtropical area: Comparison of three methods. J. Hydrol. 2019, 571, 642–650. [Google Scholar] [CrossRef]
  62. Xiang, W.; Si, B.C.; Biswas, A.; Li, Z. Quantifying dual recharge mechanisms in deep unsaturated zone of chinese loess plateau using stable isotopes. Geoderma 2019, 337, 773–781. [Google Scholar] [CrossRef]
  63. Gu, H.; Chi, B.; Wang, H.; Zhang, Y.; Wang, M. Relationship between surface water and groundwater in the liujiang basin-hydrochemical constrains. Adv. Earth Sci. 2017, 32, 789–799. [Google Scholar]
  64. Sun, C.; Chen, W. Relationship between groundwater and surface water based on environmental isotope and hydrochemistry in upperstream of the haihe river basin. J. Geogr. Sci. 2018, 3, 790–799. [Google Scholar]
  65. Yin, L.; Zhang, J.; Wang, Z.; Dong, J.; Chang, L.; Li, C.; Zhang, P.; Gu, X.; Nie, Z. Groundwater circulation patterns and its resources assessment of inland river catchments in Northwestern China. Geol. China 2021, 48, 1094–1111. [Google Scholar]
Figure 1. Geographical location of the study area (a). Regional hydrogeology and sampling sites, groundwater flow direction from Yuanmou County 1:100,000 comprehensive hydrogeologic survey report (1999) (b). Hydrogeological profile from A to A’. The rock and soil in the valley area is loose and rainfall can easily infiltrate, forming a permeable but not water-laden recharge zone (c).
Water 17 00775 g001
Figure 2. δD-δ18O isotopic relationship of atmospheric precipitation in the study area.
Water 17 00775 g002
Figure 3. Spatial distribution of δD and δ18O isotopes in river samples (where symbol size represents isotope values).
Water 17 00775 g003
Figure 4. δD-δ18O isotope relationship between rivers and reservoirs in the study area.
Water 17 00775 g004
Figure 5. δD-δ18O isotopic relationship between well water and spring water in the study area.
Water 17 00775 g005
Figure 6. Spatial interpolation of δD and δ18O isotopes in groundwater samples.
Water 17 00775 g006
Figure 7. Simulation of water vapor source of atmospheric precipitation in the study area.
Water 17 00775 g007
Figure 8. Spatial distribution of δ18O in the study area (where symbol size represents isotope values).
Water 17 00775 g008
Figure 9. Pearson’s correlation analysis of δD-δ18O isotopes and other parameters. Color from red to blue represents negative to positive correlations. The larger symbol size represents more significant correlations.
Water 17 00775 g009
Figure 10. δD-δ18O isotope relationship in different water bodies in the study area.
Water 17 00775 g010
Figure 11. Spatial distribution of d-excess in different water bodies (where symbol size represents isotope values).
Water 17 00775 g011
Figure 12. Piezometric maps of groundwater during wet season.
Water 17 00775 g012
Table 1. Statistical characteristics of δD and δ18O isotopes in surface water and groundwater samples.
Type of Water BodyStatistical ValueWet SeasonDry Season
δD/‰δ18O/‰d-Excesslc-ExcessδD/‰δ18O/‰d-Excesslc-Excess
Well watermin−97−12.4−3.6−6.5−98−12.6−5.8−8.5
max−70−8.46.22.2−70−8.372.9
mean−82.0−10.41.1−2.4−83.2−10.61.2−2.5
std7.31.12.31.98.51.43.12.6
Spring watermin−101−13.2−1.6−4.7−90.0−12.30.0−3.2
max−75−9.39.85.5−76−9.58.44.0
mean−86.7−11.55.11.0−86.1−11.55.91.8
std8.31.44.03.55.01.02.82.4
Groundwatermin−101−13.2−3.6−6.5−98−12.6−5.8−8.5
max−70−8.49.85.5−70−8.38.44.0
mean−82.8−10.51.9−1.8−83.7−10.72.0−1.7
std7.61.23.12.68.11.33.53.0
River watermin−103−13.90.2−3.2−107−14.7−2.8−5.7
max−79−9.98.43.3−74−8.910.65.1
mean−89.4−11.63.6−0.5−87.7−11.54.20.1
std8.41.32.62.111.51.93.93.1
Reservoir watermin−76−9.5−4.2−6.8−88−11.3−4.2−7.2
max−69−8.10−3.2−71−8.42.4−1.6
mean−71.5−8.6−2.7−5.5−78.7−9.6−1.9−5.1
std3121.69243.1
Surface watermin−103−13.9−4.2−6.8−107−14.7−4.2−7.2
max−69−8.18.43.3−71−8.410.65.1
mean−85.2−10.92.1−1.7−85.9−11.13.0−0.9
std10.71.83.62.911.31.94.53.7
Table 2. Statistical characteristics of δD and δ18O isotopes in shallow well and borehole samples.
Type of Water BodyStatistical ValueWet SeasonDry Season
δD/‰δ18O/‰d-Excesslc-ExcessδD/‰δ18O/‰d-Excesslc-Excess
Dug wellmin−95−12.2−2.8−5.51−94−12.2−5.8−8.5
max−70−8.45.20.95−70−8.35.81.6
mean−78.6−9.90.9−2.5−78.6−9.90.4−2.9
std6.21.02.11.76.61.23.22.7
Boreholemin−97−12.4−3.6−6.48−98−12.6−2.8−5.7
max−74−8.86.22.17−74−8.972.9
mean−86.2−10.91.4−2.4−89.5−11.52.2−1.8
std6.31.02.52.26.71.02.72.4
Buried depth 0~10 mmin−95−12.2−1−4.19−94−12.2−5.8−8.5
max−71−8.95.20.95−70−8.45.81.6
mean−79.3−10.01.0−2.5−79.0−9.90.3−3.1
std6.51.01.81.57.11.23.12.6
Buried depth 10~30 mmin−97−12.4−3.6−6.48−98−12.6−3.6−6.2
max−70−8.44.60.66−70−8.35.21.1
mean−82.9−10.40.6−3.0−85.5−10.81.1−2.6
std7.91.22.62.29.21.42.82.3
Buried depth > 30 mmin−93−12.21−3.07−96−12.6−1−4.6
max−83−10.56.22.17−85−10.572.9
mean−87.8−11.43.0−1.0−89.7−11.63.4−0.7
std3.80.62.12.05.30.82.62.4
Table 3. Ratio of atmospheric precipitation and groundwater recharge to surface water.
SeasonCalculated ItemCalculation Item CompositionδD/‰δ18O/‰Mix Ratio According to δD/%Mix Ratio According to δ18O/%Mix Ratio According to Mean/%
Wet seasonend memberprecipitation−87.6−11.449.044.546.8
groundwater−82.8−10.551.055.553.3
mixed watersurface water−85.2−10.9100.0100.0100.0
Dry seasonend memberprecipitation−91.1−11.829.736.433.1
groundwater−83.7−10.770.363.667.0
mixed watersurface water−85.9−11.1100.0100.0100.0
Disclaimer/Publisher’s Note: The statements, opinions and data contained in all publications are solely those of the individual author(s) and contributor(s) and not of MDPI and/or the editor(s). MDPI and/or the editor(s) disclaim responsibility for any injury to people or property resulting from any ideas, methods, instructions or products referred to in the content.

