Article

Spatial and Seasonal Water Quality and Heavy Metal Pollution for Irrigation Use in Awash River, Ethiopia

by
Elias Kebede Hailu
1,2,*,
Tena Alamirew Agumassie
1,3,
Solomon Gebreyohannis Gebrehiwot
1,3,
Abebe Demissie Chukalla
4 and
Katrina Jane Charles
5
1
Ethiopian Institute of Water Resources, Department of Water Resources Engineering and Management, Addis Ababa University, Addis Ababa P.O. Box 3880, Ethiopia
2
Ethiopian Institute of Agricultural Research, Addis Ababa P.O. Box 2003, Ethiopia
3
Water and Land Resource Center, Addis Ababa University, Addis Ababa P.O. Box 3880, Ethiopia
4
Department of Land and Water Management, IHE Delft Institute for Water Education, 2611 AX Delft, The Netherlands
5
School of Geography and the Environment, University of Oxford, Oxford OX1 3QY, UK
*
Author to whom correspondence should be addressed.
Water 2025, 17(5), 757; https://doi.org/10.3390/w17050757
Submission received: 21 January 2025 / Revised: 20 February 2025 / Accepted: 21 February 2025 / Published: 5 March 2025
(This article belongs to the Section Water Use and Scarcity)

Abstract

:
Irrigation water quality impacts the agro-ecosystem, human health, and the overall well-being of the environment. The purpose of this study was to investigate upstream municipal and industrial pollution impacts on irrigated farming and ecosystem health. The suitability indices and Heavy Metal Pollution Index methods have been used to identify the contamination extent and corresponding spatial and seasonal variability. Samples were collected twice per annum, i.e., during the low-flow season and high-flow season (rainy season) in the 2022/23 year. Results showed that during the low-flow season, the salinity hazard was 0.7 dS/m to 2.5 dS/m and medium to high. Sodicity hazards were obtained below <10 for the low-flow season, and for the rainy season, medium (16.63), high (18–26), and very high (>26). The toxic level of chloride for low-flow season showed slight to moderate at 3.6 mg/L and 6.07 mg/L, and toxicity was severe at Deho (14.6 mg/L), slight to moderate at Ambash (4 mg/L), Ertaale Lake (5 mg/L), and Gewanie (4.6 mg/L) in high-flow seasons. No heavy metal contamination was observed for low-flow periods except at Werer Research, which had a Heavy Metal Pollution Index (HPI) > 100. But, during the rainy season, Kesem Dam, Sedi Weir, WARC Pumping, WARC Offtake, and Ambash had a HPI > 100, which implied contamination by metals. Cadmium (Cd) was at moderate to ecological risk at low flow in sites Kesem factory, WARC Offtake, Ertaale, Meteka, and Gewanie, whereas Sedi Weir (Cd and Hg) and WARC Offtake (Cd) were at moderate risk during high flow. To conclude, metal pollution is a serious concern that needs upstream quality monitoring.

1. Introduction

Human activities, such as farming, irrigation, damming rivers, and aquifer extraction, have an impact on watersheds and river systems [1]. These interventions result in the depletion of natural resources and modifications to ecosystem functions [2]. Furthermore, agriculture is the earliest form of human activity that has been used to produce food for consumption [3,4]. Nevertheless, the population’s rapid expansion has led to a situation where soil fertility is being reduced, water quality is declining, and ecosystem function is being impacted [5]. In a similar manner, some irrigation waters can directly harm plants, while others harm the structure of the soil [6,7]. Large-scale irrigation project development has improved global food security, especially in dry regions, but it has also been linked to issues with declining soil and water quality [8].
Awash Basin is the most developed basin in Ethiopia due to the availability of land suitable for agriculture, water resources that can be easily tapped, and its strategic location [9]. Furthermore, many of the big agro-industries and highly populated cities and towns in the country are found inside the Awash River Basin [8]. Hence, this basin is the most utilized river basin in Ethiopia, with a number of small-, medium-, and large-scale irrigation schemes (e.g., Fental–Tibila, Metahara, Kesem, Amibara, and Gewan) with a land potential of 200,000 ha of farmland [10].
However, inappropriate irrigation practices and poor-quality irrigation water resulted in the development of salt affected soil, a decline in production, a degradation of natural habitats and ecosystems, and abandoned agricultural lands [1,11,12]. In addition, the mismanagement of irrigation water, in the absence of a complementary drainage system, gave rise to waterlogging, the salinization of productive areas, and considerable losses in crop yields [13]. Thus, the use of poor-quality water for irrigation can create problems like toxicity, poor water infiltration, the degradation of soil’s physical properties, and other problems that lead to a reduction in crop production [4,14,15]. Even good-quality irrigation water with an electrical conductivity (ECw) of 0.15 dS m-1 adds one ton/ha of soil after an application of 1 m depth of water [4,16,17]. Since potential crop yield reductions are expected from the use of saline water, the regular monitoring of irrigation water quality needs to be undertaken [18,19]. On the other hand, soils that are not naturally salt-affected soils can also experience high salt accumulation due to unsustainable management practices, including the use of low-quality irrigation water, inadequate irrigation methods, poor drainage, the removal of deep-rooted vegetation resulting in raised water table, the mismanagement of agricultural soil changes, and fertilizer use [17]. In addition, ecosystem change included climate change (affecting water supply and timing of flows), land use change (expanding agriculture increases water demand), and demographic change (growing population increases water demand), urbanization wastewater, and industrial wastewater [15,20].
Recently, the accumulation of toxic metals in irrigated soils and the discharge of wastewater into the river basin concerns the impact of the agro-ecosystem, human health, and environmental pollution [21]. Therefore, a water quality index is an indicator of the quality of water obtained by aggregating several water quality measurements into one number [18]. These assess changes in the quality of the water resource, identifying water quality problems for which special studies are needed and evaluating the performance of pollution control programs [15,16].
For this particular study, water quality was assessed based on its suitability standards and indices for irrigation use. Salinity is the most important criterion for evaluating the quality of irrigation water because of the potential crop yield reductions [14,22,23]. Furthermore, heavy metal pollution of irrigation water has become a serious environmental problem, mainly in upper Awash, with high industrialization and rapid growth leading to the destruction of the balance of the ecosystem [21,24]. At the same time, it enters the human body through the food chain and other channels and accumulates in the human body, endangering human health [25]. Therefore, heavy metals (boron, arsenic, copper, chromium, lead, zinc, manganese, mercury and nickel) need to be assessed for their degree of pollution in the basin using the standard pollution index and hazard classification [20,26].

2. Materials and Methods

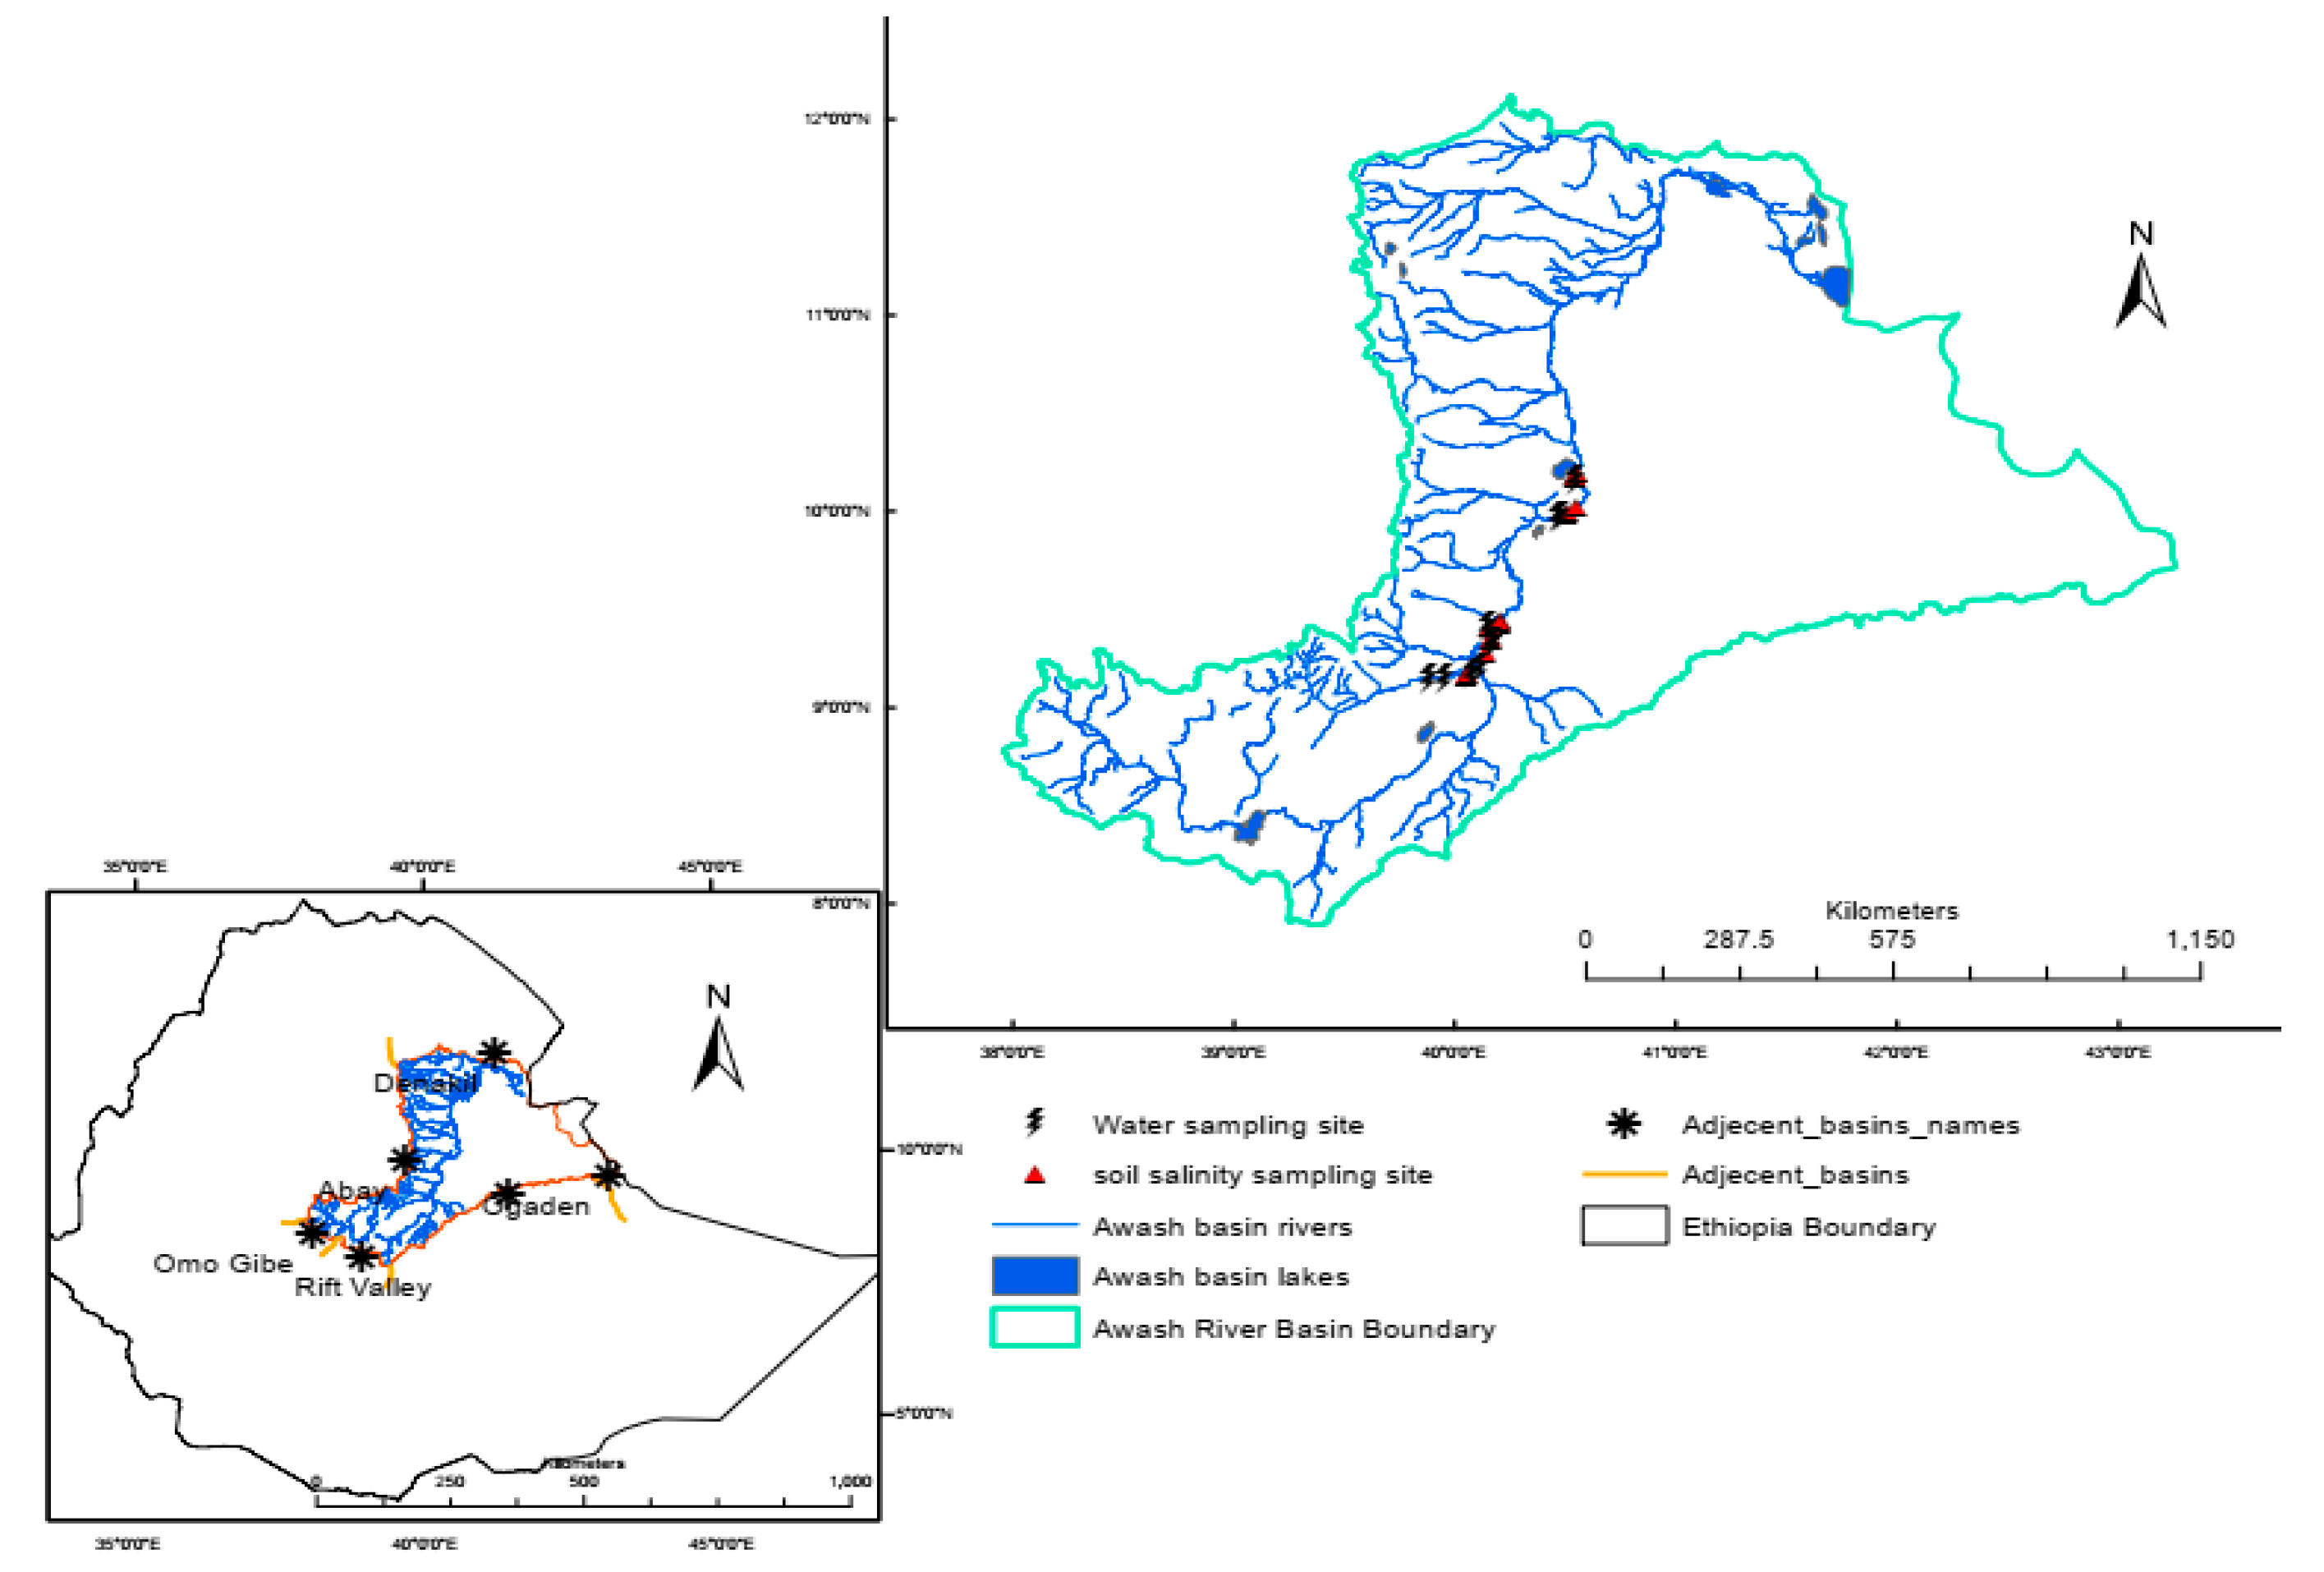
2.1. Study Area Description

The Awash River Basin is situated between 7°53′42′′ and 12°07′20′′ north latitude and 37°56′56′′ and 43°17′04′′ east longitude. It is bordered by the Danakil, Abbay, Omo-Gibe, and Rift Valley lakes, and Wabi Shebele Basin, as well as the Republic of Djibouti. The river originates near Ginchi in the central highlands of Ethiopia and flows northeast through the northern section of the Rift Valley, eventually discharging into Lake Abbe near the Djibouti border, covering a distance of approximately 1200 km. The basin has a total catchment area of about 115,906 square kilometers (Figure 1). The Awash River Basin is the only region in Ethiopia with extensive water resource development and offers the best potential for large-scale agricultural expansion, with an irrigable land potential of 206,000 hectares and a mean annual river flow of 4.9 billion cubic meters (BCM) [10].

2.2. Sampling Design

Water sampling and collection were conducted twice a year: (i) during the middle of the dry season and (ii) during the middle of the main rainy season. Irrigation water samples were collected using two-liter polyethylene bottles, which were acid-washed and rinsed prior to use. Sampling was carried out at 10 locations along the river course and other water bodies within the basin, including dams, hot springs, and lakes. To ensure representative sampling, a total of 20 water samples were collected using the grab method, combining multiple sub-samples taken at 5 min intervals. At each sampling site, two-liter acid-washed polyethylene bottles were used to collect irrigation water samples.

2.3. Analysis of Water Quality Parameters

2.3.1. Measurement of Physico-Chemical Parameters

The collected water samples were subjected to detailed laboratory analysis to evaluate a range of physico-chemical parameters. These included pH, electrical conductivity (EC), concentrations of dissolved cations (calcium (Ca2+), magnesium (Mg2+), sodium (Na+), and potassium (K+)), anions (bicarbonate (HCO3), carbonate (CO32−), chloride (Cl), sulfate (SO42−), and nitrate (NO3)), as well as alkalinity. Based on these measurements, key irrigation water quality indices, such as the sodium adsorption ratio (SAR) and residual sodium carbonate (RSC), were calculated. The pH of the water samples was measured using a digital pH meter, while the electrical conductivity (ECw) was determined using a conductivity meter [27]. The pH of the water samples was measured using a digital pH meter, while electrical conductivity (ECw) was determined using a conductivity meter. These measurements provided insights into the water’s acidity/alkalinity and salinity levels, respectively. Alkalinity, which reflects the concentration of bicarbonate (HCO3) and carbonate (CO32−) ions, was measured within 12 to 24 h after sample collection. This was achieved by titrating the samples with a standard acid solution until a pH of 4.5 was reached. Chloride (Cl) concentration was quantified using the silver nitrate titrimetric method, which involves the reaction of chloride ions with silver nitrate to form a precipitate. Sulfate (SO42−) concentration was assessed using either the barium sulfate turbidimetric method or the gravimetric method, depending on the laboratory setup [4,27]. Nitrate (NO3) concentration was determined following the standardized procedures outlined in the United Nations Food and Agricultural Organization (FAO) Irrigation and Drainage Report 29 Rev 1.
This method ensures the accurate and consistent measurement of nitrate levels, which is critical for assessing water suitability for irrigation. Calcium (Ca2+) and magnesium (Mg2+) ions were detected using an atomic absorption spectrophotometer (AAS), which provides precise measurements of these cations. Sodium (Na+) and potassium (K+) ions were evaluated using a flame photometer, which measures the intensity of light emitted by these elements when excited in a flame. Total dissolved salts (TDSs) were determined by summing the concentrations of all individual ions measured in the water samples. For solutions with an EC range of 0.1 to 5.0 mmhos/cm, TDS (in mg/L or ppm) was estimated by multiplying the EC value (in mmhos/cm) by a conversion factor of 640 [17,28].
The sodium adsorption ratio (SAR) was calculated using Equation (1). SAR is a critical parameter for evaluating the sodium hazard in irrigation water and is calculated as follows: Here, the concentrations of sodium (Na+), calcium (Ca2+), and magnesium (Mg2+) are expressed in milliequivalents per liter (meq/L). The SAR value indicates the relative proportion of sodium ions to calcium and magnesium ions in the water, which is essential for assessing its suitability for irrigation [4]. The residual sodium carbonate (RSC) was calculated using Equation (2). RSC is a measure of the excess carbonate and bicarbonate ions over calcium and magnesium ions and is computed as follows: Here, the concentrations of bicarbonate (HCO3), carbonate (CO32−), calcium (Ca2+), and magnesium (Mg2+) are expressed in milliequivalents per liter (meq/L). RSC is used to assess the potential for sodium accumulation in soils, which can affect soil structure and crop growth [27]. By analyzing these parameters and computing SAR and RSC, this study provides a comprehensive evaluation of the water quality in the Awash River Basin, particularly for its suitability for irrigation and agricultural purposes.
SAR = Na + Ca 2 + + Mg 2 + 0.5
RSC = HCO 3 + CO 2 3 Ca 2 + Mg 2 +
Finally, the quality and suitability of irrigation water were evaluated based on the analyzed parameters. The classification of water into various appropriateness categories was conducted using the standards established by the US Salinity Laboratory Staff, which are widely adopted by many countries as a benchmark for assessing irrigation water quality. These standards provide a framework for determining the suitability of water for different uses. It is important to note that Ethiopia does not have its own specific standards for irrigation water quality suitability and hazard limits. Therefore, the assessment relied on the outputs of the analysis and the US Salinity Laboratory Staff’s guidelines to classify the water into appropriate categories [27].

2.3.2. Irrigation Water Quality Indices

The quality of water for various applications, such as human and livestock consumption, crop irrigation, and other uses, is determined by the concentration and composition of soluble salts present in it [27]. As a result, water quality is a critical factor in the sustainable utilization of water for irrigated agriculture, especially in regions where salinity is expected to become a concern [4]. Key challenges associated with irrigation water include salinity, sodicity, and ion toxicity. To assess water quality for irrigation, essential parameters such as water salinity (measured by electrical conductivity, EC), sodium hazard (evaluated through the sodium adsorption ratio, SAR), residual sodium carbonates (RSCs), and ion toxicity are considered. Additionally, plant toxicity related to boron and chloride levels is also taken into account, as highlighted in [4,22,27,28].
Salinity levels are a primary concern in most irrigation systems, as excessive salts can adversely affect both soil structure and crop productivity [29]. Additionally, irrigation water often contains various trace elements that may restrict its suitability for agricultural use [30]. Assessing irrigation water quality and selecting appropriate management strategies involve evaluating multiple factors, with salinity risk being a key consideration [28]. To classify irrigation water quality, parameters such as electrical conductivity (EC), the sodium adsorption ratio (SAR), residual sodium carbonate (RSC), pH, chloride, hardness, and alkalinity were evaluated using the standards established by the US Salinity Laboratory (USSL) [4,18,27].
A significant issue arises when irrigation water contains high salt concentrations, particularly due to the impact of sodium on soil properties, which is referred to as the sodium hazard. The sodium adsorption ratio (SAR) is a widely used indicator to quantify the sodium hazard [31]. SAR is calculated based on the ratio of sodium (Na+) to calcium (Ca2+) and magnesium (Mg2+) ions in the water, as outlined in [27]. This metric helps determine the potential for sodium-induced soil degradation and guides the selection of appropriate irrigation practices.

2.3.3. Heavy Metal Analysis Indices

The concentrations of heavy metals (Cr, Cd, Zn, Fe, Pb, As, Mn, Cu, Hg, Ni, Co, and B) in the water samples were measured using an Inductively Coupled Plasma Optical Emission Spectrophotometer (ICP-OES). To assess the potential risks associated with heavy metal contamination, several pollution indices were employed, including the Heavy Metal Pollution Index (HPI) Equation (3), the metal index (MI) Equation (4), and the Ecological Risk Index (ER) and Risk Index (RI) Equation (5) [32,33]. These indices provide a comprehensive evaluation of the environmental and ecological risks posed by heavy metals in the water.
HPI = n i = 0 W i Q i W i
MI = n i = 0 C i MAC i
RI = 1 n ER i ,     ER i = T i × C i Cb i
where HPI: Heavy Metal Pollution Index, Wi Qi: weighted average heavy metal concentration, Wi: concentration factor MI: single metal pollution index, Ci: concentration of metal, MACi: maximum allowable metal concentration, RI: Ecological Risk Index, ERi: ecological pollution index for heavy metal, i, and Ti is the toxic response coefficient for the metal i.

3. Results

3.1. Irrigation Water Quality (IWQ)

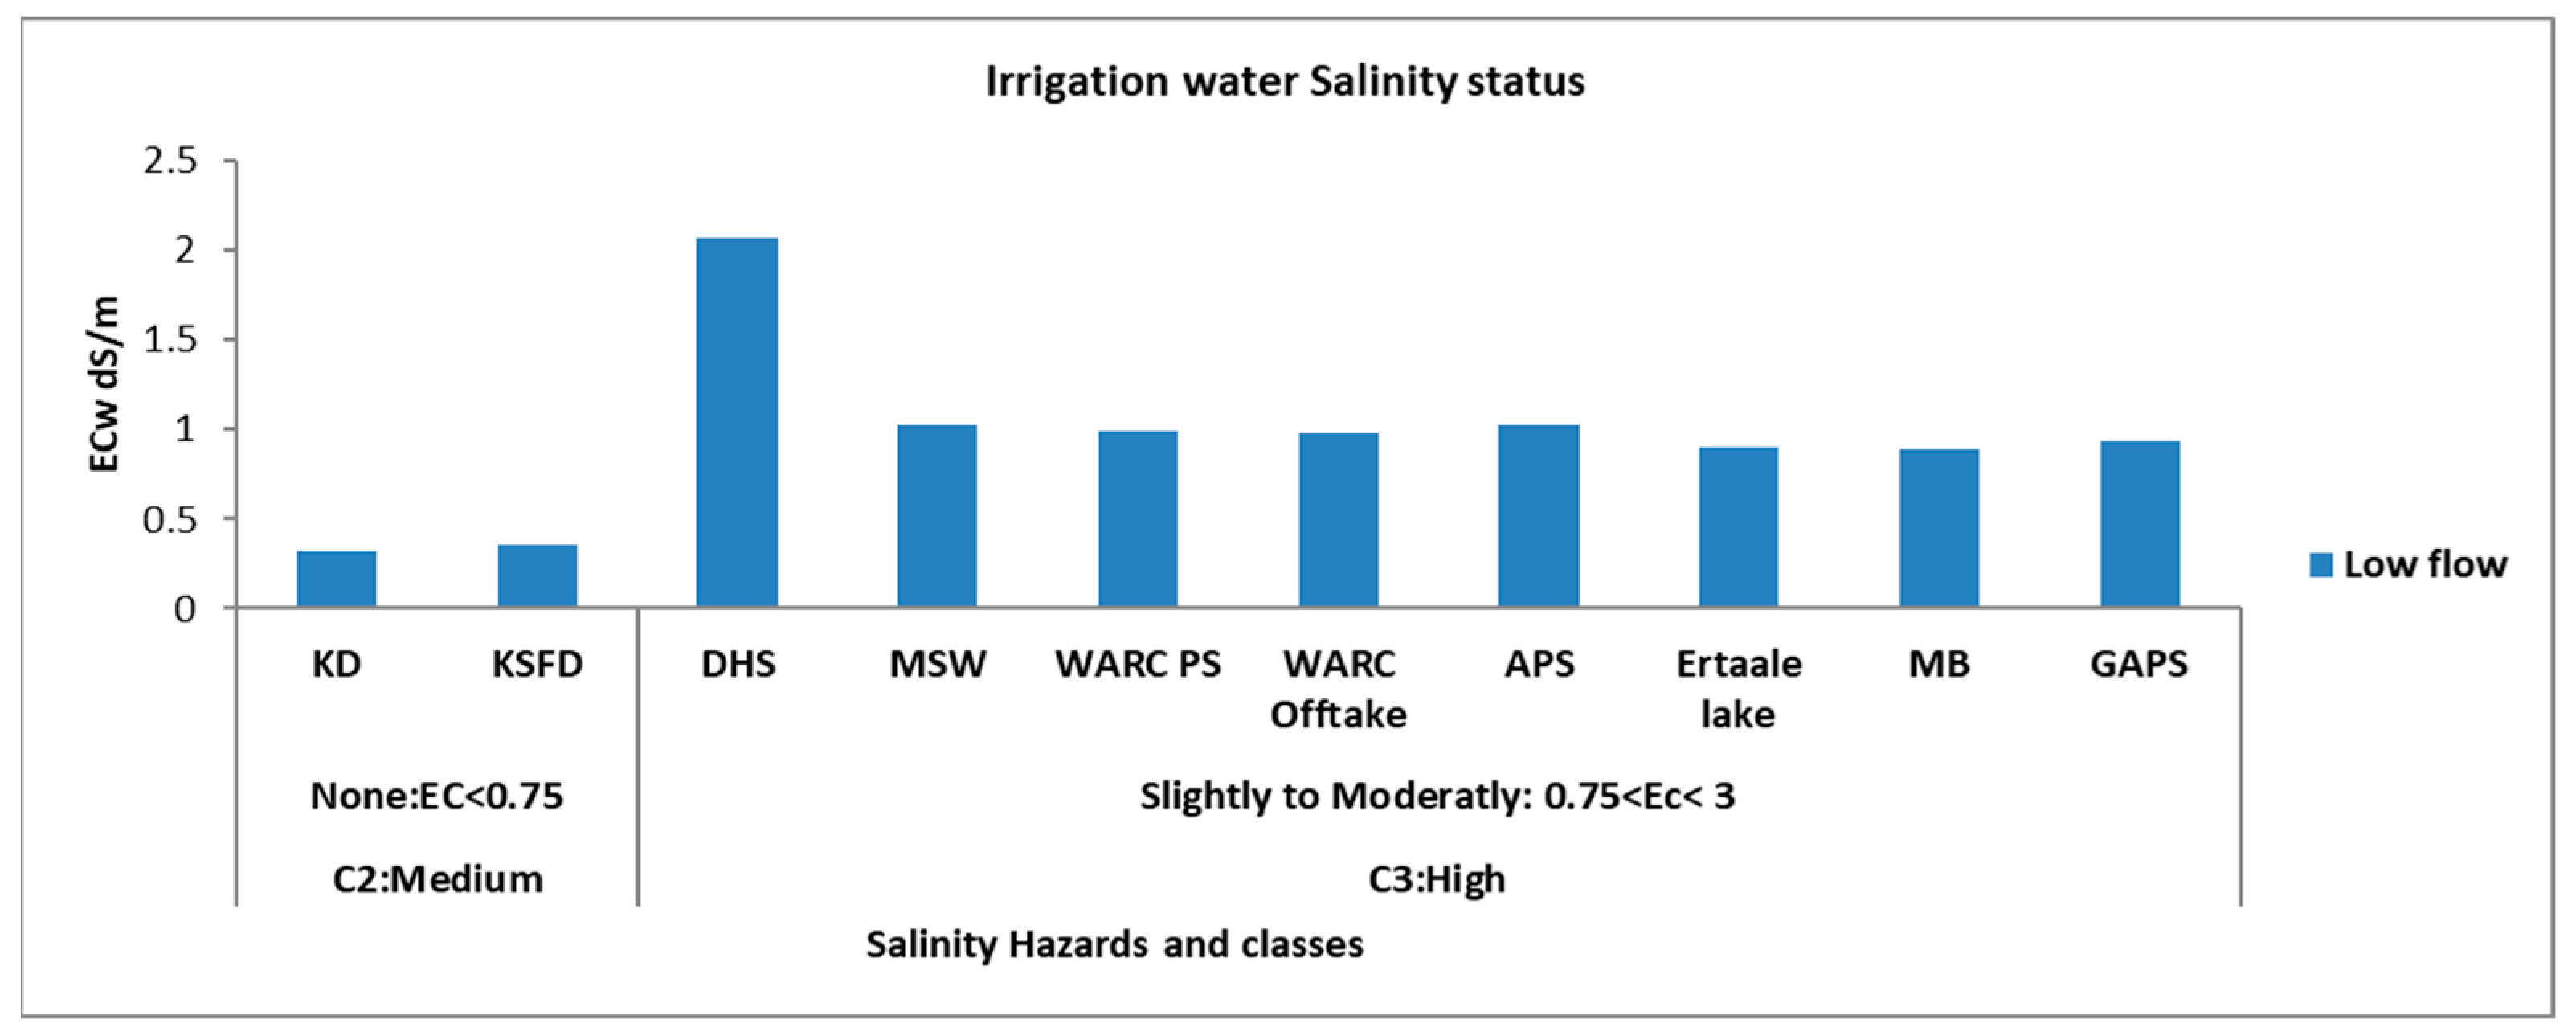
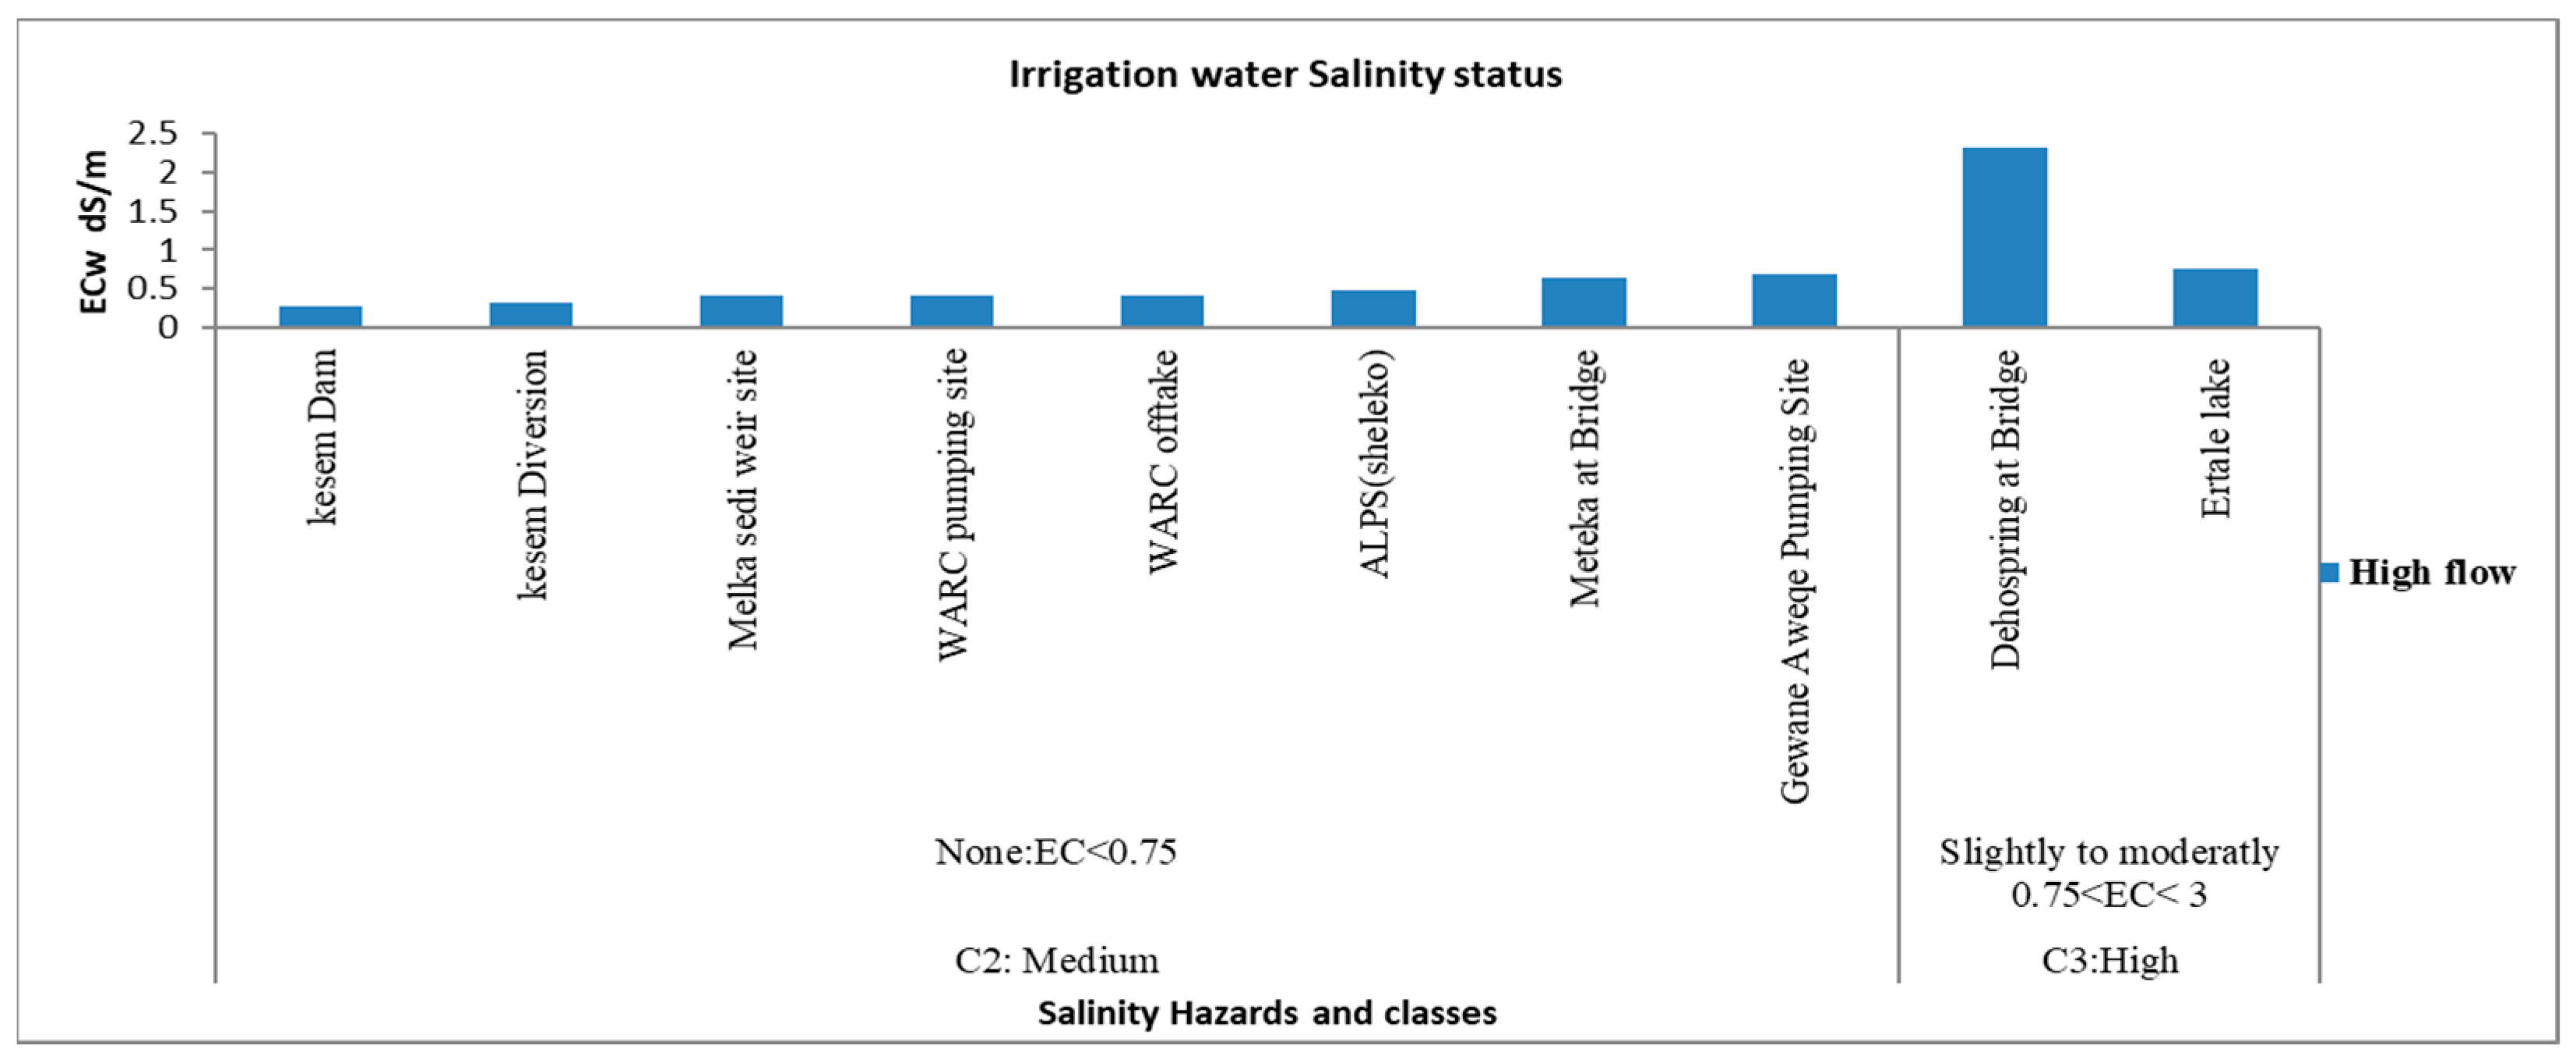
3.1.1. Salinity Hazard and Salinity Class

This study revealed that the salinity status, classes, and hazards of irrigation water in the Middle Awash Basin ranged from C2 (medium salinity hazard) to C3 (high salinity hazard) during both the low-flow and high-flow seasons, as illustrated in Figure 2, Figure 3 and Figure 4.
During the low-flow season, measurements at Kesem Dam (0.32 dS/m) and Kesem Sugar Factory Diversion (0.36 dS/m) indicated a medium salinity hazard (EC < 0.75 dS/m), as shown in Figure 2. These locations exhibited relatively low electrical conductivity (EC) values, suggesting a lower risk of salinity-related issues for irrigation. However, at other locations within the middle Awash Basin, EC values ranged from 0.7 to 2.5 dS/m, signaling a significant salinity risk (Figure 2). These locations included the following: Deho Hot Spring (DH); Melka Sedi Weir (MSW); Werer Research Pumping Station (WARCPS); Werer Research Offtake (WARC Offtake); Ambash Pumping Station (APS); Ertaale Lake; Meteka (MB); Gewanie Pumping Station (GAPS). Despite the variability in EC values, most locations fell within salinity classes C2 and C3, indicating a medium to high salinity hazard; Figure 3 and Figure 4. While these levels pose some risk, the water remains generally suitable for irrigation, provided appropriate management practices are implemented to mitigate salinity-related issues.
During the high-flow season, Deho Hot Spring recorded the highest conductivity value of 2.31 dS/m, while Ertaale Lake had the lowest EC value of 0.76 dS/m. Other locations exhibited lower EC values, including the following: Kesem Dam (0.27 dS/m); Kesem Sugar Factory (0.31 dS/m); Melka Sedi Weir (0.42 dS/m); Werer Research Pumping Station (0.41 dS/m); Werer Research Offtake (0.42 dS/m); Ambash Pumping Station (0.48 dS/m); Meteka at Bridge (0.65 dS/m); Gewanie Aweqe Pumping Station (0.68 dS/m). These lower EC values during the high-flow season reflect a reduced salinity hazard compared to the low-flow season, as depicted in Figure 2.
The fluctuation in EC values is closely tied to seasonal rainfall patterns, which influence the volume of water entering the river system. During the rainy season (high flow), the dilution effect of increased water flow typically reduces salinity levels, resulting in lower EC values and a reduced salinity hazard (Figure 4). Conversely, during the dry season (low flow), reduced water flow leads to higher concentrations of dissolved salts, increasing the salinity hazard (Figure 3). This seasonal variability underscores the dynamic nature of water quality in the middle Awash Basin.
The findings highlight the importance of considering seasonal changes when assessing water suitability for irrigation and implementing adaptive water management strategies to address salinity risks effectively. This study also highlighted that the middle course of the Awash Basin has been categorized as having slight to moderate salinity risks, consistent with previous research. These studies have indicated that salinity risks in the area have been increasing since the introduction of irrigation practices, as referenced in studies [34].
High electrical conductivity (ECw) in irrigation water, often referred to as salinity hazard, poses significant challenges for agricultural productivity. As EC levels rise, the osmotic pressure of the soil solution increases, creating a physiological drought condition. This occurs because plants can only absorb “pure” water, and the presence of excessive salts in the soil solution makes it harder for plants to compete with ions for water uptake. As a result, even if the soil appears moist, plants may wilt due to the inability to access sufficient water, leading to reduced crop yields. The relationship between water transpiration and crop yield is well established, with higher salinity levels directly impacting the amount of water transpired by plants [35]. This, in turn, reduces yield potential, as highlighted in studies [36,37,38]. Furthermore, excessive salt accumulation in the soil can degrade soil structure, reduce water infiltration rates, and hinder root development, exacerbating the negative effects on crop growth [36,37,39,40,41].

3.1.2. Sodium Hazard and Sodium Class of Irrigation Water

During the low-flow season, all locations exhibited low sodicity hazard, with SAR values consistently below 10. These results fall under the sodicity class S1, indicating that the water in these areas is safe for irrigation with a minimal risk of soil sodicity issues. However, the situation changes during the high-flow season, where higher SAR values were observed, leading to increased sodicity hazards. In Kesem Dam (KD), SAR values ranged between 10 and 18, indicating a medium sodicity hazard. This places Kesem Dam in the sodicity class S2, suggesting a moderate risk of soil sodicity, which may require careful management if used for irrigation (Table 1).
In contrast, locations such as KSFD, MSW, and WARC Offtake recorded SAR values between 18 and 26, indicating a high sodicity hazard. These areas were classified under the sodicity class S3, signifying a significant risk of soil degradation due to high sodium content. Irrigation with such water could lead to soil structure deterioration and reduced permeability, necessitating mitigation measures. Furthermore, several locations exhibited very high sodicity hazards, with SAR values exceeding 26. These areas include DHS, WARC PS, APS, Ertalale, MB, and GAPS, which were categorized under the sodicity class S4 during the high-flow season (Table 1). Water with such high SAR values is considered unsuitable for irrigation due to the severe risk of soil sodicity, which can lead to long-term soil damage and reduced agricultural productivity.
In summary, while all locations were safe for irrigation during the low-flow season (SAR < 10, class S1), the high-flow season revealed significant variations in sodicity hazards (Table 1). Areas like KD showed moderate risk (SAR 10–18, class S2), while KSFD, MSW, and WARC Offtake faced high risk (SAR 18–26, class S3). The most critical areas, such as DHS, WARC PS, APS, Ertalale, MB, and GAPS, had very high sodicity hazards (SAR > 26, class S4), rendering the water unsuitable for irrigation.
These findings underscore the importance of monitoring and managing irrigation water quality, particularly in regions like the middle Awash Basin, where seasonal variations significantly influence water chemistry. This study highlights the need for adaptive irrigation strategies during the high-flow season to mitigate the risks associated with increased sodicity and ensure sustainable agricultural practices [42,43,44].

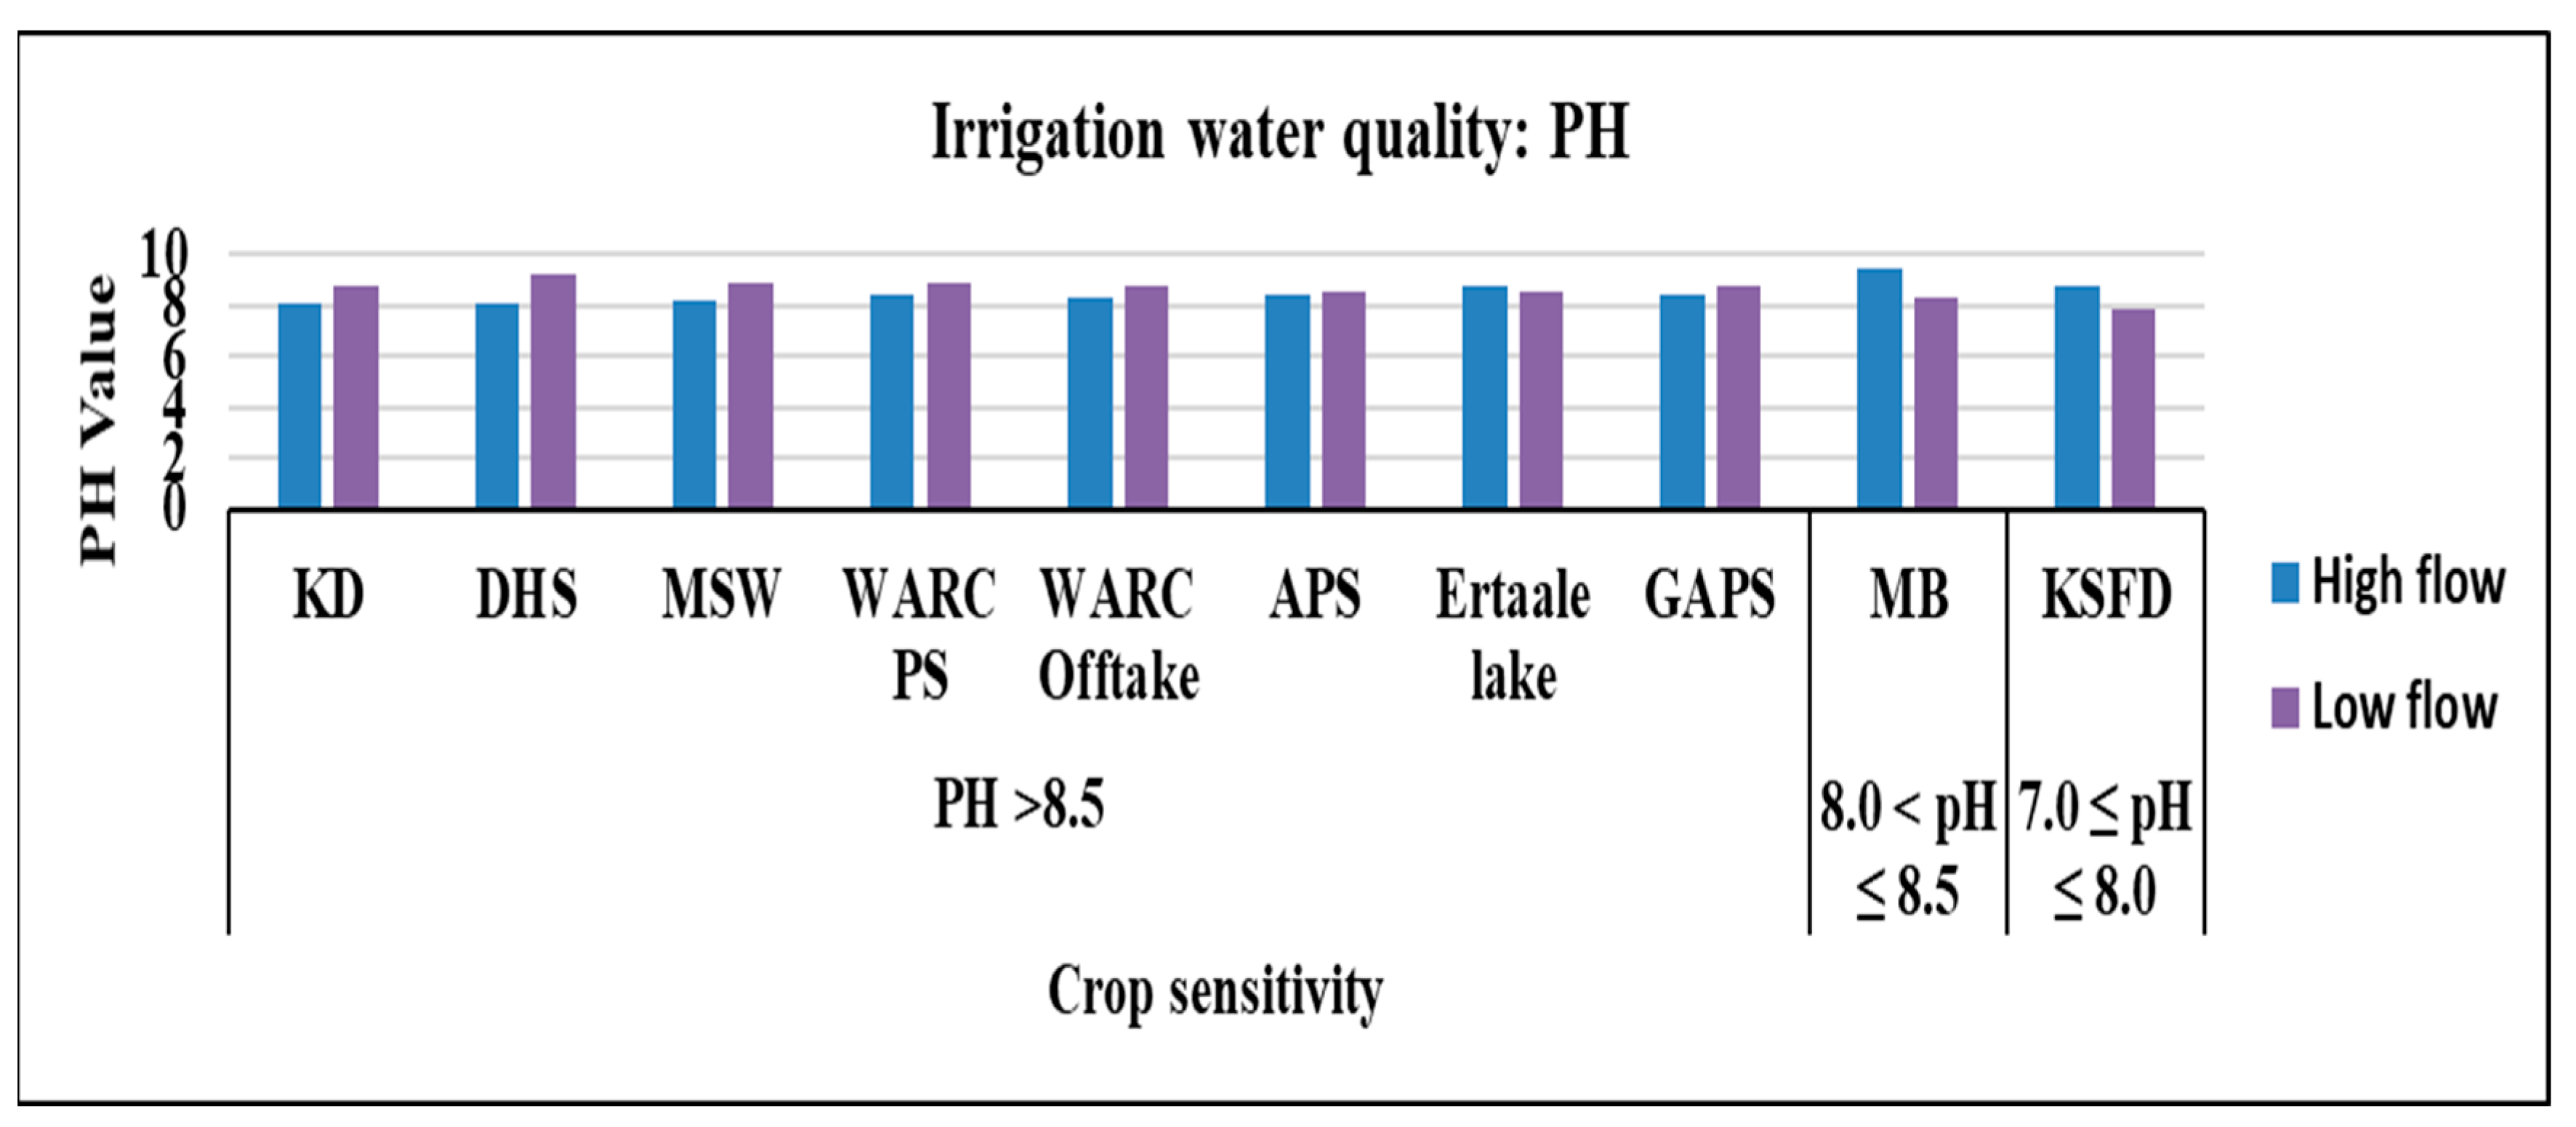
3.1.3. pH Levels and Implications for Crop Sensitivity

The analysis of water quality in the study area revealed that pH levels consistently exceeded the limits recommended by the Food and Agriculture Organization (FAO) for irrigation water, as illustrated in Figure 5. During the low-flow season, pH values along the Awash River ranged from a minimum of 7.82 to a maximum of 9.28, indicating a predominantly alkaline environment. Specifically, pH > 8.5 was recorded at several locations, including at the following: Kesem Dam (8.74); Deho Hot Spring (9.28); Melka Sedi Weir (8.87); Werer Agricultural Research Center (WARC) Pumping Station (8.89); WARC Offtake (8.81); Ambash Pumping Station (8.62); Ertaale Lake (8.53); Gewanie Pumping Station (8.84); 8.0 < pH ≤ 8.5 was observed at Meteka (8.38). The lowest pH value of 7.82 was recorded at Kesem Sugar Factory Diversion; Figure 5. These elevated pH levels suggest that the water in the middle Awash Basin is highly alkaline, which can negatively impact crops sensitive to pH variations. Alkaline conditions can lead to nutrient imbalances, the reduced availability of essential micronutrients (such as iron, zinc, and phosphorus), and impaired root function, ultimately reducing crop yields. During the high-flow season, pH levels showed some variation but remained predominantly alkaline. Key observations include the following: pH > 8.5 was recorded at Deho Hot Spring (9.44) and Ertaale Lake (8.76). At other locations, pH values in the range of 8.0 < pH ≤ 8.5, as shown in Table 2.
The relatively lower pH values during the high-flow season can be attributed to the dilution effect of rainfall, which reduces the concentration of alkaline substances in the water. However, even during this period, the pH levels remained above the optimal range for irrigation water, indicating that the water quality is still unsuitable for pH-sensitive crops. The findings highlight that the water quality in the middle Awash Basin poses a significant risk to pH-sensitive crops. Crops such as beans, potatoes, and certain fruits are particularly vulnerable to alkaline conditions, which can lead to high pH levels which can limit the availability of essential nutrients, leading to deficiencies that impair plant growth and development. Alkaline water can cause physiological stress in plants, reducing their ability to absorb water and nutrients, ultimately lowering crop yields. The prolonged use of alkaline irrigation water can lead to soil alkalization, further exacerbating nutrient imbalances and reducing soil fertility over time. The study also emphasizes the seasonal variability in water quality, with pH levels being more alkaline during the low-flow season and slightly lower during the high-flow season. This variability is primarily driven by the volume of rainfall, which dilutes alkaline substances in the river during the rainy season. However, even during the high-flow season, the pH levels remain above the safe threshold for irrigation, indicating that the water quality in the middle Awash Basin is consistently unsuitable for pH-sensitive crops. The findings emphasize the need for adaptive irrigation strategies, such as the use of acidifying agents or the selection of pH-tolerant crop varieties, to mitigate the adverse effects of alkaline water on crop production. Additionally, the continuous monitoring and management of water quality are essential to ensure sustainable agricultural practices in the region.

3.1.4. Chloride Toxicity

The analysis of chloride concentrations in the study area showed varying levels of chloride toxicity across different locations during both the low- and high-flow seasons. During the low-flow season, chloride toxicity levels ranged from modest to moderate at several locations: Melka Sedi Weir recorded a chloride concentration of 6.07 mg/L, and WARC Pumping Station showed a chloride concentration of 4.1 mg/L (Figure 4). In contrast, Deho Hot Spring exhibited severe chloride toxicity with a concentration of 14.6 mg/L, while other locations such as Ambash Pumping Station (4 mg/L), Ertaale Lake (5 mg/L), and Gewanie Pumping Station (4.6 mg/L) displayed slight to moderate toxicity. Chloride concentrations at all other locations were below 4 mg/L, indicating non-toxic conditions (Figure 6). However, during the high-flow season, chloride toxicity levels were generally lower, with no locations exhibiting potentially hazardous concentrations. This reduction in chloride levels can be attributed to the dilution effect of increased rainfall, which lowers the concentration of dissolved salts in the water (Figure 6). As a result, elevated chloride levels in irrigation water can lead to chloride ion accumulation in plant tissues, causing leaf burn, reduced growth, and yield loss. Additionally, chloride toxicity can exacerbate the effects of salinity, further impairing crop performance and soil health [45,46].

3.2. Irrigation Water’s Heavy Metal Pollution Index and Ecological Risk Index

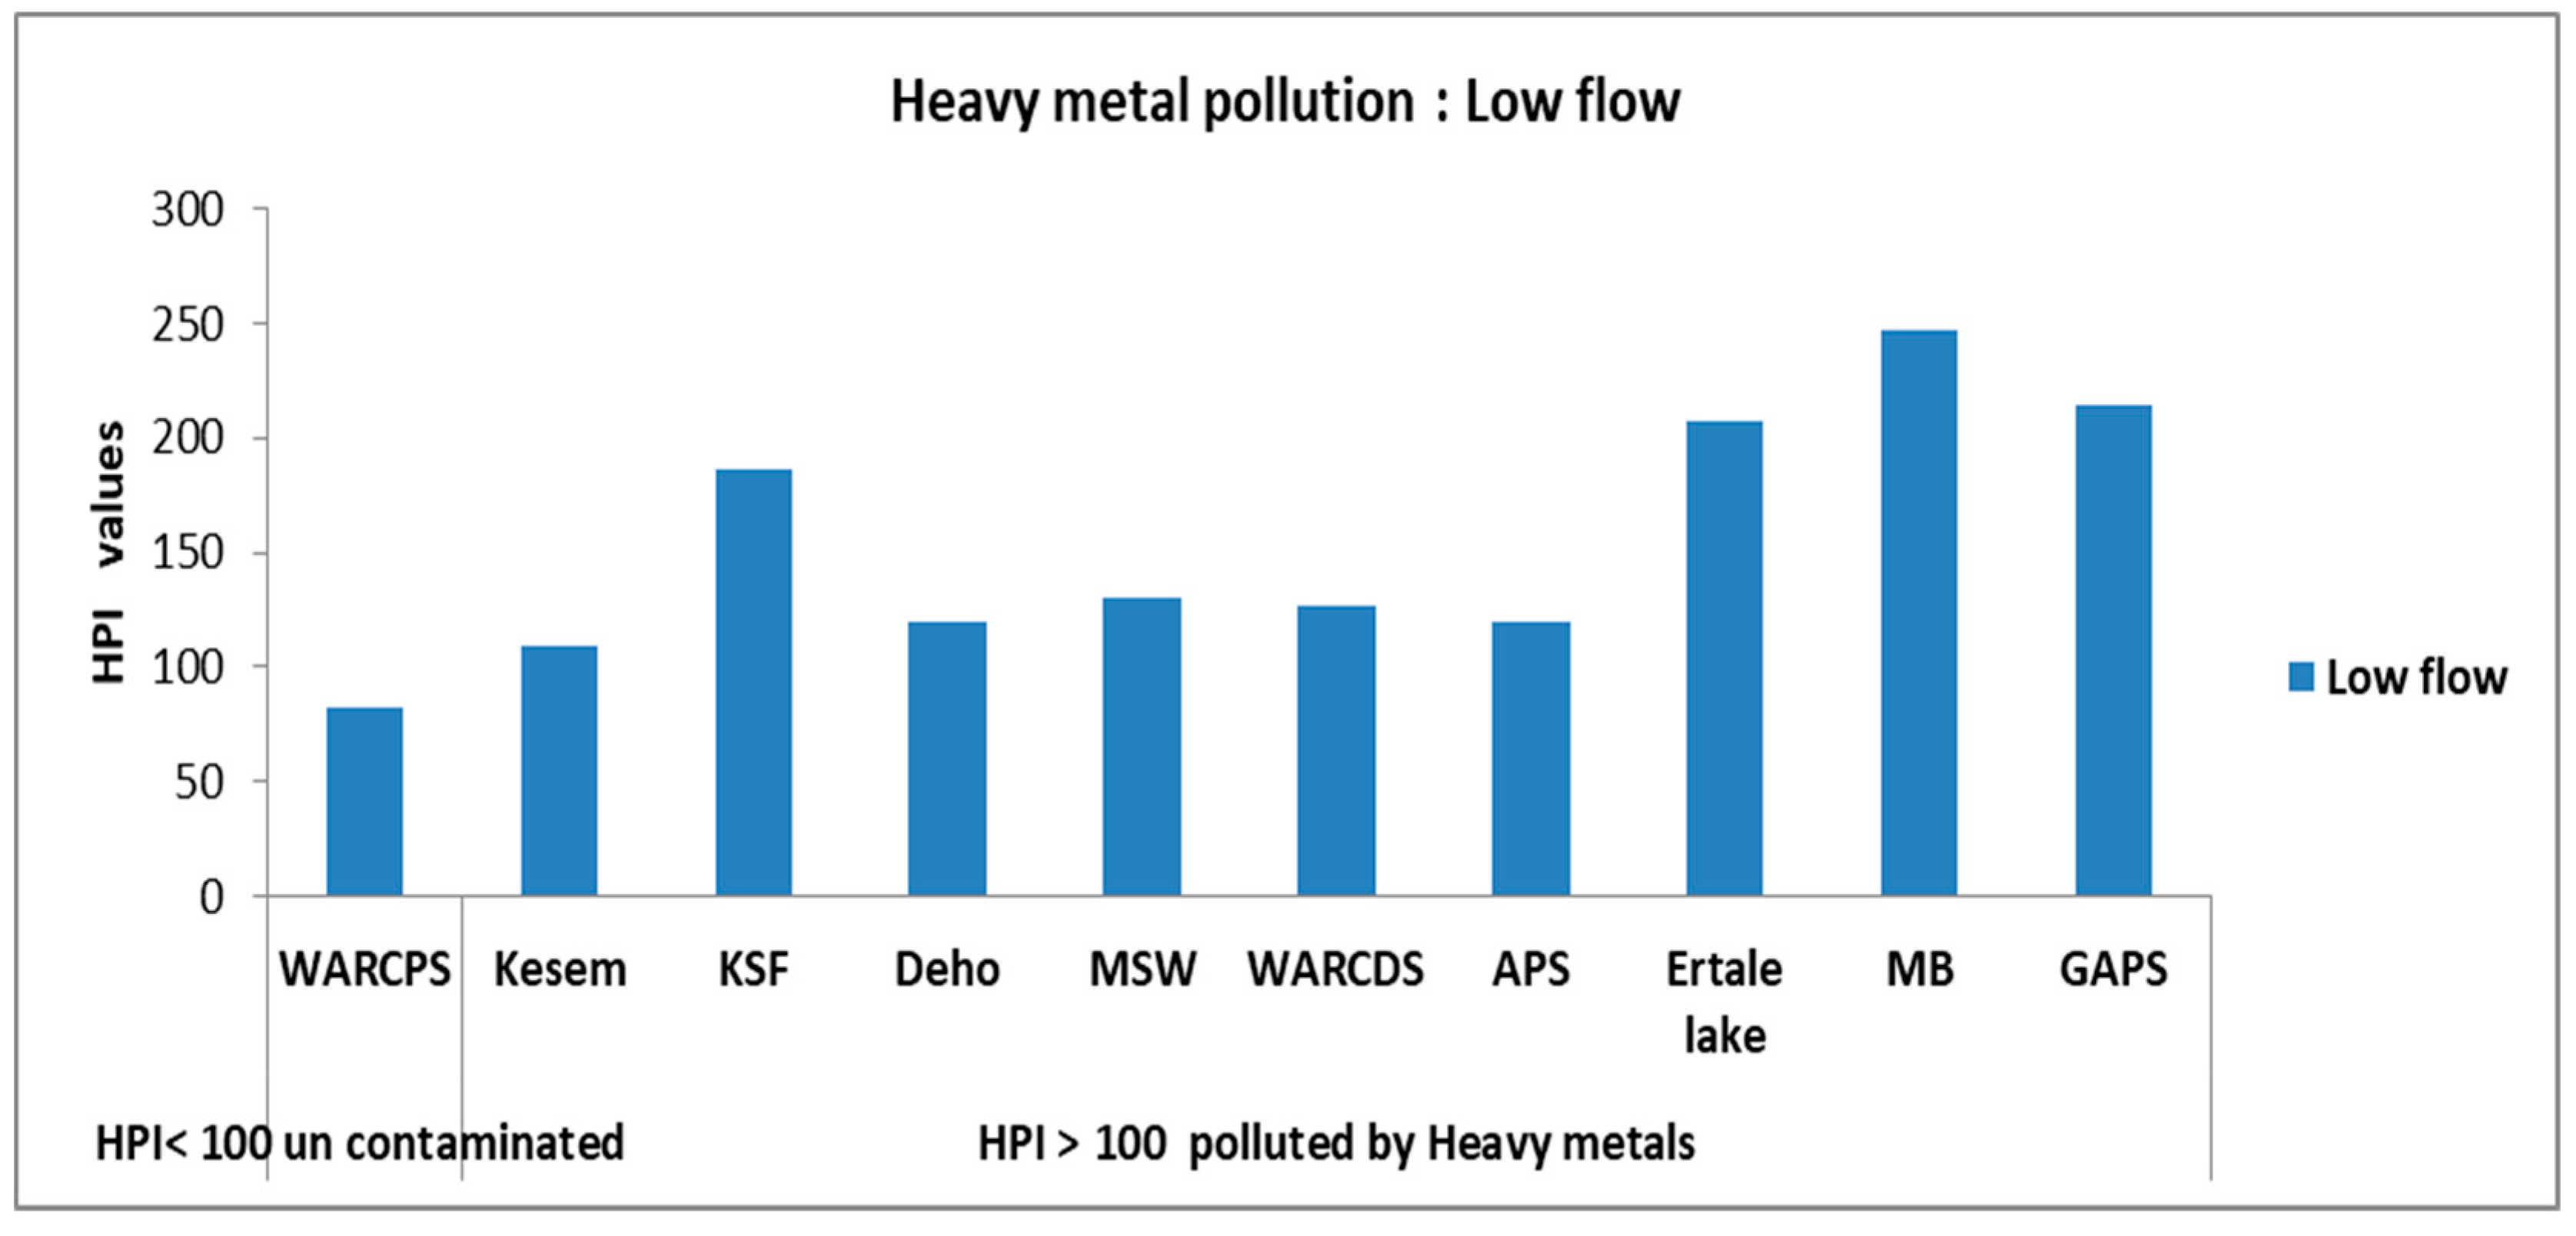
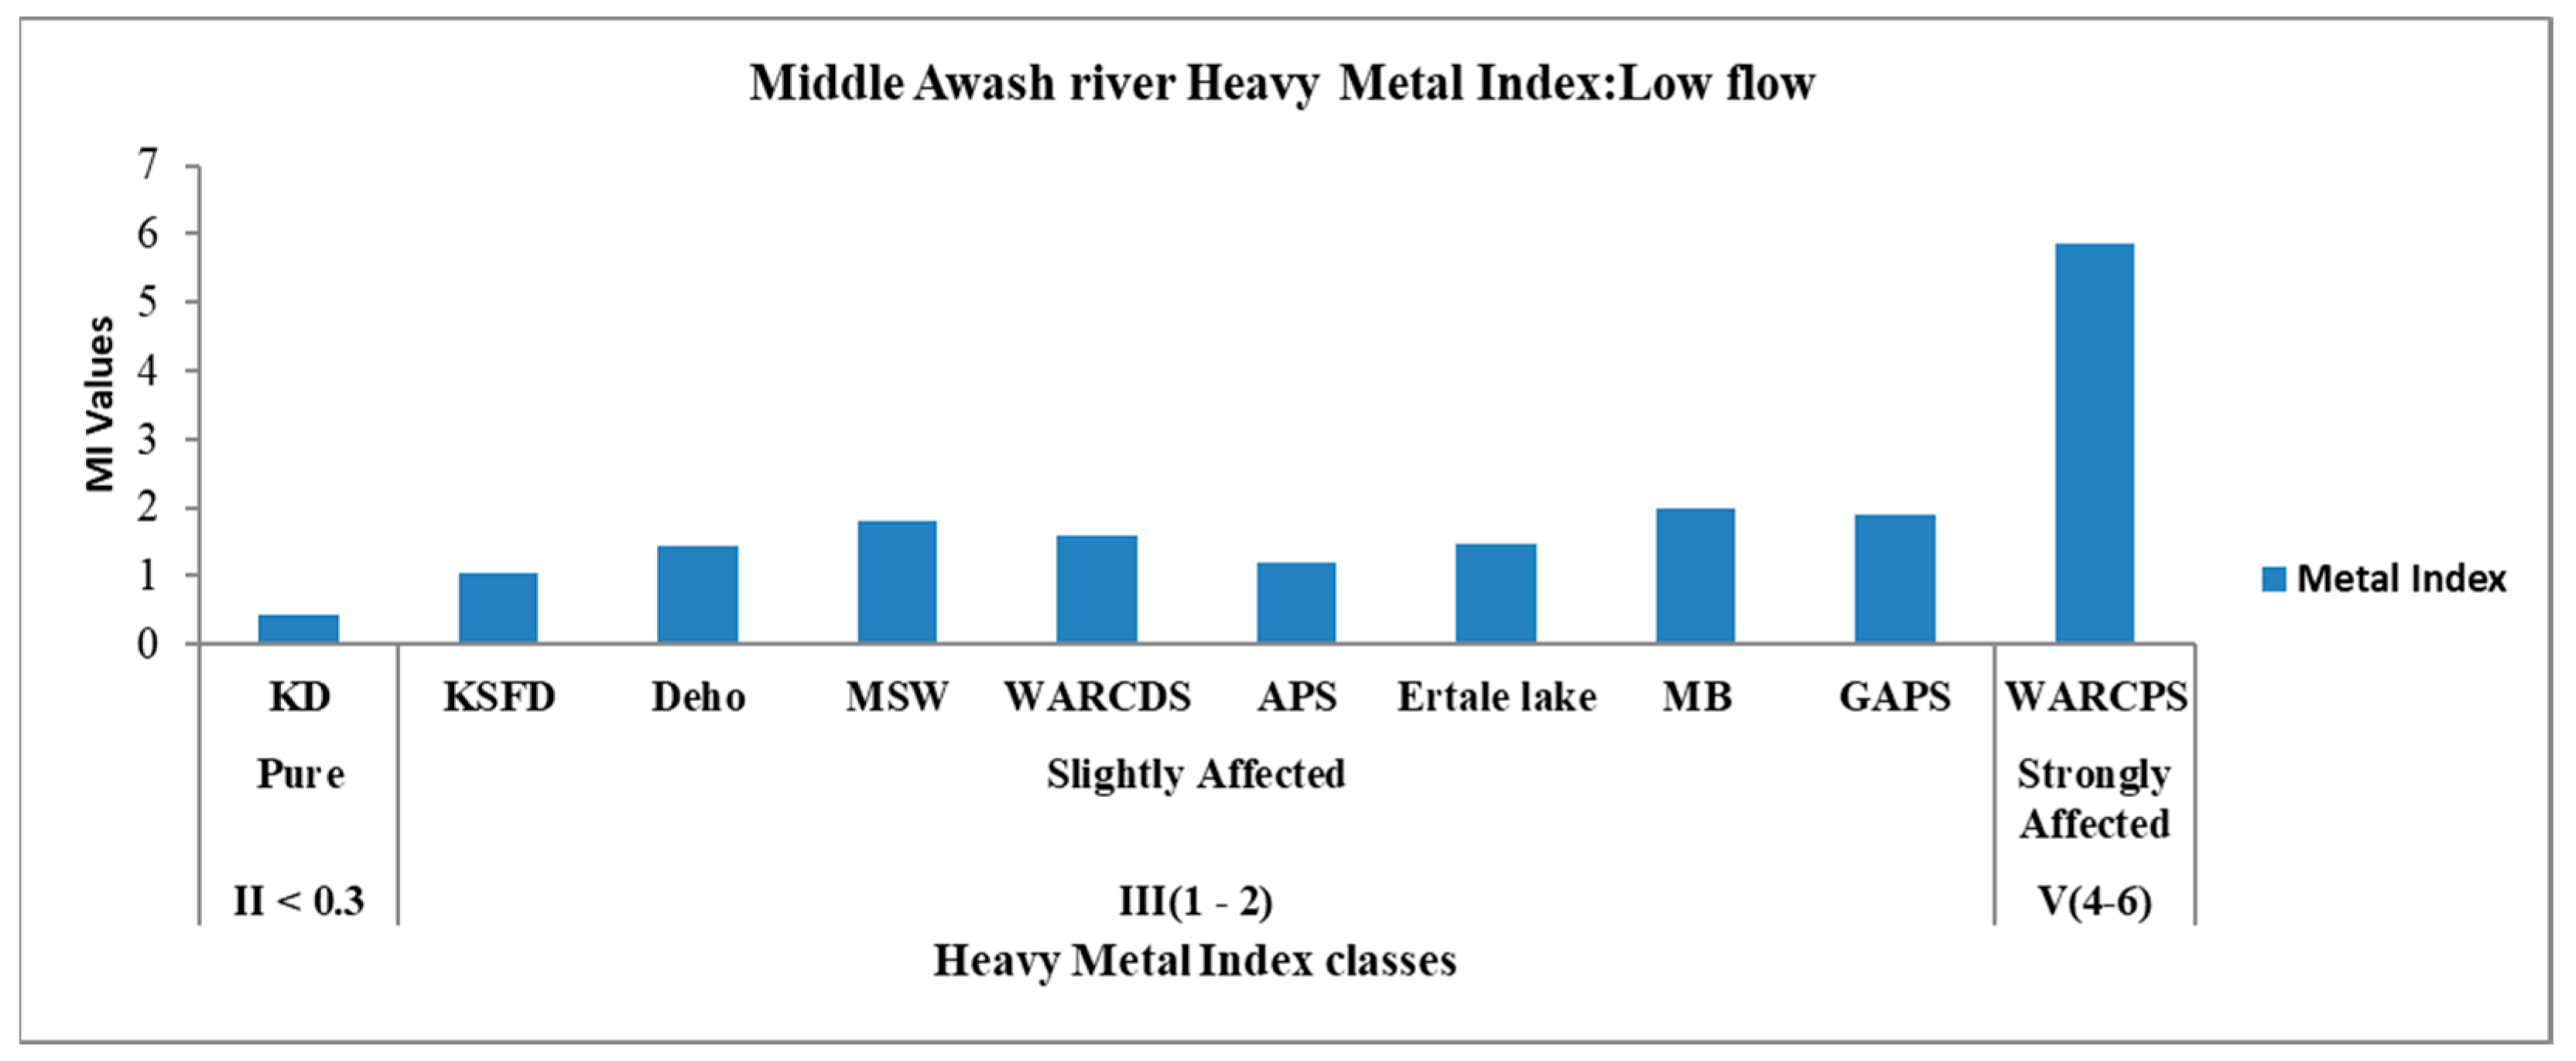
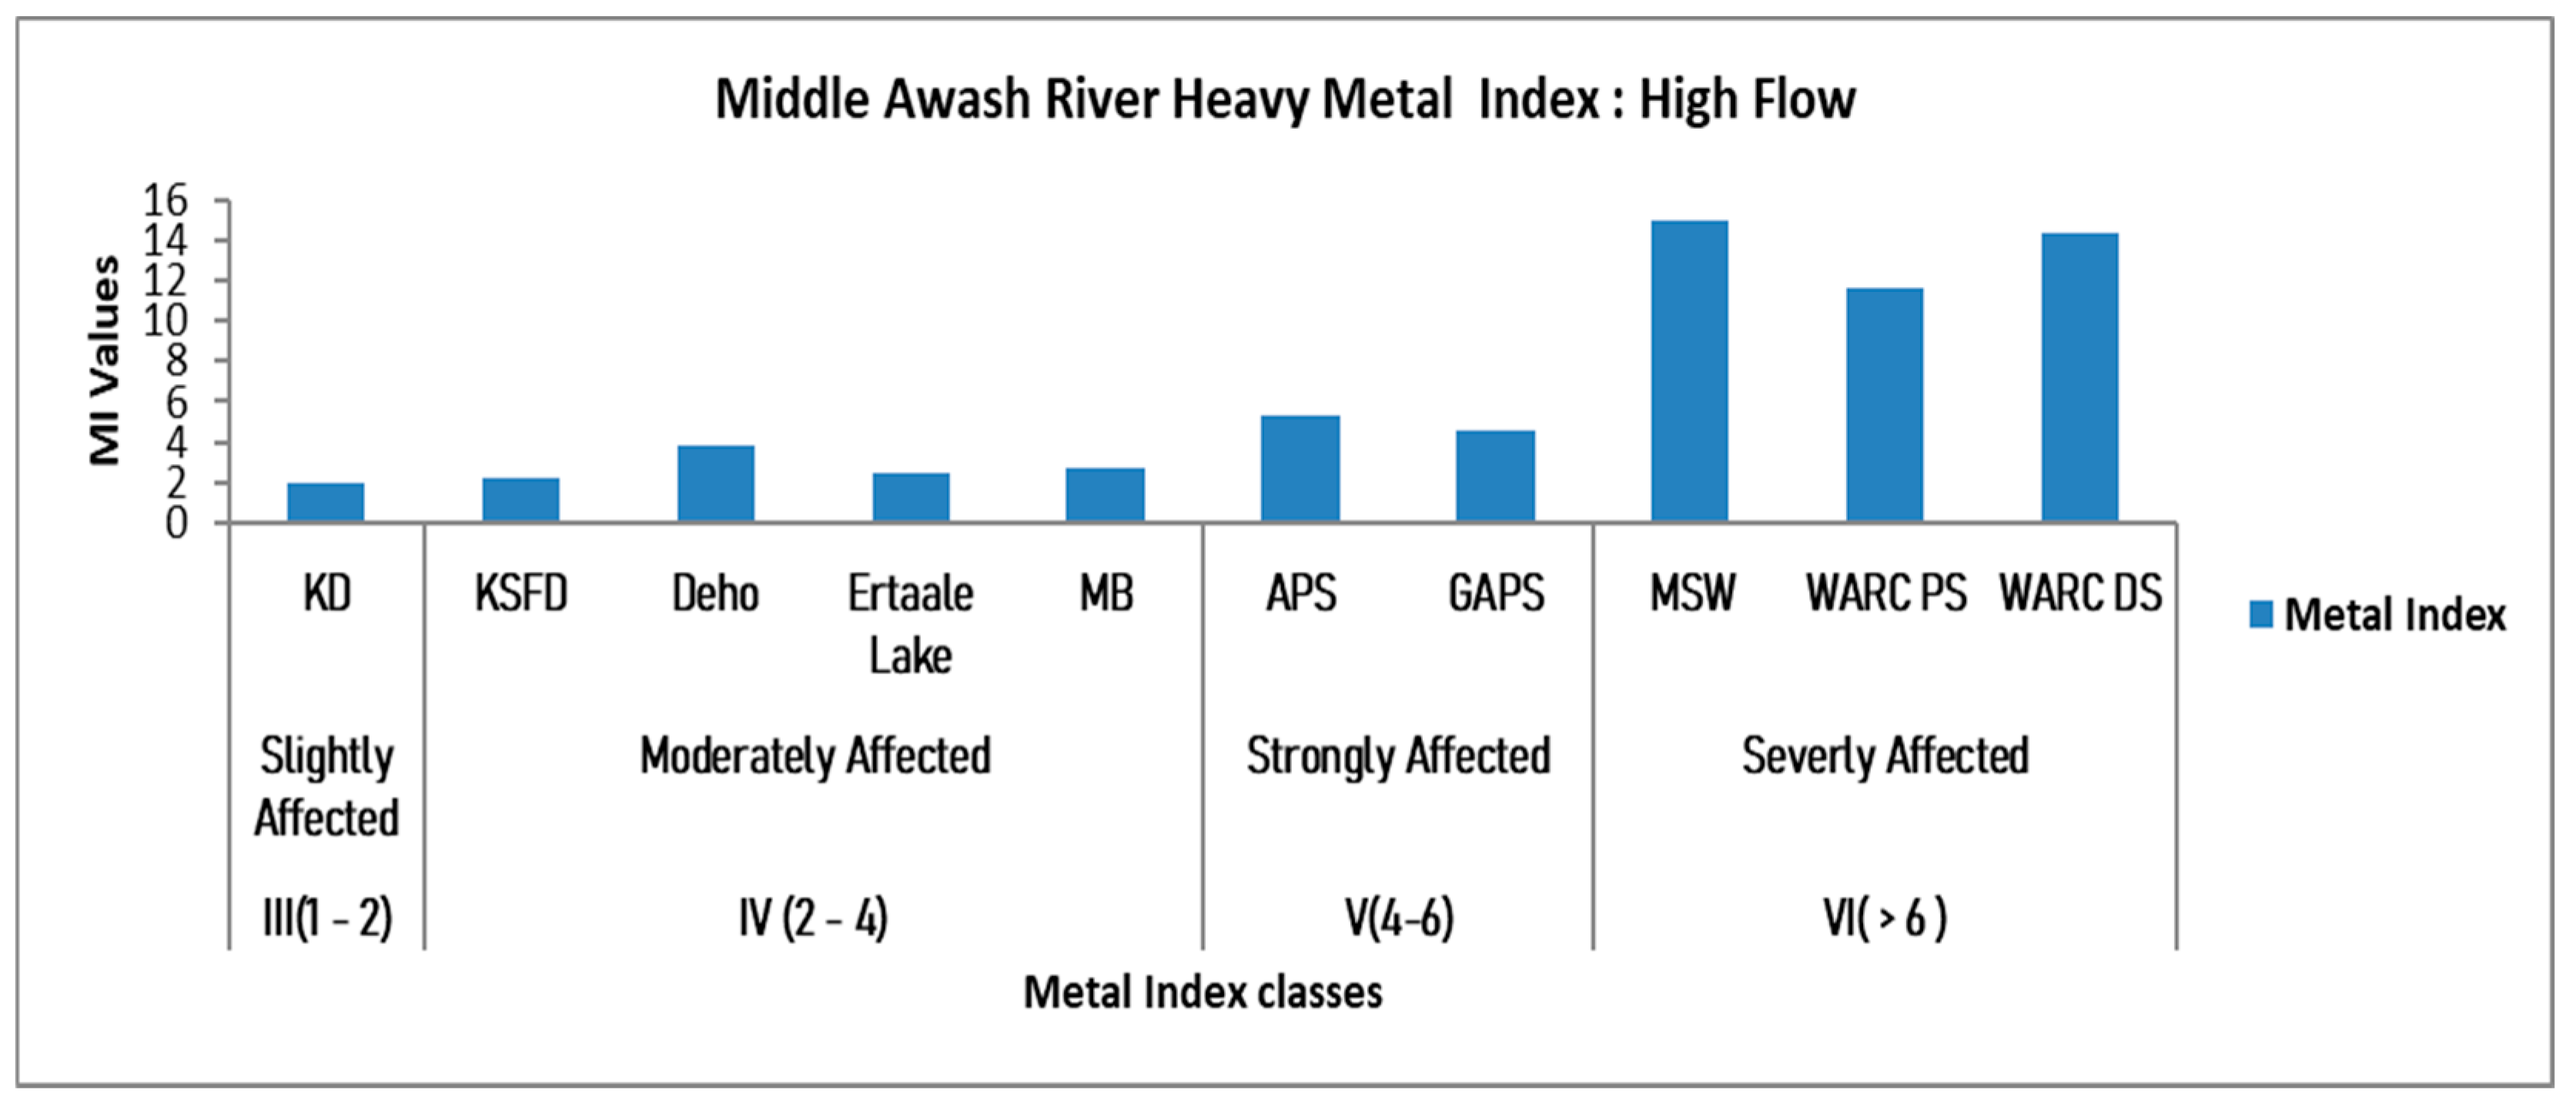
3.2.1. Heavy Metal Pollution Index (HPI)

This study revealed significant heavy metal contamination in the irrigation water of the middle Awash River Basin (ARB), during both the low- and high-flow season. Therefore, heavy metal contamination was detected at nearly all sampling locations across the study basin, with the exception of the Werer Research Pumping Station (WARC PS), which recorded a Heavy Metal Pollution Index (HPI) below 100, indicating relatively lower contamination levels (Figure 7). During the high-flow season, elevated HPI values (above 100) were observed at several locations, including Kesem Dam, Melka Sedi Weir (MWS Weir), WARC Pumping Station, WARC Offtake, and Ambash Pumping Station, confirming the presence of heavy metal contamination in the river (Figure 8). These findings highlight the persistence of heavy metal pollution in the basin, regardless of seasonal variations [21,24]. The persistent presence of heavy metals in the irrigation water of the middle Awash Basin poses significant risks to agricultural productivity, soil health, and human health.
The metal index (MI) was used to further assess the degree of heavy metal contamination in irrigation water. During the low-flow season, the MI values indicated varying levels of contamination: pure (Kesem Dam); slightly affected (Kesem Sugar Factory, Deho Hot Spring, Melka Sedi Weir, WARC DC, Ambash Pumping Station, Ertaale Lake, Meteka, and Gewanie Pumping Station); and strongly affected (WARC Pumping Station) (Figure 9). During the high-flow season, the MI values showed a similar trend but with some variations: moderately affected (Kesem Sugar Factory, Deho Hot Spring, Ertaale Lake, and Meteka); severely affected (Ambash and Gewanie Pumping Stations); slightly affected (Kesem Dam); and severely affected (Melka Sedi Weir, WARC Pumping Station, and WARC Offtake) (Figure 10). These results demonstrate that the middle Awash River is polluted with heavy metals throughout both flow seasons, with varying degrees of contamination across different locations. This study identified the presence of various heavy metals, including arsenic (As), boron (B), cadmium (Cd), cobalt (Co), copper (Cu), chromium (Cr), iron (Fe), mercury (Hg), manganese (Mn), nickel (Ni), lead (Pb), and zinc (Zn). These metals are known to have detrimental effects on human health, ecological systems, and plant growth [47]. For instance, heavy metals can accumulate in soil and water, leading to bioaccumulation in crops, which poses risks to human health when consumed.

3.2.2. Ecological Risk Index

During the low-flow season, the Ecological Risk Index (ERI) for individual metals indicated low risk (ER < 40) at most sampling sites (Table 3). However, moderate risk was observed for cadmium (Cd) at the following locations: Kesem Sugar Factory (KSF) (ERI: 68); WARC Offtake (ERI: 40); Ertaale Lake (ERI: 76); Meteka (ERI: 80); Gewanie Pumping Station (ERI: 76). During the high-flow season, the Ecological Risk Index (ERI) for individual metals indicated low risk (ER < 40) at most sites (Table 3). However, moderate risk was observed for cadmium (Cd) and mercury (Hg) at the following locations: Melka Sedi Weir (Cd: 55.976; Hg: 42.73) and WARC Offtake (Cd: 60.32). Similar results were obtained and concluded ecological risks in the study area.
The Risk Index (RI), which assesses the cumulative ecological risk of multiple heavy metals, also indicated low risk (RI < 112.5) at most sites during low-flow seasons (Table 4). However, moderate risk was observed at the following: Ertaale Lake (RI: 118.19); Meteka (RI: 136.95); Gewanie Pumping Station (RI: 122.093). These findings suggest that while most sites posed a low ecological risk during the low-flow season, certain locations exhibited moderate risk due to elevated levels of cadmium (Cd) and other heavy metals such as arsenic (As), boron (B), cobalt (Co), copper (Cu), chromium (Cr), iron (Fe), mercury (Hg), manganese (Mn), nickel (Ni), lead (Pb), and zinc (Zn). Similarly, during high-flow season, the Risk Index (RI) indicated low risk (RI < 112.5) at most sites, but moderate risk was observed at the following: Melka Sedi Weir (RI: 149.81) and WARC Offtake (RI: 158.05) (Table 4). These results highlight that, despite the dilution effect of increased water flow during the high-flow season, certain locations still exhibited moderate ecological risk due to the presence of heavy metals.
The presence of heavy metals such as As, B, Cd, Co, Cu, Cr, Fe, Hg, Mn, Ni, Pb, and Zn in the middle Awash River Basin poses significant risks to the following: Ecosystems: Heavy metals can disrupt aquatic ecosystems, harm biodiversity, and degrade water quality [21,24,47,48,49]. For example, cadmium and mercury are highly toxic to aquatic organisms, leading to reduced populations and altered ecosystem dynamics. Plants: Heavy metals can impair nutrient uptake, reduce crop yields, and cause physiological stress in plants. Cadmium, in particular, is known to inhibit root growth and reduce photosynthesis. Human Health: Heavy metals can accumulate in crops and enter the food chain, posing risks such as toxicity, organ damage, and chronic diseases. For instance, cadmium exposure is linked to kidney damage and bone disorders, while mercury exposure can cause neurological and developmental issues.

4. Discussion

4.1. Irrigation Water Quality

The assessment of irrigation water quality is a critical step in understanding the suitability of water for agricultural use, especially in regions with seasonal and temporary variations in water availability. Methods such as salinity classification and hazard assessment are widely used to evaluate water quality and its impact on crop production and soil health [13,16,50]. In the middle Awash Basin, water quality varied between medium salinity (C2) and high salinity (C3), indicating significant salt accumulation that renders the water unsuitable for irrigation during both low- and high-flow seasons. This finding aligns with previous studies [24,34,51,52], which also highlighted the adverse effects of salinity on water quality and agricultural productivity.
Therefore, during the low-flow season, Kesem Dam and Kesem Sugar Factory Diversion exhibited medium salinity hazards (below 0.7 dS/m), while other locations showed high salinity hazards (0.7 to 2.5 dS/m). In contrast, during the high-flow season, only Deho Hot Spring had high salinity (2.31 dS/m), with other sites falling under medium salinity hazards. This seasonal variation in salinity is influenced by rainfall and the volume of water entering the river from its tributaries. High salinity (ECw) in irrigation water negatively impacts crop yields by creating a physiological drought condition, where plants struggle to absorb water due to increased osmotic pressure in the soil solution [45,52]. Even when the soil appears moist, high salinity reduces the availability of water to plants, directly affecting crop productivity [19,53]. Chloride toxicity further exacerbates these challenges, with high levels observed at Deho Hot Spring, moderate levels at Ambash Pumping Station, Ertaale Lake, and Gewanie Pumping Station, and non-toxic levels at other locations.
This study also found that pH levels in the middle Awash Basin exceeded the FAO-recommended range of 6.0–8.0, with values ranging from 7.82 to 9.28 during the low-flow season. Elevated pH levels during the high-flow season further impacted pH-sensitive crops, reducing yields. These findings underscore the need for the careful management of irrigation water to mitigate salinity, chloride toxicity, and pH-related challenges.
The analysis of the Sodium Absorption Ratio (SAR) across different locations and seasons reveals significant variations in sodicity hazards, which are critical for assessing the suitability of water for irrigation. The results demonstrate a clear distinction between the low-flow and high-flow seasons, with implications for agricultural practices and soil health. During the low-flow season, all locations exhibited low sodicity hazard (SAR < 10), falling under the sodicity class S1. This indicates that the water in these areas is safe for irrigation with a minimal risk of soil sodicity issues. The low SAR values suggest that sodium levels are within acceptable limits, posing no immediate threat to soil structure or permeability. This is an ideal scenario for agricultural activities, as it ensures that irrigation will not lead to soil degradation or reduced crop productivity.
In contrast, the high-flow season showed a marked increase in SAR values, leading to higher sodicity hazards across various locations. This seasonal variation highlights the influence of external factors such as increased runoff, changes in water sources, or contamination during periods of high rainfall or flooding. Area like Kesem Dam recorded SAR values between 10 and 18, placing it in the sodicity class S2 (medium hazard). While this poses a moderate risk of soil sodicity, it can still be managed with careful irrigation practices, such as the application of gypsum or other soil amendments to mitigate sodium accumulation. Locations like KSFD, MSW, and WARC Offtake exhibited SAR values between 18 and 26, categorizing them under sodicity class S3 (high hazard). This level of sodicity poses a significant risk to soil health, as high sodium content can disrupt soil structure, reduce permeability, and hinder root growth. Irrigation in these areas requires stringent management strategies, including the use of leaching practices and organic matter to improve soil conditions. The most critical areas, including DHS, WARC PS, APS, Ertalale, MB, and GAPS, recorded SAR values exceeding 26, placing them in the sodicity class S4 (very high hazard). Water with such high SAR values is considered unsuitable for irrigation due to the severe risk of soil sodicity. The prolonged use of such water can lead to irreversible soil damage, including soil hardening, reduced fertility, and decreased agricultural productivity. These areas require alternative water sources or advanced treatment methods before irrigation can be considered.
The RSC results underscore the importance of monitoring and managing irrigation water quality to prevent sodium-induced soil degradation. High RSC values can lead to soil sodicity, which reduces soil permeability, inhibits root growth, and decreases crop productivity. In areas with unsuitable RSC values, alternative water sources or soil amendment practices, such as the application of gypsum or organic matter, may be necessary to mitigate the effects of sodium accumulation. In contrast, areas with safe or marginal RSC values can be used for irrigation, provided that appropriate management practices, such as leaching and the cultivation of salt-tolerant crops, are implemented. The seasonal variability in RSC values also highlights the influence of rainfall and water flow on water quality, with the high-flow season generally showing improved conditions due to the dilution effect of increased water volume.

4.2. Heavy Metal Pollution Index (HPI) and Metal Index (MI)

Heavy metal contamination was prevalent in the middle Awash Basin, particularly during the low-flow season. The Heavy Metal Pollution Index (HPI) indicated contamination at all sampling locations except WARC Pumping Station (HPI < 100). During the high-flow season, heavy metal contamination (HPI > 100) was observed at Kesem Dam, Melka Sedi Weir, WARC Pumping Station, WARC Offtake, and Ambash Pumping Station. In contrast, Kesem Sugar Factory Diversion, Deho Hot Spring, Ertaale Lake, and Gewanie Pumping Station showed HPI values below 100, indicating lower contamination levels.
The Metal Index (MI) further confirmed heavy metal pollution, with varying degrees of contamination across sites. During the low-flow season, Kesem Dam was classified as non-affected, while other sites ranged from slightly affected (Kesem Sugar Factory, Deho Hot Spring, Melka Sedi Weir, Ambash Pumping Station, Ertaale Lake, Meteka, and Gewanie Pumping Station) to strongly affected (WARC Pumping Station). During the high-flow season, contamination levels ranged from slightly affected (Kesem Dam) to severely affected (Melka Sedi Weir, WARC Pumping Station, and WARC Offtake).
Heavy metals such as As, B, Cd, Co, Cu, Cr, Fe, Hg, Mn, Ni, Pb, and Zn pose significant risks to human health, ecosystems, and plant growth. Their presence in irrigation water can lead to bioaccumulation in crops, soil degradation, and ecological imbalances, necessitating urgent monitoring and mitigation efforts.

4.3. Ecological Risk Index (ERI)

The Ecological Risk Index (ERI) and Risk Index (RI) assessments revealed low ecological risk (ER < 40, RI < 112.5) at most sites during both low- and high-flow seasons. However, moderate risks were observed for cadmium (Cd) at Kesem Sugar Factory, WARC Offtake, Ertaale Lake, Meteka, and Gewanie Pumping Station during the low-flow season. Similarly, moderate risks were identified at Ertaale Lake, Meteka, and Gewanie Pumping Station based on the Risk Index.
During the high-flow season, low ecological risks were observed at most sites, except for Melka Sedi Weir (Cd: 55.976; Hg: 42.73) and WARC Offtake (Cd: 60.32), which showed moderate risks. The RI also indicated moderate risks at Melka Sedi Weir (149.81) and WARC Offtake (158.05). These findings highlight the persistent ecological risks posed by heavy metals in the middle Awash Basin, particularly during periods of high contamination.

5. Conclusions

5.1. General Findings on Water Quality

This study focused on assessing the current state of water pollution and contamination in the middle Awash Basin using suitability indices, the Heavy Metal Pollution Index (HPI), and the Ecological Risk Index (ERI). The results revealed significant issues related to salinity accumulation and heavy metal contamination, which limit the suitability of water for irrigation in the area. The primary source of heavy metal contamination was identified as upstream wastewater discharge and effluents entering the river system.

5.2. Salinity Hazards

The analysis showed that irrigation water quality in the middle Awash Basin ranged from medium-salinity (C2) to high salinity (C3), indicating contamination by salt accumulation. This makes the water unsuitable for irrigation, posing risks of environmental pollution and potential yield reduction during both low- and high-flow seasons. While medium-salinity water (C2) can be used with moderate leaching and salt-tolerant crops, high-salinity water (C3) is unsuitable for soils with restricted drainage. During the low-flow season, Kesem Dam and Kesem Sugar Factory Diversion exhibited medium salinity hazards (below 0.7 dS/m), while all other sites showed high salinity hazards (0.7 to 2.5 dS/m). In contrast, during the high-flow season, only Deho Hot Spring had high salinity (2.31 dS/m), with other sites falling under medium salinity hazards. Salinity levels fluctuated with seasonal rainfall and water volume from tributaries.

5.3. pH Levels and Chloride Toxicity

This study found that the pH levels in the middle Awash Basin exceeded the FAO-recommended range of 6.0–8.0 for safe irrigation water. During both low- and high-flow seasons, pH values surpassed 8.5, negatively impacting pH-sensitive crops and reducing yields. Chloride toxicity was highest at Deho Hot Spring, moderate at Ambash Pumping Station, Ertaale Lake, and Gewanie Pumping Station, and non-toxic at other locations such as Kesem Dam, Kesem Sugar Factory, Melka Sedi Weir, Werer Research Pumping Station, Werer Research Offtake, and Meteka.

5.4. Heavy Metal Contamination

Heavy metal pollution was prevalent during the low-flow season, with all sites except WARC Pumping Station (HPI < 100) showing contamination. The Metal Index (MI) indicated that most sites were slightly to strongly affected by heavy metals, with Kesem Dam being the only non-affected location. During the high-flow season, heavy metal contamination (HPI > 100) was observed at Kesem Dam, Melka Sedi Weir, WARC Pumping Station, WARC Offtake, and Ambash Pumping Station. The MI results further confirmed widespread pollution, with sites ranging from slightly affected (Kesem Dam) to severely affected (Melka Sedi Weir, WARC Pumping Station, and WARC Offtake).

5.5. Ecological Risk Assessment

The Ecological Risk Index (ERI) and Risk Index (RI) revealed low ecological risk (ER < 40, RI < 112.5) at most sites during the low-flow season. However, moderate risks were observed for cadmium (Cd) at Kesem Sugar Factory, WARC Offtake, Ertaale Lake, Meteka, and Gewanie Pumping Station. Similarly, moderate ecological risks were identified at Ertaale Lake, Meteka, and Gewanie Pumping Station based on the RI. During the high-flow season, low ecological risks were observed at most sites, except for Melka Sedi Weir (Cd: 55.976; Hg: 42.73) and WARC Offtake (Cd: 60.32), which showed moderate risks. The RI also indicated moderate risks at Melka Sedi Weir (149.81) and WARC Offtake (158.05).

Author Contributions

Conceptualization: E.K.H., T.A.A. and S.G.G.; methodology: E.K.H., T.A.A., S.G.G. and A.D.C.; software: E.K.H.; validation: E.K.H., T.A.A. and S.G.G.; formal analysis: E.K.H. and T.A.A.; investigation: E.K.H.; resources: T.A.A. and S.G.G.; data curation: E.K.H., T.A.A., S.G.G. and A.D.C.; writing—original draft preparation: E.K.H. and T.A.A.; writing—review and editing, E.K.H., T.A.A., S.G.G., A.D.C. and K.J.C.; visualization: E.K.H., T.A.A., S.G.G. and A.D.C.; supervision: T.A.A. and S.G.G.; project administration: T.A.A., S.G.G. and K.J.C.; funding acquisition: T.A.A., S.G.G. and K.J.C. All authors have read and agreed to the published version of the manuscript.

Funding

The research was funded by UK Aid from the UK Foreign, Commonwealth and Development Office (FCDO) for the benefit of developing countries (Project Code 201880).

Data Availability Statement

Data will be available upon request.

Acknowledgments

This article is an output from the REACH programme, funded by UK Aid from the UK Foreign, Commonwealth and Development Office (FCDO) for the benefit of developing countries (Project Code 201880). However, the views expressed and information contained in it are not necessarily those of or endorsed by FCDO, which can accept no responsibility for such views or information or for any reliance placed on them. The authors would like to express their gratitude to Tena Alamirewu, Senior Scientists, and WLRC Deputy Director, Solomon Gebre Hiwot, REACH Ethiopia project coordinator, and Katrina Charles, and REACH Director, as well as WLRC and Ethiopian Institute of Water Resource (EIWR) staff, Ethiopia.

Conflicts of Interest

This research has been conducted by obeying scientific ethics and has no conflicts between individuals, organizations, and other bodies. The authors are fully responsible for the research results and outcomes.

References

  1. FAO. Water for Sustainable Food and Agriculture Water for Sustainable Food and Agriculture; FAO: Rome, Italy, 2016; Available online: https://www.fao.org/3/i7959e/i7959e.pdf (accessed on 10 February 2021).
  2. Emilio. Global Risks 2020: An Unsettled World. World Economic Forum. 2020. Available online: https://www3.weforum.org/docs/WEF_Global_Risk_Report_2020.pdf (accessed on 15 March 2021).
  3. FAO; OECD. Water and Agriculture. An issues note produces for the G20 Presidency of the Kingdom of Saudi Arabia. 2021, p. 26. Available online: https://www.fao.org/publications/card/en/c/CB2392EN (accessed on 10 April 2023).
  4. Ayers, R.S.; Westcot, D.W. Water Quality for Agriculture; FAO Irrigation and Drainage Paper; FAO: Rome, Italy, 1985. [Google Scholar]
  5. Cameira, M.d.R.; Santos Pereira, L. Innovation issues in water, agriculture and food. Water 2019, 11, 1230. [Google Scholar] [CrossRef]
  6. Angella, G.; Vila, M.G.; López, J.M.; Barraza, G.; Salgado, R.; Angueira, S.P.; Tomsic, P.; Fereres, E. Quantifying yield and water productivity gaps in an irrigation district under rotational delivery schedule. Irrig. Sci. 2016, 34, 71–83. [Google Scholar] [CrossRef]
  7. Bryant, C.; Krutz, L.; Falconer, L.; Irby, J.; Henry, C.; Pringle, H.; Henry, M.; Roach, D.; Pickelmann, D.; Atwill, R.; et al. Crop Management Irrigation Water Management Practices that Reduce Water Requirements for Mid-South Furrow-Irrigated Soybean. Crop Forage Turfgrass Manag. 2017, 3, 1–7. [Google Scholar] [CrossRef]
  8. Aquastat, F. Country Profile—Ethiopia; FAO: Rome, Italy, 2016. [Google Scholar]
  9. Hailemariam, K. Impact of climate change on the water resources of Awash River Basin, Ethiopia. Clim. Res. 1999, 12, 91–96. [Google Scholar] [CrossRef]
  10. AWBA. Awash River Basin Flood and Drought Management Strategic Plan; Awash Basin Authority: Yangon, Myanmar, 2017. [Google Scholar]
  11. Elias, H.; Brook, A.; Tilahun, H. Effect of blended irrigation water quality on soil physico-chemical properties and cotton yield in Middle Awash Basin Ethiopia. Int. J. Water Resour. Environ. Eng. 2016, 8, 1–10. [Google Scholar] [CrossRef]
  12. Elliott, J.; Deryng, D.; Müller, C.; Frieler, K.; Konzmann, M.; Gerten, D.; Glotter, M.; Flörke, M.; Wada, Y.; Best, N.; et al. Constraints and potentials of future irrigation water availability on agricultural production under climate change. Proc. Natl. Acad. Sci. USA 2014, 111, 3239–3244. [Google Scholar] [CrossRef] [PubMed]
  13. Wondim, G.; Daba, A.; Qureshi, A. Effects of Salinity on Producers’ Livelihoods and Socio-economic Conditions; the Case of Afar Region, Northeastern Ethiopia. J. Sustain. Agric. Sci. 2020, 46, 35–46. [Google Scholar] [CrossRef]
  14. Hopkins, B.G.; Horneck, D.A.; Stevens, R.G.; Ellsworth, J.W.; Sullivan, D.M. Managing Irrigation Water Quality; Oregon State University: Corvallis, OR, USA, 2007. [Google Scholar]
  15. Helmer, R.; Hespanhol, I.; Nations, U.; Programme, E.; Council, S.C. Water Pollution Control—A Guide to the Use of Water Quality Management Principles, 2nd ed.; E & FN Spon, an Imprint of Thomson Professional: London, UK, 1997. [Google Scholar]
  16. Borden, C.; Roy, D. Water Quality Monitoring System Design; IISD: Winnipeg, MB, Canada, 2015. [Google Scholar]
  17. FAO. Advances in the Assessment and Monitoring of Salinazation and Status of Biosaline Agriculture. In World Soil Resources Reports No. 104, Proceedings of the Expert Consultation, Dubai, United Arab Emirates, 26–29 November 2007. Dubai, United Arab Emirates, FAO: Rome, Italy, 2009. [Google Scholar]
  18. WMO. Planning of Water Quality Monitoring Systems; WMO-No. 1113; Technical Report; WMO: Geneva, Switzerland, 2013. [Google Scholar]
  19. FAO. Mapping of Salt-Affected Soils Technical Specifications and Country Guidelines Mapping; FAO: Rome, Italy, 2020; p. 26. [Google Scholar]
  20. FAO; WHO. Safety and Quality of Water Used in Food Production and Processing; Microbiological Risk Assessment Series, No. 33; FAO/WHO: Rome, Italy, 2019. [Google Scholar]
  21. Abebe, Y.; Alamirew, T.; Whitehead, P.; Charles, K.; Alemayehu, E. Spatio-temporal variability and potential health risks assessment of heavy metals in the surface water of Awash basin, Ethiopia. ScienceDirect 2023, 9, e15832. [Google Scholar] [CrossRef] [PubMed]
  22. Zaman, M.; Shahid, S.A.; Heng, L. Guideline for Salinity Assessment, Mitigation and Adaptation Using Nuclear and Related Techniques; IAEA: Ittigen, Switzerland; Springer Open Access: Berlin/Heidelberg, Germany, 2018. [Google Scholar] [CrossRef]
  23. Omuto, C.; Vargas, R.; El Mobarak, A.; Mohamed, N.; Viatkin, K.; Yigini, Y. Mapping of Salt-Affected of Salt-Affected; FAO: Rome, Italy, 2020. [Google Scholar] [CrossRef]
  24. Assegide, E.; Alamirew, T.; Bayabil, H.; Dile, Y.T.; Tessema, B.; Zeleke, G. Impacts of Surface Water Quality in the Awash River Basin, Ethiopia: A Systematic Review. Front. Water 2022, 3, 15. [Google Scholar] [CrossRef]
  25. Gebeyehu, H.R.; Bayissa, L.D. Levels of heavy metals in soil and vegetables and associated health risks in Mojo area, Ethiopia. PLoS ONE 2020, 15, 22. [Google Scholar] [CrossRef]
  26. FAO; WHO. Evaluation of Certain Food Contaminants; FAO/WHO: Rome, Italy, 2006. [Google Scholar]
  27. Wilcox. Classification and Use of Irrigation Waters; Circular No. 969, No. 192; USDA: Washington DC, USA, 1955. [Google Scholar]
  28. Singh, S.; Ghosh, N.C.; Gurjar, S. Index-based assessment of suitability of water quality for irrigation purpose under Indian conditions. Environ. Monit. Assess. 2018, 190, 29. [Google Scholar] [CrossRef] [PubMed]
  29. Fipps, G. Irrigation Water Quality Standards and Salinity Management Strategies; Texas Cooperative Etension: College Station, TX, USA, 2000. [Google Scholar]
  30. Vácha, R. Heavy Metal Pollution and Its Effects on Agriculture. Agronomy 2021, 11, 1719. [Google Scholar] [CrossRef]
  31. Cowan, P.A.; Porcella, D.B.; Adams, V.D.; Gardner, L.A. Water Quality Analysis Laboratory Procedures Syllabus; USU Library: Logan, UT, USA, 1978. [Google Scholar]
  32. Marina, G.; Aristidis, T. Proposing new approaches for the risk characterisation of single chemicals and chemical mixtures: The source related Hazard Quotient (HQS) and Hazard Index (HIS) and the adversity specific Hazard Index (HIA). Toxicol. Rep. 2019, 6, 632–636. [Google Scholar] [CrossRef]
  33. IAEA. Comparative Analysis of Methods and Tools for Nuclear Knowledge Preservation. Technol. Rep. 2011, 115. Available online: http://www.iaea.org/Publications/index.html (accessed on 10 January 2021).
  34. Worku, A.; Bedadi, B. Citation Ashenafi Worku, Bobe Bedadi. Studies on Soil Physical Properties of Salt Affected Soil in Amibara Area, Central Rift Valley of Ethiopia. Int. J. Agric. Sci. Nat. Resour. 2016, 3, 8–17. [Google Scholar]
  35. Richard, H.; Hespanhol, I. Water Pollution Control: A Guide to the Use of Water Quality Management Principles, 1st ed.; United Nations Environment Programme, Water Supply and Sanitation Collaborative Council, World Health Organization, Eds.; E & FN Spon: London, UK; New York, NY, USA, 1997. [Google Scholar]
  36. Qureshi, A.S.; Daba, A.W. Evaluating Growth and Yield Parameters of Five Quinoa (Chenopodium quinoa W.) Genotypes Under Different Salt Stress Conditions. J. Agric. Sci. 2020, 12, 128. [Google Scholar] [CrossRef]
  37. Raes, D.; Steduto, P.; Hsiao, T.C.; Fereres, E. Crop-Water Productivity Model to Simulate Yield Response to Water; FAO: Rome, Italy, 2018; p. 23. Available online: www.fao.org/publications (accessed on 25 January 2020).
  38. FAO; IWMI. Water Pollution from Agriculture: A Global Review—Executive Summary; FAO & IWMI: Rome, Italy, 2017. [Google Scholar]
  39. Smith, M.; Steduto, P. Yield Response to Water: The Original FAO Water; FAO: Rome Italy, 2012; pp. 1–13. Available online: http://www.fao.org/docrep/016/i2800e/i2800e02.pdf (accessed on 25 January 2020).
  40. Pereira, L.S.; Allen, R.G.; Smith, M.; Raes, D. Crop evapotranspiration estimation with FAO56: Past and future. Agric. Water Manag. 2015, 147, 4–20. [Google Scholar] [CrossRef]
  41. Spencer, G.D.; Krutz, L.J.; Falconer, L.L.; Henry, W.B.; Henry, C.G.; Larson, E.J.; Pringle, H.C.; Bryant, C.J.; Atwill, R.L.; Iii, H.C.P. Crop Management Irrigation Water Management Technologies for Furrow-Irrigated Corn that Decrease Water Use and Improve Yield and On-Farm Profitability. Crop Forage Turfgrass Manag. 2019, 5, 180100–180108. [Google Scholar] [CrossRef]
  42. Cheng, M.; Wang, H.; Fan, J.; Wang, X.; Sun, X.; Yang, L.; Zhang, S.; Xiang, Y.; Zhang, F. Crop yield and water productivity under salty water irrigation: A global meta-analysis. Agric. Water Manag. 2021, 256, 107105. [Google Scholar] [CrossRef]
  43. Qureshi, A.S.; Mohammad, T.E.; Minaleshoa, M. Prospects of Alternative Agricultural Systems to Improve the Productivity of Marginal Lands in Ethiopia. In Biosaline Agriculture as a Climate Change Adaptation for Food Security; Choukr-Allah, R., Ragab, R., Eds.; Springer International Publishing: Cham, Switzerland, 2023; pp. 87–116. [Google Scholar] [CrossRef]
  44. Adhanom, O.G. Salinity and sodicity hazard characterization in major irrigated areas and irrigation water sources, Northern Ethiopia. Cogent Food Agric. 2019, 5, 1673110. [Google Scholar] [CrossRef]
  45. Geilfus, C.-M. Chloride: From Nutrient to Toxicant. Plant Cell Physiol. 2018, 59, 877–886. [Google Scholar] [CrossRef] [PubMed]
  46. Ahmed, M.; Matsumoto, M.; Ozaki, A.; Thinh, N.; Kurosawa, K. Heavy Metal Contamination of Irrigation Water, Soil, and Vegetables and the Difference between Dry and Wet Seasons Near a Multi-Industry Zone in Bangladesh. Water 2019, 11, 583. [Google Scholar] [CrossRef]
  47. Ali, M.H.; Alturiqi, A.S.; Albedair, L.A. Health risk assessment of heavy metals in irrigation water, soil and vegetables from different farms in Riyadh district, Saudi Arabia. J. Elem. 2020, 2. [Google Scholar] [CrossRef]
  48. Ahmad, W.; Alharthy, R.D.; Zubair, M.; Ahmed, M.; Hameed, A.; Rafique, S. Toxic and heavy metals contamination assessment in soil and water to evaluate human health risk. Sci. Rep. 2021, 11, 12. [Google Scholar] [CrossRef]
  49. Dopp, E.; Pannekens, H.; Itzel, F.; Tuerk, J. Effect-based methods in combination with state-of-the-art chemical analysis for assessment of water quality as integrated approach. J. Hyg. Environ. Health 2019, 222, 607–614. [Google Scholar] [CrossRef]
  50. Li, R.; Zhan, Z. Fast ICP-MS Method for Determination of Heavy Elements in Different Types of Food Matrices; SHIMADZU: Kyoto, Japan, 2012; Volume 1425, p. 118264. [Google Scholar]
  51. Taddese, G.; Sonder, K.; Peden, D. The Water of the Awash River Basin: A Future Challenge to Ethiopia; ILRI: Addis Ababa, Ethiopia, 2009. [Google Scholar]
  52. Daba, A.W.; Qureshi, A.S. Review of Soil Salinity and Sodicity Challenges to Crop Production in the Lowland Irrigated Areas of Ethiopia and Its Management Strategies. Land 2021, 10, 1377. [Google Scholar] [CrossRef]
  53. Qureshi, A.S.; Daba, A.W. Evaluating the Impact of Different Salt Stress on Growth and Nutritional Parameters of three Lablab-bean (Lablab purpureus) Genotypes. Int. J. Agric. Biol. 2019, 22, 921–926. [Google Scholar] [CrossRef]
Figure 1. Study area and sampling locations.
Water 17 00757 g001
Figure 2. Irrigation water conductivity at middle Awash Basin for low_flow and high_flow season 2022/23.
Water 17 00757 g002
Figure 3. Salinity classes and hazards of irrigation water at middle Awash Basin for low-flow season 2022/23.
Water 17 00757 g003
Figure 4. Salinity classes and hazards of irrigation water at middle Awash Basin for high-flow season 2022/23.
Water 17 00757 g004
Figure 5. Water pH at middle Awash Basin for low- and high-flow season 2022/23.
Water 17 00757 g005
Figure 6. Toxic ion level of irrigation water quality at middle Awash River Basin for high_flow and low_flow seasons in 2022/23.
Water 17 00757 g006
Figure 7. Heavy metal index of irrigation water at middle Awash River Basin during low_flow seasons in 2022/23.
Water 17 00757 g007
Figure 8. Heavy metal index of irrigation water at middle Awash River Basin for high_flow seasons in 2022/23.
Water 17 00757 g008
Figure 9. Individual metal pollution classes at middle Awash River Basin during low_flow seasons in 2022/23.
Water 17 00757 g009
Figure 10. Individual metal pollution classes of irrigation water at middle Awash River Basin for high_flow seasons in 2022/23.
Water 17 00757 g010
Table 1. Sodium classes and sodium hazard of irrigation water at middle Awash River Basin in 2022/23.
Water Quality IndicesRangeSodicity ClassSodicity HazardLocations and Sampling Seasons
Low FlowHigh Flow
Sodium Absorption Ratio (SAR)<10S1LowALLNone
10–18S2MediumNoneKD
18–26S3HighNoneKSFD, MSW, WARC Offtake
>26S4Very HighNoneDHS, WARC PS, APS, Ertalale, MB, GAPS
Residual Sodium Carbonate (RSC)<1.25 SafeKD, KSFKD, KSFD, MSW, WARC PS, WARC Offtake
1.25–2.5 MarginalNoneAPS, MB, GAPS
>2.5 UnsuitableDHS, MSW, WARC PS, WARC Offtake, APS, Ertalale, MB, GAPSDHS, Ertaale Lake
KD: Kesem Dam, KSFD: Kesem Sugar Factory Diversion, DHS: Deho Hot Spring, WARC PS: Werer Agricultural Research Center Pumping Station, WARC Offtake: Werer Agricultural Research Center Offtake, APS: Ambash Pumping Station, MB: Meteka at Bridge, GAPS: Gewnaie Aweqe Farm Pumping Station.
Table 2. Crop sensitivity and toxicity hazards of irrigation water at middle Awash River Basin for low- and high-flow season in 2022/23.
Irrigation Water Quality (IWQ) Indices
Crop Sensitivity
ParameterRangeHazardLocations and Sampling Seasons
Low FlowHigh Flow
PH7.0 ≤ pH ≤ 8.0Slight to moderateKSFDNone
8.0 < pH ≤ 8.5SevereMetekaKD, KSFD, MSW, WARCPS, WARCD, APS, Meteka, and GAPS
pH > 8.5Highly severeKD, DHS, MSW, WARCPS, WARCD, APS, Eratale Lake, and GAPSDHS, Ertaale Lake
Nitrate Nitrogen (mg/L)NO3− < 5.0NoneKD, DHS, WARCPS, WARCD, and APSNone
5.0 ≤ NO3− ≤ 30.0Slight to moderateNoneKD, KSFD, and DHS
NO3− > 30.0SevereKSFD, MSW, Ertaale Lake, Meteka, and GAPSMSW, WARCPS, WARCD, APS, Ertaale Lake, and Meteka, GAPS
Alkalinity (mg/L)Alkalinity < 90NoneNoneNone
90 ≤ alkalinity ≤ 500Slight to moderateKD, KSFD, MSW, WARCPS, WARCD, Ertaale Lake, Meteka, and GAPSKD, KSFD, and Ertaale Lake
Alkalinity > 500SevereDHSDHS, MSW, WARCPS, WARCD, Ertaale Lake, and Meteka, GAPS
KD: Kesem Dam, KSFD: Kesem Sugar Factory Diversion, DHS: Deho Hot Spring, WARCPS: Werer Agricultural Research Center Pumping Station, WARC Offtake: Werer Agricultural Research Center Offtake, APS: Ambash Pumping Station, MB: Meteka at Bridge, GAPS: Gewnaie Aweqe Farm Pumping Station.
Table 3. Potential Ecological Risk Index of middle Awash River (low and high flow).
LocationsER Low-Flow Season ER High-Flow Season
ER < 4040 ≤ RI < 80 Ecological Risk of Individual MetalER < 4040 ≤ ER < 80 Ecological Risk of Individual Metal
KesemAll LowAll Low
KSFAll except CdCd: 68Moderate risk (Cd)All Low
DehoAll LowAll Low
MSWeirAll except Cd and Hg LowAll except Cd and HgCd: 55.976 and Hg: 42.73Moderate risk
WARCPSAll LowAll Low
WARCDSAll except CdCd: 40Moderate risk (Cd)All except CdCd: 60.32Moderate risk
Ambash PSAll LowAll Low
Ertaale LakeAll except CdCd: 76Moderate risk (Cd)All Low
MetekaAll except CdCd: 80Moderate risk (Cd)All Low
Gewanie PSAll except CdCd: 76Moderate risk (Cd)All Low
KSF: Kesem Sugar Factory; WARCPS: Werer Agricultural Research Center Pumping Station; WARC Offtake: Werer Agricultural Research Center Offtake; Ambash PS: Ambash Pumping Station; Gewanie PS: Gewanie Aweqe Fentie Farm Pumping Station.
Table 4. Pollution risk index of middle Awash River (low and high flow).
LocationsRI Low-Flow SeasonRI High-Flow Season
RI < 112.5112.5 ≤ RI < 225Ecological Risk of Single MetalRI < 112.5112.5 ≤ RI < 225Ecological Risk of Single Metal
Kesem53.5 Low2.49 Low
KSF99.94 Low25.76 Low
Deho108.52 Low110.1 Low
MSWeir81.82 Low 149.81Moderate risk
WARCPS59.91 Low110.76
WARCDS80.91 Low 158.05Moderate risk
AmbashPS75.95 Low73.38 Low
Ertaale lake 118.19Moderate 54.78 Low
Meteka 136.95Moderate 42.78 Low
Gewanie PS 122.093Moderate47.08 Low
KSF: Kesem Sugar Factory; WARCPS: Werer Agricultural Research Center pumping station; WARC Offtake: Werer Agricultural Research Center Offtake; Ambash PS: Ambash Pumping Station; Gewanie PS: Gewanie Aweqe Fentie Farm Pumping Station.
Disclaimer/Publisher’s Note: The statements, opinions and data contained in all publications are solely those of the individual author(s) and contributor(s) and not of MDPI and/or the editor(s). MDPI and/or the editor(s) disclaim responsibility for any injury to people or property resulting from any ideas, methods, instructions or products referred to in the content.

