Article

Coordinated Development Model of Coal–Water–Ecology in Open-Pit Combined Underground Mining Area

1
Department of Architectural Engineering, Shanxi Polytechnic College, Taiyuan 030006, China
2
College of Engineering Management, Shanxi Vocational University of Engineering Science and Technology, Jinzhong 030619, China
3
College of Environment and Ecology, Taiyuan University of Technology, Jinzhong 030600, China
4
College of Water Resources Science and Engineering, Taiyuan University of Technology, Taiyuan 030024, China
*
Author to whom correspondence should be addressed.
Water 2025, 17(5), 759; https://doi.org/10.3390/w17050759
Submission received: 3 February 2025 / Revised: 23 February 2025 / Accepted: 1 March 2025 / Published: 5 March 2025
(This article belongs to the Section Ecohydrology)

Abstract

:
In this paper, a coal–water–ecology (CWE) index system is firstly constructed based on an analysis of the current situation regarding coal mining, water resource utilization, and the ecological environment in an open-pit combined underground mining area. Three methods are used to determine the weights of each index in the system. Then, the TOPSIS model and coupling coordination degree model are adopted to construct the coordinated development model for CWE. Finally, the coordinated development status of CWE in the mine area is analyzed, and the next improvement measures are pointed out. The CWE index system contains 3 dimensions, 6 aspects, and 21 indicators. Combining the weights with game theory makes the weight coefficients more concentrated, reduces the dispersion of single weights, and makes the results of the fusion weights more reliable. The TOPSIS model and coupling coordination degree model can successfully characterize the coordinated development of CWE system factors. The proximity degrees of the CWE system in the study area show an increasing trend year by year. Although the coupling degree of CWE increases slowly year by year, it exhibits little coordination, with an average value of 0.4. Economic benefits, the water resource utilization rate, and the green land area are the three indices with the greatest weights. While ensuring the economic benefits of coal mining, coal enterprises should focus on improving the water resource utilization rate. The reduction in the green land area should also be emphasized in open-pit mining.

1. Introduction

1.1. Background

Coal is the most important fossil energy source in China. Coal resources play a key role in ensuring national energy security and economic development. However, the regional ecological environment and water resources will be inevitably damaged in the process of coal mining. In the process of open-pit mining (OPM), the stripping of surface soil and the transport and discharge of soil lead to the serious damage and occupation of land, changes in the topography and landform, a reduction in the vegetation area, and the serious destruction of water resources and the atmospheric ecological environment. In the process of underground coal mining (UCM), the integrity of the coal seam roof and floor will be destroyed [1], and a large amount of mine water will be discharged. Mine water needs to be treated and converted into water resources for recycling. In addition, coal mining, coal washing, and other activities require large amounts of water resources [2]. The efficient utilization of water resources in mining areas is of great significance to ensure the normal operation of coal enterprises [3]. Open-pit combined underground mining (OPCUM) refers to the simultaneous mining of open-pit and underground coal in the same mining area [4]. For OPCUM areas, it is necessary to consider the carrying capacity of water resources and the ecological environment while ensuring the economic benefits of coal mining. Therefore, the coordinated development mode of coal–water–ecology (CWE) can provide guidance for the sustainable development of OPCUM areas.
Research on the impact of coal mining on water resources can be divided into two categories. One is the study of water resources. Mining will first affect the regional land use structure and then lead to a reduction in regional water resources. Ecological hydrological models can be applied to analyze water resources under different land use conditions to guide water resource regulation [5]. At the same time, a water saving strategy is implemented in the mining area to reduce the degree of water shortage to the greatest extent. In view of the amount of water resources used in the process of coal mining, many scholars have established a water footprint evaluation model for energy production by applying the whole life cycle theory, and they have calculated and analyzed the water footprint of the coal industry [6,7,8]. The other category is the utilization of mine water resources. A mine water utilization model was established, including the bidirectional coordinated mine water supply and a demand evaluation model, based on the TOPSIS method [9].The three-in-one model of “drainage, supply, and environmental protection” has been proposed in mine water disaster prevention. In terms of mine water resource utilization, the five-in-one mine water resource utilization mode of “control, treatment, utilization, recharge, and ecological environmental protection” has been proposed [10]. There are also ecological utilization systems and evaluation models for mine water from a systematic perspective [11]. In addition, many scholars have also studied the optimal allocation of water resources in mining areas. Deng [12] studied the optimal allocation of water resources in the Hongshaquan open-pit mine. Duan [13] analyzed the allocation of water resources in the Pingshuo coal mine. Fang [14] studied the water resource carrying capacity of the Shanxi coal base. Bai [15] proposed the optimal water resource planning of the Fengfeng mining area. Zhang [16] conducted research on water resource allocation in the Sishanling area. Masood et al. [17] investigated the true cost of the coal mining industry and its associated environmental impacts on water resource development. These research works provide a theoretical basis for the efficient utilization of water resources in the mining area.
Coal mining has led to a series of ecological and environmental problems. Mining area reclamation is a major ecological restoration measure that can re-establish a permanent and stable landscape and effectively promote the restoration and improvement of the ecosystem [18]. Many scholars have evaluated the ecological changes in coal mining areas [18,19,20]. Sun [21] classified and assessed the temporal and spatial characteristics of the ecosystem in the process of land destruction and reclamation in mining areas, analyzed the risk changes, and established a prevention and control mechanism. Cui [22] constructed an evaluation index system and evaluation method for land reclamation in OPM and proposed a land reclamation model for the whole life cycle. Regarding water resource pollution, Singh et al. [23] conducted an evaluation of the surface water quality index of the Jharia coal mining region and its management of surface water resources. Wright et al. [24] investigated water pollution and ecological impairment resulting from an underground coal mine. Bazaluk et al. [25] forecasted the underground water dynamics within the technogenic environment of a mine field. In addition, satellite remote sensing (SRE) information technology can be used to observe the environmental problems caused by mining. This technology can be used to study the land reclamation status of the mining area [26,27], analyze the temporal and spatial changes in the ecological status [28,29], and monitor the land use of the mining area [30]. In addition, SRE can also be used to identify and monitor polluted water bodies in mining areas [31]. This technology can be used to interpret different ecological indicators and construct different ecological models by integrating various ecological factors. These models include the remote sensing ecological index (RSEI) [32], ecological quality assessment model [28], vegetation coverage inversion model [33], etc. In this way, the ecological status and environmental quality of the mining area can be analyzed and evaluated, and the ecological security status of the mining area can be evaluated [34,35].
Some scholars have studied the multi-factor coordination and coupling in coal mines. Kang et al. [36] built a quantitative model of environmental factors, providing a basic framework for the quantitative assessment of the environmental impacts of mineral resource development. Lawrence [37] used the system flow diagram method to describe the environmental system as interrelated components and identified secondary, tertiary, or higher environmental impacts through the linkages between these environmental components, so as to determine the direct and indirect environmental impacts in mineral resource development. Griffiths [38] proposed a systematic comprehensive fuzzy analysis method. By constructing a spatiotemporal fuzzy similarity matrix, he compared the accumulation of environmental influences on spatiotemporal levels. Sun [39] established a cooperative degree evaluation model of a coal mine production system based on the entropy method and TOPSIS method and proposed improvement countermeasures for key bottlenecks. Wang et al. [40] constructed an index system and measurement method for the coordinated utilization coupling relationship to conduct a comparative analysis of this relationship between coal and land resources in coal mining areas. Liu [41] constructed the matching and coordination coefficients of water and land resources to conduct a quantitative evaluation and dynamic analysis of the coordinated utilization of water and land resources. Yan [42] established a coupling coordination degree model to analyze the coordination of coal–land–water utilization in mining areas. Regarding optimization methods, Mufazzal et al. [43] proposed a new fuzzy multi-criteria decision-making method based on proximity index values. Hapishko et al. [44] conducted the modification of fuzzy TOPSIS based on various proximity coefficient metrics and shapes of fuzzy sets. Bingol [45] established a combined fuzzy AHP–entropy and proximity index value method. In addition, relevant studies also include the coordinated utilization of coal and land resources in mining areas [39,40], the coordinated coupling of coal mining and ecological protection [46], the coordinated management and control of coal–soil–water resource protection [47], and the collaboration between coal and water resources [48].
Thus far, research has been carried out from the perspectives of coal mining’s impact on water resources and the ecological environment, multi-factor coordinated coupling development, and water resource allocation. However, most studies are conducted based on a single aspect or two factors, and there are few studies on the coupling of the coordinated development of CWE factors in OPCUM areas.

1.2. Overview of the Study Area

The Pingshuo mining area, located in Shuozhou City, Shanxi Province, is the first OPCUM area in China. It belongs to the semi-arid continental monsoon climate area in the northern temperate zone. Rainfall varies from year to year and is unevenly distributed within the year. Rainfall is mainly concentrated in June to August, accounting for about 65% of the annual precipitation. The average annual rainfall is 421.2 mm, the maximum annual rainfall is 806.7 mm, and the minimum annual rainfall is 193 mm.
The depth of the coal seam of the Pingshuo mining area is 100~350 m, and the shallow part is an OPM. The junction of the OPM and the area below the dump are mined via UCM. The Pingshuo mining area now has three super-large OPMs and three modern UCMs. The production capacity of these mines is tens of millions of tons. The whole mining area is divided into several areas, including the east OPM area, the Muguajie area, the Anjialing (AJL) area, and the Antaibao (ATB) area (Figure 1). In this paper, the AJL and ATB areas are selected as the study areas. This region includes the AJL OPM, ATB OPM, and Jinggong No. 1 UCM. Among them, the approved production capacity of both the AJL OPM and ATB OPM is 20 million t/a, and the approved production capacity of the Jionggong No. 1 UCM is 10 million t/a.
The water supply in the study area is mainly composed of three parts, namely surface water, groundwater, and reclaimed water. The surface water is the Yellow River water diverted from the Wanjiazhai Yellow River Diversion Project in Shanxi Province. Groundwater comes from the Liujiakou water source, and its aquifer is dominated by Ordovician carbonate rocks. The reclaimed water mainly comes from mine gushing water and wastewater after treatment in the mining area. The wastewater mainly comes from the Daxigou wastewater treatment station, untreated domestic sewage, machine repair sewage, coal preparation plant cleaning water, mine drainage, gangue power plant drainage, and drainage from surrounding villages. The treated water from the treatment station is reused or discharged to the Qilihe River.

1.3. Research Objective

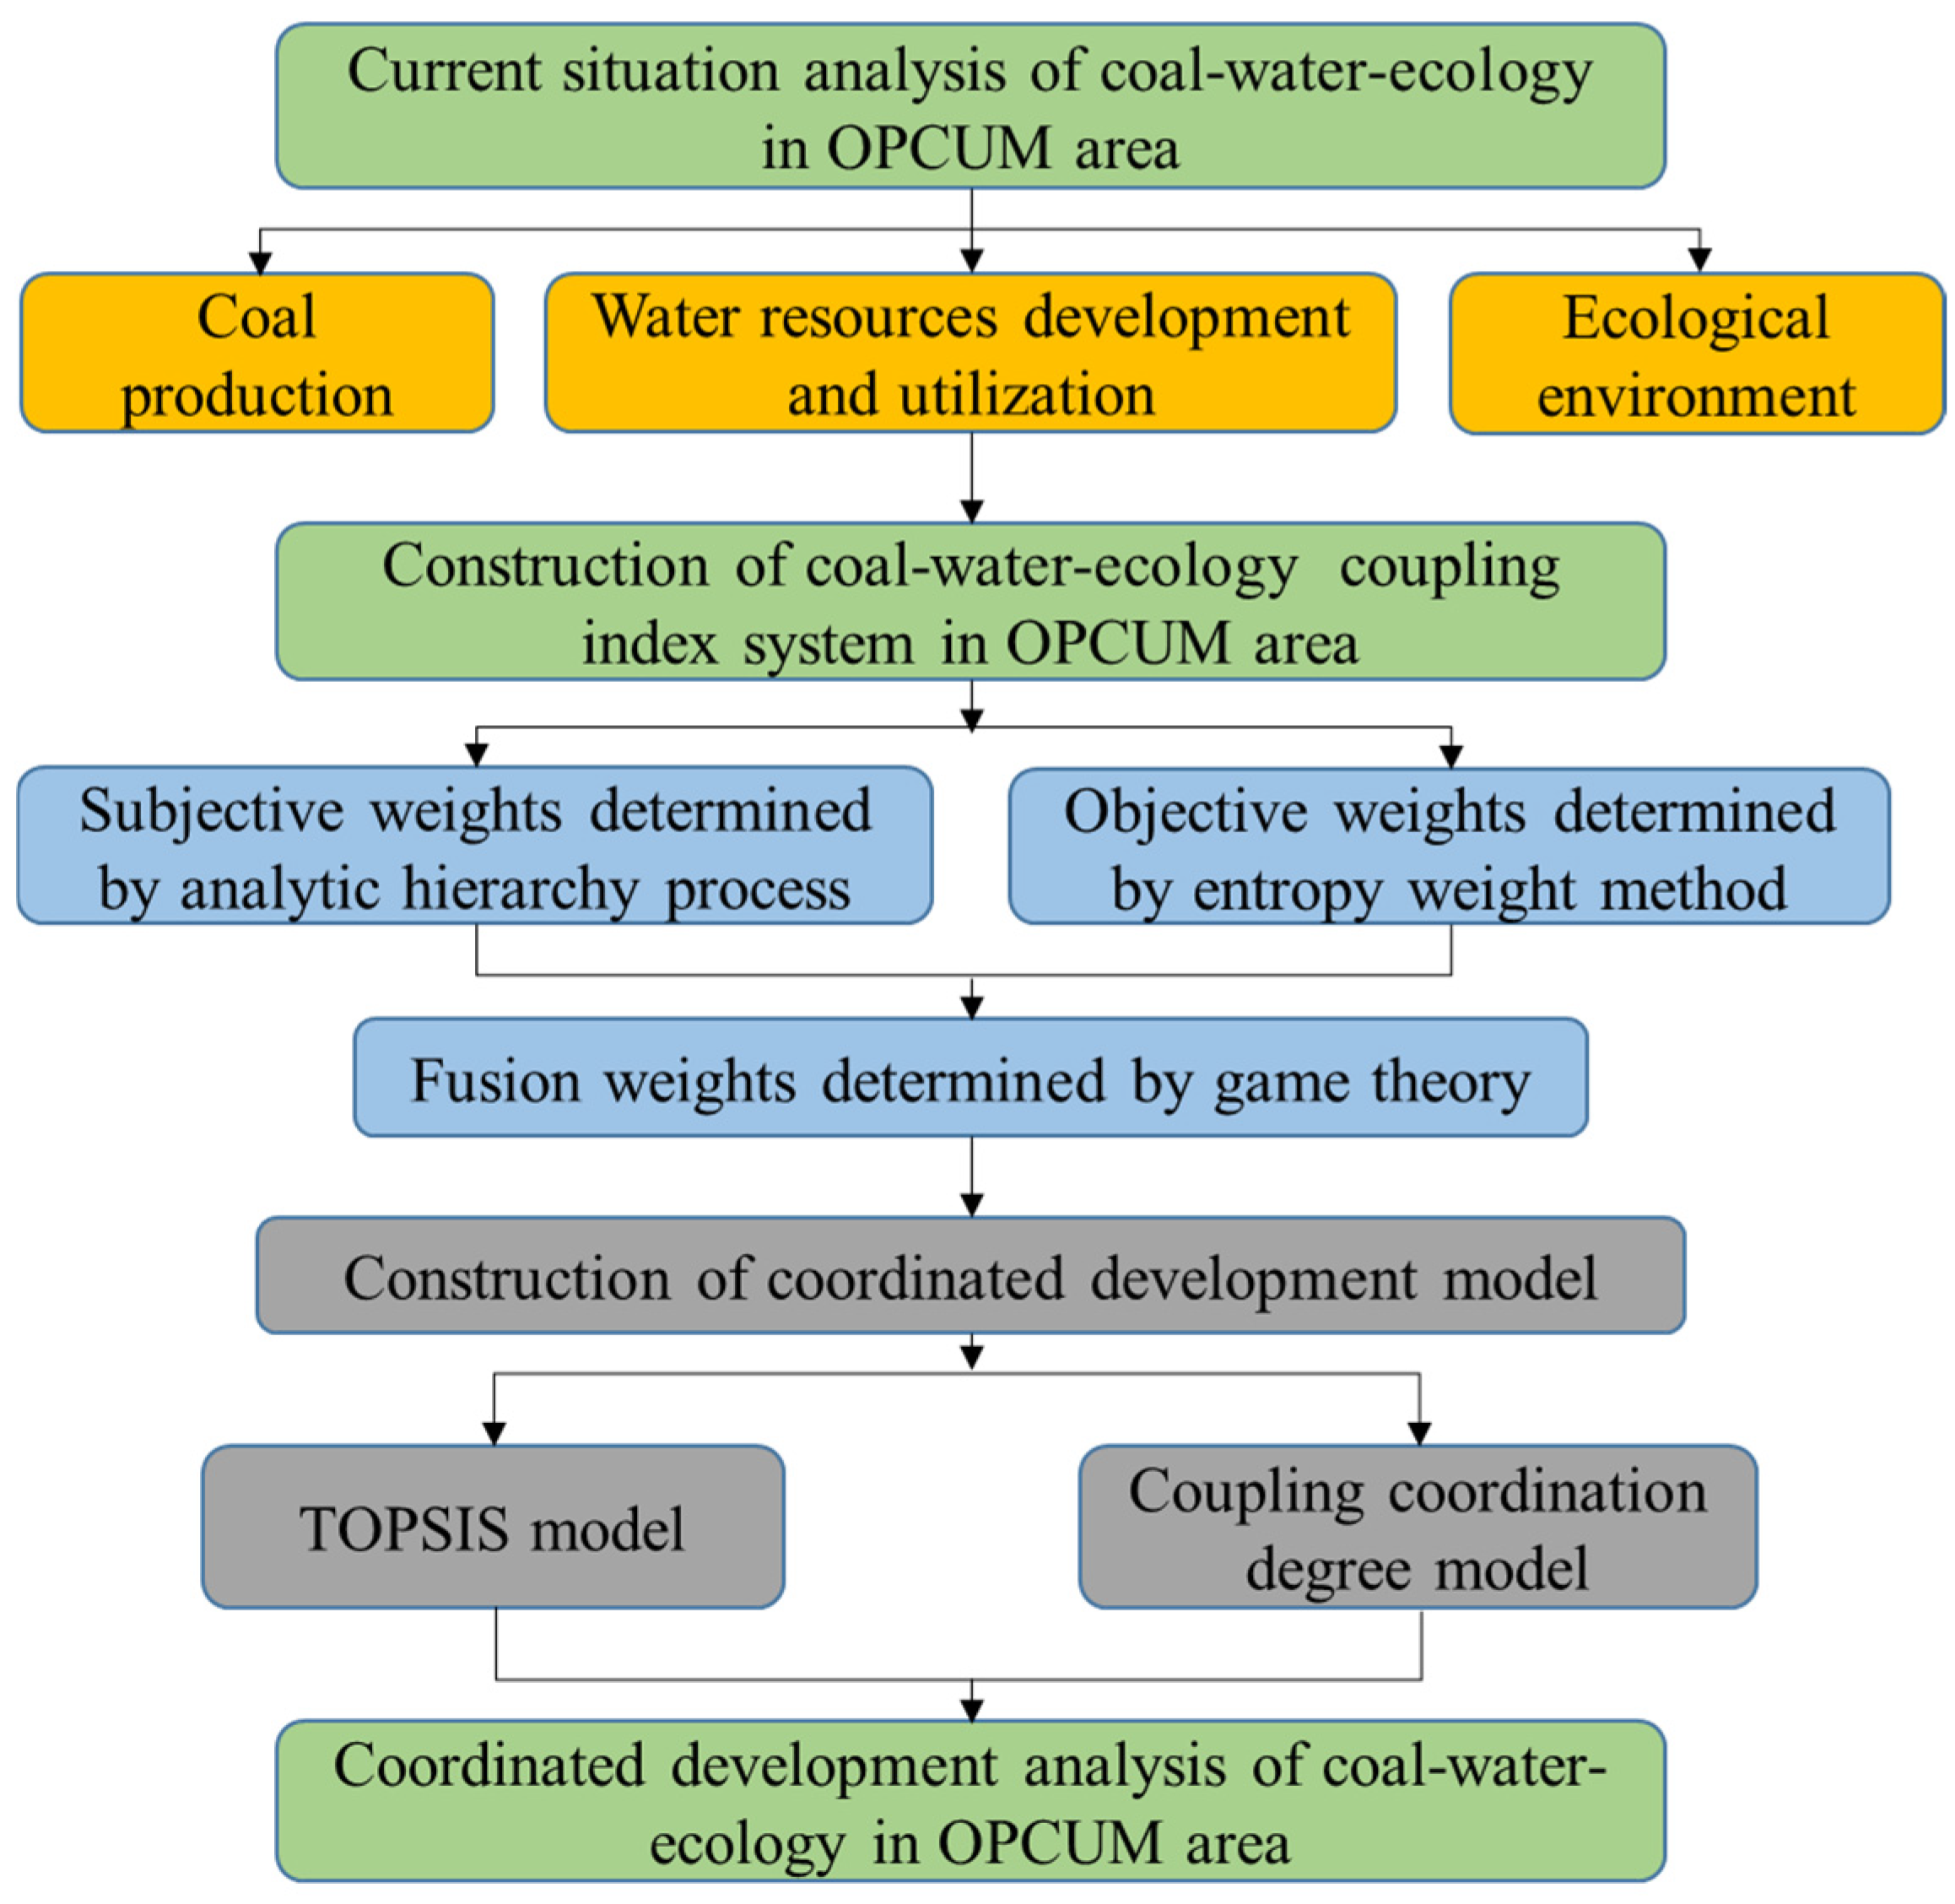
In this paper, the AJL-ATB OPCUM is taken as the research object. Based on an analysis of the current situation regarding coal mining, water resource utilization, the ecological environment, and reclamation in the AJL-ATB OPCUM, the CWE index system and coordinated development model are constructed. Then, the development level of each factor of coal, water, and the ecological environment in recent years is analyzed. Finally, the coupling coordination degree and comprehensive development level of the CWE system are evaluated. The research results can provide support for the sustainable and green development of OPCUM. This research’s technical roadmap is shown in Figure 2.

2. Coal–Water–Ecology Coupling Index System

2.1. Coal–Water–Ecology Coupling Mechanism

The coordinated development of coal, water, and ecology requires that the production of coal mines, the utilization and protection of water resources, and the destruction and protection of the ecological environment are considered equally important. In the process of coal mining, the mine water should be used rationally, the use of fresh water should be reduced, and the utilization rate of water resources should be improved. At the same time, the ecological environment damage that may occur in the process of coal mining should be reduced, the damaged land and vegetation should be repaired in time, and land reclamation should be carried out to achieve the harmonious development of coal mining, water resources, and the ecological environment. In this way, the maximum benefit, sustainable development, and the coordinated coupling development of the mining area can be realized. The CWE coupling mechanism is shown in Figure 3.

2.2. Index System

According to the characteristics of the AJL-ATB OPCUM, the current situation regarding coal mining, water resource utilization, and the ecological environment is analyzed, and multiple factors involved in the coordinated development of coal mines are considered. The index system of CWE coordinated development is obtained by selecting 21 indices from three dimensions and six aspects via frequency statistics and correlation analysis.
The target layer is the coordinated development of coal–water–ecology (A). The criterion layer consists of three dimensions: coal production (B1), water resources (B2), and the ecological environment (B3). The factor layer includes coal production and consumption (C11), the coal economy (C12), the water resource quantity (C21), water resource pollution (C22), ecological destruction (C31), and ecological protection (C32). The 21 indicators of the indicator layer are shown in Figure 4.

2.3. Index Connotations

(1)
Coal production and consumption (C11)
Coal production and consumption mainly refers to the production capacity and resource consumption. Coal production (D111) is measured in 10,000 tons of coal, integrating the total amount of coal mined by OPM and UCM. Coal mining also involves power resource consumption (D112) and water resource consumption (D113). The greater the output, the smaller the consumption of resources and the greater the value of coal production in mining areas.
(2)
Coal economy (C12)
The coal economy refers to the economic value brought by coal mining. The smaller the cost, or the better the benefit, the greater the economic value. The resource acquisition cost, operation cost, and economic benefit are selected to characterize the economic status of coal.
The resource acquisition cost (D121) is the cost of clean water resources to be purchased during the system’s operation. The operation cost (D122) refers to the sum of the electricity fee, material fee, cost engineering fee, outsourced maintenance fee, safety fee, commuting fee, business contract fee, and labor fee spent during the operation of the clean water system, domestic and industrial water system, underground water system, and reuse water system. The economic benefits (D123) include the savings in purchased water resources through reclaimed water allocation and reuse projects, and the savings in the environmental protection tax of water pollutants due to exemption from paying for the excess water discharged after their own wastewater treatment plants meet the standards.
(3)
Water resources (C21)
Coal mining, coal washing, and other activities require large amounts of water resources. UCM will produce a large amount of water gushing. There is also drainage from other production activities. The wastewater needs to be treated and reused. Therefore, four indices, namely the water resource development utilization ratio, fresh water in water supply ratio, industrial water reuse ratio, and water consumption with CNY 10,000 industrial added value, are selected to characterize the water resource utilization level of the mining area.
The water resource utilization ratio (D211) refers to the ratio of water resource utilization and the available water supply. Under a certain amount of water supply, lower water resource utilization means that the mining technology implements the measures for water saving well. The fresh water in the water supply ratio (D212) is opposite to the industrial water reuse ratio (D213). The smaller the proportion of groundwater or surface water in the total water consumption, and the greater the proportion of recycled water, the more water resources can be reused. The water consumption with CNY 10,000 industrial added value (D214) is used to evaluate the level of industrial water consumption by combining the output value and the water quantity.
(4)
Water pollution (C22)
When sewage is still not fully reused after treatment, the remaining water resources need to be stored in reservoirs or discharged into rivers according to standards. At this time, the displacement and pollutant concentrations need to be taken into account. The lower the emissions and the smaller the concentrations of pollutants, the smaller the degree of water pollution. Therefore, wastewater discharge (D221) and the concentrations of SS (D222), COD (D223), BOD (D224), and ammonia–nitrogen (D225) are selected to characterize water pollution.
(5)
Ecological damage (C31)
OPM processes include perforation, blasting, shoveling, transportation, and rock drainage. In the process of excavation and soil discharge, land resources and ecological aspects will be destroyed. The excavation loss area (D311) refers to the area destroyed by excavation. The land occupied area (D312) refers to the stripped land and the area occupied by the dump. The vegetation loss area (D313) refers to the total area of vegetation destroyed during OPM. These three indices are selected to characterize the damage caused by OPM to the ecological environment.
(6)
Ecological protection (C32)
In view of the destruction of the environment, mining area reclamation and greening measures should be taken. The green area, land reclamation rate, and forest vegetation coverage (FVC) are selected to characterize the ecological protection degree. The green area (D321) denotes the land area of reclamation. The reclamation rate (D322) indicates the degree of restoration of ecological damage. The FVC rate (D323) refers to the proportion of the projected area of forest vegetation on the ground to the total land area.

3. Materials and Methods

3.1. Data Sources and Processing

The data on coal production and water resources are derived from the statistical data of the Pingshuo mining area. Ecological data are derived from Landsat 8 remote sensing images of the annual vegetation growth period. The remote sensing images are preprocessed by image clipping, radiometric calibration, and atmospheric correction. Finally, the normalized difference vegetation index (NDVI) and FVC rate of the mining area are calculated.
Due to the different dimensions of different indicators, normalization is adopted to process the data. The initial index matrix R is constructed by
R = x i j m n
where xij is the index value of the i-th index in the j stage. m is the number of indicators. n is the number of stages.
The initial index matrix R is normalized, and the normalized matrix U is obtained.
U = u i j m n
In the formula, for positive indicators,
u i j = x i j min x i j max x i j min x i j
For negative indicators,
u i j = max x i j x i j max x i j min x i j

3.2. Vegetation Coverage Rate

The FVC is extracted by the pixel binary model. The pixel binary model assumes that the spectral information of a pixel is only linearly mixed via vegetation and soil and then calculates the pure pixel remote sensing information of the two parts. It then calculates the FVC. The NDVI is a vegetation index and the most common planted cover index used in remote sensing estimation methods. Its calculation formula is as follows:
N D V I = D N N I R D N R D N N I R + D N R
where D N N I R is the near-infrared band and D N R is the red band. The NDVI ranges from −1 to 1.0, which denotes rock or bare soil. Negative values indicate that the ground is covered by clouds, rain, etc. A positive value indicates that there is vegetation cover, and the greater the vegetation cover, the higher the NDVI value.
The FVC rate is a basic indicator of a change in the ecological environment. Its calculation formula is as follows:
F V C = N D V I N D V I s o i l N D V I v e g N D V I s o i l
where N D V I s o i l is the NDVI value of the completely bare soil or non-vegetated area. N D V I v e g is the NDVI value when the land area is completely covered by vegetation. The NDVI values with a cumulative frequency of 5% and 95% are selected as the values of N D V I s o i l and N D V I v e g , respectively.

3.3. Classification of Land Use Types

The land use of the mining area is divided into 8 types: the mining area, stripping area, dumping site, reclamation area, grassland, forest land, water area, and other land. The mining area refers to the coal seam area that is being mined in the process of OPM. The stripping area refers to the area where the surface soil has been stripped away, but has not been stripped to the mining coal seam. The dumping site refers to an area where waste rock and soil generated from mining are piled and the abandoned landform is not reclaimed. The reclamation area refers to the area where the dumping site is reclaimed. Grassland refers to plants that are artificially planted or grown naturally in the mining area. Forest land refers to the area covered by natural vegetation. The water area refers to the area of water that exists in the mining area. Other land refers to the construction area and other land used for construction, offices, or living in the process of coal mining.
The classification of the land use types is performed using the supervised classification tool in the Environment for Visualizing Images (ENVI) (version 5.2). The maximum likelihood method is used for supervised classification. Before classification, the learning sample is selected first, and then regions of interest are established, and different ground object types are saved in different regions of interest. The sample separation degree is between 0 and 2. The greater the degree of separation, the strong the representation of the learning sample regarding the ground object. After supervised classification, it is inevitable that some small patches will be produced in the classification result. In order to ensure the quality of supervised classification and ensure that the calculated sample separation is greater than 1.8, it is necessary to remove these small patches. The majority/minority analysis method is used to remove small patches.

3.4. Determination of Index Weights

The accuracy of the calculation of the CWE coordinated development model depends on the value of the index weights. In order to avoid the limitation of a single weight, the method of game theory is adopted to ensure the consistency of subjective and objective weights. In this paper, two methods, namely the analytic hierarchy process and entropy weight method, are used to assign weights, and the fusion weight is calculated as the final result of the weight.

3.4.1. Subjective Weights Determined by Analytic Hierarchy Process

The analytic hierarchy process is the combination of qualitative and quantitative multi-criteria decision-making methods, and it is suitable for the evaluation of index systems with obvious structural levels. The calculation steps are as follows.
(1)
Construct the judgment matrix
For r indicators at the same level in the index system, a pairwise comparison is performed, and the judgment matrix A is constructed by using the 1–9 scale method (see Table 1).
A = ( a i j ) r r
(2)
Calculate the weight vector Wi
W i = M i ¯ i = 1 r M i ¯
M i ¯ = i = 1 r a i j r
(3)
Consistency check
The maximum eigenvalue λmax of judgment matrix A is calculated and the consistency is tested by CR. When CR < 0.1, the result is accepted; otherwise, the result is not accepted.
λ m a x = 1 r i = 1 r ( A W ) i W i
C R = C I R I
C I = λ m a x r r 1
In the formula, r is the matrix dimension. RI is the consistency indicator. Table 2 lists the queries of RI.

3.4.2. Objective Weights Determined by Entropy Weight Method

Information entropy can be used to extract indicator information via indicator values. The entropy weight method is a reasonable method to determine objective weights. The specific steps are as follows.
(1)
Calculate the entropy of the indicator
According to the definition of information entropy, the entropy ei of the index is calculated by
e i = k j = 1 n f i j l n f i j
where k = 1 l n n , f i j = u i j j = 1 n u i j . When f i j = 0 , f i j l n f i j = 0 .
(2)
Calculate the weight of the indicator
The weight ωi is calculated according to the entropy of the index.
ω i = 1 e i m i = 1 m e i

3.4.3. Fusion Weights Determined by Game Theory

In view of the shortcomings of the single weighting method, game theory combination weighting can be used to achieve the unity of subjective and objective weights and improve the rationality of the weight results.
The calculation method of game theory used to determine the fusion weight is as follows.
(1)
Suppose that L types of weight vectors uk are calculated in L ways, and linear combinations of them are obtained to obtain all possible weight sets u:
u = k = 1 L α k u k T
where αk is the linear combination coefficient, and αk > 0.
(2)
Select the most satisfactory weight in the weight set u through the following function:
m i n k = 1 L α k u k T u k
(3)
A set of optimization coefficients αk is calculated, and the combined weight u* is calculated by using the normalized optimization coefficient αk*:
u * = k = 1 L α k * u k T
α k * = α k k = 1 L α k

3.5. Construction of Coordinated Development Model

The Technique for Order Preference by Similarity to Ideal Solution (TOPSIS) model is also called the approximate ideal solution sorting method. The basic principle is to evaluate the object through the distance between the positive and negative ideal solutions. The result can be used as an indicator of the advantages and disadvantages of coordinated development. The TOPSIS method has been proven to be a very effective method in multi-objective decision analysis [44]. In this paper, the coordinated development of CWE in the mining area is analyzed using the TOPSIS model. The degree of coupling coordination can be used to analyze the degree of coordination development between different elements in the same region—that is, the degree of interaction. The specific calculation steps are as follows.
(1)
Calculate the weighted matrix Y of the standardized index and set vi as the weight of an index.
y i j = u i j   ×   v i
Y = y i j m n
(2)
Determine the positive and negative ideal solutions. Set yk+ and yk as the maximum and minimum values of each index, respectively; then, the positive ideal solution y+ and the negative ideal solution y are obtained.
y + = ( y 1 + , y 2 + , , y m + )
y = ( y 1 , y 2 , , y m )
(3)
Calculate the distance between each index datum and the positive and negative ideal solutions.
d j + = i = 1 m y i j y k + 2
d j = i = 1 m y i j y k 2
(4)
Calculate the proximity degree cj. The proximity degree represents the degree of approximation between the evaluation index and the ideal solution. The greater the proximity degree, the higher the level of the evaluation scheme.
c j = d j d j + d j +
(5)
Calculate the coupling coordination degree D.
D = C T
C = c 1 × c 2 × c 3 ( c 1 + c 2 + c 3 ) 3 1 / 3
T = α c 1 + β c 2 + γ c 3
where C is the coordination index. T is the comprehensive evaluation index. c1, c2, and c3 are the proximity degrees of coal production, water resources, and the ecological environment, respectively. α, β, and γ are the weights of each dimension determined by the entropy weight method.
The larger the value of D, the better the degree of coordination and coupling, as shown in Table 3.

4. Results and Discussion

4.1. Analysis of FVC Ratio and Area Change

Through ENVI calculation and ArcMap 10.2 image processing, the FVC ratio from 2015 to 2020 is as shown in Figure 5. The FVC ratio of the study area was statistically analyzed, and the results are shown in Table 4 and Table 5. In the study area, the ratio and area of first-order coverage and second-order coverage mostly showed negative growth and had a trend of decreasing year by year. The ratio of first-order coverage decreased from 26% in 2016 to 20% in 2020, and the area decreased from 35.14 km2 in 2016 to 27.26 km2 in 2020, a decrease of 7.88 km2. The ratio of second-order coverage decreased from 18% in 2015 to 15% in 2020, and the area decreased from 24.98 km2 in 2015 to 20.32 km2 in 2020, a decrease of 4.66 km2. At the same time, the ratio and area of fourth-order coverage and fifth-order coverage basically showed positive growth and had an increasing trend year by year. The ratio of fourth-order coverage increased from 23% in 2015 to 29% in 2020, and the area increased from 31.71 km2 in 2015 to 39.29 km2 in 2020, an increase of 7.58 km2. The ratio of fifth-order coverage increased from 17% in 2015 to 19% in 2020, and the area increased from 22.69 km2 in 2015 to 25.54 km2 in 2020, an increase of 2.85 km2. The average FVC ratio from 2015 to 2020 was 0.50, 0.46, 0.49, 0.50, 0.52, and 0.52, respectively. It can be seen that the vegetation cover improved slightly over time.

4.2. Analysis of Land Use Type Change

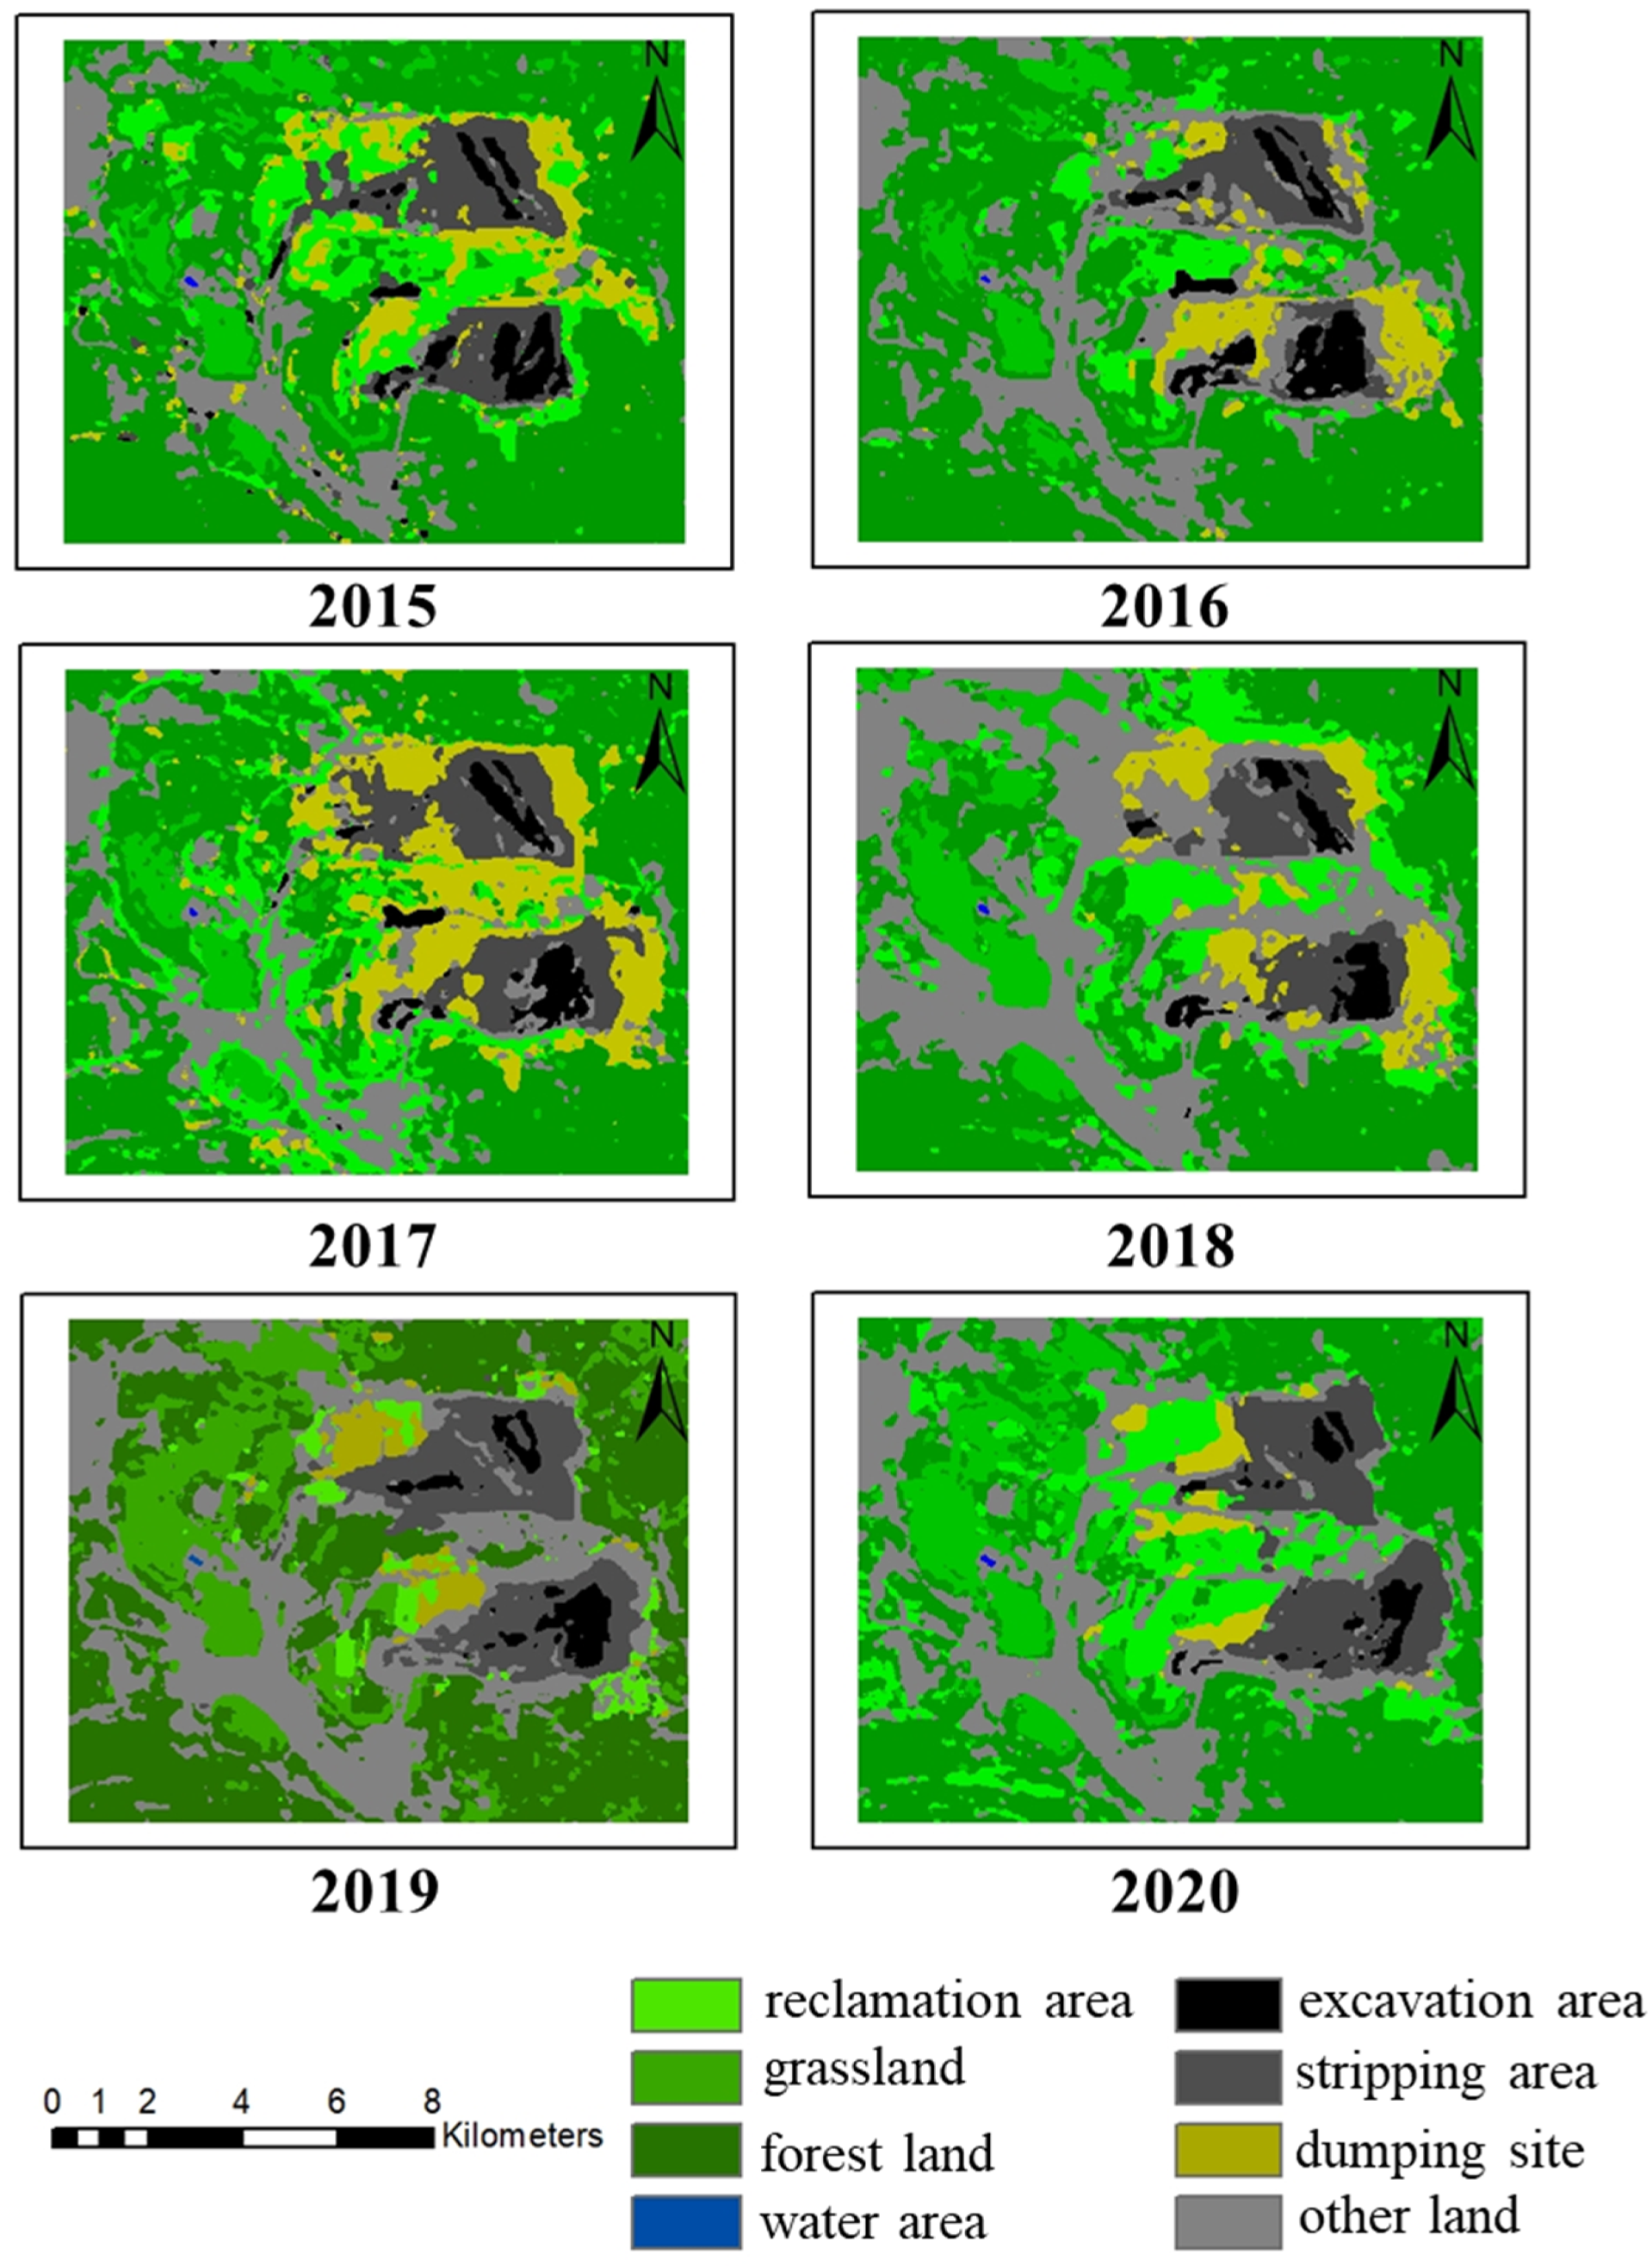
The classification results for the land use types are shown in Figure 6. The post-classification statistical function in ENVI was used to obtain the area and proportion of different land use types in the study area from 2015 to 2020, as shown in Table 6. Its land use structure mainly has the following characteristics.
(1)
OPM occupies a large amount of land. The research area is mined by OPM in the ATB and AJL coal areas, and soil discharge is carried out in UCM areas. In recent years, the reclamation and greening of the waste dump have been implemented, and the area of mining and discharging has gradually decreased, while the area of greening has increased year by year.
(2)
Green space is the largest part. Except for the excavated and piled areas, all areas of the mining area have been reclaimed.
(3)
Other land uses occupy a certain proportion, and the water area accounts for the smallest proportion and basically remains unchanged.
The change amplitude of land use in the reclamation area, mining area, stripping area, and dump sites was calculated, and the results are shown in Table 7. It can be seen that reclamation areas and dump sites experienced the largest changes, and the dump area decreased by 6.39 km2 over six years. At the same time, the reclamation area increased by 6.39 km2 over six years, indicating that the reclamation and greening work of the mining area has been gradually promoted, and the waste dump has been greening. The mining area and stripping area fluctuated with OPM, the change amplitude was less than 6 km2, and the total change amplitude was not more than 2 km2 over six years.
The land use structure and land use change mainly reflect the composition of and changes in different types of ground objects in the study area. The land use transfer matrix can accurately and quantitatively reflect the migration and conversion between different land use types. It can directly reflect the dynamic evolution process of each land use type. ENVI was used to calculate the land use transfer matrix in the study area, and the calculation results are shown in Table 8. According to the size of the transferred area, the top three are forest land, dump areas, and reclamation areas, whose transferred areas are 25.13 km2, 9.94 km2, and 9.32 km2 respectively. Moreover, 8.81 km2, 7.14 km2, and 6.13 km2 of forest land were converted into other land, reclamation areas, and grassland, respectively. Meanwhile, 3.42 km2, 2.7 km2, and 2.31 km2 were converted into other land uses, reclamation, and stripping areas, respectively. Reclamation areas of 2.98 km2, 2.04 km2, and 1.8 km2 were converted to other land, forests, and grassland, respectively. According to the size of the transferred area, the top two classes are other land uses and reclamation areas, whose transferred areas are 18.68 km2 and 11.93 km2, respectively. Meanwhile, 8.81 km2 of forest land, 3.42 km2 of waste dumps, and 2.98 km2 of reclamation areas were converted to other land. There were 7.14 km2 of forest land, 2.7 km2 of dumps, and 1.35 km2 of stripping areas transformed into reclamation areas. Excluding the influence of other land uses and forest land, the change in the land use types consists mainly of the transformation of dump areas and stripping areas into reclamation areas.

4.3. Weight Analysis

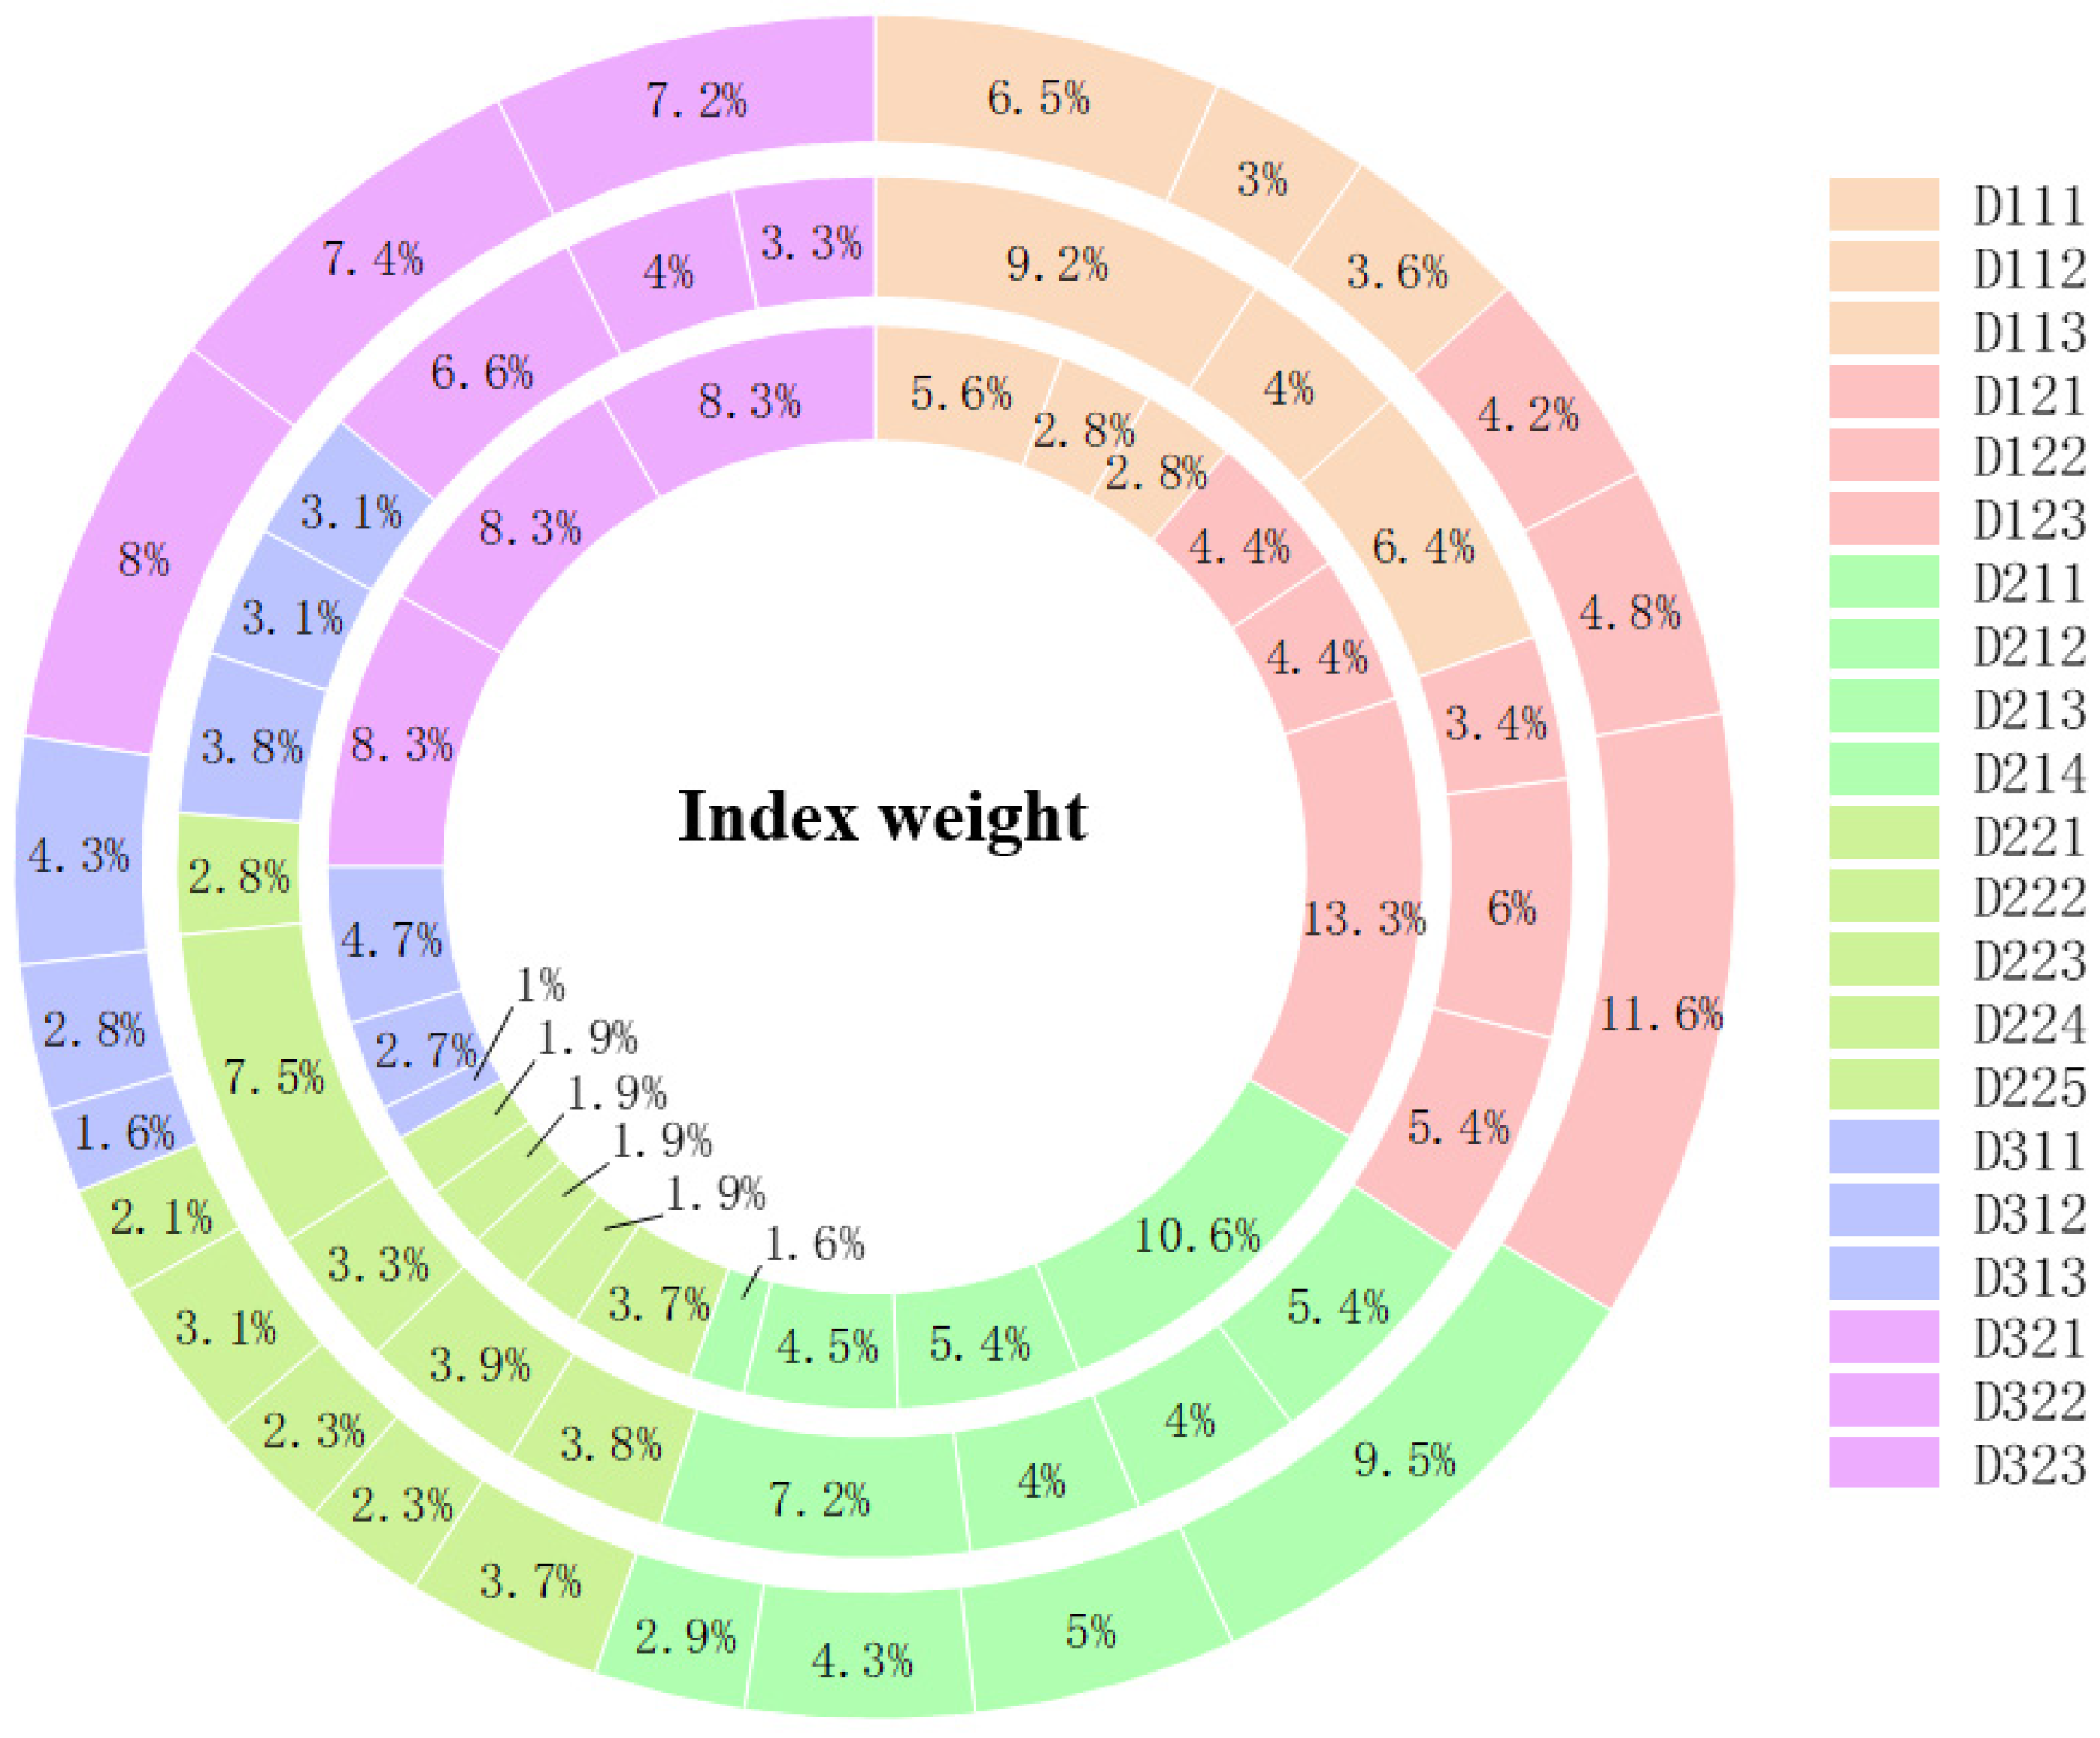
The subjective weight, objective weight, and fusion weight are compared, and the results are shown in Figure 7. The inner ring represents the subjective weights of different indicators, the middle ring represents its objective index, and the outer ring represents its fusion weight. As can be seen from the figure, the fusion weight for an indicator is between two single weights. As for the criterion layer, because the objective weight is the information extracted from the data, there is a large difference in the weight size, and the proportion of water resources is significant, while the proportion of the ecological environment is small. However, the subjective weight takes coal, water, and ecology into equal consideration, and the weights of the three dimensions are similar. The result of the fusion weight is between two single weights, indicating that the fusion weight combines the advantages of subjective and objective weights and expresses the information of two single weights at the same time, which makes the result of the fusion weight more reliable.
Table 9 lists the calculation results regarding the fusion weights of each layer. Economic benefits, the water resource utilization ratio, and the green area are the top three indicators, corresponding to three different criteria of coal mining, water resources, and the ecological environment, respectively. Guo et al. [3] concluded that the water resource utilization ratio is the most important factor affecting the optimal allocation of water resources in coal mining areas. Sun et al. [49] found that the coal production and surface green area have a great influence on the groundwater storage capacity of the mining area. Our results agree with theirs. Wright et al. [24] found that the wastewater discharge of a coal mine caused major impairments in the aquatic ecosystem. The study area considered in this paper does not allow wastewater discharge, so the weights of water resource pollution indicators are low.
The variation coefficients of the single and combined weights for an indicator are calculated, and the results are shown in Figure 8. It is found that the weight coefficients of some indicators are relatively concentrated, such as D112, D213, etc. However, the weight coefficients of some indicators are relatively dispersed, such as D123, D224, etc. The results of a single weight are different and the weight coefficient is uncertain. The variation coefficients of combined weights are always smaller than those of single weights. Although the uncertainty of single weights still exists, it also greatly reduces the dispersion of single weights and makes the weight coefficients more concentrated. The results of the fusion weights are more reliable.

4.4. Analysis of Coordinated Development of CWE System

4.4.1. Proximity Degree Analysis

The proximity degree can represent the quality of the coordinated development of multiple factors of the system. The TOPSIS evaluation model was used to calculate the proximity degrees of the CWE system’s factor layers in the study area from 2015 to 2020, and the calculation results are shown in Table 10. It can be seen that the development level of coal production and consumption is not stable, and the development level in 2015 is the best. The reason is that, with the closure of the Jinggong No. 2 mine, the coal production capacity has declined, and the electricity consumption and water consumption have also decreased year by year. The development level of the coal economy basically shows an upward trend. The resource acquisition cost and economic benefit are the two major factors affecting the development level of the coal economy. The development level of water resources shows a fluctuating state. It increased from 2015 to 2016, decreased from 2016 to 2018, and increased again from 2018 to 2020, with the average level in a constant state. The development level of water pollution has improved year by year, but, in 2020, due to the increase in pollutant emissions, the water pollution worsened compared with previous years. In addition, in 2017, the development level of ecological destruction was gradually improved, and ecological protection also showed a good development trend. The results show that the ecological destruction in the study area was gradually reduced, ecological protection work was gradually implemented, and the situation of the ecological environment was gradually improved.
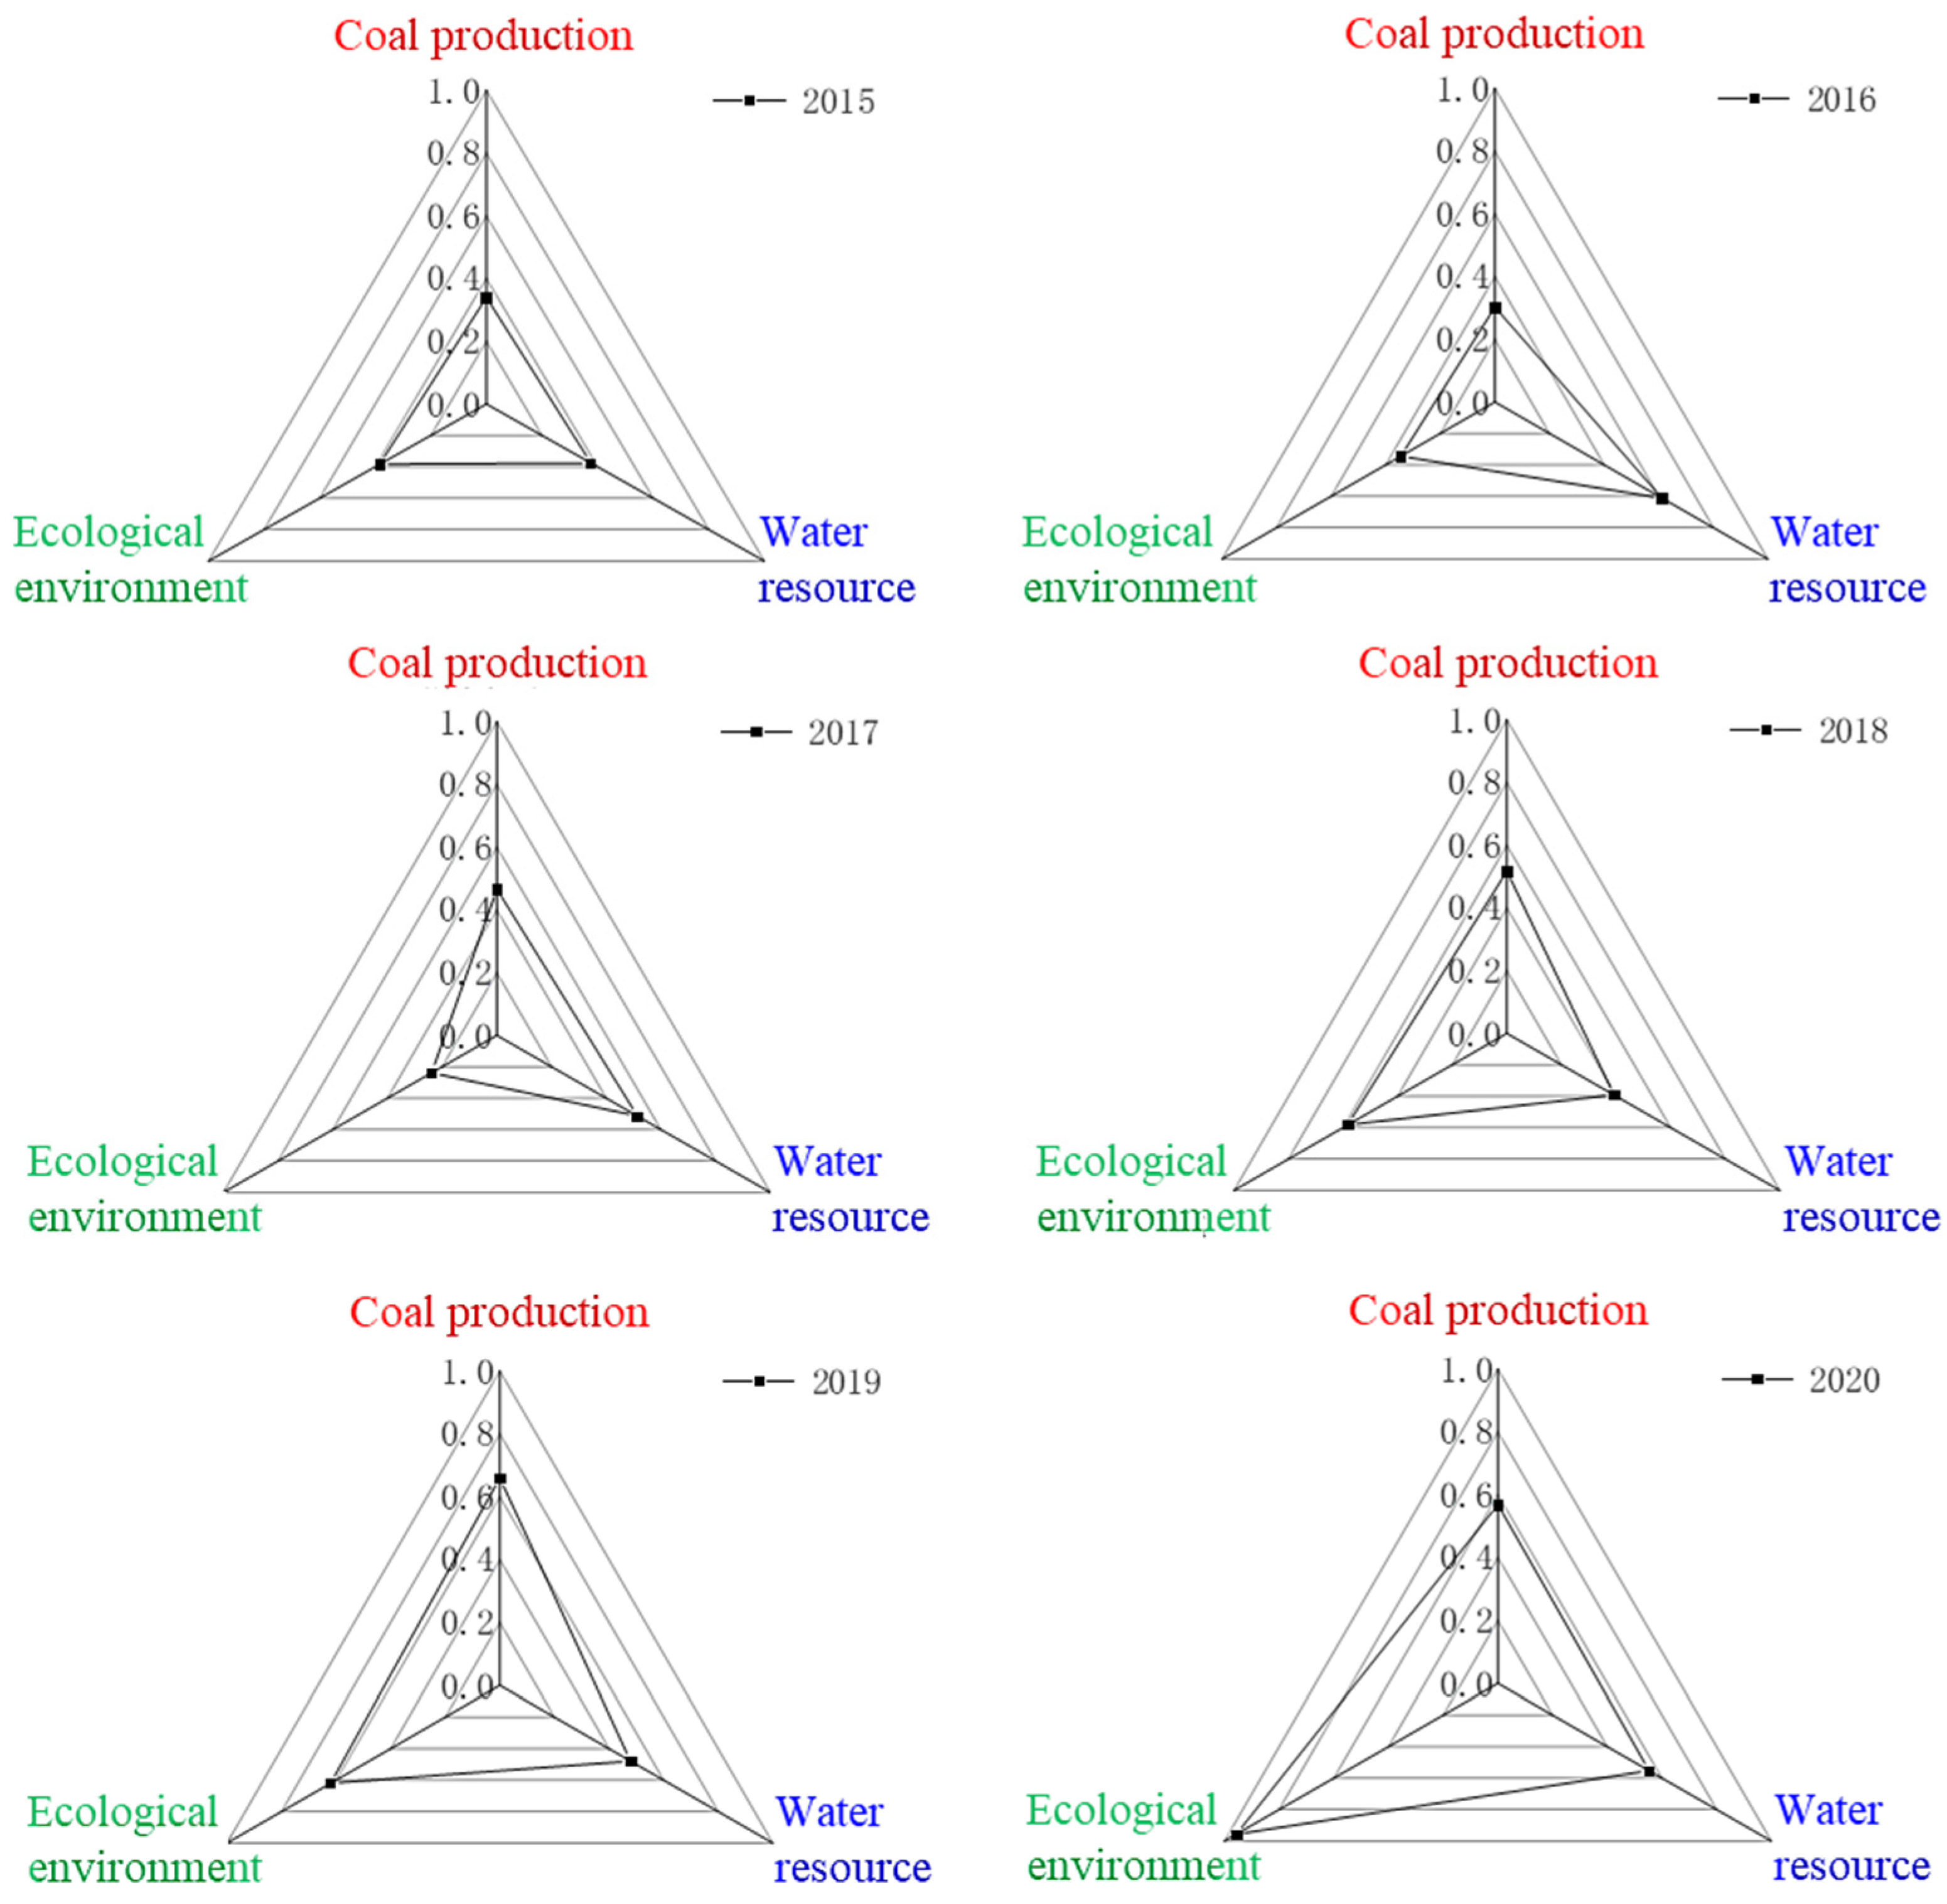
The proximity degree of the criterion layer is calculated according to the proximity degree of the factor layer. The calculation results are shown in Figure 9. It can be seen that the development levels of the CWE system regarding the three dimensions of the criterion layer in 2015 are similar, all of which are around 0.4. The development level of water resources increased in 2016 and 2017. In 2018, all three dimensions were improved, among which the development level of the ecological environment was the best. In 2019, the development levels of coal production and the ecological environment were higher than that of water resources. In 2020, the development level of the ecological environment increased to 0.96, and the development levels of coal production and water resources also increased to around 0.6. The area surrounded by the three dimensions in Figure 7 increased year by year. On the whole, the development level of CWE in the study area showed an obvious improvement trend.
(1)
Coal production
The proximity degree of the coal production dimension is 0.30~0.66. With the exception of slight decreases in 2016 and 2020, the values in all years increased from the previous year. This shows that the mining and economic value of coal are gradually improving. After 2017, the coal production capacity declined and stabilized, and the water consumption and operating costs fluctuated, resulting in a low proximity degree between coal production and the ideal solution and a short downward trend. Therefore, it is necessary to appropriate improve coal production, reduce the consumption of resources, develop the coal economy, and ensure that it is in a stable state.
(2)
Water resources
The proximity degree of water resources is 0.38~0.61. It appears as a change consisting of first increasing, then decreasing, and then increasing. The water resource utilization rate is 56~65%, and the fluctuation is consistent with its proximity degree. Therefore, improving the water resource utilization rate is a feasible way to realize the good development of water resources.
(3)
Ecological environment
The proximity degree of the ecological environment dimension decreased briefly from 2015 to 2017 and then increased rapidly and significantly, increasing to 0.96 in 2020. This shows that the ecological environment in the study area has been improved rapidly in recent years. In 2016, the excavation area, green area, and FVC were the worst. The vegetation destruction area and land reclamation rate were the worst in 2017. As a result, the level of development in the past two years has decreased slightly, and, since then, all indicators have improved. Therefore, ecological protection should be paid attention to as OPM destroys the ecology. In recent years, the concept of ecological environmental protection in the mining area has been gradually implemented, reclamation work has been promoted in an orderly manner, and the ecological environment of the mining area has developed well.
The proximity degree of the target layer is calculated according to the proximity degree of the criterion layer. The calculation results are shown in Figure 10. It shows that the proximity degree of the CWE system in the study area ranges from 0.36 to 0.65, and it shows an increasing trend year by year. The coordinated development level of the CWE system in the study area is improving year by year. Although the current level of development is relatively low, as long as the growth trend is maintained, a high level of CWE development will be achieved in the future.

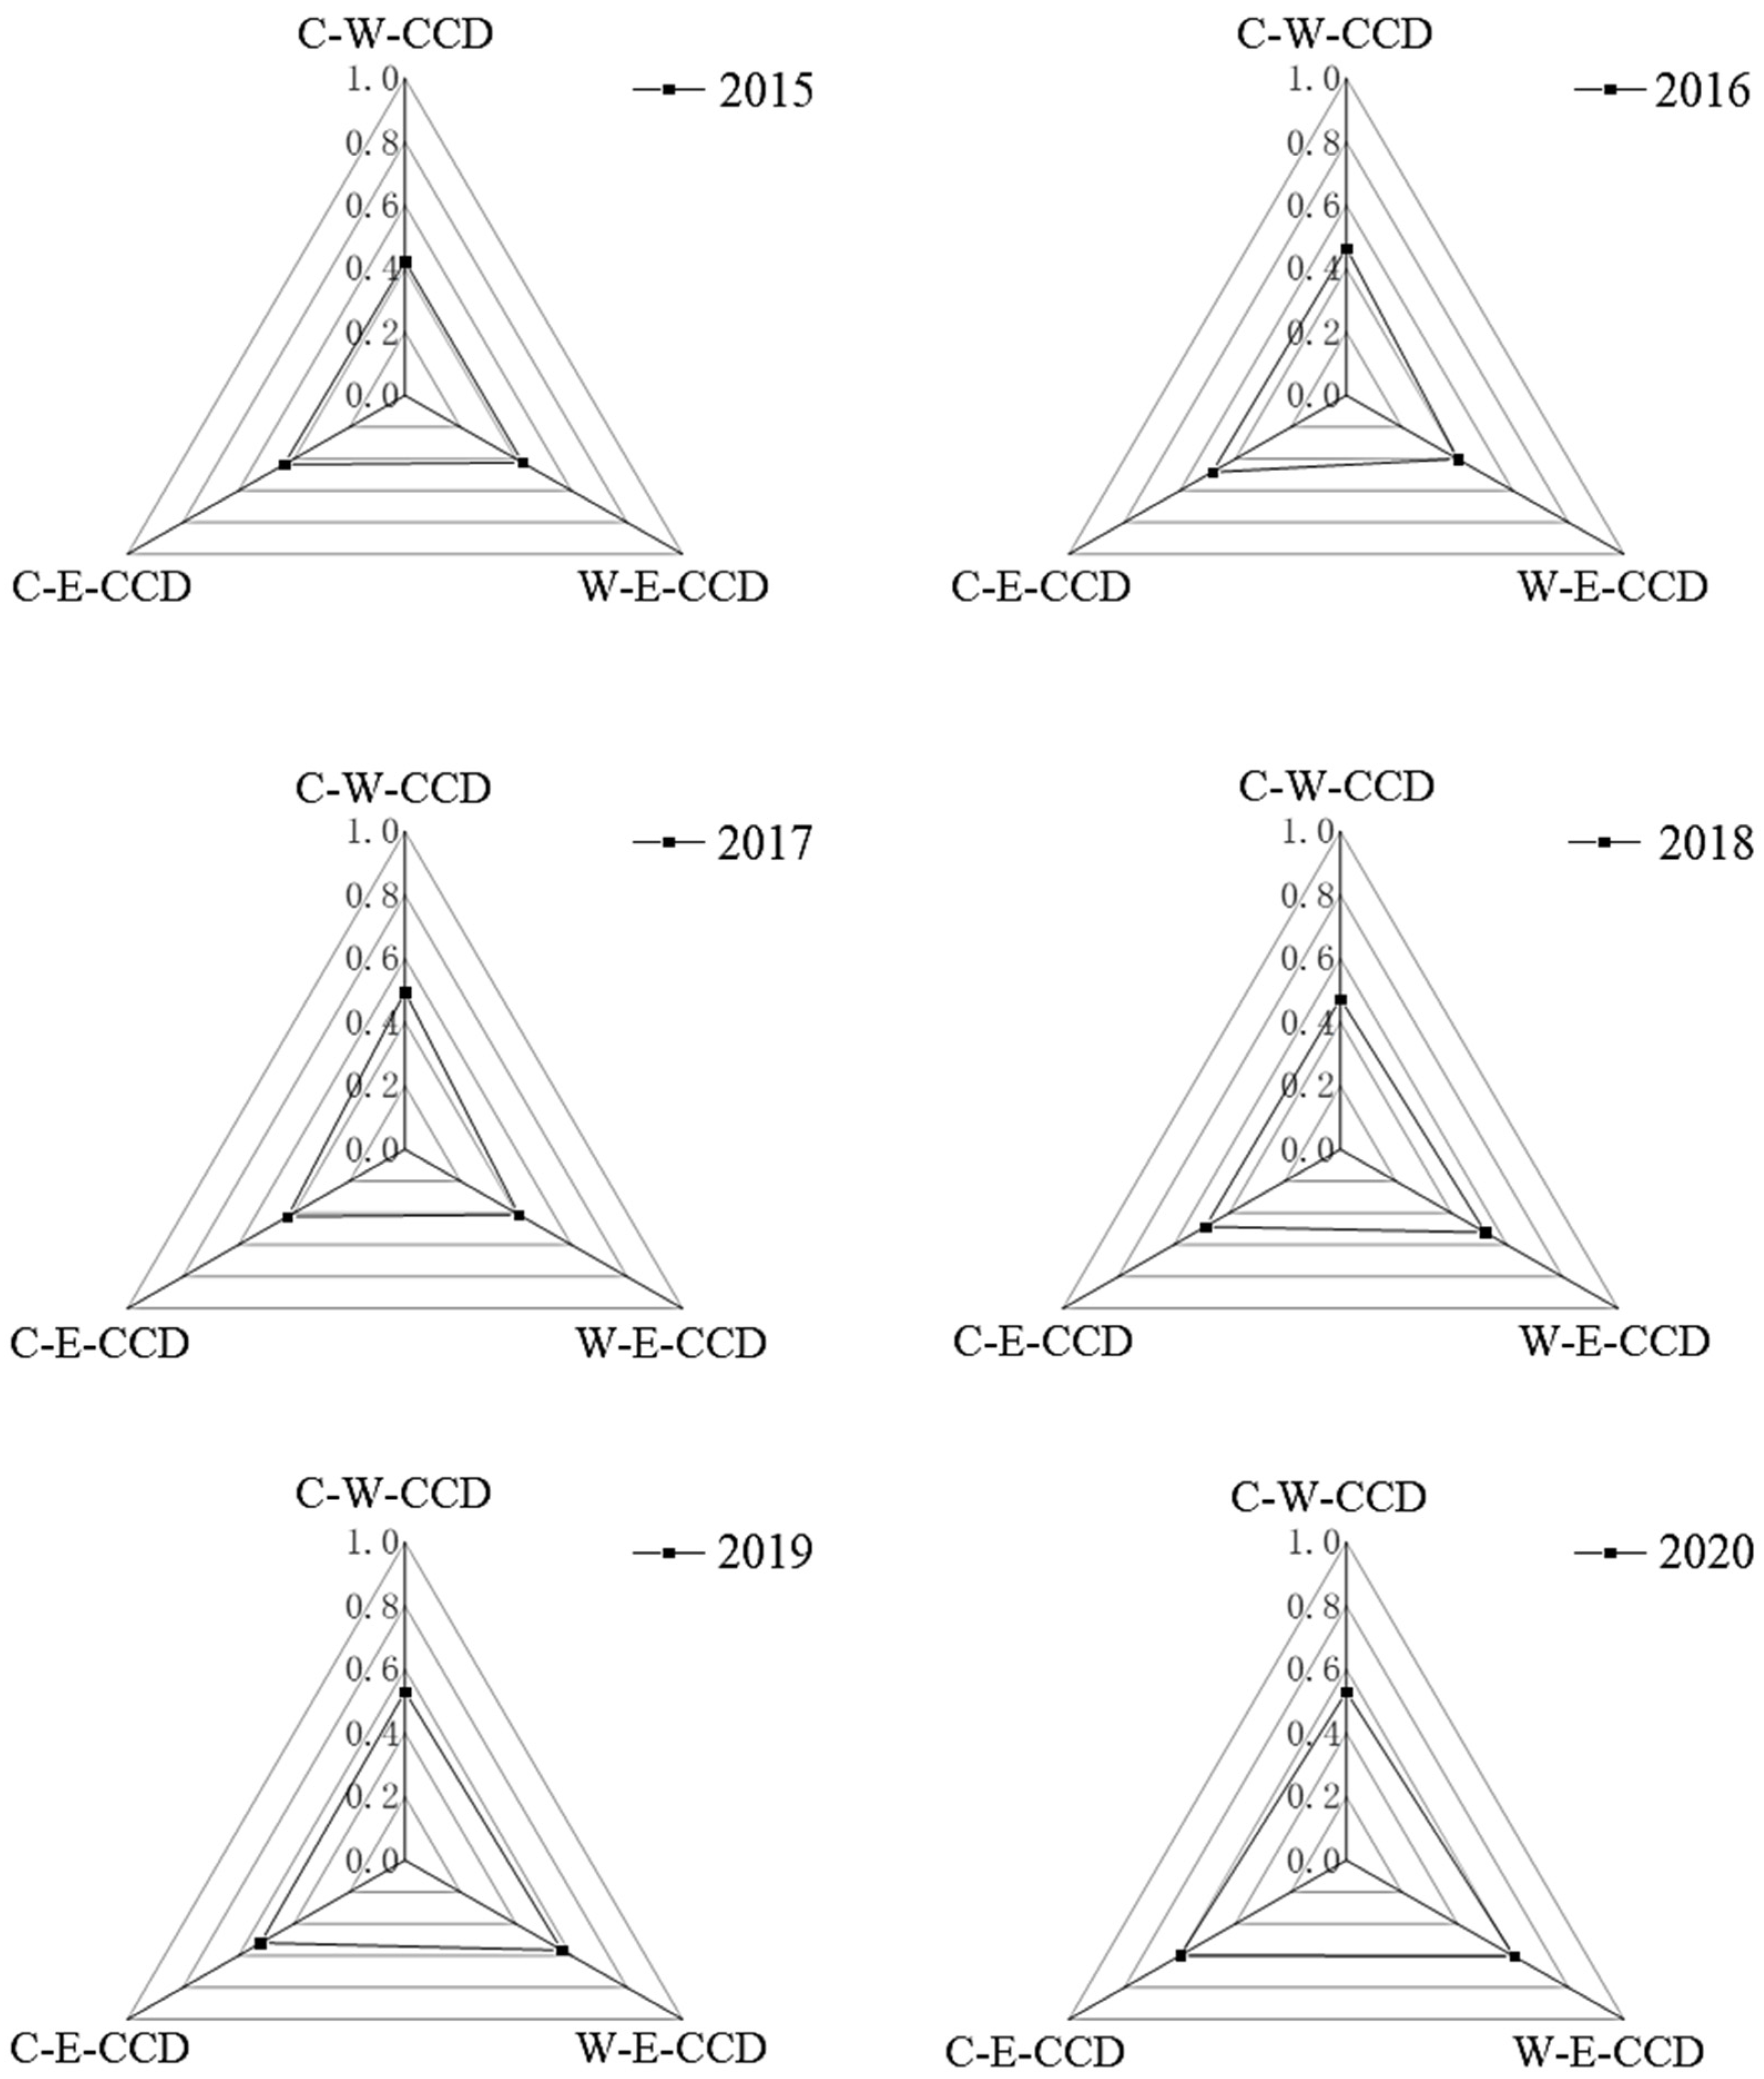
4.4.2. Two-Dimensional Coupling Degree Analysis

The coupling degree between each dimension in the CWE system was calculated using the coordination coupling degree formula, and the results are shown in Figure 11. The radar maps from 2015 to 2020 are all approximately equilateral triangles. This shows that the coupling coordination degree of each dimension in the same year is roughly the same. The area enclosed by the triangle increases year by year, indicating that the coupling coordination degree of any two dimensions in the CWE system in the study area is gradually increasing. The coal–water coupling coordination degree is 0.42~0.53. The coordination level indicates little coordination. Affected by the proximity degree, the coupling coordination degree showed an increasing trend year by year, except for a slight decrease in 2018. The water–ecological coupling coordination degree is 0.40~0.61. The coordination level indicates little coordination, and the coordination degree increases year by year. The coal–ecology coupling coordination degree is 0.42~0.60. The coordination level indicates little coordination, and the coordination degree is improving year by year.

4.4.3. Three-Dimensional Coupling Coordination Degree Analysis

The calculation results regarding the coupling coordination degree of the CWE system in the study area are shown in Figure 12. It can be seen that the coupling coordination degree of CWE in the study area is 0.35~0.47. Affected by the unbalanced development of various dimensions and mutual constraints, the average value is 0.4, which indicates minor coordination. The proximity degrees of the three dimensions increase or decrease inconsistently in different years, resulting in a disordered state. It was in a state of mild disorder until 2017. From 2018 to 2020, the coupling coordination degree gradually increased year by year, and the coordination degree gradually improved. By comparing the three-dimensional coupling coordination degree with the two-dimensional coupling coordination degree, it is found that the coupling coordination degree between the three is always lower than the coordination degree between each pair of dimensions.
In recent years, the coal production in the study area has decreased, and the amount of wastewater discharged has also decreased. Frequent problems occurred in the Anjialing terminal sewage treatment station after November 2015, and the amount of coal sludge accumulated in the regulating pond was large, which necessitated frequent dewatering, leading to problems in water treatment. In addition, although the consumption of water resources in the mining area has decreased, the sewage treatment water cannot be fully utilized, and there is a large amount of surplus recycled water. The dependence on yellow water and groundwater is high; although this situation has been improved year by year, there is still some room for improvement. Recently, the Pingshuo Group Company has formed an ecological restoration demonstration base. The vegetation coverage of the reclamation area has reached more than 95%, and the intensity of ecological restoration has increased. In 2020, the land reclamation rate of the mining area reached 66%, and the land vegetation damage caused by open-pit mining was well repaired. The development of the three factors of coal, water, and ecology in the mining area is not consistent.

4.5. Policy Implications

Regarding the three dimensions of coal production, water resources, and the ecological environment, regardless of whether the binary system or the ternary system is considered, their coupling and coordinated development are improving year by year, but the coupling level needs to be improved due to the low internal order of the three systems. In the future, it is necessary to promote the concept of CWE coordinated development in OPCUM areas, improve the level of coal development, improve the water resource management mode, and pay attention to ecological protection to promote the high-quality development of mining areas. While ensuring the economic benefits of coal mining, coal enterprises should focus on improving the water resource utilization rate. The reduction in the green land area should be emphasized in open-pit mining.

5. Conclusions

In this paper, a coal–water–ecology (CWE) index system is firstly constructed based on an analysis of the current situation regarding coal mining, water resource utilization, and the ecological environment in an OPCUM area. Three methods are used to determine the weights of each index in the system. Then, the TOPSIS model and coupling coordination degree model are adopted to construct the coordinated development model of CWE. Finally, the coordinated development status of CWE in the mine area is analyzed, and the next improvement measures are pointed out. The main conclusions are as follows.
(1)
Coal production and consumption, the coal economy, the water resource quantity, water resource pollution, ecological destruction, and ecological protection are considered as a whole to establish a CWE index system. The index system includes 21 indices from six aspects and three dimensions. The target layer is the coordinated development of coal, water, and ecology. The criterion layer has three dimensions of coal production, water resources, and the ecological environment.
(2)
The average FVC ratio of the study area from 2015 to 2020 was 0.50, 0.46, 0.49, 0.50, 0.52, and 0.52, respectively, showing a slight increase. Among the different land use types, the green area is the largest and the water area is the smallest. The size of the reclamation area increased by 6.39 km2 in six years. The changes in land use types consist mainly of the conversion of waste dumps and stripping areas into reclamation areas. The reclamation and greening of the waste dump have been implemented, and the green area has increased year by year.
(3)
Using game theory to merge subjective and objective weights, it is shown that fusion weights can combine the advantages of subjective and objective weights and express the information of two single weights at the same time, which makes the results of the fusion weights more reliable. The variation coefficient of combined weights is always smaller than that of single weights, which greatly reduces the dispersion of single weights and makes the weight coefficients more concentrated. Therefore, the results of the fusion weights are more reliable.
(4)
The TOPSIS model and coupling coordination degree model can successfully characterize the coordinated development of CWE system factors. The development level of coal production and consumption in the study area is unstable. The development level of the coal economy basically shows an upward trend. The development level of water resources shows a fluctuating state. The development level of water pollution is improving year by year. The ecological environment is gradually improving. On the whole, the development level of the CWE system in the study area shows an obvious improvement trend.
(5)
The proximity degrees of the CWE system in the study area from 2015 to 2020 are 0.36, 0.42, 0.41, 0.49, 0.59, and 0.65, respectively, showing an increasing trend year by year, and the development level of the system is improving year by year. The coupling degree of CWE coordination is 0.35, 0.37, 0.36, 0.40, 0.44, and 0.47, respectively, with an average value of 0.4, which indicates little coordination. The degree of coupling coordination increases slowly year by year, and the degree of coordination is being gradually improved, but there is still some room for improvement.
(6)
The economic benefit, water resource utilization rate, and green land area are the three indices with the greatest weight. While ensuring the economic benefits of coal mining, coal enterprises should focus on improving the water resource utilization rate. The reduction in the green land area should be emphasized in open-pit mining.
In this paper, the coupling coordination degree of coal–water–ecology is analyzed based on the past data of a mining area. The accuracy of the model is proven by comparing it with the actual situation. We can first predict the future changes in 21 indicators in the index layer and then predict the future coal–water–ecological coupling coordination degree of the mining area according to the model proposed in this paper. It should be pointed out that the weights of each index considered in this paper were fixed, but various states may occur in the actual operations of coal enterprises, resulting in changes in the weights of each index. Therefore, the question of how to accurately determine the dynamic changes in weights and the degree of influence on the coordination degree of coal–water–ecological coupling should be considered in the future.

Author Contributions

Conceptualization, Y.D. and X.L.; methodology, Y.D. and X.X.; software, T.C.; validation, L.G.; resources, Y.D. and X.X.; writing—original draft preparation, Y.D. and L.G.; writing—review and editing, X.L. and X.X.; supervision, T.C. All authors have read and agreed to the published version of the manuscript.

Funding

This research was funded by the Shanxi Basic Research Program Project (202203021211127), the Shanxi Scholarship Council of China (2023-045), the Fund Program for the Scientific Activities of Selected Returned Overseas Professionals in Shanxi Province (20230062), and the Engineering Research Center of Geothermal Resource Development Technology and Equipment, Ministry of Education, Jilin University (23015).

Data Availability Statement

Some or all of the data and the models generated or used during the study are available from the corresponding author by request.

Conflicts of Interest

The authors declare no conflicts of interest.

References

  1. Tolovkhan, B.; Smagulova, A.; Khuangan, N.; Asainov, S.; Issagulov, S.; Kaumetova, D.; Khussan, B.; Sandibekov, M. Studying rock mass jointing to provide bench stability while Northern Katpar deposit developing in Kazakhstan. Min. Miner. Depos. 2023, 17, 99–111. [Google Scholar] [CrossRef]
  2. Bascetin, A.; Tuylu, S.; Adıguzel, D. New Technologies in Mining Sustainable Production. Tailings Management and Mining Chemicals. Eng. J. Satbayev Univ. 2022, 144, 41–50. [Google Scholar] [CrossRef]
  3. Guo, L.; Xie, X.; Zeng, J.; An, N.; Wang, Z.; Gao, L.; Wang, Y.; Yang, J. Optimization Model of Water Resources Allocation in Coal Mine Area Based on Ecological Environment Priority. Water 2023, 15, 1205. [Google Scholar] [CrossRef]
  4. Yang, J.Y.; Guo, L.L. Dynamic evaluation of water utilization efficiency in large coal mining area based on life cycle sustainability assessment theory. Geofluids 2021, 4, 7793988. [Google Scholar] [CrossRef]
  5. Allan, R. Introduction: Sustainable mining in the future. J. Geochem. Explor. 1995, 52, 1–4. [Google Scholar] [CrossRef]
  6. Suwala, W. Modelling adaptation of the coal industry to sustainability conditions. Energy 2008, 33, 1015–1026. [Google Scholar] [CrossRef]
  7. Chen, J.; Jiskani, I.M.; Jinliang, C.; Yan, H. Evaluation and future framework of green mine construction in China based on the DPSIR model. Sustain. Environ. Res. 2020, 30, 1–10. [Google Scholar] [CrossRef]
  8. Mathys, N. Runoff and erosion in the Black Marls of the French Alps: Observations and measurements at the plot scale. Catena 2005, 63, 261–281. [Google Scholar] [CrossRef]
  9. Zhang, N.; Wang, D.X.; Li, L.; Jiang, H. Two-way coordinated evaluation of mine water supply and demand in coal base-Empirical Research Based on TOPSIS Method. J. Phys. Conf. Ser. 2019, 1176, 937–943. [Google Scholar] [CrossRef]
  10. Wu, Q.; Wang, Z.Q.; Guo, Z.K. A research on an optimized five-in-one combination of mine water control, treatment, utilization, back-filling and environment friendly treatment. Energy Sav. Environ. Prot. 2010, 2, 109–112. [Google Scholar]
  11. Zhong, J. Research on Construction and Evaluation of Ecological Utilization System of Mine Water. Master’s Thesis, Shandong University of Science and Technology, Shandong, China, 2012. [Google Scholar]
  12. Deng, W.J. Research on Optimal Allocation of Water Resources in Hongshaquan Open-Pit Coal Mine. Master’s Thesis, Anhui University of Science and Technology, Huainan, China, 2012. [Google Scholar]
  13. Duan, S.J. Study on the Dynamic Optimal Allocation Mode of Water Resources for the Coordinated Development of Coal and Water in the Open Pit Combined Mining Area. Master’s Thesis, Taiyuan University of Technology, Taiyuan, China, 2020. [Google Scholar]
  14. Fang, S.Y. Research on Optimal Allocation and Carrying Capacity of Water Resources of Coal Base in Shanxi Province. Master’s Thesis, Zhengzhou University, Zhengzhou, China, 2016. [Google Scholar]
  15. Bai, X. Research on Water Resources Planning in Fengfeng Mining Area Based on Ecological Concept. Master’s Thesis, Hebei University of Engineering, Handan, China, 2019. [Google Scholar]
  16. Zhang, Y.B. Research on optimal allocation of water resources in Benxi Sishanling Iron Mine. Master’s Thesis, Shenyang Jianzhu University, Shenyang, China, 2016. [Google Scholar]
  17. Masood, N.; Hudson-Edwards, K.; Farooqi, A. True cost of coal: Coal mining industry and its associated environmental impacts on water resource development. J. Sustain. Min. 2020, 19, 1. [Google Scholar] [CrossRef]
  18. Zeng, Q.; Li, G.S.; Dong, J.X.; Pu, Y. Typical ecological environment problems and countermeasures of coal resource exploitation in Xinjiang. Min. Saf. Environ. Prot. 2017, 44, 106–110. [Google Scholar]
  19. Hu, X.L.; Wang, X.L.; Liu, S.H.; Liu, G.B. Soil heavy metal pollution characteristics and ecological risk assessment at risk points in Yili Mining area. Min. Saf. Environ. Prot. 2018, 45, 69–73. [Google Scholar]
  20. Li, L.; Lei, Y.L.; Pan, D.Y. Economic and environmental evaluation of coal production in China and policy implications. Nat. Hazards 2015, 77, 1125–1141. [Google Scholar] [CrossRef]
  21. Sun, Q. Study on Evolution Process and Prevention and Control Mechanism of Ecological Risk in Coal Mine Area. Ph.D. Thesis, China University of Geosciences (Beijing), Beijing, China, 2017. [Google Scholar]
  22. Cui, L. Land Reclamation System Analysis and Evaluation Method of Opencast Coal Mine. Ph.D. Thesis, University of Science and Technology Beijing, Beijing, China, 2018. [Google Scholar]
  23. Singh, P.K.; Panigrahy, B.P.; Verma, P.; Kumar, B. Evaluation of the surface water quality index of Jharia coal mining region and its management of surface water resources. Environ. Pollut. Sel. Proc. ICWEES 2018, 77, 429–437. [Google Scholar]
  24. Wright, I.A.; Belmer, N.; Davies, P.J. Coal mine water pollution and ecological impairment of one of Australia’s most ‘protected’high conservation-value rivers. Water Air Soil Pollut. 2017, 228, 90. [Google Scholar] [CrossRef]
  25. Bazaluk, O.; Sadovenko, I.; Zahrytsenko, A.; Saik, P.; Lozynskyi, V.; Dychkovskyi, R. Forecasting underground water dynamics within the technogenic environment of a mine field: Case study. Sustainability 2021, 13, 7161. [Google Scholar] [CrossRef]
  26. Dimitrijevic, B.; Vujic, S.; Matic, I.; Majianac, S.; Praštalo, J.; Radosavljevic, M.; Čolakovic, V. Multi-criterion analysis of land reclamation methods at Klenovnik open pit mine, Kostolac coal basin. J. Min. Sci. 2014, 50, 319–325. [Google Scholar] [CrossRef]
  27. Zha, D.P.; Shen, Z.; Liu, Z.G.; Liao, B.; Wang, W. Ecological environment change in Dexing Copper mining area based on TM image. Remote Sens. Land Resour. 2015, 27, 109–114. [Google Scholar]
  28. Xu, J.; Zhao, H.; Yin, P.; Wu, L.; Li, G. Landscape ecological quality assessment and its dynamic change in coal mining area: A case study of Peixian. Environ. Earth Sci. 2019, 78, 708. [Google Scholar] [CrossRef]
  29. Liu, H.; Jiang, Y.; Xia, M.Y.; Gao, J.H.; Jiang, Y. Ecological environment change in mining area based on 30 years remote sensing monitoring: A case study of Nansihu mining area. Met. Mines 2021, 1, 197–206. [Google Scholar]
  30. Yu, S.; Wang, F.H.; Yang, A.M. Remote sensing monitoring of land use change in Pingshuo open pit Coal Mine. Bull. Surv. Mapp. 2015, 43, 86–90. [Google Scholar]
  31. Xu, Z.W.; Wang, S.Y. Recognition and detection of water environment state in mining area based on remote sensing image: A case study of some reaches of the Pearl River Basin. Min. Saf. Environ. Prot. 2021, 48, 107–111. [Google Scholar]
  32. Li, Q.; Zhan, C.; Zhang, J.S.; Deng, H.; Jia, Z. Evaluation of ecological environment quality change in Ganfu plains irrigation area based on remote sensing ecological index. Resour. Environ. Yangtze Basin 2024, 33, 1340–1353. [Google Scholar]
  33. Zhang, Y.; Zhou, W. Study on inverse estimation of vegetation coverage of reclamation land in Antaibao open-pit mining area. J. Cent. South Univ. For. Technol. 2016, 36, 113–119. [Google Scholar]
  34. Zhang, H.B.; Zhang, K.; Liu, P.; Yu, Z.Y.; Zhao, J.W. Extraction of ecological index and safety evaluation of mining area based on RS and GIS: A case study of Jiaozuo Mining Area. Coal Sci. Technol. 2019, 48, 80–88. [Google Scholar]
  35. Wu, W.; Zhou, J.; Niu, J.; Lv, H. Study on coupling between mineral resources exploitation and the mining ecological environment in Shanxi Province. Environ. Dev. Sustain. 2021, 23, 13261–13283. [Google Scholar] [CrossRef]
  36. Kang, M.; Stam, A. Pahap: A pairwise aggregated hierarchical analysis of Ratio-Scale preferences. Decis. Sci. 1994, 25, 607–624. [Google Scholar] [CrossRef]
  37. Lawrence, D.P. Cumulative impact assessment at the Project Level. Environ. Impact Assess. Rev. 1994, 12, 254–259. [Google Scholar]
  38. Griffiths, H. Cumulative Effects Assessment Prepared for Alberta Environmental Protection by Macleod Institute for Environmental Analysis; Government of Alberta: Calgary, Canada, 1998; p. 69. [Google Scholar]
  39. Sun, D. Research on evaluation of cooperation degree of Coal mine production system and improvement of key subsystems. Master’s Thesis, Shandong University of Science and Technology, Qingdao, China, 2017. [Google Scholar]
  40. Wang, H.; Ding, Z.Y.; Jia, F.F.; Mao, M.Q. Study on the coupling relationship between coordinated utilization of coal resources and land resources in Coal Mine Area: A case study of Zhangshuanglou Mine in Peibei Coal mine Area. China Min. Ind. 2016, 25, 93–98. [Google Scholar]
  41. Liu, C. Research on Coordinated Utilization of Land and Water Resources in Mountainous Areas Under Coal Pressure in Villages. Master’s Thesis, China University of Geosciences (Beijing), Beijing, China, 2017. [Google Scholar]
  42. Yan, J. Study on Coordination and Optimal Allocation of Coal-Ground Water Utilization in Kunda Mining Area, Jincheng City. Master’s Thesis, China University of Geosciences (Beijing), Beijing, China, 2018. [Google Scholar]
  43. Mufazzal, S.; Khan, N.Z.; Muzakkir, S.M.; Siddiquee, A.N.; Khan, Z.A. A new fuzzy multi-criteria decision-making method based on proximity index value. J. Ind. Prod. Eng. 2022, 39, 42–58. [Google Scholar] [CrossRef]
  44. Hapishko, D.; Sidenko, I.; Kondratenko, G.; Zhukov, Y.; Kondratenko, Y. Modification of Fuzzy TOPSIS Based on Various Proximity Coefficients Metrics and Shapes of Fuzzy Sets. In Proceedings of the International Conference on Information and Communication Technologies in Education, Research, and Industrial Applications, Ivano-Frankivsk, Ukraine, 18–22 September 2023; pp. 98–113. [Google Scholar]
  45. Bingol, S. Selection of Semiconductor Packaging Materials by Combined Fuzzy AHP-Entropy and Proximity Index Value Method. Math. Probl. Eng. 2022, 1, 7901861. [Google Scholar] [CrossRef]
  46. Wu, W. Research on Coupling Relationship Between Coal Mining and Ecological Protection. Master’s Thesis, Shanxi University, Taiyuan, China, 2016. [Google Scholar]
  47. Zhang, K.Y. Research on Key Factors and Analysis and Control of Coordination Between Coal Development Scale and Water and Soil Resources Protection. Master’s Thesis, Shanxi Agricultural University, Taiyuan, China, 2019. [Google Scholar]
  48. Li, C.M. Study on Health Evaluation and Synergistic Relationship Between Coal Resource Exploitation System and Water Resource Ecosystem. Ph.D. Thesis, China University of Mining and Technology, Beijing, China, 2018. [Google Scholar]
  49. Sun, Y.; Jiang, J.; Yang, F.; Chen, X.; Yu, Z.; Guo, Q.; Zhao, Y. Spatial–temporal variation analysis of water storage and its impacts on ecology and environment in high-intensity coal mining areas. Land Degrad. Dev. 2023, 34, 338–352. [Google Scholar] [CrossRef]
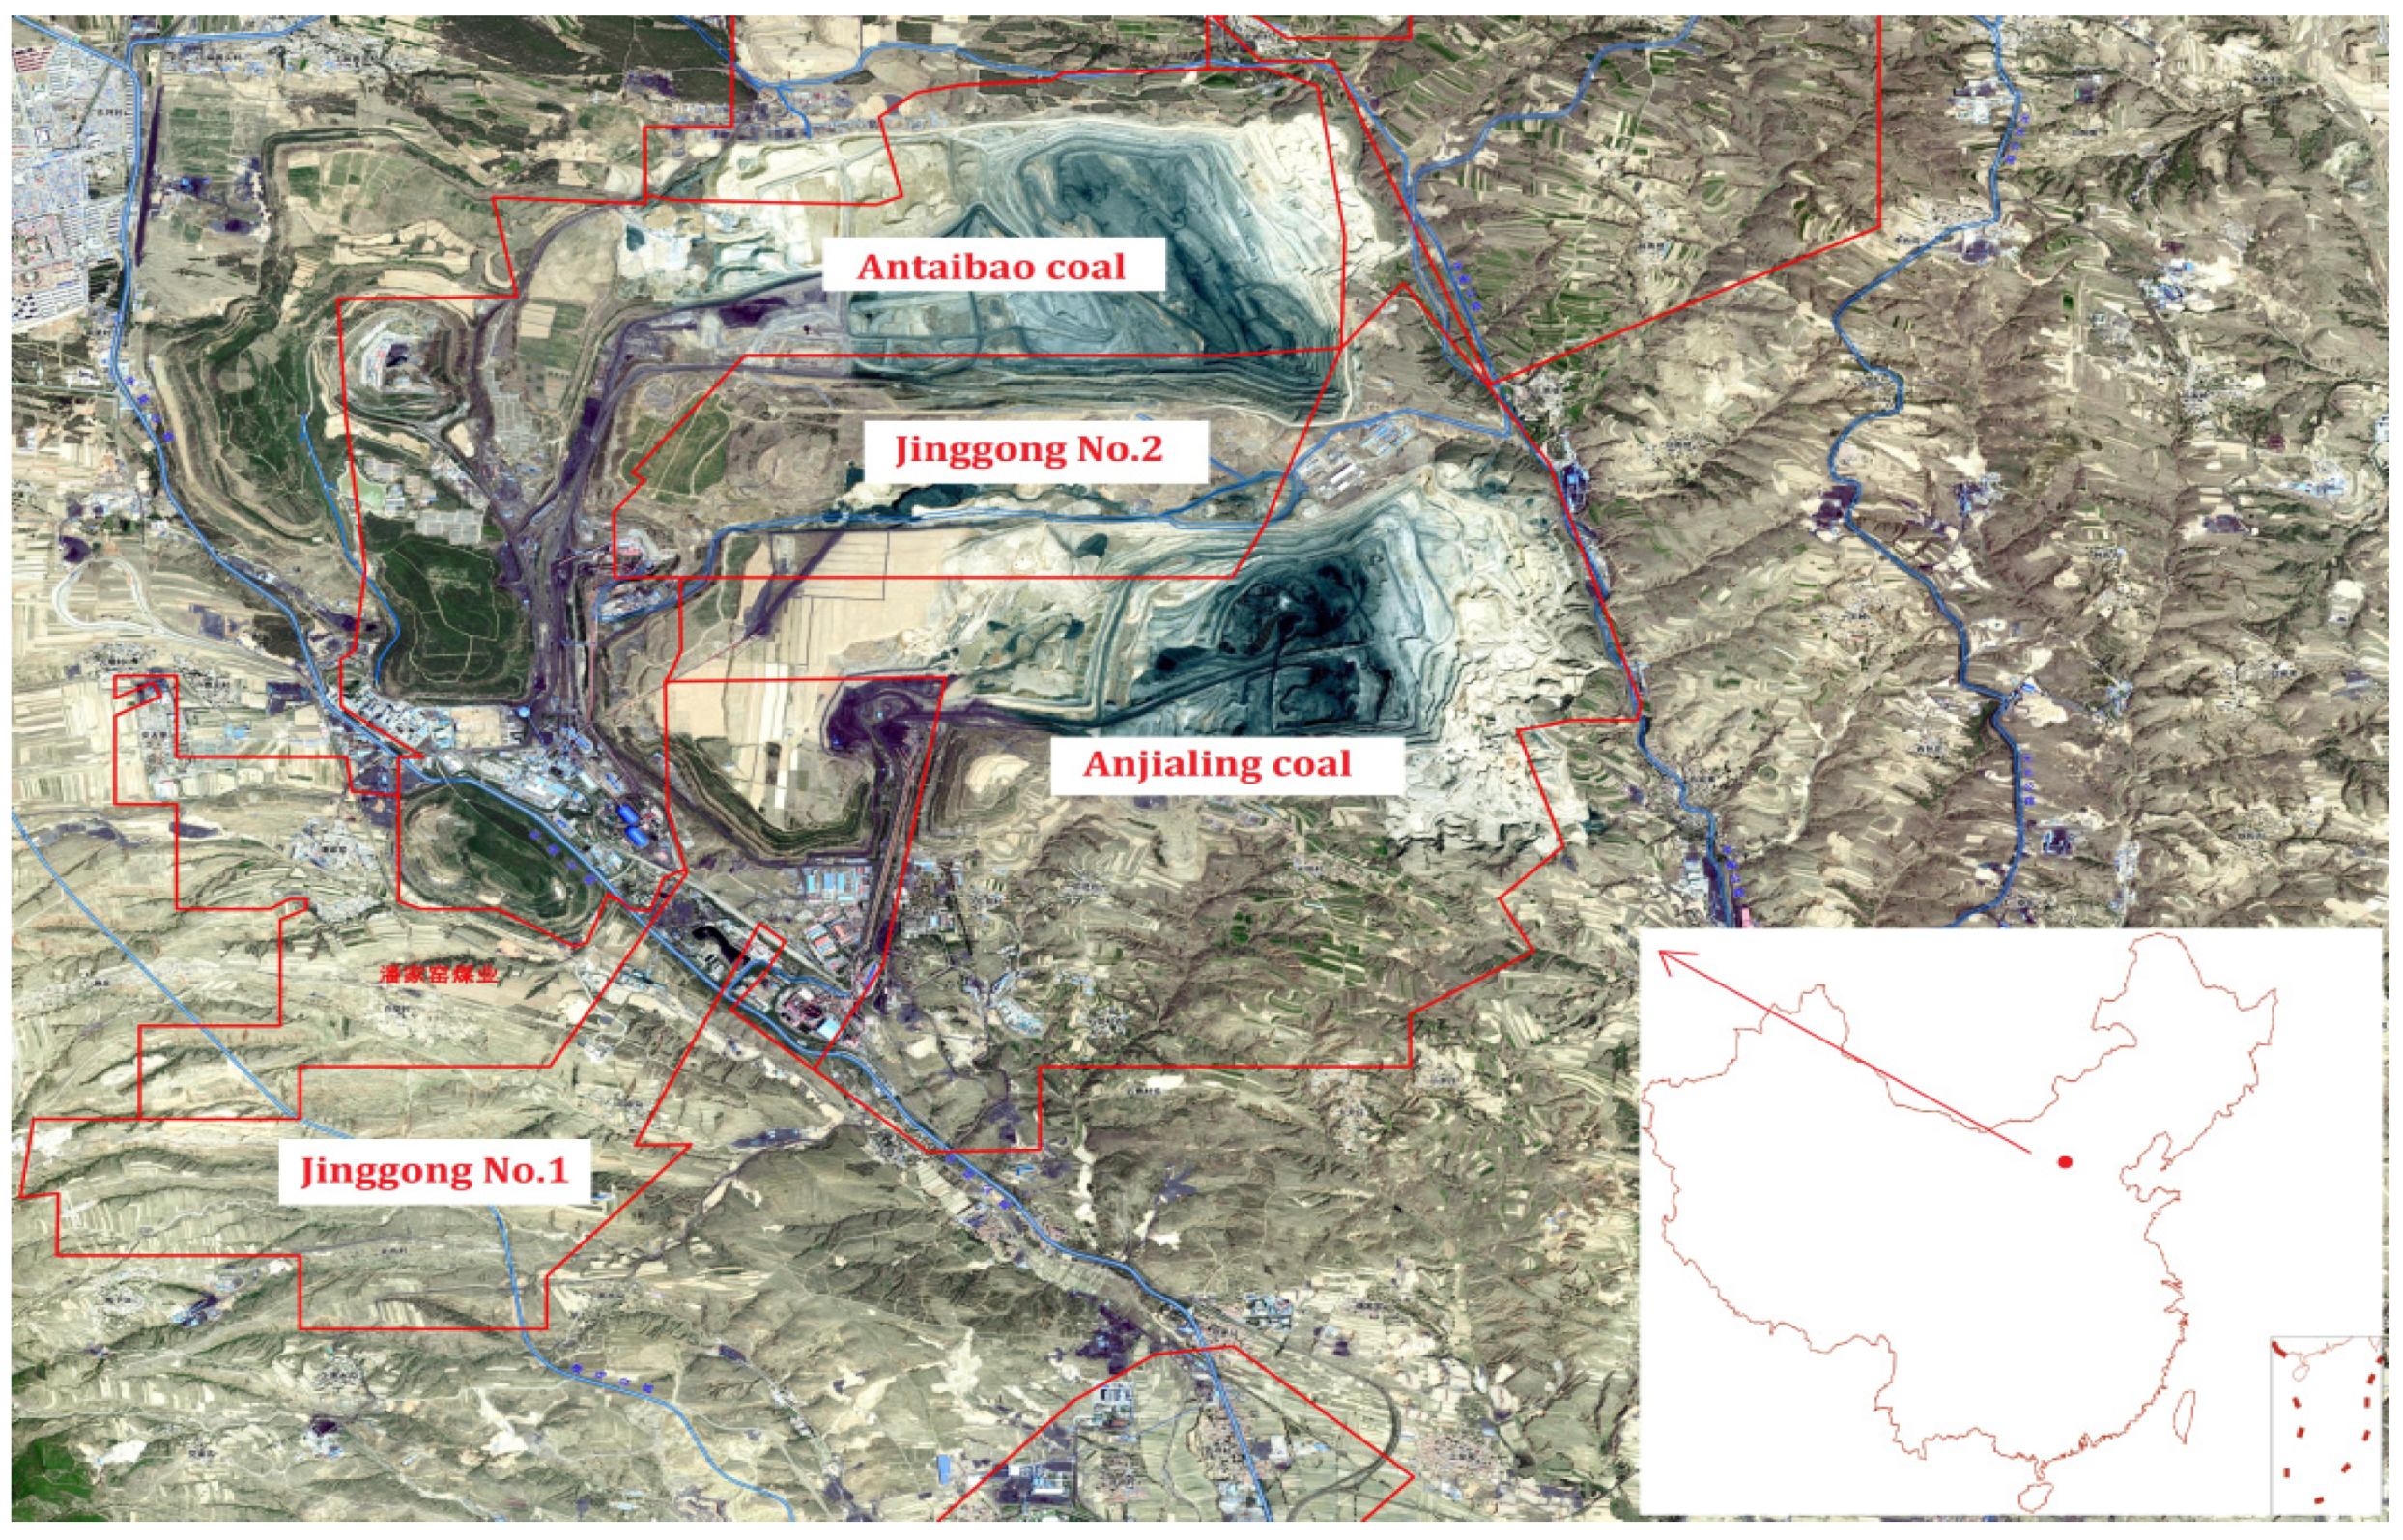
Figure 1. Coal mine distribution map of study area.
Water 17 00759 g001
Figure 2. Research technology roadmap.
Water 17 00759 g002
Figure 3. Schematic of CWE coupling mechanism.
Water 17 00759 g003
Figure 4. Schematic of CWE coordinated development index system.
Water 17 00759 g004
Figure 5. Vegetation coverage in the study area from 2015 to 2020.
Water 17 00759 g005
Figure 6. Change in land use type in the study area from 2015 to 2020.
Water 17 00759 g006
Figure 7. Comparison of three weights (arranged clockwise).
Water 17 00759 g007
Figure 8. Comparison of variation coefficients of different weighting methods.
Water 17 00759 g008
Figure 9. The development levels of each dimension of CWE from 2015 to 2020.
Water 17 00759 g009
Figure 10. The development level of CWE from 2015 to 2020.
Water 17 00759 g010
Figure 11. The two-dimensional coupling coordination degrees from 2015 to 2020. C-W-CCD denotes the coal production (C)–water resource (W) coupling coordination degree (CCD). C-E-CCD denotes the coal production (C)–ecological environment (E) coupling coordination degree (CCD).
Water 17 00759 g011
Figure 12. Three-dimensional coupling coordination degree from 2015 to 2020.
Water 17 00759 g012
Table 1. The 1–9 scale method.
ScaleComparison of Factors i and j
From scales 1, 2, 3 to scale 9Factor i becomes more important than factor j
From scales 1, 1/2, 1/3 to scale 1/9Factor j becomes more important than factor i
Table 2. Query table of RI.
r123456789
RI000.580.901.121.241.321.411.45
Table 3. Coupling coordination degree grading table.
Coupling Coordination DegreeCoordination Level
0–0.19Level 1 (severe disorder)
0.20–0.29Level 2 (moderate disorder)
0.30–0.39Level 3 (mild disorder)
0.40–0.59Level 4 (slight coordination)
0.60–0.69Level 5 (primary coordination)
0.70–0.79Level 6 (little coordination)
0.80–0.89Level 7 (good coordination)
0.90–0.99Level 8 (excellent coordination)
Table 4. Statistics of FVC area and its ratio in the study area from 2015 to 2020.
Coverage OrderFirst OrderSecond OrderThird OrderFourth OrderFifth Order
Value0–0.20.2–0.40.4–0.60.6–0.80.8–1
2015Ratio (%)18.59 18.17 23.67 23.06 16.50
Area (km2)25.56 24.98 32.54 31.71 22.69
2016Ratio (%)25.56 17.04 22.21 19.39 15.80
Area (km2)35.14 23.43 30.54 26.66 21.73
2017Ratio (%)24.21 15.80 17.41 23.64 18.93
Area (km2)33.11 21.62 23.82 32.34 25.90
2018Ratio (%)22.09 16.84 17.88 24.21 18.98
Area (km2)30.37 23.15 24.59 33.29 26.09
2019Ratio (%)21.65 13.82 16.47 26.61 21.45
Area (km2)29.92 19.09 22.76 36.78 29.65
2020Ratio (%)19.83 14.78 18.24 28.58 18.57
Area (km2)27.26 20.32 25.08 39.29 25.54
Table 5. Change in FVC area and its ratio in the study area from 2015 to 2020.
Coverage OrderFirst OrderSecond OrderThird OrderFourth OrderFifth Order
Value0–0.20.2–0.40.4–0.60.6–0.80.8–1
2015 to 2016Ratio change (%)6.96 −1.13 −1.45 −3.68 −0.70
Area change (km2)9.58 −1.55 −2.00 −5.05 −0.96
2016 to 2017Ratio change (%)−1.35 −1.23 −4.80 4.25 3.13
Area change (km2)−2.03 −1.81 −6.72 5.68 4.17
2017 to 2018Ratio change (%)−2.12 1.03 0.47 0.57 0.05
Area change (km2)−2.74 1.53 0.77 0.95 0.19
2018 to 2019Ratio change (%)−0.44 −3.02 −1.41 2.40 2.47
Area change (km2)−0.45 −4.06 −1.83 3.49 3.56
2019 to 2020Ratio change (%)−1.82 0.96 1.77 1.96 −2.88
Area change (km2)−2.66 1.23 2.32 2.51 −4.11
2015 to 2020 Ratio change (%)1.24 −3.39 −5.42 5.51 2.07
Area change (km2)1.70 −4.66 −7.46 7.58 2.85
Table 6. Statistics of land use type area and its ratio in the study area from 2015 to 2020.
Land Use TypeReclamation AreaGrasslandForest LandOther LandWater AreaExcavation AreaStripping AreaDumping Site
2015Ratio (%)10.94 5.45 52.86 12.52 0.02 2.75 7.97 7.49
Area (km2)15.04 7.49 72.68 17.21 0.03 3.78 10.96 10.29
2016Ratio (%)9.02 5.34 49.77 22.74 0.02 3.29 4.68 5.14
Area (km2)12.41 7.35 68.43 31.26 0.03 4.52 6.43 7.06
2017Ratio (%)11.93 4.31 43.12 16.96 0.01 2.66 7.64 13.37
Area (km2)16.32 5.90 58.98 23.20 0.02 3.64 10.45 18.28
2018Ratio (%)11.24 7.81 34.18 32.82 0.02 2.21 5.65 6.07
Area (km2)15.45 10.74 46.99 45.13 0.03 3.04 7.76 8.35
2019Ratio (%)3.27 15.52 38.46 27.94 0.03 2.03 9.95 2.80
Area (km2)4.52 21.45 53.15 38.61 0.04 2.80 13.76 3.88
2020Ratio (%)15.59 11.52 35.06 24.03 0.03 1.76 9.18 2.84
Area (km2)21.43 15.84 48.20 33.04 0.04 2.41 12.62 3.90
Table 7. Change amplitudes of different land use types in the study area from 2015 to 2020.
Change Amplitude (km2)Reclamation AreaExcavation AreaStripping AreaDumping Site
2015 to 2016−2.63 0.74 −4.53 −3.23
2016 to 20173.91 −0.89 4.03 11.22
2017 to 2018−0.87 −0.59 −2.69 −9.94
2018 to 2019−10.94 −0.24 5.99 −4.47
2019 to 202016.91 −0.39 −1.14 0.02
2015 to 20206.39 −1.37 1.66 −6.39
Table 8. Transfer matrix of land use types in the study area from 2015 to 2020.
Out (km2)Reclamation AreaGrasslandForest LandOther LandWater AreaExcavation AreaStripping AreaDumping SiteTotal
In (km2)
Reclamation area5.72 0.03 7.14 0.48 0.00 0.23 1.35 2.70 11.93
Grassland1.80 5.87 6.13 0.14 0.00 0.00 0.00 0.46 8.53
Forest land2.04 1.29 47.55 0.71 0.00 0.00 0.02 0.78 4.85
Other land2.98 0.31 8.81 15.35 0.00 0.71 2.45 3.42 18.68
Water area0.00 0.00 0.00 0.01 0.03 0.00 0.00 0.00 0.01
Excavation area0.21 0.00 0.73 0.02 0.00 0.20 0.57 0.26 1.79
Stripping area1.32 0.00 1.87 0.24 0.00 2.24 5.47 2.31 7.99
Dumping site0.98 0.00 0.44 0.26 0.00 0.39 1.10 0.35 3.17
Total9.32 1.62 25.13 1.86 0.00 3.58 5.49 9.94 -
Table 9. Calculation results regarding fusion weights of each layer.
Criterion LayerWeightFactor LayerWeightIndicator LayerWeight
B10.3370C110.1313D1110.0652
D1120.0304
D1130.0357
C120.2057D1210.042
D1220.0478
D1230.1159
B20.3509C210.2157D2110.0948
D2120.0496
D2130.0428
D2140.0285
C220.1352D2210.0371
D2220.0232
D2230.023
D2240.0311
D2250.0208
B30.3121C310.0867D3110.0161
D3120.0276
D3130.043
C320.2254D3210.0795
D3220.0737
D3230.0722
Table 10. Calculation results regarding proximity degrees of factor layers in the study area from 2015 to 2020.
Factor Layer201520162017201820192020
Coal production and consumption0.582 0.533 0.187 0.215 0.316 0.440
Coal economy0.153 0.177 0.573 0.630 0.838 0.629
Water resource quantity0.367 0.643 0.500 0.333 0.427 0.581
Water resource pollution0.404 0.510 0.560 0.580 0.707 0.480
Ecological destruction0.491 0.760 0.115 0.862 0.799 0.888
Ecological protection0.368 0.225 0.255 0.543 0.600 0.996
Disclaimer/Publisher’s Note: The statements, opinions and data contained in all publications are solely those of the individual author(s) and contributor(s) and not of MDPI and/or the editor(s). MDPI and/or the editor(s) disclaim responsibility for any injury to people or property resulting from any ideas, methods, instructions or products referred to in the content.