Article

Untangling the Characteristics and Ecological Processes of Microbial Community Assembly in the Source Area of the East Route of the South-to-North Water Diversion Project in China Under Different Water Periods

1
College of Environmental Science and Engineering, Yangzhou University, Huayang West Road #196, Yangzhou 225009, China
2
National Key Laboratory of Water Disaster Prevention, Nanjing Hyraulic Research Institute, Guangzhou Road #223, Nanjing 210029, China
3
Dongzhu Ecological Environmental Protection Co., Ltd., Xihu Middle Road #90, Wuxi 214000, China
*
Authors to whom correspondence should be addressed.
Water 2025, 17(5), 649; https://doi.org/10.3390/w17050649
Submission received: 18 January 2025 / Revised: 20 February 2025 / Accepted: 21 February 2025 / Published: 23 February 2025
(This article belongs to the Special Issue Freshwater Ecosystems—Biodiversity and Protection)

Abstract

:
This study presented a comprehensive analysis of the microbial ecology in water diversion rivers (WDRs) in the source area of the East Route of the South-to-North Water Diversion Project (ER-SNWDP) in China across various water periods. Proteobacteria, Chloroflexi, Acidobacteriota, and Bacteroidota were identified as the dominant microbial phyla in river sediment. During the wet period, microbial communities exhibited the highest richness, biodiversity, and the most intense antagonistic relationships compared to those in the dry and normal water periods. Generally, the microbial network predominantly existed in symbiotic models characterized by mutual benefit and symbiosis throughout all periods. During the dry period, the microbial co-occurrence network was found to be the most complex, with microbial OTUs showing the closest interconnections. The dominant mechanisms governing community diversity, succession, and biogeography were spatial turnover of species and stochastic processes. A more pronounced impact of stochastic processes on microbial community assemblages was observed during normal or wet periods than the dry period. Functional prediction of metabolic pathways indicated that the main ecological functions of microbial communities encompassed carbohydrate metabolism, amino acid metabolism, energy metabolism, etc. This study could provide essential scientific data for ecological regulation, ecological protection, and water resources management in WDRs.

1. Introduction

Adequate and high-quality water resources are essential for the health and sustainable development of human societies and ecosystems [1]. However, factors such as rapid population growth, climate change, water contamination, urbanization, and industrial development are exacerbating water shortages [2]. To meet the growing demands of domestic, agricultural, and industrial water use, both developed and developing countries have implemented numerous water diversion projects (WDPs) [3]. WDPs refer to engineering works that involve the construction or modification of hydraulic facilities to divert water from one source to another area or region. Currently, there are over 160 large-scale, long-distance WDPs worldwide [4]. These WDPs have played a crucial role in alleviating the uneven distribution of water resources [5]. The North-to-South WDP in California in the United States has promoted the economic development of California; Egypt’s West-East WDP has provided valuable water resources to the Sinai Peninsula; the South-to-North WDP in China has promoted the coordinated development of the local economy, society, population, resources, and environment [3]. Water diversion rivers (WDRs) refer to rivers that are subject to water resource allocation and management through WDPs. These rivers, serving as the primary arteries for water transportation, often undergo frequent environmental changes due to the operation of WDPs. There is increasing concern about their impact on water ecology in WDRs with the construction of WDPs. Therefore, it is essential to understand the effects of water diversion on the ecosystems of water diversion rivers for the long-term implementation of WDPs.
Microorganisms play a vital role in WDR ecosystems by contributing to various functions and exhibiting diverse characteristics [6]. River sediments, which serve as a major source of pollutants in water bodies and as sites for microbial aggregation, are essential components of water ecosystems [7]. Microorganisms in sediments make important contributions to river ecosystems, particularly in biogeochemical cycles, nutrient cycles, and energy flows [8]. Furthermore, sediment environments harbor a rich diversity of microbial species, intense metabolic activity, and show high responsiveness to environmental changes [9]. The operation of WDPs can result in complex ecological and hydrological changes in WDRs [10]. The consequent changes in environmental parameters such as pH, temperature (T), dissolved oxygen (DO), and nutrient concentration could have a profound effect on the microbial communities in the river ecosystem [11]. Luo et al. (2019) pointed out that there was spatial variability in the planktonic bacterial community in the main channel of the South-to-North WDP, driven by DO, pH, and T [12]. Liu et al. (2023) found that pH, Total Phosphorus (TP), and Nitrate Nitrogen (NO3-N) were the main factors influencing the bacterial community in river sediments of the Li River Basin [13]. Environmental changes have the potential to increase microbial community heterogeneity in sediments, facilitate the dispersal of pathogenic bacteria, and disrupt the original interspecific relationships within microbial communities [14]. Therefore, understanding the ecological characteristics of microbial communities in river sediments of WDRs under changing environments is essential for effective water ecological management in these regions.
However, most studies on the effects of WDPs on water ecology have focused on water quality, fish, and plants; until recent years, more attention has been paid to the effects on microorganisms [6]. Qu et al. (2018) investigated the dominant microbes in the water body of Miyun Reservoir in China and observed an increase in the relative abundance of Proteobacteria and Verrucomicrobiota under the influence of the South-to-North WDP, leading to intensified interspecies competition for ecological niches [15]. Yao et al. (2019) found differences in bioavailability and microbial diversity in the area affected by the South-to-North WDP in Hongze Lake compared with other sites [16]. Liu et al. (2022) determined that the spatial heterogeneity of bacterial communities in Dongping Lake decreased during the south-to-north water diversion period, potentially increasing the risk of biological homogenization between rivers [17]. However, research on microbial communities in watersheds affected by WDPs has mainly focused on receiving lakes in the area and regulating lakes along the route, with limited attention given to microbial communities in WDRs. Lv et al. (2021) found that under the influence of the Yellow River diversion in Shanxi Province in China, the dominant position of the core bacterial community in the sediment of the Fen River decreased, and the abundance of Comamonadaceae and Hydrogenophaga decreased [14]. WDRs in the water source area play a critical role in water quality regulation during water transportation, directly impacting the safety of drinking water for millions of people along the diversion route. The ecological and physicochemical status of WDRs change in the normal, dry, and wet periods affected by WDPs. Therefore, it is necessary to study the microbial communities in WDRs in the source area of WDPs under different water conditions. However, research on microbial communities in WDRs in the water source area of WDPs is still lacking.
This study investigated the microbial communities in river sediments within the source area of the East Route of the South-to-North Water Diversion Project (ER-SNWDP) in China. The objectives of this study were (1) to analyze the composition, distribution, and diversity patterns of microbial communities in WDRs in the source area of ER-SNWDP under the normal, dry, and wet periods with varying hydrologic conditions; (2) to investigate the complexity and interactions of microbial networks across different water periods; (3) to figure out the metabolic potential and ecological functions of microbial communities in the WDR ecosystem; (4) to reveal the dominant mechanisms governing community diversity, succession, and biogeography in WDRs. This research could provide essential scientific data for ecological regulation, environmental protection, and water resources management in WDRs.

2. Materials and Methods
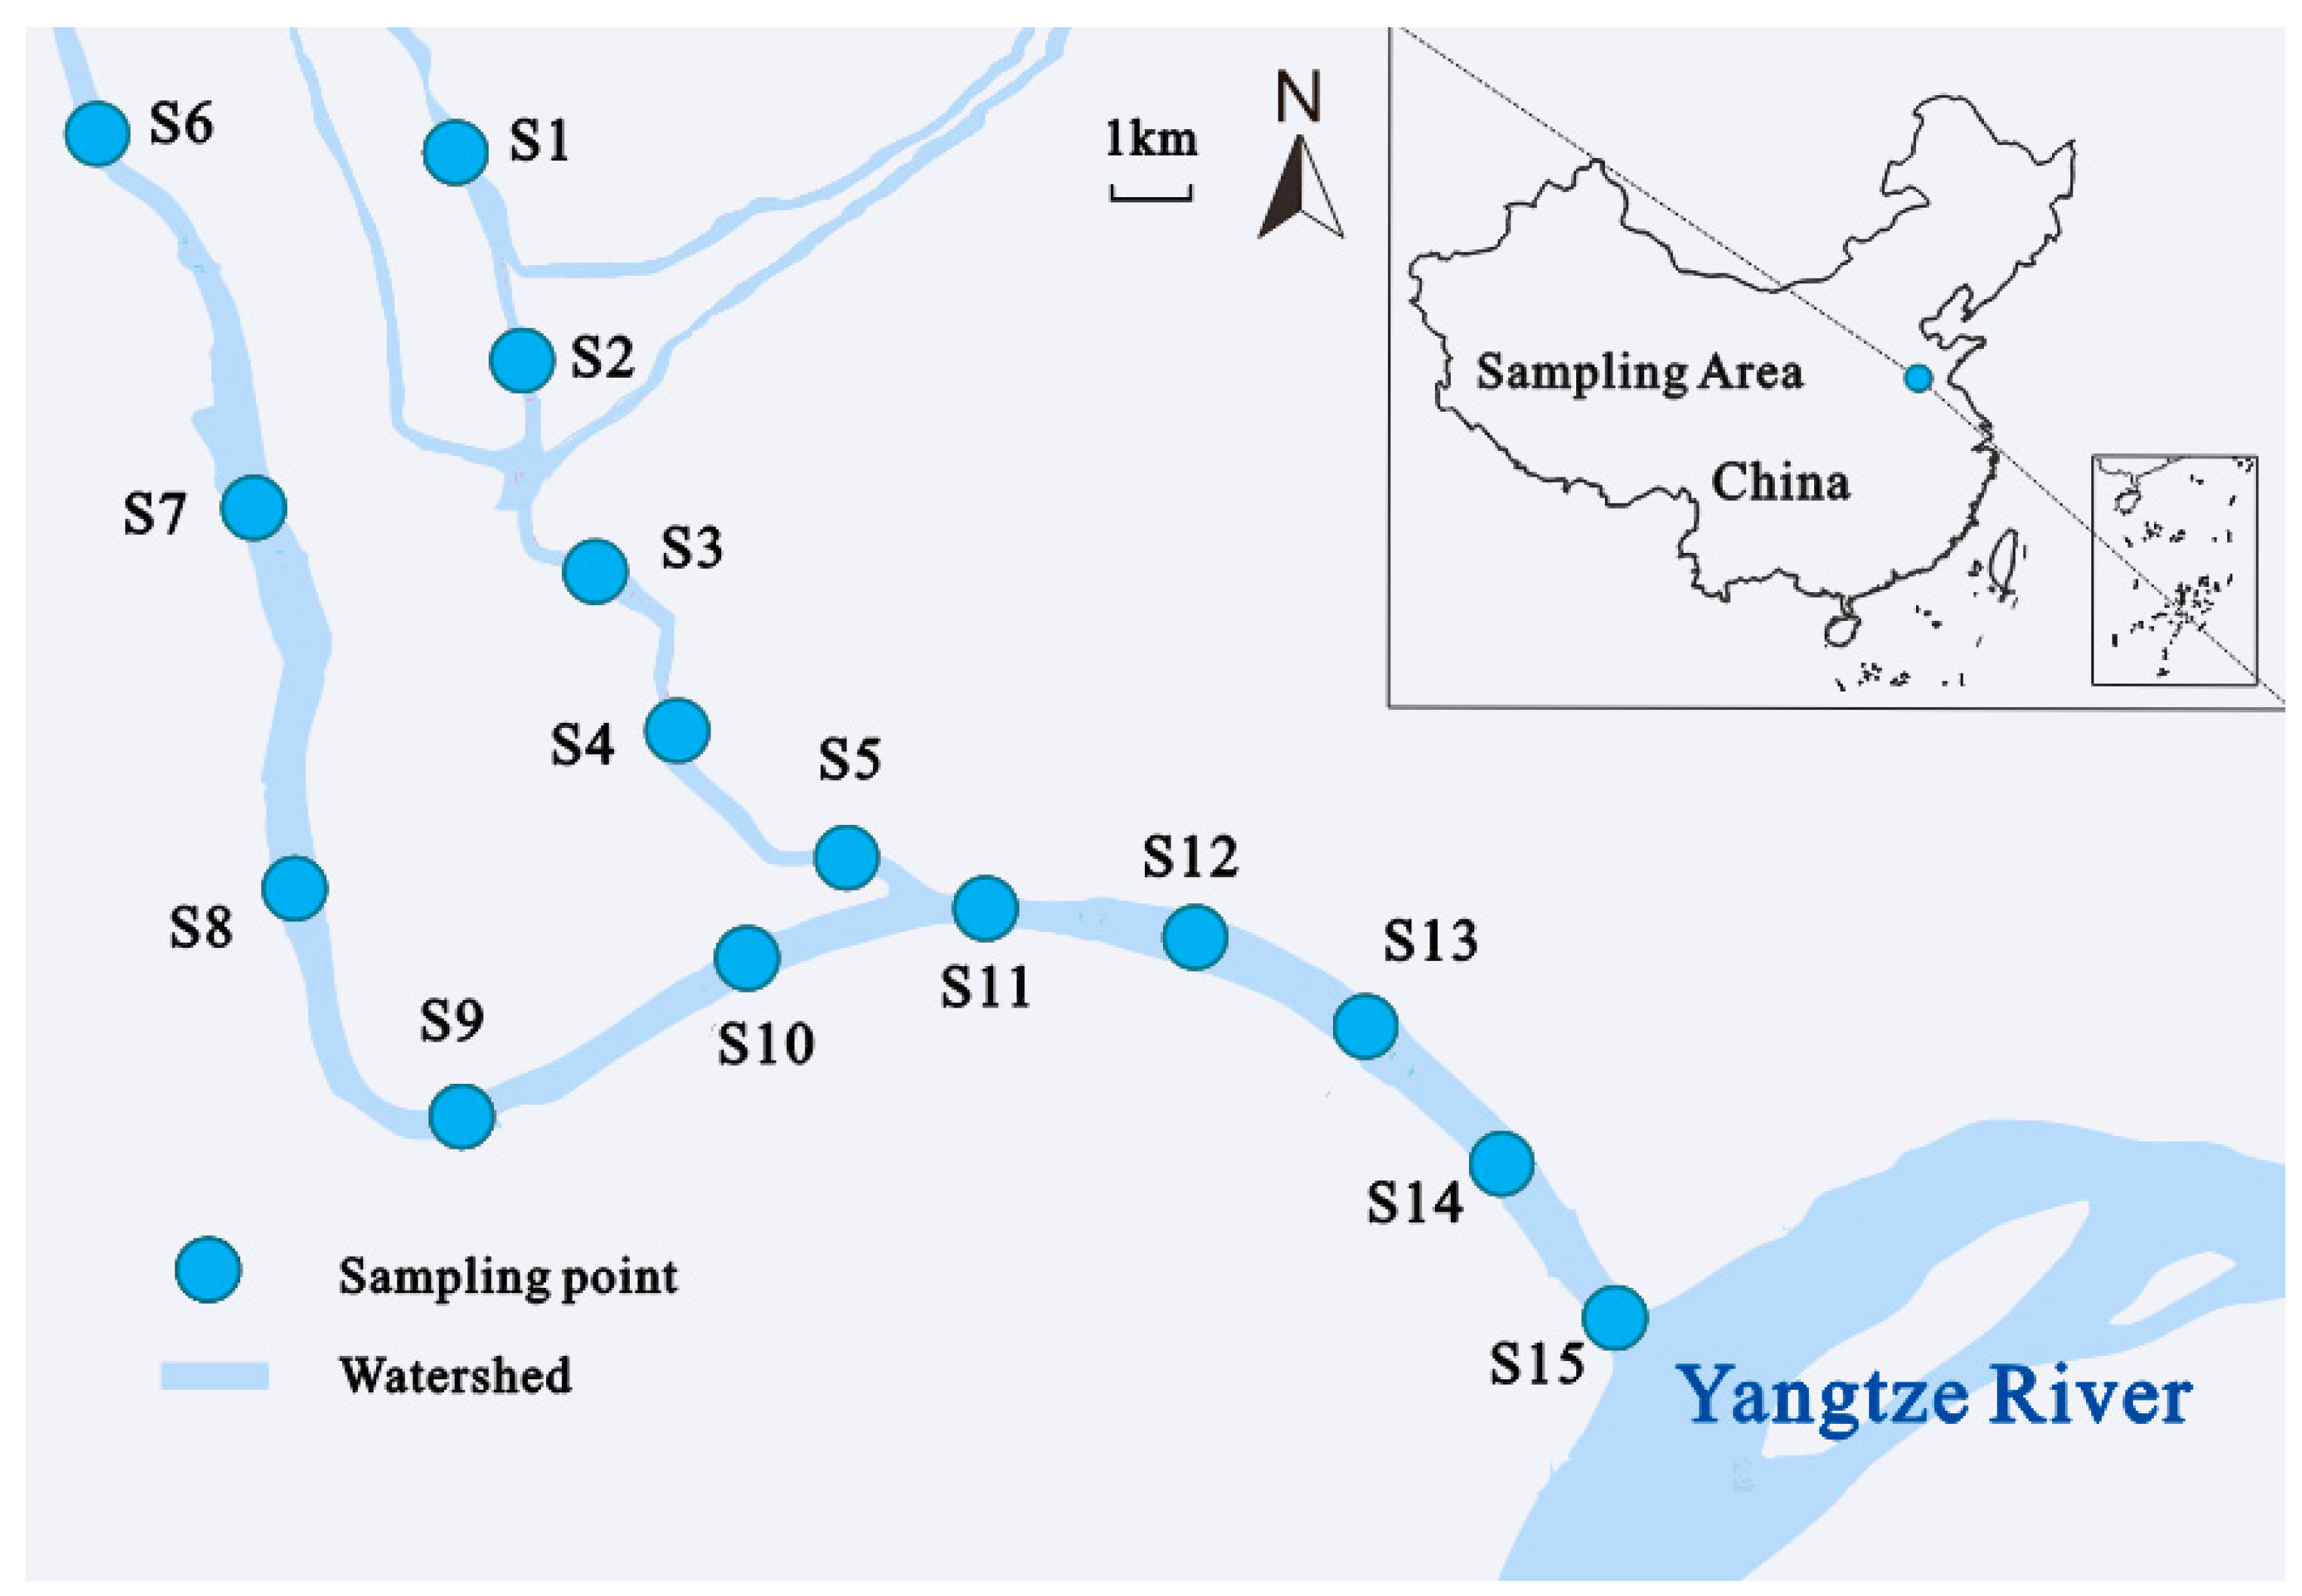
2.1. Study Area

The study area located in the water source area of ER-SNWDP is shown in Figure 1. It is also a transition zone between a subtropical humid monsoon climate and a temperate monsoon climate, characterized by four distinct periods, ample sunlight, and abundant rainfall. Since 2013, ER-SNWDP has officially transferred water from the Yangtze River along hundreds of water diversion rivers to the water deficit zone in northern China. Rivers in this area are subject to significant hydrological fluctuations due to the impacts of frequent water diversion activities and watershed precipitation changes. They are undertaking complex tasks. In addition to serving as water diversion rivers for ER-SNWDP, rivers in this area also serve as the water conveyance rivers from the Huai River to the Yangtze River in normal water periods and as the flood discharge channels in flood periods. Therefore, the hydrological conditions of these rivers vary in complexity throughout the year, with frequent changes in water volume, flow rate, even flow directions, etc.

2.2. Sample Collection

According to the field investigation and survey, river sediment samples were taken from 15 sampling sites in three water diversion river channels in the source area of ER-SNWDP in China. Detailed location data are shown in Table S1 (Supporting Information). In the field of hydrology, the division of wet season, normal season, and dry season is determined based on the changes in water levels of rivers, lakes, and other water bodies. Generally speaking, the wet season refers to the period when the water level is high and the water volume is large, usually during the rainy season or the melting season of ice and snow (June to August). The normal water period refers to a time when the water level is moderate and the water volume is moderate, usually during seasons with relatively even rainfall (March to May; September to November). The dry season refers to the period when the water level is low and the water volume is small, usually during the dry or low rainfall season (December to March of the following year). The specific classification criteria may vary depending on factors such as region, climate, and hydrology. Therefore, sampling activities were conducted in three distinct water periods: January 2021 (the dry period), April 2022 (the normal period), and August 2022 (the wet period). Samples collected during these periods were marked as A1–A15, B1–B15, and C1–C15, respectively. Grab-type mud collectors were employed to collect river sediment samples, with each sample point being sampled in triplicate. The collected sediments in the same site were extracted from a depth of 0–20 cm, packed, and mixed in pre-sterilized plastic sealed bags. All sampling equipment used was pre-sterilized to prevent any external contamination. Furthermore, the samples were processed under controlled, contamination-free conditions. Samples were then kept in ice, transported to the laboratory immediately, and stored at −20 °C. Subsequently, the sediment samples were processed in the laboratory for total DNA extraction and subsequent analysis.

2.3. DNA Extraction, PCR Amplification, and Illumina MiSeq Sequencing

To reduce sampling errors, each sediment sample was thoroughly homogenized before subsampling and weighing. Biomass was extracted using a vacuum filtration method, followed by genomic DNA extraction with the FastDNA® Spin Kit (MP Biomedicals, Santa Ana, CA, USA) for Soil according to the manufacturer’s instructions, with three replicates per sample. Microbial community composition was analyzed using Illumina MiSeq Sequencing (San Diego, CA, USA) with 16S rRNA. PCR amplification was performed using the bacterial 16S rRNA gene universal primers 341F (5′-CCTACGGGNGGCGWGCAG-3′) and 806R (5′-GGACTACNVGGGTWTCTAAT-3′). The amplification region of the 16S rRNA gene was the V3-V4 hypervariable region. Polymerase chain reaction (PCR) amplifications were carried out in triplicate for each sediment sample using a 20 μL volume. The reaction mixture included 4 μL of 5×FastPfu buffer, 2 μL of 2.5 mM dNTPs, 0.4 μL of each primer (5 μM), 0.8 μL of DNA template, and 0.4 μL of FastPfu polymerase. The amplification protocol was initiated at 94 °C for 5 min, followed by a series of cycles at 94 °C for 30 s (denaturation), 53 °C for 30 s (annealing), and 72 °C for 30 s (extension), culminating in a final extension at 72 °C for 8 min over 30 cycles. The purification of PCR amplicons was performed using AMPure beads to remove unused primers, which were then used to construct sequencing libraries quantitated using the Qubit 2.0 Fluorometer from Thermo Scientific (Waltham, MA, USA). The amplified products were placed on ice and immediately sent to Shanghai Biozeron Biotechnology Co., Ltd. (Shanghai, China) for sequencing. The bioinformatics analysis followed the previously described procedure [18]. DNA sequencing data are available at NCBI GenBank database under accession PRJNA1057511, PRJNA1057626, and PRJNA1058100.

2.4. Statistical Analysis

Alpha diversity, which encompasses richness and evenness, was evaluated using several indicators, including ACE, Chao1, Simpson, Shannon, and Pielou evenness indices. All data analysis was conducted using R software (version 4.5.0, http://www.r-project.org) accessed on September 2022. Differences in the structure and composition of microbial communities among samples were visualized through principal coordinate analysis (PCoA) and non-metric multidimensional scaling (NMDS) based on the distance matrix of normalized operational taxonomic units (OTUs). Periodical variation in microbial community composition was compared using histograms. For functional prediction analysis, the PICRUSt software was employed to predict sediment bacterial functions, which were subsequently compared with the Kyoto Encyclopedia of Genes and Genomes (KEGG) database to obtain functional prediction information. Detailed analysis steps were based on an online analysis platform (http://picrust.github.io/picrust/) accessed on September 2022.

3. Results

3.1. Species Richness, Evenness, and Diversity

A total of 1,997,209 sequence reads were obtained from 45 samples through 16S rRNA gene sequencing. Samples collected in the wet period showed the largest OTU numbers, with 73,794, followed by 68,033 OTUs in the normal period and 64,877 OTUs in the dry period, respectively (Table S2). These bacterial OTUs captured in the current sequencing depth were deemed representative of the microbial communities in all samples. The microbial alpha diversity showed different characteristics in different water periods. During the dry period, the Chao1, ACE, Shannon, and Simpson indices ranged from 2868.864 to 7625.035, 3012.299 to 7965.199, 6.395 to 7.894, and 0.9918 to 0.9992, respectively. During the normal period, the Chao1 index ranged from 6215.653 to 8371.831, the ACE index ranged from 6495.969 to 8616.480, the Shannon index ranged from 7.069 to 7.688, and the Simpson index ranged from 0.9970 to 0.9986. When at the wet period, Chao1, ACE, Shannon, and Simpson indices were from 6395.259 to 9644.657, 6698.417 to 9974.901, 6.978 to 7.849, and 0.9929 to 0.9989, respectively. These alpha diversity indexes exhibited the largest fluctuations in the dry period. The average values of Chao1 (8097.221) and ACE indexes (8445.687) were the highest in the wet period, indicating the richest ecological community in the wet period. The wet period also exhibited the highest average values for the Shannon index (7.585), Simpson index (0.998), and Pielou evenness index (0.893), suggesting the highest species biodiversity and evenness during this period.

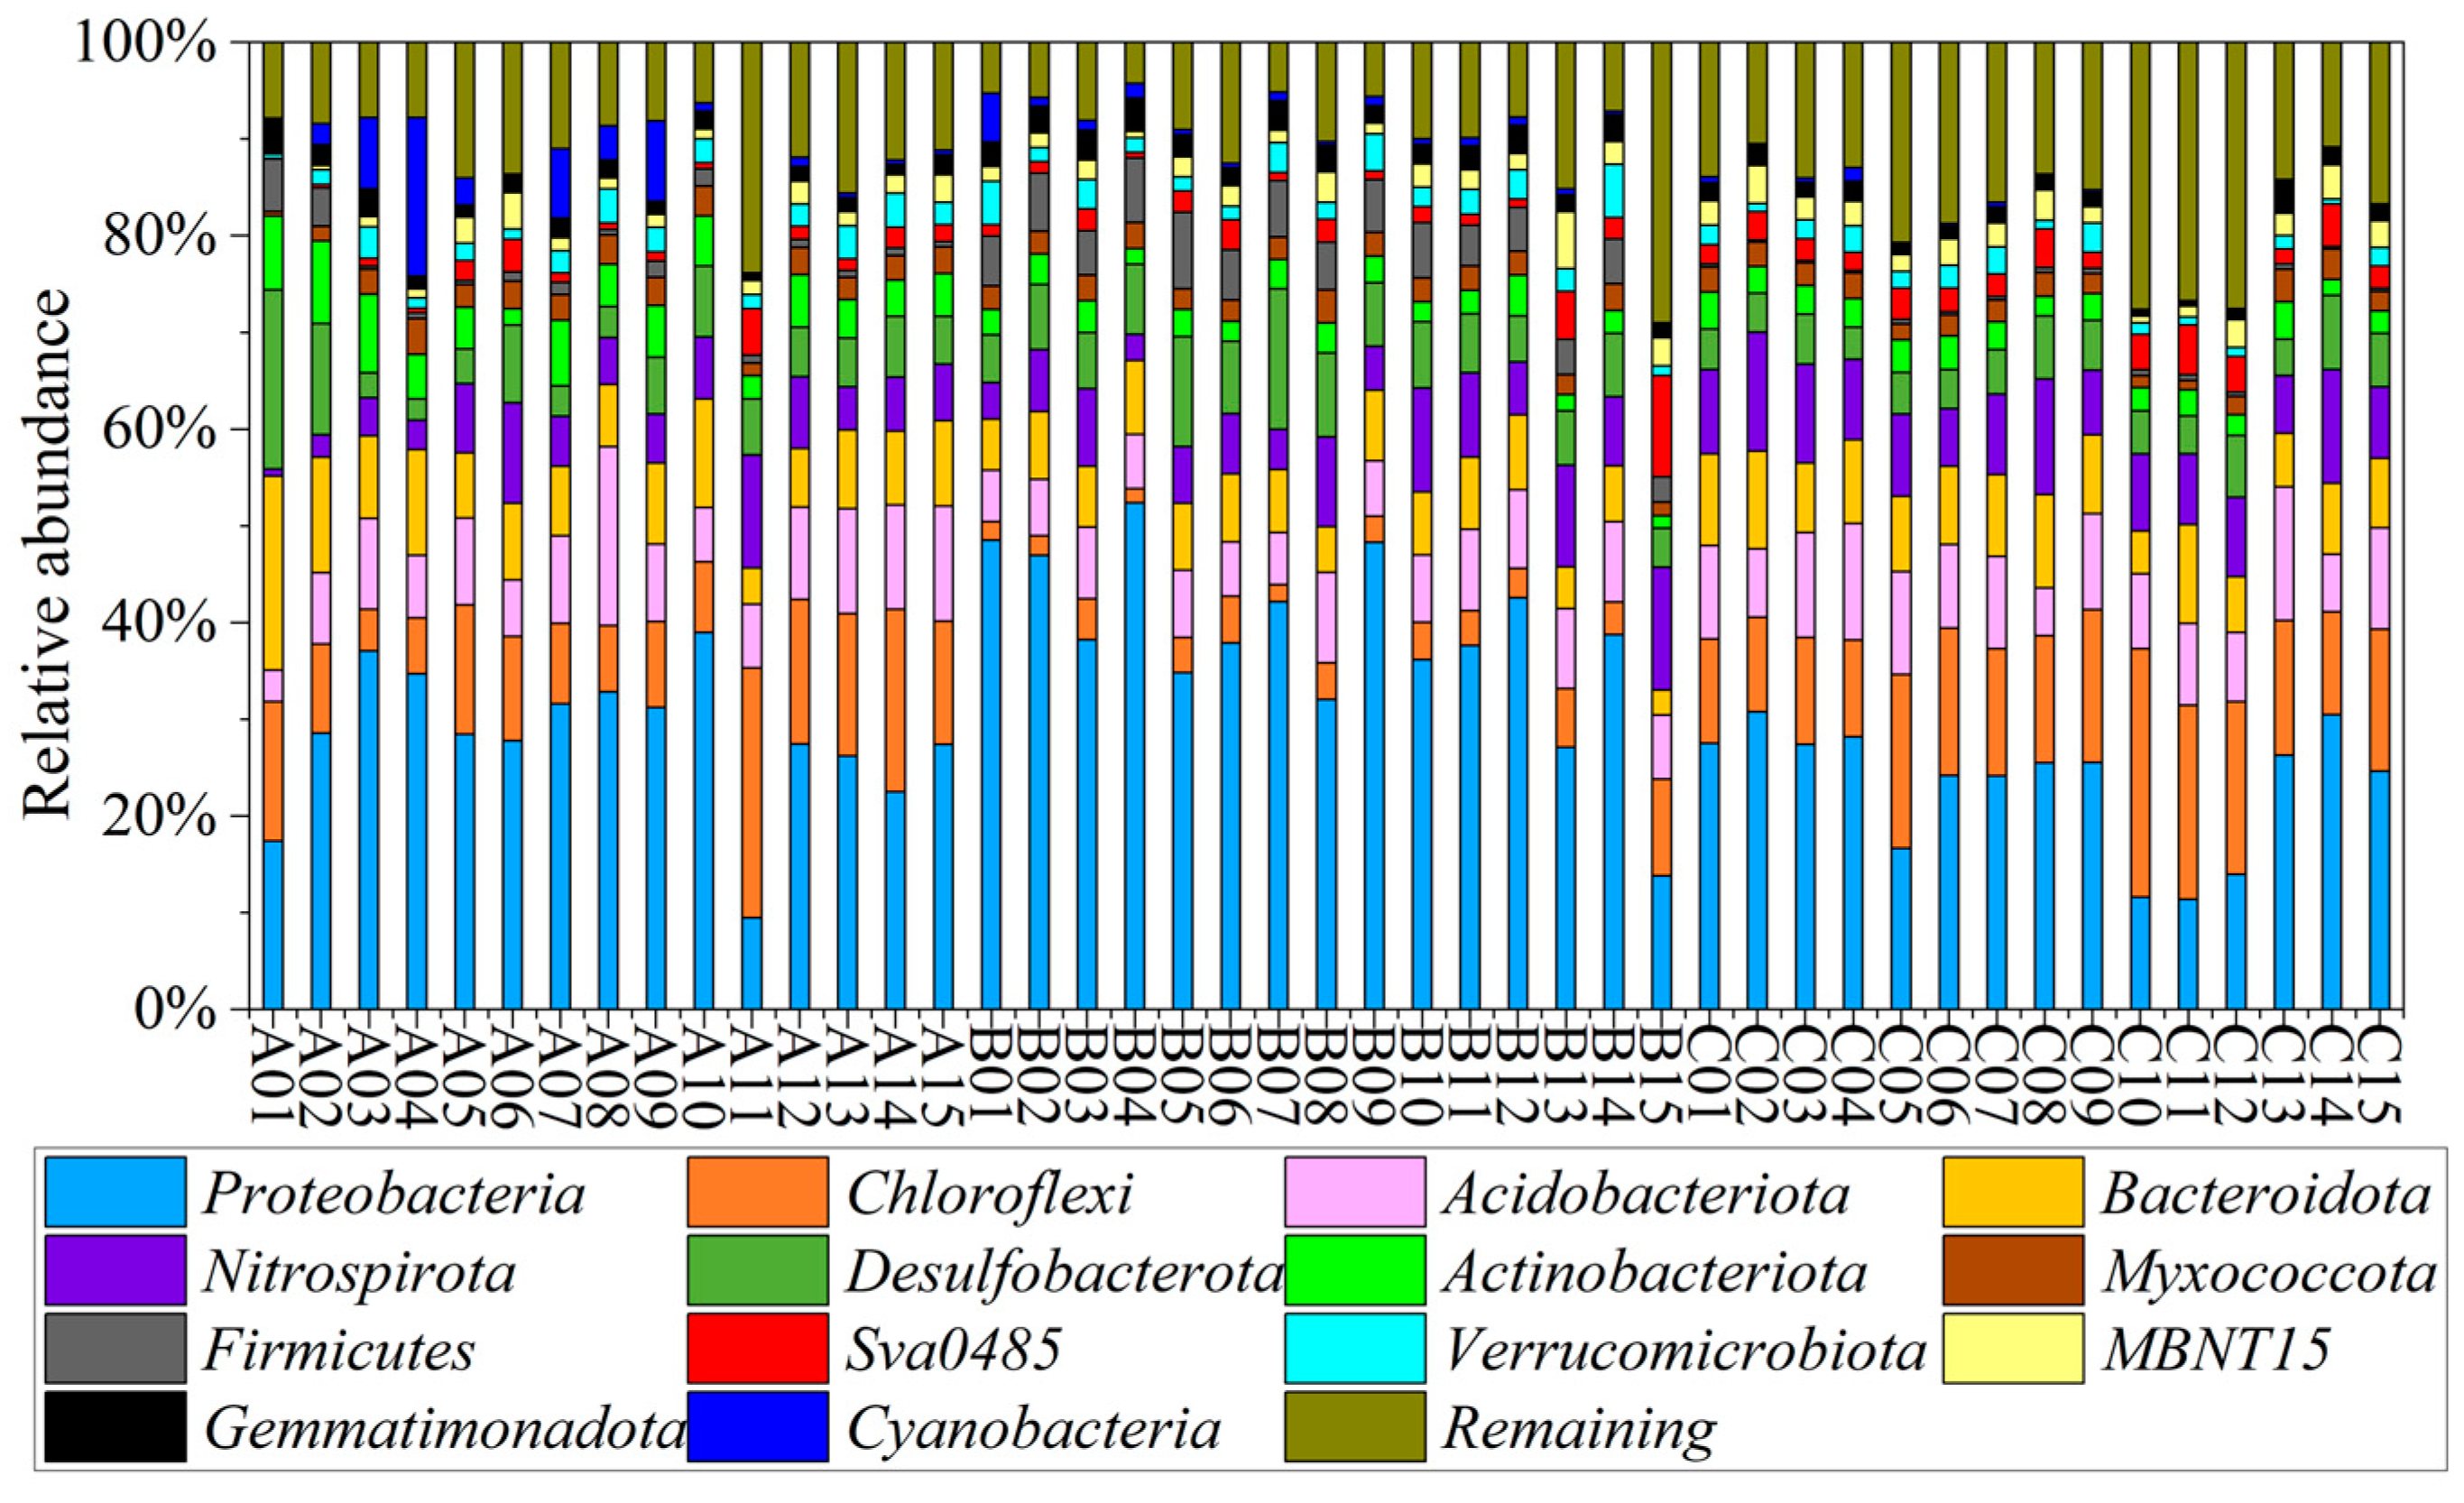
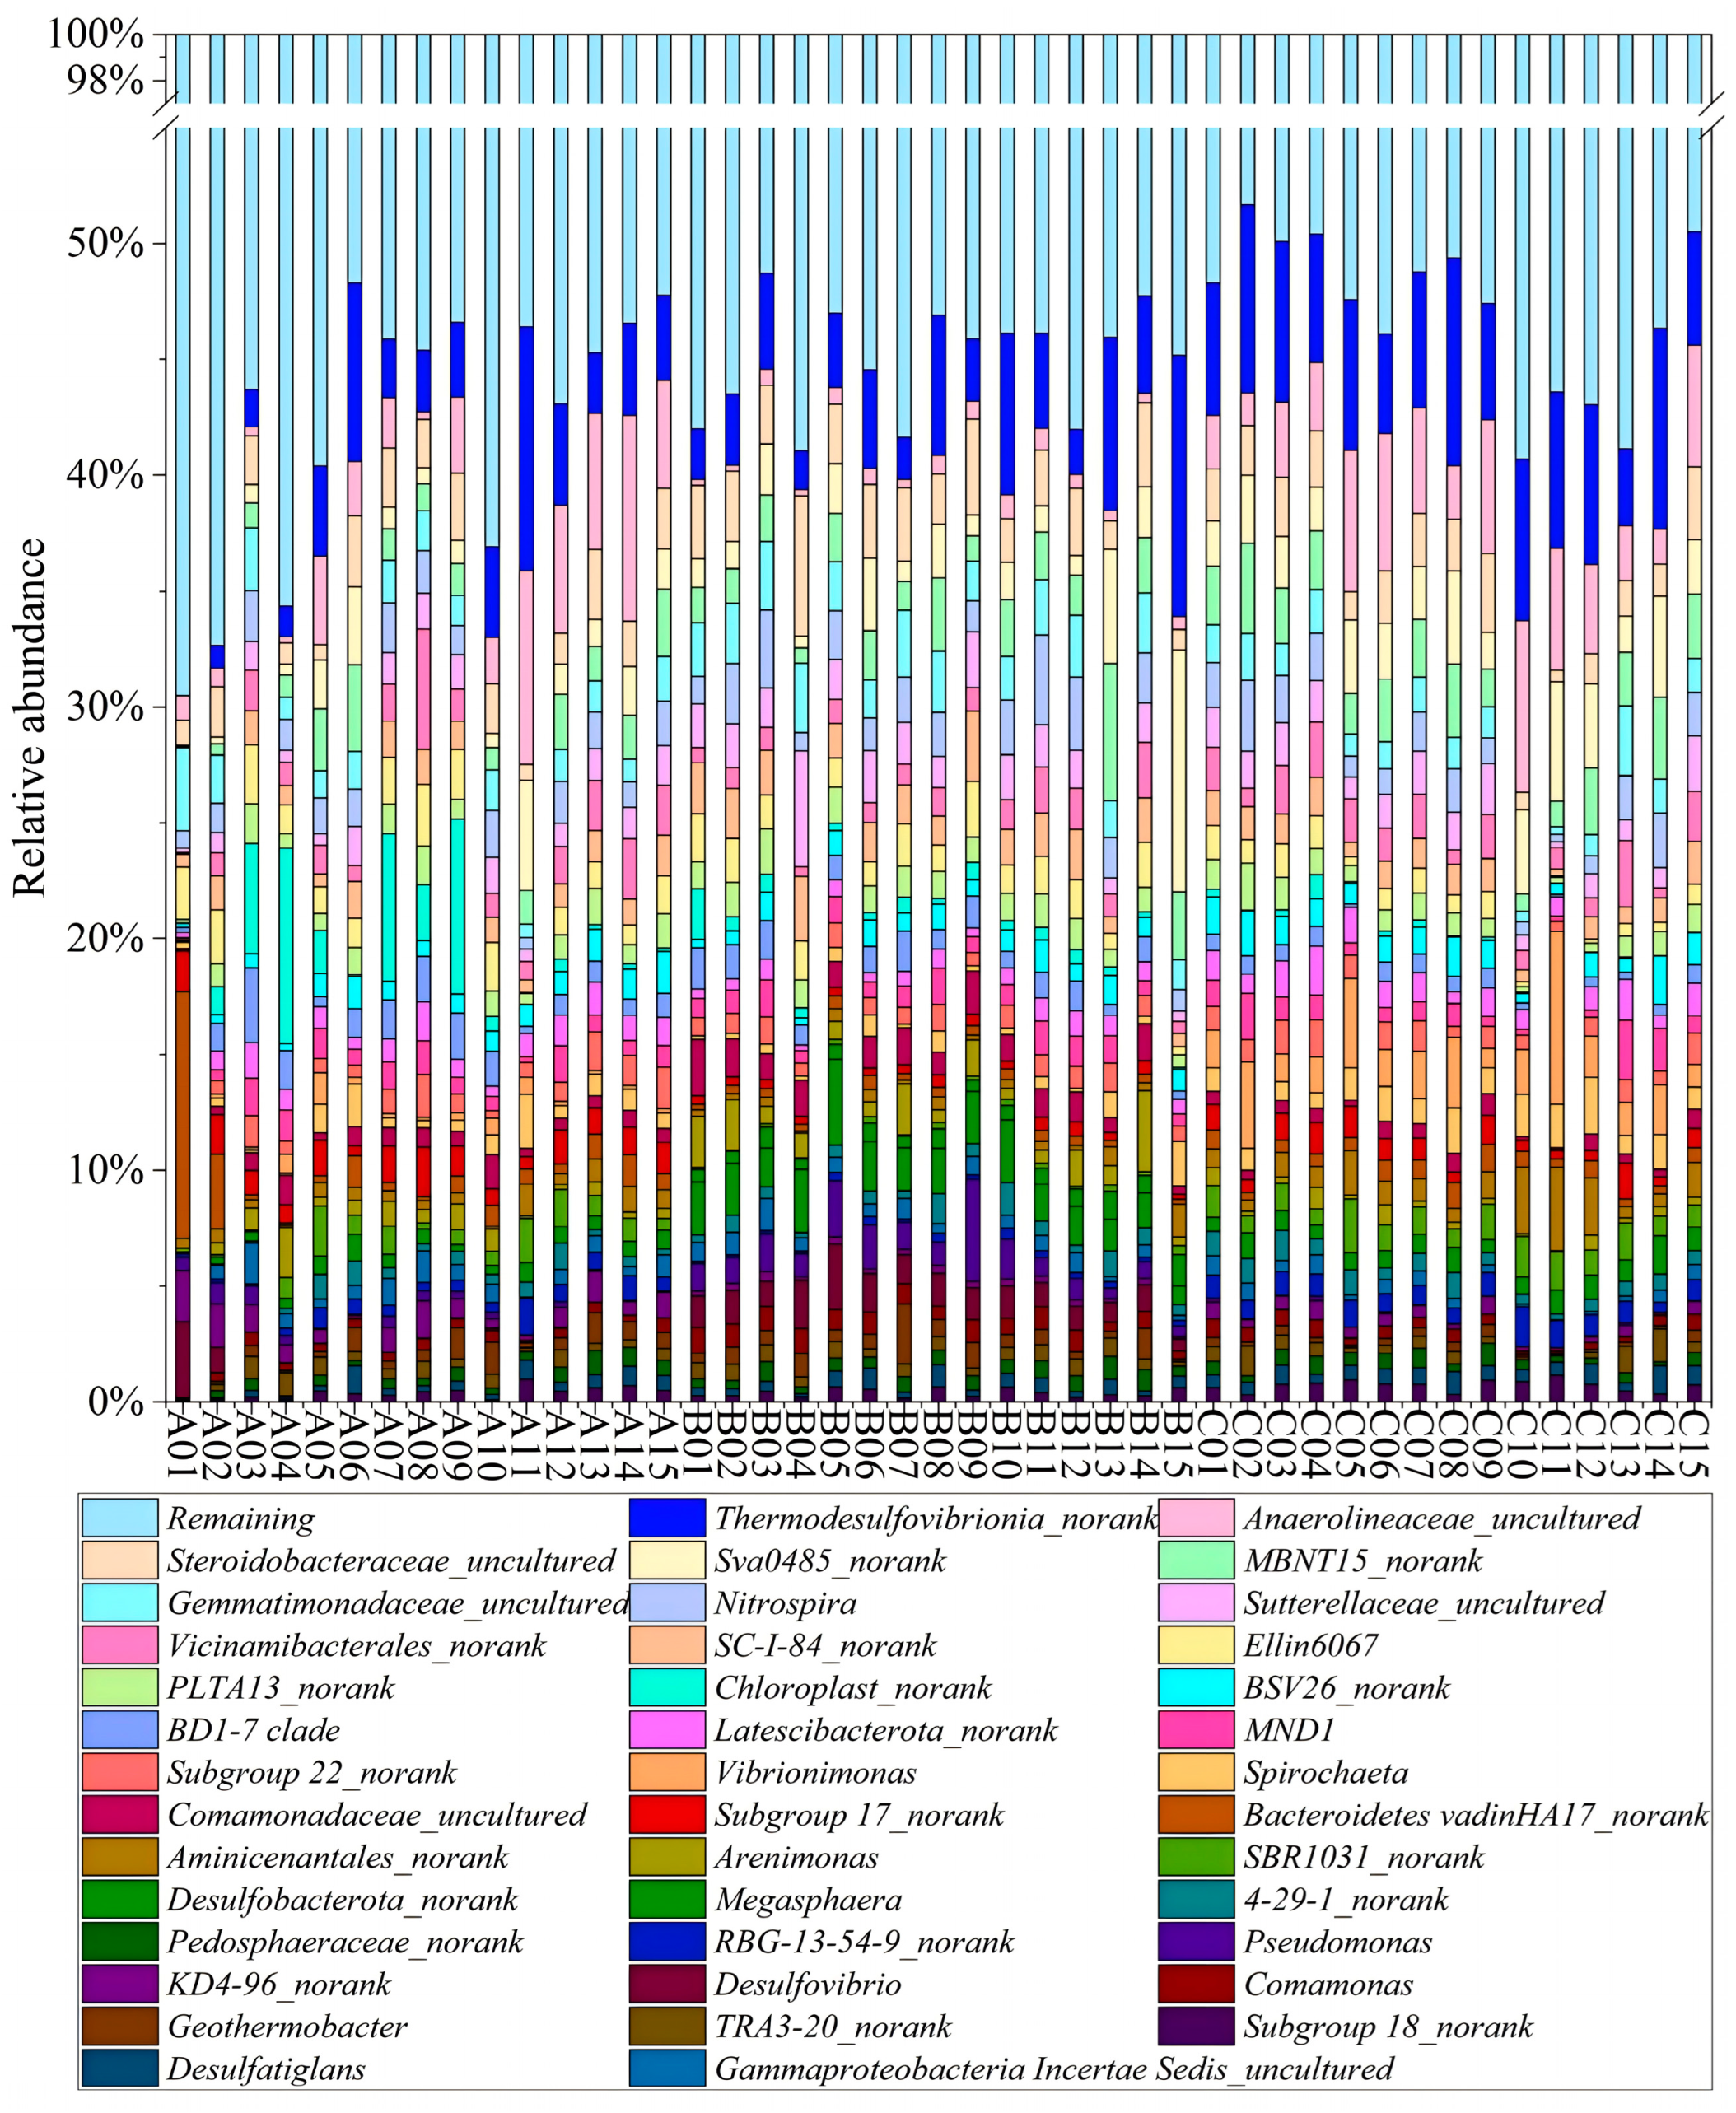
3.2. Microbial Community Composition

Among the 45 samples, a total of 74 phyla and 1717 genera were identified and classified. The composition and distribution of the microbial communities at the phylum and genus level were characterized in Figure 2. Taxa with an average relative abundance of less than 2% were classified into the Remaining Group. Generally, Proteobacteria, Chloroflexi, Acidobacteriota, Bacteroidota, and Nitrospirota were the most dominant phylum, accounting for 29.95%, 10.05%, 8.29%, 7.67%, and 7.09% of the total sequences, respectively. In the dry period, the dominant phyla were Proteobacteria (28.12%), Chloroflexi (11.75%), Bacteroidota (8.92%), Acidobacteriota (8.81%), and Desulfobacteriota (6.22%). In the normal period, the dominant phyla were Proteobacteria (38.5%), Desulfobacteriota (7.15%), Nitrospirota (7.07%), Acidobacteriota (6.94%), and Bacteroidota (6.21%). In the wet period, the dominant phyla were Proteobacteria (23.24%), Chloroflexi (14.64%), Acidobacteriota (9.12%), Nitrospirota (8.63%), and Bacteroidota (7.88%). Proteobacteria was the dominant phylum throughout the three periods, with its relative abundance the highest in the normal period. Chloroflexi was obviously lower in the normal period than in the other periods. From the dry period to the wet period, the abundance of Cyanobacteria decreased, whereas that of Nitrospirota increased.
At the genus level, Thermodesulfovibrionia, Anaerolineaceae, Steroidobacteraceae, Sva0485, and MBNT15 were the most abundant genera, accounting for 4.72%, 2.64%, 2.26%, 2.23%, and 2.07% of the total sequences, respectively (Figure 3). During the dry period, the dominant genera were Thermodesulfovibrionia (3.53%), Anaerolineaceae (3.32%), and Chloroplast (2.30%). In the normal period, the most abundant bacterial genera were Thermodesulfovibrionia (4.33%), Steroidobacteraceae (2.86%), and Sva0485 (2.38%). In the wet period, Thermodesulfovibrionia also retained its status as the most abundant genus (6.29%), followed by Anaerolineaceae (4.02%) and Sva0485 (2.87%). As the most dominant group in all periods, Thermodesulfovibrionia exhibited the highest relative abundance during the wet period and the lowest during the dry period. Anaerolineaceae was the second abundant genus both in the dry and wet periods but showed a much lower abundance (0.6%) in the normal period. Conversely, the relative abundance of Steroidobacteraceae was the highest in the normal period compared to that in the dry and wet periods.

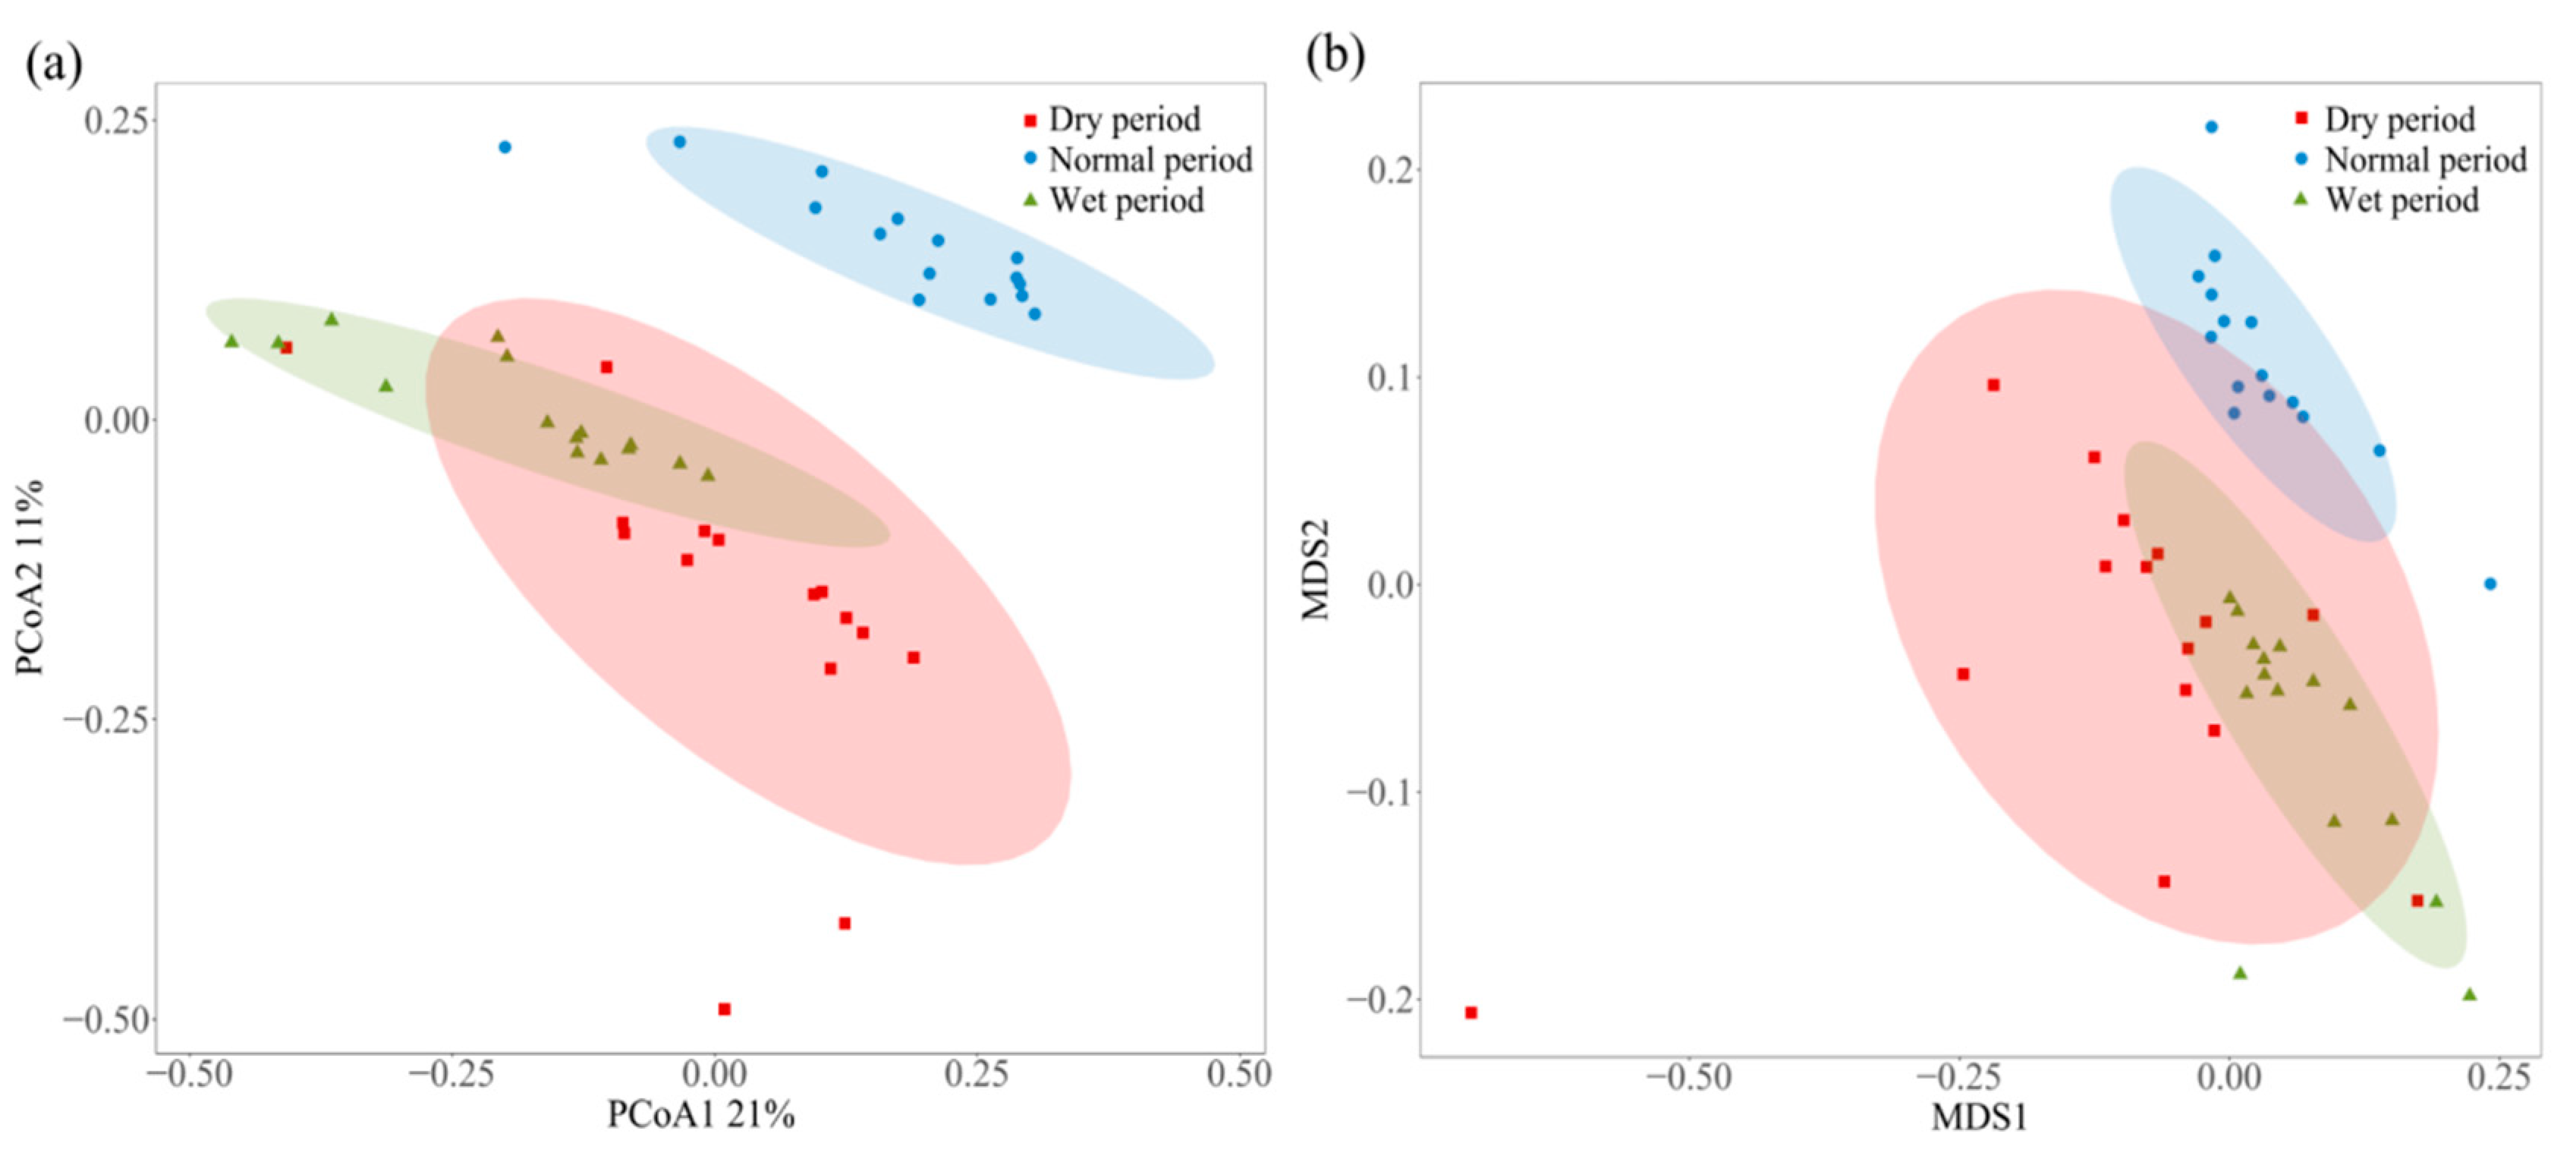
3.3. PCoA Analysis and NMDS Analysis

The PCoA analysis was performed to analyze the distribution pattern of microbial communities across all sampling sites (Figure 4a). The first component (PCoA1) and the second component (PCoA2) accounted for 21% and 11% of the observed changes, respectively. The PCoA analysis revealed that the composition of microbial communities showed spatiotemporal variation among samples. Generally, the samples in the dry and wet periods were not well separated. However, those collected during the normal period were found to be distantly separated from those in the dry and wet periods, indicating relatively obvious differences between the microbial community structure in the normal period and other periods. Among different periods, samples in the dry period showed the most separation characteristics, while those in the normal and wet periods both exhibited a higher degree of similarity. These findings were further supported by NMDS analysis, which confirmed the distinctive distribution pattern of microbial communities across different sampling points (Figure 4b). These results provide evidence of discernible differences in the composition of microbial communities across different periods.

3.4. β-Diversity Measurement

The divergence of causal mechanisms underlying biodiversity can be attributed to a series of environmental evolution, which is expected to give rise to two key phenomena in the beta diversity of microbial communities including nestedness and the spatial turnover of species assemblages [19]. The Simpson dissimilarity index (βSIM), Sørensen dissimilarity index (βSOR), and the nestedness-resultant dissimilarity index (βNES) were used to differentiate the effects of species spatial turnover and nestedness components on the biotic similarity of microbial communities among multiple-site biotas. The phase dissimilarity indices across various sample groups are shown in Table S3 and Figure S1, according to Baselga’s community assembly methodology [19]. βSOR is dependent on the proportion of species shared among different communities, and βSIM and βNES were used to characterize species turnover and nestedness among the biotas of multiple sites. Overall, βSOR was the highest, with an average value of 0.8282 among all samples, followed by βSIM (0.8018) and βNES (0.0202). Among the three water periods, the dry period showed the highest βSOR value (0.8517), followed by the wet period (0.8210) and the normal period (0.8119). βSIM values were much higher than βNES values in all three periods, indicating the species spatial turnover in multiple-site biotas contributed much more to shaping the bacterial communities in different water periods.

3.5. Co-Occurrence Networks of Microbial Community

Network analysis has been adopted for elucidating microbial interactions in the WDRs in the source area of the ER-SNWDP under different water periods. Statistics for the topological parameters of each network are displayed in Table 1. In the dry period, Proteobacteria, Acidobacteria, and Chloroflexi were the dominant keystone species in the network diagram (Figure 5a). The positive correlation between species is 95.62%, which is much higher than the negative correlation (4.38%). The highest degree node is Desulfobacteriota, which has a high connection and is positively correlated with other phyla. The proportion of connections among different members of Proteobacteria was 16.1%, while that among Chloroflexi members was 6.79%. The connection between Proteobacteria and Chloroflexi was the closest among different phyla, with a connection proportion of 3.66%. In the normal period, the network consisted of the lowest abundance of nodes and edges, indicating the lowest degree of interconnectedness between OTUs in the normal period (Figure 5b). The main network nodes are Proteobacteria, Bacteroidota, Nitrospirota, etc. The positive correlation between species was 80.80%, which was higher than the negative correlation (19.20%). The highest degree node is Proteobacteria. The proportion of connections among Proteobacteria members and Nitrospirota members was 25.71% and 3.41%, respectively. The closest connection was found between Proteobacteria and Bacteroidota, with a connection proportion of 5.57%. In the wet period, Proteobacteria was also the most dominant keystone species as the network nodes, followed by Chloroflexi and Acidobacteria (Figure 5c). The positive correlation between species is 77.11%, also higher than the negative correlation (22.89%). Chloroflexi was the highest degree node and is mainly positively correlated with other phyla. The proportion of connections between members of Proteobacteria was 9.45%, the lowest among the three periods. Proteobacteria and Chloroflexi showed a relatively strong connection with a connection proportion of 4.51%.

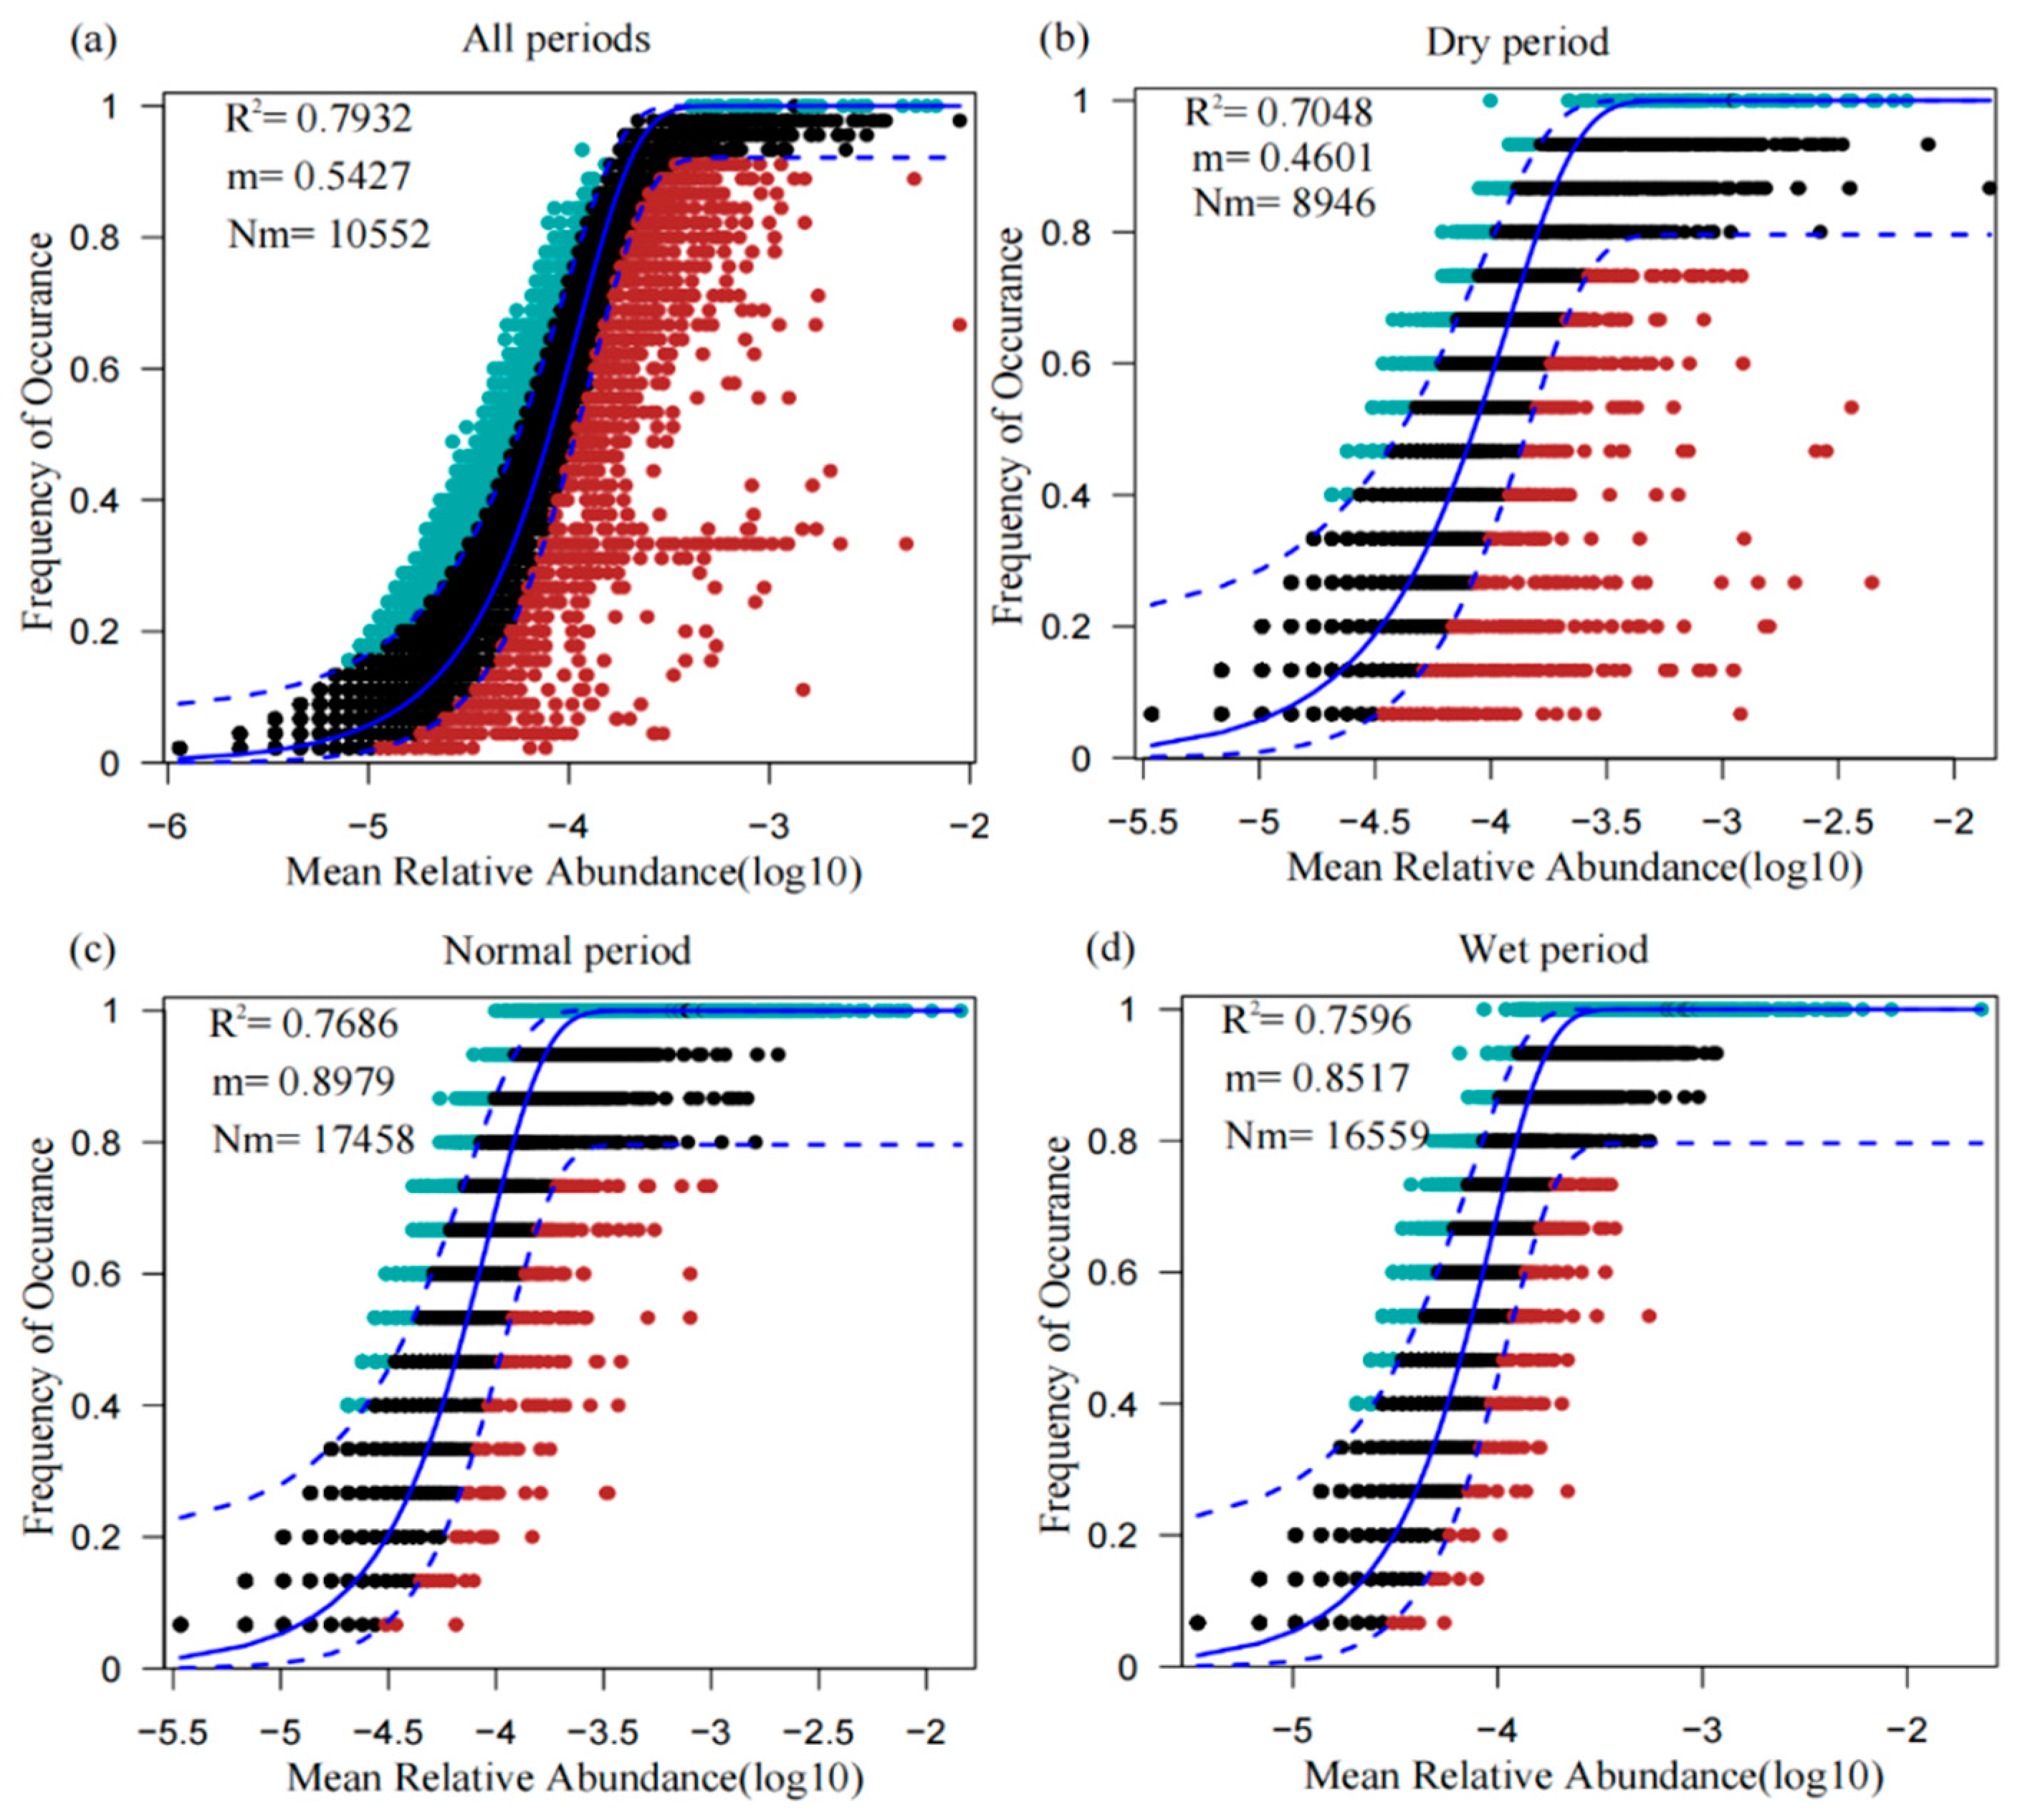
3.6. Fit to the Neutral Model of Community Assembly

The neutral community model (NCM) was used to evaluate the effects of stochastic processes on shaping microbial community assembly in the WDRs in the source area of the ER-SNWDP under different water periods (Figure 6). In this study, the values of NCM parameter R2 for communities in all periods, i.e., the dry period, normal period, and wet period, were 0.7973, 0.7048, 0.7686, and 0.7596, respectively, suggesting that the trait community model fitted for the microbial communities. The Nm-value and the dispersibility of microbial communities were the lowest in the dry period (Nm = 8946, m = 0.4601) and the highest in the normal period (Nm = 17,458, m = 0.8979).

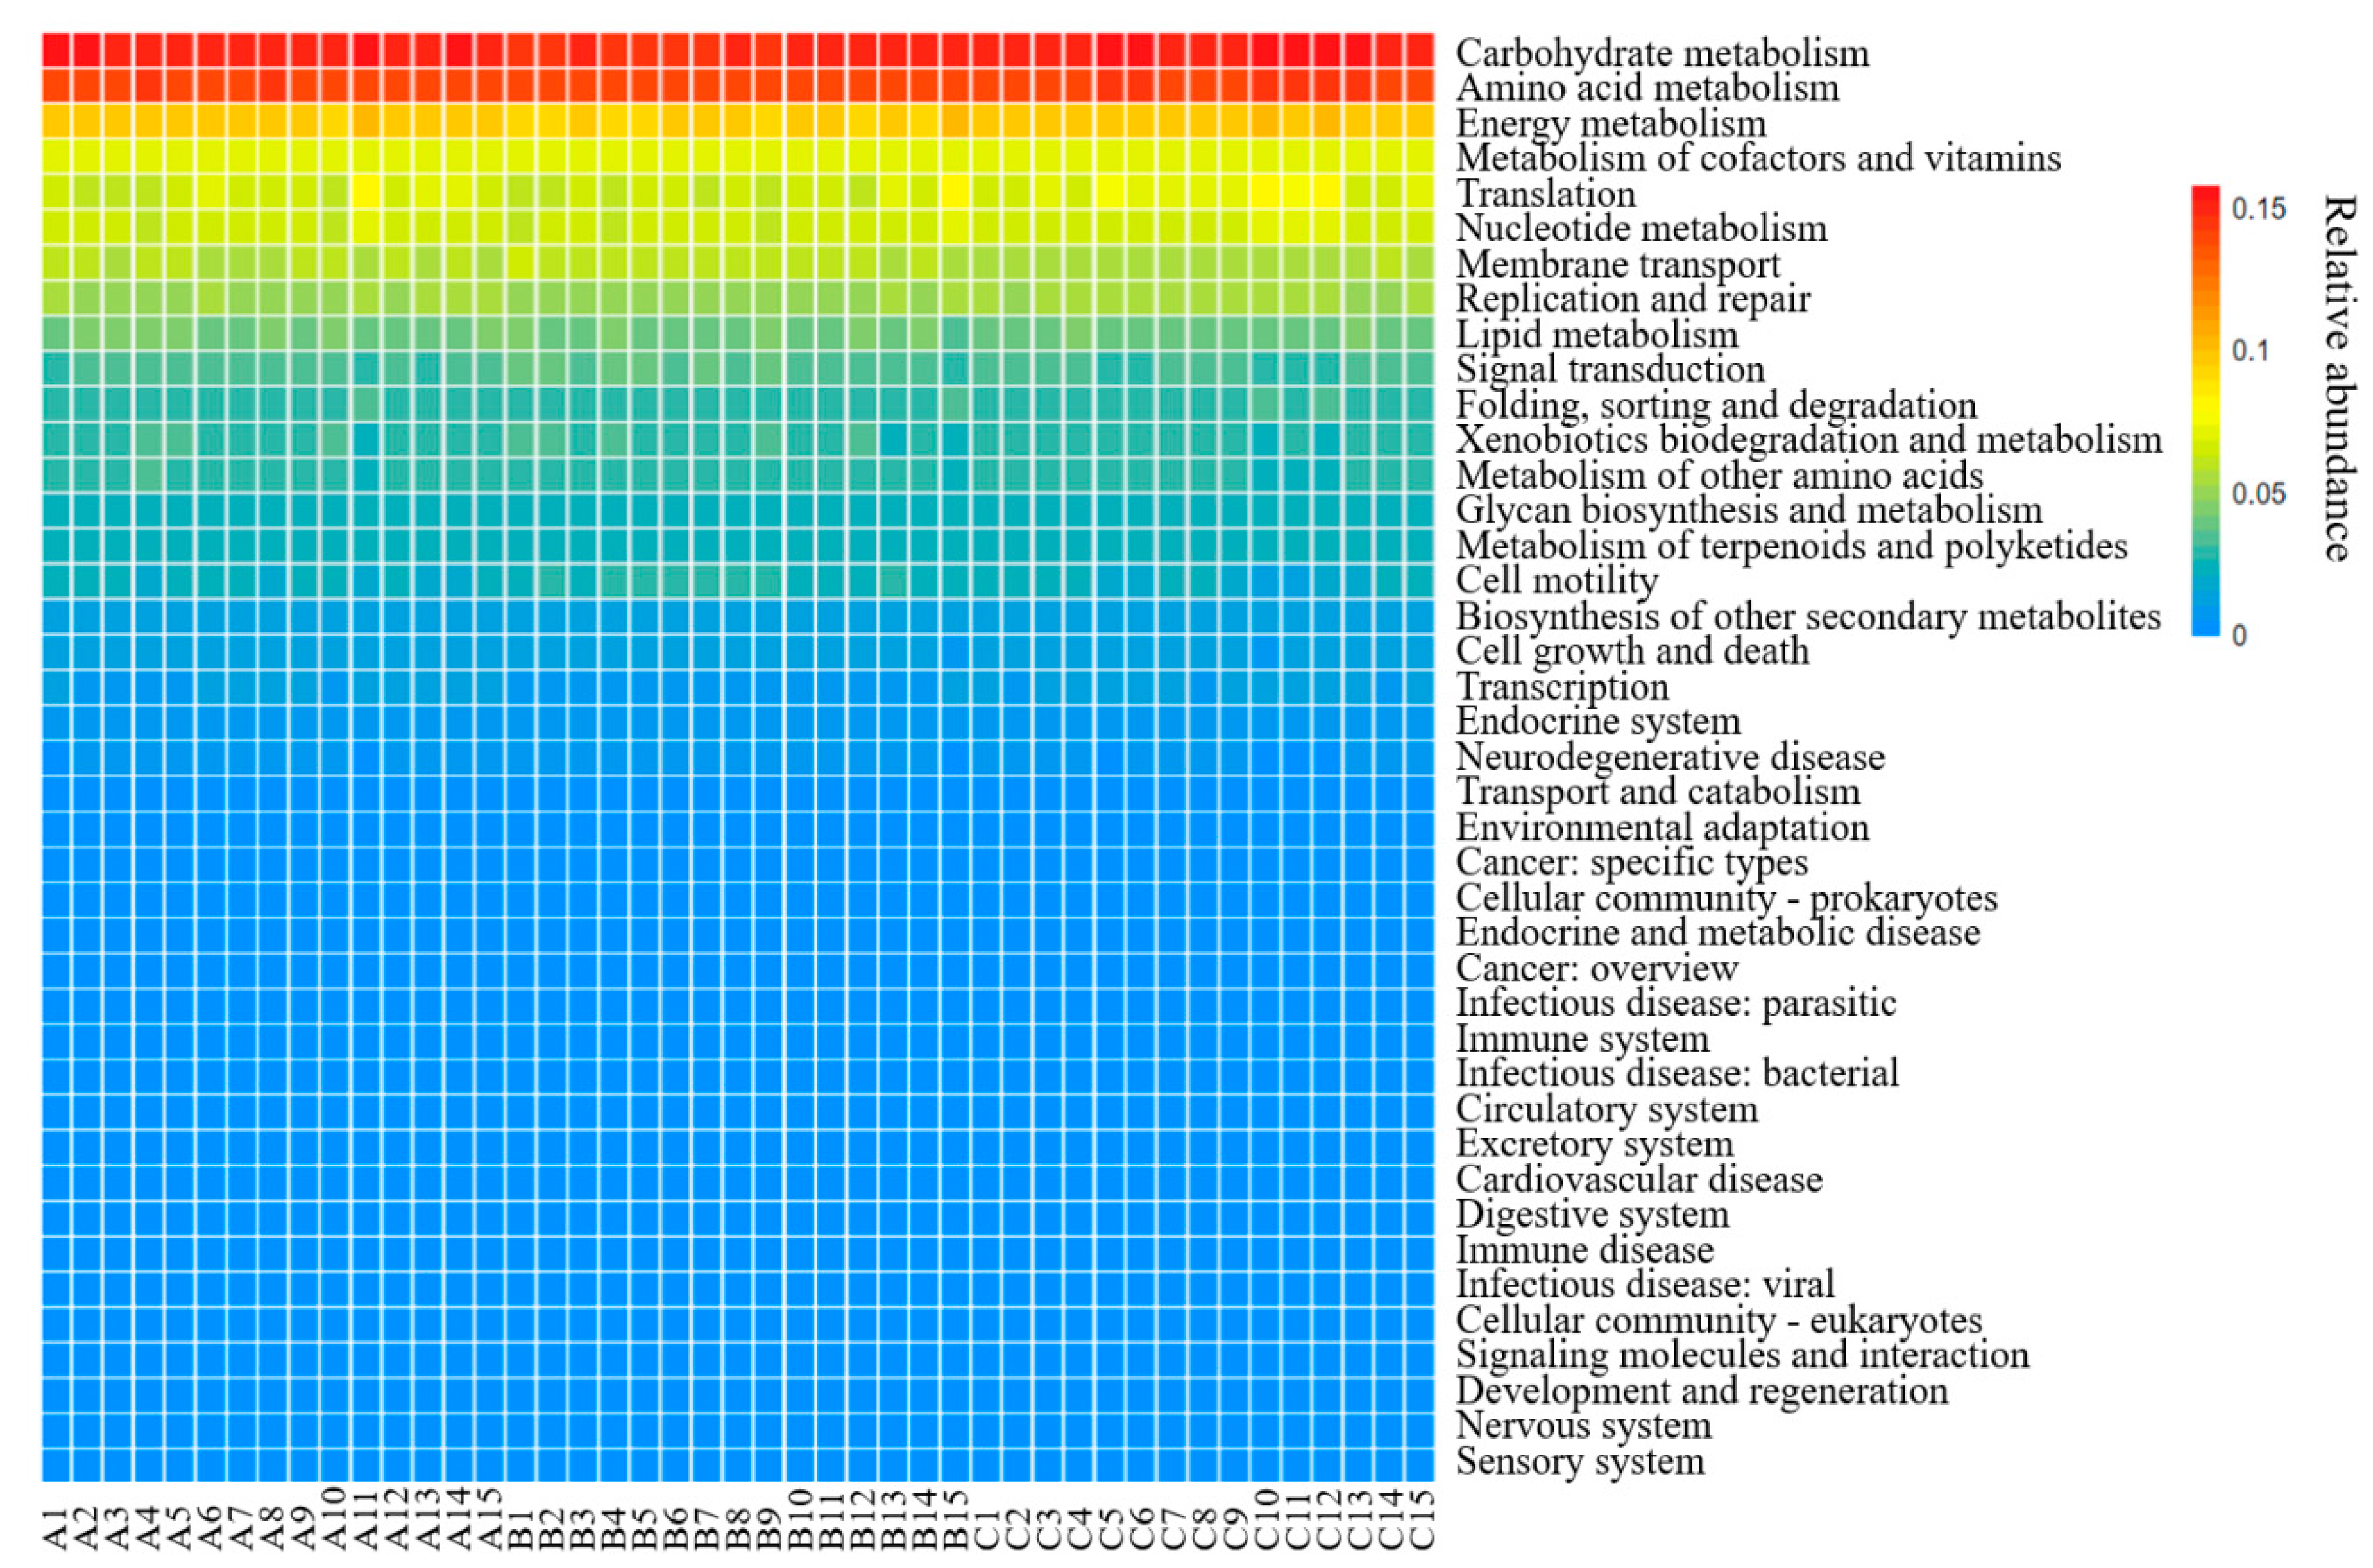
3.7. Functional Analysis from PICRUSt

To determine the function of sediment microbial communities in the source area of the ER-SNWDP, PICRUSt was employed for analysis in this study. The results based on the KEGG database indicated that the metabolic pathways were mainly divided into six categories, including metabolism (68.32%), genetic information processing (15.90%), environmental information processing (9.15%), cellular processes (4.04%), organizational systems (1.16%), and human diseases (1.43%). The relative abundance of major metabolic pathways was depicted through a heat map (Figure 7). Among the 41 pathways detected, carbohydrate metabolism, amino acid metabolism, energy metabolism, cofactor and vitamin metabolism, and translation were the most predominant groups. These pathways were present in all samples, with an average abundance exceeding 1%.

4. Discussion

Plentiful rainfall, floods in summer, water scarcity, and droughts in winter were the typical characteristics of the basic water regime in China, which led to the uneven spatial and temporal distribution of water resources. To mitigate water shortages, numerous WDPs including ER-SNWDP, have been implemented nationwide. The operation of these WDPs inevitably impacts the ecosystems of their source areas in various ways. Microbial communities play a crucial role in maintaining ecological balance within river ecosystems [11]. Therefore, this study showed a comprehensive investigation of the distribution and assembly patterns of microbial communities in the WDRs in the source area of ER-SNWDP.
The microbial communities in the sediment in the WDRs of the source area of ERSNWDP are mainly composed of Proteobacteria, Chloroflexi, Acidobacteriota, Bacteroidota, Nitrospirota, and Desulfobacterota at the phylum level. These phyla are common in inland rivers and are usually the dominant bacterial species in natural river sediments [2]. Proteobacteria was the most prevalent phylum detected, showing the highest relative abundance in the normal period. This phylum is functionally diverse and widely involved in biogeochemical processes such as carbon, nitrogen, and sulfur cycling in sediments [20]. Its functional versatility enables Proteobacteria to adapt to different hydrological conditions, allowing it to maintain high abundance in various environments. The relatively stable hydrological conditions in the normal period may have provided a more favorable environment for Proteobacteria, allowing it to dominate the community structure. Chloroflexi was the second dominant phylum, with higher levels in the dry and wet periods than in the normal period. Chloroflexi is a photoautotrophic bacterium mainly involved in biological denitrification, organic pollutant degradation and transformation, and sediment nitrogen and sulfur cycling [21]. Their preference for nutrient-rich environments might suggest higher nutrient levels in the sediments in the dry and wet periods [22]. Desulfobacterota was abundant during the normal period but showed a relatively lower proportion in the other two periods. Members of Desulfobacterota can metabolize sulfides into sulfates, indicating higher sulfide concentrations during the normal period, which likely created a favorable environment for their growth. The stable hydrological conditions in this period may have facilitated sulfide accumulation in the sediments, supporting Desulfobacterota proliferation. This also suggests a more active sulfur biogeochemical cycle during the normal period. [23]. Thermodesulfovibrionia, Anaerolineaceae, and Steroidobacteraceae were the most abundant genera detected in the study at the genus level. Thermodesulfovibrionia, a genus within Proteobacteria, is active in the sulfur cycle and is known for its dissimilatory sulfate reduction capabilities. The abundant Thermodesulfovibrionia in the WDRs in the source area of the WDPs might also be related to the sulfide concentrations in this area. The stable presence of Thermodesulfovibrionia across all sampling periods indicates that sulfate reduction remains a continuous and essential process regardless of hydrological fluctuations. Thermodesulfovibrionia showed the highest relative abundance during the wet period and the lowest during the dry period, suggesting its strong adaptability to fluctuating hydrological conditions. During the wet period, enhanced water flow may promote the resuspension of sulfide-rich sediments, increasing sulfide availability and supporting Thermodesulfovibrionia proliferation. Anaerolineaceae, part of the Chloroflexi phylum, is a facultative anaerobic bacterium that degrades various organic compounds such as amino acids and lipids found in domestic wastewater and agricultural pollution [24]. Its presence in the sediment might indicate a high nutrient level in the region, which boosts bacterial cycling and oxygen consumption, aiding their proliferation and survival. Steroidrobacteraceae is usually the dominant genus of bacteria in activated sludge with a certain degree of denitrification ability [25]. Its abundance might further suggest a potential presence of specific pollutants in the study area.
The dynamic water conditions induced by water diversion across different periods may play a crucial role in shaping microbial ecology by altering hydraulic dynamics and water quality parameters in WDRs. Fluctuations in water volumes and flow rates brought by the operation of WDPs also contribute to alterations in the water body’s physical and chemical properties, such as DO, nutrient concentrations, organic matter content, and temperature [13]. Shifts in the hydraulic and physicochemical conditions in different water periods could be pivotal in controlling the microbial communities in river ecosystems [26]. Microbial diversity is considered a key indicator of ecosystem stability in rivers [27]. Results showed that the diversity of microbial communities was the highest during the wet period of all sampling sites. Zhang et al. (2019) also found a higher microbial diversity in rivers flowing into Chaohu Lake during the wet period compared to that in the dry period [28]. Hydrological factors, such as temperature variability and water level fluctuations, are known to influence microbial diversity [11]. During the wet period, the rainfall and high river flow could probably cause disturbance of the river water and surface sediment, promoting the fusion of bacteria in the water and sediment [14]. The PCoA analysis also exhibited a temporal variation of the microbial communities in WDRs in different water periods. Samples collected during the normal period displayed a pronounced clustering, while those from the dry and wet periods exhibited varying degrees of intersection. This observation was further substantiated by the NMDS analysis. Furthermore, different microbial communities showed differential distribution characteristics in different water periods. Chloroflexi, Firmicutes, Cyanobacteria, Anaerolineaceae, and Chloroplast are more susceptible to changes in water conditions in different water periods. The relative abundance of Chloroflexi was much higher during the dry (11.75%) and wet periods (14.64%), contrasting sharply with a mere 3.75% in the normal period. Cyanobacteria seemed to be more adaptable to the environment of the dry period, showing the highest abundance in this period but the lowest in the wet period. It is suggested that a mild hydraulic condition with low water flow and velocity may favor the proliferation of Cyanobacteria. This could be due to enhanced hydrodynamics, sediment dilution, and changes in light conditions in the wet period, which may inhibit the growth of Cyanobacteria. In contrast, Cyanobacteria is highly adaptable to low nutrient conditions, and its relatively high abundance during the dry period reflects the positive effect of nutrient accumulation in the water during this time. It is also confirmed by the study in the Amazon River, which indicated that one of the main reasons for the decrease in blue-green algae abundance is the increased flow in the river [29,30]. The abundance variation patterns of Chloroplasts are similar to Cyanobacteria, with a higher relative abundance during the dry period (2.3%) compared to less than 1% in the normal and wet periods. This disparity may be attributed to the reduced water volume and ample sunlight in the dry period, which promotes aquatic plant growth and may favor Chloroplast distribution [31]. Conversely, Anaerolineaceae showed a pronounced presence in the wet period (4%) but was substantially lower (0.6%) during the normal period. This genus has demonstrated adaptability to sediment environments post-water diversion, thriving in both anaerobic and aerobic conditions, and could respond to environmental alterations brought about by water diversion [32]. Despite changes in microbial ecology in WDRs under different water periods with different water conditions observed in this study, the mechanisms of changing water conditions on the microbial communities remain unclear. More extensive studies on the impact mechanism of hydraulic factors (such as flow rate, flow direction, and flow volume.) coupling physicochemical factors on microbial communities in WDRs are needed for further investigation.
The complexity and correlation of microbial networks in different water periods were exhibited by the co-occurrence network analysis. Proteobacteria, Acidobacteria, Chloroflexi, Bacteroidota, and Nitrospirota were identified as the most dominant keystone species in the network diagram. The co-occurrence network patterns of microbial communities varied among different water periods. The microbial co-occurrence network in the dry period is the most complex, as indicated by the network density of microbes. During the dry period, the microbial network displayed clear modularity, with microbial OTUs showing the strongest interconnections. Most of the correlations were positive correlations, and it was greater than the negative correlation in all periods, indicating that the network probably mainly existed in symbiotic models characterized by mutual benefit and symbiosis. Species that tend to have symbiotic relationships in the community would gradually occupy the dominant position, causing changes in the structure of microbial communities [33]. This relationship could also contribute to the maintenance of the stability and functional diversity of ecosystems. The highest ratio of negative correlations in the wet period suggested the most intense antagonistic relationships, such as competition, existed compared to other periods.
The ecological processes governing microbial community assembly in WDRs in the source area of ER-SNWDP were determined by assessing the contributions of spatial turnover or nestedness to the β-diversity patterns and the evaluation of stochastic processes by NCM. The causes of the disparities in the processes promoting biodiversity may be explained by the changes in the redox state, nutritional composition, and electron acceptors, which could lead to nestedness and the spatial turnover of species assemblages of microbial communities. Nestedness leads to variances in species richness between communities, stemming from a nonrandom process of species loss, while spatial turnover involves the replacement of species across different communities [15]. In this study, both processes contributed to the formation of the microbial community assembly, especially the spatial turnover of species, which refers to the replacement of species and is caused by historical and geographical constraints as well as environmental factors. Results showed that the microbial community assemblies and different water periods in the source area of ER-SNWDP were all mainly shaped by the spatial turnover of species, suggesting that microbial communities benefited more from species replacement across regions. Microbial community assemblages in this typical area in different water periods were well described by a neutral-based model, indicating that stochastic processes explained a large fraction of the variation in shaping microbial community assembly. Varied Nm-value and the dispersibility in different water periods indicated a potential effect of water diversion on the dispersion of microbial communities. The better fit of the NCM in normal and wet periods than that in dry periods could probably suggest a stronger impact of stochastic processes on microbial community assemblages in normal and wet periods than that in dry periods. It is concluded that the impact of stochastic processes on microbial community assemblages could be changed with the water conditions in WDRs. To advance the understanding of the ecological processes governing microbial community assembly in WDRs, a series of river ecology theories should be further applied to the analysis. Furthermore, microbial parameters should be incorporated into the river dynamics models and water quality evaluation models to build a comprehensive ecological evaluation system in rivers.

5. Conclusions

WDRs function as specialized waterways and play a pivotal role in optimizing water resource allocation. The ecosystem status of WDRs in the source area of WDPs is basic insurance for the ecological health of rivers and residents’ livelihood. Under the operation of water diversion projects, WDR ecology is constantly affected by external factors, resulting in frequent changes in water quality and hydraulic conditions in different water periods. Microorganisms play a crucial role in river ecosystems and are highly responsive to environmental changes. Frequent environmental changes in WDRs would probably have a considerable impact on the microbial ecology and ultimately affect the ecology of the river. This study investigated the microbial communities in sediments in the source areas of ER-SNWDP during three typical water periods for the first time. A total of 1,997,209 sequence reads were obtained by 16S rRNA gene sequencing. Generally, microbial communities in this area were dominated by Proteobacteria, Chloroflexi, Acidobacteriota, and Bacteroidota. Various microbial communities are more susceptible to changes in water conditions and exhibit distinct distribution characteristics across different water periods, notably Chloroflexi, Firmicutes, Cyanobacteria, Anaerolineaceae, and Chloroplast. During the wet period, microbial communities exhibited the highest richness, biodiversity, and the most intense antagonistic relationships compared to those in the dry and normal water periods. Throughout all periods, the microbial network predominantly existed in symbiotic models characterized by mutual benefit and symbiosis. During the dry period, the microbial co-occurrence network was found to be the most complex, with microbial OTUs showing the closest interconnections. The functional analysis determined carbohydrate metabolism, amino acid metabolism, energy metabolism, cofactor and vitamin metabolism, and translation as the most predominant functions of microbial communities. Microbial communities in this period also showed the highest nestedness-resultant dissimilarity index, followed by those in the normal period and the wet period. Spatial turnover of species and stochastic processes were determined as the dominant mechanisms controlling community diversity, succession, and biogeography in the WDRs in the source area of ER-SNWDP. A more pronounced impact of stochastic processes on microbial community assemblages was observed during normal or wet periods, as opposed to the dry period. This study could provide a comprehensive understanding of microbial ecology in WDRs under different water periods and is pivotal for the maintenance of river ecological health and the conservation of water resources in WDRs.

Supplementary Materials

The following supporting information can be downloaded at: https://www.mdpi.com/article/10.3390/w17050649/s1, Figure S1: The β-diversity pattern indexes of microbial communities in different water periods; Table S1: Data of longitude and latitude of each sampling point; Table S2: Statistics of the data for sequence reads, OTUs and gene alpha diversity indices among samples; Table S3: β-diversity pattern indexes of microbial communities. (Group A represents samples collected in the dry period, Group B represents samples collected in the normal period, and Group C represents samples collected in the wet period).

Author Contributions

Conceptualization, W.C. and J.W.; Methodology, W.C., X.W. (Xin Wen) and J.W.; Software, X.W. (Xin Wen) and Y.Z.; Validation, Y.Z., X.W. (Xiusen Wu), H.Z. and Z.H.; Investigation, W.C. and J.W.; Data curation, J.C. and Q.Z.; Writing—original draft, W.C., X.W. (Xin Wen) and J.W.; Supervision, W.C. and J.W.; Funding acquisition, W.C. and J.W. All authors have read and agreed to the published version of the manuscript.

Funding

This research was funded by the National Natural Science Foundation of China (Grant No. 51909229), the Natural Science Foundation of the Jiangsu Higher Education Institutions of China (Grant No. 24KJB610020), the Belt and Road Special Foundation of the National Key Laboratory of Water Disaster Prevention (Grant No. 2023nkms04), and the Student Science and Technology Innovation Foundation of Yangzhou University.

Data Availability Statement

The data are available from the corresponding author upon reasonable request.

Conflicts of Interest

We have no financial and personal relationships with other people or organizations that can inappropriately influence our work; there is no professional or other personal interest of any nature or kind in any product, service, and/or company that could be construed as influencing the position presented in the manuscript entitled “Untangling the characteristics and ecological processes of microbial community assembly in the source area of the East Route of the South-to-North Water Diverion Project in China under different water periods”. We declare that the author Qin Zhong was employed by the company Dongzhu Ecological Environmental Protection Co., Ltd., Xihu Middle Road #90, Wuxi 214000, China. The remaining authors declare that the research was conducted in the absence of any commercial or financial relationships that could be construed as a potential conflict of interest.

References

  1. Faraji, H.; Shahryari, A. Estimation of Water Quality Index and Factors Affecting Their Changes in Groundwater Resource and Nitrate and Fluoride Risk Assessment. Water Air Soil Pollut. 2023, 234, 608. [Google Scholar] [CrossRef]
  2. Eliasson, J. The rising pressure of global water shortages. Nature 2015, 517, 6. [Google Scholar] [CrossRef] [PubMed]
  3. Zhao, Z.-Y.; Zuo, J.; Zillante, G. Transformation of water resource management: A case study of the South-to-North Water Diversion project. J. Clean. Prod. 2017, 163, 136–145. [Google Scholar] [CrossRef]
  4. Zhuang, W. Eco-environmental impact of inter-basin water transfer projects: A review. Environ. Sci. Pollut. Res. 2016, 23, 12867–12879. [Google Scholar] [CrossRef]
  5. Davies, B.R.; Thoms, M.; Meador, M. An assessment of the ecological impacts of inter-basin water transfers, and their threats to river basin integrity and conservation. Aquat. Conserv. Mar. Freshw. Ecosyst. 1992, 2, 325–349. [Google Scholar] [CrossRef]
  6. Zhang, S.; Pang, Y.; Xu, H.; Wei, J.; Jiang, S.; Pei, H. Shift of phytoplankton assemblages in a temperate lake located on the eastern route of the South-to-North Water Diversion Project. Environ. Res. 2023, 227, 115805. [Google Scholar] [CrossRef]
  7. Funes, A.; de Vicente, J.; Cruz-Pizarro, L.; Álvarez-Manzaneda, I.; de Vicente, I. Magnetic microparticles as a new tool for lake restoration: A microcosm experiment for evaluating the impact on phosphorus fluxes and sedimentary phosphorus pools. Water Res. 2016, 89, 366–374. [Google Scholar] [CrossRef] [PubMed]
  8. Pusch, M.; Fiebig, D.; Brettar, I.; Eisenmann, H.; Ellis, B.K.; Kaplan, L.A.; Lock, M.A.; Naegeli, M.W.; Traunspurger, W. The role of micro-organisms in the ecological connectivity of running waters. Freshw. Biol. 1998, 40, 453–495. [Google Scholar] [CrossRef]
  9. Mohapatra, M.; Behera, P.; Kim, J.Y.; Rastogi, G. Seasonal and spatial dynamics of bacterioplankton communities in a brackish water coastal lagoon. Sci. Total Environ. 2020, 705, 134729. [Google Scholar] [CrossRef] [PubMed]
  10. Wang, K.; Wang, Z.; Liu, K.; Cheng, L.; Wang, L.; Ye, A. Impacts of the eastern route of the South-to-North Water Diversion Project emergency operation on flooding and drainage in water-receiving areas: An empirical case in China. Nat. Hazards Earth Syst. Sci. 2019, 19, 555–570. [Google Scholar] [CrossRef]
  11. Bagra, K.; Bellanger, X.; Merlin, C.; Singh, G.; Berendonk, T.U.; Klümper, U. Environmental stress increases the invasion success of antimicrobial resistant bacteria in river microbial communities. Sci. Total Environ. 2023, 904, 166661. [Google Scholar] [CrossRef] [PubMed]
  12. Luo, Z.; Li, S.; Hou, K.; Ji, G. Spatial and seasonal bacterioplankton community dynamics in the main channel of the Middle Route of South-to-North Water Diversion Project. Res. Microbiol. 2019, 170, 24–34. [Google Scholar] [CrossRef] [PubMed]
  13. Liu, B.; Guo, F.; Xie, P.; Zhang, W.; Hu, H.; Wu, J.; Yang, Z. Differences in sediment microbial community structure and co-occurrence network in different seasons. J. Soils Sediments 2023, 23, 3539–3549. [Google Scholar] [CrossRef]
  14. Lv, J.; Niu, Y.; Yuan, R.; Wang, S. Different Responses of Bacterial and Archaeal Communities in River Sediments to Water Diversion and Seasonal Changes. Microorganisms 2021, 9, 782. [Google Scholar] [CrossRef] [PubMed]
  15. Qu, J.; Jia, C.; Liu, Q.; Li, Z.; Liu, P.; Yang, M.; Zhao, M.; Li, W.; Zhu, H.; Zhang, Q. Dynamics of Bacterial Community Diversity and Structure in the Terminal Reservoir of the South-To-North Water Diversion Project in China. Water 2018, 10, 709. [Google Scholar] [CrossRef]
  16. Yao, Y.; Wang, P.; Wang, C. The Influence on Contaminant Bioavailability and Microbial Abundance of Lake Hongze by the South-to-North Water Diversion Project. Int. J. Environ. Res. Public Health 2019, 16, 3068. [Google Scholar] [CrossRef] [PubMed]
  17. Liu, Y.; Pan, B.; Zhu, X.; Zhao, X.; Sun, H.; He, H.; Jiang, W. Patterns of microbial communities and their relationships with water quality in a large-scale water transfer system. J. Environ. Manage. 2022, 319, 115678. [Google Scholar] [CrossRef] [PubMed]
  18. Da Costa, C.; Colin, Y.; Debret, M.; Copard, Y.; Gardes, T.; Jacq, K.; Ayrault, S.; Berthe, T. Shifts in sediment bacterial communities reflect changes in depositional environments in a fluviatile context. Sci. Total Environ. 2023, 885, 163890. [Google Scholar] [CrossRef] [PubMed]
  19. Baselga, A. Partitioning the turnover and nestedness components of beta diversity. Glob. Ecol. Biogeogr. 2010, 19, 134–143. [Google Scholar] [CrossRef]
  20. Liu, J.; Sun, X.; Zuo, Y.; Hu, Q.; He, X. Plant species shape the bacterial communities on the phyllosphere in a hyper-arid desert. Microbiol. Res. 2023, 269, 127314. [Google Scholar] [CrossRef] [PubMed]
  21. Newton Ryan, J.; Jones Stuart, E.; Eiler, A.; McMahon Katherine, D.; Bertilsson, S. A Guide to the Natural History of Freshwater Lake Bacteria. Microbiol. Mol. Biol. Rev. 2011, 75, 14–49. [Google Scholar] [CrossRef] [PubMed]
  22. Colatriano, D.; Tran, P.Q.; Guéguen, C.; Williams, W.J.; Lovejoy, C.; Walsh, D.A. Genomic evidence for the degradation of terrestrial organic matter by pelagic Arctic Ocean Chloroflexi bacteria. Commun. Biol. 2018, 1, 90. [Google Scholar] [CrossRef] [PubMed]
  23. Roberto, A.A.; Van Gray, J.B.; Leff, L.G. Sediment bacteria in an urban stream: Spatiotemporal patterns in community composition. Water Res. 2018, 134, 353–369. [Google Scholar] [CrossRef] [PubMed]
  24. Kelly, J.J.; Tate Iii, R.L. Effects of Heavy Metal Contamination and Remediation on Soil Microbial Communities in the Vicinity of a Zinc Smelter. J. Environ. Qual. 1998, 27, 609–617. [Google Scholar] [CrossRef]
  25. Abiriga, D.; Jenkins, A.; Klempe, H. Microbial assembly and co-occurrence network in an aquifer under press perturbation. Ann. Microbiol. 2022, 72, 41. [Google Scholar] [CrossRef]
  26. Santos, A.; Rachid, C.; Pacheco, A.B.; Magalhães, V. Biotic and abiotic factors affect microcystin-LR concentrations in water/sediment interface. Microbiol. Res. 2020, 236, 126452. [Google Scholar] [CrossRef] [PubMed]
  27. Meziti, A.; Tsementzi, D.; Rodriguez-R, L.M.; Hatt, J.K.; Karayanni, H.; Kormas, K.A.; Konstantinidis, K.T. Quantifying the changes in genetic diversity within sequence-discrete bacterial populations across a spatial and temporal riverine gradient. ISME J. 2018, 13, 767–779. [Google Scholar] [CrossRef] [PubMed]
  28. Zhang, M.; Wu, Z.; Sun, Q.; Ding, Y.; Ding, Z.; Sun, L. The spatial and seasonal variations of bacterial community structure and influencing factors in river sediments. J. Environ. Manag. 2019, 248, 109293. [Google Scholar] [CrossRef]
  29. Ma, X.; Li, Y.; Niu, L.; Shang, J.; Yang, N. Microbial community structure and denitrification responses to cascade low-head dams and their contribution to eutrophication in urban rivers. Environ. Res. 2023, 221, 115242. [Google Scholar] [CrossRef] [PubMed]
  30. Doherty, M.; Yager, P.L.; Moran, M.A.; Coles, V.J.; Fortunato, C.S.; Krusche, A.V.; Medeiros, P.M.; Payet, J.P.; Richey, J.E.; Satinsky, B.M.; et al. Bacterial Biogeography across the Amazon River-Ocean Continuum. Front. Microbiol. 2017, 8, 882. [Google Scholar] [CrossRef]
  31. Baldassi, A.C.; Balbuena, T.S. The Eucalyptus grandis chloroplast proteome: Seasonal variations in leaf development. PLoS ONE 2022, 17, e0265134. [Google Scholar] [CrossRef] [PubMed]
  32. Lv, J.; Yuan, R.; Wang, S. Water diversion induces more changes in bacterial and archaeal communities of river sediments than seasonality. J. Environ. Manag. 2021, 293, 112876. [Google Scholar] [CrossRef] [PubMed]
  33. Horton, D.J.; Theis, K.R.; Uzarski, D.G.; Learman, D.R. Microbial community structure and microbial networks correspond to nutrient gradients within coastal wetlands of the Laurentian Great Lakes. FEMS Microbiol. Ecol. 2019, 95, fiz033. [Google Scholar] [CrossRef] [PubMed]
Figure 1. Map of the study area and sampling sites.
Water 17 00649 g001
Figure 2. Microbial community composition at phylum level (A1–A15 represent samples collected in the dry period, B1–B15 represent samples collected in the normal period, and C1–C15 represent samples collected in the wet period).
Water 17 00649 g002
Figure 3. Microbial community composition at genus level (A1–A15 represent samples collected in the dry period, B1–B15 represent samples collected in the normal period, and C1–C15 represent samples collected in the wet period).
Water 17 00649 g003
Figure 4. (a) PCoA and (b) NMDS analysis of the microbial communities (red squares represent samples collected in the dry period, blue circles represent samples collected in the normal period, and green triangles represent samples collected in the wet period).
Water 17 00649 g004
Figure 5. Co-occurrence network analysis of microbial communities in different water periods. The co-occurrence network of microbial communities in the dry period (a), normal period (b), and wet period (c).
Water 17 00649 g005
Figure 6. Fit of the neutral community model (NCM) of microbial community assembly. The predicted frequencies of occurrence for all periods, dry period, normal period, and wet period groups representing microbial communities from all periods (a), dry period (b), normal period (c), and wet period (d), respectively. Nm indicates the estimates of the metacommunity size times immigration rate, N demonstrates the metacommunity size, m is the immigration rate, and the coefficient of determination (R2) is the goodness of fit of the neutral model.
Water 17 00649 g006
Figure 7. Relative abundance heatmap of predicted metagenomes using KEGG genes (A1–A15 represent samples collected in the dry period, B1–B15 represent samples collected in the normal period and C1–C15 represent samples collected in the wet period).
Water 17 00649 g007
Table 1. Topological properties of microbial networks in different water periods.
Network FeaturesDry PeriodNormal PeriodWet Period
Total nodes485343650
Todal edges8453231197
Positive correlations808 (95.62%)261 (80.80%)923 (77.11%)
Negative correlations37 (4.38%)62 (19.20%)274 (274)
Average clustering coefficient (avgCC)0.2980.2840.303
Average degree (avgK)3.481.8833.683
Average path distance (GD)6.6917.9275.547
Density0.0070.0060.006
Disclaimer/Publisher’s Note: The statements, opinions and data contained in all publications are solely those of the individual author(s) and contributor(s) and not of MDPI and/or the editor(s). MDPI and/or the editor(s) disclaim responsibility for any injury to people or property resulting from any ideas, methods, instructions or products referred to in the content.

