Article

Analysis of Carbon Density Distribution Characteristics in Urban Wetland Ecosystems: A Case Study of Shanghai Fish and Dishui Lake

1
School of Design, Shanghai Jiao Tong University, Shanghai 200240, China
2
Yanjiang District Natural Resources and Planning Bureau, Ziyang 641399, China
*
Author to whom correspondence should be addressed.
Water 2025, 17(5), 650; https://doi.org/10.3390/w17050650
Submission received: 27 December 2024 / Revised: 7 February 2025 / Accepted: 22 February 2025 / Published: 23 February 2025
(This article belongs to the Special Issue Agricultural Water-Land-Plant System Engineering)

Abstract

:
This paper examines two major artificial wetlands in Shanghai—Shanghai Fish and Dishui Lake—as case studies to explore the biomass, carbon content, carbon density, and carbon sequestration functions of wetland plants in urban ecosystems. Through field sampling and elemental analysis of 20 common wetland plant species, this study investigated the differences in aboveground and underground biomass and carbon storage capacity across different plant types. The results indicated that emergent plants have the highest carbon storage capacities, with species such as Cyperus involucratus, Arundo donax, Phragmites australis, and Nelumbo sp. exhibiting higher carbon densities, while floating plants demonstrated relatively weaker carbon storage capacity. The carbon content varied significantly between different parts and species of plants, while soil carbon density was much higher than that of the plant portions, highlighting the crucial role of soil in wetland carbon sequestration. Additionally, an inversion model for wetland plant carbon density was established, and remote sensing data were used to assess the vegetation distribution characteristics and carbon density variations in the two artificial wetlands. This distribution pattern reflects the influence of wetland vegetation and water level (which affect water availability and nutrient distribution) on carbon density. The results showed a significant increase in carbon density from 2018 to 2023, particularly in lakeshore areas, suggesting that wetland ecological restoration and management measures have achieved positive outcomes, including a measurable increase in carbon density and enhanced vegetation coverage. The findings are significant for understanding and enhancing the carbon sequestration potential of artificial wetlands in urban ecosystems.

1. Introduction

Global climate change is considered one of the most severe environmental challenges of the 21st century, primarily driven by the continuous rise in atmospheric greenhouse gases, especially carbon dioxide. In response, countries have established various agreements over the past three decades to mitigate emissions. China aims to peak in carbon emissions by 2030 and achieve carbon neutrality by 2060, with carbon stocks playing a crucial role in offsetting residual emissions. Shanghai has set a target to become a “low-carbon” and “zero-carbon” city, emphasizing ecological priority and green, low-carbon development to achieve carbon neutrality by 2060 and position itself as a “world-class wetland city” and a globally recognized “eco-city” by 2035 [1].
Wetlands, including urban artificial wetlands, are among the most important ecosystems for carbon storage, sequestering significant amounts of organic carbon due to their high productivity and capacity to accumulate organic matter in anaerobic soil conditions [2]. Despite covering only 6–8% of the earth’s freshwater surface, wetlands store approximately one-third of global organic soil carbon [3]. Artificial wetlands, such as those in Shanghai, are vital for their ecosystem services, including carbon sequestration, water management, and biodiversity conservation [4]. However, rapid urbanization has led to significant wetland loss and fragmentation, necessitating efforts to improve their ecological carbon sequestration capacity.
Artificial wetlands are actively constructed or modified ecosystems designed to provide specific services, such as flood control and carbon sequestration. In Shanghai, Dishui Lake and Shanghai Fish are two major artificial lakes that serve as crucial urban carbon stocks. Wetland plants, including emergent, submerged, and floating species, play a central role in carbon assimilation and storage through photosynthesis and root biomass accumulation [5]. Recent research on wetland carbon stocks has demonstrated that management of water levels and vegetation patterns significantly influences carbon sequestration [6,7].
Overall, existing studies mainly investigate the carbon sequestration capacity of wetland plants at three scales: individual, community, and ecosystem.
At the individual scale, research involves comparing the carbon absorption capacity of wetland plants and their different organs. Research found that the average organic carbon content in the living parts and dead matter across seasons was as follows: Phragmites australis, followed by Spartina alterniflora, and Scirpus mariqueter [8]. Lolu et al. researched the carbon sequestration efficiency of twelve abundant macrophytes, indicating that the carbon content in aboveground components was higher than that in underground components [9]. Pal et al. [5] investigated the seasonal variation in the carbon sequestration efficiency of twelve dominant wetland macrophytes. Their results revealed notable differences in the carbon content of the roots, stems, and leaves of the 12 macrophytes.
Community-scale studies typically estimate vegetation carbon storage in a given area. Mei and Zhang found that the carbon storage of Phragmites australis wetlands in the Yangtze River Estuary was relatively high, with an annual carbon storage rate of 1.11 to 2.41 kg/(m2·annum), significantly exceeding both national and global averages [10]. Wang et al. studied the carbon sequestration capacity of Phragmites australis, Scirpus triqueter, and Spartina alterniflora communities in Chongming Island, estimating an annual CO2 fixation of 2.67 kg/m2 [11]. Xu and Xu reported that the total carbon density of Guangzhou’s wetlands in 2013 was 1.50 kg/m2 [12]. Yu et al. found a declining trend in carbon storage of wetland vegetation in Nansi Lake over the past two decades [13].
Ecosystem-scale research builds on community studies, expanding to include both plant and soil carbon stocks. Zhang et al. explored carbon storage and influencing factors in mangrove wetlands [14]. Euliss Jr. et al. estimated that North American prairie wetlands could sequester 2.36 kg/m2 of organic carbon within ten years [15]. Byun et al. assessed carbon storage in South Korean coastal wetlands, with salt marshes and mudflats storing 14.6–25.5 kgC/m2 and 18.2–28.6 kgC/m2, respectively [16]. Bernal and Mitsch compared carbon stocks across wetland types, finding that depressional wetland communities sequestered more carbon annually than riverine wetland communities, with the swamp oak forest wetland community having the highest sequestration rate [17].
Additionally, Qian et al. found that Zhongxiasha shoal in the Jiuduansha Wetland of the Yangtze River Estuary had the highest carbon accumulation, with the Phragmites australis community outperforming other vegetation [18]. Based on this literature review, carbon density data for common wetland plants in Shanghai are shown in Table 1 [8,10,11,13,19].
The quantification methods for individual carbon stocks of wetland plants mainly included elemental analysis, CO2 flux measurement, volumetric, and allometric equation methods. Liu et al. and Lolu et al. used elemental analysis to measure the carbon content in different parts of various wetland plants [8,9]. Xu et al. used the CO2 flux measurement method to study CO2 flux changes in three wetland plants in the Haizhu Lake Wetland of Guangzhou, finding that carbon fixation ability ranked as Canna indica > Hygrophila salicifolia > Colocasia esculenta [20]. Doughty et al. applied the allometric equation method to measure the carbon content of mangroves in the salt marsh–mangrove ecotone of Florida [21].
Quantitative methods for wetland plant community carbon stocks also include plot survey and remote sensing estimation. Wang et al. used plot surveys to study the carbon sequestration dynamics of coastal wetland plant communities on Chongming Island [11]. Mei et al. investigated the biomass and carbon sequestration capacity of Phragmites australis wetlands in Chongming Dongtan [10]. Xu et al. used remote sensing to estimate the total biomass of wetland vegetation in Guangzhou in 2013 [12]. Wu et al. combined plot surveys and remote sensing techniques to assess submerged plant biomass, but the correlation was low [22]. Yu used plot surveys and remote sensing to analyze the carbon stock of vegetation in Nansi Lake and its driving factors [13].
In addition to the aforementioned methods, the measurement of carbon sequestration in wetland ecosystems also includes methods for assessing soil carbon sequestration. The main methods currently used are direct measurement, ecological type, soil type, and soil modeling methods [14]. Euliss Jr. et al. estimated the carbon storage of North American prairie wetlands using direct measurement and soil modeling methods and found that their carbon sequestration potential was much higher than other wetland types [15]. Villa and Mitsch studied wetlands in Florida and found that communities with the longest flooding duration had the highest soil carbon sequestration rates [23]. Byun et al., using sample survey and direct measurement methods, assessed the carbon storage of five coastal wetlands in Korea, including vegetation and soil [16]. Mueller et al. evaluated the long-term carbon sequestration potential of salt marshes in the Wadden Sea, emphasizing the importance of deep sampling to avoid overestimating sequestration capacity [24].
In summary, current research mainly focuses on natural wetlands, with limited attention to artificial wetlands, especially small-scale ones, leading to an incomplete understanding of their carbon storage and sequestration potential. Additionally, due to GPS accuracy and remote sensing resolution limitations, small artificial wetlands are often overlooked, and field survey data remain insufficient. Existing studies mostly assess carbon storage at specific points in time, failing to reflect the dynamic processes of biomass accumulation and carbon cycling. This study focuses on Shanghai Fish and Dishui Lake, conducting field surveys and remote sensing to analyze the spatial distribution of carbon density in wetland plants, as well as the changes in carbon sequestration patterns and influencing factors. Shanghai Fish wetland features a unique design and diverse plant structures, providing essential recreational space for urban residents and serving as an ideal case for carbon stock research. Dishui Lake, as Shanghai’s largest artificial lake, plays a critical role in water conservation and carbon sequestration. The main objective of this study is to explore the spatial distribution characteristics of vegetation and carbon density in two typical artificial wetlands, analyze the temporal changes in their carbon sequestration patterns from the initial construction phase to the present, and identify spatial differences in their carbon sequestration functions. By comparing the research results with studies of natural wetlands and other artificial wetlands, this study aims to reveal the spatial distribution characteristics of carbon density in wetland plants and the reasons for these significant heterogeneities. This will provide scientific recommendations for optimizing wetland plant structures and management, ultimately enhancing the carbon sequestration function of urban wetlands.

2. Materials and Methods

2.1. Research Area

Shanghai is located in Eastern China, adjacent to the Pacific Ocean, and is part of the Yangtze River Delta in the eastern part of the Asian continent. Its geographical coordinates range from 120°52′ E to 122°12′ E and 30°40′ N to 31°53′ N, with rich wetland resources. The total wetland area in Shanghai is 468,565 hectare/ha (wetlands with an area of 8 ha or more), of which natural wetlands (lakeshore and inland wetlands) account for 409,308 ha, making up 87.35% of the total wetland area, while artificial wetlands cover 59,257 ha, accounting for 12.65% of the total wetland area [1].
The research area consists of two artificial lakes in Shanghai: Shanghai Fish (121°42′32″ E, 31°2′26″ N) and Dishui Lake (121°55′50″ E, 30°53′32″ N), which are typical artificial wetlands. Diverse wetland plants are cultivated within Shanghai Fish and Dishui Lake, such as Pontederia cordata, Phragmites australis, and Typha angustifolia. These plants provide crucial ecosystem services, including water purification and biodiversity maintenance. As important tourist attractions in Shanghai, Shanghai Fish and Dishui Lake have significant demonstration effects and social influence.

2.2. Research Methods

2.2.1. Field Survey Method

A field survey was conducted in late September 2023. Sample plots of 1 m × 1 m were established based on the principles of representativeness of plant species, uniformity of distribution, suitability for remote sensing data, and field investigation feasibility [12]. A total of 30 sample plots were established in each of the two study areas, with an even distribution across different vegetation types to ensure representativeness. Soil samples were taken using a soil sampler from each plot at a depth of 0–20 cm, excluding visible root material, to focus on soil carbon content. The samples were dried and analyzed to measure soil organic carbon content and density. Root contributions to underground carbon density were calculated separately based on biomass measurements. Each sample was analyzed in triplicate to ensure reliability, and the average value was used for subsequent calculations. The plant density within each plot was recorded, and the collected samples were representative, ensuring completeness (including aboveground and underground parts as well as soil). The center point of each sample plot was located, and the coordinate data were entered into ArcMap 10.7 to generate a distribution map of the sampling points.

2.2.2. Direct Measurement Method

The soil sample volume was determined using a soil core sampler with a known internal diameter and height, allowing for precise calculation of the sample’s cylindrical volume. Soil samples were dried at a constant temperature of 105 °C until reaching a stable weight to calculate soil bulk density and soil carbon density. Soil bulk density is defined as the ratio of the dry weight of the soil to the volume of the soil sample. Soil carbon density is obtained by multiplying the soil carbon content, soil bulk density, and sample depth [8,16].

2.2.3. Elemental Analysis Method

After drying and grinding, the carbon content of each sample was measured using a CHN (carbon–hydrogen–nitrogen) elemental analyzer (e.g., Elementar Vario Cube/Flash Smart, Germany) [11]. To ensure reliability, measurements were conducted in triplicate, and the average value was used for further calculations, conducted in triplicate for reliability.

2.2.4. Remote Sensing Data Acquisition and Inversion

The remote sensing data for the two wetlands, Shanghai Fish and Dishui Lake, were sourced from terrestrial observation satellite data services (https://data.cresda.cn (accessed on 4 September 2018)) and Geovis Earth Today Imagery (https://daily.geovisearth.com (accessed on 5 August 2018)) for 2018, with resolutions of 0.8 m and 0.9 m, respectively. The 2023 remote sensing data were obtained using DJI Mavic 3M drones, with a resolution of 0.03 m. Remote sensing image preprocessing involves correcting systematic errors and calibrating remotely sensed imagery to ensure consistent and comparable data.
Image preprocessing involves steps such as radiometric calibration, atmospheric correction, geometric correction, image fusion, mosaic, and clipping, all of which are essential for correcting sensor-related biases and environmental interferences to enhance data quality and feature expression. Radiometric calibration adjusts sensor-recorded radiometric values to real-world reflectance, enabling comparisons across different dates and sensors. Atmospheric correction mitigates the effects of scattering and absorption, while geometric correction addresses spatial distortions and aligns images with true geographical coordinates for accurate temporal comparisons [25,26]. Image fusion and mosaic integrate images with varying spatial resolutions or spectral bands to improve feature identification, and clipping focuses the analysis on the study area by excluding irrelevant data [25,26].
Using the vegetation indices derived from remote sensing images and the measured data of wetland plant carbon storage, models were established to estimate wetland plant carbon storage using the Normalized Difference Vegetation Index (NDVI) and Ratio Vegetation Index (RVI) [27]. Based on the carbon density values of wetland plants and the corresponding RVI of the sample plots, correlation analysis and model building were conducted using SPSS 22 and Excel 8.0. The established carbon density inversion model was used to calculate the carbon density values of the study area, and a carbon density distribution map was created in ArcMap 10.7 to analyze the carbon storage patterns and their changes.

3. Results and Discussion

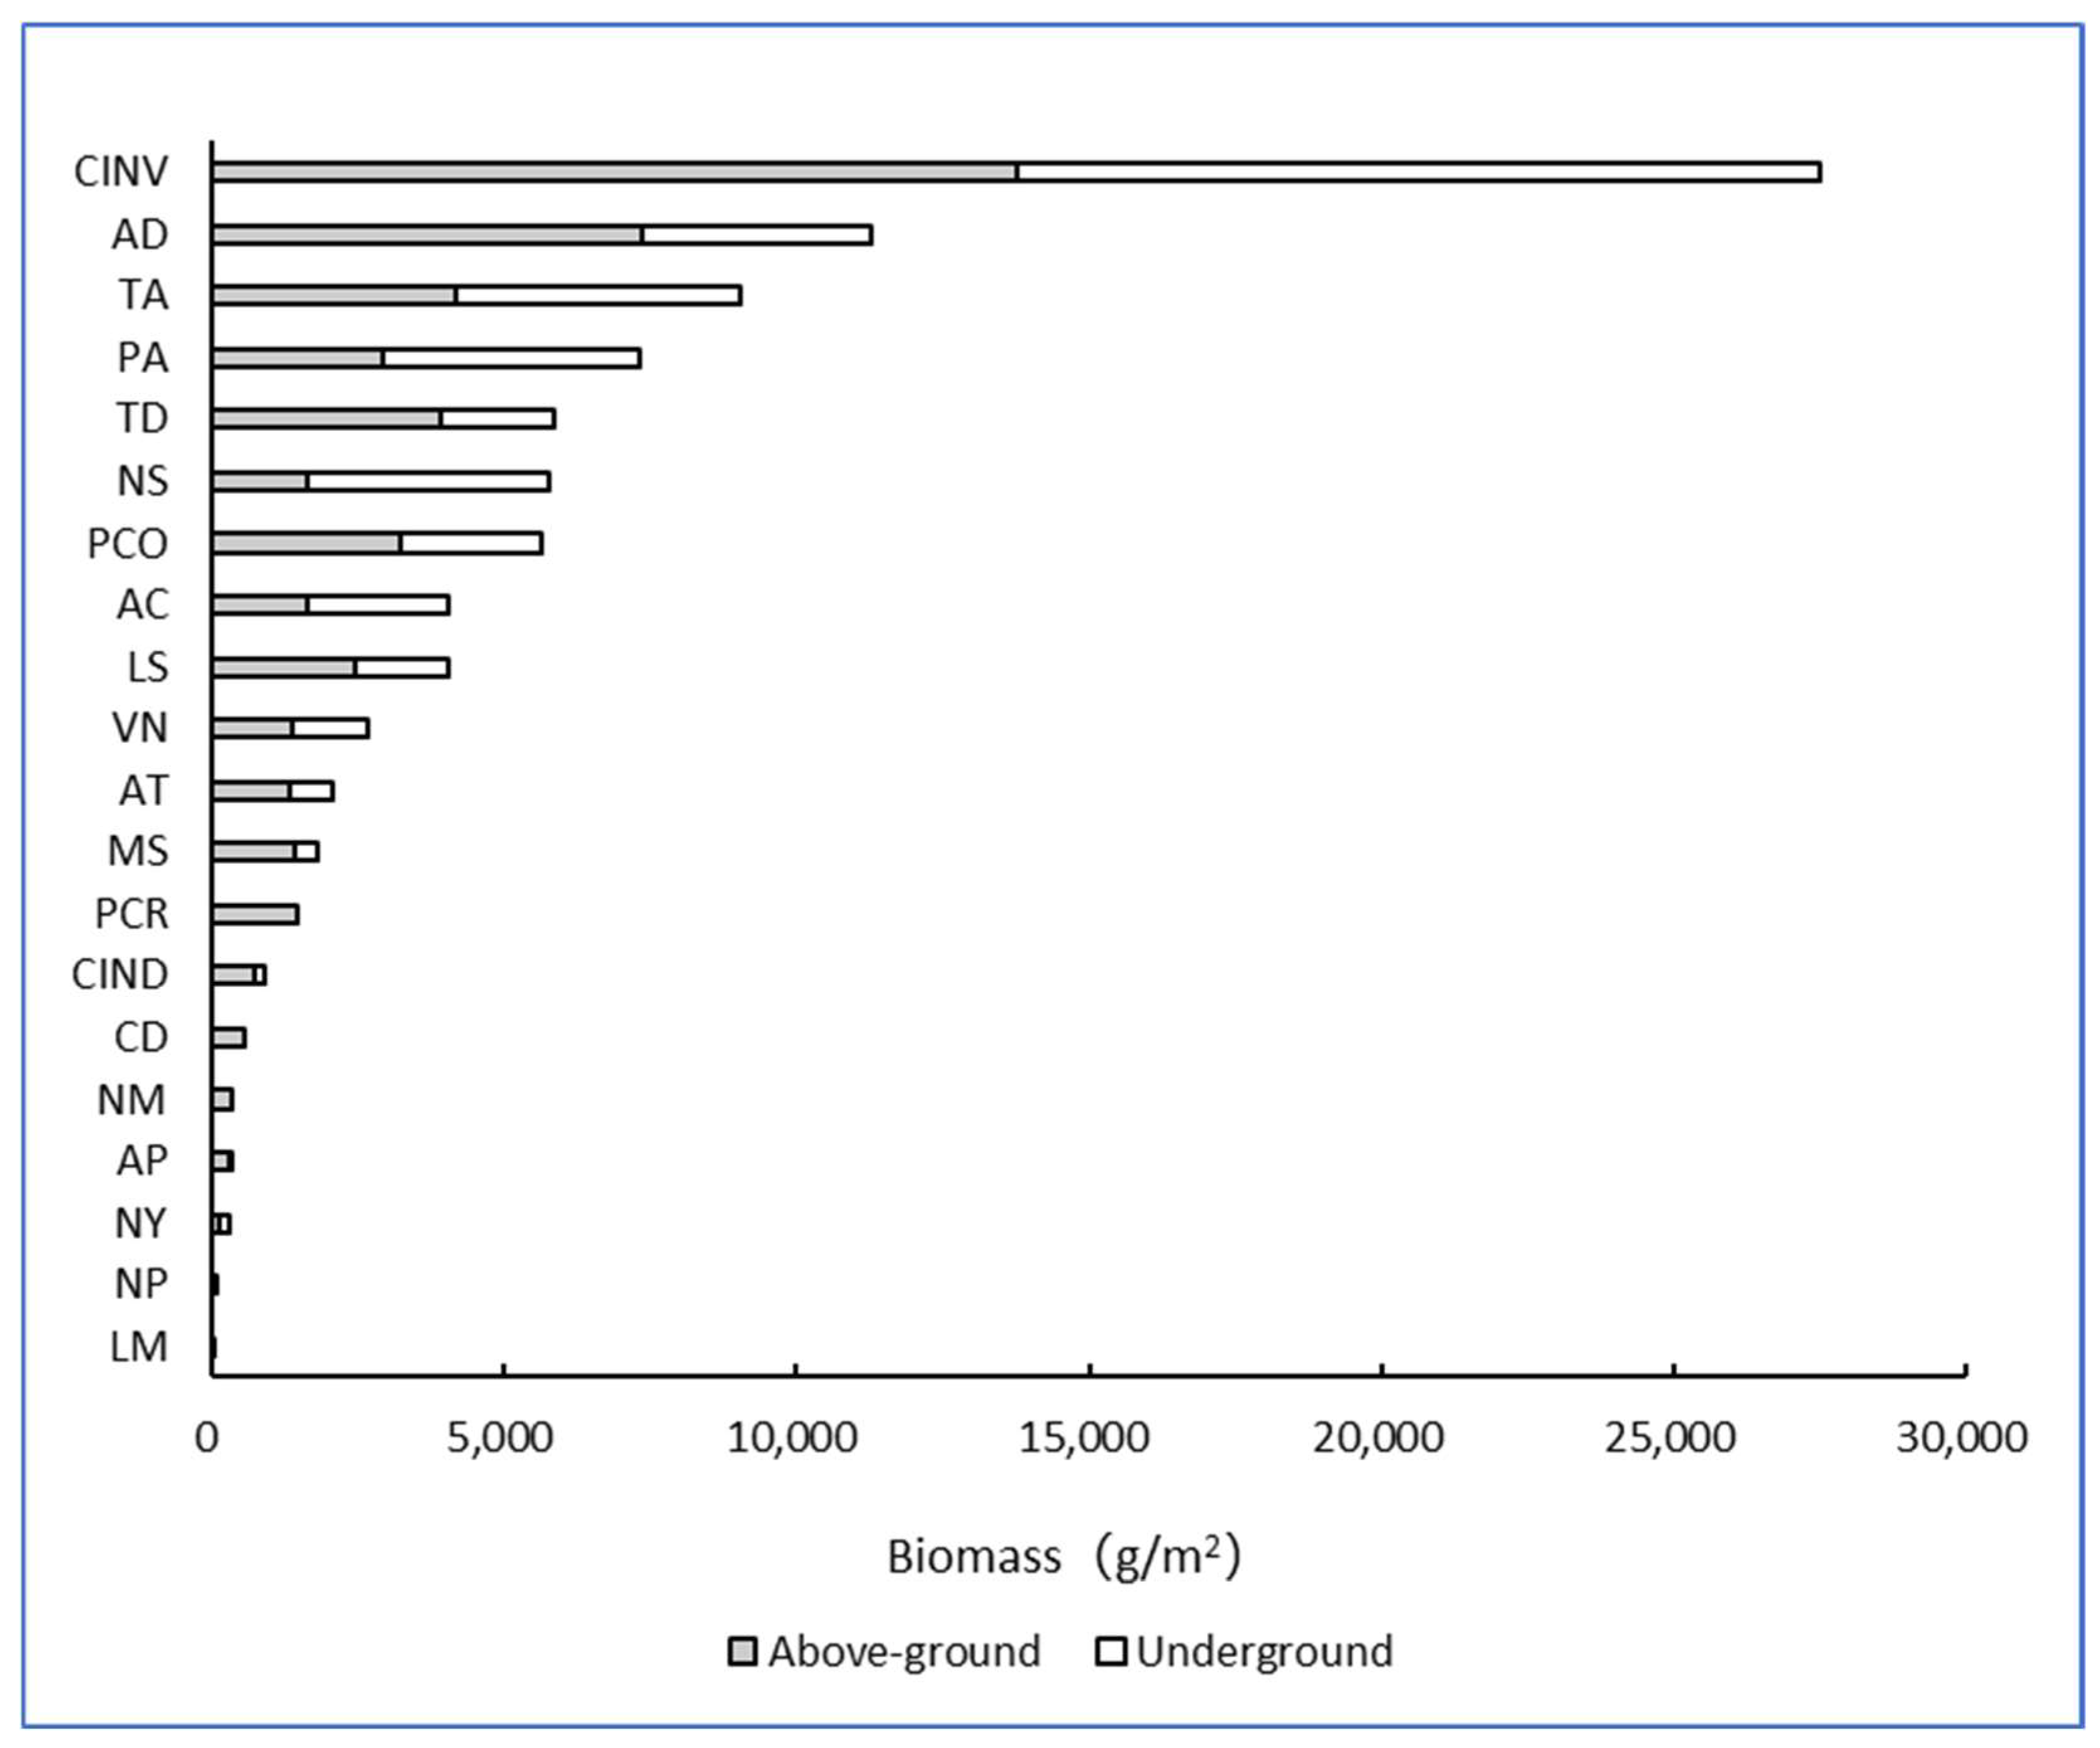
3.1. Biomass of Common Wetland Plants in Shanghai

Based on field sampling and testing involving weighing dried plant samples to calculate aboveground and underground biomass in grams per square meter (g/m2), there is a significant difference between the aboveground and underground biomass among the 20 common wetland plant species in Shanghai (Figure 1). Cyperus involucratus has the highest aboveground biomass, reaching 13,750 g/m2, while Lemna minor has the lowest aboveground biomass, with only 14.8 g/m2. For floating plants such as Lemna minor, ‘aboveground biomass’ refers to the visible plant body on the water surface, while ‘belowground biomass’ represents any submerged or root-like structures anchoring to debris or other plants. The plant with the largest underground biomass is also Cyperus involucratus, reaching 13,750 g/m2, whereas Alternanthera philoxeroides has the lowest underground biomass, with only 24.5 g/m2. These differences indicate that different wetland plants allocate biomass to different parts of the plant according to their ecological strategies and adaptability.
In terms of total biomass, the differences among the plants are also highly significant (Figure 1). Cyperus involucratus has a total biomass of 27,500 g/m2, far surpassing the other plants, while Lemna minor has the lowest biomass, with only 14.8 g/m2. Plants like Cyperus involucratus, Arundo donax, and Typha angustifolia have well-developed root systems, while plants like Lemna minor and Nymphoides peltate only have a few fibrous roots. The differences in root systems are one of the main factors contributing to the vast differences in total biomass.
By observing the changes in root-to-shoot ratios and biomass allocation, three types of relationships between aboveground and underground biomass were identified (Figure 1). Plants with greater aboveground biomass (e.g., Alternanthera philoxeroides, Canna indica, Lythrum salicaria, Arundo donax, and Thalia dealbata.) are typically found in areas with stable water levels and sufficient nutrient supply. In contrast, plants with higher underground biomass (e.g., Nelumbo sp., Acorus calamus, Acorus tatarinowii, and Phragmites australis) thrive in zones where water levels fluctuate significantly, relying on their extensive root systems to access water and nutrients from deeper soil layers. Floating plants, such as Lemna minor and Nymphoides peltata, demonstrate minimal root biomass, reflecting a dependence on dissolved nutrients in the water column, characteristic of submerged plants in aquatic habitats. These variations are closely linked to water availability and nutrient distribution within the wetland environment [28,29].

3.2. Differences in Biomass Distribution Among Different Types of Wetland Plants

Different types of wetland plants also show significant differences in aboveground and underground biomass. As shown in Figure 2, the aboveground and underground biomass of emergent plants (Canna indica, Lythrum salicaria, Typha angustifolia, Nelumbo sp., Acorus calamus, Arundo donax, Cyperus involucratus, Pontederia cordata, Miscanthus sinensis, Thalia dealbata, Phragmites australis, Acorus tatarinowii) are the highest, with 3524 g/m2 and 3586 g/m2, respectively. Submerged plants (Najas marina, Vallisneria natans, Potamogeton crispus, Ceratophyllum demersum) have aboveground and underground biomass of 941 g/m2 and 317 g/m2, making them second in total biomass. In contrast, due to the smaller proportion of root biomass in floating plants (Nymphoides peltata, Lemna minor), their biomass is mainly categorized as aboveground, making their aboveground biomass the lowest, at only 54 g/m2. Floating-leaved plants (Alternanthera philoxeroides, Nymphaea) have the lowest underground biomass, at 106 g/m2. Emergent plants are the only plant type where underground biomass is slightly higher than aboveground biomass, highlighting their strong root systems, which are crucial for providing anchorage and nutrient acquisition in fluctuating water levels. The dominance of emergent plants in total biomass aligns with their robust growth and adaptability to a variety of wetland conditions [30]. In contrast, floating plants have the lowest total biomass, reflecting their reliance on water buoyancy rather than extensive root systems [31].
These findings emphasize the importance of plant types in determining biomass distribution within wetland ecosystems. Emergent plants play a crucial role in carbon storage and habitat stability due to their extensive root systems, while floating and floating-leaved plants contribute to the diversity of wetland ecosystems through their specialized adaptations [32].

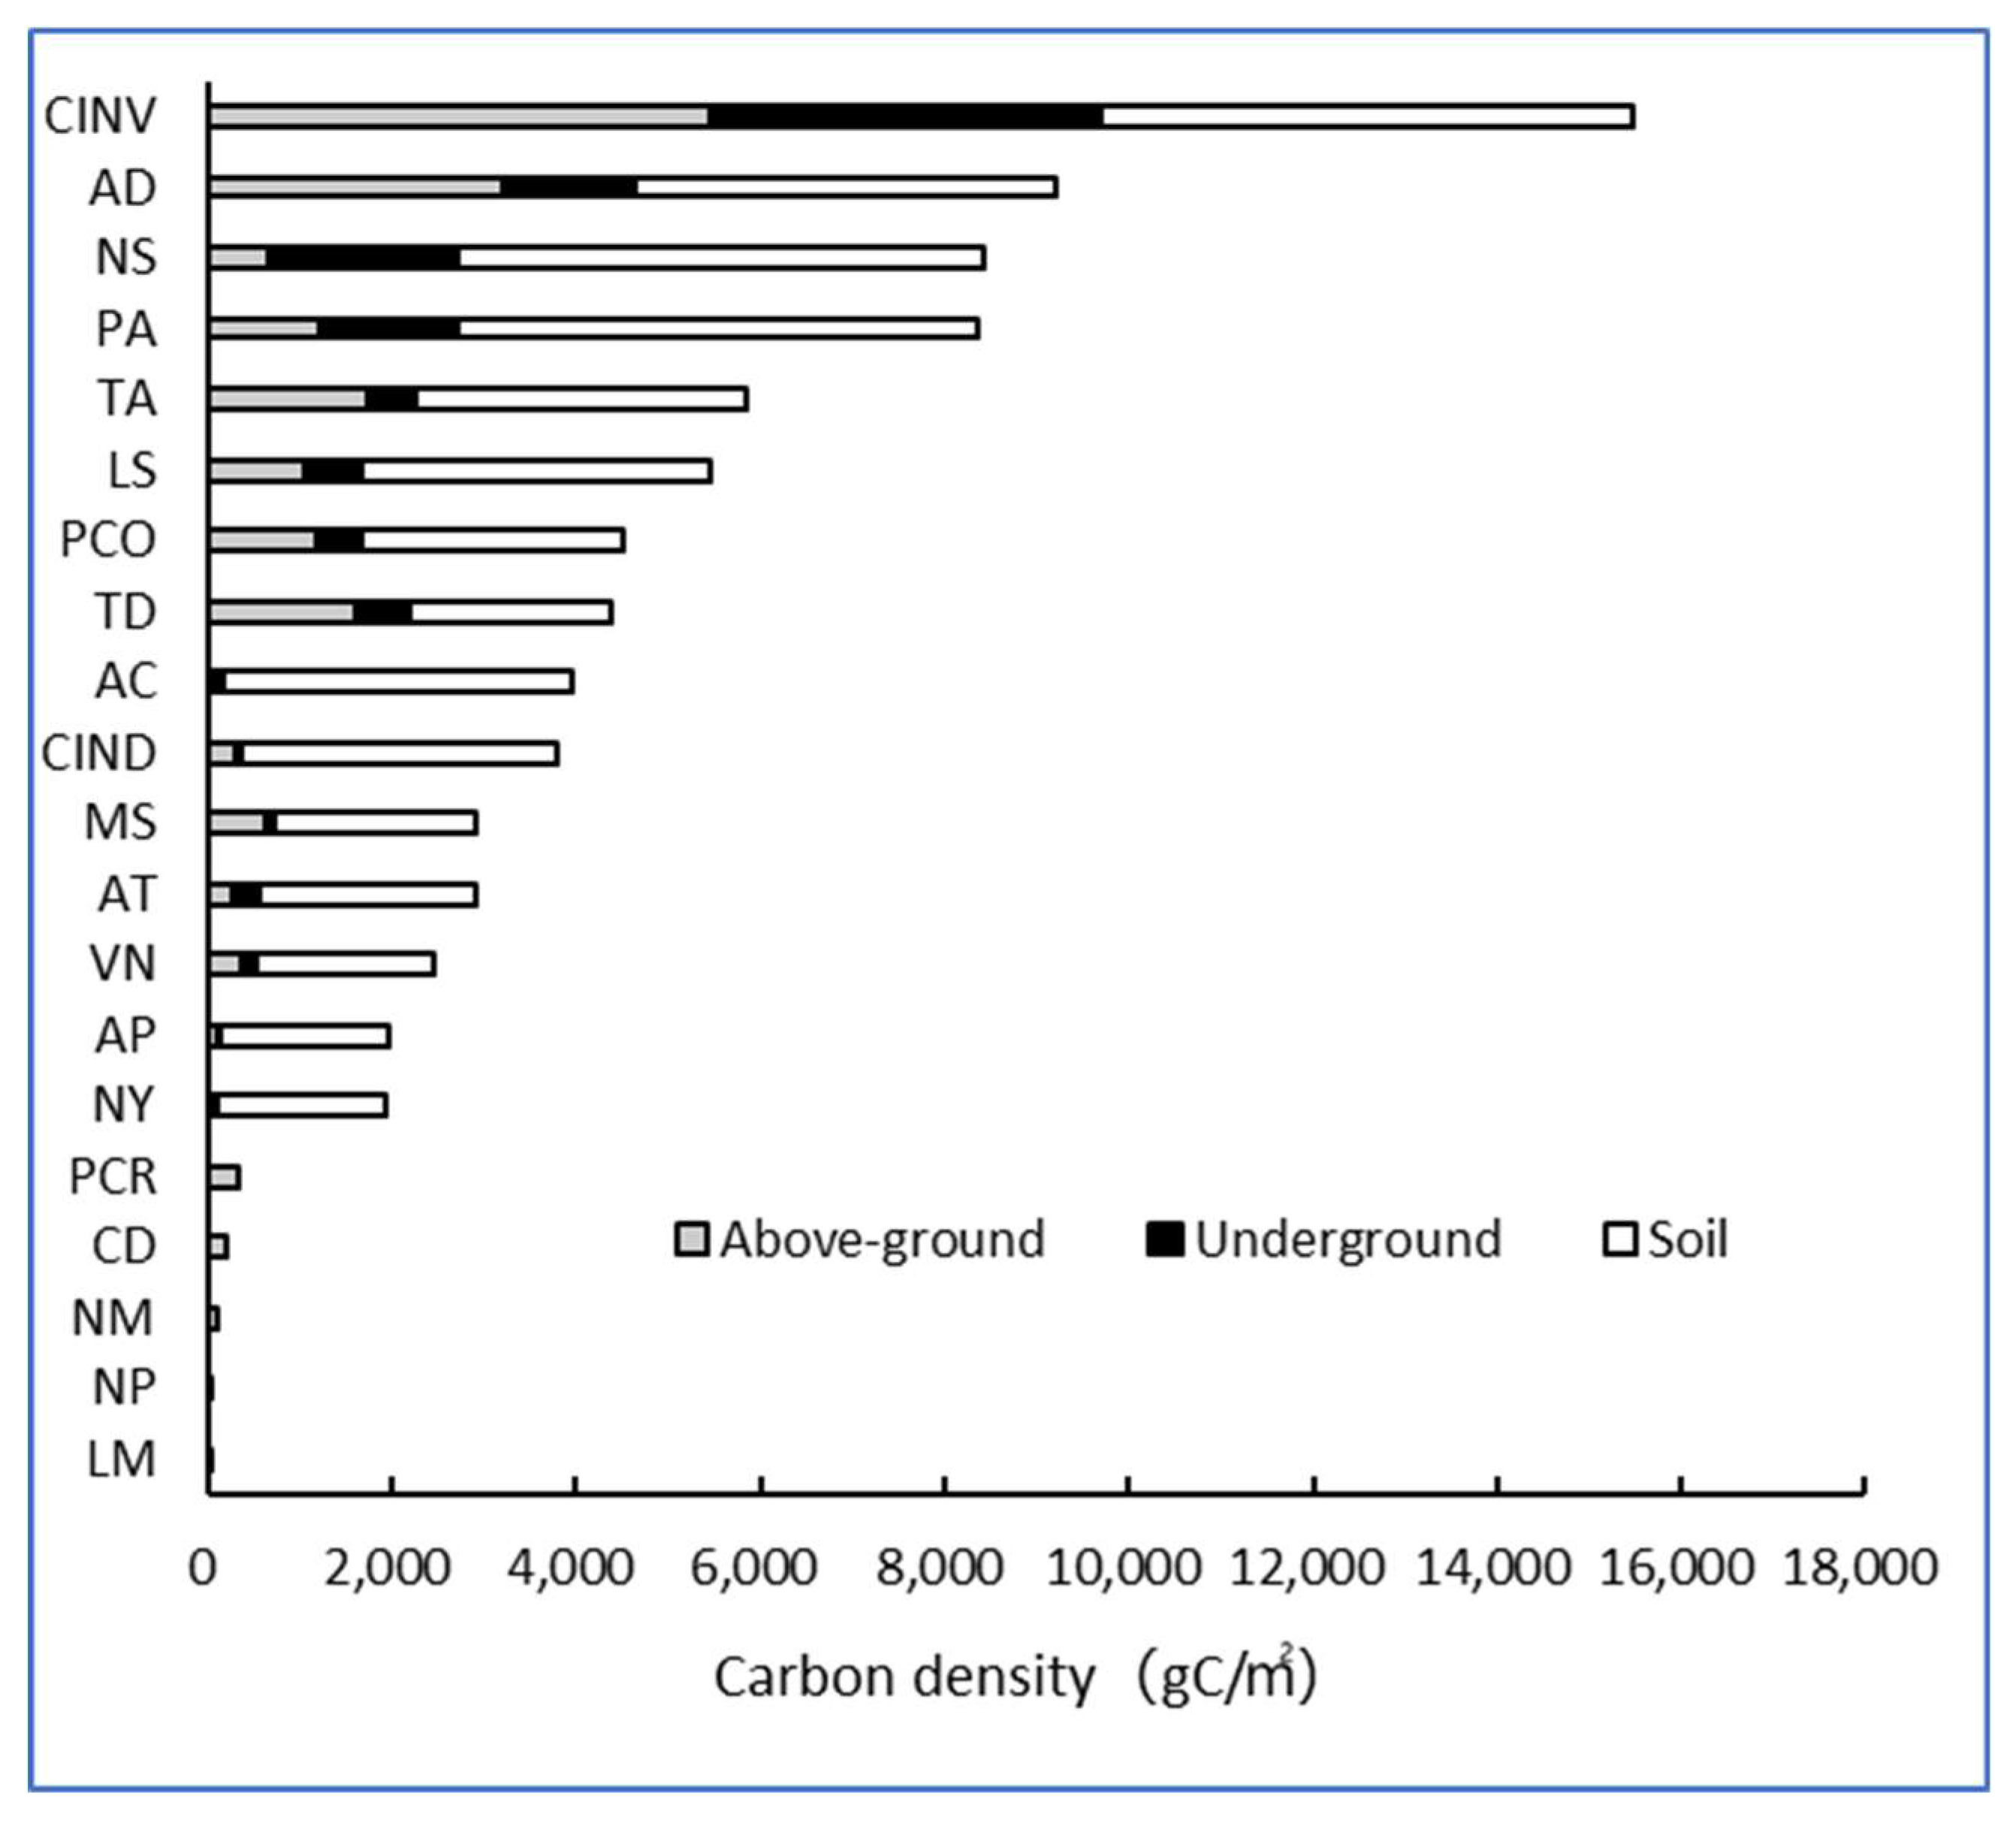
3.3. Carbon Content and Carbon Density Distribution Patterns in Plants

3.3.1. Differences in Carbon Content and Carbon Density Distribution Among Different Plants

Studies have shown that there are significant differences in the carbon content of different plants (Table 2).
Table 2 indicates that most plants exhibit carbon contents between 31 and 43%. The aboveground carbon content of Arundo donax was the highest, reaching 43.65%, while the carbon content of Potamogeton crispus was the lowest, at only 23.18%. In the underground part, Nelumbo sp. had the highest carbon content, reaching 50.30%, while Vallisneria natans had the lowest carbon content, at only 12.05%. Except for Nelumbo sp., the carbon content in the aboveground parts of the other plants was generally higher than in the underground parts. These results suggest that different wetland plants exhibit distinct diversity in carbon distribution, which may be related to their growth habits and habitat adaptability [33].
Submerged plants such as Vallisneria natans and Potamogeton crispus exhibit lower carbon content, likely due to their aquatic photosynthetic adaptations. In contrast, floating plants like Lemna minor, despite having higher carbon content, have minimal biomass, resulting in negligible contributions to overall carbon density. The carbon density of a plant is the product of its biomass and carbon content. The plant with the highest aboveground carbon density was Cyperus involucratus, reaching 5455 gC/m2, while the lowest was Lemna minor, with only 5.1 gC/m2, a difference of more than 1000 times. The highest underground carbon density was also found for Cyperus involucratus, at 4249 gC/m2, while the lowest was found for Alternanthera philoxeroides, with just 8.8 gC/m2. Although Alternanthera philoxeroides has a relatively high underground carbon content, its extremely low biomass results in a very low carbon density (Table 2).
According to the carbon density indications, the following are dominant: CINV, AD, NS, PA, TA, TD, PCO, LS. The dominance of emergent plants such as Typha angustifolia and Arundo donax reflects their adaptability to fluctuating water levels and nutrient availability. Their well-developed root systems enable greater underground biomass accumulation, making them critical to wetland carbon dynamics.
The carbon densities of different plants are distributed in a gradient (Figure 3). The first gradient, 0–1000 gC/m2, includes 12 species; the second gradient, 1000–3000 gC/m2, includes 6 species; the third gradient, 3000–5000 gC/m2, has only 1 species; and the fourth gradient, above 5000 gC/m2, also has only 1 species. This gradient distribution may be closely related to the physiological characteristics of the plants, as well as to variations in water availability and nutrient distribution within the wetland environment [28,29,34].
Among the studied plants, 16 species had a higher proportion of aboveground carbon density, indicating that these plants primarily function as aboveground carbon stocks. However, four species—Acorus tatarinowii, Phragmites australis, Acorus calamus, and Nelumbo sp.—had a greater proportion of underground carbon density, suggesting that these plants mainly serve as underground carbon stocks. This is consistent with the findings of Ren et al. [35] in wetlands in Northeastern China, where the distribution of carbon density in wetland plants is largely influenced by vegetation cover and wetland type. The variation in carbon stock capacity among different plants is an important component of ecosystem carbon dynamics.

3.3.2. Differences in Carbon Content and Carbon Density Distribution Among Different Plant Types

There were significant differences in the carbon content and density characteristics of the four plant types (Table 3). The ranking of aboveground carbon content was as follows: emergent plants > floating-leaved plants > free-floating plants > submerged plants. For underground carbon content, the ranking was as follows: floating-leaved plants > emergent plants > submerged plants. In all plant types, the carbon content of the aboveground parts was greater than that of the underground parts. The ranking of aboveground carbon density was as follows: emergent plants > submerged plants > floating-leaved plants > free-floating plants. The ranking of the underground carbon density was as follows: emergent plants > floating-leaved plants > submerged plants. Overall, the highest carbon density was found in emergent plants, and the lowest was found in free-floating plants, with the carbon density in the aboveground parts being higher in all cases. Many studies have shown that changes in wetland plant types significantly affect carbon density distribution. For example, research in the Hangzhou Bay wetlands demonstrated that the carbon density of native Phragmites australis wetlands is significantly higher than that of invaded Spartina alterniflora wetlands, indicating that vegetation type has an important impact on carbon storage capacity [36].

3.3.3. Comparison of Soil Carbon Content and Carbon Density

When studying the soil carbon content and carbon density of wetland plants, it was found that these plants generally have low soil carbon content, but their carbon density is very high, making them a major carbon stock in wetland ecosystems. In this study, Phragmites australis had the highest soil carbon content, reaching 28.50‰, while Vallisneria natans had the lowest soil carbon content, at only 8.60‰. However, the differences in soil carbon density were even more significant. Cyperus involucratus had the highest soil carbon density, reaching 5768 gC/m2, while Nymphaea had the lowest carbon density, at only 1824 gC/m2. Excluding the floating plants’ soil carbon density, among the remaining three plant types, emergent plants had the highest carbon content, followed by floating-leaved plants, with submerged plants having the lowest. Emergent plants also had the highest carbon density, followed by submerged plants, and floating-leaf plants had the lowest (Table 4).
This significant variation in soil carbon density has also been observed in other studies. For example, Bennett and Chambers [37] pointed out in a study conducted in Florida that wetlands stored on average 16 times more carbon than uplands, and carbon density increased with soil depth. Differences in soil carbon content among plant functional groups are mainly influenced by productivity, biomass allocation, tissue decomposability, and oxygen availability [1,10,11,12]. Emergent plants (such as Phragmites australis and Cyperus involucratus) exhibit high productivity and widespread biomass distribution, contributing large amounts of organic matter to the soil and increasing carbon content. Plants that decompose more slowly help retain carbon over the long term, whereas those that decompose quickly reduce carbon storage. The extensive root systems of emergent plants improve soil oxygen levels, slow down decomposition, and enhance carbon storage. In contrast, submerged plants, although in anaerobic environments with slower decomposition, have lower root biomass, resulting in limited carbon input.

3.3.4. Analysis of Differences in Overall Carbon Storage Capacity of Plants

By comprehensively calculating the carbon density data of the aboveground parts, underground parts, and soil, the overall carbon storage capacity of plants can be evaluated (Figure 4). For individual plants, the strongest carbon storage capacity was found in Cyperus involucratus (15,472 gC/m2), followed by Arundo donax (9212 gC/m2), Nelumbo sp. (8428 gC/m2), and Phragmites australis (8347 gC/m2). The weakest carbon storage capacity was seen in Lemna minor (5.1 gC/m2), followed by Nymphoides peltate (34 gC/m2), Najas marina (110 gC/m2), and Ceratophyllum demersum (197 gC/m2).
The average carbon density of the different plant types indicates that the highest carbon density was found in emergent plants, while the lowest was in floating plants. The carbon density of the emergent plants was 287 times that of the floating plants, 2.9 times that of the floating-leaved plants, and 2.6 times that of the submerged plants. The high carbon density of emergent plants is closely related to their well-developed root systems and the accumulation of carbon in the soil substrate. They create localized aerobic microenvironments in anaerobic soils through oxygen release from their roots, thereby promoting the decomposition of organic matter and nutrient cycling [38]. Additionally, the decomposition of plant litter and root exudates provides a stable carbon source for the soil, significantly contributing to the increase in soil carbon content, which can significantly prolong carbon storage [38]. Emergent plants absorb and accumulate nutrients through their growth and metabolic processes, which can then return to the soil in the form of litter, thereby influencing the carbon cycle in wetlands. Research has shown that emergent plants like Phragmites australis can effectively store organic carbon in wetland sediments, with carbon storage in wetland sediments accounting for more than 90% of the total carbon storage in wetland ecosystems, which is of great significance for mitigating global climate change [39]. Mander et al. investigated the flux of greenhouse gases in artificial wetlands, highlighting the importance of plant root systems in regulating gas exchange and carbon sequestration [40]. This study aligns with the above findings, where wetland plants with well-developed root systems, such as Phragmites australis, demonstrate higher underground carbon densities. These plants’ root systems play a significant role in carbon storage, similar to the carbon sequestration patterns observed in natural wetlands.

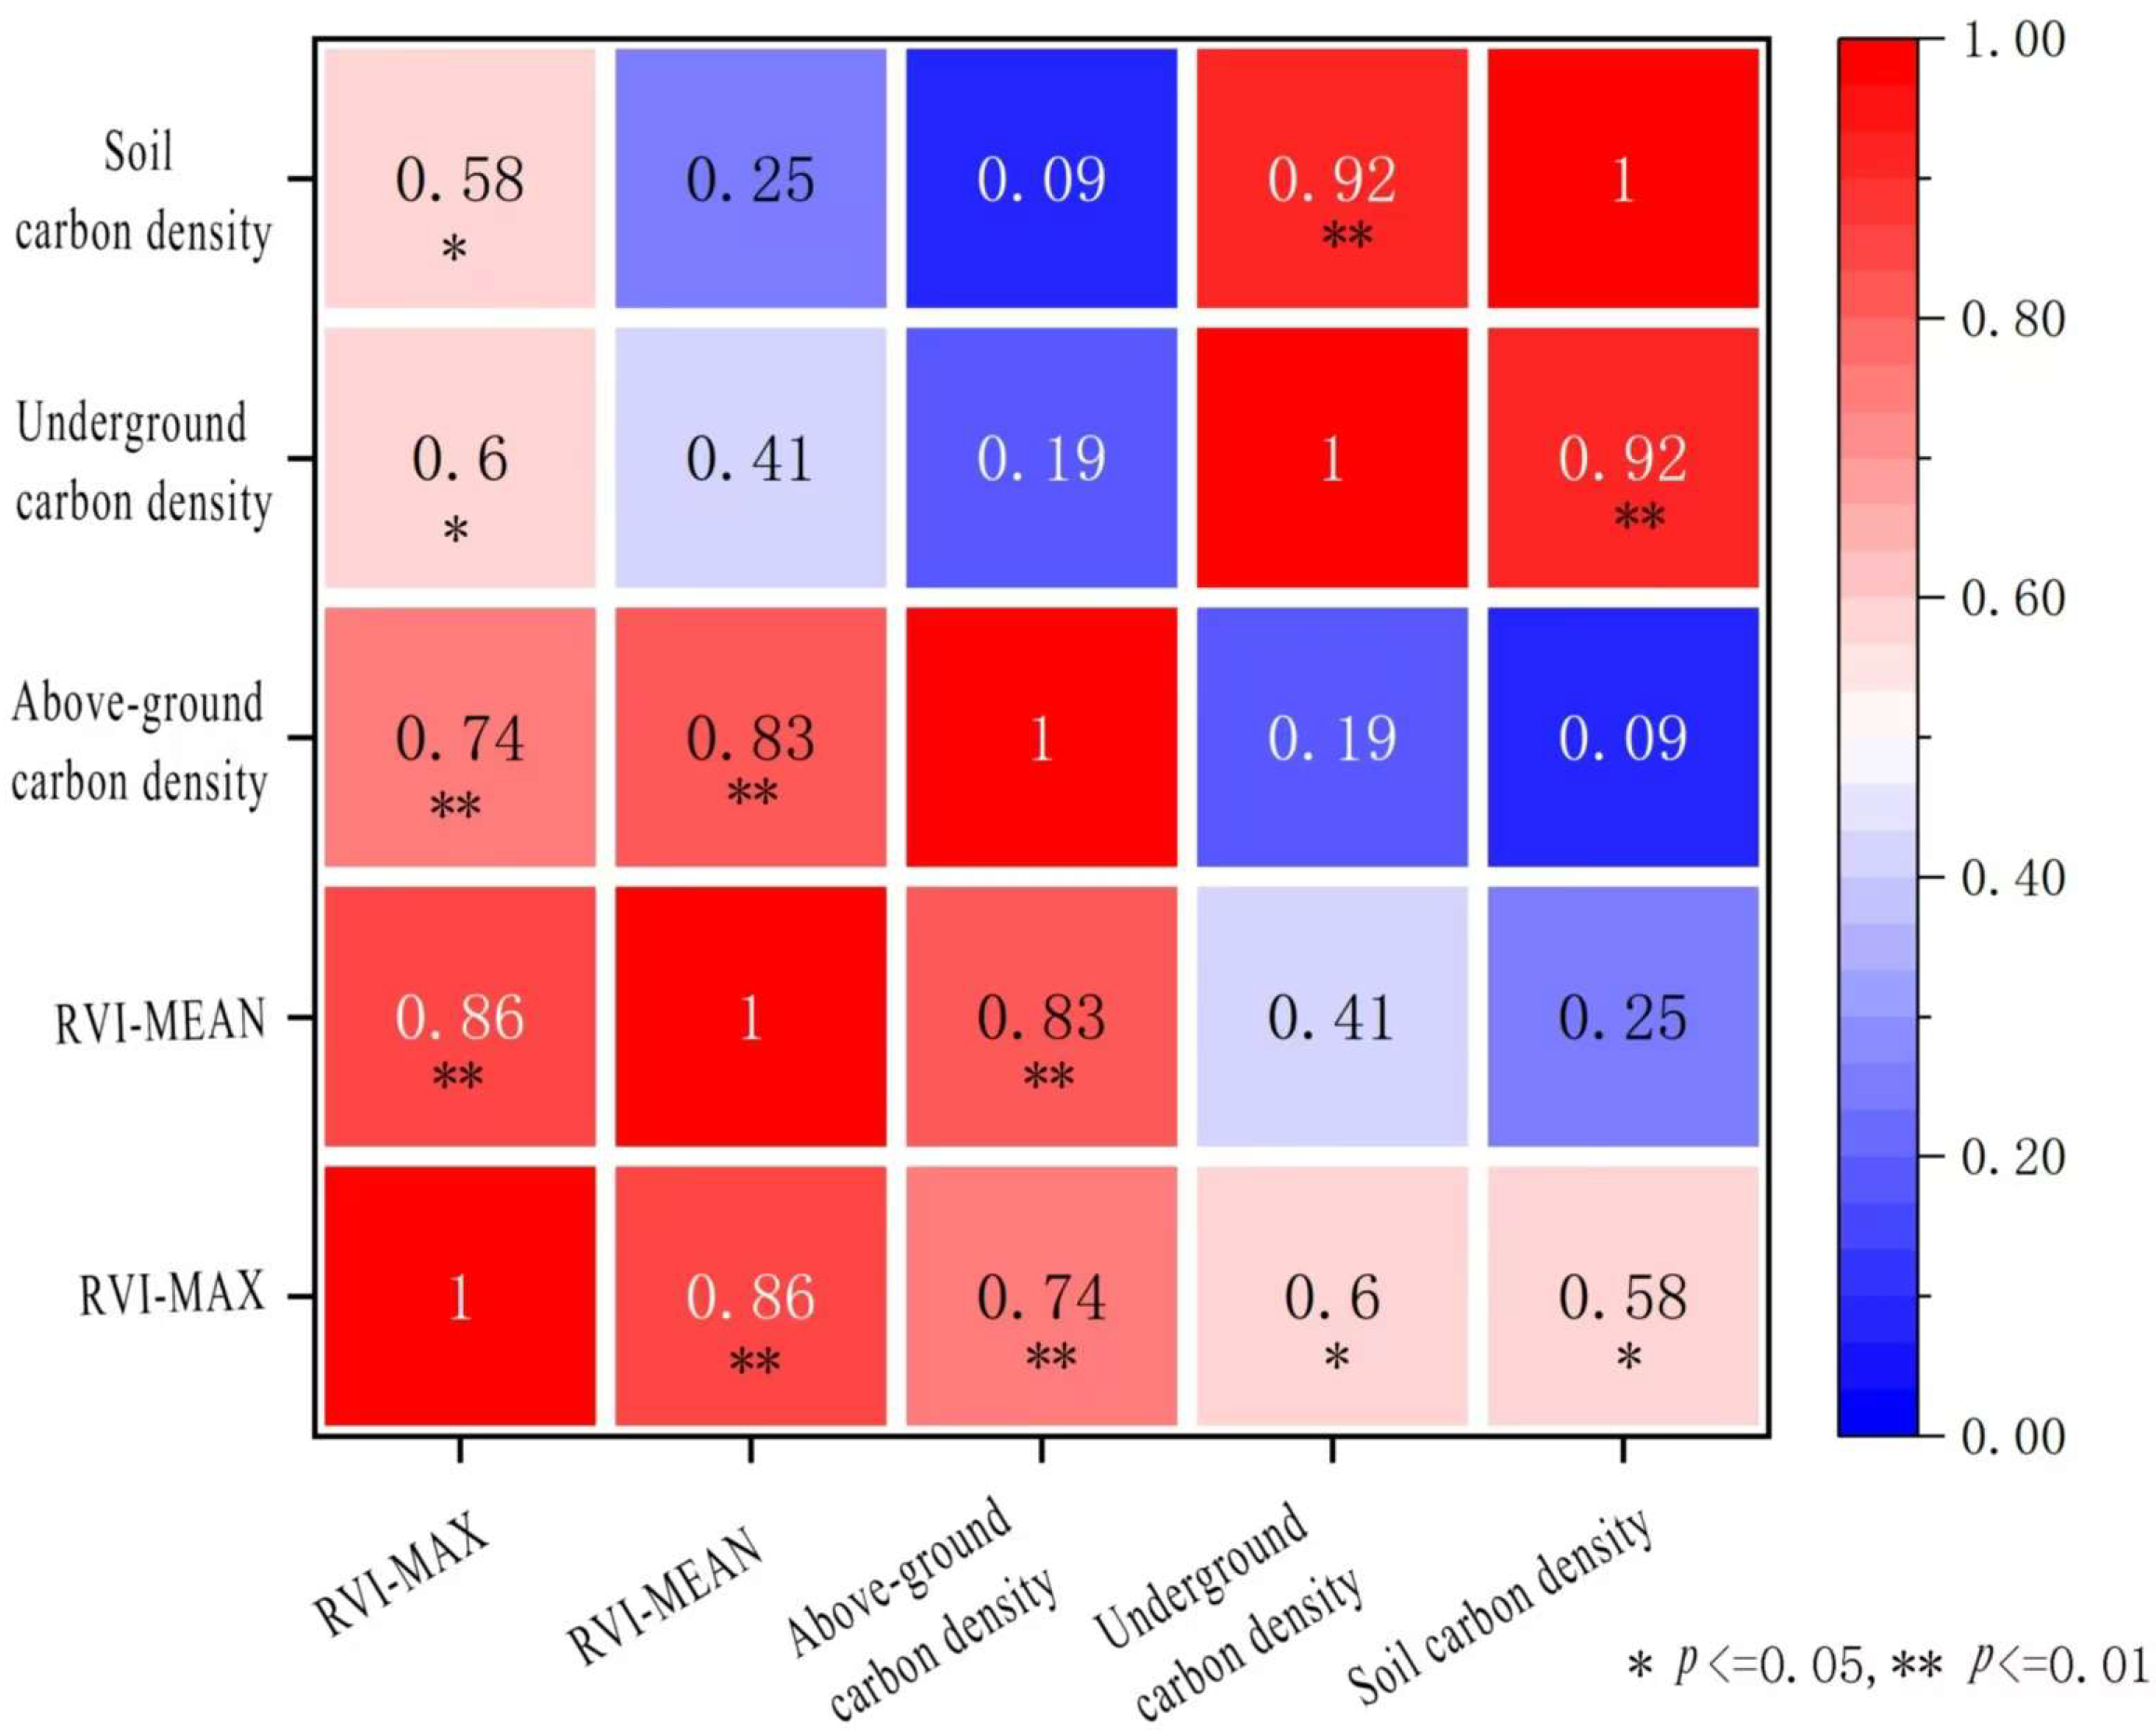
3.4. Remote Sensing Information Extraction of Vegetation in Artificial Wetlands and Distribution Characteristics of Wetland Vegetation

3.4.1. Vegetation Extraction Methods

For vegetation extraction, an unsupervised classification method was first used, testing both K-means clustering and ISO data clustering algorithms. The land features were classified into three categories: vegetation, buildings/roads, and water bodies. However, the classification accuracy of the unsupervised classification was validated using the confusion matrix with ground truth regions of interest (ROIs) method, and the Kappa coefficient was calculated. The result showed Kappa ≤ 0.4, indicating poor classification performance [41], which may be due to the limited number of spectral bands in the multispectral data, making this method unsuitable for classification.
Subsequently, the classification results were visually verified directly, and it was found that the classification accuracy was relatively high. Different NDVI thresholds were set to extract the vegetation coverage of the entire artificial wetland, with a threshold of 0.4 for Shanghai Fish and 0.5 for Dishui Lake. When the NDVI value is greater than the corresponding threshold, it is considered as a vegetation-covered area. The range of water bodies and wetland plant communities was clipped, and areas with RVI values greater than 2 were filtered as wetland vegetation distribution areas, with the remaining areas considered water bodies.

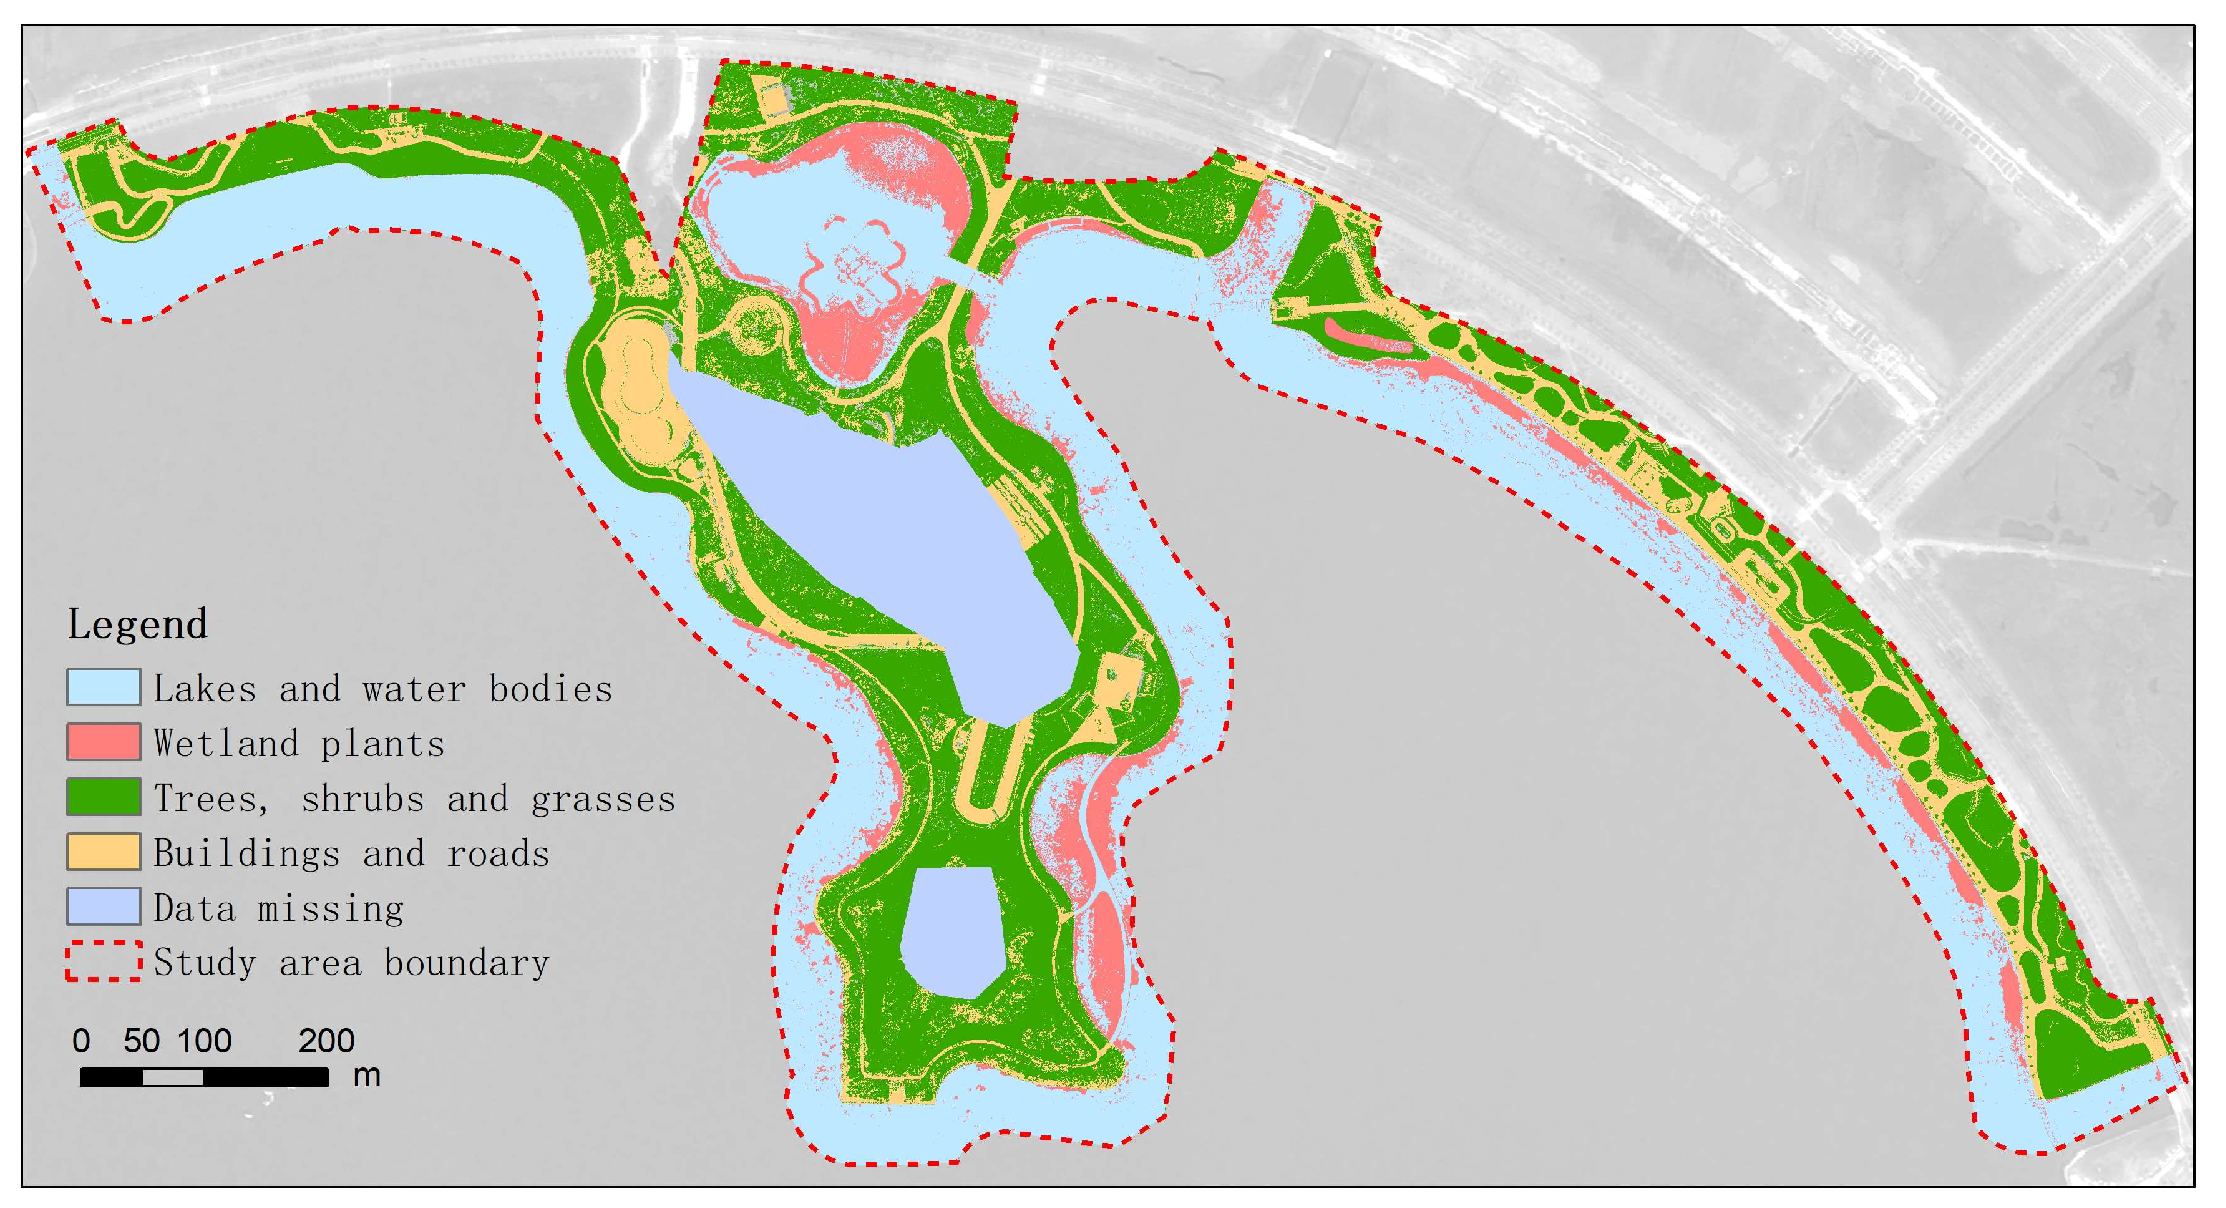
3.4.2. Analysis of Spatial Distribution Characteristics of Wetland Vegetation

(1)
Shanghai Fish Artificial Wetland
Based on the classification results, the total area of the Shanghai Fish artificial wetland is approximately 1,071,377 m2, with a vegetation-covered area of 353,765 m2, accounting for about 33.02%. Among this, the wetland vegetation area is 103,795 m2, which accounts for about 29.34% of the vegetation area and about 9.69% of the total area.
From the classification results, three characteristics of the wetland vegetation distribution in the Shanghai Fish area can be observed: First, the overall distribution area is small, covering less than one-tenth of the entire wetland park, and the distribution is scattered, with vegetation present throughout almost the entire park. Second, the distribution of wetland vegetation shows significant spatial heterogeneity, with concentrations mainly in the northern and mid-western areas, while other areas are sparsely vegetated. This heterogeneity may be related to factors such as microtopography and water level fluctuations; shallow water levels creating favorable conditions for vegetation growth, such as providing sufficient water availability and supporting nutrient uptake by plant roots; as well as to variations in water availability and nutrient distribution within the wetland environment, as pointed out by Zheng et al. in their study of Poyang Lake [42]. Third, the wetland vegetation was mainly distributed in a strip-like pattern, concentrated around the lakeshore, with some small areas distributed in patches (Figure 5). This distribution pattern is similar to that of other wetland regions, where vegetation is usually influenced by hydrological conditions and soil status, referring to the physical and chemical characteristics of the soil, such as its moisture content, organic matter concentration, and nutrient availability, which collectively influence vegetation distribution and growth, as also found by Huang et al. in their study of Poyang Lake [43].
(2)
North Island of Dishui Lake Artificial Wetland
The total area of the artificial wetland at Dishui Lake is approximately 490,847 m2, with a vegetation-covered area of 173,261 m2, accounting for about 35.30%. Of this, the wetland vegetation area is 37,046 m2, making up approximately 21.38% of the vegetation-covered area and about 7.55% of the total area.
The distribution of wetland vegetation in Dishui Lake exhibits three main characteristics. First, the overall distribution area is small, covering only 7.55% of the total wetland park area. Second, there is significant spatial heterogeneity in the distribution of vegetation, with most wetland vegetation concentrated in the northern inner lake, the southern eastern shore, and the western shore of the eastern section, with very little vegetation in other areas. This spatial distribution pattern is influenced by factors such as soil moisture and nutrient availability, as well as to variations in water availability and nutrient distribution, as Fu et al. pointed out in their analysis of wetland plant communities [44]. Third, the shape of the wetland vegetation distribution also exhibits spatial heterogeneity. It is distributed in discontinuous strips along the outermost lakeshore and in patches near the islands (Figure 6). This distribution shape may be influenced by hydrological connectivity, water level (affecting water availability and nutrient distribution), and other environmental factors, as supported by the research of Li et al. in other wetland ecosystems [45].

3.5. Analysis of Carbon Sequestration Pattern Differences in Two Artificial Wetlands Across Different Periods

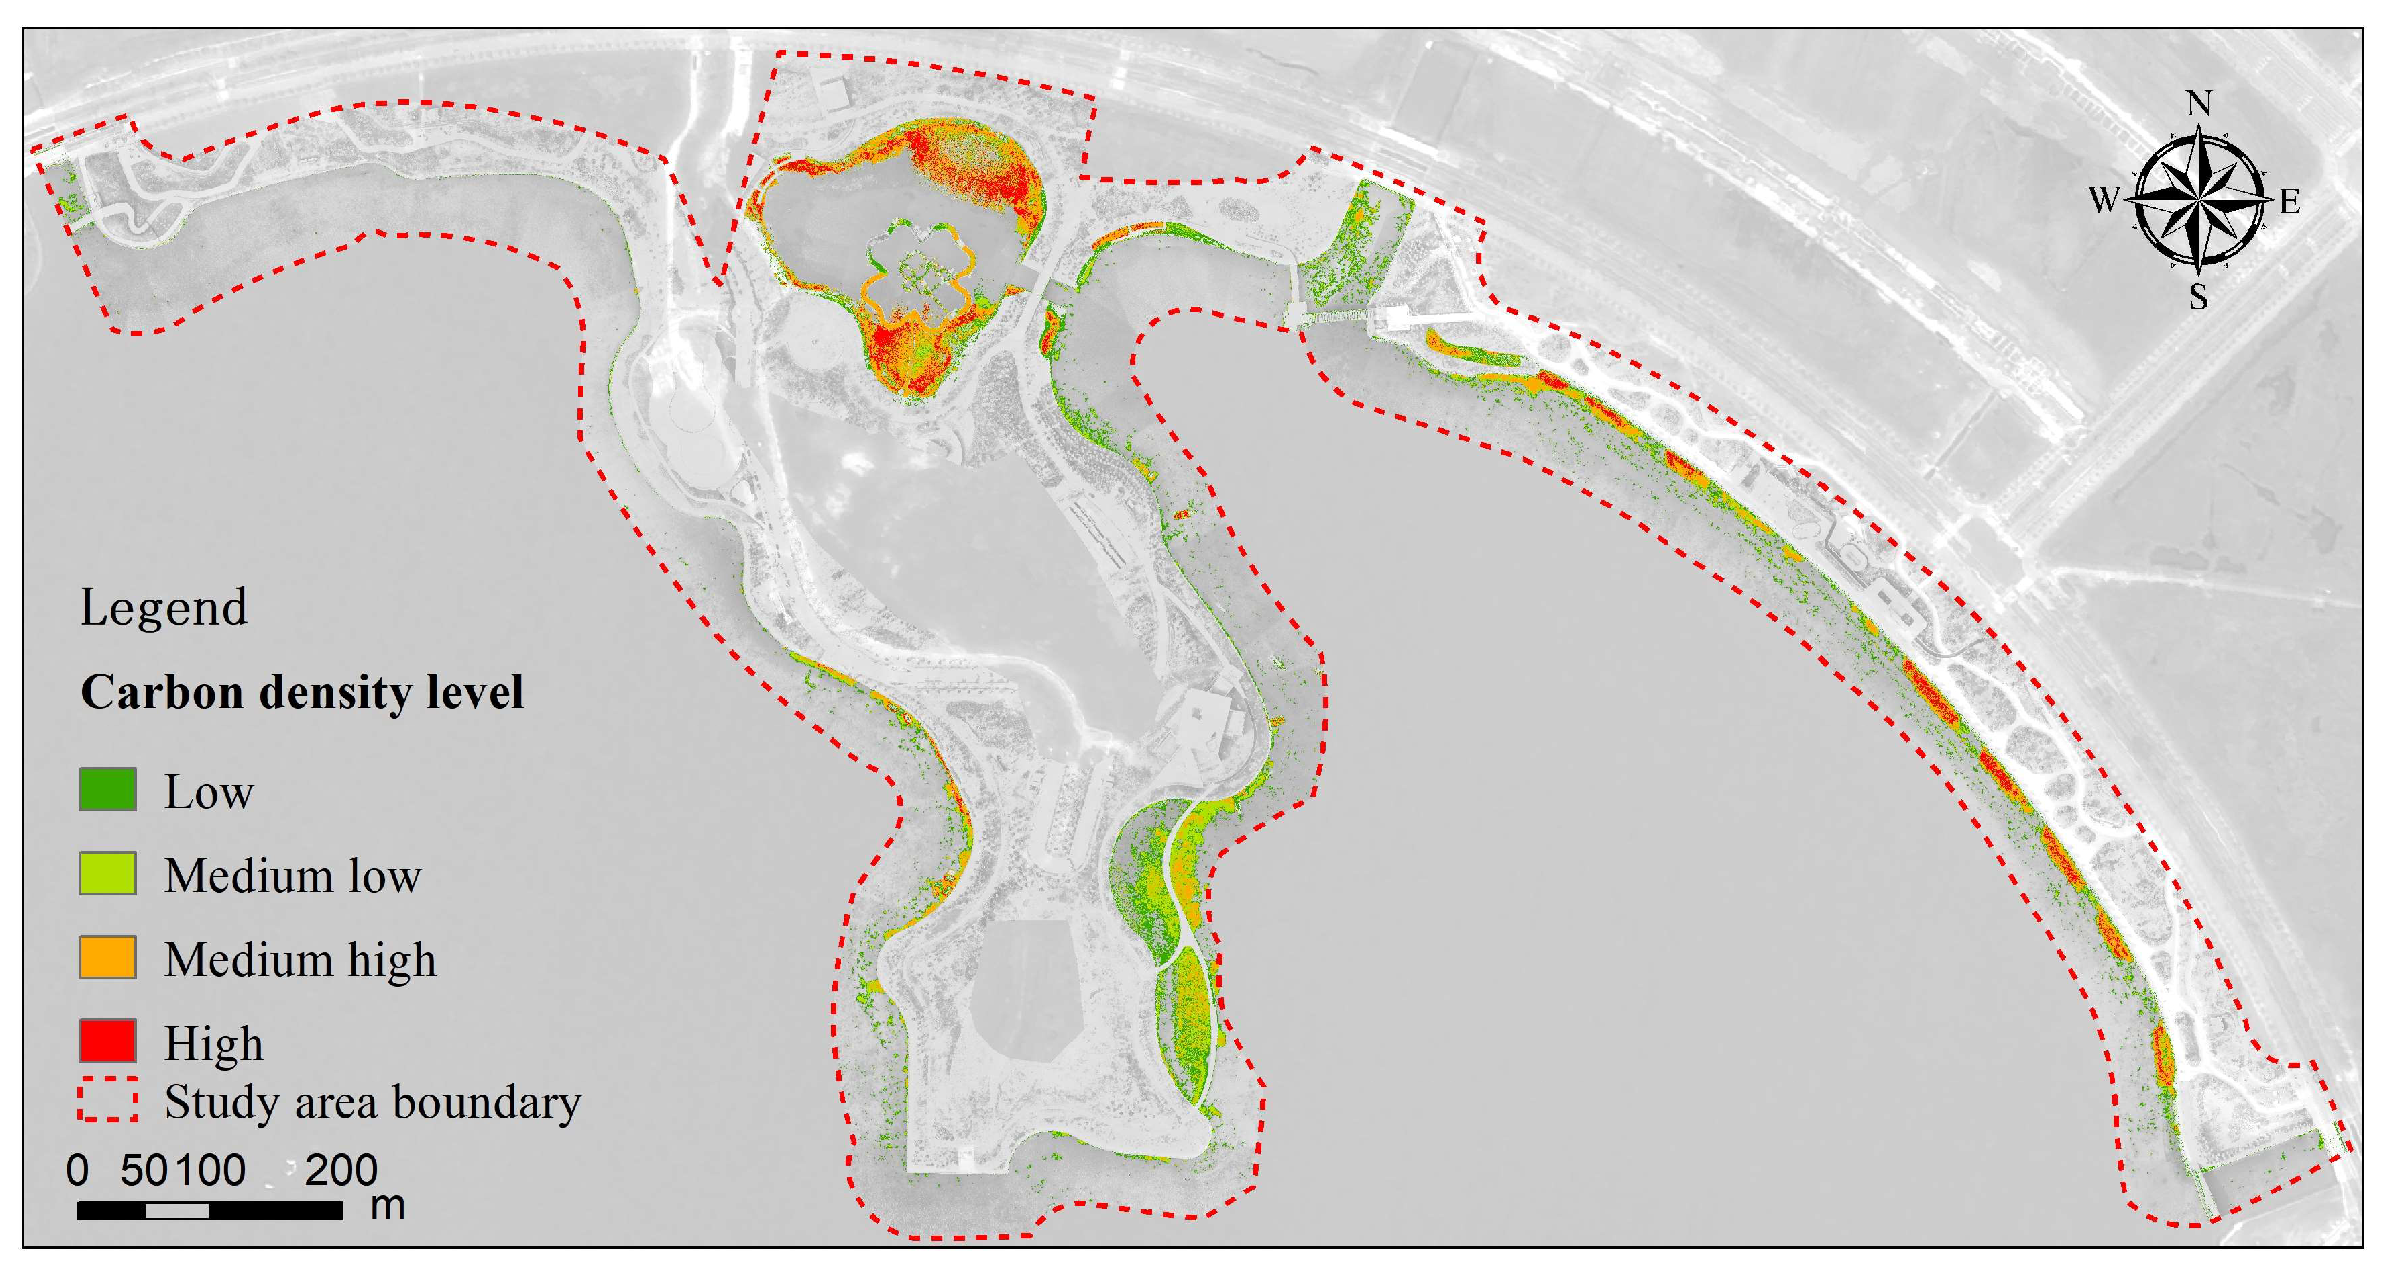
3.5.1. Current Carbon Density Patterns

(1)
Spatial Characteristics of Aboveground Carbon Density
Table 5 presents the carbon density along with the maximum and average RVI (Ratio of Vegetation Index) values of the plants, while Figure 7 illustrates their Pearson correlation. The correlation coefficient between aboveground carbon density and the maximum RVI is 0.74, with a significance level of p < 0.01, indicating a significant correlation. The correlation coefficient between aboveground carbon density and the average RVI is 0.83, with a significance level of p < 0.01, also indicating a significant correlation.
The average aboveground carbon density of wetland plants in the Shanghai Fish wetland is approximately 106 gC/m2, while the average aboveground carbon density of wetland plants in the northern island of Dishui Lake is about 121 gC/m2. These two values serve as thresholds for evaluating the carbon storage capacity across these regions. The analysis shows significant spatial heterogeneity in the carbon storage capacities of the two wetland parks.
Overall, the northern and central lakeshore areas of the Shanghai Fish wetland park exhibit higher carbon storage capacities, whereas the other areas display relatively lower capacities. Similarly, the northern region of the northern island of Dishui Lake demonstrates higher carbon storage, while the southern region shows lower capacity. This spatial heterogeneity can be attributed to the diversity of vegetation distribution and the influence of hydrological conditions. Studies have shown that the carbon storage in wetlands varies significantly among different vegetation types, and there is a significant correlation between the biomass of wetland plants and their carbon density [19].
The fault-like distribution pattern in the aboveground carbon storage capacity of the two wetland parks was primarily divided into two levels: high and medium-to-low. The medium-to-low carbon storage areas were widely distributed, covering most of the wetland park areas. This distribution pattern suggests that although some regions of the wetlands exhibited higher carbon storage capacities, the capacity was relatively low across the majority of the area. The spatiotemporal dynamics of carbon storage and sequestration in wetland ecosystems are often influenced by climate change and land-use changes [46]. The aboveground carbon storage areas in both wetland parks primarily followed a linear distribution, particularly in the concave and convex regions along the water’s edge, where the carbon density was more concentrated, forming a planar and convex pattern due to the influence of the underlying topography. This distribution feature can be attributed to the root structure of wetland plants and their interaction with the water. The dense distribution of wetland plants along the shoreline typically enhances carbon fixation, and the carbon density along the shoreline is also relatively higher [47].
(2)
Spatial Characteristics of Underground Carbon Density
The correlation coefficient between underground carbon density and the maximum value of RVI was 0.60, with significance < 0.05, indicating a significant correlation. The correlation coefficient between underground carbon density and the average value of RVI was 0.41, with significance > 0.05, indicating no significant correlation (Figure 7).
The average underground carbon density of the wetland plants in Shanghai Fish was approximately 92 gC/m2, while in the north island wetland of Dishui Lake, it was about 111 gC/m2. These two values serve as thresholds for the high and low carbon storage capacity of the entire region. Overall, the underground carbon storage capacity distribution in Shanghai Fish and the eastern shore of Dishui Lake was relatively simple, with a noticeable strip-like pattern. The areas with stronger carbon storage capacity were concentrated along the shoreline. In contrast, the distribution of underground carbon storage capacity on the northern island wetland of Dishui Lake remained higher in the north and lower in the south. This distribution pattern was related to the growth status of wetland plant root systems in different environments. Specifically, in shoreline areas, where soil moisture and nutrient conditions are more favorable, the carbon fixation capacity of roots is more pronounced. Studies have shown that underground carbon storage in wetlands varies significantly under different vegetation types and hydrological conditions [19].
The distribution of underground carbon storage capacity exhibited a progressive pattern. In the north island wetland of Dishui Lake, moving from the water body toward the lakeshore, the carbon storage capacity transitioned from medium–low to medium–high to high levels. In Shanghai Fish, this transition was from low to medium–high to high levels. This progressive distribution pattern reflects the influence of the hydrological gradient on underground carbon storage capacity: the higher the water level, the greater the potential for carbon fixation, and as the distance from the center of the lake increased, underground carbon storage also increased. This is consistent with findings from other wetland ecosystems, which indicate that wetland carbon storage capacity exhibits significant variations across different environmental gradients [1].
The spatial distribution of underground carbon density is influenced not only by soil and water levels (affecting water availability and nutrient distribution) but also by the root structure of plants [48]. These factors collectively contribute to the spatial heterogeneity and gradient distribution of underground carbon storage capacity.
(3)
Spatial Characteristics of Soil Carbon Density
The correlation coefficient between soil carbon density and the maximum RVI value was 0.58, with a significance level below 0.05, indicating a significant relationship. The Spearman correlation coefficient between soil carbon density and the average RVI value was 0.25, with a significance level greater than 0.05, suggesting no significant correlation (Figure 7).
The average soil carbon density of the wetland plants in Shanghai Fish was approximately 1365 gC/m2, while the average soil carbon density of the wetland plants in the northern island of Dishui Lake was approximately 1590 gC/m2. These two values were used as the thresholds for evaluating the carbon density across the entire region. Analysis shows that the soil carbon density levels of the two wetland parks exhibit significant spatial heterogeneity and distinct distribution patterns.
The soil carbon density in the north island of Dishui Lake exhibited a stepped distribution, with two main levels: high and low. In contrast, the soil carbon density in Shanghai Fish, similar to the underground carbon density distribution, showed a progressive pattern, increasing from the water body towards the lakeshore, with carbon stock levels ranging from low, medium–low, medium–high, to high.
Overall, the soil carbon density was higher in the northern and central–western lakeshore areas of Shanghai Fish, while it was lower in other areas. Similarly, the northern region and eastern coastline of the northern island of Dishui Lake had higher carbon density, while the southern region had lower capacities. This spatial heterogeneity demonstrates that soil carbon storage in wetland ecosystems is greatly influenced by hydrological conditions, soil types, and vegetation coverage. Studies have shown that the organic carbon density in wetland soils varies significantly among different vegetation types and hydrological environments [49].
The stepped distribution of soil carbon density in the north island of Dishui Lake may result from significant differences in local environmental conditions, such as hydrological gradients and soil properties. In Shanghai Fish, the soil carbon density followed a progressive distribution pattern from the water body towards the lakeshore, with carbon density levels increasing from low to high. This distribution pattern reveals a trend of increasing soil carbon storage with greater distance from the water body, consistent with the distribution characteristics of underground carbon sequestration and dynamic changes in carbon sequestration capacity across different environmental gradients in the wetland [50].
Furthermore, this study found that the spatial distribution of soil carbon density was influenced not only by hydrological conditions, primarily water level (which affects water availability and nutrient distribution), but also by vegetation types. Particularly in lakeshore wetlands, vegetation types and soil chemical characteristics have a significant impact on carbon density. These factors collectively contribute to the spatial heterogeneity and distribution patterns of soil carbon sequestration capacity [7]. Lal [51] highlighted the importance of soil carbon sequestration, emphasizing the potential to increase soil organic carbon storage through scientific management and restorative land use. This approach not only helps mitigate climate change but also improves soil health and agricultural productivity.
(4)
Overall Spatial Characteristics of Carbon Density
By adding the aboveground, underground, and soil carbon densities, the spatial distribution map of overall carbon density was obtained. The overall average carbon density of the wetland plants in Shanghai Fish was approximately 1563 gC/m2, while in the north island of Dishui Lake, the overall average carbon density of the plants was about 1823 gC/m2. These two values were used as thresholds to distinguish the high and low carbon densities of the entire area (Figure 8 and Figure 9). Analysis indicates that the overall carbon density of the two wetland parks showed significant spatial heterogeneity and displayed specific distribution patterns.
The spatial distribution of overall carbon density in Shanghai Fish was very similar to the spatial distribution of its soil carbon density, mainly showing a strip-like distribution. The areas with higher carbon density were concentrated in the lakeshore zone, while the other areas had lower carbon density. Similarly, in the north island of Dishui Lake, the northern and eastern areas exhibited stronger carbon densities, while the southern part showed weaker capacity, and the western part had almost zero capacity. In Shanghai Fish, the carbon density around the periphery, as well as in the eastern and southern lakeshore areas of the north island of Dishui Lake, showed a progressive distribution pattern. From the water body toward the lakeshore, the carbon density increased from low to medium–low to medium–high to high levels. This distribution pattern suggests that as the distance from the water body increases, the carbon density of the wetland gradually strengthens. This may be because the areas near the lakeshore typically have higher biomass and soil organic carbon contents, which enhances carbon storage capacity [52].
Figure 10 shows differences in the area and proportion of various carbon density zones in Shanghai Fish and Dishui Lake. In the Shanghai Fish wetland, the proportion of the low carbon density zone was the largest, while in the Dishui Lake wetland, the medium–high carbon density zone accounted for the largest proportion. In the high carbon density and medium–low carbon density zones, the proportions in Dishui Lake and Shanghai Fish were close, but Shanghai Fish was slightly higher. Overall, with the increase in the level of carbon density zones (from low carbon density zones to high carbon density zones), the area proportion of carbon sequestration zones in both locations showed a significant increase, with the decline in Shanghai Fish being more pronounced.
The carbon storage capacity within the study areas of the artificial wetlands in Shanghai Fish and Dishui Lake was as follows: the aboveground carbon storage in Shanghai Fish was 11.0 t, the underground carbon storage was 9.6 t, and the soil carbon storage was 141.7 t, with a total carbon storage capacity of 162.3 t. In the north island of Dishui Lake, the aboveground carbon storage was 4.5 t, the underground carbon storage was 4.1 t, and the soil carbon storage was 58.9 t, with a total carbon storage capacity of 67.5 t.
The aboveground carbon density of the plants in these two artificial wetlands was relatively high, while the underground carbon density showed an uneven distribution. This distribution pattern reflects the influence of wetland vegetation and water level on carbon storage capacity, with soil carbon storage often dominating the spatial distribution of overall wetland carbon sequestration capacity [49].

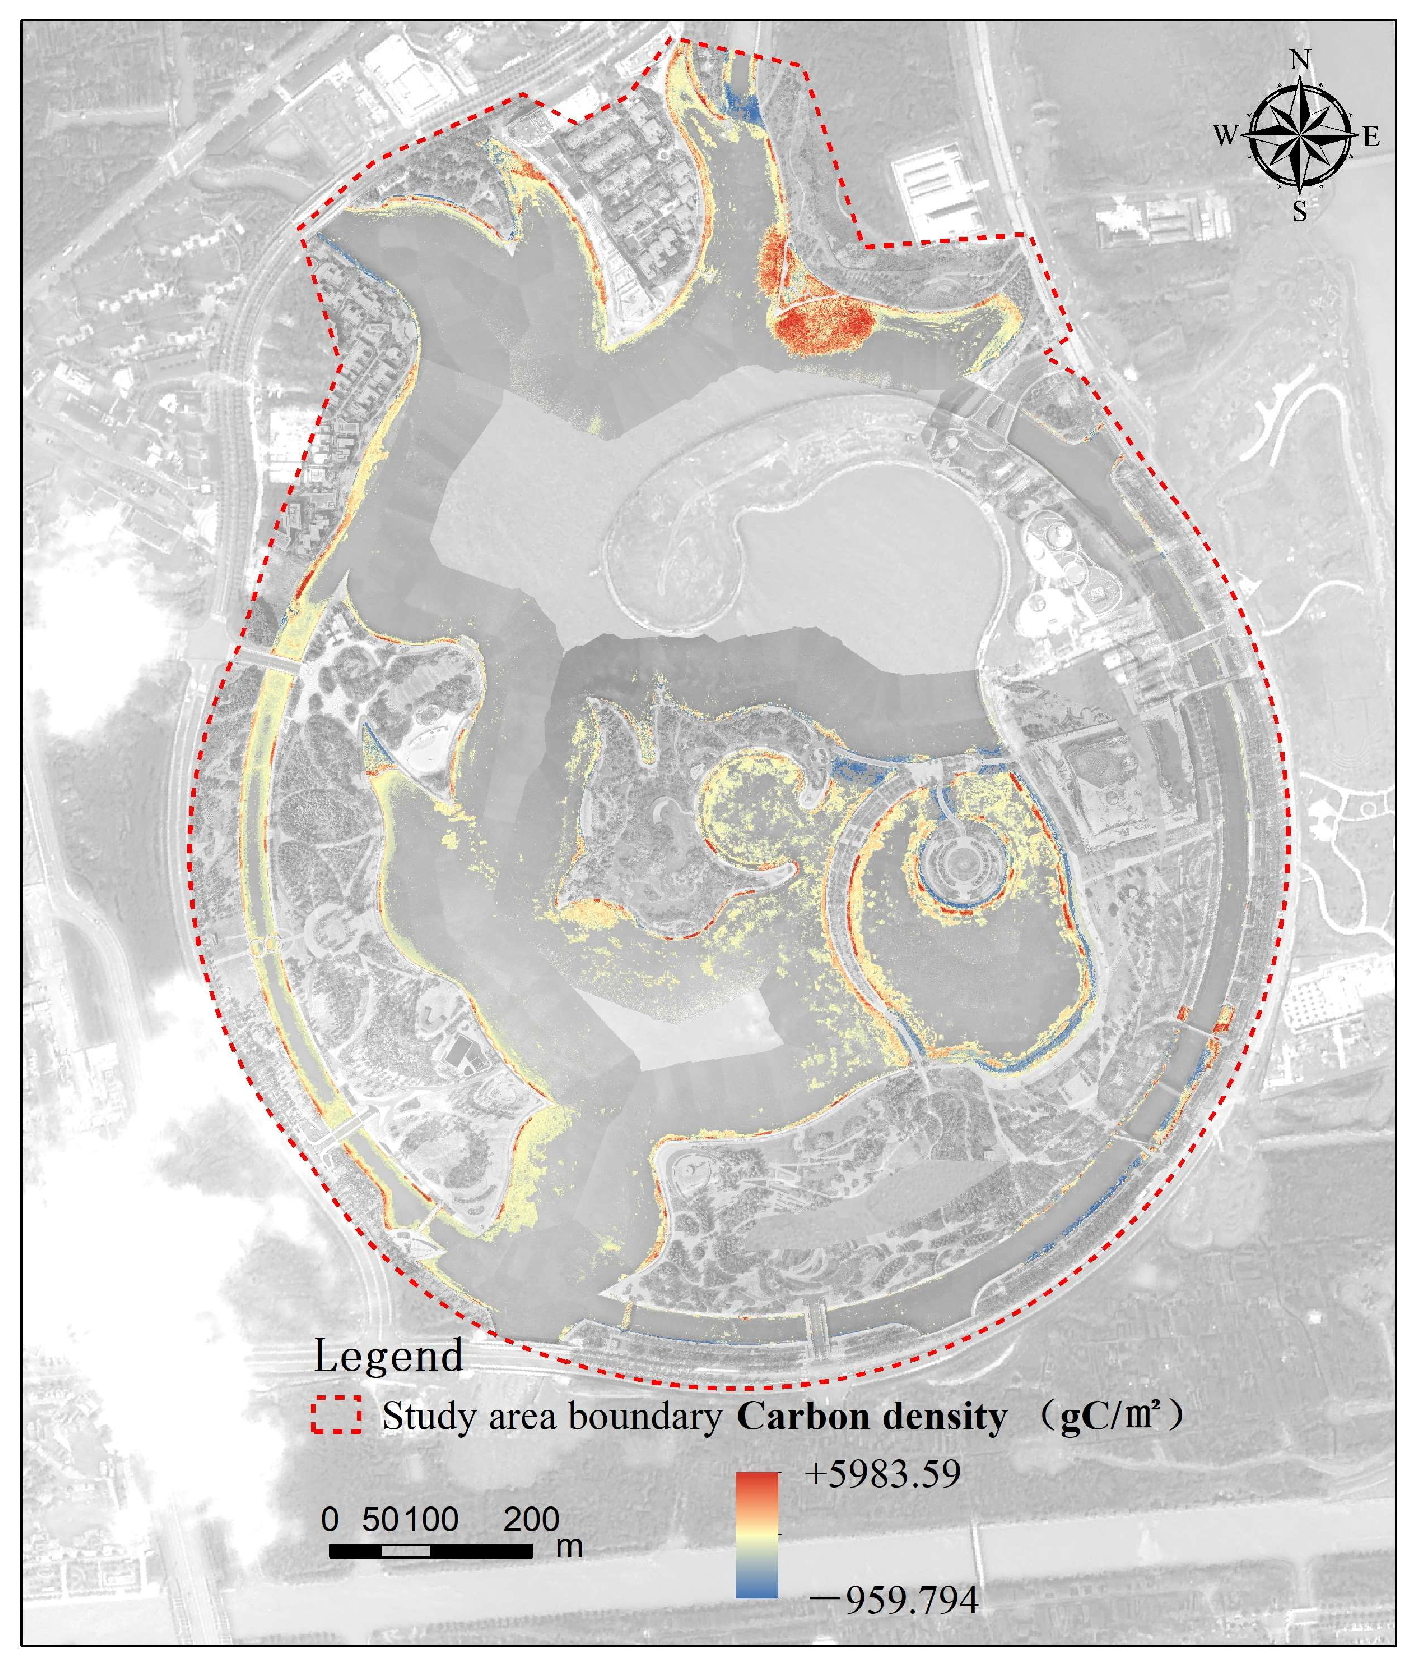
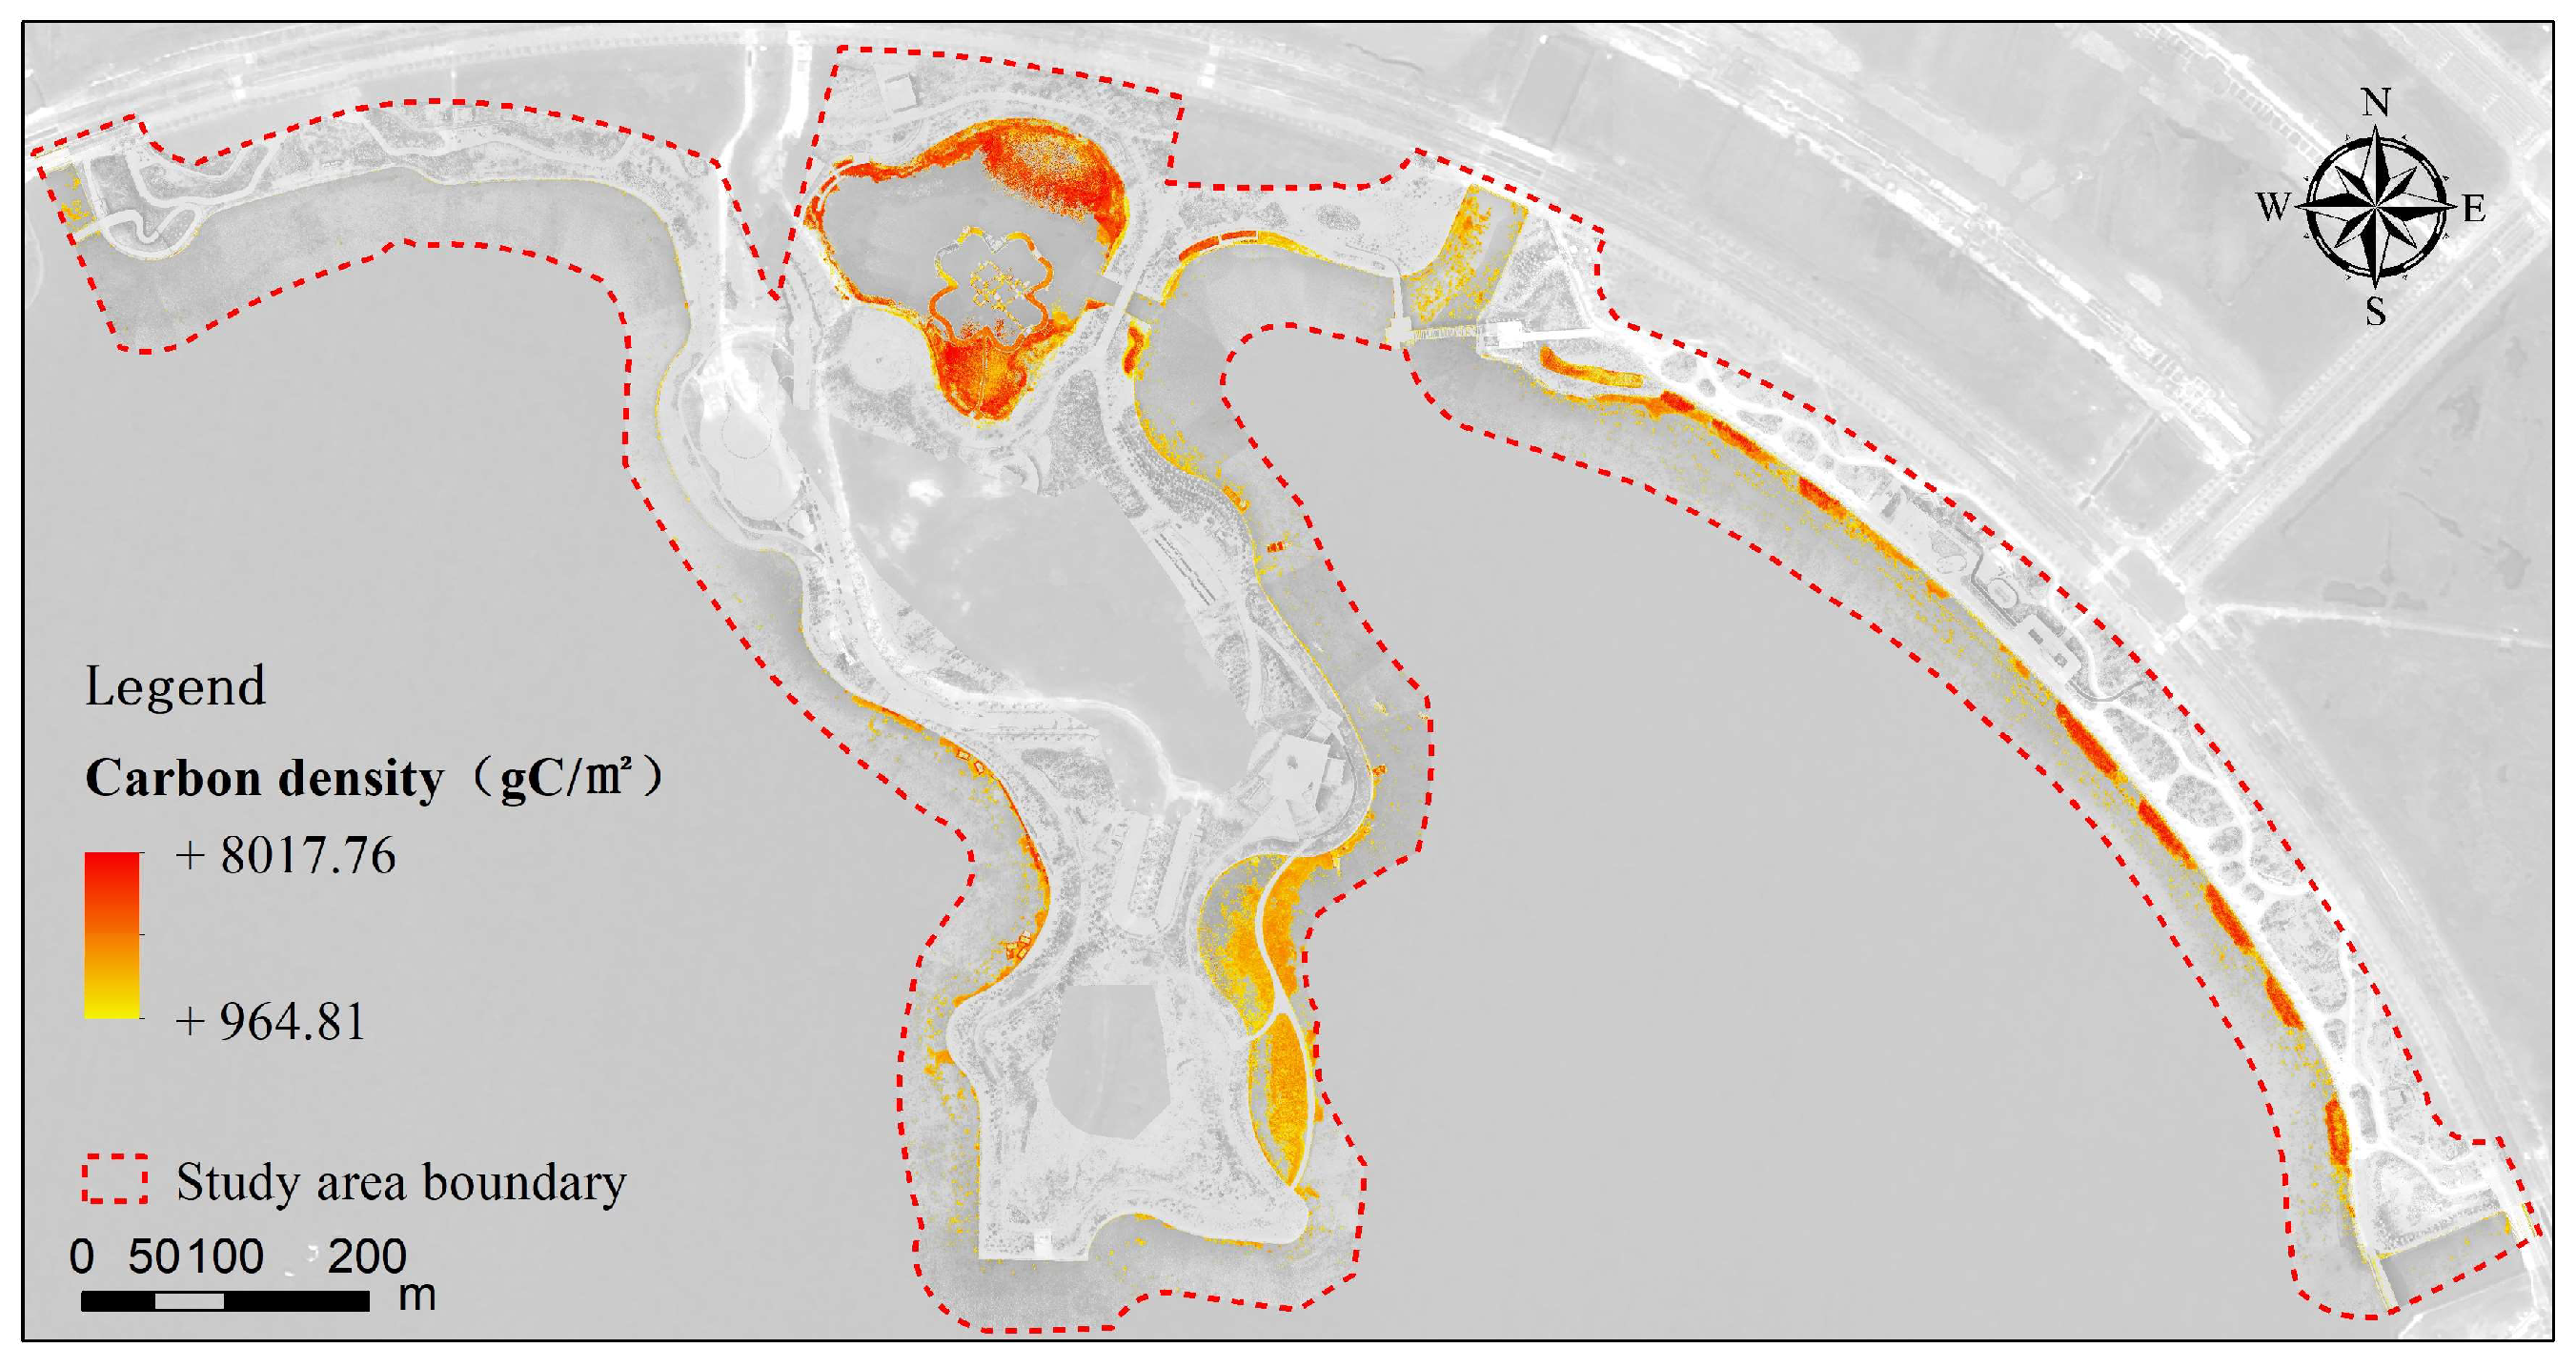
3.5.2. Changes in Carbon Sequestration Patterns

The remote sensing data used for the recent carbon density pattern were captured in September 2023. To study changes in carbon density patterns, remote sensing images from the Shanghai Fish artificial wetland taken on 4 September 2018, with a resolution of 0.8 m, and from the Dishui Lake artificial wetland taken on 5 August 2018, with a resolution of 0.9 m, were selected.
Using remote sensing data and the established carbon density inversion model, the carbon density of the wetland plants and soil was estimated using vegetation indices (such as NDVI and RVI) extracted from the remote sensing images, and the spatial distribution of overall carbon density was further analyzed. The overall average carbon density of the Shanghai Fish wetland plants in 2018 was approximately 1235 gC/m2, and this value was used as the threshold to evaluate the carbon sequestration capacity across the entire area. Overall, the spatial distribution of carbon density capacity in Shanghai Fish in 2018 generally exhibited a banded pattern, with stronger carbon sequestration capacity along the central lakeshore and the northern and southern lakeshore areas, while the capacity in other areas was relatively low. The carbon density of Shanghai Fish exhibited a gradual distribution pattern, increasing progressively from the water area towards the lakeshore. The levels of carbon density ranged from low to medium–low to medium–high, with a few scattered patches of carbon density areas.
The maximum RVI (Ratio Vegetation Index) of the northern island of the Dishui Lake artificial wetland in 2018 was only 1.54, while the RVI of vegetation is typically greater than 2, indicating that there were no wetland plants in this area at this time, and the carbon density in 2018 was zero.
By subtracting the overall carbon density in 2018 from that in 2023, the changes in the carbon sequestration patterns of the two artificial wetlands over the five-year period were obtained.
In terms of changes in the area of carbon sequestration zones, the area of carbon sequestration zones in the Shanghai Fish wetland increased from 25,772 m2 in 2018 to 103,795 m2 in 2023, with 100,293 m2 of increased sequestration distributed throughout the wetland, while the area of decreased sequestration was 2536 m2, mainly located along the northern, central, and southeastern coasts. The equilibrium area (where the change in carbon density did not exceed 50 gC/m2) was 1089 m2, mainly along the inner lakeshore on the eastern side. The entire study area in Dishui Lake showed an increase in carbon sequestration.
Mitsch and Mander highlighted that wetland carbon sequestration rates are influenced by environmental and management factors such as hydrological conditions, vegetation type, and soil organic matter quality. In particular, the hydroperiod, a key factor in methane emissions and carbon sequestration, can significantly impact the overall carbon dynamics in wetlands [53]. This aligns with the observed increase in carbon density in the Shanghai Fish and Dishui Lake artificial wetlands between 2018 and 2023, suggesting that ecological restoration measures, including vegetation optimization and hydrological management, have contributed positively to carbon sequestration. Such findings demonstrate the adaptability and high potential of urban wetlands for carbon storage through targeted management. At the same time, the changes in carbon density exhibited obvious regional characteristics. Specifically, the carbon density in the northern region and nearshore areas of Shanghai Fish increased significantly, with the highest increase reaching 5984 gC/m2, while in some other areas, the growth was slower or even showed a decline, with the most significant reduction being 960 gC/m2. In the northern island wetland of Dishui Lake, the areas with the greatest increase in carbon density were concentrated along the eastern to northern coasts, with the highest increase reaching 8018 gC/m2 (Figure 11 and Figure 12). According to the studies by Xu and Xu [12] and Byun et al. [16], the carbon density of wetlands in Guangzhou and South Korea are 1.50 kg/m2 and 14.6–28.6 kg/m2, respectively, providing a comparison for the carbon density of Shanghai’s wetlands. Based on this comparative analysis, the carbon density of the two Shanghai wetlands was significantly lower than that of the higher carbon density wetlands, indicating that there is still substantial potential for improvement in their carbon sequestration capacity.
Furthermore, by observing the extent of changes in carbon density, it can be seen that the carbon sequestration capacity varied significantly between different areas. The enhanced carbon density along the shoreline and edge zones was due to dense vegetation growth and hydrological conditions, such as the observation that areas along the water’s edge exhibit stronger carbon fixation capacities [52]. Some areas exhibited significant increases in carbon density, indicating a higher potential for carbon absorption and sequestration, while other areas showed smaller increases or even declines, suggesting the need to strengthen ecological protection and management measures to enhance their carbon sequestration capacities.

4. Conclusions

(1)
There were significant differences in the biomass of 20 common wetland plant species in Shanghai, and the ratio of aboveground biomass and underground biomass also varied. Emergent plants had the largest biomass, with Cyperus involucratus having the highest biomass at 27.5 kg/m2, while floating plants had the smallest biomass, with Lemna minor being the lowest at 14.8 g/m2. These differences in biomass were mainly attributed to the type of plant and the development of their root systems. For instance, Cyperus involucratus and Arundo donax gain an advantage in wetland environments through their developed root systems, while plants like Lemna minor and Nymphoides peltate show lower biomass due to their relatively small root systems. The pattern of carbon content in the plants showed little variation in aboveground carbon content, primarily concentrated around 40%, whereas their underground carbon content showed significant variability, ranging from 12.05% to 50.30%. The soil carbon content of the wetland plants was generally low, with Phragmites australis having the highest at 28.50‰ and Vallisneria natans having the lowest at 8.60‰. Most of the carbon assimilated by wetland plants is stored in the wetland soil as sediment, making the carbon density in the soil far higher than in the plants, with the plant carbon density being most significantly influenced by biomass. Cyperus involucratus, Arundo donax, Phragmites australis, Nelumbo sp., and Typha angustifolia rank among the top five plants with the highest carbon density, while Lemna minor, Nymphoides peltate, Najas marina, Ceratophyllum demersum, and Potamogeton crispus are among the five with the lowest carbon density. Overall, the emergent plants exhibited the strongest carbon sequestration capacity, while the floating plants were the weakest. The carbon density of the emergent plants was 287 times greater than that of the floating plants, 2.9 times that of the floating-leaved plants, and 2.6 times that of the submerged plants. Emergent plants play a particularly crucial role in carbon sequestration in wetland ecosystems, closely linked to their well-developed root systems and strong adaptability.
(2)
In these two wetlands, the proportion of wetland vegetation coverage was lower, and wetland vegetation was not the primary surface cover type. The total area of wetland vegetation in Shanghai Fish and the north island of Dishui Lake accounted for approximately 9.69% and 7.55%, respectively. The spatial distribution of wetland vegetation exhibited significant heterogeneity. In the artificial wetland of Shanghai Fish, it was mainly distributed in the northern and central–western regions, while in the north island of Dishui Lake, it was primarily located in the northern inner lake, the southern east coast, and the western east coast. The distribution patterns of wetland vegetation in both wetlands exhibited both strip-like and patch-like characteristics. This distribution pattern reflects the influence of wetland vegetation and water level (affecting water availability and nutrient distribution) on carbon density.
(3)
From 2018 to 2023, the overall carbon density in both artificial wetlands showed a significant increase, indicating that ecological restoration and management efforts in the wetlands had achieved positive results, significantly enhancing their carbon sequestration capacity. In 2018, the average carbon density in Shanghai Fish was approximately 1235 gC/m2, while the overall average carbon density in 2023 was 1563 gC/m2. Dishui Lake had no wetland plants in 2018, so its carbon density was 0, but by 2023, the overall average carbon density had reached 1823 gC/m2. Between them, the highest carbon density increase in Shanghai Fish was 5984 gC/m2, while the highest increase in the north island of Dishui Lake was 8018 gC/m2. In Shanghai Fish, from 2018 to 2023, the overall area of the carbon stock zone increased by about 78,023 m2, with the area of the carbon sequestration zone reaching 100,293 m2, distributed throughout the wetland, while the area of the carbon stock reduction zone was 2536 m2. Overall, Dishui Lake showed an increase in carbon sequestration, particularly significant in the northern and nearshore areas of Shanghai Fish and in the eastern to northern lakeshore areas of the northern island of Dishui Lake. This study demonstrates that wetland management and protection play a positive role in enhancing carbon sequestration capacity, providing important scientific evidence for the future protection and management of wetland ecosystems.

Author Contributions

Conceptualization, J.W.; methodology, J.W.; software, J.W.; validation, M.S.; formal analysis, J.Y. and M.S.; investigation, J.W., J.Y. and M.S.; resources, J.Y. and M.S.; data curation, J.W.; writing—original draft, J.W.; writing—review and editing, S.C. and J.Y.; supervision, J.W. and S.C.; project administration, S.C.; funding acquisition, S.C. All authors have read and agreed to the published version of the manuscript.

Funding

This research and the APC were funded by the National Natural Science Foundation of China (No. 32271934); 2024 Ministry of Education Industry School Cooperation Collaborative Education Project (No. 240901375235216, No. 240906252053643).

Data Availability Statement

The original contributions presented in this study are included in the article; further inquiries can be directed to the corresponding author.

Conflicts of Interest

The authors declare that they have no known competing financial interests or personal relationships that could have appeared to influence the work reported in this paper.

References

  1. Wang, C.L.; An, S.Q.; Zeng, Q.; Zhu, K.Q.; Zhang, K.F.; Xia, Y.X.; Zhao, H. Current status of wetland resources and spatial arrangement of wetland protection in Shanghai. Wetl. Sci. Manag. 2021, 17, 73–76. [Google Scholar]
  2. Li, J.; Jiang, M.; Pei, J.; Fang, C.M.; Li, B.; Nie, M. Convergence of carbon sink magnitude and water table depth in global wetlands. Ecol. Lett. 2023, 26, 499–510. [Google Scholar] [CrossRef] [PubMed]
  3. Zhang, Z.; Jiang, W.; Peng, K.; Wu, Z.F.; Ling, Z.Y.; Li, Z. Assessment of the impact of wetland changes on carbon storage in coastal urban agglomerations from 1990 to 2035 in support of SDG15.1. Sci. Total Environ. 2023, 873, 162824. [Google Scholar] [CrossRef]
  4. Deng, W.B.; Liu, X.Y.; Hu, H.B.; Liu, Z.Q.; Ge, Z.W.; Xia, C.P.; Wang, P.; Liang, L.; Zhu, Z.Y.; Sun, Y.; et al. Carbon storages and densities of different ecosystems in Changzhou City, China: Subtropical forests, urban green spaces, and wetlands. Forests 2024, 15, 303. [Google Scholar] [CrossRef]
  5. Pal, S.; Chattopadhyay, B.; Datta, S.; Mukhopadhyay, S.K. Potential of wetland macrophytes to sequester carbon and assessment of seasonal carbon input into the East Kolkata Wetland ecosystem. Wetlands 2017, 37, 497–512. [Google Scholar] [CrossRef]
  6. Turmel-Courchesne, L.; Davies, M.A.; Guêné-Nanchen, M.; Strack, M.; Rochefort, L. Rewetting increases vegetation cover and net growing season carbon uptake under fen conditions after peat-extraction in Manitoba, Canada. Sci. Rep. 2023, 13, 12345. [Google Scholar] [CrossRef] [PubMed]
  7. Song, J.; Zhang, R.; Wang, Y.; Huang, J. Evolution characteristics of wetland landscape pattern and its impact on carbon sequestration in Wuhan from 2000 to 2020. Land 2023, 12, 582. [Google Scholar] [CrossRef]
  8. Liu, Y.; Li, X.Z.; Yan, Z.Z.; Chen, X.Z.; He, Y.L.; Guo, W.Y.; Sun, P.Y. Biomass and carbon storage of Phragmites australis and Spartina alterniflora in the Jiuduansha salt marsh wetland of the Yangtze River Estuary. Chin. J. Appl. Ecol. 2013, 24, 2129–2134. [Google Scholar]
  9. Lolu, A.J.; Ahluwalia, A.S.; Sidhu, M.C.; Reshi, Z.A. Carbon sequestration potential of macrophytes and seasonal carbon input assessment into the Hokersar wetland, Kashmir. Wetlands 2019, 39, 453–472. [Google Scholar] [CrossRef]
  10. Mei, X.Y.; Zhang, X.F. Research on carbon storage and carbon sequestration function of typical wetland vegetation in the Yangtze River Estuary-A case study of the reed belt in Chongming Dongtan. Chin. J. Eco-Agric. 2008, 02, 269–272. [Google Scholar] [CrossRef]
  11. Wang, S.Q.; Wang, H.Q.; Fang, Y.; Li, K. Carbon sequestration capacity of plant communities in coastal wetlands of Chongming Island. Chin. J. Ecol. 2014, 33, 915–921. [Google Scholar]
  12. Xu, S.J.; Xu, Z.C. Research on carbon sink function of wetland vegetation in Guangzhou. Wetl. Sci. 2015, 13, 190–196. [Google Scholar]
  13. Yu, Q.Z. Preliminary Study on Carbon Storage of Wetland Vegetation in Nansi Lake. Master’s Thesis, Shandong Normal University, Jinan, China, 2011. [Google Scholar]
  14. Zhang, L.; Guo, Z.H.; Li, Z.Y. Progress in research on carbon storage and carbon sinks in mangrove wetlands. Chin. J. Appl. Ecol. 2013, 24, 1153–1159. [Google Scholar]
  15. Euliss, N.H., Jr.; Gleason, R.A.; Olness, A.; McDougal, R.L.; Murkin, H.R.; Robarts, R.D.; Bourbonniere, R.A.; Warner, B.G. North American prairie wetlands are important nonforested land-based carbon storage sites. Sci. Total Environ. 2006, 361, 179–188. [Google Scholar] [CrossRef] [PubMed]
  16. Byun, C.; Lee, S.H.; Kang, H. Estimation of carbon storage in coastal wetlands and comparison of different management schemes in South Korea. J. Ecol. Environ. 2019, 43, 8. [Google Scholar] [CrossRef]
  17. Bernal, B.; Mitsch, W.J. Carbon sequestration in two created riverine wetlands in the Midwestern United States. J. Environ. Qual. 2013, 42, 1236–1244. [Google Scholar] [CrossRef] [PubMed]
  18. Qian, L.W.; Yan, J.F.; Hu, Y.; Gao, L.Y.; Wu, P.F.; Wang, L. Spatial distribution patterns of annual soil carbon accumulation and carbon storage in the Jiuduansha wetland of the Yangtze River estuary. Environ. Monit. Assess. 2019, 191, 750. [Google Scholar] [CrossRef]
  19. Yuan, Y.; Li, X.; Jiang, J.; Xue, L.; Craft, C. Distribution of organic carbon storage in different salt-marsh plant communities: A case study at the Yangtze Estuary. Estuar. Coast. Shelf Sci. 2020, 243, 106900. [Google Scholar] [CrossRef]
  20. Rogerson, R.; Horgan, D.; Roberts, J. Integrating artificial urban wetlands into communities: A pathway to carbon zero? Front. Built Environ. 2021, 7, 777383. [Google Scholar] [CrossRef]
  21. Doughty, C.L.; Langley, J.A.; Walker, W.S.; Feller, I.C.; Schaub, R.; Chapman, S.K. Mangrove range expansion rapidly increases coastal wetland carbon storage. Estuar. Coasts. 2016, 39, 385–396. [Google Scholar] [CrossRef]
  22. Wu, G.F.; Liu, Y.L.; Ji, W.T. Estimating aboveground biomass of submerged vegetation using Landsat 5 TM imagery: A case study of Jiangxi Poyang Lake National Nature Reserve, China. Geomat. Inf. Sci. Wuhan Univ. 2006, 31, 953–957. [Google Scholar]
  23. Villa, J.A.; Mitsch, W.J. Carbon sequestration in different wetland plant communities in the Big Cypress Swamp region of southwest Florida. Int. J. Biodivers. Sci. Ecosyst. Serv. Manag. 2015, 11, 17–28. [Google Scholar] [CrossRef]
  24. Mueller, P.; Ladiges, N.; Jack, A.; Schmiedl, G.; Kutzbach, L.; Jensen, K.; Nolte, S. Assessing the long-term carbon-sequestration potential of the semi-natural salt marshes in the European Wadden Sea. Ecosphere 2019, 10, e2556. [Google Scholar] [CrossRef]
  25. Inamdar, D.; Kalacska, M.; Leblanc, G.; Arroyo-Mora, J. Implementation of the directly-georeferenced hyperspectral point cloud. MethodsX 2021, 8, 101429. [Google Scholar] [CrossRef]
  26. Zhang, S.; Wang, Y.; Zhang, C. Response mechanism of the thermal environment in the karst rocky desertification areas from the perspective of settlement transition. Urban Clim. 2024, 55, 101984. [Google Scholar] [CrossRef]
  27. Jia, X.L.; Han, H.T.; Feng, Y.; Song, P.H.; He, R.Z.; Liu, Y.; Wang, P.; Zhang, K.H.; Du, C.Y.; Ge, S.D.; et al. Scale-dependent and driving relationships between spatial features and carbon storage and sequestration in an urban park of Zhengzhou, China. Sci. Total Environ. 2023, 894, 164916. [Google Scholar] [CrossRef]
  28. Hassan, M.A.; Júnior, S.A.; Silva, T.S. Root-to-shoot ratio variations in wetland plants: Implications for biomass allocation and wetland management. Ecol. Indic. 2021, 128, 107–119. [Google Scholar]
  29. Jin, Q.; Zhang, Y.; Wang, J. Biomass dynamics and carbon sequestration potential in constructed wetlands: A case study of emergent macrophytes. Environ. Sci. Pollut. Res. 2021, 28, 11578–11590. [Google Scholar]
  30. Lee, H.; Kim, K.S. Wetland plant strategies for aboveground and belowground biomass distribution under varying water levels. Aquat. Bot. 2022, 177, 103486. [Google Scholar]
  31. Wang, L.; Xu, X.; Zhao, Y. The role of floating plants in wetland ecosystems: A synthesis of biomass distribution and ecological functions. Wetl. Ecol. Manag. 2023, 31, 287–300. [Google Scholar]
  32. Zhou, Q.; Liu, G.; Yan, Y. Comparative study of biomass and carbon storage in different wetland plant communities. Ecol. Eng. 2022, 181, 106647. [Google Scholar]
  33. Wang, Y.; Bao, H.; Kavana, D.J.; Li, Y.; Xu, W. Effects of vegetation types and soil properties on regional soil carbon and nitrogen in Salinized Reservoir Wetland, Northeast China. Plants. 2023, 12, 3767. [Google Scholar] [CrossRef] [PubMed]
  34. Kalita, S.; Kumar, S.; Sarma, H.P.; Devi, A. Total organic carbon, heavy metal content and metal bioaccumulation in a freshwater wetland of Indo-Burmese province, India. Environ. Pollut. 2021, 270, 116118. [Google Scholar] [CrossRef]
  35. Ren, Y.; Li, X.; Mao, D.; Xi, Y.; Wang, Z. Northeast China holds huge wetland soil organic carbon storage: An estimation from 819 soil profiles and random forest algorithm. Soil Biol. Biochem. 2023, 160, 108–118. [Google Scholar] [CrossRef]
  36. Xiong, J.; Shao, X.; Yuan, H.; Liu, E.; Wu, M. Carbon, nitrogen, and phosphorus stoichiometry and plant growth strategy as related to land-use in Hangzhou Bay Coastal Wetland, China. Front. Plant Sci. 2022, 13, 946949. [Google Scholar] [CrossRef]
  37. Bennett, J.D.; Chambers, L.G. Wetland soil carbon storage exceeds uplands in an urban natural area (Florida, USA). Soil Res. 2022, 60, 531–544. [Google Scholar] [CrossRef]
  38. Wang, J.; Yu, J.; Shen, M.; Che, S. Study on the optimization of carbon sequestration in Shanghai’s urban artificial wetlands: The cases of Shanghai Fish and Dishui Lake. Land 2024, 13, 2148. [Google Scholar] [CrossRef]
  39. Yang, R.R.; Fang, J.H.; Cao, Q.Q.; Zhao, D.; Dong, J.Y.; Wang, R.Q.; Liu, J. The content, composition, and influencing factors of organic carbon in the sediments of two types of constructed wetlands. Environ. Sci. Pollut. Res. 2021, 28, 49206–49219. [Google Scholar] [CrossRef]
  40. Mander, Ü.; Maddison, M.; Valach, A.C.; Soosaar, K.; Kill, K.; Kasak, K. High methane emissions as trade-off for phosphorus removal in surface flow treatment wetlands. Aquat. Bot. 2024, 190, 103719. [Google Scholar] [CrossRef]
  41. Petrovska, I.; Dimov, L. Accuracy assessment of unsupervised land cover classification. Sci. J. Civ. Eng. 2020, 9, 83–88. [Google Scholar] [CrossRef]
  42. Zheng, L.; Wang, X.; Li, D.; Xu, G.; Guo, Y. Spatial heterogeneity of vegetation extent and the response to water level fluctuations and micro-topography in Poyang Lake, China. Ecol. Indic. 2021, 124, 107420. [Google Scholar] [CrossRef]
  43. Huang, W.; Hu, T.; Mao, J.; Montzka, C.; Bol, R.; Wan, S.; Dai, H. Hydrological drivers for the spatial distribution of wetland herbaceous communities in Poyang Lake. Remote. Sens. 2022, 14, 4870. [Google Scholar] [CrossRef]
  44. Fu, H.; Zhou, Y.; Yuan, G.; Peng, H.; Wu, A.; Li, W.; Jeppesen, E. Environmental and spatial drivers for wetland plant communities in a freshwater lake: Reduced coupling of species and functional turnover. Ecol. Eng. 2021, 159, 106092. [Google Scholar] [CrossRef]
  45. Li, Z.Q.; Sun, W.C.; Chen, H.Y.; Xue, B.L.; Yu, J.S.; Tian, Z.F. Interannual and seasonal variations of hydrological connectivity in a large shallow wetland of north china estimated from landsat 8 images. Remote. Sens. 2021, 13, 1214. [Google Scholar] [CrossRef]
  46. An, X.; Jin, W.; Long, X.; Chen, S.; Qi, S.; Zhang, M. Spatial and temporal evolution of carbon stocks in Dongting Lake wetlands based on remote sensing data. Geocarto Int. 2022, 37, 14983–15009. [Google Scholar] [CrossRef]
  47. Shen, X.J.; Jiang, M.; Lu, X.G.; Liu, X.T.; Liu, B.; Zhang, J.Q.; Wang, X.W.; Tong, S.T.; Lei, G.C.; Wang, S.Z.; et al. Aboveground biomass and its spatial distribution pattern of herbaceous marsh vegetation in China. Sci. China Earth Sci. 2021, 64, 1115–1125. [Google Scholar] [CrossRef]
  48. Hao, C.; Zhang, Q.; Chen, M.; Wu, Q.; Feng, Z.; Wang, Q.; Hu, Q. Root C, N and C stoichiometry of 22 plant species in Nanji wetlands of Poyang Lake. Acta Ecol. Sin. 2020, 40, 864–873. [Google Scholar]
  49. Xia, S.P.; Song, Z.L.; van Zwieten, L.; Guo, L.D.; Yu, C.X.; Wang, W.Q.; Li, Q.; Hartley, I.P.; Yang, Y.; Liu, H.; et al. Storage, patterns and influencing factors for soil organic carbon in coastal wetlands of China. Glob. Change Biol. 2022, 28, 6065–6085. [Google Scholar] [CrossRef]
  50. Wang, T.; Mu, C.C.; Sun, Z.Q.; Li, M.L.; Wang, W.J.; Xu, W.; Zhao, H.M. Variation of carbon source and sink along the environmental gradient from lakeside to highlands in Yuanchi swamp wetlands, Changbai Mountains, China. Chin. J. Appl. Ecol. 2023, 34, 2363–2373. [Google Scholar]
  51. Lal, R. Digging deeper: A holistic perspective of factors affecting soil organic carbon sequestration in agroecosystems. Glob. Chang. Biol. 2018, 24, 3285–3301. [Google Scholar] [CrossRef]
  52. Wang, B.; Mu, C.C.; Lu, H.C.; Li, N.; Zhang, Y.; Ma, L. Ecosystem carbon storage and sink/source of temperate forested wetlands in Xiaoxing’anling, northeast China. J. For. Res. 2021, 33, 839–849. [Google Scholar] [CrossRef]
  53. Mitsch, W.J.; Mander, Ü. Wetlands and carbon revisited. Ecol. Eng. 2018, 114, 1–6. [Google Scholar] [CrossRef]
Figure 1. Overall biomass of common wetland plants in Shanghai. Notes1: CINV (Cyperus involucratus); AD (Arundo donax); TA (Typha angustifolia); PA (Phragmites australis (Cav.)Trin. ex Steud); TD (Thalia dealbata); NS (Nelumbo sp.); PCO (Pontederia cordata); AC (Acorus calamus); LS (Lythrum salicaria); VN (Vallisneria natans); AT (Acorus tatarinowii); MS (Miscanthus sinensis); PCR (Potamogeton crispus); CIND (Canna indica); CD (Ceratophyllum demersum); NM (Najas marina); AP (Alternanthera philoxeroides); NY (Nymphaea); NP (Nymphoides peltata); LM (Lemna minor).
Water 17 00650 g001
Figure 2. Overall biomass of different wetland plant types in Shanghai.
Water 17 00650 g002
Figure 3. Overall carbon density of common wetland plants in Shanghai.
Water 17 00650 g003
Figure 4. Overall carbon density capacity of common wetland plants in Shanghai.
Water 17 00650 g004
Figure 5. Map showing the land cover classification of the artificial wetland on the north island of Dishui Lake.
Water 17 00650 g005
Figure 6. Map showing the land cover classification of the artificial wetland at Shanghai Fish.
Water 17 00650 g006
Figure 7. Carbon density and RVI correlation.
Water 17 00650 g007
Figure 8. Spatial distribution plot of overall carbon density levels in Shanghai Fish.
Water 17 00650 g008
Figure 9. Spatial distribution plot of overall carbon density levels in Dishui Lake.
Water 17 00650 g009
Figure 10. Area and proportion of different carbon density zones in the two artificial wetlands.
Water 17 00650 g010
Figure 11. Map illustrating spatial distribution of carbon density changes in Shanghai Fish, 2018–2023.
Water 17 00650 g011
Figure 12. Map illustrating spatial distribution of carbon density changes in Dishui Lake, 2018–2023.
Water 17 00650 g012
Table 1. Carbon density of different wetland plants.
Plant NameCarbon Density (gC/m2)References
Aboveground Live Carbon DensityLitter Carbon DensityTotal Aboveground Carbon DensityUnderground Root Carbon DensityTotal Vegetation Carbon DensitySoil Carbon DensitySoil Depth (cm)
Phragmites australis416 41 457 1551 2008 104930 8
Spartina alterniflora663 56 720 1418 2138 583
Scirpus mariqueter66 -66 245 312 34430 8
Phragmites australis--680 340 1020 --11
Spartina alterniflora--935 175 1100 --
Scirpus mariqueter--260 70 330 --
Phragmites australis800–124050–100850–1340260–10701100–2410--10
Cyperus papyrus--17 91 108 2446 100 19
Nelumbo sp. --79–202927–16681006–1870--13
Note: - indicates the parameter was not measured or analyzed for the respective plant or condition.
Table 2. Carbon content and carbon density of common wetland plants in Shanghai.
No.NameAboveground Carbon Content (%)Underground Carbon Content (%)Aboveground Carbon Density (gC/m2)Underground Carbon Density (gC/m2)
1Alternanthera philoxeroides40.5635.771188.8
2Canna indica39.0434.1928366
3Lythrum salicaria41.9439.791035621
4Typha angustifolia41.3522.721729537
5Nelumbo sp. 38.9150.30 *6412064
6Nymphoides peltate37.21/34/
7Acorus calamus39.5939.146492
8Nymphaea38.9030.94 **5843 **
9Lemna minor34.46/5.1/
10Arundo donax43.6536.1932111421
11Cyperus involucratus39.6730.90 **54554249 **
12Najas marina31.89/101/
13Pontederia cordata37.0919.811195483
14Vallisneria natans26.4312.05369153
15Potamogeton crispus23.18/335/
16Miscanthus sinensis42.9632.23612118
17Thalia dealbata41.5228.241619556
18Phragmites australis40.8634.28 *12021502 *
19Acorus tatarinowii38.6520.21270274
20Ceratophyllum demersum34.08/197/
Notes: / indicates the parameter was not measured or analyzed for the respective plant or condition, * indicates calculated from references, ** indicates the average value of similar plant species.
Table 3. Carbon density of aboveground and underground parts of different wetland plant types in Shanghai.
Plant TypeEmergent PlantsFree-Floating PlantsFloating-Leaved PlantsSubmerged Plants
Carbon content of aboveground part (%)40.4335.8439.7928.90
Carbon content of underground part (%)32.02/33.3512.05
Aboveground carbon density (gC/m2)13902081253
Underground carbon density (gC/m2)456/33 30
Note: / indicates the parameter was not measured or analyzed for the respective plant or condition.
Table 4. Soil carbon content and soil carbon density of different wetland plant types in Shanghai.
ItemsEmergent PlantsFloating PlantsFloating-Leaved PlantsSubmerged Plants
Soil carbon content (‰)15.71/10.708.60
Soil carbon density (gC/m2)3805/18241936
Note: / indicates the parameter was not measured or analyzed for the respective plant or condition.
Table 5. RVI values of different plants and carbon density of different parts.
Plant NameRVI-MAXRVI-MEANAboveground Carbon Density (gC/m2)Underground Carbon Density (gC/m2)Soil Carbon Density
(gC/m2)
Potamogeton crispus4.811.25335//
Najas marina5.513.22110//
Lemna minor6.552.455//
Ceratophyllum demersum6.943.55197//
Vallisneria natans8.294.123691531936
Acorus tatarinowii9.603.032702742352
Alternanthera philoxeroides11.125.4111891824
Miscanthus sinensis16.925.876121182181
Typha angustifolia (Shanghai Fish)20.736.747562593572
Phragmites australis20.929.011202--
Arundo donax21.418.40-1421-
Nymphaea (Dishui Lake)22.119.88-481824
Typha angustifolia (Dishui Lake)25.719.671729537-
Thalia dealbata27.699.3616195562191
Nymphaea (Shanghai Fish)30.016.32-431824
Pontederia cordata32.9113.101195-2826
Nelumbo sp. 38.048.6564120645723
Note: - indicates the parameter was not measured or analyzed for the respective plant or condition, / indicates the parameter was not measured or analyzed for the respective plant or condition.
Disclaimer/Publisher’s Note: The statements, opinions and data contained in all publications are solely those of the individual author(s) and contributor(s) and not of MDPI and/or the editor(s). MDPI and/or the editor(s) disclaim responsibility for any injury to people or property resulting from any ideas, methods, instructions or products referred to in the content.

