Article

Fluoride in Drinking Water and Tea in the Arusha Region of Tanzania

1
Center for Environmental Research and Education, Duquesne University, Pittsburgh, PA 15282, USA
2
Now at Civil and Environmental Engineering, University of Virginia, Charlottesville, VA 22904, USA
3
School of Nursing, Duquesne University, Pittsburgh, PA 15282, USA
*
Author to whom correspondence should be addressed.
Water 2025, 17(4), 546; https://doi.org/10.3390/w17040546
Submission received: 5 December 2024 / Revised: 20 January 2025 / Accepted: 3 February 2025 / Published: 14 February 2025
(This article belongs to the Section Water Quality and Contamination)

Abstract

:
High fluoride concentrations in drinking water affect millions of people around the world. The World Health Organization recommends a fluoride concentration in drinking water below 1.5 mg/L. Fluoride above this concentration can cause long-term problems known as fluorosis, such as mottled teeth and increased risk of dental caries, or skeletal deformities. Rural communities near Arusha, Tanzania have high fluoride concentrations in their water; although, they typically consume even more tea. While tea has the benefit of disinfection by boiling, the tea leaves also impart additional fluoride; our tests with local water and tea show tea to increase fluoride from 3.2 to 6.4 mg/L. In the region, tea is traditionally prepared with milk. To better determine the total fluoride intake in the area, we measured tea prepared with and without milk. Tea infused with water and mixed with milk had 0.3 mg/L or 15% more fluoride compared to the fluoride from the constituents. Tea infused with water and milk had 0.8 mg/L or 40% less fluoride compared to the fluoride from the constituents. This apparent difference in fluoride is small, but the consistent difference from preparations warrants further investigation including reactions that may have caused less fluoride infusion or unknown interferences. Surveys also indicated that residents do not have water within 30 min of their residents, which places them into the Limited category for drinking water as defined by the Joint Monitoring Program.

1. Introduction

In many safely managed drinking water systems, fluoride is added to a concentration of approximately 0.7 mg/L [1] as it binds with calcium in enamel to help build strong teeth and bones [2]. The beneficial range of fluoride in drinking water is 0.5 mg/L to 1.5 mg/L [3,4]. Fluoride above 1.5 mg/L can leach calcium from teeth and jaw bones [2]. Prolonged ingestion of drinking water with fluoride concentrations above the World Health Organization’s (WHO) recommended limit of 1.5 mg/L can cause dental or skeletal fluorosis [5,6]. Dental fluorosis is indicated by mottled teeth and increases the risk of dental caries. Skeletal fluorosis is a chronic metabolic bone disease [7] indicated by an increase in bone mass and density, bony outgrowths at bone surfaces, and the development of cartilaginous lesions in cancellous bones [3,8]. Additionally, tensile strength, energy required for fracture, and modulus of elasticity may be lowered with skeletal fluorosis [7]. Around the world, over 150 million people suffer from some form of fluorosis [3]; a recent assessment estimated that 167 million people consume high (>1.5 mg/L) fluoride water, but provide a confidence interval that encompasses the prior estimate [9]. The majority of people affected by the debilitating effects of fluorosis are from low- and middle-income regions where there is a need for safely managed water systems [4]. Fluoride consumption may also be a risk factor for osteoarthritis [10], which adds to the importance of fluoride consumption.
Groundwater is frequently preferred as a drinking water source due to generally less enteric disease due to its filtration properties and residence time; however, it more often contains a higher concentration of fluoride than surface water [11]. The Arusha region of Tanzania has been known to have high levels of fluoride in groundwater samples as well as issues related to water quantity; specifically, the areas around Mt. Meru were reported over 15 mg/L [12]. The presence of fluoride in groundwater and surface water resources in the region is associated with mineral-rich volcanic rock that surrounds the East African Rift Valley [13].
Aside from water, tea is the most popular beverage worldwide [14,15]. Tea is produced from the leaves of the evergreen shrub, Camellia sinesis, and is classified into three main categories, green, oolong, and black, based on the length of the fermentation of the leaves [14,16]. Herbal teas are produced from several parts of a variety of plants [17], and were not considered in this study. Acidic soil with high mineral content and high humidity in these regions are optimal for the growth of the plant [18,19]. There are local teas grown throughout South Africa and in regions along the east coast of Africa. Minerals in the soil may be accumulated by the tea plant, leading to the accumulation of minerals in tea leaves [19,20]. Some of these minerals, such as fluoride and aluminum, can potentially be harmful for human consumption [19,21,22,23].
Fluoride levels in tea can add to already excessive concentrations in drinking water [24,25,26]. To assess the dietary contribution of tea, we determined the fluoride levels of teas popular in the study area. Traditionally, tea in the Arusha Region is prepared with milk mixed from cows and goats. We hypothesized that the preparation of tea with milk would have a different fluoride concentration available in the beverage.

2. Materials and Methods

2.1. Water Supply

The field study was carried out in a rural community in Arusha Region, Tanzania. The source of water for the community is a spring on the slopes of Mt. Meru, a dormant volcano. We worked with the local Water Board to identify from where the community members retrieve water. We obtained samples from the water taps that the Water Board identified for analysis of fluoride.
We purged taps for 30 s fully open and collected at least 20 mL of sample in a 50 mL conical tube. After collection, the samples were tested for pH and conductivity (Orion Star A329 portable meter, 8107UWMMD ROSS Gel-filled Epoxy pH/ATC Triode, 013010MD DuraProbeEpoxy 4-Probe (K = 0.475) Conductivity Probe, Orion, Thermo Scientific, Chelmsford, MA, USA). Fluoride concentration was measured in accordance with the United States Environmental Protection Agency (USEPA) method 340.2 with a commercial buffer. Equal parts (10 mL each) of sample water and total ionic strength buffer, TISAB II (Orion, Thermo Scientific), were mixed thoroughly by inverting the conical tubes. Samples were equilibrated for one hour at room temperature prior to testing, in accordance with the manufacturer’s specifications. The samples were then tested for fluoride concentration using an F-ion selective electrode (ISE) (Ionplus Sure-Flow Solid State Combination 9609 BNWP, Orion, Thermo Scientific). The ISE was calibrated prior to each set of measurements with standards, combined with equal parts of standard and TISAB, obtained from the manufacturer. The standards were for 1, 2, and 10 mg/L as recommended by the manufacturer. After calibration, the instrument was tested with the 2 mg/L standard and recalibrated if the measurement was outside 1.9 and 2.1 mg/L. After the samples were measured, the instrument was tested for drift with the 2 mg/L standard, and the process was repeated if the measurement was outside 10%, or 1.8 and 2.2 mg/L.

2.2. Household Surveys

We conducted a survey (Survey S1) that included the amount of water and tea consumed. The protocol described in this manuscript was approved by the Institutional Review Board (IRB) of Duquesne University: No. 2018/12/2. We met with the Village Board and determined where and when they permit the surveys. The community is divided into four official sub-villages; households were randomly selected from each of the geographic strata. We divided into two groups, each with an interpreter from the community, fluent in English and Swahili, who interpreted the surveys and responses. Interpretation was limited due to cultural customs and the interpreters’ added local information. We obtained consent from each adult who responded to the survey on behalf of the household. We confirmed that the respondents understood that participation was voluntary and that they could withdraw at any time and skip any questions they were uncomfortable answering. Consent was verbal as the IRB agreed that the study activities presented no higher risk than normal household activities and the documentation of consent presented the largest risk to loss of privacy. The goal was to survey 50 households with no fewer than 40.
The three questions used in this analysis were: (1) Approximately how much water do you use for drinking, including tea, each day? (2) How much tea does your household prepare each day, excluding guests? Lastly, (3) Do you usually treat the water before consumption; if so, how? In the first question, households were asked to estimate in liters as most of the community used standard 20 L plastic jerry cans to collect and store water. In the second question, households were asked to estimate the amount of tea in cups, a non-standard unit, as measurement was not common. For the final question, households were given the options: no treatment, let stand and settle, solar disinfection, ceramic or sand filter, cloth filter, chlorine, boil, or other.

2.3. Tea

A community member demonstrated the common method of tea preparation: water was boiled and tea leaves or bags were added. After the tea was steeped, the tea leaves or bag were removed, and then the tea was poured into a kettle for serving usually with milk; however, the tea tested in Arusha did not have milk added; alkaline solutions require an additional buffer that was not available in the field. We tested the fluoride concentration of the tea by the same procedure as in Section 2.1. The community member also discussed variations that included adding the milk at the start of the boil or with the tea, boiling the mixture after tea leaves were added, and the type of milk used: cow, goat, or combination. The tea was usually a product of half water and half milk; however, this may not capture the range of milk-to-water ratios used.
For laboratory tests, we used deionized (DI) water (18.2 MΩ×cm, no measurable fluoride) and synthetic groundwater (SGW). We prepared SGW according to the standardized protocol proposed by the USEPA [27] to use as standard water for tea infusion in the laboratory experiments; SGW was not anticipated to replicate the local Mt. Meru water and there may be other reactions present in various localities. To prepare 20 L of solution, we mixed 19 L of DI water with 1.20 g magnesium sulfate (Fisher Chemicals, Fair Lawn, NJ, USA), 1.92 g sodium hydrogen carbonate (Fisher Chemicals), and 0.08 g potassium chloride (Fisher Chemicals). This solution was aerated overnight. In a separate flask, we dissolved 1.20 g calcium sulfate dihydrate in 1 L of DI water and added it to the 19 L above. The combined 20 L was aerated again for 24 h before use in tests.
The fluoride concentration of three preparations was measured to determine the relative contribution and potential interactions of the constituents: (1) tea infusions, (2) milk samples, and (3) tea with milk. Duplicate samples were prepared for all tests. Three types of tea were prepared: Bagged Black Tea (Kilimanjaro Premium, Tanzania Tea Company, Moshi, Tanzania), which is sourced from the highlands region in northern Tanzania and includes the geothermal-rich East African Rift Valley, Loose Leaf Black Tea (Green Label Tea, Tanzania), which is a blended tea from several locations in Tanzania, and Bagged Oolong Tea (Bigelow, Fairfield, CT, USA). The first two teas were procured in the study region and represent the tea commonly used; the last tea was procured in the United States and is included here to test a wider range of tea varieties; unfortunately, Bigelow Teas does not disclose the origin of their teas [28].
We boiled 200 mL of deionized (DI) water or (SGW). The water was removed from heat and one tea bag was added. Loose-leaf tea infusions were made using the same boiling process followed by the addition of 2 g of the tea. The solutions were steeped for 5 min. For each trial, 10 mL of sample was collected and mixed with 10 mL of TISAB II in 50 mL conical tubes for measurement by ISE. For the loose-leaf teas, the leaves were allowed to settle before a sample was removed; this was to capture what would typically be ingested.
We measured the mass of the complete tea bag and then removed the tea leaves from the bag. Tea was brewed as if it were loose tea and the fluoride concentration (as a function of concentration per mass of total bagged mass) was compared to the tea brewed in the bag. This should show if the filter bag in the Kilimanjaro Black Tea interacts with the fluoride in the tea.
In the study community, cows and goats were common sources of milk. Anecdotally, we found that cow and goat milk were combined. A commercial milk was also included to provide an additional sample; however, milk in the communities was not pasteurized. Four types of milk samples were prepared: (1) commercial, pasteurized milk (Whole Milk, Trader Joe’s, Pittsburgh, PA, USA), (2) fresh cow’s milk (Goat Rodeo Farm, Allison Park, PA, USA), (3) fresh goat’s milk (Goat Rodeo Farm), and (4) a combination of goat’s and cow’s milk. All milk samples were refrigerated in a cooler during transit and in a 38 C refrigerator in the laboratory. The fresh milk was not sold for human consumption and was not pasteurized. To measure the fluoride in milk, samples were prepared with 10 mL of milk with either 10 mL of deionized water or 10 mL of synthetic groundwater in 50 mL conical tubes. The samples that were a combination of goat’s and cow’s milk were prepared with 5 mL of goat’s milk, 5 mL of cow’s milk, and 10 mL of deionized water or synthetic groundwater.
In alkaline samples such as milk or tea with milk, the hydroxide ions can interfere with the fluoride ISE. To adjust the sample to a pH between 5 and 6, we used a 4.0 M alkaline buffer in accordance with instrument instructions. To prepare the buffer solution, 666 mL of 6.0 M acetic acid was mixed with deionized water to make 1 L of solution. The solution was placed in a water bath, and potassium hydroxide was added in increments of 50 g until the pH of the solution was between 5 and 6. Fluoride standards of 10 mg/L and 2 mg/L were prepared using 100 ppm fluoride standard (Sodium Fluoride, Orion, Thermo Scientific) and deionized water. The preparation standards included 1 mL of the standard, 9 mL of the prepared alkaline buffer, and 10 mL of TISAB II. For samples, 1 mL of the sample was combined with 9 mL of the buffer and 10 mL of TISAB II. For each trial, 1 mL of milk solution, 9 mL of the alkaline buffer, and 10 mL of TISAB II were added to a 50 mL conical tube for measurement by ISE.
Combination samples were prepared with 0.5 mL of tea, as described with SGW and 0.5 mL of milk. One type, labeled “Brewed with Commercial” in figures, was prepared with 100 mL of synthetic groundwater and 100 mL of commercial milk that was boiled; the tea sample was introduced, and the tea was steeped for 5 min before a sample was removed. For each trial, 1 mL of the tea/milk solution was added to 9 mL of the alkaline buffer and 10 mL of TISAB II for measurement by ISE.
After 1 h, all samples were tested for fluoride concentration using the ISE following the sample protocol as Section 2.1. The ISE was calibrated with standards that were prepared in the same manner as the samples: with equal parts standard and TISAB II or with a 1:9:10 ratio of standard to alkaline buffer to TISAB II.

3. Results and Discussion

3.1. Water Quality

Of the multiple sources tested in the community, the mean (and standard deviation, s.d.) of pH, conductivity, and fluoride concentration were 8.5 (s.d. = 0.14), 605 (s.d. = 63.9) μS/cm, and 3.2 (s.d. = 0.59) mg/L, respectively. The fluoride concentration was from 2.6 to 4.2 mg/L, which is above the WHO-recommended value of 1.5 mg/L. This was used as the primary reference for safe fluoride consumption. These values are consistent with other studies conducted on fluoride content in the region [29]. Some areas around Mt. Meru have higher fluoride due to the variations in geology, specifically fluoride-rich minerals, within the same geologic formations [12]. The water infrastructure that serves these communities was installed before 1960 by the British when Tanzania (then, Tanganyika) was a British Protectorate. There are no consistent or centrally available records for the origins or conditions of the pipes.

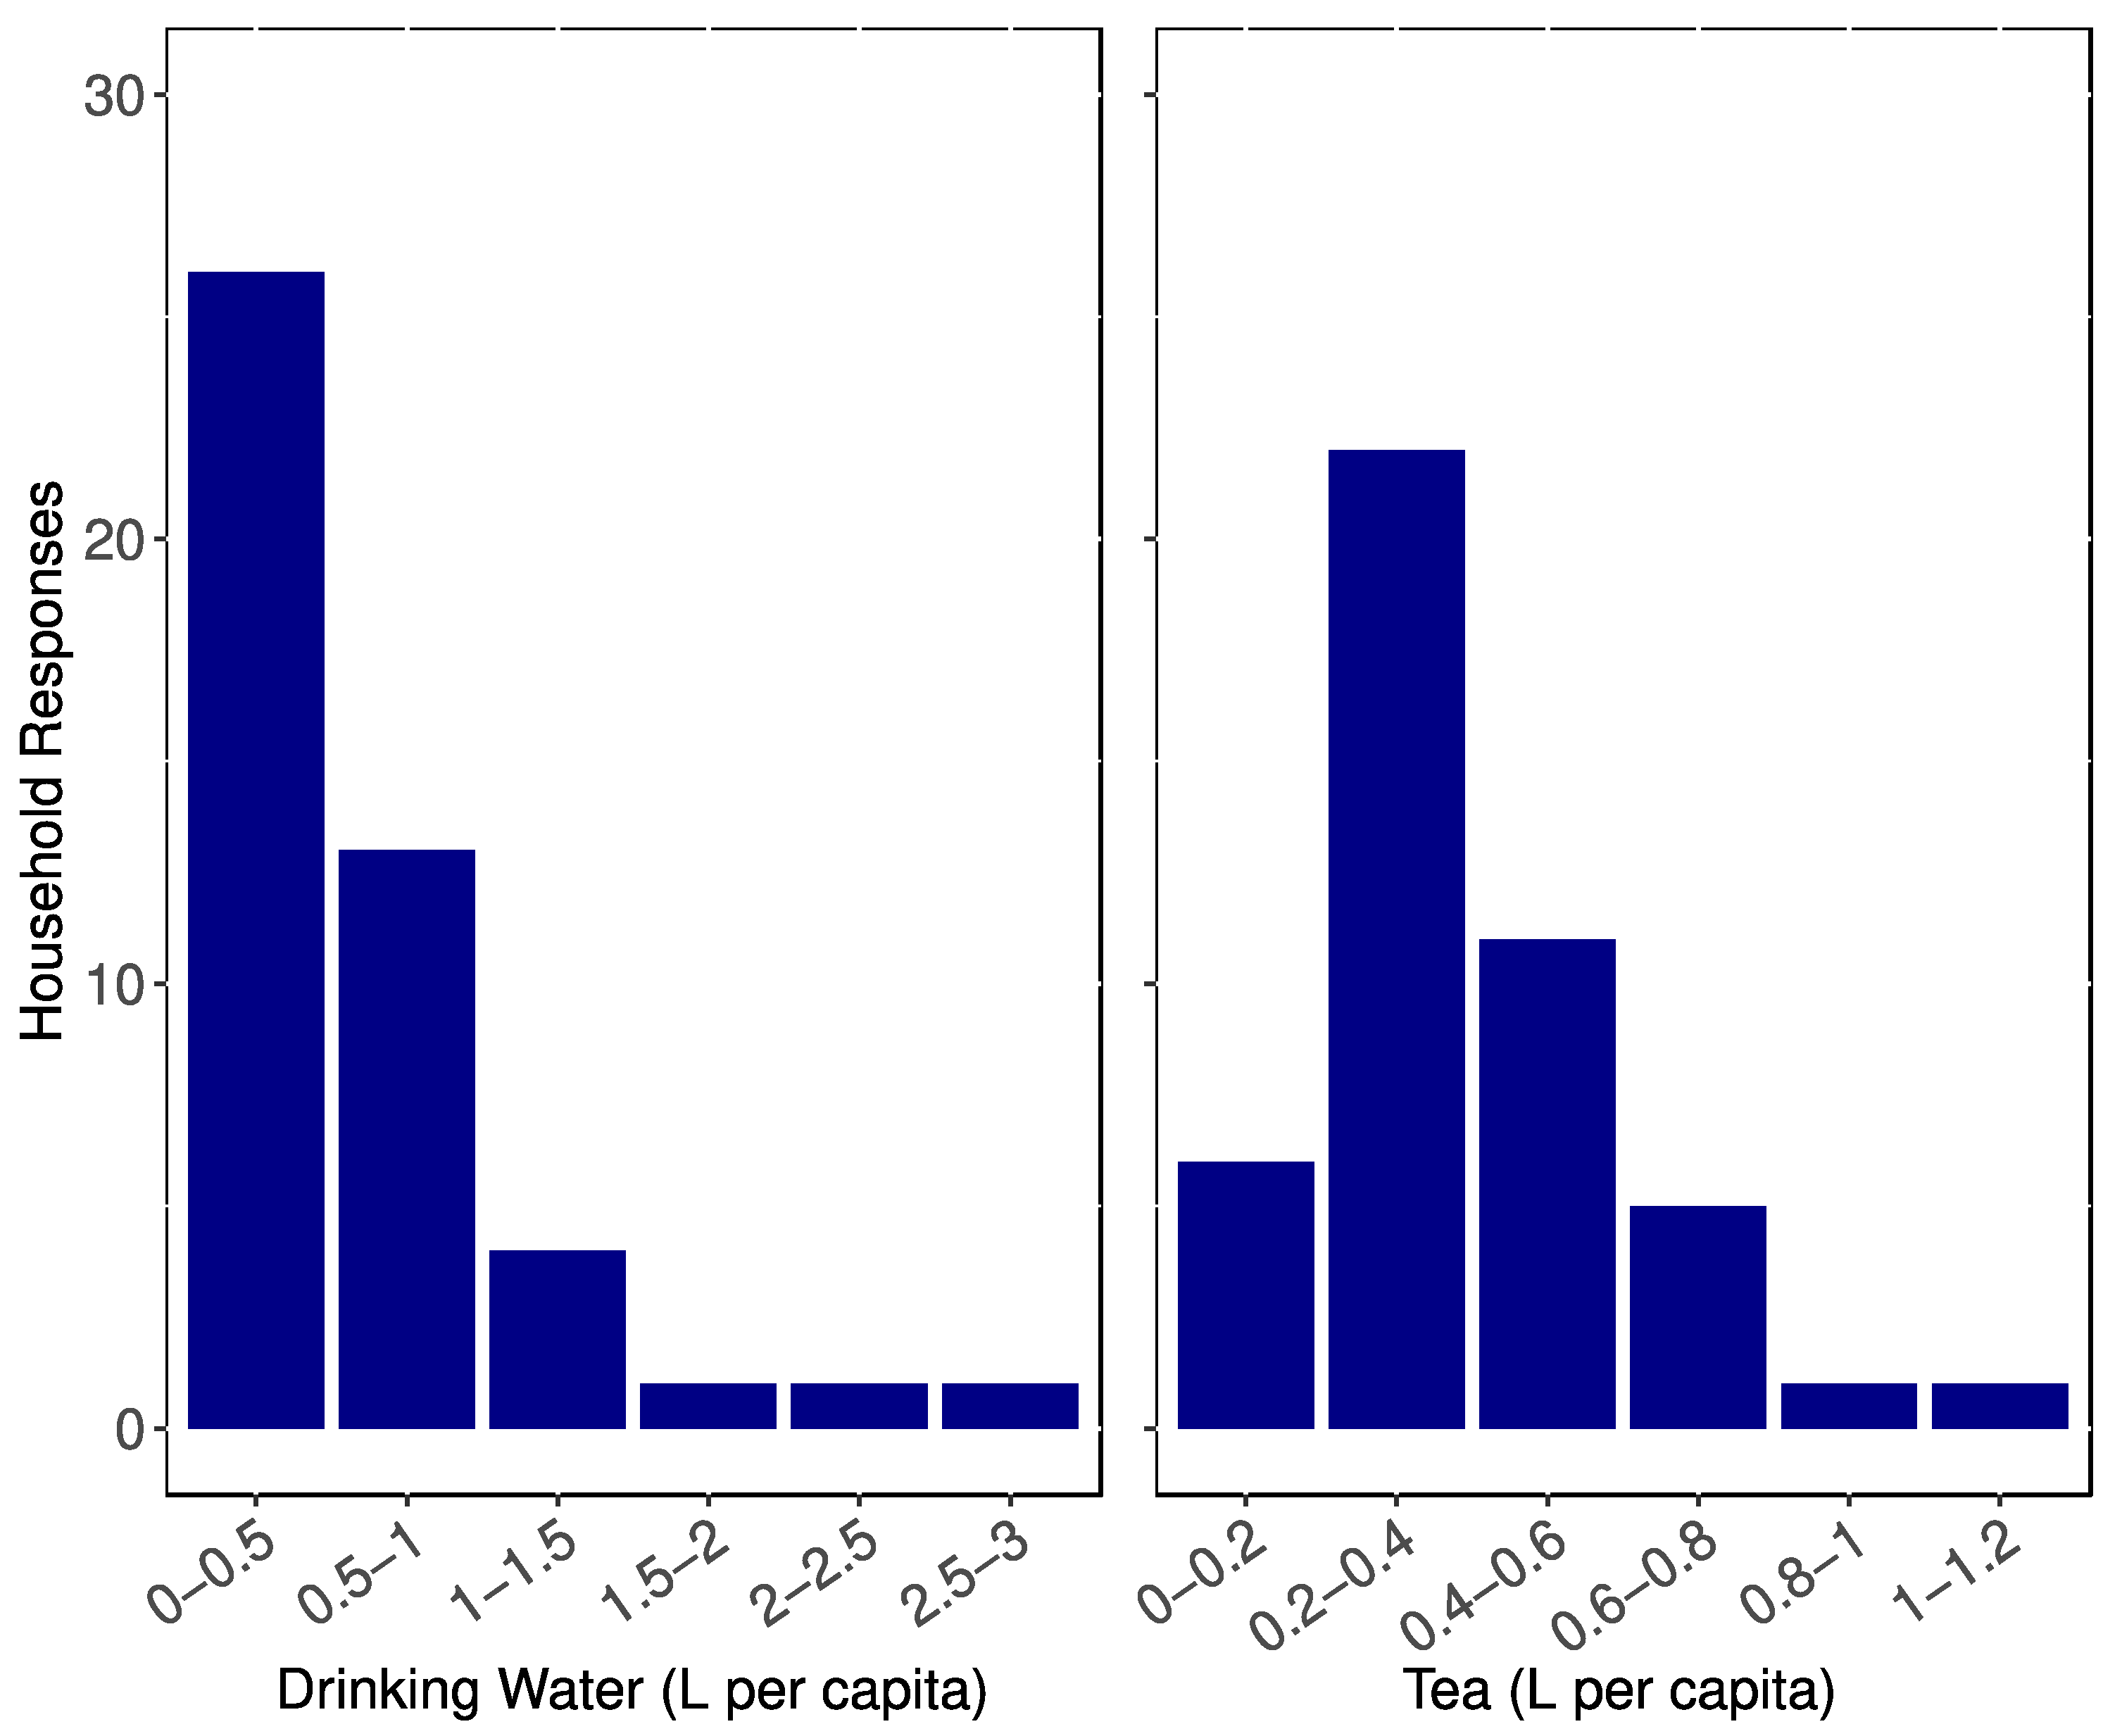
3.2. Water Consumption
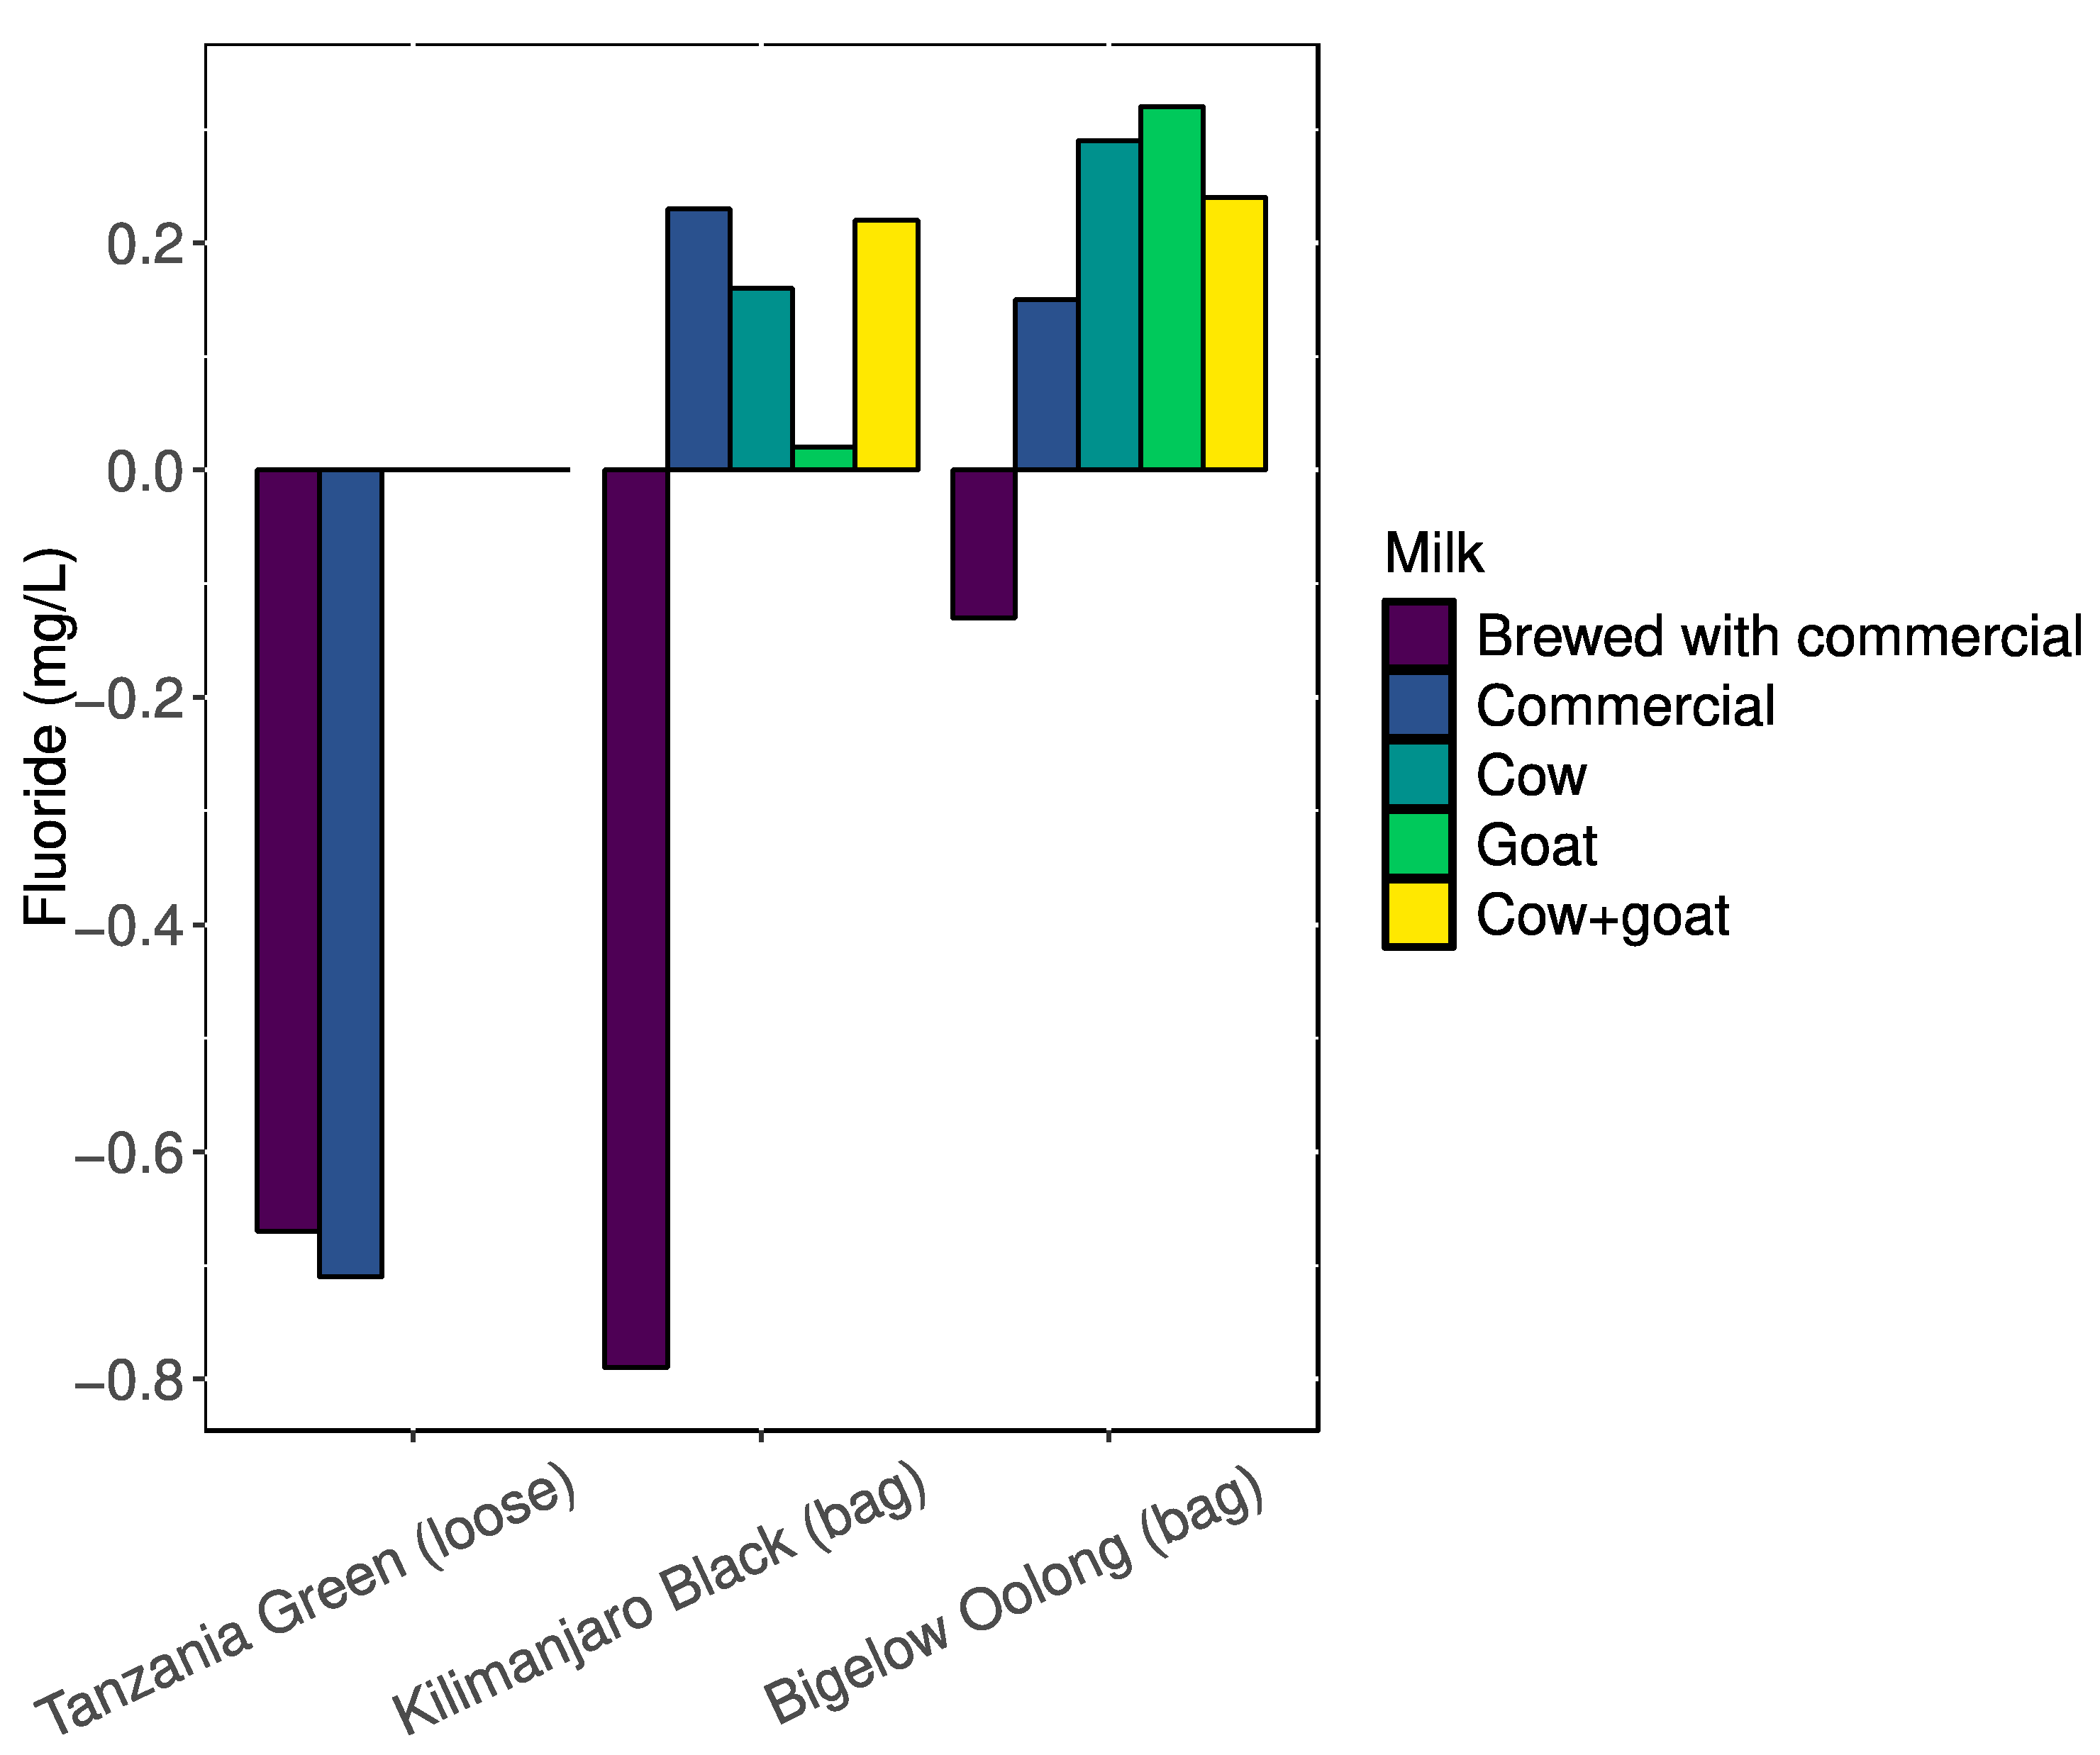
Based on 48 completed household surveys [30], 74% of respondents did not routinely treat their drinking water; when water was treated, boiling water was the only treatment reported. The response to the question, “How much water do you use for drinking (including tea) each day?” had a mean of 2.8 L (s.d. = 3.5), and 0.6 L per capita (Figure 1). The response to the question, “How much tea does your household prepare each day (excluding tea for guests)?” was 1.8 L (s.d. = 1.2). Households were asked to report their household water use in liters and their tea in their own cups, which is not a standard measurement, and for analysis, a cup was estimated to be 0.25 L (Figure 1). Most households reported they consumed as much or more tea than water each day, which could have indicated a misunderstanding of the question or an error in volume estimation; however, these responses were made even after clarifying remarks from the researchers. The question did not capture the amount of water used versus the amount of water and milk mixture, as is common to make tea. This may also reflect the importance of tea in everyday life. It also shows that tea is an important dietary source of fluoride. There remains the potential for errors in volume estimation.

3.3. Tea

Tea without milk prepared in Tanzania had 6.4 mg/L fluoride (standard error, (s.e.) = 0.1, n = 3). We measured the fluoride concentration of the tea in the laboratory with deionized water with Tanzania Green: 3.2 mg/L (s.e. = 0.1, n = 4) (loose leaf black—the label, Tanzania Green, refers to the color of the label, the tea is classified as black tea), Kilimanjaro black: 2.5 mg/L (s.e. = 0.1, n = 6), and Bigelow Oolong: 2.8 mg/L (s.e. = 0.1, n = 4) (Figure 2). These values are comparable with other studies conducted on fluoride concentration in black teas [18,19,31]. We measured the fluoride concentration of the tea in the laboratory with SGW with Tanzania Green: 4.5 mg/L (s.e. = 0.1, n = 2), Kilimanjaro black: 3.3 mg/L (s.e. = 0.0, n = 2), and Bigelow Oolong: 2.7 mg/L (s.e. = 0.0, n = 2) (Figure 2). Loose-leaf black tea had consistently higher concentrations of fluoride than the bagged Kilimanjaro black tea and Bigelow oolong tea. To evaluate the potential impact of the tea bag itself, the tea was removed from the bag and brewed. The Kilimanjaro Black tea without a bag (mean mass with bag 2.31 g, n = 2) had a mean concentration of 2.48 mg/L (s.e. = 0.10) and with a bag (mean mass with bag 2.31 g, n = 2) had a mean concentration of 3.04 mg/L (s.e. = 0.14). This is a consistent difference in concentration per tea mass and is outside the range of standard errors. This difference could be due to heterogeneity in the tea bags or the bag itself. The duration of brewing [26] and water composition can also influence the fluoride content. The loose tea contains larger leaves or leaf fragments compared to the bagged tea. Due to the packaging of the loose tea, the smaller fragments and dust from leaves settled out; furthermore, in this unlined box, the tea dust has either escaped the package (and is trapped in the overwrap, which was discarded) or is trapped in the folds of the box.
Milk typically contains some fluoride and was measured with an alkaline buffer independently (Table 1). Tea in the region is typically prepared or served with milk as half of the solution. The tea tested was tested with milk added after the tea was steeped except for one set of trials with commercial milk, where tea was steeped with milk (Figure 3).
The hypothesis was that the fluoride concentration of the mixture of the tea and milk could be different than the average constituent fluoride concentrations of the tea and the milk through potential reactions between the milk and fluoride. In the tests, no precipitates were observed.
Tea prepared with synthetic groundwater and milk (Figure 3) was compared to tea prepared with synthetic groundwater (Figure 2) plus the fluoride of milk alone (Table 1). The differences (Figure 4) showed where there is more (positive) or less (negative) fluoride in the final combination. Negative results, that is, less fluoride in the tea with milk than the average of the two constituents, suggest fluoride may have sorbed or reacted. Positive results, that is, more fluoride in the tea with milk than the average of the two constituents, may indicate a release of previously bound fluoride. All tea steeped with milk (Figure 4, “Brewed with commercial”) contained less fluoride in the final combination and could indicate a reaction, such as sorption to small tea leaves still in solution, which warrants further investigation.

4. Conclusions

Fluoride can play a beneficial role in bone and teeth mineralization and dental cavity resistance; however, excessive ingestion of fluoride can cause skeletal and dental fluorosis. The Arusha Region is known to have high levels of fluoride in groundwater sources, and these groundwater sources are the main source of drinking water and water for tea [29]. Based on data from household surveys, tea is consumed within the household as much as, if not more than, water; therefore, fluoride in tea is an important parameter. This result is limited to our study community; however, these trends were the motivation for this exploration of the fluoride contribution of tea and, previously under-studied, milk. Black tea with milk is the most common tea prepared in the region. Black tea leaves, loose-leaf or bagged, impart fluoride into the solution, causing an increase in daily intake of fluoride for those consuming the beverage. The average fluoride concentration of drinking water in the study community is 3.2 mg/L. Loose-leaf tea is more commonly used than bagged tea among survey participants, and milk is commonly added during the brewing process. The addition of milk in the heating and steeping process may reduce the fluoride in the solution by as much as 0.8 mg/L or about 40%. This could indicate an inhibition of the fluoride extraction or sequestration of fluoride despite the alkaline buffer and TISAB. The addition of milk after the steeping process may increase the fluoride in the solution by as much as 0.3 mg/L or about 15%. No precipitates were observed when the tea was brewed or mixed with milk. Further exploration is needed to determine the interactions with milk. Based on surveys, residents consume approximately 2 L of tea daily, yielding over 7 mg F, more than from drinking water. This level of excess fluoride consumption places the population at risk of dental and skeletal fluorosis.

Author Contributions

Conceptualization and investigation: S.A.B., A.W., K.G., K.O. and A.B.; Formal analysis: S.A.B., A.W., K.G., K.O., A.B. and D.M.K.; Funding acquisition: D.M.K.; Supervision, D.M.K.; Visualization, S.A.B. and D.M.K.; Writing—original draft, S.A.B.; Writing—review and editing, S.A.B., A.W. and D.M.K. All authors have read and agreed to the published version of the manuscript.

Funding

This work was supported by the Duquesne University’s Paluse Faculty Research Grant, Honors College, Bayer School of Natural and Environmental Sciences, School of Nursing, Center for Community Engaged Teaching and Research, and Center for Environmental Research and Education. S.A.B. and K.O. received travel grants from Duquesne University Honors College to participate in this research. The authors report no conflict of interest.

Data Availability Statement

The survey data used for this research is available [30]. The weather station data available as a result of this research is available [32].

Acknowledgments

The authors would like to acknowledge the efforts of the community for their participation, especially the village leadership and water committee. The authors also thank Pat Patten, Shao, Charles, and interpreters Zablon Ole Muterin and Samwell. The research program presented here builds on the previous relationships built by students from Duquesne University, specifically, Faba Malik and Kim Nguyen, and the support of other faculty and staff, Benjamin Goldschmidt, Plaxedes Chityio, and Luci-Jo DiMaggio.

Conflicts of Interest

The authors declare no conflicts of interest. The funders had no role in the design of the study; in the collection, analyses, or interpretation of data; in the writing of the manuscript; or in the decision to publish the results.

References

  1. USDHHS, U.S. Public Health Service Recommendation for Fluoride Concentration in Drinking Water for the Prevention of Dental Caries; Association of Schools of Public Health: Washington, DC, USA, 2015; Volume 130, pp. 318–331. [Google Scholar]
  2. Jagtap, S.; Yenkie, M.K.; Labhsetwar, N.; Rayalu, S. Fluoride in Drinking Water and Defluoridation of Water. Chem. Rev. 2012, 112, 2454–2466. [Google Scholar] [CrossRef] [PubMed]
  3. Ayoob, S.; Gupta, A.K. Fluoride in Drinking Water: A Review on the Status and Stress Effects. Crit. Rev. Environ. Sci. Technol. 2006, 36, 433–487. [Google Scholar] [CrossRef]
  4. WHO. Guidelines for Drinking-Water Quality: Fourth Edition Incorporating the First Addendum; World Health Organization: Geneva, Switzerland, 2017; p. 631. [Google Scholar]
  5. Aulestia, F.J.; Groeling, J.; Bomfim, G.H.S.; Costiniti, V.; Manikandan, V.; Chaloemtoem, A.; Concepcion, A.R.; Li, Y.; Wagner, L.E.; Idaghdour, Y.; et al. Fluoride Exposure Alters Ca2+ Signaling and Mitochondrial Function in Enamel Cells. Sci. Signal. 2020, 13, eaay0086. [Google Scholar] [CrossRef] [PubMed]
  6. Solanki, Y.S.; Agarwal, M.; Gupta, A.B.; Gupta, S.; Shukla, P. Fluoride Occurrences, Health Problems, Detection, and Remediation Methods for Drinking Water: A Comprehensive Review. Sci. Total Environ. 2022, 807, 150601. [Google Scholar] [CrossRef]
  7. Pramanik, S.; Saha, D. The Genetic Influence in Fluorosis. Environ. Toxicol. Pharmacol. 2017, 56, 157–162. [Google Scholar] [CrossRef] [PubMed]
  8. Sellami, M.; Riahi, H.; Maatallah, K.; Ferjani, H.; Bouaziz, M.C.; Ladeb, M.F. Skeletal Fluorosis: Don’t Miss the Diagnosis! Skelet. Radiol. 2020, 49, 345–357. [Google Scholar] [CrossRef] [PubMed]
  9. Podgorski, J.; Berg, M. Global Analysis and Prediction of Fluoride in Groundwater. Nat. Commun. 2022, 13, 4232. [Google Scholar] [CrossRef]
  10. Meng, X.; Li, H.; Liu, X.; Li, B.; Liu, Y.; Li, M.; Sun, D.; Yang, Y.; Gao, Y.; Pei, J. Drinking Brick Tea Containing High Fluoride Increases the Prevalence of Osteoarthritis in Tibetan, China. Int. J. Environ. Health Res. 2024, 34, 3760–3770. [Google Scholar] [CrossRef] [PubMed]
  11. Onipe, T.; Edokpayi, J.N.; Odiyo, J.O. A Review on the Potential Sources and Health Implications of Fluoride in Groundwater of Sub-Saharan Africa. J. Environ. Sci. Health Part A 2020, 55, 1078–1093. [Google Scholar] [CrossRef] [PubMed]
  12. Smedley, P.L.; Nkotagu, H.; Pellig-Ba, K.; MacDonald, A.M.; Tyler-Whittle, R.; Whitehead, E.J.; Kinniburgh, D.G. Fluoride in Groundwater from High-Fluoride Areas of Ghana and Tanzania; Fluoride in Groundwater from High-Fluoride Areas of Ghana and Tanzania: Nottingham, UK, 2002; p. 72. [Google Scholar]
  13. Kut, K.M.K.; Sarswat, A.; Srivastava, A.; Pittman, C.U.; Mohan, D. A Review of Fluoride in African Groundwater and Local Remediation Methods. Groundw. Sustain. Dev. 2016, 2–3, 190–212. [Google Scholar] [CrossRef]
  14. Malinowska, E.; Inkielewicz, I.; Czarnowski, W.; Szefer, P. Assessment of Fluoride Concentration and Daily Intake by Human from Tea and Herbal Infusions. Food Chem. Toxicol. 2008, 46, 1055–1061. [Google Scholar] [CrossRef] [PubMed]
  15. Yadav, A.K.; Kaushik, C.P.; Haritash, A.K.; Singh, B.; Raghuvanshi, S.P.; Kansal, A. Determination of Exposure and Probable Ingestion of Fluoride Through Tea, Toothpaste, Tobacco and Pan Masala. J. Hazard. Mater. 2007, 142, 77–80. [Google Scholar] [CrossRef] [PubMed]
  16. Karak, T.; Bhagat, R.M. Trace Elements in Tea Leaves, Made Tea and Tea Infusion: A Review. Food Res. Int. 2010, 43, 2234–2252. [Google Scholar] [CrossRef]
  17. Długaszek, M.; Kaszczuk, M. Assessment of the Nutritional Value of Various Teas Infusions in Terms of the Macro- and Trace Elements Content. J. Trace Elem. Med. Biol. 2020, 59, 126428. [Google Scholar] [CrossRef] [PubMed]
  18. Chan, L.; Mehra, A.; Saikat, S.; Lynch, P. Human Exposure Assessment of Fluoride from Tea (Camellia sinensis L.): A UK Based Issue? Food Res. Int. 2013, 51, 564–570. [Google Scholar] [CrossRef]
  19. Wong, M.H.; Fung, K.F.; Carr, H.P. Aluminium and Fluoride Contents of Tea, with Emphasis on Brick Tea and Their Health Implications. Toxicol. Lett. 2003, 137, 111–120. [Google Scholar] [CrossRef] [PubMed]
  20. Simpson, A.; Shaw, L.; Smith, A.J. The Bio-Availability of Fluoride from Black Tea. J. Dent. 2001, 29, 15–21. [Google Scholar] [CrossRef] [PubMed]
  21. Chandrajith, R.; Abeypala, U.; Dissanayake, C.B.; Tobschall, H.J. Fluoride in Ceylon Tea and Its Implications to Dental Health. Environ. Geochem. Health 2007, 29, 429–434. [Google Scholar] [CrossRef] [PubMed]
  22. Gardner, E.J.; Ruxton, C.H.S.; Leeds, A.R. Black Tea—Helpful or Harmful? A Review of the Evidence. Eur. J. Clin. Nutr. 2007, 61, 3–18. [Google Scholar] [CrossRef]
  23. Shen, C.-L.; Yeh, J.K.; Cao, J.J.; Wang, J.-S. Green Tea and Bone Metabolism. Nutr. Res. 2009, 29, 437–456. [Google Scholar] [CrossRef]
  24. Fung, K.F.; Zhang, Z.Q.; Wong, J.W.C.; Wong, M.H. Fluoride Contents in Tea and Soil from Tea Plantations and the Release of Fluoride into Tea Liquor During Infusion. Environ. Pollut. 1999, 104, 197–205. [Google Scholar] [CrossRef]
  25. Yi, J.; Cao, J. Tea and Fluorosis. J. Fluor. Chem. 2008, 129, 76–81. [Google Scholar] [CrossRef]
  26. Pattaravisitsate, N.; Phetrak, A.; Denpetkul, T.; Kittipongvises, S.; Kuroda, K. Effects of Brewing Conditions on Infusible Fluoride Levels in Tea and Herbal Products and Probabilistic Health Risk Assessment. Sci. Rep. 2021, 11, 14115. [Google Scholar] [CrossRef] [PubMed]
  27. United States Environmental Protection Agency. Methods for Measuring the Acute Toxicity of Effluents and Receiving Waters to Freshwater and Marine Organisms; EPA: Washington, DC, USA, 2002; p. 275.
  28. LaPierre, R. Bigelow Tea Response—Ref#000217704A 2019.
  29. Kitalika, A.J.; Machunda, R.L.; Komakech, H.C.; Njau, K.N. Fluoride Variations in Rivers on the Slopes of Mount Meru in Tanzania. J. Chem. 2018, 2018, 7140902. [Google Scholar] [CrossRef]
  30. Bakar, S.; Kahler, D.M.; Bachtlin, A.; Okular, K.; Glancey, K.; Whitewood, A. Assessment of the Fluoride Concentration in Drinking Water and Tea in The Arusha Region of Tanzania. In Duquesne Scholarship Collection; Duquesne University: Pittsburgh, PA, USA, 2021. [Google Scholar]
  31. Koblar, A.; Tavčar, G.; Ponikvar-Svet, M. Fluoride in Teas of Different Types and Forms and the Exposure of Humans to Fluoride with Tea and Diet. Food Chem. 2012, 130, 286–290. [Google Scholar] [CrossRef]
  32. Kahler, D.M. Olkokola Meteorological Station 2019. Mendeley Data, V2. [CrossRef]
Figure 1. Histogram of household-reported daily consumption of water (left) and tea (right). The range of volumes reported is different between the plots; there was a larger range of water reported (n = 46).
Water 17 00546 g001
Figure 2. Fluoride concentrations of tea samples prepared in local water (n = 3, Tanzania Green only) and in laboratory with deionized (DI) water (n = 6 and 4 for Kilimanjaro and Oolong, respectively) and synthetic groundwater (SGW) (n = 2). Error bars indicate standard error.
Water 17 00546 g002
Figure 3. Fluoride concentrations of tea brewed with synthetic groundwater (SGW) and brewed with, or combined with, milk (n = 2 each). Error bars indicate standard error.
Water 17 00546 g003
Figure 4. Difference in fluoride concentration computed in between the tea prepared with milk and the average concentration of the fluoride concentration in the tea and milk independently.
Water 17 00546 g004
Table 1. Fluoride concentrations of milk samples (n = 3) measured by ISE with alkaline buffer and TISAB II.
Milk SampleDeionized WaterSynthetic Groundwater
Fluoride (mg/L)Standard ErrorFluoride (mg/L)Standard Error
Cow0.590.010.690.00
Goat 0.680.000.690.00
Cow + Goat0.720.000.680.00
Commercial0.690.000.660.00
Disclaimer/Publisher’s Note: The statements, opinions and data contained in all publications are solely those of the individual author(s) and contributor(s) and not of MDPI and/or the editor(s). MDPI and/or the editor(s) disclaim responsibility for any injury to people or property resulting from any ideas, methods, instructions or products referred to in the content.

