Abstract
Lake Kotokel, the largest lake on the eastern shore of Lake Baikal, has historically served as an important fishery and recreational resource. However, it underwent an ecological crisis and a Haff disease outbreak in 2008–2009. Hydraulic engineering interventions were subsequently implemented, and the lake was closed to tourism and fishing for an extended period. This study provides the first comprehensive analysis of Lake Kotokel’s water level fluctuations from 1985 to 2022 and evaluates hydrochemical data collected between 2015 and 2024. A comparative assessment of the seasonal variability in Lake Kotokel’s condition during 2023–2024 and 2008–2009 was conducted using various water quality indices, including the Russian Specific Combinatorial Water Pollution Index (SCWPI) and Basic Anthropogenic Load Index (ALI), as well as the international National Sanitation Foundation Water Quality Index (NSF-WQI) and Canadian Council of Ministers of the Environment Water Quality Index (CCME-WQI). Trophic state indices, such as Carlson’s Trophic State Index (CTSI) and the Trophic Index (TRIX), were also applied. The analysis revealed a seasonal decline in water quality, transitioning from pure (“excellent”) and “light eutrophic” index classifications in spring to polluted (“marginal”) and “hypertrophic” index classifications in summer and autumn. This study demonstrated that a combination of unfavorable factors, including significant lake-level fluctuations, prolonged high temperatures during the vegetative period, and the discharge of fracture-vein waters, led to a sharp decline in water quality and an increase in the lake’s trophic status. Elevated levels of iron, manganese, COD, pH, and ammonium detected in water samples in 2024, alongside incidents of fry mortality in spring and summer and intense algal blooms, raise concerns as they may signal a potential recurrence of Haff disease in the lake.
1. Introduction
Water resources are vital for the socio-economic development of nations and are closely connected to public health and well-being [1,2,3]. However, the combination of inefficient and unsustainable management practices with growing uncertainties and risks from climate change and other factors is increasingly threatening the functionality and survival of many aquatic ecosystems [4,5,6]. Along with rivers and groundwater, lakes are among the most important sources of surface freshwater [7,8]. Due to their location in topographic depressions and slow water turnover, lake ecosystems are prone to pollutant accumulation and exhibit heightened sensitivity to environmental changes [9,10,11,12].
The assessment of water quality in aquatic systems within the Lake Baikal basin, alongside evaluations of their ecological state under anthropogenic pressures and global climate change, is particularly vital for Lake Baikal. Recognized as a UNESCO World Heritage Site and an important source of freshwater both regionally and globally, its conservation is of utmost importance [13,14,15]. A chain of small lakes located along Baikal’s eastern shore is notable for its abundant fish resources and diverse aquatic vegetation. The resources and chemical composition of these lakes are significantly shaped by their position within the Baikal Rift Zone, a series of tectonic depressions marked by the discharge of fracture-vein waters through fault systems [16].
Lake Kotokel (also known as Kotokelskoye, and less commonly as Katakel) is the largest lake on the eastern shore of Lake Baikal and the third largest by surface area (68.9 km2) within the Baikal basin, following Lake Khubsugul (Mongolia) and Lake Gusinoye (Buryatia) (Figure 1). Situated just 2 km from Lake Baikal, it is hydrologically connected to it through a network of rivers. Historically, Lake Kotokel ranked among the most productive fisheries in Transbaikalia [17,18]. The lake’s shallow depth contributes to elevated summer water temperatures, reaching 25–26 °C. However, the sharp increase in recreational activities during the 1980s and 1990s, coupled with adverse natural factors, resulted in the loss of its fisheries value and culminated in an ecological disaster [19,20].
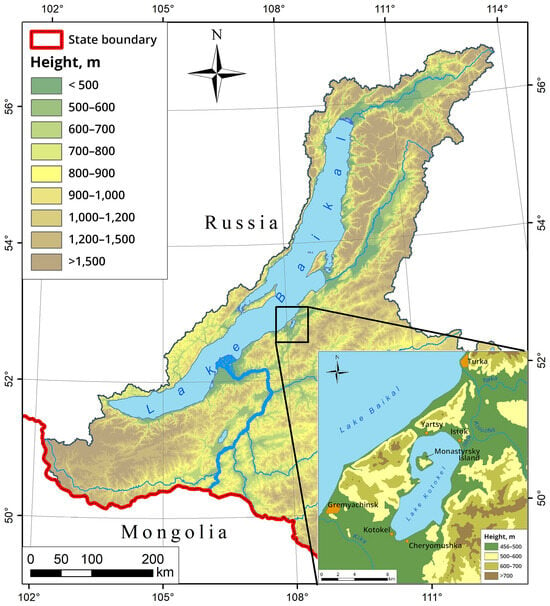
Figure 1.
Russian part of the Lake Baikal basin and the Lake Kotokel basin.
Between April 2008 and late July 2009, the lake experienced mass die-offs of fish and livestock, along with outbreaks of human illnesses, including 17 severe cases and one fatality. Symptoms included skeletal muscle paresis and acute renal failure, diagnosed as Haff disease [17]. The Haff disease outbreak at Lake Kotokel was the longest recorded in Russia, with the lake remaining in an ecological crisis for seven years.
Haff disease, also known as alimentary-toxic paroxysmal myoglobinuria, is a rare and acute disease of uncertain etiology. It sporadically affects fish species such as crucian carp, common carp, pike, burbot, pike perch, perch, ruff, and ide, as well as certain carnivorous animals, birds, and humans [21,22]. The disease is associated with the consumption of fish that acquire toxic properties during their life in contaminated waterbodies [23]. From 1924 to 2024, 31 outbreaks of Haff disease were reported globally [24,25,26,27,28,29]. Despite its century-long history and widespread occurrence, the precise causes and mechanisms underlying Haff disease remain poorly understood.
Retrospective analyses [24] suggested that waterbody toxicity often developed following prolonged periods of low water levels, particularly when succeeded by a rapid rise in levels and flooding of surrounding areas. The blooming of waterbodies, particularly with significant cyanobacterial proliferation, is likely a contributing factor to the formation of toxins associated with Haff disease [30]. In several instances, deviations in Fe, Mn, and COD levels were observed in all collected water samples, while specific samples also showed MAC (maximum allowable concentration) exceedances for As, Al, NH4+, and pH. Additionally, coliform bacteria were detected in bottom sediments [23]. This combination of factors may facilitate the production of the Haff disease toxin, its bioaccumulation in fish, and the emergence of contamination hotspots. Consequently, a comprehensive analysis of hydrological and hydrochemical data to identify risk factors for Gaff disease is an important task.
The only extensive ecological and biological investigation of Lake Kotokel was conducted in 2008–2009, with results published in the monograph “Lake Kotokel: Natural Conditions, Biota, Ecology” [17]. In the 15 years following the Haff disease outbreak and subsequent suspension of the lake’s use, research has been limited to fragmented, short-term, and narrowly focused studies [20,31,32,33,34,35].
A comprehensive ecological assessment of the water quality of Lake Kotokel is very important, given its location within the Baikal Natural Territory and its significant socio-economic value. Such an assessment is critical not only for determining current pollution levels and identifying risk factors for Haff disease recurrence but also for categorizing water quality. This classification can provide a basis for evaluating the effectiveness of implemented conservation measures and guiding the development of new environmental and economic strategies.
The aim of this study is to provide a comprehensive assessment of the ecological state of Lake Kotokel through an analysis of its hydrological and hydrochemical characteristics, an evaluation of water quality, and a determination of trophic status under the influence of anthropogenic impacts and climatic changes.
2. Materials and Methods
2.1. Study Area
Lake Kotokel is situated 2–3 km east of Lake Baikal at an elevation of 461 m above sea level, between the estuarine areas of the Turka and Kika Rivers (Figure 1). The lake is situated within the Baikal hydrogeological folded region, within a basin of fracture waters originating from the Khamar-Daban, Morskoi, and Ulan-Burgasy mountain ranges. The lakebed is extensively intersected by faults [36], facilitating the discharge of fracture-vein waters into the lake. These waters contribute trace elements that are typically present in high concentrations in thermal waters [16]. The geological structure of the Lake Kotokel area consists of stratified Cenozoic sedimentary rocks and intrusive formations of various ages [34,37]. The stratified formations include schists, gneisses, granitoids, and limestones, with a detailed description available in [17]. The terrestrial floor of the Kotokel basin consists of a complex of unconsolidated sediments of aquatic, colluvial, and aeolian origin. The bottom sediments of the coastal zone consist primarily of fine-grained sand with varying degrees of silt. The majority of the lakebed is composed of algal–clay and clayey sapropels in olive or greenish-brown hues, with a thickness of up to 4 m (or up to 8 m according to some sources [38]), averaging approximately 2 m [16,17].
The general characteristics of Lake Kotokel are summarized in Table 1. In the northern part of the lake, there is a large rocky island, i.e., Monastyrsky, with an area of 2.3 km2. The deepest section of the lake lies between its western shore and the island, where a local bottom relief depression has an elongated shape with a depth of up to 14 m. On average, only about 7% of the lake’s surface area has depths exceeding 6 m, while 41% is characterized by depths ranging from 2 to 4 m.

Table 1.
Characteristics of Lake Kotokel.
The climate of the area is continental, with cold winters and moderately warm summers. The average temperature in January is approximately −20 °C, while in July, it rises to about +16 °C. The basin receives an average annual precipitation of around 400 mm [39]. Predominantly northwest winds over Lake Kotokel lead to active mixing of the lake’s waters, resulting in significant sediment deposition in its southern part [17].
The lake basin is characterized by a mountainous relief. Several streams and creeks flow into Lake Kotokel from the Ulan-Burgasy mountain range, which reaches an elevation of up to 783 m along the watershed line. The lake’s outflow occurs through a small river, Istok, which connects to Lake Baikal via the Kotochik and Turka river systems, spanning a total length of 15 km [40]. The flow of the Istok River is unstable and varies greatly depending on the water levels in the lake and the Kotochik River. The lowlands where the streams flow into the lake are swampy. The lake is classified as a water body with a very small specific catchment area of 2.6. Probably, the resources of the reservoir are formed to a greater extent at the expense of the groundwater. The conditional water exchange is equal to 6 years [17].
The shores of Lake Kotokel host four settlements, Yartsy, Istok, Kotokel, and Cheryomushka, with populations ranging from 70 to 145 residents. The primary activities of the local population include fishing, tourism, and logging. Lake Kotokel is extensively used for recreational purposes. Between 1991 and 1993, in addition to the four settlements, 41 recreational and tourist facilities were located along its shores, of which only two were equipped with wastewater treatment systems [31]. The accelerated influx of biogenic substances into the lake, combined with reduced water flow and declining water levels, has resulted in increased phytoplankton biomass, particularly cyanobacteria, which are known producers of toxins [30]. The negative impact on Lake Kotokel’s ecosystem was intensified by the mass proliferation of the invasive Canadian waterweed (Elodea canadensis) and its subsequent large-scale die-off during the 2000s [18].
The progression of these destructive processes, in the absence of effective remediation measures, resulted in a dramatic decline in the lake’s fishery value, with fish catches decreasing by as much as 20-fold [41]. Between spring 2008 and late July 2009, the lake experienced a mass fish die-off, affecting species such as roach, perch, bream, and pike. This event was accompanied by disease outbreaks and fatalities among domestic animals, including cats and dogs, that had consumed fish from the lake. Furthermore, in July 2008, cases of Haff disease were reported among residents of settlements near the lake.
Between June 2009 and May 2017, the use of Lake Kotokel for recreational, drinking, and domestic purposes was prohibited [42]. This reduction in recreational pressure, combined with efforts to improve the lake’s hydrological regime (through the redistribution of inflows and outflows to increase water flow and levels), facilitated the recovery of the ecosystem. In recent years, the number of tourists visiting the lake has shown a steady increase.
In 2023–2024, the Ministry of Natural Resources and Ecology of the Republic of Buryatia (Russia) implemented a series of environmental restoration measures aimed at enhancing the lake’s self-purification capacity and rehabilitating its aquatic ecosystem. These initiatives included cleaning shallow waters and the shoreline of reeds, decayed algae, and bottom sediments, particularly in popular recreational areas, focusing on a 3.9 km stretch of the northern shore.
2.2. Data Sources
Long-term data on the water levels in Lake Kotokel (recorded at the hydrological station in Istok) from 1985 to 2022, as well as precipitation levels and average monthly air temperatures (measured at the meteorological station in Goryachinsk), were obtained from the Buryat Center for Hydrometeorology and Environmental Monitoring (a branch of “Transbaikal Directorate for Hydrometeorology and Environmental Monitoring”, a public-sector entity). These datasets are also publicly available for download from the following online sources: air temperatures and precipitation—https://www.pogodaiklimat.ru (accessed on 10 November 2024) and http://aisori-m.meteo.ru/waisori/ (accessed on 10 November 2024); water level data for Lake Kotokel—https://gmvo.skniivh.ru/ (accessed on 15 October 2024).
2.3. Field Studies
Field studies were carried out from 2015 to 2024 to analyze the hydrochemical parameters of Lake Kotokel. Water samples were collected at locations identified based on bathymetric survey data (covering sites with varying depths) and areas near potential pollution sources, such as settlements and tourist facilities. The sampling points, indicated on the bathymetric map [43], are presented in Figure 2. Samples were collected four times annually, corresponding to different seasons: during the ice-covered period (late February to early March), spring (May), summer (July), and autumn (late September to early October). Between July 2015 and 2021, water sampling was limited to points 2 and 8. In 2022–2023, additional samples were collected at points 10, 15, 16, and 19. By 2024, sampling had expanded to all points indicated on the map, encompassing 22 stations.
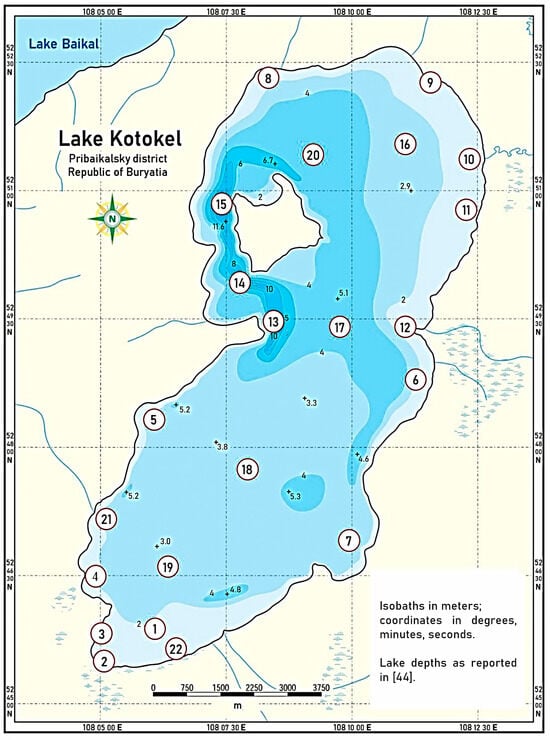
Figure 2.
Sampling points in the water area of Lake Kotokel [44].
Surface water samples were collected from across the lake at depths of 0.2–0.5 m, resulting in a total of 188 samples. Bottom water samples were obtained at depths ranging from 3 to 12 m (depending on the lake depth at the sampling site) using a Patalas sampler, specifically at points 14–19. These locations, situated in the lake’s central area and its deepest areas, yielded a total of 44 bottom water samples.
The sampling procedure was detailed in our previous work [14]. Briefly, water samples were collected in pre-washed polypropylene bottles and filtered through membrane filters with a pore size of 0.45 µm. For heavy metal analysis, the filtered samples were preserved by adding ultrapure HNO3 to adjust the pH to 2. Some physicochemical parameters and components were analyzed on-site. The samples were transported to the institute’s laboratory in a refrigerated box maintained at 1–3 °C and analyzed within two days.
2.4. Laboratory Analyses
The methods of chemical analysis were described in detail in [14] and were performed at the Laboratory of Chemistry of Natural Systems of BINM SB RAS according to standard procedures [44,45,46,47,48,49]. Certain parameters were measured in a field chemistry laboratory on the day of sampling.
Temperature, turbidity, pH value, dissolved oxygen (DO), total dissolved solids (TDS), and the content of hydrogencarbonates, phosphates, ammonium, nitrites, nitrates, as well as chemical oxygen demand (COD) level in water, were measured in a field laboratory using additional equipment (pH tester, Hanna portable instruments (HI 991300, HI 98703, Hanna instruments, Judetul Salaj, Romania), photoelectric colorimeter (PE-5400 UV, Ecroskhim, Saint-Petersburg, Russia) on the day of sampling.
Water pH was measured by the potentiometric method, DO content by the Winkler test with an error 0.3%, and carbonates and hydrogencarbonates were measured by the titrimetric method. Chlorophyll-a and nutrient concentrations were measured using spectrophotometric methods, with an error margin of 2–5%. Nitrite concentration was determined using the Griess reagent, while nitrate concentration was measured using the salicylic acid method. The concentration of ammonium ions was measured using the Nessler reagent. The Deniges–Atkins method, with tin chloride as a reducing agent, was used to determine phosphate concentrations. Total phosphorus concentrations were determined using the ammonium molybdate method after persulfate oxidation with heating. Chlorophyll-a was extracted from phytoplankton cells using a 90% acetone solution prior to photometric quantification.
COD was determined by oxidizing organic substances with excess potassium dichromate in a sulfuric acid solution using silver sulfate as a catalyst, followed by photometric detection (2–5% error). Concentrations of F−, major anions (Cl−, SO42−), and cations (K+, Na+, Ca2+, and Mg2+) were analyzed by ion chromatography (Dionex 1600, Thermo Electron Corporation, San Diego, CA, USA), with 2–5% error. The reliability of the results was ensured through ionic balance error evaluation and by comparing the calculated and measured specific conductivity values. The concentrations of HMs (Fe, Mn, Zn, Ni, Cd, Cr, Cu, and Pb) were determined using an atomic absorption spectrometer (Solaar M6, Thermo Electron Corporation, San Diego, CA, USA) coupled with a graphite furnace and flame atomizer, with an error of 5–10%.
2.5. Assessment of Water Quality and Trophic Status
2.5.1. Water Quality Indices
The water quality of Lake Kotokel was evaluated using both national and international water quality indices. Two national indices—the Basic Anthropogenic Load Index (ALI) and the Specific Combinatorial Water Pollution Index (SCWPI)—were applied alongside two major international indices: the National Sanitation Foundation Water Quality Index (NSF-WQI) and the Canadian Council of Ministers of the Environment Water Quality Index (CCME-WQI). The methodologies for calculating these indices and the corresponding water quality ranking scales (Table S1) are detailed in the Annex.
The Specific Combinatorial Water Pollution Index (SCWPI) is widely used in Russia’s state water quality monitoring system. Surface water pollution levels are assessed using a comprehensive method based on hydrochemical parameters [50]. The SCWPI is calculated using 15 mandatory parameters, with the option to include additional specific pollutants characteristic of particular water bodies. The SCWPI serves as the primary indicator of water quality, classifying water into five categories, from “relatively pure–1” (Class I) to “very poor–5” (Class V) (Table S1). This methodology identifies critical pollution parameters based on the highest amplitude and frequency of exceeding the MAC. These parameters indicate consistent or characteristic pollution levels, with water categorized as “poor” or “very poor” depending on its SCWPI value [50].
The Basic Anthropogenic Load Indicator (ALIb) is a comprehensive, specific metric that represents the cumulative dilution factor needed to reduce the concentrations of key analyte markers of anthropogenic impact to safe levels. These key analyte markers include pH, mineralization, suspended solids, ammonium nitrogen, nitrite nitrogen, nitrate nitrogen, total phosphorus or phosphate phosphorus, total iron, total manganese, chemical oxygen demand (COD), and biochemical oxygen demand (BOD). BOD is considered for waters classified as Classes III–V when COD exceeds 30 mgO2/L [51].
The National Sanitation Foundation Water Quality Index (NSF-WQI) evaluates water quality using nine parameters: biochemical oxygen demand (BOD), DO, nitrate, total phosphorus, temperature, turbidity, total solids, pH, and fecal coliform bacteria [7]. In this study, eight parameters were used, excluding fecal coliform bacteria. Consequently, the weight scores were adjusted accordingly, as detailed in Table S2.
The Canadian Council of Ministers of the Environment Water Quality Index (CCME-WQI), initially developed by the British Columbia Ministry of Environment, Lands, and Parks and subsequently modified by Alberta Environment, was applied in this study [52,53]. Compared to other water quality indices, the CCME-WQI provides several advantages, such as flexibility in the selection of monitoring parameters and the ability to accommodate missing data [54,55].
2.5.2. Trophic State Index
To assess the trophic status of the lake, two eutrophication indices were utilized, i.e., Carlson’s Trophic State Index (CTSI) and the Trophic Index (TRIX), both of which are widely recognized in scientific research [56,57,58,59,60]. The methodologies for calculating these indices are outlined in the Annex, with the trophic status ranking scale presented in Table S3.
2.6. Visualization and Data Analysis
Data on water component concentrations were analyzed using OriginPro software ver. 9.9 (OriginLab Corporation, Northampton, MA, USA). Piper diagrams were plotted in OriginPro to examine the relationships between major anion and cation concentrations in groundwater and to assess groundwater hydrogeochemistry.
Trend analyses of water level data were conducted using the Mann–Kendall (MK) test and Sen’s slope (SS) estimator. The MK test is a non-parametric statistical method widely applied in environmental and climate studies to detect significant upward or downward trends in time series data. To quantify these trends, the SS estimator, a robust method resistant to outliers, was employed to provide reliable estimates of the rate of change. Both tests have been widely used in hydrological, meteorological, and water quality studies [61,62,63]. This study analyzed data on the average water level of Lake Kotokel from 1985 to 2022. The calculations were performed as outlined in [61]. In this study, the MK and SS tests, along with the corresponding p-values, were computed using MS Excel.
3. Results and Discussion
3.1. Analysis of Water Levels
Water levels in lakes can serve as important indicators of the hydrological characteristics of lake systems, reflect climatic changes, and significantly influence the reproduction of certain biotic organisms [64]. Natural climatic variations are often characterized by cyclic processes, such as alternating dry and wet periods or fluctuations in bioproductivity. Poorly drained or closed-basin lakes are fragile systems that are particularly sensitive to climatic variations in the regions where they are situated.
The intra-annual dynamics of air temperature and precipitation for the period 2008–2024, based on data from the nearest meteorological station located 15 km north of Lake Kotokel in the village of Goryachinsk, are shown in Figure 3a,b. The average annual air temperature in the study area was 0.3 °C, while total annual precipitation amounted to 400 mm, with half of it occurring between June and September. The increased precipitation observed in November and December is likely due to the proximity of Lake Baikal, where ice formation begins approximately two months later, in January.
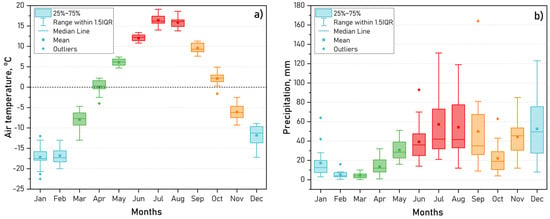
Figure 3.
Air temperature (a) and precipitation (b) according to the meteorological station of Goryachinsk settlement (2008–2024).
The water regime of Lake Kotokel is directly influenced by its inflow and outflow dynamics. The intra-annual variations in the lake’s water level, based on 15 years of daily observations (2008–2022) at the Istok hydrological station (zero mark 453.96 m, Baltic height system), are depicted in Figure 4. During the ice-covered period (November to early May), the water level typically declined slightly due to the freezing of streams and springs that supply the lake. From mid-May, the water level increased sharply, peaking in June as a result of meltwater inflow. Maximum water levels were generally recorded between late June and mid-July.
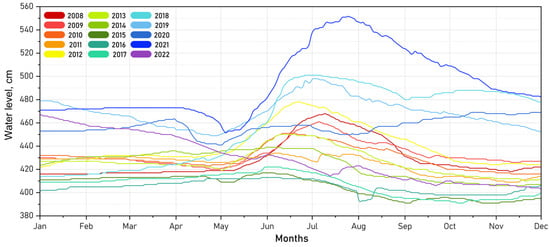
Figure 4.
Long-term dynamics of water levels in Lake Kotokel (hydrological station in Istok, zero mark: 453.96 m, Baltic height system).
This distinct unimodal water level pattern was disrupted in 2003 [17] and during 2015–2016, years characterized by severe droughts and wildfires in the region, when minimum levels were recorded in July–August instead of the usual peak. Atypical dynamics were also observed in 2020 and 2022, the years preceding and following 2021, when an extreme water level rise was documented. During these years, the maximum water levels were recorded in December and January.
Seasonal fluctuations in Lake Kotokel’s water level from 2008 to 2022 generally ranged between 30 and 50 cm, exceeding the 1 m mark only once during this period in 2021 (101 cm).
An analysis of long-term water level data for Lake Kotokel from 1985 to 2022 (Figure 5) revealed recurring periods of high maximum water levels in 1988, 1997, 2006, 2012, 2018, and 2021. Statistical analysis using the MK test (p < 0.05) revealed a significant negative trend (MK = −146; p = 0.014) in average water levels up to 2017, attributed to an extended period of low water availability in the region [65]. The results of the SS test further supported this finding, indicating a decrease in water levels at a rate of −0.667 during this period. In 2018, a shift toward increased water availability began, both regionally and within the Lake Kotokel basin. From 2018 to 2021, the average annual water level in the lake exceeded the long-term mean. In 2021, the lake reached its highest water level in 40 years, resulting in the flooding of settlements located in the coastal zone (Figure 5).
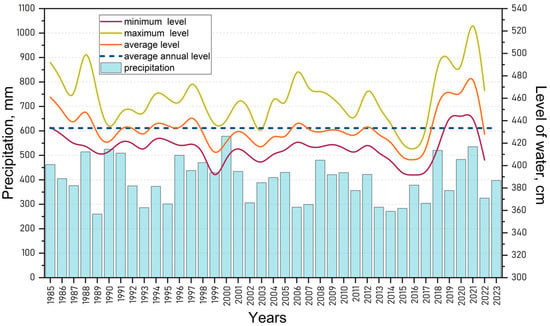
Figure 5.
Long-term fluctuations in water levels in Lake Kotokel in 1985–2022 (hydrological station in Istok, zero mark: 453.96 m, Baltic height system) and precipitation levels (meteorological station in Goryachinsk).
This situation arose following the clearing of the left branch of the Kotochik River in the winter of 2011–2012. During this period, a channel connecting the river to the lake was created, and the mouth of the Istok outflow was also cleared. These measures were designed to enhance the lake’s flow-through capacity, prevent further depletion, and promote self-purification. However, during the subsequent high-water period, the inflow through the channel increased significantly, causing a sharp rise in the lake’s water level and flooding coastal settlements. To mitigate further shoreline flooding, technical facilities were installed on the Kotochik River in early 2022 to regulate the inflow of river water into the lake. These measures resulted in a notable reduction in Lake Kotokel’s water level in 2022, despite heavy regional rainfall. The decline in water levels continued through 2023 and 2024.
An analysis of long-term data on the water levels of Lakes Kotokel and Baikal, as well as regional humidity trends (Figure 6), revealed a stronger correlation between the water levels of Kotokel and Baikal (0.61, p < 0.05) than between Kotokel water levels and precipitation (0.38, p < 0.05) (Figure 7).
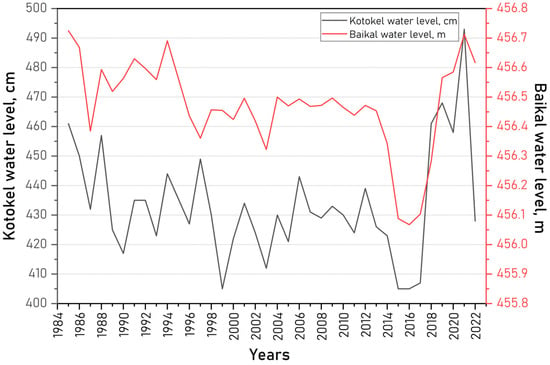
Figure 6.
Long-term trends in water levels in Lake Kotokel (cm, Baltic height system) and Lake Baikal (m, Pacific height system).

Figure 7.
Relationship between the water level of Lake Kotokel and the amount of precipitation (a) and the water level of Lake Baikal (b).
This correlation may be attributed to the hydraulic connectivity of fractured water-bearing horizons within the Baikal hydrogeological folded area, which includes Lake Kotokel [34]. Previous studies have also observed that trends in declining water levels in Lake Kotokel mirrored the hydrological dynamics of the Khaim River basin, located adjacent to the Kotokel Depression, and corresponded with patterns of atmospheric precipitation in the Zabaikalsky Krai [17]. Therefore, the hydrological regime of Lake Kotokel is shaped by the interplay of geophysical processes and water availability of the Baikal Siberia–Trans-Baikal megaregion [17,66].
3.2. Analysis of Physicochemical Conditions, Major Ions, Nutrients, and Heavy Metals
The first comprehensive hydrochemical and biological studies of Lake Kotokel, conducted in 2008–2009 [17], identified prolonged negative changes in the lake’s biota and ecosystem as being primarily linked to cyclical fluctuations in regional water availability during periods of reduced water levels. Research findings from subsequent years, summarized in Table S4, demonstrated considerable variability in specific parameters across different studies.
Long-term fluctuations in lake water levels drive habitat changes, varying across different temporal scales. These changes encompass alterations in the extent of shallow areas, water depths, mineralization, biogenic substance influx from the watershed, water warming dynamics, and the duration of the vegetation period [64].
The results of quantitative chemical analyses of Lake Kotokel’s water, conducted between 2015 and 2024 (232 samples), are summarized in Table 2.

Table 2.
Water characteristics of Lake Kotokel for the period 2015–2024.
Throughout the observation period, Lake Kotokel had its lowest water turbidity and pH values during the under-ice period (0.72–8.28 NTU, pH 6.1–7.5) (Figure 8a–d).
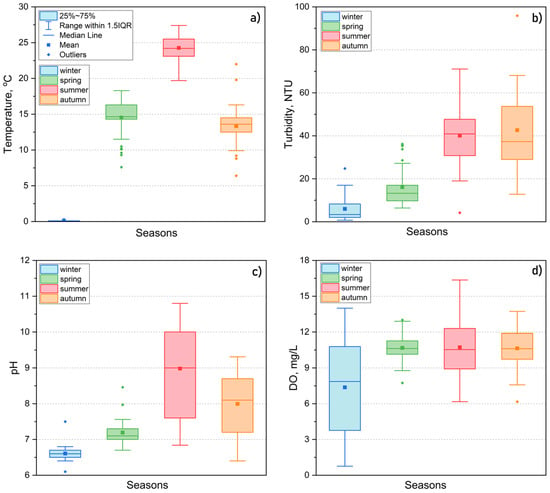
Figure 8.
Physicochemical parameters of Lake Kotokel water in different seasons from 2015 to 2024: (a) temperature, (b) turbidity, (c) pH, (d) dissolved oxygen.
Increased turbidity and pH levels correlated with rising water temperatures, which peaked at 20–27 °C in July, coinciding with the development of phytoplankton. Over the multi-year observation period, the lowest values for turbidity (12.8–23.1 NTU), pH (6.5–7.5), and water temperature (19–21 °C) were recorded during the summer–autumn seasons of 2018 and 2021, when the lake’s water level was at its highest. In contrast, the highest values for these parameters were observed during periods of low water levels. For example, in 2016 and 2024, turbidity reached 50–70 NTU (with peaks of 95–120 NTU registered at specific sites in 2024), pH values ranged from 8.5 to 10.8, while water temperature reached 25.5 °C in 2016 and 27.4 °C in 2024. The elevated turbidity and pH values were attributed to the active development and photosynthesis of phytoplankton, which coincided with algal blooms and aligned with findings reported in the literature [17]. During periods of low water levels in the lake combined with prolonged high summer temperatures, as observed in 2016 and 2024, increased water warming significantly intensified biological processes.
The DO content in Lake Kotokel varied with the hydrological season, with higher levels typically recorded in spring (8.8–11.7 mg/L) due to increased oxygen solubility at lower temperatures (Figure 8a,d). Instances of oxygen supersaturation, reaching up to 200% due to algal photosynthesis, were observed during algal blooms in July 2016 and 2024, with local concentrations reaching 14.60–16.36 mg/L in specific areas of the lake. During the under-ice period, DO concentrations showed significant variability, ranging from 0.76 to 10.18 mg/L across different regions of the lake and between surface and bottom water layers. Low oxygen levels (0.76–3.26 mg/L) were consistently observed in the bottom layers and occasionally in certain surface water areas. The unfavorable oxygen regime in winter is attributed to the absence of under-ice photosynthesis, resulting from continuous snow cover, oxygen consumption during the oxidation of organic matter in the water column and sediments, and the influx of oxygen-depleted groundwater, which is typical during reduced surface inflows in the cold season. Low oxygen levels during the under-ice period frequently resulted in fish mortality. However, during the open-water season, oxygen saturation typically returned to normal levels, even in the bottom layers, due to intensified wind-induced mixing, which created favorable conditions for aquatic organisms.
A comparison with data from 2008 to 2009 revealed that turbidity, pH, and oxygen levels during the ecological crisis mirrored the values and dynamics observed in low-water years, such as 2016 and 2024.
Exceedances of MACfr for fishery reservoirs were recorded during periods of intense algal blooms in low-water, high-temperature years (pH > 8.5, suspended matter > 10 mg/L) and during the under-ice period, when DO levels fell below the normative threshold of 4 mg/L.
3.2.1. Mineralization and Major Ions
The mineralization level of the Lake Kotokel water remained consistently low during the observation period, ranging from 36.2 to 98.0 mg/L. Declines in lake water levels were accompanied by increases in dissolved salt concentrations, particularly during the winter months (Figure 9). Conversely, rises in lake levels—both seasonally and over the long term—led to reductions in TDS, largely due to the influx of low-mineralized tributary and meltwaters in May and June. Notably, the upward trend in lake water levels observed from 2017 to 2021 corresponded to a concurrent decline in the mineralization of the lake waters.
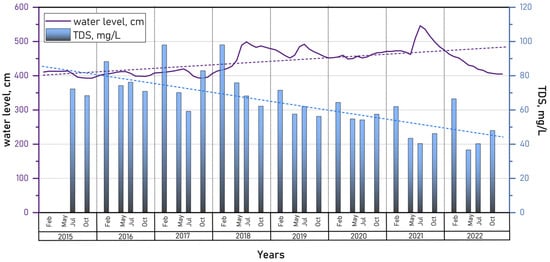
Figure 9.
Seasonal and long-term dynamics of water mineralization in Lake Kotokel from 2015 to 2022 (dashed lines indicate the trend lines of the corresponding parameters).
The analysis of ion concentrations revealed the following sequences for major cations, i.e, Ca2+ > Na+ > Mg2+ > K+, and for anions, i.e., HCO3− > SO42− > Cl−. The concentrations of major ions were plotted on a Piper diagram (Figure 10) [69]. Based on the cation composition, the water of Lake Kotokel was classified within the calcium water zone, with mixed-type waters observed from 2016 to 2020. The hydrogencarbonate ion consistently predominated in the anion composition. Overall, throughout the study period, the lake water was classified in the Ca2+–Mg2+–HCO3− geochemical facies.
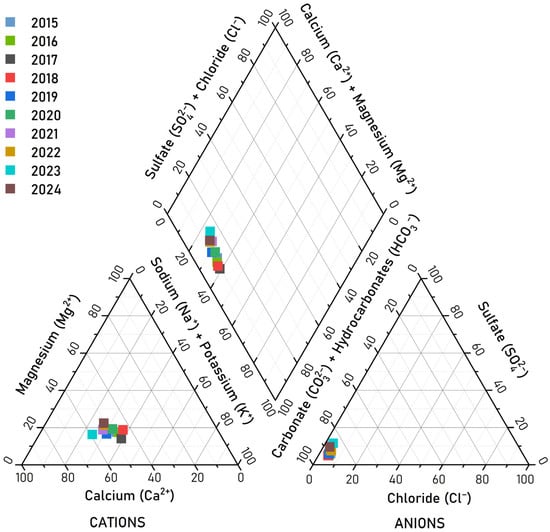
Figure 10.
Relative (%-equiv.) concentration of major anions and cations in Lake Kotokel water in 2015–2024 on a tri-linear Piper diagram.
The ionic composition of the lake water remained stable across both the seasonal and long-term scales and was relatively uniform throughout the lake area. Seasonal variations in anion and cation concentrations from 2015 to 2024, shown in Figure 10, aligned with the trends in mineralization for all ions except sulfates. The observed increase in sulfate concentrations over time may reflect their accumulation due to anthropogenic influences, a pattern previously documented in other aquatic systems within the Baikal Natural Territory, such as Lake Gusinoe [14], and the Selenga [70] and Barguzin [71] Rivers.
Carbonate ions (CO32−) were detected only twice during the observation period: in low concentrations (0.5–2.5 mg/L) in July 2016 and in substantially higher concentrations (up to 16.2 mg/L) in July 2024, exclusively in surface water layers. This occurrence was likely linked to intense phytoplankton photosynthesis during peak bloom periods, which depleted surface water carbon dioxide and shifted the carbonate equilibrium toward CO32− formation from HCO32− [72]. Throughout the study period, no exceedances of the MAC were recorded for mineralization or the concentrations of major ions in the lake water (Figure 11a,b).
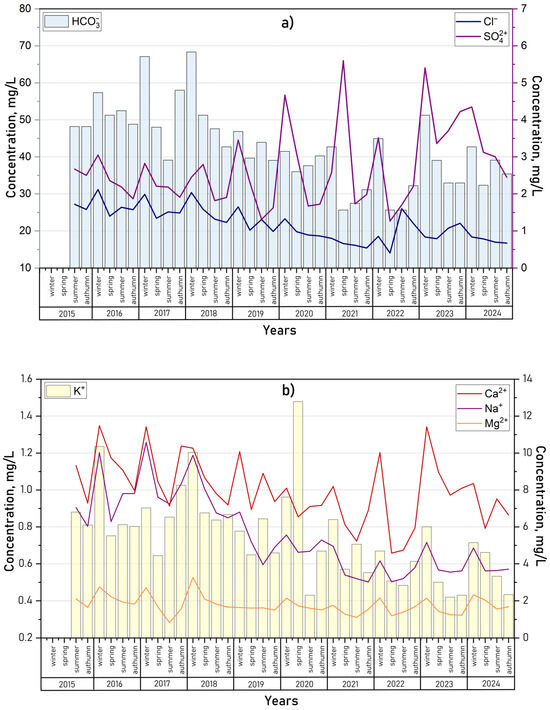
Figure 11.
Seasonal and long-term dynamics of anions (a) and cations (b) in the water of Lake Kotokel.
3.2.2. Nutrients and Organic Matter
In addition to major ions, the water of Lake Kotokel contained biogenic substances that had a minimal influence on mineralization but were essential for the biological processes of aquatic organisms. The concentrations of mineral forms of nitrogen (nitrates, nitrites, and ammonium ions) and phosphorus (phosphates) were low, generally remaining within the MAC (Table 2). The seasonal dynamics of these substances (Figure 12a–d) showed peak concentrations during the ice-covered period, primarily due to the decomposition of organic matter. For ammonium and nitrite nitrogen, a secondary peak occurred during the spring flood period, likely resulting from runoff transporting pollutants from the catchment area. As the growing season commenced, biogenic substance concentrations significantly declined, driven by their rapid uptake by assimilating organisms.
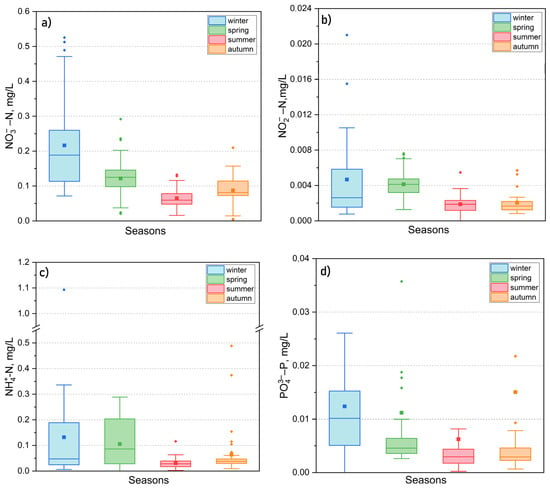
Figure 12.
Seasonal dynamics of mineral forms of nitrogen (NO3−, NO2−, NH4+) (a–c) and phosphorus (PO43−) (d) in 2015–2024.
The seasonal dynamics of total phosphorus in Lake Kotokel exhibited minimal concentrations during the winter, attributed to the absence of organic matter input from the catchment area and the limited development of algae (Figure 13a,b). By autumn, at the end of the vegetation period, total phosphorus concentrations reached their annual maximum, with 90–95% of the phosphorus in organic form. Exceedances of the MAC for total phosphorus were recorded exclusively during periods of intense algal blooms.
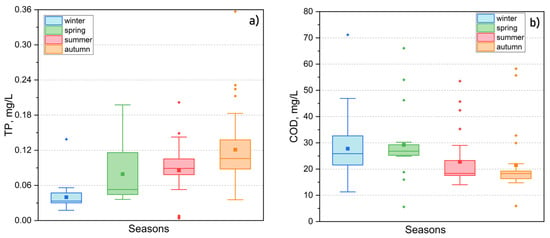
Figure 13.
Seasonal variability in TP (a) and COD (b) in Lake Kotokel from 2015 to 2024.
The chemical oxygen demand (COD) exhibited significant variability, with the highest values recorded during the under-ice period and spring (Figure 13b). These peaks were associated with pollutant inflows from meltwater, particularly runoff from nearby marshy areas rich in humic substances. Occasional high values of COD in Lake Kotokel may be attributed to the influence of local pollution sources. Over the long term, elevated COD levels were observed during the summer and autumn of 2021 (45.7 to 58.9 mgO/L), when a sharp rise in the lake’s water level followed a period of prolonged heavy rainfall, which was attributed to a substantial influx of organic substance inputs from flooded coastal areas. A similar trend in COD dynamics was previously observed in the lakes of the Selenga River delta [73]. Biochemical oxygen demand (BOD5) was measured only in 2024, ranging from 1.8 to 8.3 mg/L. The highest values were observed during the peak of algal blooms in July. MAC exceedances for both COD and BOD5 were noted in 84.6–92.7% of the water samples.
Water availability and the extent of phytoplankton development significantly influenced the seasonal and inter-annual variability in nutrient concentrations in Lake Kotokel. The lowest total phosphorus levels were recorded during periods of elevated lake levels, notably in the summer and autumn of 2018 and 2021, which coincided with reduced water warming. The flooding of adjacent areas contributed to increased concentrations of nitrites, phosphates, and COD levels in the lake waters. In May 2024, ammonium nitrogen levels in all water samples ranged from 0.026 to 0.371 mg/L, with an average of 0.17 mg/L, substantially higher than the average concentration in prior years (0.038 mg/L). This anomaly was likely linked to fish mortality observed during this period, resulting in the decomposition of proteinaceous substances.
The spatial distribution of nutrients in the waters of Lake Kotokel in July 2024 (Table 3) indicated slightly elevated concentrations of ammonium nitrogen, nitrate nitrogen, and COD levels in coastal areas near settlements and tourist facilities, suggesting a potential anthropogenic contribution. Additionally, higher total phosphorus levels in the coastal zone were likely a result of intensified biological activity in the well-warmed shallow waters.

Table 3.
Spatial distribution of biogenic substances in the surface water of Lake Kotokel in July 2024.
3.2.3. Heavy Metals in Water
The influx of heavy metals (HMs) into aquatic systems results from both natural processes (such as rock weathering, wind transport, release from bottom sediments, and organic matter mineralization), and anthropogenic activities (including gaseous emissions, solid and liquid waste from industrial enterprises, municipal utilities, transportation, and agriculture). The seasonal dynamics of HM concentrations in Lake Kotokel (Figure 14) revealed elevated levels of iron, manganese, zinc, and chromium during the under-ice period. This increase was likely due to groundwater inputs, release from bottom sediments, and the mineralization of accumulated plant detritus and organic matter from the preceding growing season. Additionally, spring meltwater, contaminated by runoff from surrounding areas, further contributed to elevated HM concentrations.
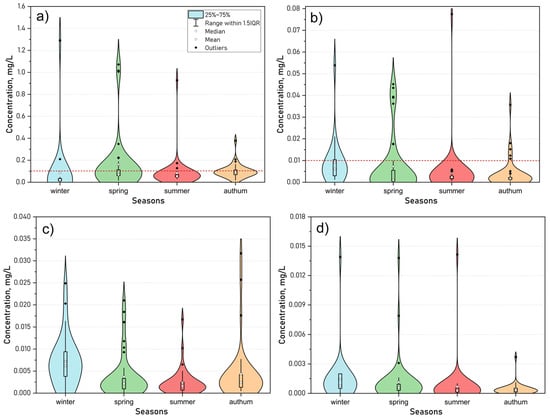
Figure 14.
Seasonal dynamics of Fe (a) (dashed red line—MAC 0.1 mg/L), Mn (b) (dashed red line—MAC 0.01 mg/L), Zn (c) (MAC = 0.01 mg/L), and Cr (d) (MAC 0.05 mg/L) in the water of Lake Kotokel during 2015–2024.
It is particularly noteworthy that during the under-ice periods of 2022 and 2024, exceptionally high concentrations of iron (1.71–3.75 mg/L) and manganese (0.28–0.59 mg/L) were detected in bottom water samples collected near fault zones (the values are not illustrated in the figures). These concentrations exceeded those in surface waters across the lake and bottom waters in other areas by factors of tens to hundreds. The presumed locations of these fault zones were documented in a previous study [34]. Fracture-vein waters entering through fault zones and dispersing along the lakebed are likely responsible for the pronounced heterogeneity observed in heavy metal concentration distribution.
Zinc concentrations during the winter months also displayed significant variability, ranging from 0.001 to 0.032 mg/L, with an uneven spatial distribution. In contrast, during the open-water period, intense wind-driven mixing resulted in a more homogeneous distribution of heavy metals across the lake’s area and depth. Nickel was detected in only a few samples, with occasional concentrations reaching up to 0.024 mg/L. Copper was present in nearly all samples, with minor fluctuations that did not exceed 0.004 mg/L. Lead and cadmium were found sporadically and only in trace amounts.
Exceedances of the MAC were most frequently observed for iron (24.3% of samples) and manganese (16%), followed by copper (9.7%) and zinc (7.6%). Elevated levels of these elements, often at or marginally above MAC thresholds, were characteristic of water bodies in the region [74,75,76]. Exceedances of the MAC for nickel were rare, occurring in only 1.7% of samples, while concentrations of chromium, lead, and cadmium consistently remained well below regulatory standards throughout the study period.
The analysis of the results indicated high spatial and seasonal heterogeneity in the distribution of heavy metal concentrations across the lake’s surface and depth. The spatial variability in HM concentrations in Lake Kotokel was influenced by both the specific metal and the season. In 2024, the highest coefficient of variation for the iron content (261%) was recorded during the under-ice period. Manganese, zinc, and copper exhibited the greatest variability in winter and spring, with coefficients of 193% and 187%, 86% and 93%, and 103% and 87%, respectively. In contrast, nickel and chromium showed the highest variation in summer, with coefficients of 230% and 299%, respectively. Previous studies have highlighted that the substantial variability in trace element contents in lakes along the eastern coast of Lake Baikal is strongly influenced by the impact of northeast-trending fault zones on water resource formation and the chemical composition of lake waters [16]. In Lake Kotokel, the concentrations of iron, manganese, copper, zinc, lead, phosphorus, molybdenum, tungsten, and strontium were found to be the most variable, with dispersions spanning several orders of magnitude [34].
3.3. Water Quality and Trophic Status Assessment
Lakes, alongside rivers, serve as essential sources of surface freshwater, supporting a wide array of living organisms [77]. Freshwater lakes provide vital “goods and services” to humans, including drinking water, fisheries, agricultural irrigation, industrial uses, and recreation [9]. Assessing the suitability of water sources for these uses often relies on water quality indices—effective tools that condense extensive and complex water quality data into a single value [78]. These indices facilitate the logical organization of information, enabling the clear representation of annual cycles, spatial and temporal variations, and long-term trends in water quality [79]. Water quality indices are essential for the evaluation and monitoring of water bodies, offering a foundation for efficient water resource management [80].
In this study, the indices were calculated using the most comprehensive datasets available, specifically from 2023 and 2024, which included a large number of samples and a wide range of parameters. For comparison, indices were also calculated using data from 2008–2009—a period characterized by the critical ecological state of Lake Kotokel and the documented occurrence of Haff disease [17]. Considering the pronounced seasonal variability in the hydrochemical properties of Lake Kotokel observed during this study, all indices were calculated for each season separately. This approach allowed for a detailed analysis of seasonal influences on water quality and the trophic status of the lake.
3.3.1. Water Quality
Water quality was evaluated using two Russian indices: the Specific Combinatorial Water Pollution Index (SCWPI), employed within the Russian state water monitoring system, and the Basic Anthropogenic Load Indicator (ALIb), a recently developed tool for the ecological assessment of water bodies. Additionally, two globally recognized and widely applied indices—the National Sanitation Foundation Water Quality Index (NSF-WQI) and the Canadian Council of Ministers of the Environment Water Quality Index (CCME-WQI)—were utilized (Figure 15, Table S5).
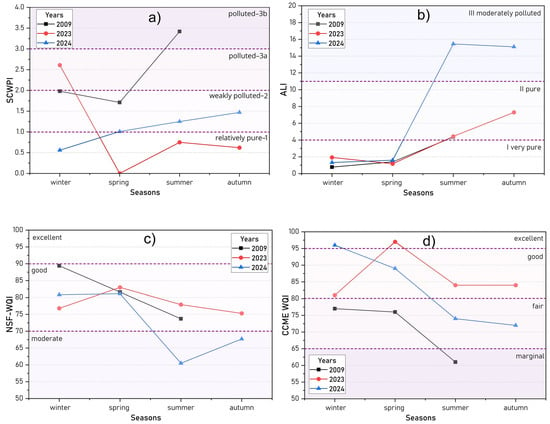
Figure 15.
Seasonal dynamics of water quality based on calculated indices: SCWPI (a), ALI (b), NSF-WQI (c), and CCME-WQI (d) for 2009, 2023, and 2024.
The SCWPI calculations considered 18 parameters, including DO, pH, NO2−, NO3−, NH4+, PO43−, Ptot, COD, BOD, Cl−, SO42−, Fe, Mn, Zn, Cu, Pb, Cd, and Ni. Of these, 11 parameters were classified as pollutants due to exceedances of MACfr recorded throughout the year (Table 4). Separate SCWPI calculations were performed for bottom water samples collected during the under-ice period, given the substantial differences in hydrochemical parameters between these samples and surface water. This approach enabled a more precise assessment of seasonal and spatial variations in water quality.

Table 4.
Pollution type, level, and indicators of water pollution in Lake Kotokel (based on the SCWPI).
The analysis of the frequency and magnitude of MAC exceedances revealed the nature and level of pollution for various parameters. Persistent low-level pollution was observed across all seasons from both poorly biodegradable (COD) and easily biodegradable (BOD) organic substances, with 92.7% and 84.6% of samples, respectively, exceeding standards by factors of 1.2 to 3.9. During the under-ice period, MAC exceedances were most commonly observed for DO, iron (Fe), manganese (Mn), and zinc (Zn), while in the summer season, pH and total phosphorus (TP) exceedances were predominant. Exceedances for mineral nitrogen compounds (NO2−, NH4+) occurred sporadically and were classified as low or moderate pollution events.
Critical water pollution indicators (parameters determining the “very poor–5” classification based on both concentration levels and detection frequency [50]) varied over the study period. In winter 2008–2009, Mn was identified as the critical parameter, while in summer 2009, it was Fe. For bottom water layers, the critical parameters were DO and Mn during winter 2023 and only DO during winter 2024.
According to the SCWPI values, the water quality of Lake Kotokel in 2023–2024 varied seasonally. During spring, summer, and autumn 2023, as well as winter 2024, the lake water was classified as Class I—“relatively pure–1”, while in spring, summer, and autumn 2024, it fell to Class II—“weakly polluted–2”. The poorest water quality occurred during the under-ice period, classified as Class III (“polluted–3a” and “polluted–3b” sub-classes), particularly in the bottom water layers where the lowest quality was recorded (Table S5).
For the earlier period of 2008–2009, the SCWPI values indicated worse water quality compared to 2023–2024. In summer 2009, the water quality was classified as Class III (“polluted–3b”). During this period, exceedance ratios for Fe, Cu, Mn, Zn, and pH ranged from 2.02 to 2.56, while those for BOD, COD, and NO2− were 1.47, 1.76, and 1.20, respectively.
The Basic Anthropogenic Load Indicator (ALIb) was calculated using 10 parameters (pH, TDS, SM, NO2−, NO3−, NH4+, PO43−, COD, Fe, Mn). For surface water, the average ALIb values during winter and spring across the study period ranged from 0.78 to 1.93, corresponding to Class I—“very pure”. However, seasonal water quality deterioration during summer and autumn resulted in a classification of Class II—“pure”, with more significant degradation in 2024 reaching Class III—“moderately polluted”, driven by elevated pH levels and increased concentrations of suspended solids. A separate ALIb analysis for bottom water during the winter of 2023–2024 was carried out. In winter 2024, average concentrations of Fe exceeded the MAC by 10 times, while Mn levels exceeded 3–5 times the MAC value. Additionally, suspended solids and COD surpassed the MAC by nearly twofold. Consequently, bottom water during this period was categorized as Class III—“moderately polluted” (Table S5). Water quality during the winter, spring, and summer of 2008–2009 was comparable to that of 2023, while the poorest quality was recorded in the summer and autumn of 2024 (Figure 14).
The NSF-WQI values for Lake Kotokel during 2008–2009, 2023, and the winter and spring of 2024 ranged from 73.7 to 89.4, classifying the water as having “good” quality. In contrast, indices calculated for bottom water during the ice-covered period of 2023–2024 and for surface water in the summer and autumn of 2024 ranged from 46.4 to 81.9, with average values of 68.6, 60.5, and 67.7, respectively. These values corresponded to “moderate” water quality.
The calculation of the CCME-WQI showed that in 2023, the water of Lake Kotokel was classified as “good” quality year-round, with “excellent” quality observed in spring. In comparison, data from 2008–2009 indicated “fair” quality in winter and spring, deteriorating to “marginal” quality in summer. A similar trend emerged in 2024, with the CCME-WQI values for surface water decreasing from 96 (“excellent” quality) in winter to 72 (“fair” quality) in autumn. Notably, the CCME-WQI for bottom water during the ice-covered period of 2024 reflected “marginal” quality (Table S5).
These findings highlighted variability in water quality assessments depending on the index used. Among the indices, only the SCWPI and CCME-WQI demonstrated an overall improvement in the water quality of Lake Kotokel over the 15-year period. Conversely, the ALI and NSF-WQI indicated a decline in quality during the summer and autumn of 2024 compared to 2008–2009.
The results of the calculations of these indices contradict the documented ecological crisis of the lake ecosystem during that period.
3.3.2. Trophic Status Assessment
Eutrophication, marked by increased biological productivity in aquatic systems due to the accumulation of biogenic elements, can result from both anthropogenic and natural processes [81]. Anthropogenic eutrophication, driven by intensified biogenic inputs from human activities, progresses significantly faster than its natural counterpart [82,83,84]. Although the concentration of biogenic elements in water serves as a key indicator of eutrophication, the development of productive processes is influenced by a range of abiotic factors, including the hydrological regime and recreational use of the waterbody.
Figure 16 and Table S6 illustrate the seasonal variations in Carlson’s Trophic State Index (CTSI) values for Lake Kotokel in 2009, 2023, and 2024. Due to the absence of chlorophyll-a data for the winter of 2008–2009 and autumn of 2009 in the referenced monograph [17], CTSI calculations for these years were limited to the spring and summer water samples.
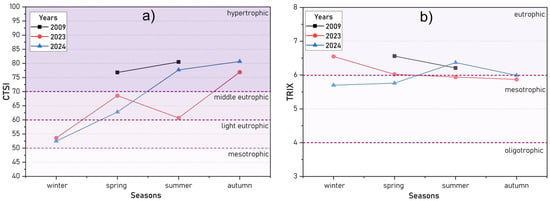
Figure 16.
Seasonal dynamics of trophic state indices: CTSI (a) and TRIX (b) for Lake Kotokel in 2009, 2023, and 2024.
In the winters of 2023 and 2024, Lake Kotokel was classified as “light eutrophic” based on the CTSI values (Figure 16a). This classification reflects the presence of a solid snow cover on the lake’s ice, which reduced sunlight penetration, combined with low temperatures that inhibited phytoplankton growth. As a result, this season exhibited the lowest chlorophyll-a concentrations, reduced total phosphorus levels, and increased water transparency.
The CTSI values for 2023–2024 indicated a progression in the lake’s trophic status, transitioning from “light eutrophic” in winter to “hypertrophic” by autumn. This escalation was driven by the intensified growth of phytoplankton, facilitated by rising water temperatures and increased sunlight availability. During the summer and autumn, the total phosphorus and chlorophyll-a concentrations peaked, accompanied by a significant decline in water transparency. The extent of algal blooms during these periods varied with fluctuations in water levels and the duration of elevated temperatures, both of which affected the degree of water warming. Notably, the lake’s trophic status in spring and summer 2009 mirrored the conditions observed in summer and autumn 2024.
The TRIX values (Figure 16b) for Lake Kotokel in 2023 and 2024 ranged between “mesotrophic” and “eutrophic” statuses, with values from 5.70 to 6.56 (Table S6). In contrast, during the spring and summer of 2009, the lake exhibited a consistently “eutrophic” state. Elevated TRIX values during the ice-covered period were associated with the accumulation of mineral nitrogen and phosphorus forms, which were released from organic matter deposited during the growing season. The dynamics of the TRIX differed slightly from those of CTSI, as TRIX calculations account for mineral nitrogen and phosphorus concentrations, which peaked during the winter season.
4. Conclusions
This study examined the variability in Lake Kotokel’s water levels over the past 40 years. A comparative analysis of long-term data on the water levels of Lakes Kotokel and Baikal, as well as regional humidity, indicated a stronger correlation between Kotokel’s water level and that of Baikal compared to precipitation levels. This stronger relationship was likely attributable to the hydraulic connectivity of fractured water-bearing horizons within the Baikal hydrogeological folded area.
This study synthesized the hydrochemical investigations of Lake Kotokel conducted between 2015 and 2024, highlighting that seasonal and long-term variations in the lake’s chemical composition are primarily governed by water level fluctuations and phytoplankton activity. A discernible trend of sulfate accumulation was identified, likely driven by anthropogenic influences. The rise in lake levels and subsequent flooding of coastal areas resulted in the influx of organic matter, accompanied by increased concentrations of nitrites, phosphates, and COD levels in the lake water. During low-water years, the frequency of phytoplankton blooms increased, leading to higher pH levels, increased water turbidity, and elevated total phosphorus concentrations. The distribution of heavy metals, particularly iron, manganese, zinc, and nickel, was highly heterogeneous, influenced by fracture-vein water discharges from faults within the Kotokel Basin. The highest heavy metal concentrations occurred during the ice-covered period, when there was no wind-driven water mixing and groundwater feeding predominated.
Among the 31 parameters analyzed in this study, 15 frequently exceeded the Russian MAC for fishery water bodies (MACfr). During the ice-covered period, the primary pollutants were DO, Fe, Mn, and Zn, whereas in summer, pH and TP were the main contributors to water quality deterioration. Lake Kotokel has consistently exhibited contamination by organic substances (COD and BOD values), whose composition remained insufficiently studied. Previous studies have detected phthalates in the lake’s waters during the ice-covered period. Consequently, further research into the profiles, concentrations, and dynamics of organic pollutants in Lake Kotokel is essential and will be prioritized in future investigations.
Seasonal assessments of the ecological state of Lake Kotokel for 2023–2024, supplemented by comparative data from 2008 to 2009, were conducted using a range of water quality indices, including the Russian SCWPI and ALIb, alongside international indices such as the NSF-WQI and CCME-WQI. Trophic status evaluations utilized CTSI and the TRIX. The results indicated that in 2023–2024, Lake Kotokel’s water quality ranged from the pure (“excellent”) class to the polluted (“fair”) class, with its trophic status transitioning from “light eutrophic” during winter to the “hypertrophic” class in summer and autumn. By contrast, in 2008–2009, water quality was slightly poorer, ranging from slightly polluted (“fair”) to heavily polluted (“marginal”).
Lake Kotokel demonstrated a decline in water quality and an increase in trophic status during summer and autumn, with the poorest water quality observed in the bottom layers during the ice-covered period. The most sensitive and informative indices for evaluating the lake’s conditions were the Russian Specific Combinatorial Water Pollution Index (SCWPI) and the Canadian Water Quality Index (CCME-WQI). Additionally, Carlson’s Trophic State Index (CTSI), which primarily reflects the productivity of a water body, effectively captured trophic changes.
The analysis highlighted that selecting an appropriate index for evaluating water quality and trophic status requires consideration of not only the available dataset but also how effectively a given index accounts for key parameters specific to the waterbody under investigation.
Supplementary Materials
The following supporting information can be downloaded at https://www.mdpi.com/article/10.3390/w17040545/s1: Table S1. Water quality classification based on the SCWRI, ALI, NSF-WQI and CCME-WQI indices values; Table S2. New weight scores (Wi) for eight NSF-WQI parameters; Table S3. Trophic status classification based on the CTSI and TRIX values; Table S4. Chemical composition of water in lake Kotokel based on literature data; Table S5. Comparison of results of water quality indices for each season during 2009, 2023 and 2024 in Lake Kotokel; Table S6. Classification of the trophic states in each season during 2009, 2023 and 2024 in Lake Kotokel according to the CTSI and TRIX. Figure S1. Sub-index curve of water quality parameter for the calculation of NSF-WQI.
Author Contributions
Conceptualization, V.G.S. and V.V.T.; methodology, E.P.N.; software, E.P.N.; formal analysis, E.P.N.; sampling, sample preparation, chemical analysis, V.G.S., E.P.N., O.D.B. and N.B.N.; investigation, V.G.S., E.P.N., S.V.B., V.V.T., O.D.B., N.B.N., G.S.S., E.T.P., S.V.Z., L.D.R. and E.Z.G.; data curation, S.V.B. and V.G.S.; writing—original draft preparation, V.G.S., S.V.B. and E.P.N.; writing—review and editing, V.G.S., E.P.N., S.V.B., V.V.T., O.D.B., N.B.N., G.S.S., E.T.P., S.V.Z., L.D.R. and E.Z.G.; visualization, E.P.N., V.G.S. and S.V.B.; supervision, V.V.T., V.G.S. and L.D.R.; project administration, E.Z.G. All authors have read and agreed to the published version of the manuscript.
Funding
This research was carried out at the expense of a grant from the Russian Science Foundation (no. 24-17-00333, https://rscf.ru/project/24-17-00333, accessed on 6 November 2024). The data for 2015–2023 were obtained within the framework of the state assignment to Baikal Institute of Nature Management SB RAS (AAAA-A21-121011890027-0) using the resources of the Research Equipment Sharing Center of BINM SB RAS.
Data Availability Statement
The data are provided in the article and Supplementary Materials.
Conflicts of Interest
The authors declare no conflicts of interest.
References
- Ramos, H.M.; McNabola, A.; López-Jiménez, P.A.; Pérez-Sánchez, M. Smart Water Management towards Future Water Sustainable Networks. Water 2020, 12, 58. [Google Scholar] [CrossRef]
- Suman, D.O.; Morais, M.; Saito, C.H. Solutions Based on Nature to Face Water Stress: Lessons from the Past and Present. Water 2024, 16, 2301. [Google Scholar] [CrossRef]
- Aryal, J.P.; Rahut, D.B.; López-Lavalle, A.B.; Sonobe, T. Agriculture Water Management, Food Security, and Sustainable Agriculture in the People’s Republic of China and India Under Climate Change; ADBI Working Paper: Tokyo, Japan, 2024. [Google Scholar] [CrossRef]
- Cosgrove, W.J.; Loucks, D.P. Water management: Current and future challenges and research directions. Water Resour. Res. 2015, 51, 4823–4839. [Google Scholar] [CrossRef]
- Mishra, A.; Alnahit, A.; Campbell, B. Impact of land uses, drought, flood, wildfire, and cascading events on water quality and microbial communities: A review and analysis. J. Hydrol. 2021, 596, 125707. [Google Scholar] [CrossRef]
- Modabberi, A.; Noori, R.; Madani, K.; Ehsani, A.H.; Mehr, A.D.; Hooshyaripor, F.; Klove, B. Caspian Sea is eutrophying: The alarming message of satellite data. Environ. Res. Lett. 2020, 15, 124047. [Google Scholar] [CrossRef]
- Zaghloul, G.Y.; Zaghloul, A.Y.; Hamed, M.A.; El-Moselhy, K.M.; Ezz El-Din, H.M. Water quality assessment for Northern Egyptian lakes (Bardawil, Manzala, and Burullus) using NSF-WQI Index. Reg. Stud. Mar. Sci. 2023, 64, 103010. [Google Scholar] [CrossRef]
- Tanjung, R.H.R.; Indrayani, E.; Agamawan, L.P.I.; Hamuna, B. Water quality assessment to determine the trophic state and suitability of Lake Sentani (Indonesia) for various utilisation purposes. Water Cycle 2024, 5, 99–108. [Google Scholar] [CrossRef]
- Bhateria, R.; Jain, D. Water Quality Assessment of Lake Water: A Review. Sustain. Water Resour. Manag. 2016, 2, 161–173. [Google Scholar] [CrossRef]
- Prasad, S.; Wei, Y.; Chaminda, T.; Ritigala, T.; Yu, L.; Jinadasa, K.B.S.N.; Wasana, H.M.S.; Indika, S.; Yapabandara, I.; Hu, D.; et al. Spatiotemporal Assessment of Water Pollution for Beira Lake, Sri Lanka. Water 2024, 16, 1616. [Google Scholar] [CrossRef]
- Ozdemir, K.; Ciner, M.N.; Ozcan, H.K.; Aydın, S. Evaluation of Water and Sediment Quality in Lake Mogan, Türkiye. Water 2024, 16, 1546. [Google Scholar] [CrossRef]
- Xiao, Q.; Duan, H.; Qin, B.; Hu, Z.; Zhang, M.; Qi, T.; Lee, X. Eutrophication and temperature drive large variability in carbon dioxide from China’s Lake Taihu. Limnol. Oceanogr. 2022, 6, 379–391. [Google Scholar] [CrossRef]
- Brown, K.P.; Gerber, A.; Bedulina, D.; Timofeyev, M.A. Human impact and ecosystemic health at Lake Baikal. WIREs Water 2021, 8, e1528. [Google Scholar] [CrossRef]
- Radnaeva, L.D.; Bazarzhapov, T.Z.; Shiretorova, V.G.; Zhigzhitzhapova, S.V.; Nikitina, E.P.; Dylenova, E.P.; Shirapova, G.S.; Budaeva, O.D.; Beshentsev, A.N.; Garmaev, E.Z.; et al. Ecological State of Lake Gusinoe–A Cooling Pond of the Gusinoozersk GRES. Water 2022, 14, 4. [Google Scholar] [CrossRef]
- Pinardi, M.; Stroppiana, D.; Caroni, R.; Parigi, L.; Tellina, G.; Free, G.; Giardino, C.; Albergel, C.; Bresciani, M. Assessing the impact of wildfires on water quality using satellite remote sensing: The Lake Baikal case study. Front. Remote Sens. 2023, 4. [Google Scholar] [CrossRef]
- Peryazeva, E.G.; Plyusnin, A.M.; Garmaeva, S.Z.; Budaev, R.T.; Zhambalova, D.I. Peculiarities of the formation of the chemical composition of water in lakes on the eastern shore of Lake Baikal. Geogr. Nat. Resour. 2016, 5, 49–59. [Google Scholar] [CrossRef]
- Pronin, N.M.; Ubugunov, L.L. (Eds.) Lake Kotokel’skoe: Natural Conditions, Biota, Ecology; Buryat Scientific Center SB RAS: Ulan-Ude, Russia, 2013; p. 320. [Google Scholar]
- Yuriev, A.L.; Samusenok, V.P.; Matveev, A.N.; Pronin, N.M.; Gavrilov, I.A.; Rodchenko, O.P. Biological characteristics of fish of Lake Kotokelskoye at the present time. Bull. Irkutsk. State Univ. Ser. Biol. Ecol. 2011, 4, 70–82. [Google Scholar]
- Shagzhiev, K.S.; Babikov, V.A.; Zhigmitova, S.B.; Mostovich, E.A. The East Coast of Baikal as an Area of Attraction and Influx of Tourists from Siberia, Mongolia and China. Nat. Inn. Asia 2017, 1, 54–76. Available online: https://cyberleninka.ru/article/n/vostochnoe-poberezhie-oz-baykal-kak-zona-prityazheniya-turistov-iz-stran-vnutrenney-azii (accessed on 10 November 2024).
- Zengina, T.Y.; Bedrinova, D.S. Study of the quality of surface water in the recreational zone of Lake Kotokel (Republic of Buryatia). J. Belarusian State Univ. Ser. 2 Chem. Biol. Geogr. 2015, 2, 63–69. [Google Scholar]
- Aguiar, G.R.F.; Silva, R.C.M.; Petruccelli, K.C.S.; Oliveira, M.N.; Brito, G.A.U.; Albuquerque, P.L.M.M.; Daher, E.D.F.; Silva Junior, G.B. Haff Disease: Overview and Clinical Features. Rev. Inst. Med. Trop. São Paulo 2024, 66, e52. [Google Scholar] [CrossRef] [PubMed]
- Wu, C.J.; Zhou, H.J.; Gu, W. Clinical characteristics of patients with Haff disease after eating crayfish. World J. Emerg. Med. 2019, 10, 156–159. [Google Scholar] [CrossRef] [PubMed] [PubMed Central]
- Lebedeva, D.I.; Marchenko, A.N.; Sharuho, G.V.; Raspopova, Y.I.; Turovinina, E.F. Features of the course and outcomes of Haff disease in the territory of the Tyumen region. Health Care Russ. Fed. 2023, 67, 149–155. (In Russian) [Google Scholar] [CrossRef]
- Galtseva, A.A.; Yurchenko, A.A.; Glazunova, L.A.; Raspopova, Y.I. Retrospective Analysis of Cases of Outbreaks of «Haff» Disease (Literature Review). AIC Innov. Technol. J. 2024, 3, 6–22. [Google Scholar]
- Chan, T.Y.K. The Emergence and Epidemiology of Haff Disease in China. Toxins 2016, 8, 359. [Google Scholar] [CrossRef] [PubMed]
- Wu, Y.; Wang, X.; Wang, X.; He, Z.; Wang, R.; Chen, Z.; Wu, X. Surveillance for rhabdomyolysis after the consumption of crayfish in Wuhan, China, 2016–2022. Front Nutr. 2024, 11, 1333888. [Google Scholar] [CrossRef] [PubMed] [PubMed Central]
- Cardoso, C.W.; Oliveira E Silva, M.M.; Bandeira, A.C.; Silva, R.B.; Prates, A.P.P.B.; Soares, Ê.S.; Silva, J.J.M.; de Souza, L.J.R.; Souza, M.M.D.S.; Muhana, M.A.; et al. Haff Disease in Salvador, Brazil, 2016–2021: Attack rate and detection of toxin in fish samples collected during outbreaks and disease surveillance. Lancet Reg. Health Am. 2021, 5, 100092. [Google Scholar] [CrossRef] [PubMed] [PubMed Central]
- Buchholz, U.; Mouzin, E.; Dickey, R.; Moolenaar, R.; Sass, N.; Mascola, L. Haff disease: From the Baltic Sea to the U.S. shore. Emerg. Infect. Dis. 2000, 6, 192–195. [Google Scholar] [CrossRef] [PubMed] [PubMed Central]
- Huang, C.; Peng, L.; Gong, N.; Xue, C.; Wang, W.; Jiang, J. A Retrospective Analysis of Crayfish-Related Rhabdomyolysis (Haff Disease). Emerg. Med. Int. 2019, 4209745. [Google Scholar] [CrossRef] [PubMed] [PubMed Central]
- Belykh, O.I.; Tikhonova, I.V.; Sorokovikova, E.G.; Gladkikh, A.S.; Kalyuzhnaya, O.V. Detection of toxic Microcystis in Lake Kotokelskoye (Buryatia). Vestnic Tomsk. State Univ. 2010, 330, 172–175. [Google Scholar]
- Vorobyevskaya, E.L.; Sedova, N.B.; Chevel, K.A.; Ostroumov, S.A.; Gorshkova, O.M. Biogenic Elements and Water Quality of Lake Kotokel and Some Neighboring Reservoirs. In Ecological and Biological Systems (Ecological Studies, Hazards, Solutions); Ostroumov, S.A., Gorshkova, O.M., Kotelevtsev, S.V., Eds.; MAKS Press: Moscow, Russia, 2021; Volume 27, pp. 54–62. [Google Scholar]
- Plyusnin, A.M. Geological and Hydrological Practice on the Eastern Coast of Lake Baikal: Teaching Aid; Publishing House of VSGUTU: Ulan-Ude, Russia, 2020; p. 81. [Google Scholar]
- Vorobyova, I.B.; Belozertseva, I.A.; Vlasova, N.V.; Yanchuk, M.S. Current state of watercourses in the estuary areas of the eastern coast of Lake Baikal Advances in modern. Nat. Sci. 2018, 1, 86–92. [Google Scholar] [CrossRef][Green Version]
- Angakhaeva, N.A.; Plyusnin, A.M.; Ukraintsev, A.U.; Chernyavskii, M.K.; Peryazeva, E.G.; Zhambalova, D.I. Hydrogeochemical features of Lake Kotokel. Earth Sci. Subsoil Use 2021, 44, 106–115. [Google Scholar] [CrossRef]
- Bazarsadueva, S.V.; Taraskin, V.V.; Budaeva, O.D.; Nikitina, E.P.; Zhigzhitzhapova, S.V.; Shiretorova, V.G.; Bazarzhapov, T.Z.; Radnaeva, L.D. First Data on PAE levels in Surface Water in Lakes of the Eastern Coast of Baikal. Int. J. Environ. Res. Public Health 2023, 20, 1173. [Google Scholar] [CrossRef]
- Lunina, O.V. Faults and Seismically Induced Geological Hazards in Southern East Siberia and Adjacent Areas; Publishing House of the Siberian Branch of the Russian Academy of Sciences: Novosibirsk, Russia, 2016; p. 226. [Google Scholar]
- Imetkhenov, A.B. Late Cenozoic Deposits of the Coast of Lake Baikal; Nauka: Novosibirsk, Russia, 1987; p. 148. (In Russian) [Google Scholar]
- Takahara, H.; Krivonogov, S.K.; Bezrukova, E.V.; Miyoshi, N.; Morita, Y.; Nakamura, T.; Hase, Y.; Shinomiya, Y.; Kawamuro, K. Vegetation history of the southeastern and eastern coasts of Lake Baikal from bog sediments since the last interstage. In Lake Baikal: A Mirror in Time and Space for Understanding Global Change Processes; Minoura, K., Ed.; Elsevier: Amsterdam, The Netherlands, 2000; pp. 108–118. [Google Scholar]
- Galazy, G.I. (Ed.) Baikal Atlas; Roscartography: Moscow, Russia, 1993; p. 160. [Google Scholar]
- Khaptanov, V.B.; Bashkuev, Y.B.; Dembelov, M.G. Structure of the Kotokel lake water and bottom sediments according to GRP sounding. Sib. Aerosp. J. 2013, 14, 143–146. [Google Scholar]
- Pronin, N.M.; Burdukovskaya, T.G.; Batueva, M.D.; Sondueva, L.D.; Pronina, S.V.; Zhepkholova, O.B. Parasite fauna of the perch in Lake Kotokel (Republic of Buryatia: Baikal region) during the Haff disease outbreak. Bull. Buryat State Univ. Ser. Biol. Geogr. 2010, 4, 174–179. [Google Scholar]
- Ministry of Natural Resources and Ecology of the Russian Federation. The State of Lake Baikal and Measures for Its Protection; Report; Ministry of Natural Resources and Ecology of the Russian Federation: Moscow, Russia, 2002–2020. Available online: https://www.mnr.gov.ru/docs/gosudarstvennye_doklady/o_sostoyanii_ozera_baykal_i_merakh_po_ego_okhrane/ (accessed on 2 November 2024).
- Zhang, Y.; Wünnemann, B.; Bezrukova, E.V.; Ivanov, E.V.; Shchetnikov, A.A.; Nourgaliev, D.; Levina, O.V. Basin morphology and seismic stratigraphy of Lake Kotokel, Baikal region, Russia. Quat. Int. 2013, 290–291, 57–67. [Google Scholar] [CrossRef]
- Bathymetry of Natural Lakes in Russia. MapGraphica. Available online: http://lakemaps.org/ru/atlas_maps.asp?name=Buryatia&geotype=rp&local=Pecпyбликa%20Бypятия (accessed on 1 November 2024).
- GOST 31859-201; Water. Method for Determination of Chemical Oxygen Demand. Interstate Council for Standardization, Metrology and Certification: Moscow, Russia, 2014; p. 7.
- GOST 57162-2016; Water. Determination of Elements Content by Graphite Furnace Atomic Absorption Spectrometry. Standardinform: Moscow, Russia, 2019. Available online: https://docs.cntd.ru/document/1200140389 (accessed on 10 November 2024).
- GOST 31861-2012; Water. General Requirements for Sampling. Standardinform: Moscow, Russia, 2019. Available online: https://docs.cntd.ru/document/1200097520 (accessed on 1 January 2014).
- GOST 17.1.5.01-80; Nature Protection. Hydrosphere. General Requirements for Sampling of Bottom Sediments of Water Objects for Their Pollution Analysis. IPK Izdatelstvo Standartov: Moscow, Russia, 2002. Available online: https://docs.cntd.ru/document/120001278 (accessed on 10 November 2024).
- GOST 17.1.4.02-90; Water. Spectrophotometric Determination of Chlorophyll-a. IPK Izdatelstvo Standartov: Moscow, Russia, 1999. Available online: https://docs.cntd.ru/document/1200009756 (accessed on 10 November 2024).
- RD 52.24.643-2002; Methods Guidelines. The Methods of Integral Assessment and Pollution Level of Surface Waters by Hydrochemical Indices, SPb. Gidrometeoizdat: Leningrad, Russia, 2002. Available online: https://files.stroyinf.ru/Data2/1/4293831/4293831806.pdf (accessed on 10 November 2024).
- GOST R 58556-2019; Assessment of Water Quality of Water Bodies from Ecological View Points. Russian Gost: Moscow, Russia, 2019. Available online: https://docs.cntd.ru/document/1200168048 (accessed on 1 May 2020).
- United Nations Environment Programme Global Environment Monitoring System (UNEP GEMS). Global Drinking Water Quality Index Development and Sensitivity Analysis Report; Water Programme Office, National Water Research Institute: Lakeshore Road Burlington, ON, Canada, 2007; Available online: https://www.unep.org/resources/report/global-drinking-water-quality-index-development-and-sensitivity-analysis-report-0 (accessed on 10 November 2024).
- Canadian Council of Ministers of the Environment. Canadian Water Quality Guidelines for the Protection of Aquatic Life: CCME Water Quality Index 1.0; Technical Report; Canadian Council of Ministers of the Environment: Winnipeg, MB, Canada, 2001; pp. 1–13. Available online: https://ccme.ca/en/res/wqimanualen.pdf (accessed on 10 November 2024).
- Mohebbi, M.R.; Saeedi, R.; Montazeri, A.; Vaghefi, K.A.; Labbafi, S.; Oktaie, S.; Abtahi, M.; Mohagheghian, A. Assessment of water quality in groundwater resources of Iran using a modified drinking water quality index (DWQI). Ecol. Ind. 2013, 30, 28–34. [Google Scholar] [CrossRef]
- Terrado, M.; Barcelo, D.; Tauler, R.; Borrell, E.; Campos, S.; Barcelo, D. Surface-water-quality indices for the analysis of data generated by automated sampling networks. Trends Anal. Chem. 2010, 29, 40–52. [Google Scholar] [CrossRef]
- Carlson, R.E. A trophic state index for lakes. Limnol. Oceanogr. 1977, 22, 361–369. [Google Scholar] [CrossRef]
- Aizaki, M.; Otsuki, A.; Fukushima, T.; Hosomi, M.; Muraoka, K. Application of Carlson’s trophic state index to Japanese lakes and relationships between the index and other parameters. SIL Proc. 1981, 21, 675–681. [Google Scholar] [CrossRef]
- Acuña-Alonso, C.; Alvarez, X.; Lorenzo, O.; Cancela, A.; Valero, E.; Sanchez, A. Assessment of water quality in eutrophized water bodies through the application of indexes and toxicity. Sci. Total Environ. 2020, 728, 138775. [Google Scholar] [CrossRef] [PubMed]
- Opiyo, S.B.; Getabu, A.M.; Sitoki, L.M.; Shitandi, A.; Ogendi, G.M. Application of the Carlson’s Trophic State Index for the Assessment of Trophic Status of Lake Simbi Ecosystem, a Deep Alkaline-Saline Lake in Kenya. Int. J. Fish. Aquat. Stud. 2019, 7, 327–333. [Google Scholar] [CrossRef]
- Vollenweider, R.A.; Giovanardi, F.; Montanari, G.; Rrinaldi, A. Characterization of the trophic conditions of marine coastal waters with special reference to the NW Adriatic Sea: Proposal for a trophic scale, turbidity and generalized water quality index. Environmetrics 1998, 9, 329–357. [Google Scholar] [CrossRef]
- Bazarzhapov, T.Z.; Shiretorova, V.G.; Radnaeva, L.D.; Nikitina, E.P.; Sodnomov, B.V.; Tsydypov, B.Z.; Batomunkuev, V.S.; Taraskin, V.V.; Dong, S.; Li, Z.; et al. Trend Analysis of Precipitation, Runoff and Major Ions for the Russian Part of the Selenga River Basin. Water 2023, 15, 197. [Google Scholar] [CrossRef]
- Akhundzadah, N.A. Analyzing Temperature, Precipitation, and River Discharge Trends in Afghanistan’s Main River Basins Using Innovative Trend Analysis, Mann–Kendall, and Sen’s Slope Methods. Climate 2024, 12, 196. [Google Scholar] [CrossRef]
- Singh, S.; Singh, S.K.; Kanga, S.; Shrivastava, P.; Sajan, B.; Meraj, G.; Kumar, P.; Đurin, B.; Kranjčić, N.; Dogančić, D. Analysis of hydrological changes in the Banas River: Analysing Bisalpur Dam impact and trends of the water scarcity. Results Eng. 2024, 22, 101978. [Google Scholar] [CrossRef]
- Doganovsky, A.M. The lake water level fixes the supply and in many respects influences the environment of biocenoses. Soc. Environment. Dev. Terra Humana 2007, 1, 103–110. [Google Scholar]
- Sinyukovich, V.N.; Chernyshov, M.S. Water regime of lake Baikal under conditions of climate change and anthropogenic influence. Quat. Int. 2019, 524, 93–101. [Google Scholar] [CrossRef]
- Obyazov, V.A. Adaptation to Climate Changes: A Regional Approach. Geogr. Prir. Resur. 2010, 2, 34–39. [Google Scholar]
- World Health Organization (WHO). Guidelines for Drinking Water Quality Recommendations; WHO: Geneva, Switzerland, 2004; Volume 1, p. 515. [Google Scholar]
- Ministerial Decree No. 552 of 13 December 2016 Regarding Elaboration and Validation of Water Quality Standards for Fishery Waterbodies, Including Maximum Concentration Limits of Pollutants in the Water. Available online: https://www.fao.org/faolex/results/details/en/c/LEX-FAOC187272/ (accessed on 13 December 2016).
- Piper, A.M. A Graphic Procedure in the Geochemical Interpretation of Water-Analyses. Eos Trans. Am. Geophys. Union 1944, 25, 914–928. [Google Scholar] [CrossRef]
- Tomberg, I.V.; Sinyukovich, V.N.; Sorokovikova, L.M.; Radnaeva, L.D.; Pavlov, I.A.; Shiretorova, V.G.; Chernyshov, M.S.; Tulokhonov, A.K. Characteristics of The Water Chemical Composition in The Selenga River During the 2017-2018 Low-Water Period. Geogr. Nat. Resour. 2020, 3, 81–88. [Google Scholar] [CrossRef]
- Domysheva, V.M.; Sorokovikova, L.M.; Sinyukovich, V.N.; Onishchuk, N.A.; Sakirko, M.V.; Tomberg, I.V.; Zhuchenko, N.A.; Golobokova, L.P.; Khodzher, T.I. Ionic Composition of Water in Lake Baikal, Its Tributaries, and the Angara River Source during the Modern Period. Russ. Meteorol. Hydrol. 2019, 44, 687–694. [Google Scholar] [CrossRef]
- Nikanorov, A.M. Hydrochemistry, 3rd ed.; NOK: Rostov-on-Don, Russia, 2008. (In Russian) [Google Scholar]
- Sorokovikova, L.M.; Sinyukovich, V.N.; Tomberg, I.V.; Popovskaya, G.I.; Bashenkhaeva, N.V.; Sez’ko, N.P.; Zhuchenko, N.A. Chemical composition of waters and the phytoplankton of the lakes within the delta of the Selenga river. Geogr. Nat. Resour. 2016, 37, 220–227. [Google Scholar] [CrossRef]
- Bazarsadueva, S.V.; Shiretorova, V.G.; Nikitina, E.P.; Zhigzhitzhapova, S.V.; Taraskin, V.V.; Bazarzhapov, T.Z.; Dong, S.; Radnaeva, L.D. Heavy Metal Content in Fish of the Barguzin River (Eastern Cisbaikalia) and Assessment of Potential Risks to Human Health. Water 2023, 15, 3710. [Google Scholar] [CrossRef]
- Kashin, V.K.; Ivanov, G.M. Specific Features of Manganese Distribution in Natural Waters of Transbaikalia. Water Resour. 2005, 32, 545–548. [Google Scholar] [CrossRef]
- Kashin, V.K.; Ivanov, G.M. Copper in Natural Waters in Transbaikalia. Water Resour. 2008, 35, 228–233. [Google Scholar] [CrossRef]
- Zhang, H. Lake Management and Eutrophication Mitigation: Coming down to Earth—In Situ Monitoring, Scientific Management and Well-Organized Collaboration Are Still Crucial. Water 2022, 14, 2878. [Google Scholar] [CrossRef]
- Chidiac, S.; El Najjar, P.; Ouaini, N.; El Rayess, Y.; El Azzi, D. A comprehensive review of water quality indices (WQIs): History, models, attempts and perspectives. Rev. Environ. Sci. Biotechnol. 2023, 22, 349–395. [Google Scholar] [CrossRef]
- Tyagi, S.; Sharma, B.; Singh, P.; Dobhal, R. Water Quality Assessment in Terms of Water Quality Index. Am. J. Water Resour. 2013, 1, 34–38. [Google Scholar] [CrossRef]
- Fortes, A.C.C.; Barrocas, P.R.G.; Kligerman, D.C. Water quality indices: Construction, potential, and limitations. Ecol. Indic. 2023, 157, 111187. [Google Scholar] [CrossRef]
- Akinnawo, S.O. Eutrophication: Causes, consequences, physical, chemical and biological techniques for mitigation strategies. Environ. Chall. 2023, 12, 100733. [Google Scholar] [CrossRef]
- Sonarghare, P.C.; Masram, S.C.; Sonparote, U.R.; Khaparde, K.P.; Kharkate, S.K. Causes and Effects of Eutrophication on Aquatic Life (A Review). Int. J. Environ. Rehab. Conserv. 2020, XI (SP2), 213–218. [Google Scholar]
- Atique, U.; An, K.-G. Landscape heterogeneity impacts water chemistry, nutrient regime, organic matter and chlorophyll dynamics in agricultural reservoirs. Ecol. Indic. 2020, 110, 105813. [Google Scholar] [CrossRef]
- Penna, N.; Capellacci, S.; Ricci, F. The influence of the Po River discharge on phytoplankton bloom dynamics along the coastline of Pesaro (Italy) in the Adriatic Sea. Mar. Pollut. Bull. 2004, 48, 321–326. [Google Scholar] [CrossRef] [PubMed]
Disclaimer/Publisher’s Note: The statements, opinions and data contained in all publications are solely those of the individual author(s) and contributor(s) and not of MDPI and/or the editor(s). MDPI and/or the editor(s) disclaim responsibility for any injury to people or property resulting from any ideas, methods, instructions or products referred to in the content. |
© 2025 by the authors. Licensee MDPI, Basel, Switzerland. This article is an open access article distributed under the terms and conditions of the Creative Commons Attribution (CC BY) license (https://creativecommons.org/licenses/by/4.0/).