Article

Reactive Transport Modeling of Uranium in Subsurface: Impact of Field-Scale Heterogeneity and Biogeochemical Dynamics

Department of Environmental Engineering, Middle East Technical University, Dumlupınar Bulvarı No. 1, 06800 Ankara, Turkey
*
Author to whom correspondence should be addressed.
Water 2025, 17(4), 514; https://doi.org/10.3390/w17040514
Submission received: 18 December 2024 / Revised: 23 January 2025 / Accepted: 31 January 2025 / Published: 11 February 2025

Abstract

:
Understanding the fate of contaminants in heterogeneous aquifer systems is crucial to explain their transport behavior. Although it has been proven that heterogeneity has a significant control over the quantification of these processes, the extent of this impact is yet to be studied. The unique contribution of this work lies in the assessment of field-scale physical and chemical heterogeneity in modeling reactive transport processes in the subsurface. The main objective of this study is to investigate the impact of physical and chemical heterogeneity in understanding biogeochemical processes of contaminants in the subsurface environment, coupled with advective and dispersive transport in situ with mixing limitations. This study is particularly focused on an example of uranium, where especially coupled bioreduction and reoxidation processes in the presence of Fe (III) hydroxides are considered. For this purpose, 2D numerical biogeochemical reactive transport models are developed to simulate the fate and transport of uranium in a heterogeneously distributed subsurface. Results have shown that neglecting spatial heterogeneity might lead to an overestimation of uranium bioreduction, where physical heterogeneity has been observed to have a greater impact than chemical heterogeneity in the absence of adsorption reactions. On the other hand, when adsorption of uranium is included, the significance of chemical heterogeneity is more pronounced. Thus, when potential adsorption of contaminants is ignored or if chemical heterogeneity is ignored in the presence of adsorption reactions, the contaminant concentrations might be underestimated. The underestimation is more pronounced in low hydraulic conductivity zones due to the mixing limitations for soluble compounds, whereas for immobile phase interactions, high hydraulic conductivity regions became significant. The impact of U(IV) reoxidation process is also more pronounced in the presence of chemical heterogeneity and particularly enhanced in the zones with the highest mixing. The findings of this study can shed light on identifying the conditions that necessitate the accurate characterizations of physical and chemical heterogeneity in predicting contaminant transport with mixing limitations subject to competing biogeochemical reactions in the natural subsurface.

1. Introduction

Aquifer heterogeneity is the spatial variability of hydraulic, geochemical, and transport characteristics in the subsurface [1,2,3]. It is known that all aquifers have heterogeneous characteristics that change with scale, ranging from pore to macro scale [4]. For example, the spatial distribution of hydraulic conductivity K, which is a measure of the aquifer’s ability to transmit water; porosity; and specific storage in the subsurface is associated with aquifer heterogeneity [5]. Aquifer heterogeneity strongly affects the transport of contaminants in terms of reaction rates and flow directions in the field [4]. It is a key challenge in determining the flow and transport of contaminants in the subsurface. Predicting the effect of aquifer heterogeneity is critical for understanding groundwater flow and contaminant transport [3,5,6,7,8].
According to Sarris et al. [9], heterogeneity can constrain the transport and biogeochemical processes. The variability in subsurface conditions complicates the study of contaminant fate and transport. However, considering spatial variations allows for more accurate determinations, which can be addressed via modeling tools for groundwater remediation applications [10]. The degree of variability with regard to porosity, geochemistry, groundwater density might also influence the other variables within the subsurface domain. For instance, the variable distribution of K creates a large extent of groundwater flow patterns, which in turn relatively affects the fate and transport of chemicals. Subsurface compositions have different physical and chemical complexities which are spatially variable [2,5] and can be categorized as physical and chemical types of heterogeneity, respectively. These are briefly summarized below.

1.1. Physical and Chemical Heterogeneity

Physical heterogeneity is the spatial variation in subsurface physical properties, which corresponds to the spatially distributed characteristics of groundwater such as permeability, particle size distribution, and porosity [11,12,13]. The determination of physical properties of aquifer is critical for the accurate delineation of contaminant transport, the selection of remediation strategy, and successful groundwater resource management. Thus, spatially distributed physical characteristics have significant control over the transport of contaminant plumes, and they have significant importance in terms of understanding the fate of solutes in the groundwater [3,14,15].
Chemical heterogeneity, on the other hand, is the spatial variability of geochemical properties in the subsurface, and many studies show the relationship between the chemical heterogeneity and electron acceptor/electron donor distribution [5,16,17]. While physical heterogeneity has been known for a longer time in terms of its impact on subsurface flow and transport, the influence of chemical heterogeneity has been recognized in numerous studies at laboratory- and field-scale studies [11,16,17,18].
The complex interactions between concurrent hydrological, geochemical, and biological processes that take place in the field as well as the effects of heterogeneities on these processes have a significant impact on the level of co-occurrence of these reacting agents. Atchley et al. [19] state that although physical heterogeneity controls the movement of conservative solutes in the subsurface, the presence of reactive solutes introduces additional complexities to the system. For example, it can be presumed that the heterogeneity in K would control the fate and transport of an injected electron donor. Therefore, the degree of interactions between reacting agents and the spatial distribution of reaction products are determined by the physical and geochemical heterogeneities. Despite the significance of porous medium heterogeneities in regulating reactive transport processes during bioremediation, a comprehensive high-resolution characterization of field sites is difficult and expensive, if not impossible. As a result, the difficulty of estimating the spatial distribution of physical and geochemical properties from sparse data is encountered, a task that is inevitably complicated by uncertainty and non-uniqueness [16]. Zhang et al. [20] provide a comprehensive review of deterministic and stochastic methods as newly developed upscaling approaches to estimate large-scale parameters by using data measured at small scales. Zhan et al. [21] report the development of an inversion framework that combines the strengths of stochastic and deep-learning models to determine subsurface sedimentary structure characteristics.
Li et al. [16] report that while physical heterogeneity effects on the flow and transport processes have been relatively known, the impacts of geochemical heterogeneities have been recognized more recently. Their work indicates that the variation in mineral composition affects both biomass growth and the formation of mineral precipitates within the porous medium, which are driven by a wide range of geochemical properties. It is indicated that ignoring heterogeneity can lead to the overestimation of the remediation efforts. Jang et al. [5] emphasize that while physical heterogeneity is associated with short-term impacts on redox reactions in the subsurface, chemical heterogeneity is more substantial regarding long-term impacts. Fakhreddine et al. [3] demonstrate the impacts of the geochemical characterization of the subsurface environment in terms of remediating an arsenic-contaminated site. In this study, the coupling of physical and chemical heterogeneity is stated to be vital for ensuring groundwater management and maintaining the reliability of the groundwater transport model. Scheibe et al. [22] developed a 2D transport model including the physical and chemical heterogeneity and interacting biogeochemical reactions, where their heterogeneity data are obtained by using geostatistical methods. According to Cunningham and Fadel [2], the correlation between physical and chemical heterogeneity is poorly understood, and more data are needed to expand the knowledge about this correlation. Therefore, to manage remediation applications in the subsurface settings, the relationship between physical and chemical heterogeneity may be critical.

1.2. Biogeochemical Processes and Reoxidation: An Example of Uranium

Radionuclide contamination is a considerable important problem that causes the contamination of different environments such as soils, water, and sediments. Numerous U.S. Department of Energy (DOE) sites have groundwater contamination problems caused by unacceptable levels of different radionuclides (e.g., Tc and U) [23]. In Turkey, radionuclide contamination which is the major enhancement of coal-burning plants adversely affects the quality of groundwater [24]. Uranium is the most common radionuclide found as a pervasive element in the environment that creates a legacy of soil and groundwater contamination and risks for human health [25,26].
The bioreduction of uranium is the most extensively demonstrated mechanism of removal from the groundwater because of its low cost and effectiveness [27,28,29,30]. The bioreduction of uranium can be considered as the transformation of hexavalent uranium (U(VI)) into the tetravalent uranium (U(IV)) form, which is mostly in the form of a uraninite (UO2) mineral. Uraninite is insoluble and thus less mobile and toxic [29,31,32,33]. Metal-reducing bacteria, especially iron-reducing and sulfate-reducing bacteria stimulate the reduction in U(VI) to U(IV) in the presence of a suitable electron donor such as acetate, lactate, and glucose [27,29,30,34,35,36]. However, Sani et al. [37] have indicated that when the electron donor is entirely consumed, uraninite may be reoxidized back to the soluble U(VI) form in the presence of oxidizing agents, thereby impeding the cleanup efforts in uranium-contaminated sites.
The reoxidation of uraninite can occur in the groundwater environment in the case of introducing oxidizing agents such as O2, NO3, and NO2 into the medium. Metal-reducing bacteria can utilize Fe(III) and Mn(IV) that are abundant in the subsurface as an electron donor to reoxidize uraninite to uranium under reducing conditions. Thus, it is very crucial to identify and specify the reaction mechanism, including the reoxidation of biogenic uranium (U(IV)). Research indicates that the mineral form of uranium (UO2) is very susceptible to reoxidation, causing challenges in terms of the long-term stability of uraninite in treated sites [38,39]. U(VI) can also be adsorbed onto Fe(III)hydroxides or form insoluble complexes with PO43, which could prevent the reduction process [38].
As mentioned in Section 1.1 and Section 1.2 above, both physical and chemical heterogeneities affect the geochemical and transport processes. Biogeochemical heterogeneity is very critical when natural attenuation is selected as the more favorable bioremediation strategy in the field, as this may lead to spatial variability in the results. Although the impact of heterogeneity has proven to be significant, studies on the extent of its impact is rather limited. Therefore, the goal of this study is to investigate the impact of physical and chemical heterogeneity on the transport and mobility of subsurface contaminants under multicomponent biogeochemical dynamics, coupled with advective dispersive transport in situ with mixing limitations, using uranium bioreduction and concomitant reoxidation processes as an example. Investigating aquifer heterogeneity influences on contaminant predictions for uranium would yield important findings for other contaminants, subject to similar biogeochemical reaction networks consisting of a delicate balance between competing reactions in the subsurface. Spycher et al. [39] presented biogeochemical simulations of batch laboratory experiments conducted by Sani et al. [37], capturing key biogeochemical reaction processes for reduction from soluble U(VI) to insoluble U(IV) by means of uraninite precipitation by sulfate-reducing bacteria and the reoxidation of uraninite by Fe(III) (hydr)oxides back to soluble U(VI) when electron acceptors are consumed in the medium. Şengor et al. [33] later demonstrated 1D and 2D reactive transport models of the uranium bioreduction and reoxidation experiments in homogeneous environments, mainly to assess and compare different reactive transport simulator performances for complex reaction kinetics coupled with physical transport. However, the spatial variability of aquifer characteristics would have a significant impact on in situ remediation activities, rendering numerical model predictions to be highly sensitive for the accurate assessment of bioremediation effectiveness. As physical and chemical characteristics of natural aquifer systems, particularly reactive Fe-(hydr)oxide surfaces and K that are mostly heterogeneously distributed, these can exert significant controls on transport and bioremediation process dynamics with mixing limitations. This study presents a mixing-controlled reactive transport model coupled with complex biogeochemical reaction dynamics, investigating the impact of reactive Fe-(hydr)oxide surfaces and K on bioremediation prediction efforts in a heterogeneous granular aquifer environment. The impact of both physical and chemical heterogeneities under competing reaction dynamics is demonstrated for the first time, to the best of our knowledge.

2. Model Structure and Parameters

2.1. Modeling Approach

In order to investigate the impact of physical and chemical heterogeneity in uranium immobilization and solubilization dynamics that consider the biogeochemical reaction kinetics, numerical model simulations were set up with three cases of heterogeneity as follows:
  • Reactive transport simulations are carried out with both physical and chemical heterogeneities (i.e., heterogeneous K and a heterogeneous Fe case);
  • Reactive transport simulations are carried out with physical heterogeneity but not with chemical heterogeneity (i.e., heterogeneous K and a homogeneous Fe case);
  • Reactive transport simulations are carried out with no physical or chemical heterogeneity (i.e., homogeneous K and a homogeneous Fe case).
In the first part of the model runs, the numerical model simulations are ran with no surface adsorption of uranium or any other species onto the aquifer solids. In the second part, the adsorption of uranium onto Fe(III) (hydr)oxide surfaces is implemented via surface complexation reactions. All model simulations were also carried out with and without the U(IV) reoxidation reaction by Fe(III) (hydr)oxide minerals in order to elucidate the impact of U(IV) reoxidation, specifically on the overall biogeochemical dynamics and the reoxidation effects. As mentioned previously, as the sole goal of this study is to investigate the impact of physical and chemical heterogeneity on the overall biogeochemical network for subsurface contaminant transport modeling (uranium is used as an example) under realistic in situ subsurface environmental conditions, any calibration of model parameters to fit any specific field data is not considered here. Therefore, a hypothetical uranium contamination model is considered using the South Oyster site under realistic model conditions as described by Scheibe et al. [22], and varying levels of heterogeneity are tested by means of various modeling scenarios.
The reactive transport modeling simulations are conducted using the PHT3D v2.17 code [40] as the reactive transport simulator to observe the interactions of biogeochemical processes. PHT3D is a 3D reactive transport simulator that incorporates MT3DMS v5.1 [41] for advective–dispersive multi-species transport; and PHREEQC-2 v2.17 [42] is used for the quantification of reactive processes via the sequential operator splitting approach. PHT3D is a powerful and comprehensive reactive multicomponent transport model simulator that can handle a broad range of equilibrium- and kinetically controlled biogeochemical reactions [40]. MODFLOW 2005 [43] is used as the groundwater flow model to calculate the velocity fields. This coupled model has been extensively used for various site-specific and contaminant-specific reactive transport modeling applications worldwide.

2.2. Description of the Site

The model site is based on an aquifer site located in eastern Virginia, which is known as the South Oyster site as mentioned in Scheibe et al. [22]. This field site, although not actually contaminated with uranium, has been used for research on subsurface bioremediation and microbial transport, since an extensive characterization of the data on the aquifer matrix has been made available. Scheibe et al. [22] have generated highly resolved 2D and 3D simulations of heterogeneous property distributions for the South Oyster site using geostatistical methods, where a highly resolved 2D realization of K and the corresponding realization of Fe(III) have been selected to be used in this work to incorporate physical and chemical heterogeneities, respectively.
The model domain has a length of 11.9 m and a thickness of 5.4 m. The 2D numerical model of groundwater flow and transport is defined with a uniform grid discretization of 0.1 m. Thus, the model is represented as a matrix with 54 rows and 119 columns, with a total of 6426 cells (Figure 1). The green line shows the location of lactate injection, which is 6 m away from the upgradient boundary, and the blue line represents the location where cross sectional data at x = 9 m were used to investigate the impact of heterogeneity along the cross section (as will be seen later in the graphs where the results pertaining to cross sectional profiles were compared). The flow of groundwater was assumed to be a steady state. With the injection of lactate, as seen from the green line in Figure 1, bioreduction processes are promoted, and the results pertaining to biogeochemical dynamics in the system are obtained for the different cases analyzed. The hydraulic head difference was assigned as a gradient of 0.3 m with constant head boundaries at both ends of the model domain [22]. Porosity was assigned as 0.34 with a spatially uniform distribution along the model site. The value of longitudinal and transverse dispersivity was assumed as 1.0 and 0.1 m, respectively [22].

2.3. Key Input Parameters

The initial water composition used in the modeling study here depends on the previous work by Sengor et al. [33], which used the initial conditions based on the original laboratory batch experiments conducted by Sani et al. [37]. However, the initial uranium concentration is selected as a representative value when compared to real uranium-contaminated field studies and EPA reports [44]. In the first part of the study, the model domain is assumed to be contaminated with uranium at a uniform concentration of 1 µmol/L, where a continuous influx of 1 µM U(VI) was assumed to be coming from the upstream boundary with a defined and specified concentration boundary at the upstream end. The initial water composition is summarized in Table 1. In the second and third parts of the study, in order to be more representative of natural field conditions when considering the influence of surface complexation, transport simulations are carried out using the initial water composition after 25 years of U(VI) loading with surface complexation at t = 0. In these cases, the model site is first loaded with uranium from an upgradient source at a uniform concentration of 1 × 10⁻⁶ µmol/L for 25 years to obtain a quasi-equilibrium state of uranium concentration (aqueous and sorbed U(VI)) distribution. During these runs, only equilibrium surface complexation reactions of U(VI) onto Fe(III) hydroxide surfaces are included, whereas all other reaction networks are ignored. The initial U(VI) concentration distribution of the heterogeneous K and heterogeneous Fe case after reaching quasi-equilibrium after 25 years is provided in Supplementary Material Figure S1.
The composition of inflowing water at the injection well is listed in Table 1. Lactate as the electron donor is injected in the relatively middle position of the field uniformly all throughout the depth (x = 6 m) at a rate of 0.02 m3/day for the first 8 days of the simulation period for all runs. The concentration of the electron donor is specified as 0.03 M lactate in this study, as it was also used by Sengor et al. [33] in conjunction with other uranium-contaminated studies specified in the literature.
The K and Fe(III) hydroxide data, which are used to demonstrate the impacts of physical and chemical heterogeneities, respectively, in this study are obtained from Scheibe et al. [22]. The data generated by Scheibe et al. [22] were obtained using different geostatistical methods to generate 2D simulations of heterogeneous property distributions. The summary of statistics that were used to create the data are provided in Supplementary Material Table S1 for different types of facies [22]. The details of data generation, depending on experimental correlations which resulted from geophysical and well observations, are discussed by Scheibe et al. [22].
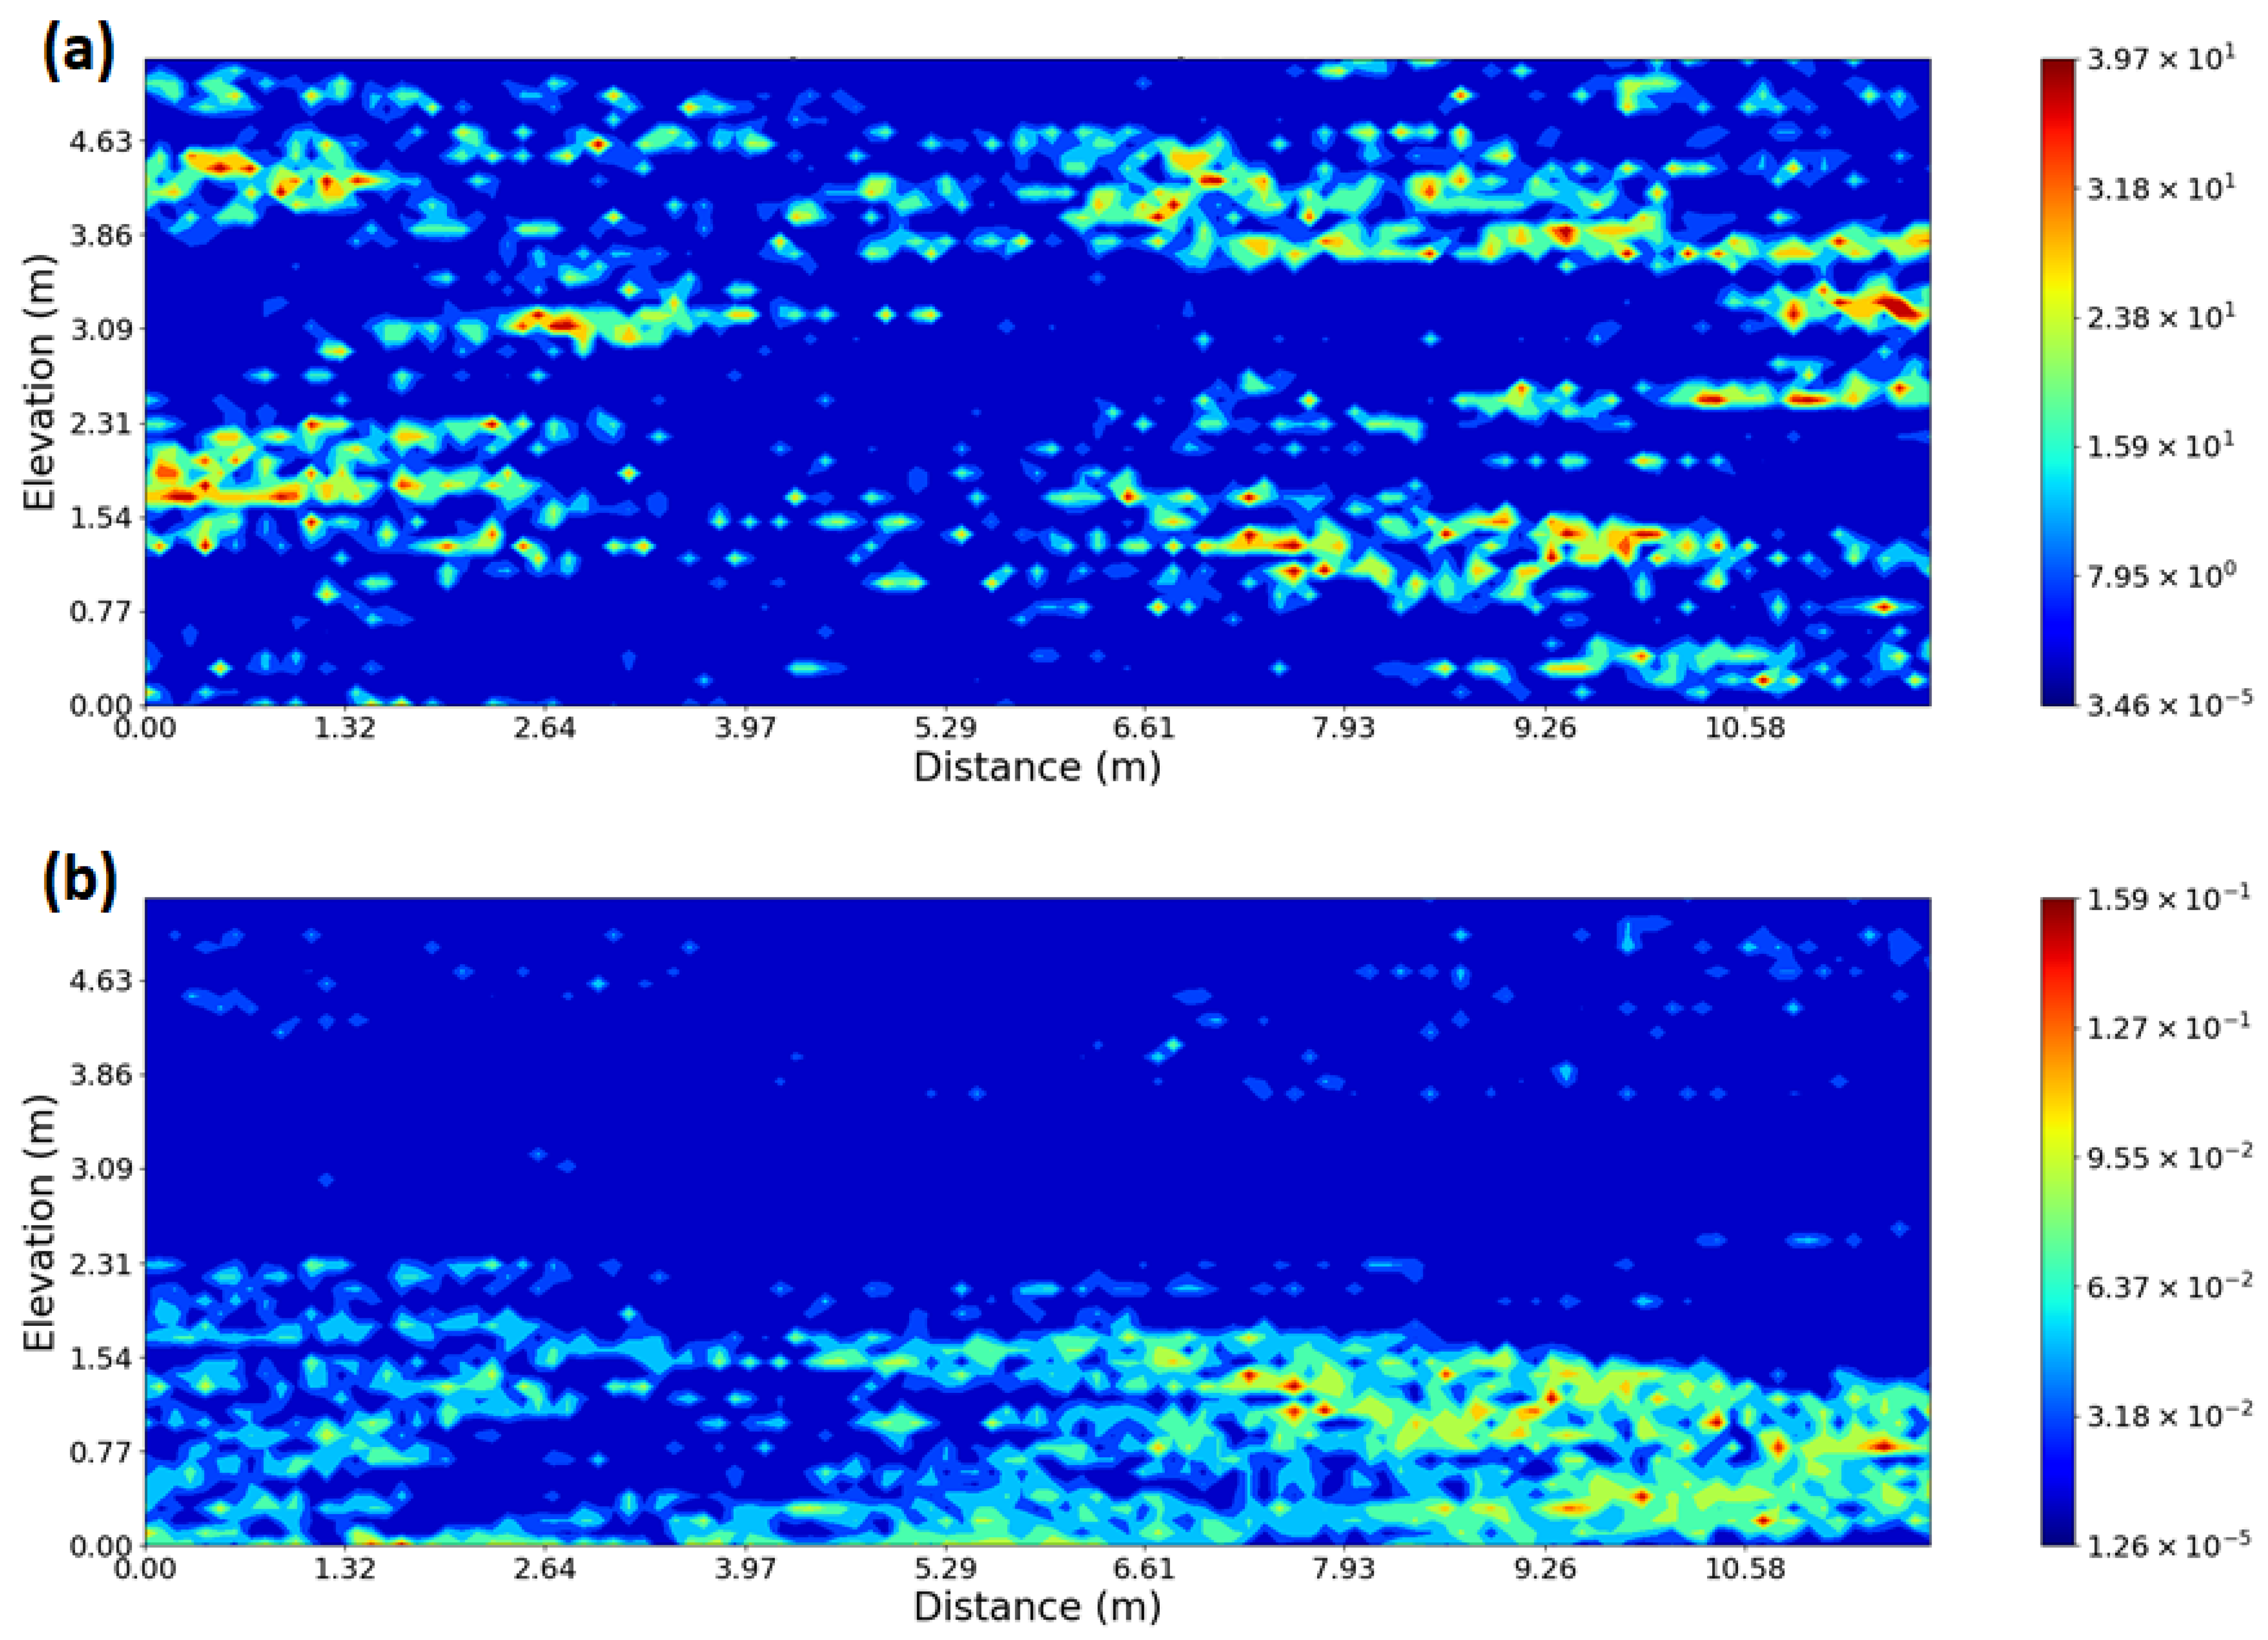
In this study, K is associated with the physical heterogeneity, and the Fe(III) hydroxide distribution represents the chemical heterogeneity. For the homogeneous K case, a uniform horizontal K value of 0.432 m/d was assigned for all cells throughout the domain (based on the previous work specified by Şengör et al. [33]). For the physical heterogeneous cases, horizontal K values were assigned based on the physical heterogeneity data obtained from Scheibe et al. [22], as shown in Figure 2a. Vertical K values were assumed as the 1:10 ratio of horizontal K (based on Scheibe et al. [22]) for all homogeneous and heterogeneous scenarios.
The Fe(III) hydroxide distribution data yielded by Scheibe et al. [22], as shown in Figure 2b, were used to demonstrate the effect of chemical heterogeneity for uranium bioreduction and reoxidation processes for heterogeneous Fe(III)-based scenarios. For homogeneous Fe(III)-based cases, a uniform value of 7.25 × 10⁻³ moles mineral/L of initial hematite solid concentration (based on the original laboratory experiments reported by Sani et al. [37] and model simulations conducted by Sengor et al. [33]) was assigned for all cells.

2.4. Biogeochemical Reactions

The biogeochemical reaction database is composed of biotic and abiotic reactions compiled using the biogeochemical reaction network outlined by Spycher et al. [39] and Sengor et al. [33], consisting of equilibrium and kinetically controlled reactions. Kinetically controlled reactions included sulfate bioreduction by lactate, Fe(III) bioreduction by lactate, U(IV) bioreduction, U(IV) reoxidation by Fe(III), sulfide reoxidation by Fe(III), and the precipitation/dissolution of sulfur. Kinetically controlled reactions and their corresponding reaction rates are listed in Table 2.
As seen in Table 2, lactate degradation reactions, i.e., sulfate (Reaction (1)) and Fe(III) bioreduction (Reaction (2)), are assumed to be microbially mediated. The rate expression R is modeled using a conventional dual-Monod rate law with biomass growth [33,39]:
R = q   C b C D k D + C D C A k A + C A   f G
with
Rb = YbRkdecCb
fG = 1 − Q/Keq
where C is the concentration, the subscripts A, D, and b represent the electron acceptor, the electron donor, and the biomass, respectively, k is a half saturation constant in units of C, q is the rate of maximum substrate utilization (in units of moles per time, per biomass), Yb is the microbial yield coefficient (in units of biomass per substrate), kdec is the cell decay rate (in units per time), and fG is the affinity term that varies between 1 (far from equilibrium) and 0 (equilibrium). Q is the ion activity product, and Keq is the equilibrium constant of each reaction. Note that although the lactate degradation reaction stoichiometries (Reactions (1) and (2)) do not include biomass generation directly, microbial concentrations are still simulated [33,39].
For Reaction (3), the rate law expression R is calculated as
R = r C D k D + C D   f G
where r and kD were adjusted to reproduce the observed experimental results as described in detail by Spycher et al. [39].
The rates of Reactions (4)–(6) are determined as
R = r fG,
where r (in units of mol/L per time) is assumed to be a constant. Other terms are the same as defined above for Equations (1)–(3). These reactions are observed to take place close to equilibrium, and the direction of the reaction (dissolution or precipitation) might be reversed, depending on whether the ion activity product, Q, is smaller or greater than Keq. In order to maintain fG to be between 0 (equilibrium) and 1 (far from equilibrium), this term was written as fG = −(1 − Keq/Q) in the case of reaction reversal. The precipitation/dissolution of elemental solid sulfur (S(s)) (Reaction 6) was considered to be kinetically controlled in order to yield results consistent with laboratory experiments [37].
It should be noted that the available kinetically controlled reaction rates which are obtained from Spycher et al. [39] were calibrated for laboratory-scale experiments (in accordance with laboratory experiments conducted by Sani et al. [37]). Therefore, the reaction rates would need to be adjusted to make it more representative for field-scale experiments to be used in this study. Laboratory-, local-, and field-scale data have been compiled in Bao et al. [45], where about a two-order magnitude of difference between laboratory- and field-scale reactions rates have been observed. Also considering the reaction rates for the experimental kinetics by Sengor et al. [33], the available kinetically controlled data are adjusted, where the reaction rates are divided by 100 to be consistent for field-scale experiments (see Table 2).
Aqueous speciation reactions were assumed to proceed at equilibrium, where these reactions are described using the law of mass action:
C i = K i 1 γ i 1 j = 1 N c ( γ j C j ) η i j
where C is the concentration (mol/kgwater), K is the thermodynamic equilibrium constant, γ is the activity coefficient, ηij values are the stoichiometric coefficients in the reaction, Nc is the number of primary species, and subscripts j and i refer to the primary and secondary species, respectively. The aqueous speciation reactions that are used in the modeling study are listed in Supplementary Material (Table S2).
The inorganic reaction system included biogenic uraninite (UO2); hematite (Fe2O3), which is considered to be the Fe(III) hydr(oxide) phase; siderite (FeCO3); and disordered mackinawite (FeSm), all implemented as equilibrium reactions. Hematite is considered to be initially present (as the Fe(III) hydr(oxide) phase as described above), whereas other minerals are initially absent and considered as secondary minerals. The equilibrium mineral dissolution and precipitation reactions are described using the mass action equation:
K m = j = 1 N c ( γ j C j ) η m j
where Km is the equilibrium constant for the mineral dissolution reaction (assuming the unit activity of solid phases), Nc is the number of primary species considered, subscript m refers to minerals, and ηmj values are the stoichiometric coefficients of primary species j in mineral m.
The sorption of uranium onto the Fe(III) hydr(oxide) phases is implemented as surface complexation reactions, which are also considered to be at equilibrium and modeled using non-electrostatic double-layer modeling [46]. The surface complexation reactions of uranium used in the study are listed in Supplementary Material Table S3.

2.5. Transport Processes

The governing equation for the advective–dispersive reactive transport of ith (mobile) aqueous species can be described as
θ C i t = θ D C i ( θ v C i ) q s C i s + θ r r e a c t , i
where   = x , y , z
Here, D is the hydrodynamic dispersion coefficient tensor, and v is the pore velocity vector v = (vx, vy, vz), with vx, vy, and vz as the pore velocities in the x, y, and z directions, respectively.
The rate of change in concentration for immobile species, e.g., minerals, is computed as
C i t = r r e a c t , i
where qs is a volumetric flow rate per unit volume of the aquifer, representing fluid sources (positive) and sinks (negative); θ is the porosity; Cis is the concentration of the source or sink flux; and rreact,i is a source/sink term due to the chemical reaction [33]. The length of the model time steps is determined as 0.01 d, where this value is calculated by taking the Peclet and Courant number criteria into consideration.
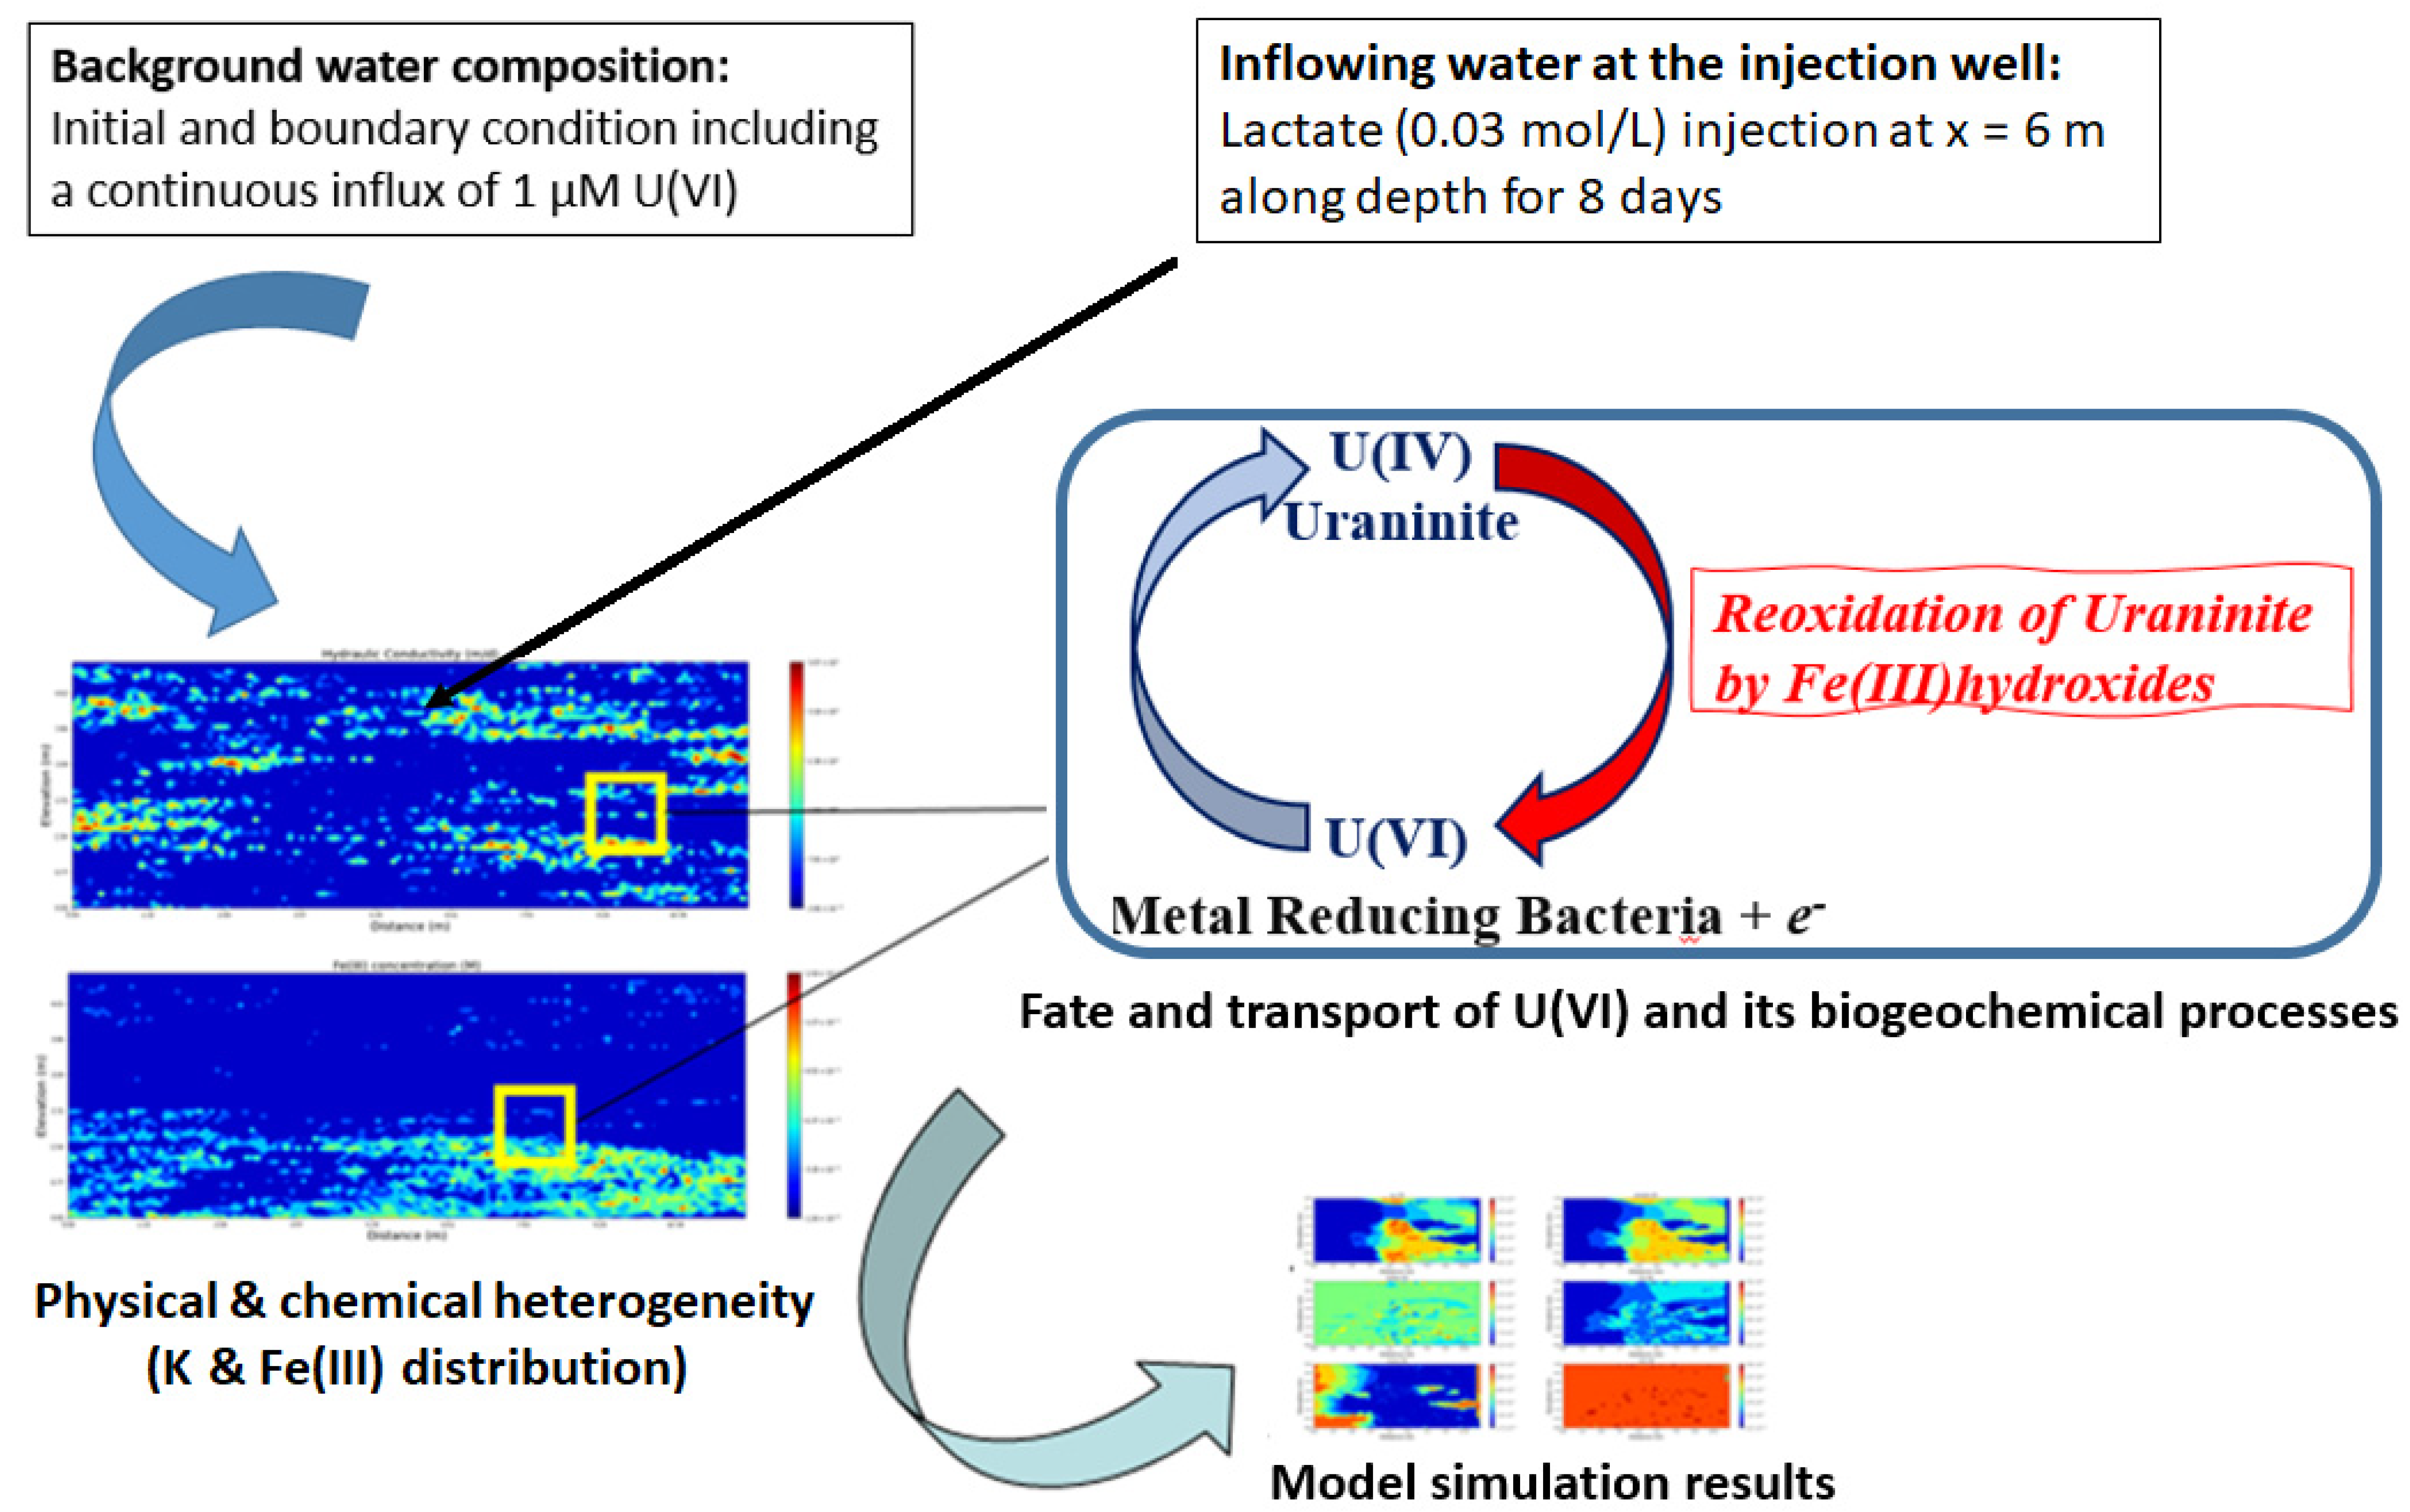
The illustration of the conceptual model of the current study is given in Figure 3.

3. Results and Discussion

In this section, the 2D reactive transport model results are presented and discussed with regard to simulating key biogeochemical reaction processes coupled with the transport of contaminants under field-scale heterogeneity, where an example for uranium fate and transport was chosen. The model simulations are set up with various cases of heterogeneity involvement, and each of their results is discussed in the following three subchapters which are detailed below. In the first part of the model runs, the numerical model simulations are ran with no adsorption of uranium or any other species onto the aquifer solids (Section 3.1). In the second part, the adsorption of uranium onto Fe(III) (hydr)oxide surfaces are implemented via surface complexation reactions (Section 3.2). In the last part, the numerical model simulations are compared with/without the U(IV) reoxidation reaction by Fe(III) (hydr)oxide minerals (Section 3.3).

3.1. Impact of Physical and Chemical Heterogeneity on the Biogeochemical Dynamics of the Reactive Transport Model

In order to investigate the impact of physical and chemical heterogeneity on the reaction network of the 2D reactive transport model of uranium, three different scenarios are demonstrated, with differing cases of heterogeneity. In the first case, both physical and chemical heterogeneities are considered, where the heterogeneous K (Figure 2a) and heterogeneous Fe(III) distributions (Figure 2b) are assigned throughout the model domain. In the second case, the model domain included only physical heterogeneity with no chemical heterogeneity. Therefore, for this case, the K representing the physical heterogeneity is distributed heterogeneously throughout the domain, whereas the distribution of Fe (III) hydroxide is homogeneous for the whole domain, corresponding to 7.25 × 10⁻³ mol/L of Fe(III) hydr(oxide) mineral concentration. In the third case, the model domain did not include any physical or chemical heterogeneity. Thus, a unique value of 0.432 m/d for K (based on the previous work of Sengor et al. [33]) and a unique value of 7.25 × 10⁻³ mol/L for Fe(III) hydr(oxide) mineral concentration (corresponding to the original experimental conditions by Sani et al. [37] and model simulations conducted by Sengor et al. [33] in homogeneous environments) were assigned for all 6426 cells throughout the domain. In all scenario cases, lactate was injected for a time period of 8 days from an injection well defined from a middle location as seen in Figure 1, where a lactate-containing solution (see Table 2) was injected at a rate of 0.02 m3/day into an initially steady-state flow field, thereby resulting in transient flow conditions. The total simulation period was considered to be 40 days (being representative of demonstrating the impact of biotic and abiotic reactions on uranium transformation), where simulation results corresponding to days 8 and 40 are presented for all scenarios for the key species, which are lactate, acetate, sulfate, Fe(II), U(VI), and uraninite (UO2). The concentrations of mackinawite (FeS), total aqueous sulfide (S), and solid sulfur (S(s)) species as well as pH are also presented.
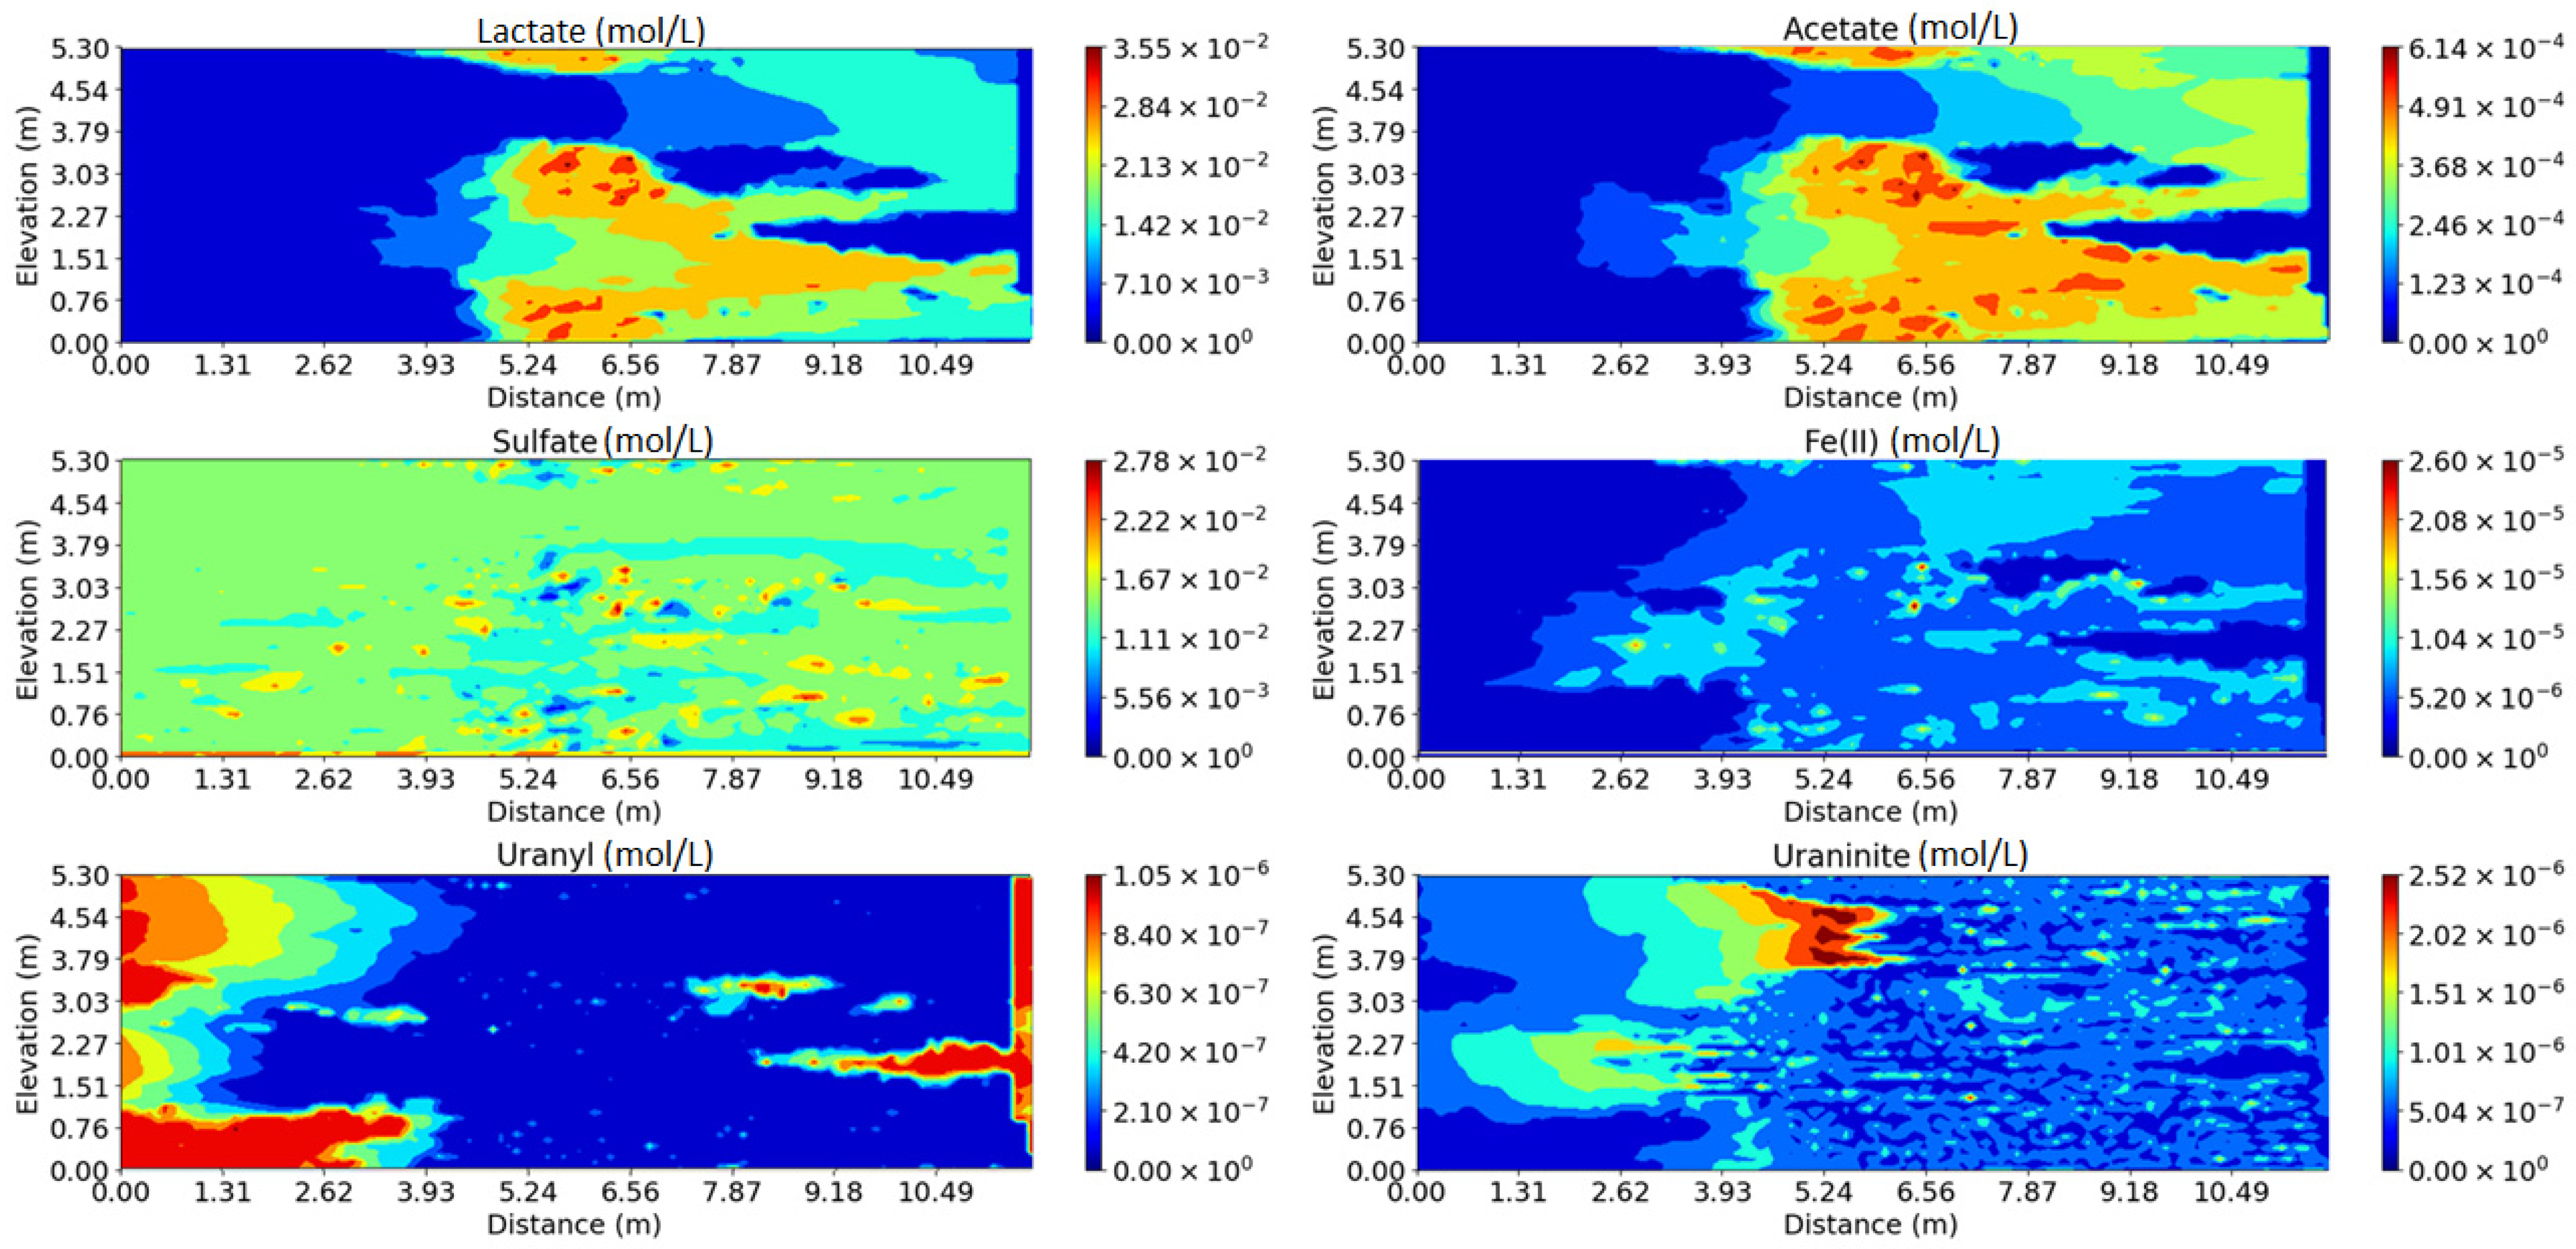
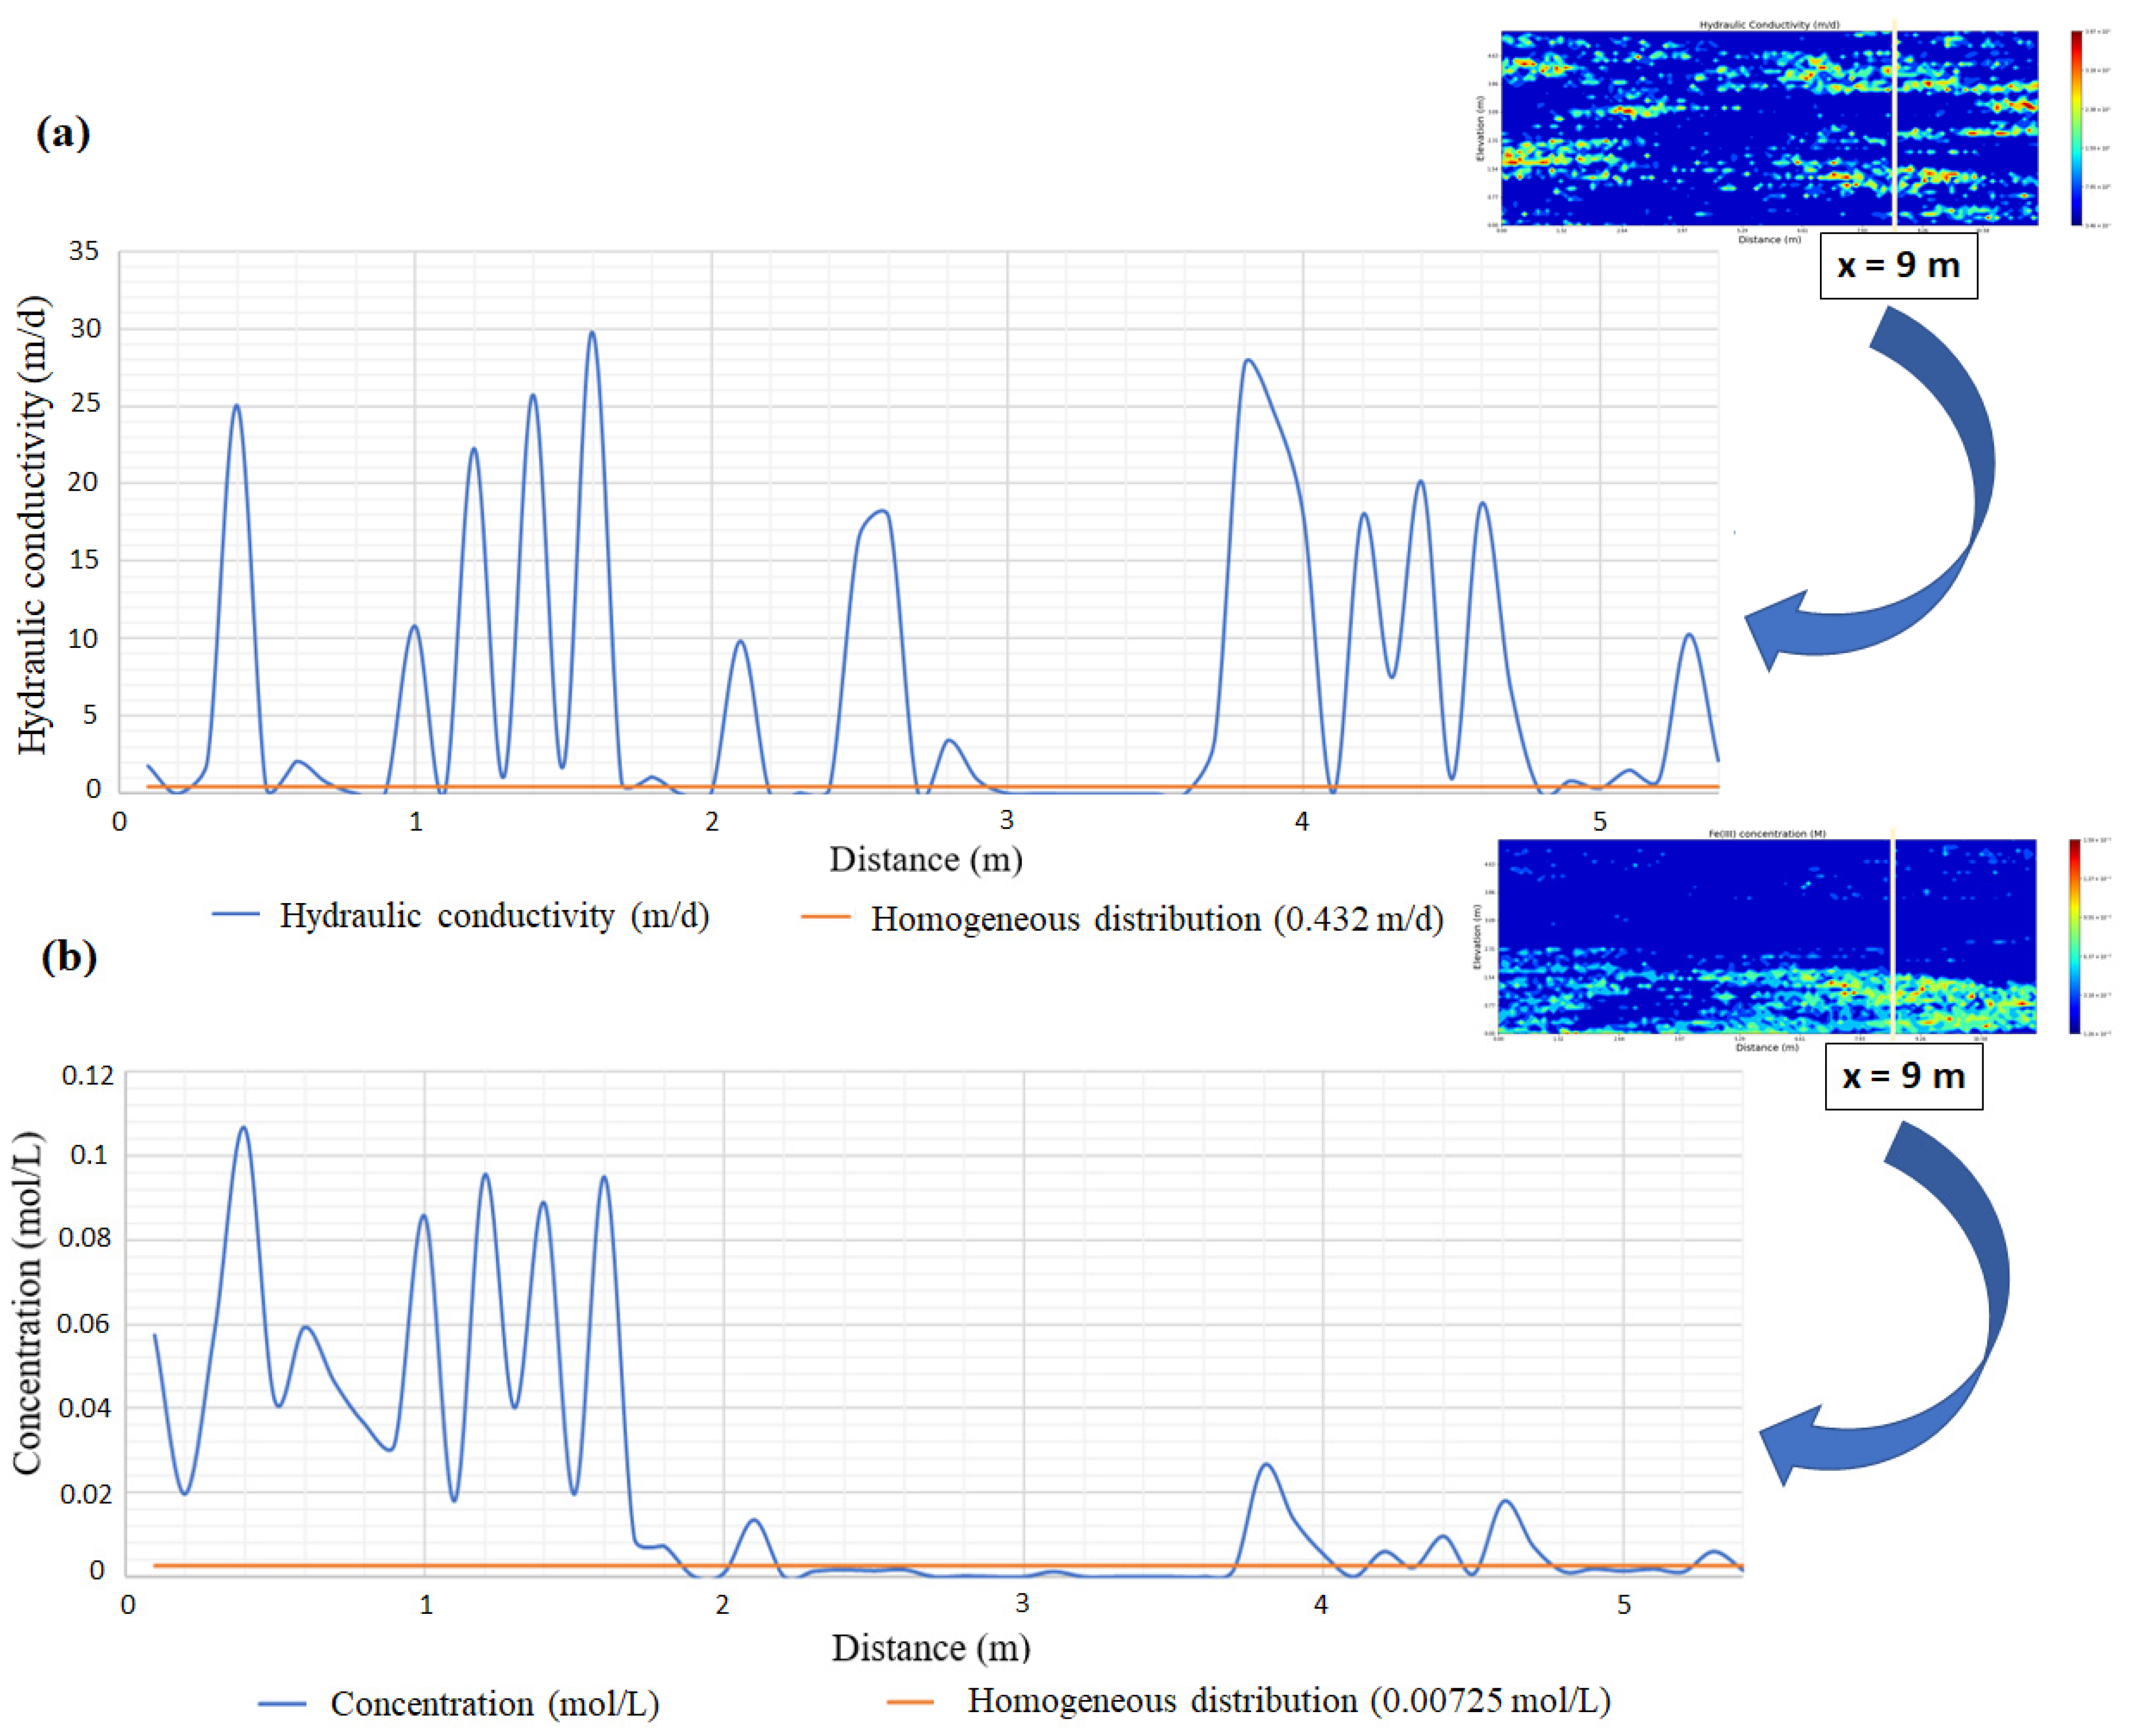
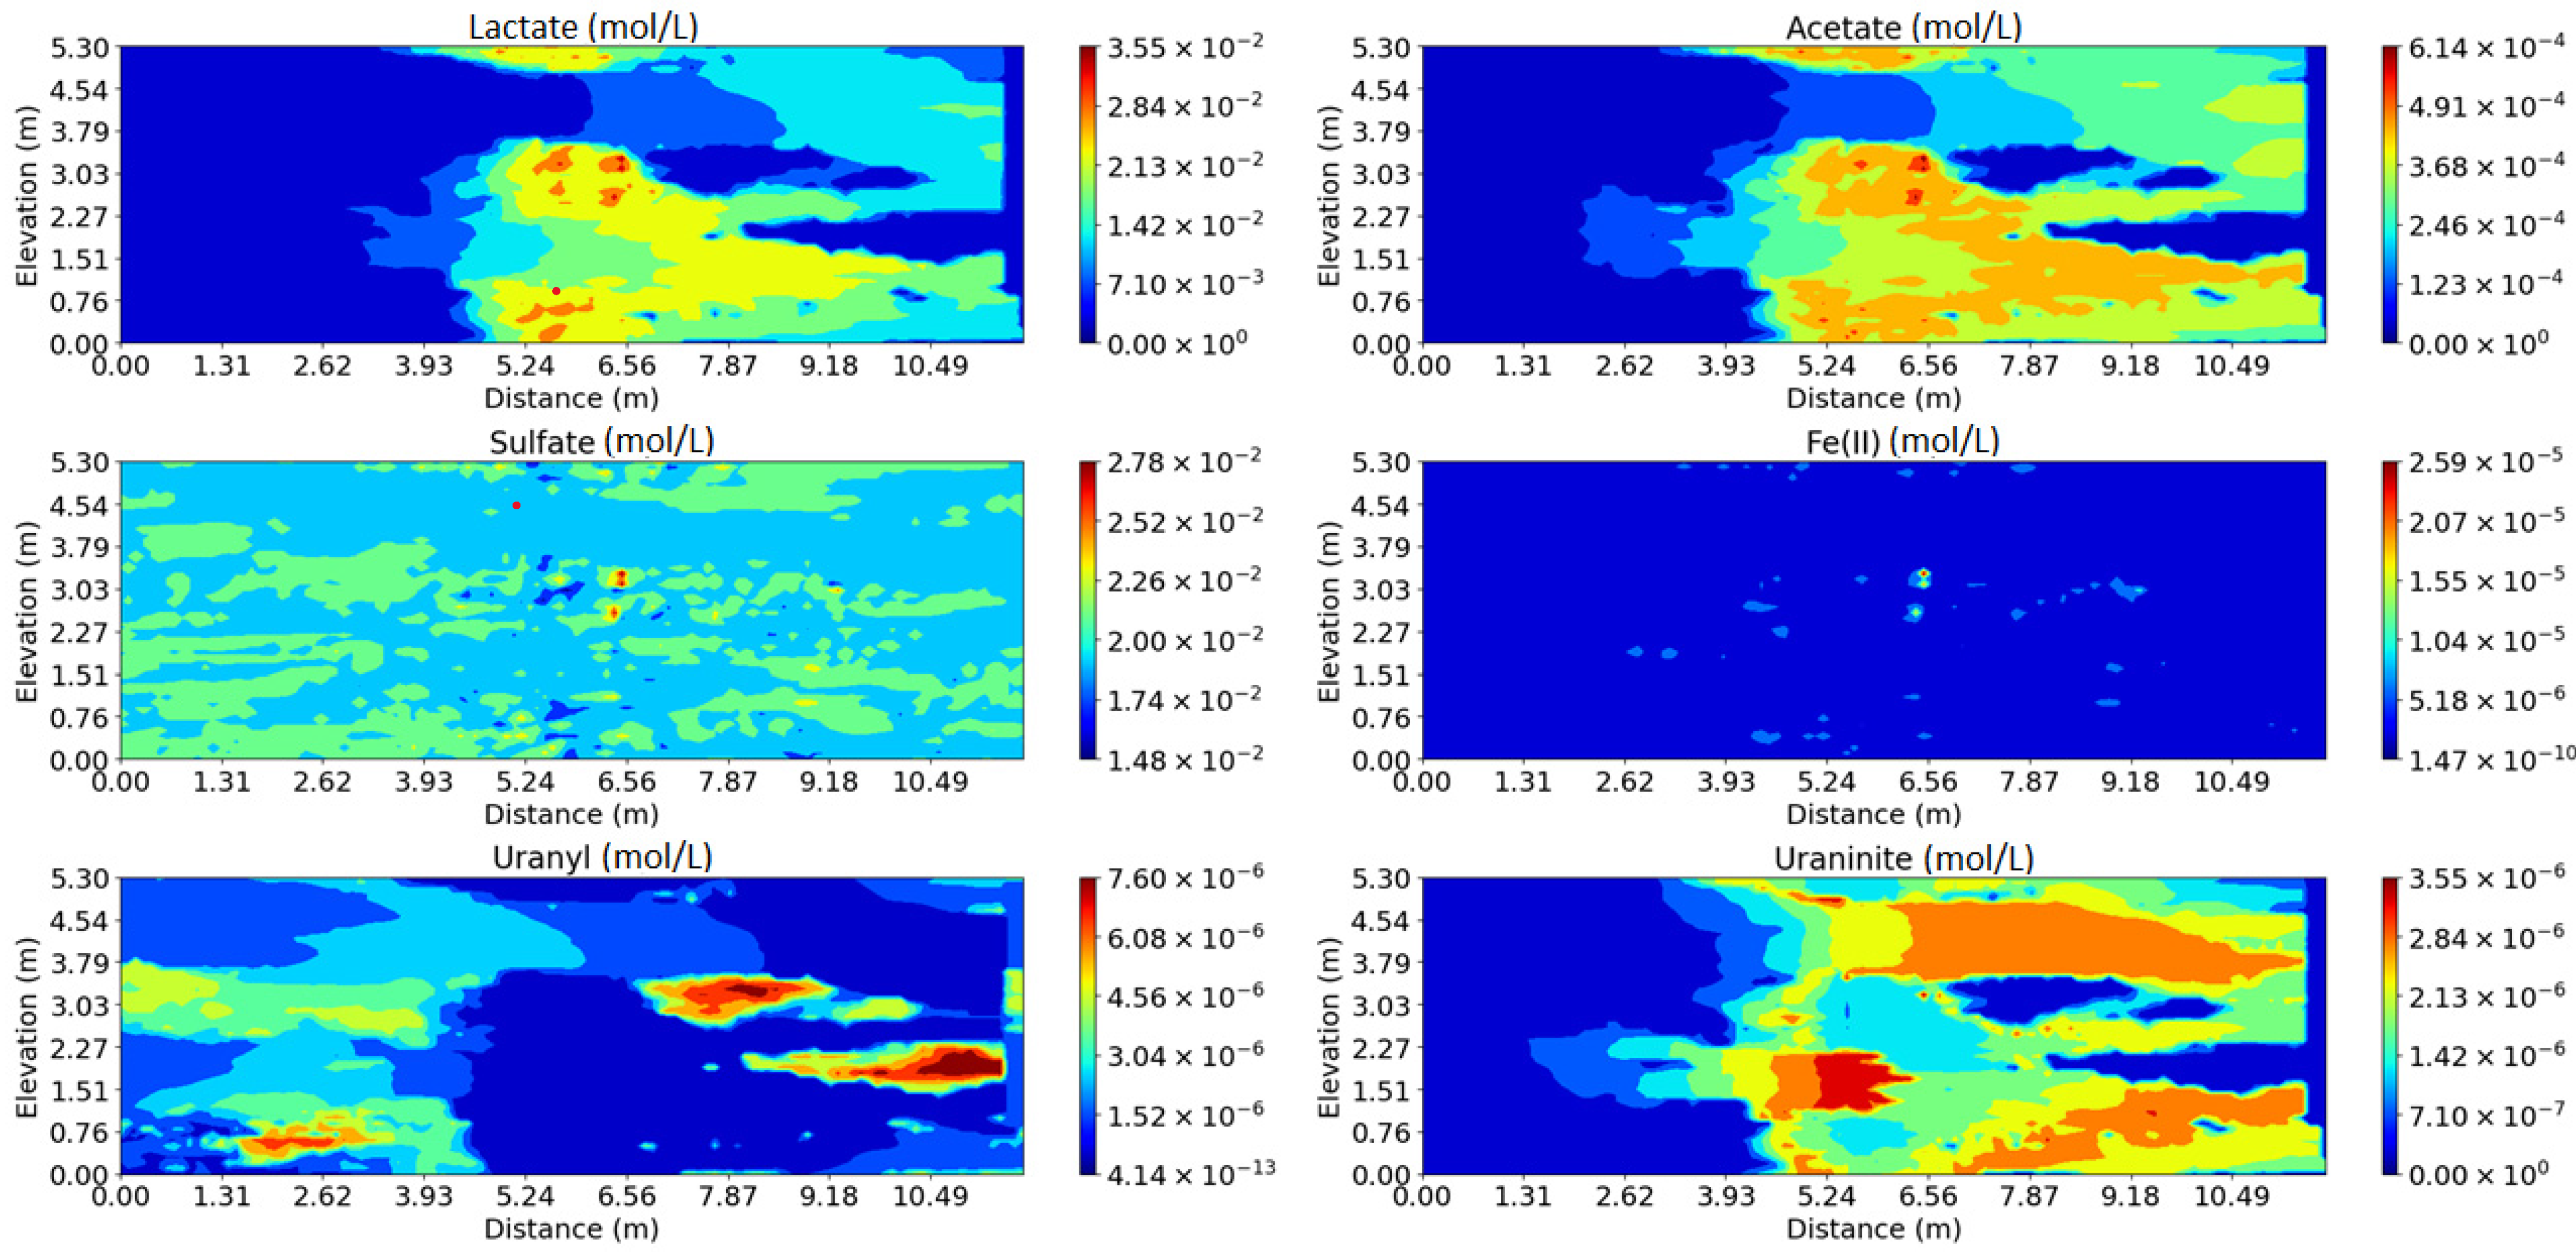
Figure 4 and Figure 5 show the concentration distribution of key species in the heterogeneous K and heterogeneous Fe concentration distribution case after 8 and 40 days of simulation period, respectively. In addition to the areal concentration distributions, key species concentrations have also been plotted along a vertical cross section of the model domain at x = 9 m, which is selected to represent the range of variability pertaining to the low and high physical and chemical heterogeneity zones within the aquifer domain, and are thus representative to elucidate the concentration changes within these zones (Figures 7–9). K and Fe(III) hydroxide concentration distributions (namely hematite concentration), along the vertical cross section at x = 9 m, are shown in Figure 6a and Figure 6b, respectively, to compare the heterogeneous zones and corresponding concentration predictions at this section for various cases. As shown in Figure 6a, a low K zone appears more specifically between 1.8 and 2 m, 3–3.6 m, and 4.8–5.2 m, and a high K zone appears between 3.8 and 4.8 m. For the Fe(III) hydroxide concentration distribution, a low zone is observed at 2.2–3.6 m and 4.8–5.4 m, and a high zone is seen around 0–1.8 m (Figure 6b).
When the model results with the heterogeneous K and Fe(III) distribution case are compared with the heterogeneous K and homogeneous Fe(III) distribution case, the concentration distributions are observed to be nearly identical (see Figure 7, Figure 8 and Figure 9). For the homogeneous K and Fe(III) concentration distribution case, a uniform and regular concentration distribution is observed due to the absence of any spatial variability, either physically or chemically. These results demonstrate that physical heterogeneity has a greater impact than chemical heterogeneity with respect to the model predictions of biogeochemical reaction dynamics coupled with subsurface transport.
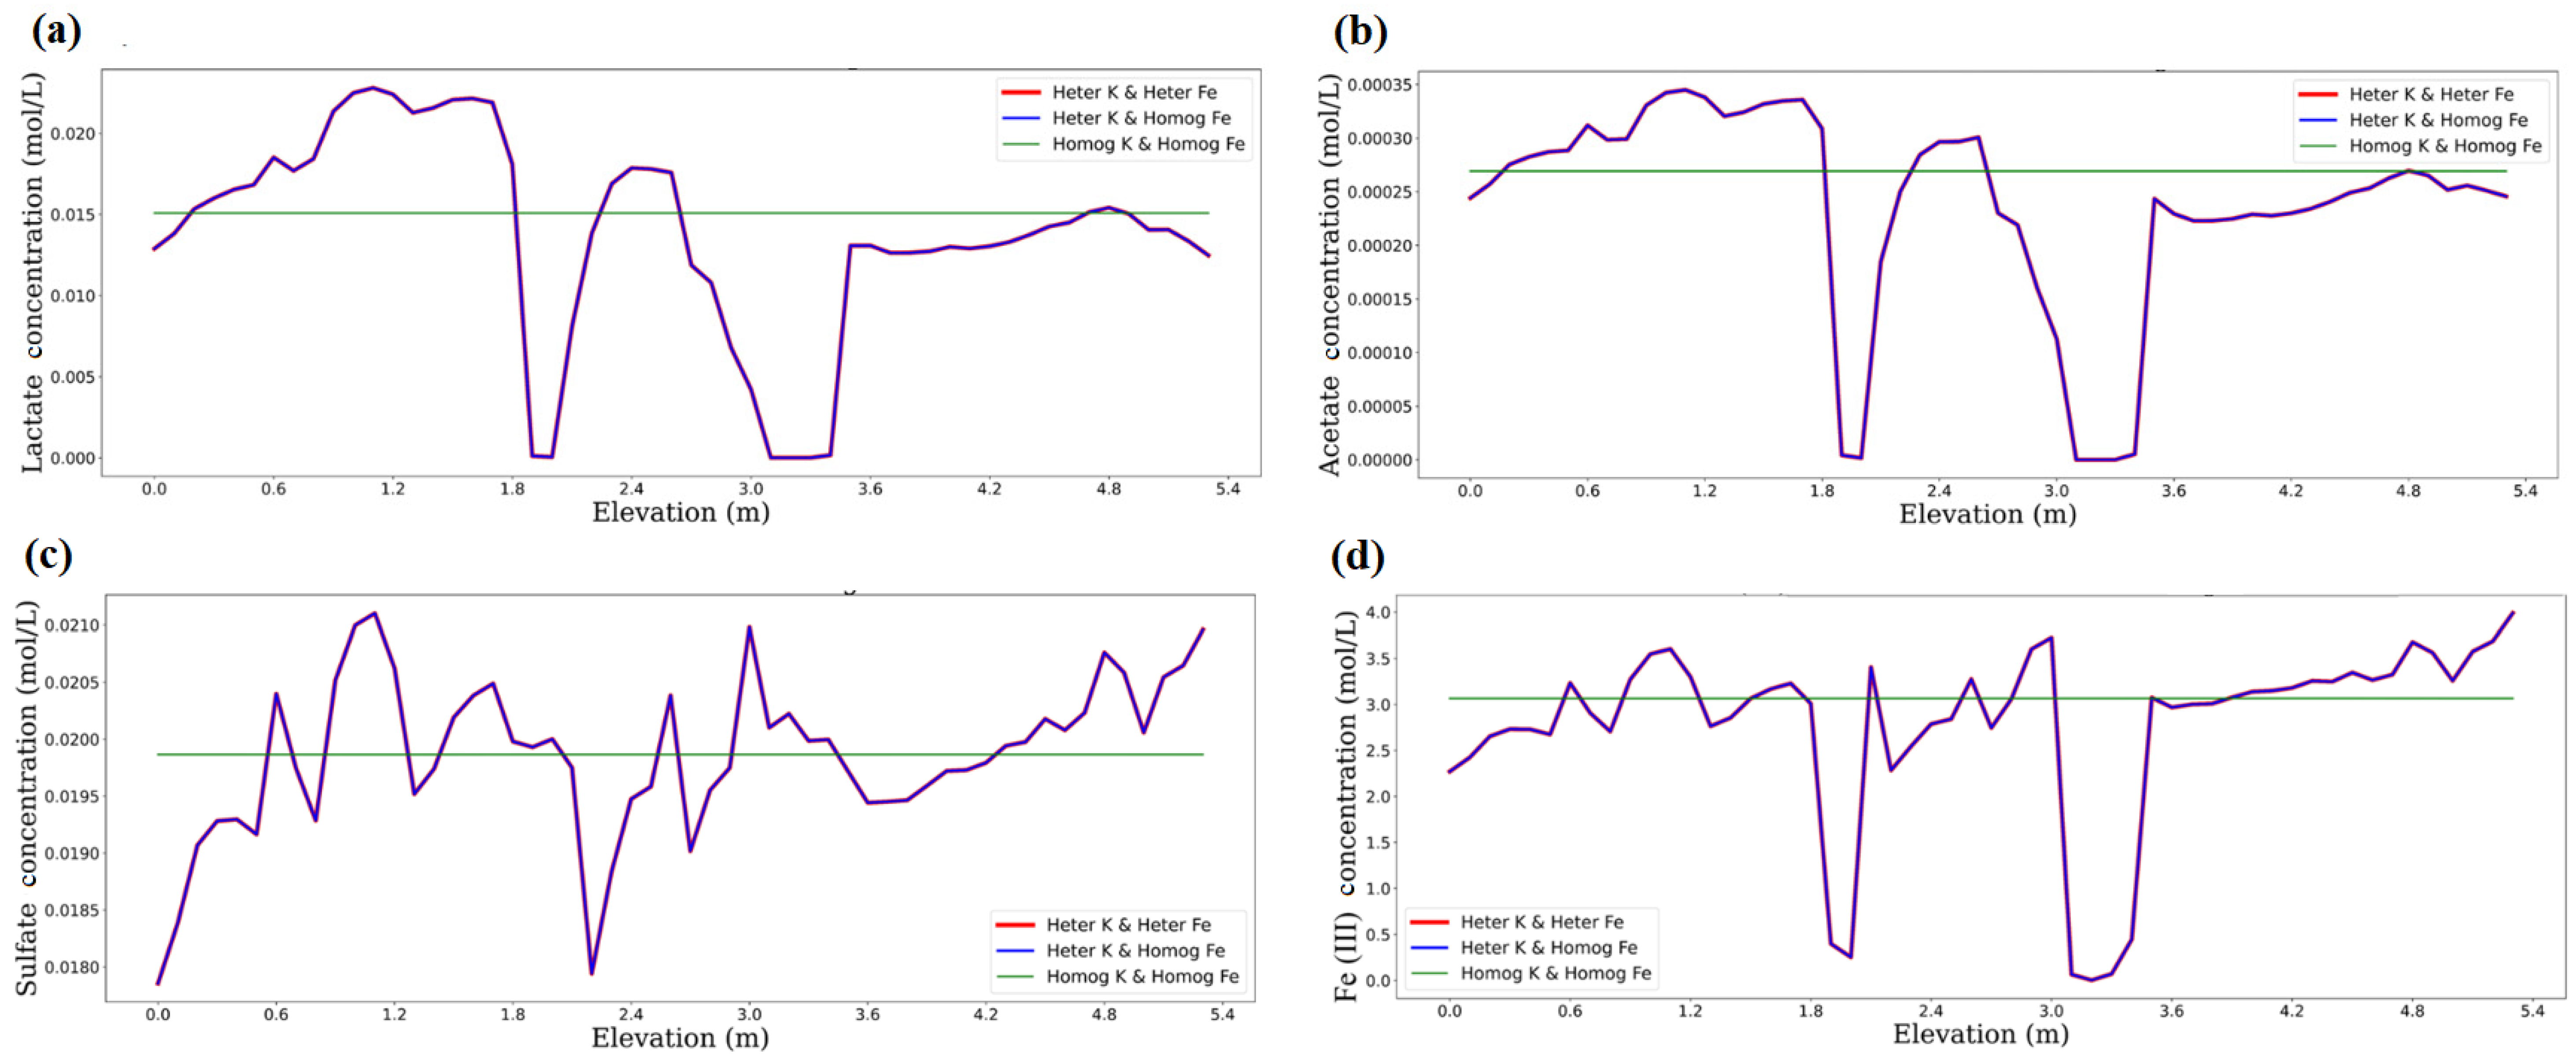
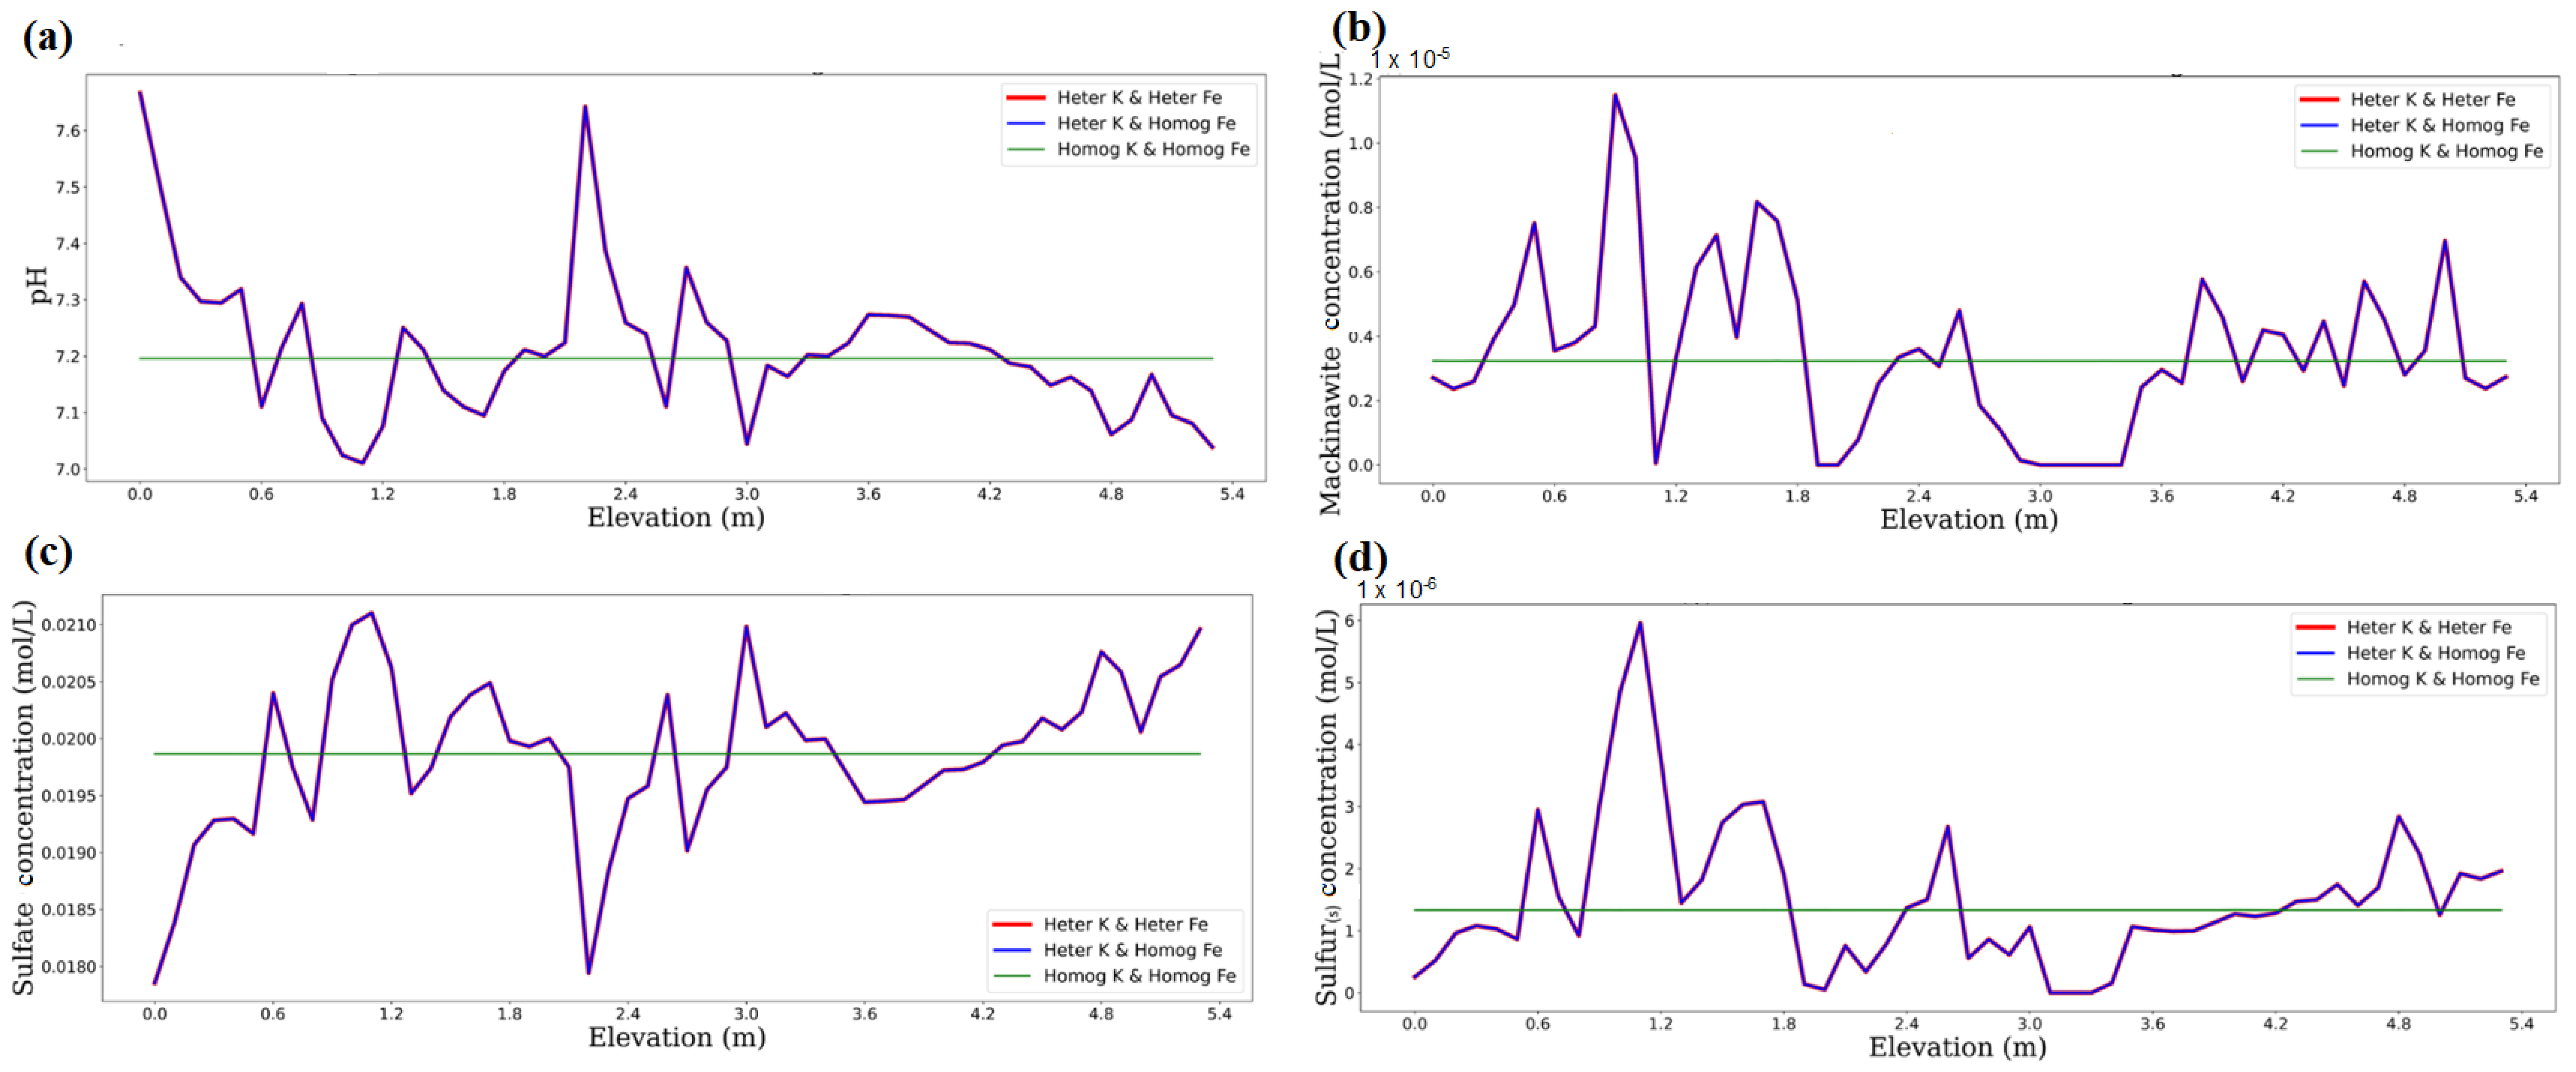
When the model predictions are compared between 8 and 40 days of simulation periods, the impact of lactate injection, resulting in sulfate bioreduction and acetate generation, along with Fe(III) bioreduction to produce Fe(II) can be monitored from 8 to 40 days of simulation. With the injection of lactate, U(VI) bioreduction to U(IV) forming uraninite mineral, along with the lactate degradation trends, can also be seen, demonstrating that the model simulations capture the complex biogeochemical reaction kinetics coupled with the transport of aqueous species in the system (Figure 4 and Figure 5). The observed trends are also in accordance with the results previously reported by Spycher et al. [39] and Sengor et al. [33] that simulated the biogeochemical reaction network of batch experiments. In addition to the areal concentration distribution of key species at the model site, vertical cross section distributions at x = 9 m are also presented to elucidate the concentrations along a representative heterogeneous zone. Figure 7 shows U(VI) and uraninite distributions; Figure 8 shows lactate, acetate, sulfate, and Fe(II) distributions; and Figure 9 shows pH, mackinawite, total aqueous sulfide, and sulfur distributions along the vertical cross section of the model domain at x = 9 m. In Figure 7, Figure 8 and Figure 9 (and subsequent x-sectional figures presented in this paper), red lines represent the heterogeneous K and heterogeneous Fe(III) hydroxide distribution case results; blue lines represent the heterogeneous K and homogeneous Fe(III) hydroxide distribution case results; and green lines represent the homogeneous K and homogeneous Fe(III) hydroxide distribution case results. The model simulation results across the cross section of the domain indicate the fluctuations of species concentrations, where high concentrations (lactate, acetate, sulfate, Fe(II), S, etc.) are observed. Correspondingly, relatively high K zones and low concentrations are observed, corresponding to low conductivity zones within the x-section, due to the preferential transport through areas of high conductivity, thereby resulting in high mixing and reaction potential. So, physical heterogeneity mainly results in low and high K zones. In the low conductivity zones, there are mixing restrictions that lead to very limited reaction potentials. High K zones implicate efficient mixing zones due to the high interaction of compounds based on the biogeochemical reaction dynamics, where the mechanical effects on concentration distributions are more pronounced. Therefore, the lowest concentrations (nearly zero) are seen at locations along the 1.8–2 m and 3–3.6 m zones, which are associated with the lowest K (compare Figure 7, Figure 8 and Figure 9 results with low K zones in Figure 6a). Accordingly, mineral formations (i.e., mackinawite, uraninite, and sulfur) are also observed at areas of high mixing at the high conductivity zones, following the biogeochemical reaction dynamics (Table 2); and pH values show decreasing trends based on sulfate and Fe(III) reduction reactions, resulting in Fe(II) formation and sulfur precipitation (Figure 9). The uranyl concentrations, on the other hand, show the highest distributions along the lowest K zones due to the initially uniform 1 µmol/L concentration distributions throughout the domain (Figure 7a). The transport of solution and dissolved species within the low K zones would be limited within these low conductivity lenses with enhanced mixing limitations, resulting in limited reaction potential.
The results thus demonstrate the strong impact of spatial variations in K on the overall fate and transport of dissolved constituents in the porewater. The comparison between physical and chemical heterogeneities from the model simulations show that the impact of physical heterogeneity is more visible. Comparing the model predictions of the heterogeneous K and Fe(III) distribution case with homogeneous K and Fe(III) distribution results, it is seen that uranium concentrations are significantly lower in the homogeneous case, indicating that assuming homogeneity would lead to an overestimation of bioreduction or the bioremediation of the contaminant of concern in the subsurface environment. Previous studies have also demonstrated that heterogeneity has significant control on the groundwater transport and reactive processes [16,22,47]; however, the findings of the present study point out the significant influence of physical heterogeneity (over chemical heterogeneity) in predicting the bioreduction potential in the subsurface, in the absence of considering sorption processes in the biogeochemical model dynamics. In other words, for contaminants that exhibit limited sorption onto the aquifer matrix (depending on the specific contaminant, surface charge, crystallographic structure, or specific contaminant-porous material interactions), ignoring chemical heterogeneity may not be significant in predicting contaminant behavior in the model domain.

3.2. Impact of Physical and Chemical Heterogeneity on the Biogeochemical Dynamics of the Reactive Transport Model with the Surface Complexation of U(VI)

In this part, the 2D transport model was set up via the incorporation of surface complexation reactions, particularly U(VI) sorption onto Fe (hydr)oxide solids, to see the impact of all biogeochemical reaction networks, including sorption reactions on uranium fate and transport. Uranium adsorption reactions are implemented in the model via surface complexation using non-electrostatic double-layer modeling [46].
Iron (hydr)oxide phases are often associated with the solid matrix composition within the aquifer environment in the subsurface. Iron (hydr)oxide nanoparticle phases may also form in natural waters and at oxic–anoxic boundaries in sediments, and it is well established that they can control the solid–solution partitioning of numerous toxic metal species in near-surface aqueous regimes [48]. Thus, iron (hydr)oxide compounds and their colloidal counterparts have significant applications in soil and groundwater remediation due to their large surface areas, self-assembly potential, high specificity, and high reactivity characteristics, which can lead to spontaneous adsorption and the co-precipitation of heavy metals, including uranium. Therefore, understanding and integrating sorption processes into model simulations are highly important for the accurate representation of (bio)geochemical reaction dynamics occurring in the environment of concern and to properly justify reactive transport modeling predictions.
As mentioned in Section 2.3, reactive transport simulations including the surface complexation of U(VI) onto Fe(III)hydroxide surfaces are carried out using the initial water composition that is obtained after 25 year of U(VI) loading with surface complexation at t = 0, where the model site is first loaded with a uniform 1 × 10⁻⁶ µmol/L U(VI) concentration for 25 years from an upgradient source to obtain the quasi-equilibrium state of uranium concentration (aqueous and sorbed U(VI)) distribution at the aquifer domain (see Supplementary Material Figure S1). The homogeneous Fe(III) concentration distribution case involved the surface complexation of U(VI) onto the uniformly distributed Fe(III). The distribution of uranium concentration is then used as the initial condition for transient flow runs, where reactive transport simulations for the biogeochemical reaction network represented by Table 2 are conducted for 40 days, considering 8 days of lactate injection period from the middle well location. It should be noted that separate runs were also conducted using the uniform initial water composition (as in Section 3.1), and the same concentration trends were observed for all key species, thereby supporting the same conclusions drawn here.
Figure 10 shows the concentration distribution of key species in heterogeneous K and heterogeneous Fe(III) concentration distributions after 40 days, including surface complexation. Figure 11 shows the concentration distribution of key species in heterogeneous K and homogeneous Fe(III) concentration distributions after 40 days. The numerical model simulations including surface complexation again capture the biogeochemical dynamics of the system coupled with the transport of species in the model domain. With the injection of lactate, U(VI) reduction, acetate and sulfate generation, and Fe(III) reduction processes are simulated, as seen in Figure 10 and Figure 11. The observed trends, again being in line with the previous comparative simulations with measured data shown by Spycher et al. [39] and Sengor et al. [33], verify that the model results are able to capture the U(VI) reduction and reoxidation behavior seen in the original experimental data. When the surface complexation of U(VI) species onto Fe(III) hyroxide solids is included in the model, the results show a higher amount of U(VI) to be retained in the system, leading to the formation of higher amounts of uraninite (and correspondingly low amounts of soluble U(IV)) at the model site, compared to previous model simulations without surface complexation, whereas the concentrations of other key species show almost the same distribution. When the heterogeneous K heterogeneous Fe(III) distribution and the heterogeneous K homogeneous Fe(III) distribution case results are compared, it is observed that the surface complexation impact is more pronounced in the presence of chemical heterogeneity, which is due to the heterogeneous distribution of Fe(III) hydroxides at the site, where Fe(III) hydroxide concentration values are relatively higher compared to the homogeneous average of 7.25 × 10⁻³ moles/L (see Figure 6b).
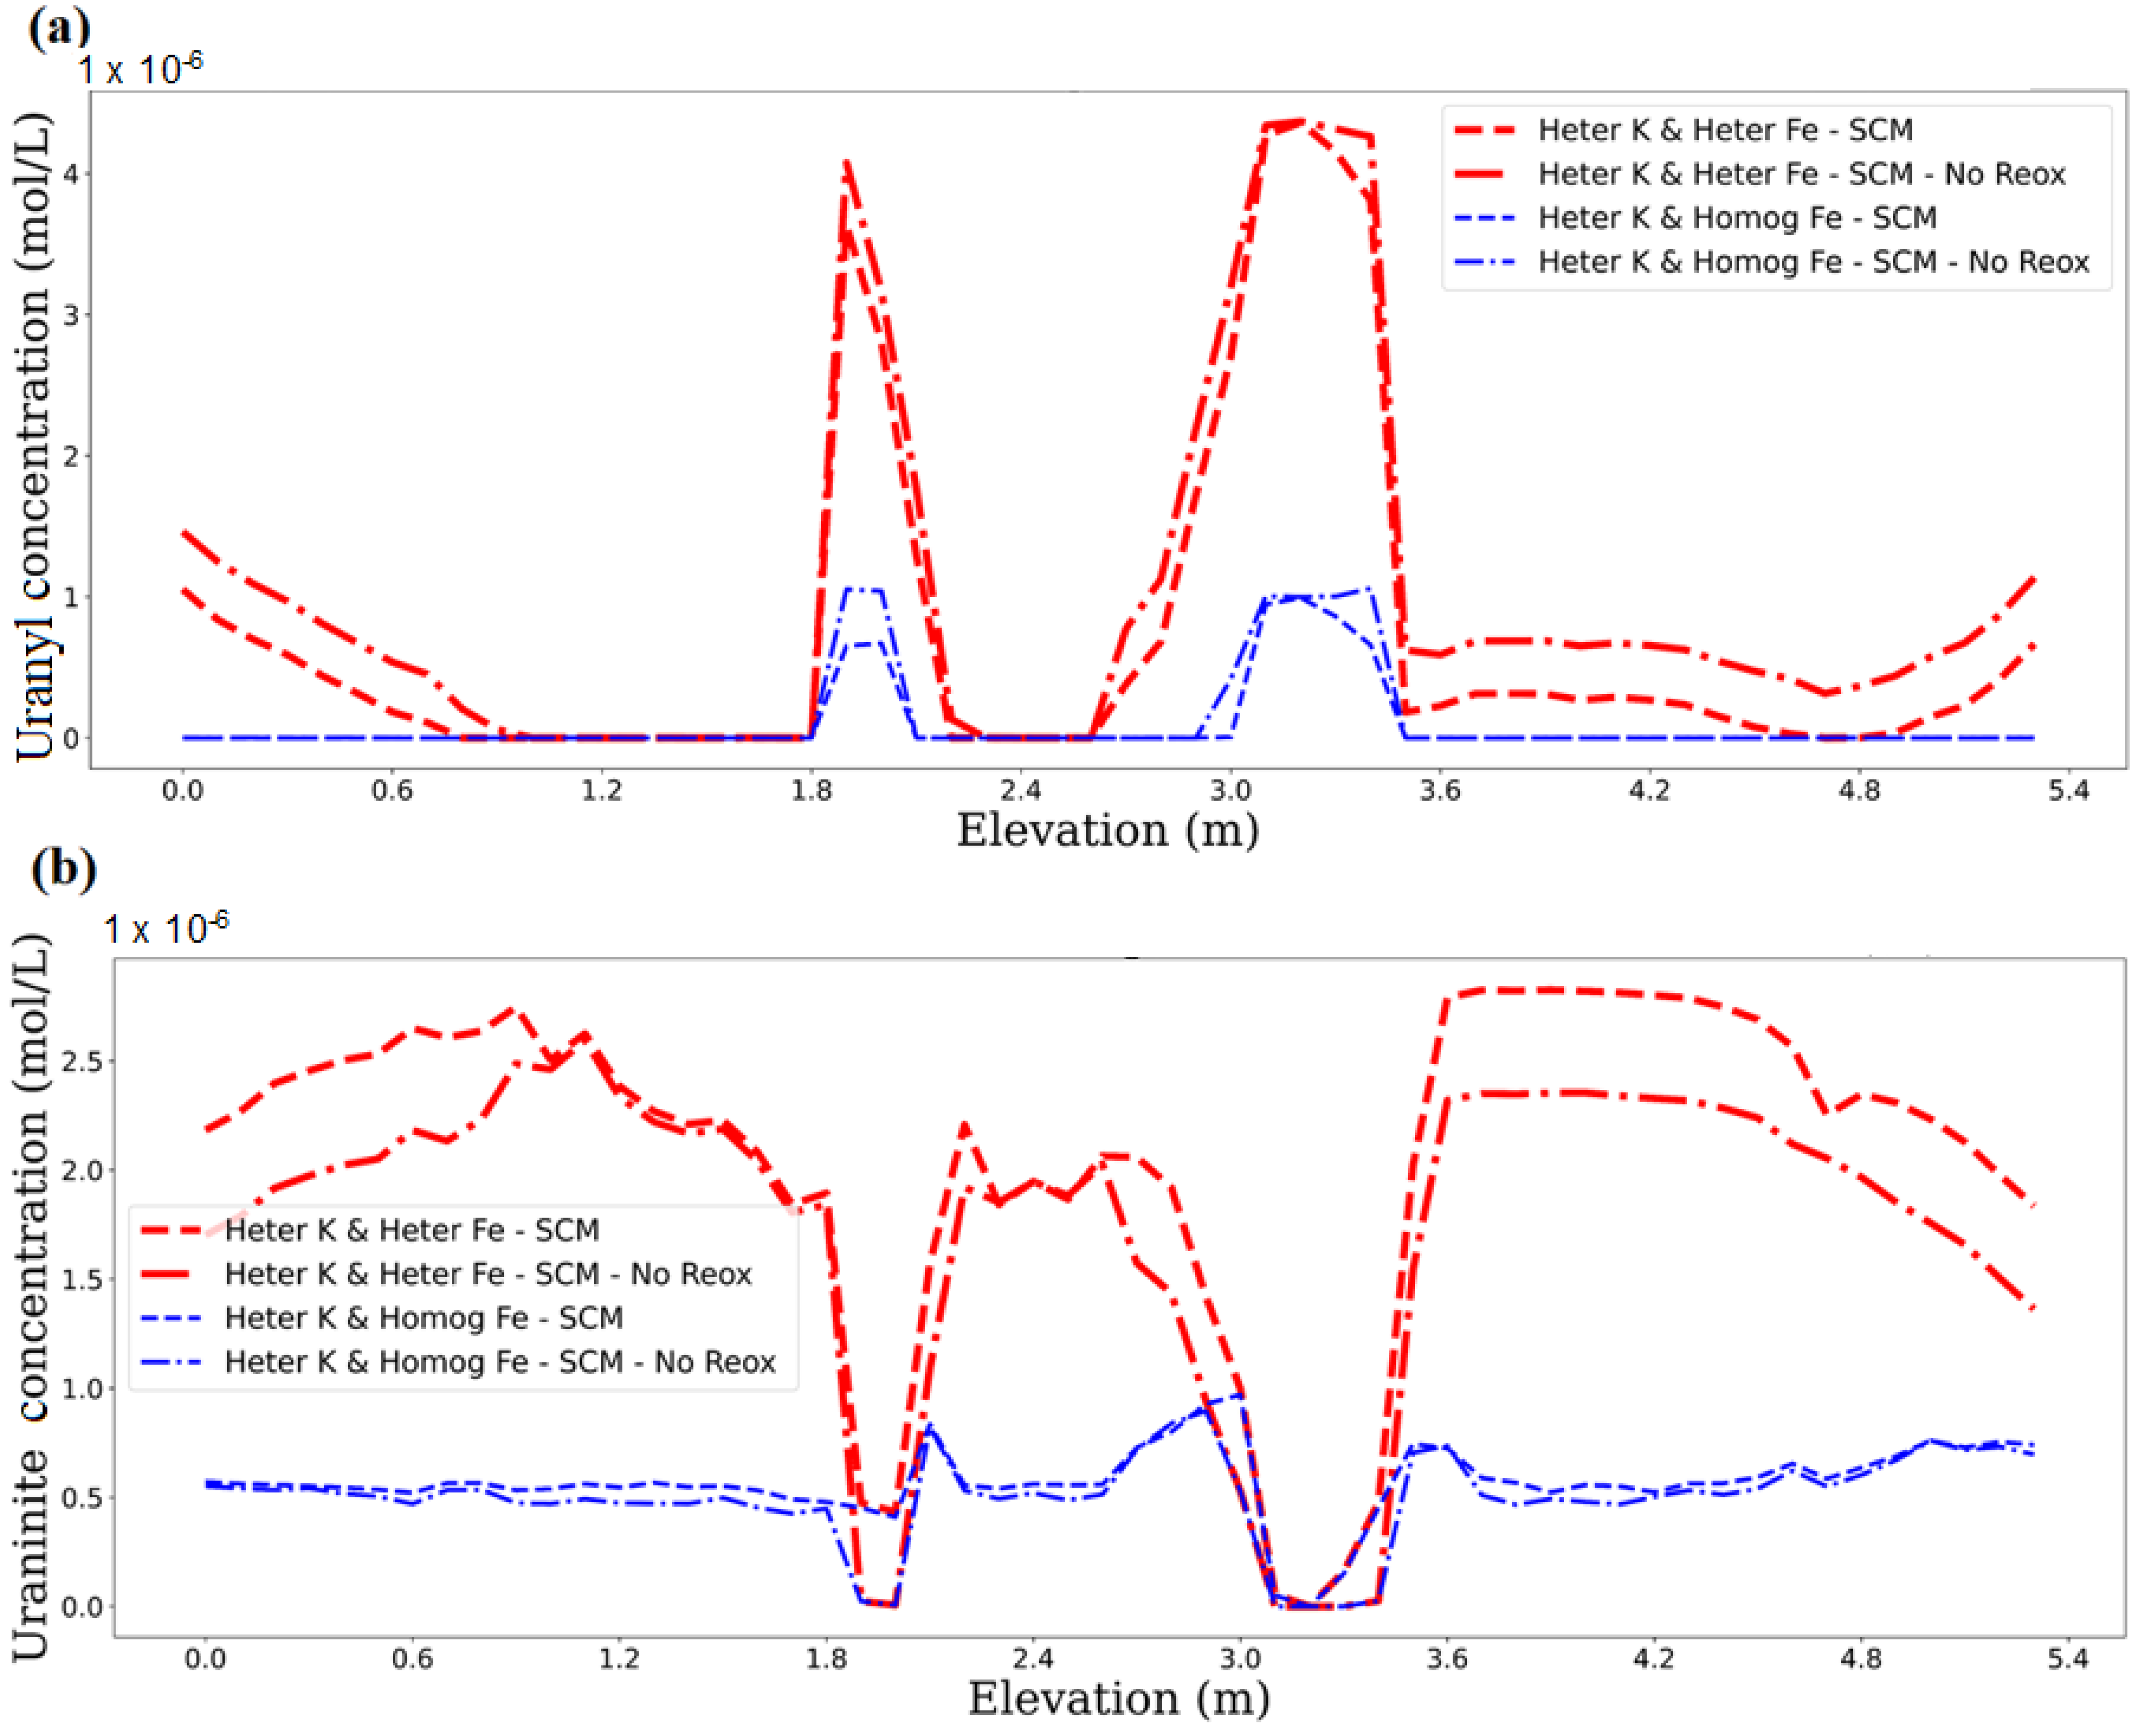
To demonstrate the difference between the physical and chemical heterogeneities in the presence of surface complexation, the concentration distributions of key species along the 9 m x-section are also presented (Figure 12 and Figure 13). As seen from the results, when surface complexation is included in the biogeochemical reaction dynamics, the soluble uranium U(VI) and bioreduced uranium (i.e., uraninite mineral) concentrations are observed to be significantly higher in the system when both physical and chemical heterogeneities are involved (compared to only the physical heterogeneity case, as well as the homogeneous K and Fe distribution cases). In the presence of chemical heterogeneity, the sorption of uranium ions in the system results in a higher retention of the species, resulting in higher soluble U(VI) concentrations, especially in the low K zones. Higher concentrations of U(VI), in general, results in higher potential of reacting with Fe (hydr)oxide mineral surfaces in a heterogeneous Fe(III) distribution with higher potential of reduction to the uraninite mineral, thus resulting in higher uraninite mineral concentrations in the system. When the adsorption process is not taken into account, soluble U(VI) species are not retained in the model domain, compared to the case when they are adsorbed onto the Fe(III) hydroxide surfaces. Therefore, these U(VI) species, being soluble within the porewater domain, are prone to spread out laterally and vertically within the aquifer medium via the impact of dispersion along with the mixing through the inflowing water within the domain. These effects would lead to the reduction in the concentration of the contaminant and thus lower concentration predictions, thereby implying the overestimation of biological reduction potential. Therefore, these results reveal that when the potential sorption of uranium contaminants is ignored in reactive transport models, in a relatively chemically heterogeneous environment, the contaminant concentrations might be underestimated. The underestimation is seen to be more pronounced for soluble species (in particular, soluble U(VI)), especially in the low K zones. The highest peaks of U(VI) and the corresponding low peaks of uraninite mineral concentrations are observed along the 1.8–2 m and 3–3.6 m zones within the 9 m x-section profiles (see Figure 12 and lowest K areas within the x-section in Figure 6a), where the amount of underestimation for U(VI) may reach around 85% in these zones.
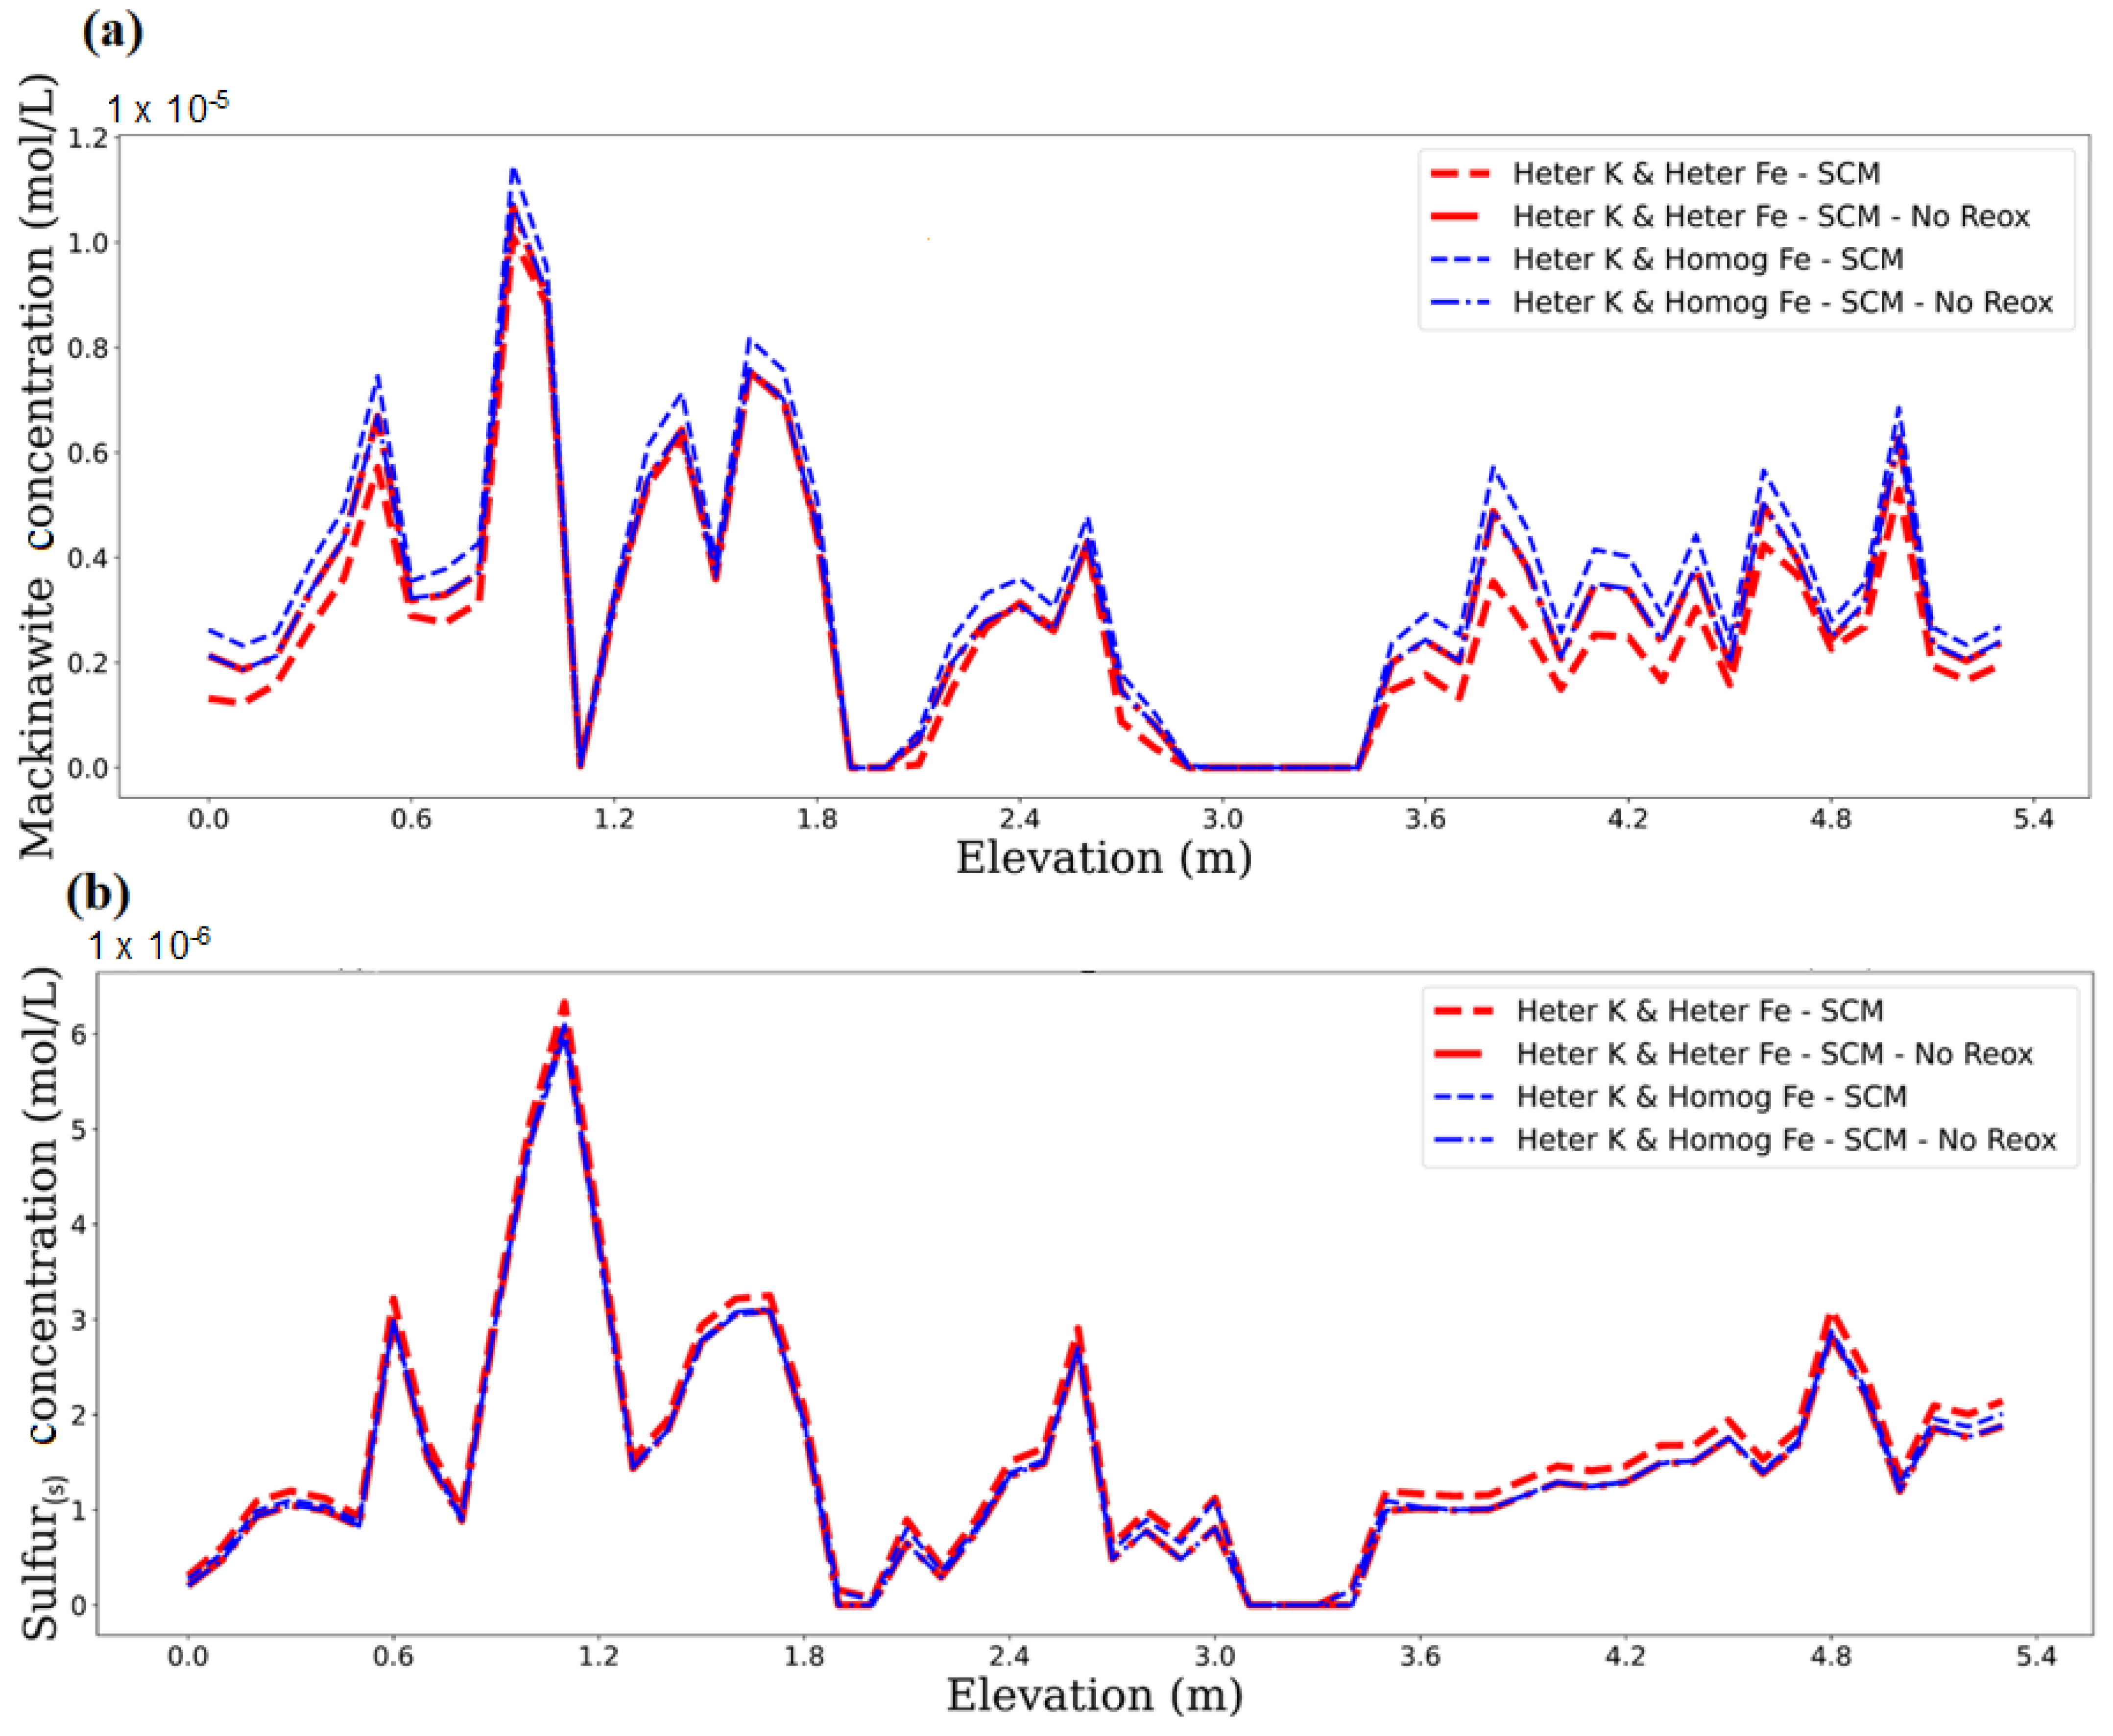
Regarding immobile phase formations, high K regions seem to have a significant influence. Mackinawite (FeS) and sulfur (Sulfur(s)) are among the immobile species. As these phases are immobile, they are not influenced by the mechanical effects of hydrodynamic dispersion as well as the dilution effects in high K zones. Once formed, they are not transported along the aquifer domain. Therefore, in high K regions where the mixing potential is enhanced, the results of the biogeochemical reaction influences become visibly apparent with these phase concentrations. In the absence of chemical heterogeneity, the constant presence of Fe(III) in the system results in the formation of preferential sulfide oxide via Fe(III) reduction (in conjunction with reaction stoichiometries for Reaction 5 in Table 2). This leads to the overprediction of the Fe(III) reduction reaction, where higher amounts of Fe(II) formation are predicted along with higher mackinawite formation in the high K zones (see blue lines in Figure 13a). The amount of overprediction in these zones may reach around 60% for mackinawite formation (Figure 13a). These reactions lead to lower HS predictions (based on reaction stoichiometries as seen in Table 2), subsequently causing lower sulfur precipitate formations in these zones, where up to about 20% of underprediction for sulfur precipitation may be observed (compare blue and red lines in Figure 13b). Therefore, the model results imply that chemical heterogeneity is more pronounced in low physical heterogeneity zones due to the mixing limitations for soluble compounds, whereas immobile phase formations resulting from precipitation/dissolution reaction interactions become significant in high physical heterogeneity regions. Ignoring the potential adsorption reactions in chemically heterogeneous environments (or ignoring chemical heterogeneity impacts in the presence of adsorption reactions) might lead to the overestimation of bioremediation/bioreduction processes in the subsurface environment.

3.3. Impact of Physical and Chemical Heterogeneity on the Biogeochemical Dynamics of the Reactive Transport Model Without the U(IV) Reoxidation Reaction

In this part, the impact of the U(IV) (i.e., in the form of uraninite mineral) reoxidation reaction back to soluble U(VI), in the presence of Fe (hydr)oxide minerals, is investigated to elucidate reoxidation and hence the solubilization potential of bioreduced uranium in the presence of physical and chemical heterogeneity in an example of field conditions. As mentioned previously, Sani et al. [37] indicated that the reduction in U(VI) to U(IV), being the promising approach in terms of bioremediation strategies, can be reversed in the absence of an electron donor, where the precipitated uraninite can be reoxidized using Fe(III) hydroxides as an electron acceptor.
In a reducing environment, the reoxidation potential of available species in the system (e.g., U(IV) or HS) with the Fe(III) hydroxide is critical in terms of predicting the mobilization and/or immobilization potential of pollutants in the porewater. To delineate the influence of reoxidation on biogeochemical processes, the same reaction system as described in Section 2.4 is simulated but without the U(IV) reoxidation reaction (i.e., Reaction 4, as shown in Table 2) for the homogeneous and heterogeneous cases separately. Figure 14 and Figure 15 present the comparative profiles of key species in different cases with and without U(IV) reoxidation after 30 days of simulation period along the 9 m x-section.
The simulation results show that the impact of the U(IV) reoxidation process is more pronounced in the presence of chemical heterogeneity. Chemical heterogeneity, which is represented by the Fe(III) hydroxide distribution in the domain, brings the effect of biogeochemical reaction dynamics more to the forefront. The influence of the competing reaction network becomes apparent in the high K regions due to efficient mixing in these zones. For soluble species, the effect of mixing and hydrodynamic dispersion results in the spreading of these species across the aquifer domain, whereas the immobile species are not influenced by these mechanical effects as mentioned previously. Mackinawite, sulfur, and uraninite are the immobile species simulated in the system. Consequently, the impact of competing reaction dynamics becomes amplified in the presence of chemical heterogeneity, especially in the high conductivity zones where the effect of these immobile phase concentration variations is highly pronounced. The comparative simulations conducted in this study with and without the U(IV) reoxidation reaction further demonstrate this impact, where preferential reaction dynamics leading to immobile phase concentration differences are depicted in the presence of chemical heterogeneity.
When U(IV) reoxidation is not implemented in the biogeochemical reaction dynamics, higher U(VI) concentrations are observed in the system for the heterogenous K and Fe case, where the amount of overprediction may reach around 70% (Figure 14a). When the U(IV) reoxidation reaction is turned off (i.e., Reaction 4 in Table 2), all Fe(III) oxides become available to oxidize HS abiotically (Reaction 5 in Table 2, instead of oxidizing U(IV)), resulting in higher Fe(II) ions in the porewater along with higher amounts of mackinawite formation (Figure 15a) and lower amounts of HS- concentrations. The relatively lower amounts of soluble HS ions in the solution would result in less S(s) precipitation (Reaction 6 in Table 2), as can be seen in Figure 15b. Lower amounts of HS ions would also result in reduced U(VI) bioreduction (Reaction 3 in Table 2), thereby resulting in higher amounts of U(VI) ions in the porewater solution (Figure 14a), corresponding to lower amounts of uraninite formation (Figure 14b). FeS and S are predicted to precipitate within the system (with a molar FeS/S ratio of two to one, as seen in Figure 15), whereas siderite is not predicted to form, in conjunction with the results presented by Spycher et al. [39] for modeling the laboratory experiments. As demonstrated in Section 3.2, when chemical heterogeneity is ignored, constant Fe(III) assumption leads to the preferential oxidation of sulfides by Fe(III) oxides compared to U(IV) reoxidation, leading to higher Fe(II) along with higher mackinawite formation in the high K zones; therefore, shutting off the U(IV) reoxidation reaction does not have much influence over the biogeochemical dynamics. The reoxidation of U(VI) depends on the competing rates of U(IV) versus sulfide oxidation by Fe(III) hydroxides, which further depends on kinetic and thermodynamic constraints. Although the impact of this delicate balance among competing reactions within the U–Fe–S system is shown by Spycher et al. [39] in simulating batch laboratory conditions, placing the biogeochemical reaction dynamics in the context of natural advective and dispersive transport with mixing limitations through the presence of a physically and chemically heterogeneous environment in this study demonstrates the substantial impact of the U(IV) reoxidation process under chemical heterogeneity in regions of relatively high K, where porewater constituents are captured with the highest potential to react via preferential flow in these zones. If the U(IV) reoxidation potential is ignored (or if the reoxidation potential is known to be insignificant), then chemical heterogeneity pertaining to the Fe(III) content may not be crucial in predicting the uranium bioremediation efficiency.
The overestimation of iron reduction and uranium bioremediation by ignoring heterogeneities in the system has also been supported by previous works [16,45,47], where the Fe(III) content especially at the vicinity of injection wells was reported to have significant implications. Supporting the previous observations of enhanced bioreduction rates at the vicinity of injection wells and the zones of high conductivity that preferentially connect to down-gradient regions rich in Fe(III), this study investigates the individual effects of chemical and physical heterogeneities to the extent of competing reactions within the U–Fe–S system, particularly focusing on the impacts of sorption reactions and the reoxidation potential of U(IV) in predicting in situ bioremediation efforts. Michael and Khan [49] reported on the sorption properties of contaminants, where upscaled models with homogeneous sorption coefficients also underpredicted arsenic (As) concentrations in deep groundwater basins in Bangladesh, pointing out the significance of correlating sorption characteristics. K. Atchley et al. [19] studied the importance of transport time and length scales to achieve equilibrium under coupled physical and geochemical heterogeneities, showing the same concertation predictions when geochemical equilibrium is achieved at late transport times, irrespective of the spatial heterogeneity, thereby supporting the impact of chemical heterogeneity under the influence of precipitation–dissolution reactions operating under competing kinetic constraints as is the case in the presented study. However, unlike our results, numerical modeling simulations of pyrite-driven denitrification of a nitrate-contaminated groundwater site in Hessian Ried in Germany using physical and chemical heterogeneity by Jang et al. [5] demonstrated that physical heterogeneity was more influential for short-term effects, and chemical heterogeneity had more impact for long-term behavior. The reason of different outcomes in these studies could be related to the redox reaction rates vs. transport times of contaminants through the model domain, especially the high K zones of preferential transport with enhanced mixing, where autotrophic denitrification was the dominant process in Jang et al. [5], compared to the delicate interplay between multiple biotic and abiotic reactions considered here, which took place at different (bio)transformation rates.
As highlighted in previous studies [5,16,45,47], although the importance of field characterization in estimating field-scale (bio)transformation rates and bioremediation efforts has been recognized, there is still a lack of information about field-scale reaction rates, including the involvement of Fe(III) (hydr)oxide interactions. Data on the field-scale characterization of mineralogical and physical properties of subsurface materials are still limited, where various studies have used geophysical characterization methods and correlation analysis between physicochemical properties, as well as geostatistical approaches, to generate stochastic realizations of aquifer heterogeneity distributions using related modeling tools [5,16,22,45,47]. However, due to the complex nature of subsurface settings, these correlations involve a high level of uncertainty in determining chemical attributes (e.g., Fe(III) content) based on the hydraulic properties of the site. Chen et al. [50] proposed a deep-learning-based mineral identification approach to characterize sorption properties of granitic rocks. They used geostatistical and geochemical analyses of the reactive mineral facies distributions to overcome the restrictions of traditional methods, which are subjective and have lower accuracy. As part of future investigations, similar methodology can be adopted to scale the radionuclide sorption coefficients related to the reactive mineral facies to more accurately describe the mechanism of action of Fe(III)hydroxides. Stochastic approaches may also need to be integrated using machine learning algorithms or artificial intelligence-based approaches which would offer a holistic approach that combines physics-based understanding of the system with data-driven insights. The implementation of these approaches in future field-scale modeling works would alleviate the challenging workload of subsurface characterization and might lead to more accurate predictions with better management strategies.

4. Summary and Conclusions

In this study, a 2D numerical reactive transport model has been developed for predicting the transport behavior of contaminants in the presence of physical and chemical heterogeneity by considering the complex interplay of biogeochemical processes. This study’s distinct contribution is the investigation of field-scale physical and chemical heterogeneity in modeling reactive transport processes in porous media. Within this scope, uranium has been selected as an example, where its bioreduction and reoxidation processes have been considered. In order to delineate the impact of physical and chemical heterogeneity on the overall biogeochemical processes, numerical model simulations have been set up with three cases of heterogeneity as follows:
  • Reactive transport simulations are carried out with no physical or chemical heterogeneity (i.e., the homogeneous K and homogeneous Fe case);
  • Reactive transport simulations are carried out with physical but no chemical heterogeneity (i.e., the heterogeneous K and homogeneous Fe case);
  • Reactive transport simulations are carried out with both physical and chemical heterogeneities (i.e., the heterogeneous K and heterogeneous Fe case).
The main findings of this study are summarized below.
Model simulation results have shown that assuming spatial homogeneity might lead to an overestimation of bioreduction or the bioremediation of the contaminant of concern, especially in low K regions due to mixing limitations, where entirely mixing-limited zones might be encountered. In the absence of adsorption reaction incorporations, or for contaminants which exhibit limited sorption onto the aquifer matrix, the comparison of model results reveal that physical heterogeneity has a greater impact than chemical heterogeneity. In this case, ignoring chemical heterogeneity may not be significant in predicting contaminant behavior in the model domain.
On the other hand, the incorporation of contaminant adsorption via surface complexation processes in predictive models highlights the significance of chemical heterogeneity in the subsurface environment. Model results reveal that when the potential adsorption of contaminants is ignored in reactive transport models in a relatively chemically heterogeneous environment, or if chemical heterogeneity impacts in the presence of adsorption reactions are ignored, the contaminant concentrations might be underestimated. Underestimation is seen to be more pronounced especially in the low K zones due to the mixing limitations for soluble compounds, where the amount of underestimation may reach around 85% in these zones. For immobile phase formations resulting from precipitation/dissolution reaction interactions, high K regions become significant.
The biogeochemical reactions include a delicate balance among competing reactions within the U–Fe–S system, demonstrating the complex interplay between various biotic and abiotic reactions under the presence of a physically and chemically heterogeneous environment. The simulation results show that the impact of U(IV) reoxidation process is more pronounced in the presence of chemical heterogeneity, especially in regions of relatively high K with the highest mixing potential. If the U(IV) reoxidation potential is ignored or if the reoxidation potential is known be insignificant, then chemical heterogeneity with regard to the Fe(III) content of the aquifer matrix may not be crucial in predicting uranium bioremediation efficiency.
The findings of this study can shed light to determine which conditions would require the accurate characterizations of physical vs. chemical heterogeneity in a natural subsurface environment of contaminant transport with mixing limitations subject to competing biogeochemical reactions. Future work may shift towards integrating machine learning algorithms or artificial intelligence-based approaches for the involvement of subsurface characterization in field-scale contaminant predictions.

Supplementary Materials

The following supporting information can be downloaded at the following website: https://www.mdpi.com/article/10.3390/w17040514/s1, Table S1. The summary of statistics that are used in the determination of heterogeneity data (from Scheibe et al. [22]). Table S2. Aqueous speciation reactions used in the biogeochemical model (from Spycher et al. [39]) and Sengor et al. [33]). Table S3. Surface complexation reactions used in this study (from Scheibe et al. [22]). Figure S1. The initial uranium concentration distribution after reaching quasi-equilibrium at 25 years for the heterogeneous K heterogeneous Fe(III) distribution case.

Author Contributions

Conceptualization, S.S.Ş.; methodology, S.S.Ş.; software, S.G.; investigation, S.S.Ş.; data curation, S.G.; writing—original draft preparation, S.G.; writing—review and editing, S.S.Ş.; visualization, S.G.; supervision, S.S.Ş.; project administration, S.S.Ş. All authors have read and agreed to the published version of the manuscript.

Funding

This research received no external funding.

Data Availability Statement

Data is contained within the article or Supplementary Materials.

Conflicts of Interest

The authors declare no conflict of interest.

References

  1. Cozzarelli, I.M.; Herman, J.S.; Baedecker, M.J.; Fischer, J.M. Geochemical heterogeneity of a gasoline-contaminated aquifer. J. Contam. Hydrol. 1999, 40, 261–284. [Google Scholar] [CrossRef]
  2. Cunningham, J.A.; Fadel, Z.J. Contaminant degradation in physically and chemically heterogeneous aquifers. J. Contam. Hydrol. 2007, 94, 293–304. [Google Scholar] [CrossRef] [PubMed]
  3. Fakhreddine, S.; Lee, J.; Kitanidis, P.K.; Fendorf, S.; Rolle, M. Imaging geochemical heterogeneities using inverse reactive transport modeling: An example relevant for characterizing arsenic mobilization and distribution. Adv. Water Resour. 2016, 88, 186–197. [Google Scholar] [CrossRef]
  4. Maliva, R.G. Aquifer Characterization and Properties. In Aquifer Characterization Techniques; Springer Hydrogeology; Springer: Cham, Switzerland, 2016. [Google Scholar] [CrossRef]
  5. Jang, E.; He, W.; Savoy, H.; Dietrich, P.; Kolditz, O.; Rubin, Y.; Schüth, C.; Kalbacher, T. Identifying the influential aquifer heterogeneity factor on nitrate reduction processes by numerical simulation. Adv. Water Resour. 2017, 99, 38–52. [Google Scholar] [CrossRef]
  6. Berg, S.J.; Illman, W.A. Capturing aquifer heterogeneity: Comparison of approaches through controlled sandbox experiments. Water Resour. Res. 2011, 47, 1–17. [Google Scholar] [CrossRef]
  7. Chrysikopoulos, C.V.; Kitanidis, P.K.; Roberts, P.V. Analysis of one-dimensional solute transport through porous media with spatially variable retardation factor. Water Resour. Res. 1990, 26, 437–446. [Google Scholar] [CrossRef]
  8. Uçankuş, T.; Ünlü, K. The effect of aquifer heterogeneity on natural attenuation rate of BTEX. Environ. Geol. 2008, 54, 759–776. [Google Scholar] [CrossRef]
  9. Sarris, T.S.; Close, M.E.; Moore, C. Uncertainty assessment of nitrate reduction in heterogeneous aquifers under uncertain redox conditions. Stoch. Environ. Res. Risk Assess. 2019, 33, 1609–1627. [Google Scholar] [CrossRef]
  10. Wang, Z.W.; Chen, H.W.; Li, F.L. Identifying spatial heterogeneity of groundwater and its response to anthropogenic activities. Environ. Sci. Pollut. Res. 2019, 26, 29435–29448. [Google Scholar] [CrossRef]
  11. Aksoy, A.; Culver, T.B. Impacts of physical and chemical heterogeneities on aquifer remediation design. J. Water Resour. Plan. Manag. 2004, 130, 311–320. [Google Scholar] [CrossRef]
  12. Haberer, C.M.; Rolle, M.; Cirpka, O.A.; Grathwohl, P. Impact of Heterogeneity on Oxygen Transfer in a Fluctuating Capillary Fringe. Groundwater 2015, 53, 57–70. [Google Scholar] [CrossRef] [PubMed]
  13. Harvey, R.W.; Kinner, N.E.; MacDonald, D.; Metge, D.W.; Bunn, A. Role of physical heterogeneity in the interpretation of small-scale laboratory and field observations of bacteria, microbial-sized microsphere, and bromide transport through aquifer sediments. Water Resour. Res. 1993, 29, 2713–2721. [Google Scholar] [CrossRef]
  14. Edwards, E.C. What lies beneath? Aquifer heterogeneity and the economics of groundwater management. J. Assoc. Environ. Resour. Econ. 2016, 3, 453–491. [Google Scholar] [CrossRef]
  15. Englert, A.; Hubbard, S.S.; Williams, K.H.; Li, L.; Steefel, C.I. Feedbacks between hydrological heterogeneity and bioremediation induced biogeochemical transformations. Environ. Sci. Technol. 2009, 43, 5197–5204. [Google Scholar] [CrossRef] [PubMed]
  16. Li, L.; Steefel, C.I.; Kowalsky, M.B.; Englert, A.; Hubbard, S.S. Effects of physical and geochemical heterogeneities on mineral transformation and biomass accumulation during biostimulation experiments at Rifle, Colorado. J. Contam. Hydrol. 2010, 112, 45–63. [Google Scholar] [CrossRef]
  17. Mohamed, M.; Hatfield, K.; Hassan, A.; Klammler, H. Stochastic evaluation of subsurface contaminant discharges under physical, chemical, and biological heterogeneities. Adv. Water Resour. 2010, 33, 801–812. [Google Scholar] [CrossRef]
  18. Tompson, A.F.B.; Schafer, A.L.; Smith, R.W. Impacts of physical and chemical heterogeneity on cocontaminant transport in a sandy porous medium. Water Resour. Res. 1996, 32, 801–818. [Google Scholar] [CrossRef]
  19. Atchley, A.L.; Navarre-Sitchler, A.K.; Maxwell, R.M. The effects of physical and geochemical heterogeneities on hydro-geochemical transport and effective reaction rates. J. Contam. Hydrol. 2014, 165, 53–64. [Google Scholar] [CrossRef]
  20. Zhang, X.; Ma, F.; Yin, S.; Wallace, C.D.; Soltanian, M.R.; Dai, Z.; Ritzi, R.W.; Ma, Z.; Zhan, C.; Lü, X. Application of upscaling methods for fluid flow and mass transport in multi-scale heterogeneous media: A critical review. Appl. Energy 2021, 303, 117603. [Google Scholar] [CrossRef]
  21. Zhan, C.; Dai, Z.; Soltanian, M.R.; Zhang, X. Stage-wise stochastic deep learning inversion framework for subsurface sedimentary structure identification. Geophys. Res. Lett. 2022, 49, e2021GL095823. [Google Scholar] [CrossRef]
  22. Scheibe, T.D.; Fang, Y.; Murray, C.J.; Roden, E.E.; Chen, J.; Chien, Y.J.; Brooks, S.C.; Hubbard, S.S. Transport and biogeochemical reaction of metals in a physically and chemically heterogeneous aquifer. Geosphere 2006, 2, 220–235. [Google Scholar] [CrossRef]
  23. Roh, Y.; Lee, S.Y.; Elless, M.P.; Cho, K.S. Electro-enhanced remediation of radionuclide-contaminated groundwater using zero-valent iron. J. Environ. Sci. Health Part A Toxic/Hazard. Subst. Environ. Eng. 2000, 35, 1043–1059. [Google Scholar] [CrossRef]
  24. Baba, A.; Tayfur, G. Groundwater contamination and its effect on health in Turkey. Environ. Monit. Assess. 2011, 183, 77–94. [Google Scholar] [CrossRef]
  25. Waseem, A.; Ullah, H.; Rauf, M.K.; Ahmad, I. Distribution of natural uranium in surface and groundwater resources: A review. Crit. Rev. Environ. Sci. Technol. 2015, 45, 2391–2423. [Google Scholar] [CrossRef]
  26. You, W.; Peng, W.; Tian, Z.; Zheng, M. Uranium bioremediation with U(VI)-reducing bacteria. Sci. Total Environ. 2021, 798, 149107. [Google Scholar] [CrossRef] [PubMed]
  27. Anderson, R.T.; Vrionis, H.A.; Ortiz-Bernad, I.; Resch, C.T.; Long, P.E.; Dayvault, R.; Karp, K.; Marutzky, S.; Metzler, D.R.; Peacock, A.; et al. Stimulating the In Situ Activity of Geobacter Species to Remove Uranium from the Groundwater of a Uranium-Contaminated Aquifer. Appl. Environ. Microbiol. 2003, 69, 5884–5891. [Google Scholar] [CrossRef]
  28. Gihring, T.M.; Zhang, G.; Brandt, C.C.; Brooks, S.C.; Campbell, J.H.; Carroll, S.; Criddle, C.S.; Green, S.J.; Jardine, P.; Kostka, J.E.; et al. A limited microbial consortium is responsible for extended bioreduction of uranium in a contaminated aquifer. Appl. Environ. Microbiol. 2011, 77, 5955–5965. [Google Scholar] [CrossRef]
  29. Wufuer, R.; Wei, Y.; Lin, Q.; Wang, H.; Song, W.; Liu, W.; Zhang, D.; Pan, X.; Gadd, G.M. Chapter Four—Uranium Bioreduction and Biomineralization. Adv. Appl. Microbiol. 2017, 101, 137–168. [Google Scholar] [CrossRef]
  30. Yabusaki, S.B.; Şengör, S.S.; Fang, Y. A uranium bioremediation reactive transport benchmark. Comput. Geosci. 2015, 19, 551–567. [Google Scholar] [CrossRef]
  31. Gu, B.; Wu, W.M.; Ginder-Vogel, M.A.; Yan, H.; Fields, M.W.; Zhou, J.; Fendorf, S.; Criddle, C.S.; Jardine, P.M. Bioreduction of uranium in a contaminated soil column. Environ. Sci. Technol. 2005, 39, 4841–4847. [Google Scholar] [CrossRef]
  32. Renshaw, J.C.; Butchins, L.J.C.; Livens, F.R.; May, I.; Charnock, J.M.; Lloyd, J.R. Bioreduction of uranium: Environmental implications of a pentavalent intermediate. Environ. Sci. Technol. 2005, 39, 5657–5660. [Google Scholar] [CrossRef] [PubMed]
  33. Şengör, S.S.; Mayer, K.U.; Greskowiak, J.; Wanner, C.; Su, D.; Prommer, H. A reactive transport benchmark on modeling biogenic uraninite re-oxidation by Fe(III)-(hydr)oxides. Comput. Geosci. 2015, 19, 569–583. [Google Scholar] [CrossRef]
  34. Hyun, S.P.; Davis, J.A.; Hayes, K.F. Abiotic U(VI) reduction by aqueous sulfide. Appl. Geochem. 2014, 50, 7–15. [Google Scholar] [CrossRef]
  35. Senko, J.M.; Istok, J.D.; Suflita, J.M.; Krumholz, L.R. In-situ evidence for uranium immobilization and remobilization. Environ. Sci. Technol. 2002, 36, 1491–1496. [Google Scholar] [CrossRef]
  36. Vrionis, H.A.; Anderson, R.T.; Ortiz-Bernad, I.; O’Neill, K.R.; Resch, C.T.; Peacock, A.D.; Dayvault, R.; White, D.C.; Long, P.E.; Lovley, D.R. Microbiological and geochemical heterogeneity in an in situ uranium bioremediation field site. Appl. Environ. Microbiol. 2005, 71, 6308–6318. [Google Scholar] [CrossRef]
  37. Sani, R.K.; Peyton, B.M.; Amonette, J.E.; Geesey, G.G. Reduction of uranium(VI) under sulfate-reducing conditions in the presence of Fe(III)-(hydr)oxides. Geochim. Cosmochim. Acta 2004, 68, 2639–2648. [Google Scholar] [CrossRef]
  38. Komlos, J.; Moon, H.S.; Jaffé, P.R. Effect of Sulfate on the Simultaneous Bioreduction of Iron and Uranium. J. Environ. Qual. 2008, 37, 2058–2062. [Google Scholar] [CrossRef]
  39. Spycher, N.F.; Issarangkun, M.; Stewart, B.D.; Sevinç Şengör, S.; Belding, E.; Ginn, T.R.; Peyton, B.M.; Sani, R.K. Biogenic uraninite precipitation and its reoxidation by iron(III) (hydr)oxides: A reaction modeling approach. Geochim. Cosmochim. Acta 2011, 75, 4426–4440. [Google Scholar] [CrossRef]
  40. Prommer, H.; Barry, D.A.; Zheng, C. MODFLOW/MT3DMS-Based Reactive Multicomponent Transport Modeling. Groundwater 2003, 41, 247–257. [Google Scholar] [CrossRef]
  41. Zheng, C.; Wang, P.P. MT3DMS: A Modular Three-Dimensional Multispecies Transport Model for Simulation of Advection, Dispersion and Chemical Reactions of Contaminants in Groundwater Systems; Documentation and User’s Guide, Contract Report SERDP-99-1; U.S. Army Engineer Research and Development Center: Vicksburg, MS, USA, 1999. [Google Scholar]
  42. Parkhurst, D.L.; Appelo, C.A.J. User’s Guide to PHREEQC (Version 2)—A Computer Program for Speciation, Batch-Reaction, one Dimensional Transport, and Inverse Geochemical Calculations; USGS Report; United States Geological Survey: Denver, CO, USA, 1999. [Google Scholar]
  43. Harbaugh, A.W.; Langevin, C.D.; Hughes, J.D.; Niswonger, R.N.; Konikow, L.F. MODFLOW-2005 Version 1.12.00, the U.S. Geological Survey Modular Groundwater Model; U.S. Geological Survey Software Release; United States Geological Survey: Reston, VA, USA, 2017. [Google Scholar] [CrossRef]
  44. USEPA. Radionuclides Rule: A Quick Reference Guide; Office of Water (4606). In EPA 816 F-01-003; USEPA: Washington, DC, USA, 2001. [Google Scholar]
  45. Bao, C.; Wu, H.; Li, L.; Newcomer, D.; Long, P.E.; Williams, K.H. Uranium bioreduction rates across scales: Biogeochemical hot moments and hot spots during a biostimulation experiment at Rifle, Colorado. Environ. Sci. Technol. 2014, 48, 10116–10127. [Google Scholar] [CrossRef]
  46. Dzombak, D.A.; Morel, F.M.M. Surface Complexation Modeling Hydrous Ferric Oxide; John Wiley & Sons: New York, NY, USA, 1990. [Google Scholar]
  47. Li, L.; Gawande, N.; Kowalsky, M.B.; Steefel, C.I.; Hubbard, S.S. Physicochemical heterogeneity controls on uranium bioreduction rates at the field scale. Environ. Sci. Technol. 2011, 45, 9959–9966. [Google Scholar] [CrossRef] [PubMed]
  48. Amde, M.; Liu, J.; Tan, Z.-Q.; Bekana, D. Transformation and bioavailability of metal oxide nanoparticles in aquatic and terrestrial environments: A review. Environ. Pollut. 2017, 230, 250–267. [Google Scholar] [CrossRef]
  49. Michael, H.A.; Khan, M.R. Impacts of physical and chemical aquifer heterogeneity on basin-scale solute transport: Vulnerability of deep groundwater to arsenic contamination in Bangladesh. Adv. Water Resour. 2016, 98, 147–158. [Google Scholar] [CrossRef]
  50. Chen, W.; Dai, Z.; Samper, J.; Ling, H.; Zhan, C.; Ma, F.; Yang, Z.; Zhang, X.; Soltanian, M.R. Impact of reactive mineral facies distributions on radionuclide sorption properties in multiscale heterogeneous granite rocks. Hydrogeol. J. 2023, 31, 1581–1597. [Google Scholar] [CrossRef]
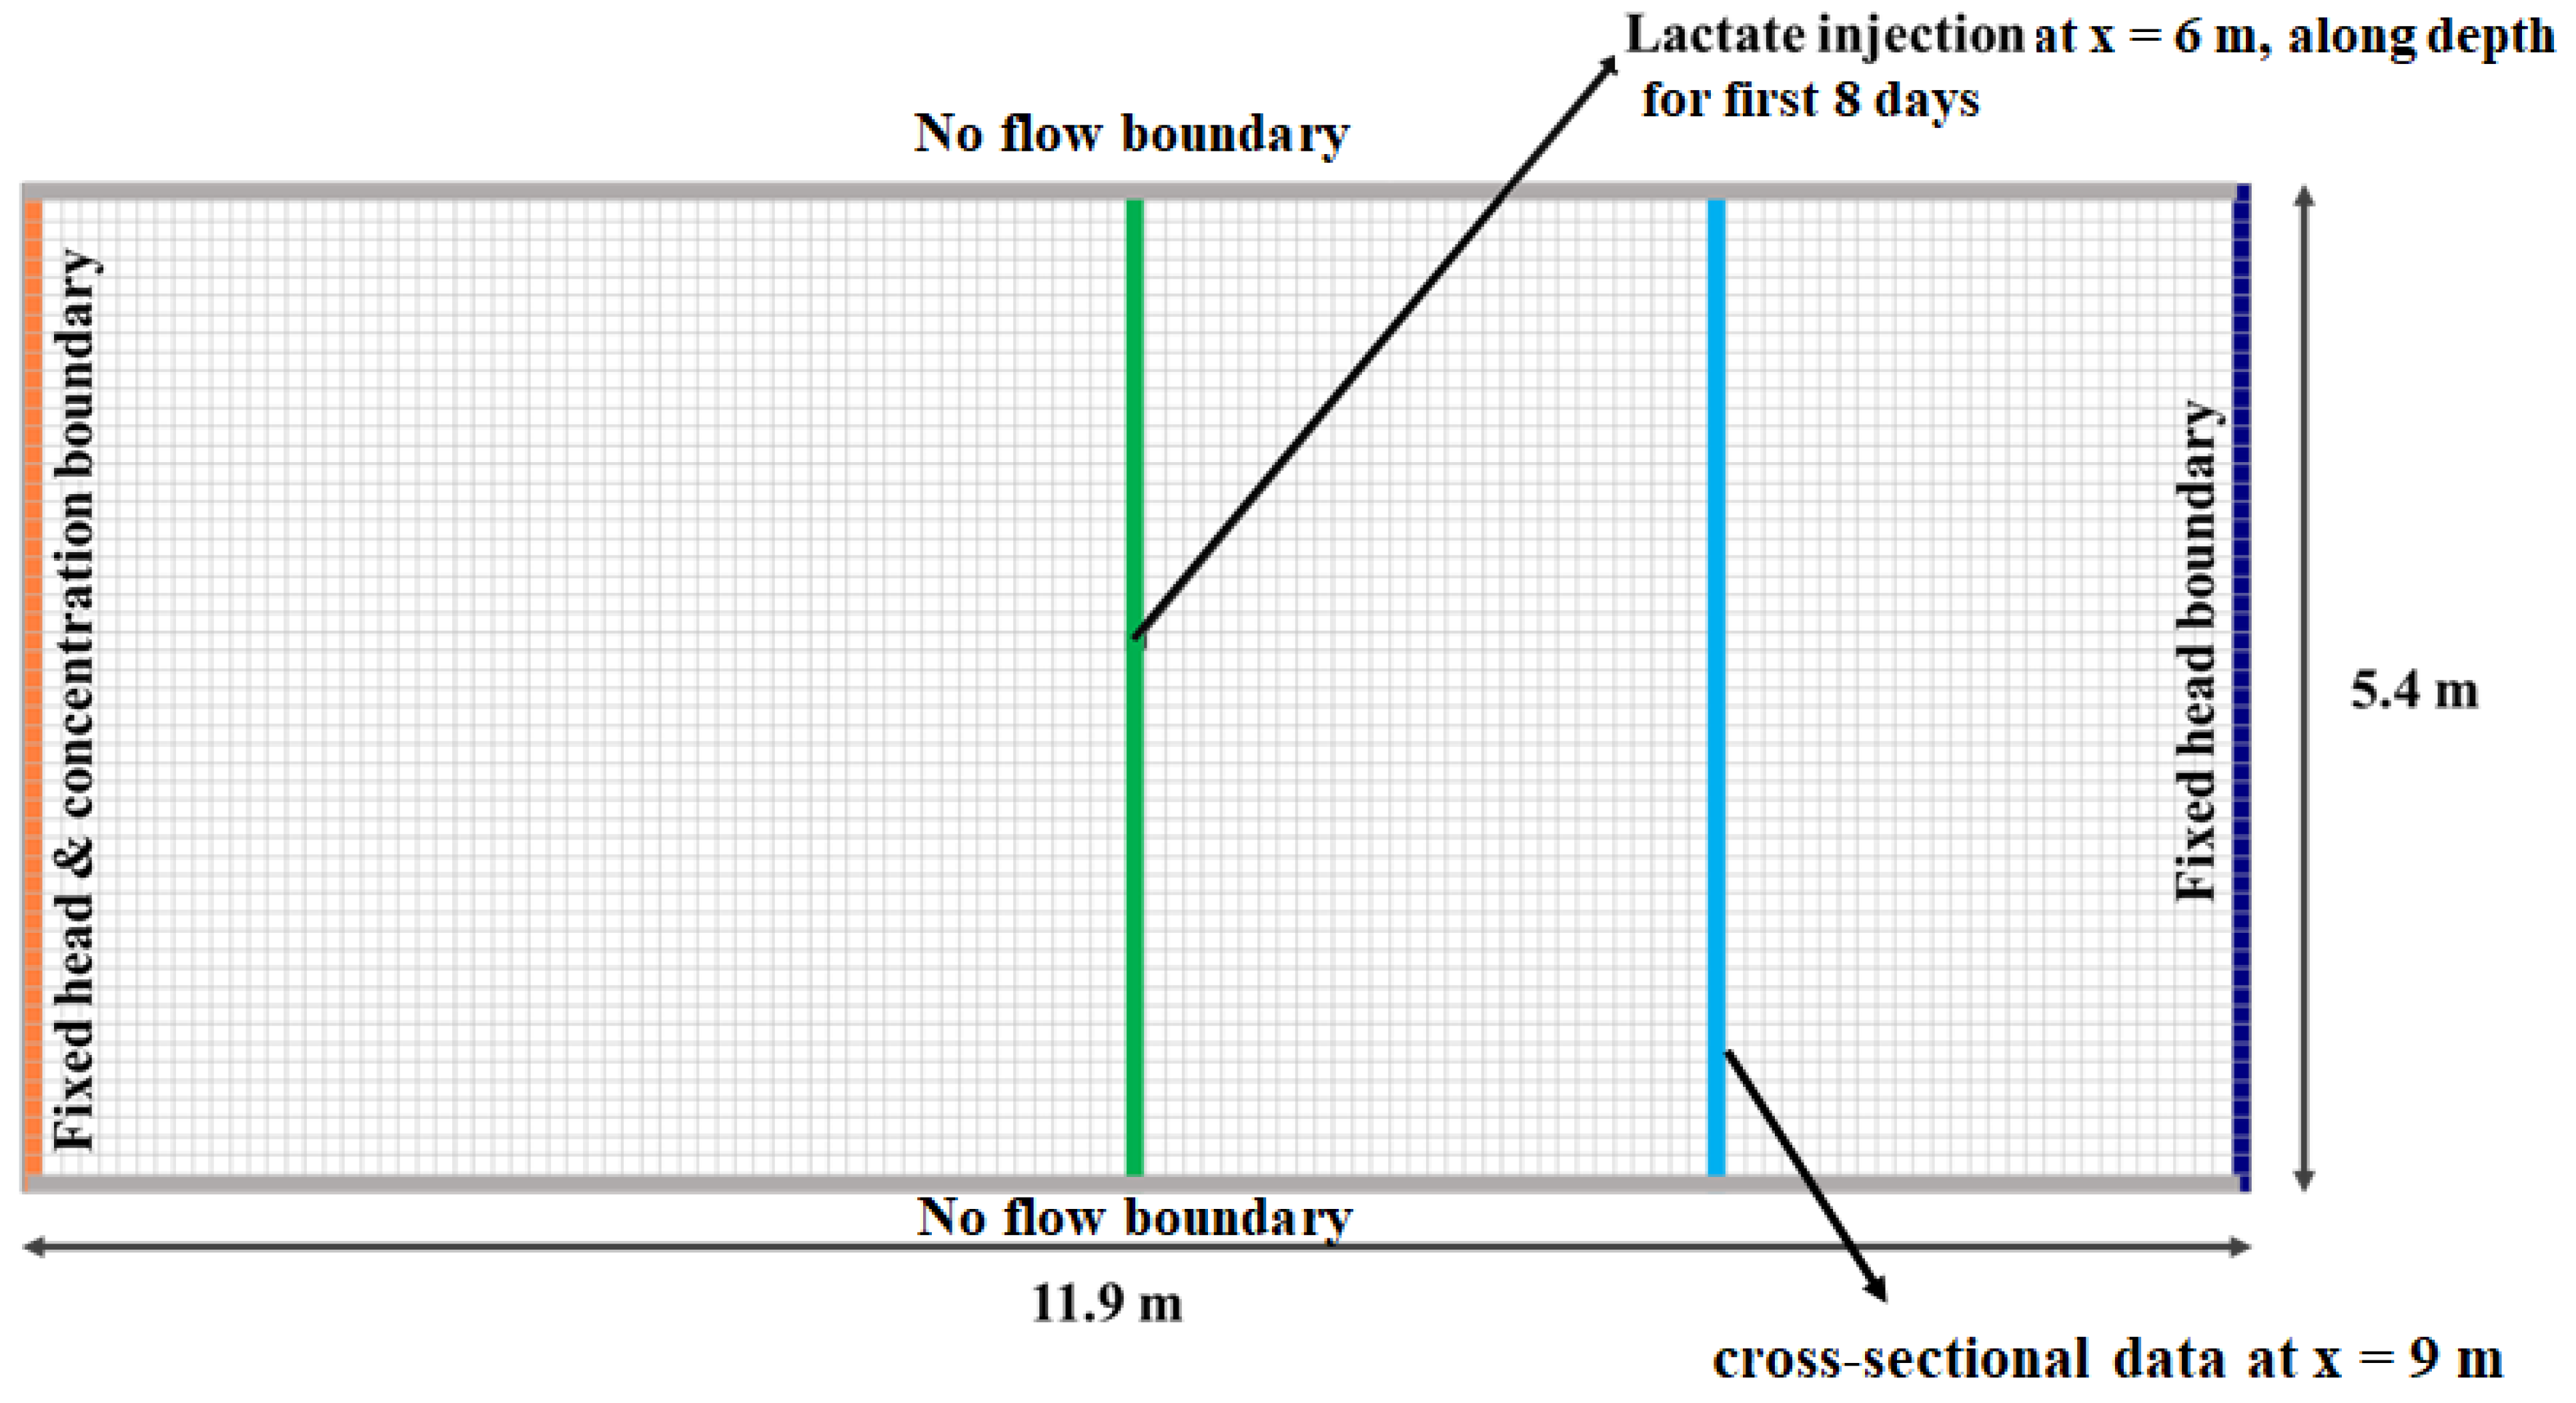
Figure 1. Model domain and boundary conditions used in the numerical model.
Water 17 00514 g001
Figure 2. (a) Heterogeneously distributed K (m/d); (b) distribution of Fe(III) hydroxide concentration (mole mineral/L) used in this study (from Scheibe et al. [22]).
Water 17 00514 g002
Figure 3. Illustration of the conceptual model of this study.
Water 17 00514 g003
Figure 4. Concentration distribution of key species in the heterogeneous K and heterogeneous Fe(III) hydroxide concentration distribution case for 8 days.
Water 17 00514 g004
Figure 5. Concentration distribution of key species in the heterogeneous K and heterogeneous Fe(III) hydroxide concentration distribution case for 40 days.
Water 17 00514 g005
Figure 6. Homogeneously and heterogeneously distributed (a) K (m/d); (b) Fe(III) hydroxide concentration (mole mineral/L) from the section at x = 9.
Water 17 00514 g006
Figure 7. (a) Uranyl and (b) uraninite concentration distributions along the 9 m x-section after 30 days.
Water 17 00514 g007
Figure 8. Concentration distribution of key species: (a) lactate, (b) acetate, (c) sulfate, and (d) Fe(III)) along the 9 m x-section after 30 days.
Water 17 00514 g008
Figure 9. Concentration distribution of key species: (a) pH, (b) mackinawite, (c) sulfate, and (d) sulfur(s) along the 9 m x-section after 30 days.
Water 17 00514 g009
Figure 10. Concentration distribution of key species in the heterogeneous K and heterogeneous Fe(III) hydroxide concentration distribution with surface complexation case after 40 days.
Water 17 00514 g010
Figure 11. Concentration distribution of key species in the heterogeneous K and homogeneous Fe(III) hydroxide concentration distribution with surface complexation case after 40 days.
Water 17 00514 g011
Figure 12. (a) Uranyl and (b) uraninite concentration distributions along the 9 m x-section with the surface complexation case after 30 days. Red lines indicate the heterogeneous K and heterogeneous Fe case; blue lines indicate the heterogeneous K and homogeneous Fe case; green lines indicate the homogeneous K and homogeneous Fe case.
Water 17 00514 g012
Figure 13. (a) Mackinawite (FeS) and (b) sulfur(s) concentration distributions along the 9 m x-section with the surface complexation case after 30 days. Red lines indicate the heterogeneous K and heterogeneous Fe case; blue lines indicate the heterogeneous K and homogeneous Fe case; green lines indicate the homogeneous K and homogeneous Fe case.
Water 17 00514 g013
Figure 14. (a) Uranyl and (b) uraninite concentration distributions along the 9 m x-section with and without the U(IV) reoxidation process after 30 days. Dashes lines represent biogeochemical reactions with the U(IV) reoxidation process, whereas the dash-dot-dash line type represents the simulation results without the U(IV) reoxidation process. Red lines indicate the heterogeneous K and heterogeneous Fe cases; blue lines indicate the heterogeneous K and homogeneous Fe cases.
Water 17 00514 g014
Figure 15. (a) Mackinawite (FeS) and (b) sulfur(s) concentration distributions along the 9 m x-section with and without the U(IV) reoxidation process after 30 days. Dashes lines represent biogeochemical reactions with the U(IV) reoxidation process, whereas the dash-dot-dash line type represents the simulation results without the U(IV) reoxidation process. Red lines indicate the heterogeneous K and heterogeneous Fe cases; blue lines indicate the heterogeneous K and homogeneous Fe cases.
Water 17 00514 g015
Table 1. Initial water composition and inflowing water composition at the injection well used for the model study. The pH value in both water compositions is 7.2 (from Sengor et al. [33]).
Chemical SpeciesInitial Water CompositionInflowing Water Composition
Concentration (mol/L)Concentration (mol/L)
Lactate3 × 10−7 (a)0.03 (b)
Acetate1 × 10−23 1 × 10⁻²³
Sulfate (SO42−)0.020.02
Sulfide (S2−) 1 × 10⁻⁸ 1 × 10⁻²³
Fe(II)1 × 10⁻²³ 1 × 10⁻²³
Fe (III)1 × 10⁻¹¹ 1.3 × 10⁻¹²
Uranyl (U(VI) or (UO22+) 1 × 10⁻⁶ (c)1 × 10⁻²³
Ca0.000420.00042
Mg0.0040.004
Inorganic carbon (C4+) 1.7 × 10⁻⁷ 1.187 × 10⁻⁴ (d)
U(IV)1 × 10⁻²³ 1 × 10⁻²³
Na0.060.07914 (e)
Cl8.2 × 10−4 8.2 × 10⁻⁴
Pip0.03 (f)0.03
Note(s): (a) A value of 3 × 10⁻¹⁰ mol/L is specified for the first three columns, and the others are specified as 3 × 10⁻⁷ mol/L to satisfy the charge balance. (b) A total of 0.03 mol/L of lactate is injected for the first 8 days. (c) A total of 1 µmol/L is used as the representative value when compared to field studies and EPA reports [44]. (d) C(IV) is specified as 1.187 × 10⁻⁴ mol/L for the first 8 days, and to satisfy the charge balance, it is specified as 1.134 × 10⁻⁴ mol/L for the rest of the model simulation. (e) Na is specified as 0.07914 mol/L for the first 8 days, and to satisfy the charge balance, it is specified as 0.04891 mol/L for the rest of the model simulation. (f) “Pip” represents the PIPES [piperazine-N,N-bis(2-ethanrsulfonic acid)] which is specified as 0.03 mol/L to keep the buffer capacity of the medium Pip + H+ = HPip log Keq = 7.2 (the speciation reaction).
Table 2. Kinetically controlled reactions and calibrated kinetic parameters used for the simulation of U(VI) bioreduction in the presence of Fe(III) hydroxide in this study (from Spycher et al. [39] and Sengor et al. [33]).
Reaction
No
Process and ReactionRate Lawq (mol/s/mgcells) or r (mol/s)kD (mol/L)kA (mol/L)Yb (mgcells/mol)kdec (1/s)
1Sulfate bioreduction (lactate degradation, biotic):
2C3H5O3 + SO42− → 2CH3COO + 2 CO32− + HS + 3H+
Equations (1)–(3)10−8/1002 × 10−22 × 10−2160010−8/100
2Fe(III) bioreduction (lactate degradation, biotic):
C3H5O3 + 4Fe3+ + 2H2O → CH3COO + CO32− + 4Fe2+ +6H+
Equations (1)–(3)10−11/1002 × 10−210 −20 (a)160010−8/100
3U(VI) bioreduction (abiotic and biotic):
4UO22+ + HS + 7H+ → 4U 4+ + SO42− + 4H2O
Equation (4)8 × 10 −11/1004 × 10−2
4U(IV) reoxidation by Fe(III) (abiotic)
U4+ + 2Fe 3+ + 2H2O → UO22+ + 2Fe2+ + 4H+
Equation (5)0.45 × 10⁻¹¹/100
5Sulfide reoxidation by Fe(III) (abiotic)
8Fe 3+ + HS + 4H2O → 8Fe2+ + SO42− + 9H+
Equation (5)2 × 10 −11/100
6Precipitation of sulfur: (b)
2Fe 3+ + HS → 2Fe2+ +S(s) + H+
Equation (5)2 × 10 −11/100
Note(s): (a) Rate is presumed to be essentially unlimited via the electron acceptor (donor-limited experiments). (b) Rate incorporates (and assumes) a constant surface area.
Disclaimer/Publisher’s Note: The statements, opinions and data contained in all publications are solely those of the individual author(s) and contributor(s) and not of MDPI and/or the editor(s). MDPI and/or the editor(s) disclaim responsibility for any injury to people or property resulting from any ideas, methods, instructions or products referred to in the content.