Article

Road Salt Collection and Redistribution at an Urban Rain Garden on Sandy Soil, Gary, Indiana

U.S. Geological Survey, Ohio-Kentucky-Indiana Water Science Center, Indianapolis, IN 46278, USA
*
Author to whom correspondence should be addressed.
Water 2025, 17(4), 510; https://doi.org/10.3390/w17040510
Submission received: 30 December 2024 / Revised: 23 January 2025 / Accepted: 26 January 2025 / Published: 11 February 2025
(This article belongs to the Section Urban Water Management)

Abstract

:
Rain gardens installed as green infrastructure to divert storm runoff from entering combined sewers also collect dissolved constituents and particulates. An urban rain garden in northwestern Indiana, USA, was continuously monitored from November 2019 to May 2021 to evaluate the fate of dissolved constituents entering the rain garden in runoff. Physical and chemical properties of soils in the rain garden were also monitored, along with underlying groundwater. Linear regression models relating specific conductance to chloride concentration indicated that the 0.0371-ha (3998 square feet) rain garden collected approximately 1490 kg (3285 pounds) of road salt from the surrounding 0.2228 ha (24,500 square feet) of impervious surfaces. Soils and groundwater were seasonally affected by road salt application but carryover from year to year was not indicated. Rain garden soil permeability (5.20 × 10⁻⁵ to 9.72 × 10⁻⁵ m/s) remained unchanged during the study period and soil organic carbon generally increased under native vegetation. The results suggest that a rain garden built on sandy soil can divert substantial quantities of runoff and dissolved constituents from combined sewers; however, chloride is transported to sub-infrastructure groundwater that eventually discharges to adjacent waterways with concentrations lower than those observed in runoff.

1. Introduction

Field and laboratory studies have documented the effects of deicers (used in cold regions where snow and ice accumulate on roads during winter months) on soils and water quality at sites with various hydrologic conditions. Field-based experiments have investigated the retention, leaching, and chemical interactions of road salt with soils [1,2,3,4]. A study of highway runoff containing deicer constituents in the sandy Calumet Aquifer beneath a northwestern Indiana wetland (about 24 km east of Gary, Ind.) determined that cation exchange in aquifer sediments reduced concentrations of sodium (Na) in groundwater but the sandy deposits had limited capacity to sustain the process [5]. In addition, chloride was detained in the unsaturated zone and provided a continuous source of chloride to groundwater throughout the year [5]. Another study of roadside soils affected by deicer-laden infiltrant determined that cation exchange led to increased metal mobility, including cadmium, copper, lead, and zinc [6]. Laboratory studies of soils leached with solutions containing dissolved sodium chloride (NaCl) increased the mobilization of organic matter and trace metals [7]. The dominant mechanism for the mobilization of metals was attributed to the dispersion of organic matter under conditions of highly exchangeable Na and low electrolyte concentrations [7].
Concentration ratios of chloride to bromide have been used to identify sources of chloride in water [4,5,8,9]. Chloride, bromide, and iodide are common constituents of roadway deicers [5,10]. The conservative nature of chloride and bromide, and to a lesser extent iodide, makes the concentration ratios of chloride to bromide (Cl/Br) and chloride to iodide (Cl/I) well suited for discriminating solute sources [11]. Conservative constituents are not affected by geochemical processes, only processes like dispersion and diffusion that can mix the constituents within a body of water. Bromide and iodide are incorporated into halite in trace proportions that are less than 30 times and 600 times, respectively [12]. The largest Cl/Br and Cl/I ratios have been interpreted to identify groundwater affected by deicers or brines [8,9,10,13,14,15]; however, Cl/Br and Cl/I ratios from brine sources are usually less than values measured in deicer-affected groundwater [5,11,13,16].
Rain gardens collecting diverted stormwater may reduce discharges to combined sewers that otherwise cause overflows to adjacent waterways or require unnecessary processing at sewage treatment plants. As rain gardens mature, they may show reduced infiltration efficiency, habitat degradation, accumulation of fine-grained deposits, and elevated concentrations of chemical constituents in soils and underlying groundwater [1,17]. In the Great Lakes region, the chemistry of stormwater runoff can be impacted by the dissolution of deicers applied to impervious surfaces to enhance public safety during freezing conditions [1]. Sodium chloride (NaCl), or ‘road salt’, is a common type of deicer applied to impervious surfaces including parking lots, sidewalks, driveways, and roads as well as other chloride-based deicers include calcium chloride (CaCl2), magnesium chloride (MgCl2), and potassium chloride (KCl) [18]. Increased salinity in groundwater used as a drinking water source can cause a minimal health risk for humans, but it can also affect the concentrations of other chemicals associated with road salt [19,20].
Information describing the long-term sustainability of rain gardens, shallow depressions designed to receive runoff generated from nearby impervious surfaces, is needed by resource managers to determine the economic viability and long-term maintenance requirements [21,22]. Dissolved constituents and particulates in runoff from paved surfaces may be transported to rain gardens, accumulate in soils, and degrade surface water and groundwater quality over time [23]. These alterations to the rain garden may adversely affect the health of plants that stabilize the rain garden surface and remove water through transpiration, reduce the holding capacity of the structure, and create a contaminant point source to groundwater. A study of green infrastructure stormwater control features in northern Ohio determined that the percentage of runoff removed by the features decreased during a 5-year monitoring period [24].
Municipalities adjacent to the Great Lakes are implementing watershed management plans that include green infrastructure to reduce the impacts of urban stormwater on nearshore water quality [25]. Since 2010, the Great Lakes Restoration Initiative has sponsored programs that support the reduction in nonpoint source pollution impacts on nearshore health; however, high-quality data on the operational and performance characteristics of green infrastructure and other stormwater control measures are needed to assess their overall success and maintenance requirements. In 2014, the U.S. Geological Survey (USGS), in cooperation with the U.S. Environmental Protection Agency, began studies to characterize the effects of green infrastructure on urban stormwater at Gary, Ind.; Detroit, Mich.; Buffalo, N.Y.; and Fond du Lac, Wisc. The rain garden examined in this study was built at Gary City Hall, Gary, Ind., monitored for water budget components from 2016 to 2021 and water quality from 2019 to 2021.
The purpose of this research was to evaluate the fate of dissolved constituents entering the rain garden in runoff and measure changes in the physical and chemical properties of soils in a cold-region rain garden constructed in sandy soils. We investigate the source of sodium chloride entering the rain garden, sodium chloride loading amounts, the occurrence of chloride in underlying groundwater, and whether soil organic carbon and infiltration rates are degraded following rain garden construction. The results have implications for determining the effectiveness of rain gardens in capturing stormwater runoff, potential impacts on groundwater quality, and long-term sustainability of the structures.

2. Study Area

The study area is in the Calumet Lacustrine Plain physiographic province of northwestern Indiana [26]. The province is characterized by dune–beach complexes formed in the Pleistocene and Holocene Epochs along the southern shore of Lake Michigan [27,28,29]. Silt, sand, and gravel were deposited as a thin but laterally extensive surficial aquifer, referred to as the Calumet aquifer. In the area of Gary City Hall, the Calumet aquifer extends 6.1 to 10 m (20 to 35 feet) below the land surface [5,30]. A glacial ablation till known as the Wheeler Sequence underlies the Calumet aquifer [31]. The clay-rich Wheeler Sequence ranges in thickness from 15 to 42 m (50 to 140 feet) in the area and forms a confining unit between the Calumet aquifer and the underlying carbonate bedrock aquifer [32]. The southern margin of the City Hall green infrastructure is underlain by a mixture of construction waste and native deposits. Documented values of hydraulic conductivity for the Calumet aquifer range from 2.7 × 10⁻⁵ to 1.6 × 10⁻⁴ m/s (7.69 to 46.2 feet/day) (mean 8.9 × 10⁻⁵ m/s; 25.3 feet/d) and are typical for silty and clean sand [5].
The Gary City Hall rain garden was designed to collect stormwater from the surrounding parking area and streets and prevent it from entering the combined sewer. The rain garden was built in the center of the parking area and impermeable surfaces were sloped to encourage drainage into the rain garden. Rain garden construction entailed excavation to a depth of 1.8 m (6 feet), placing a perforated pipe along the long axis of the rain garden, and backfilling with engineered soils intended to replicate native deposits [33]. The land surface of the rain garden was sloped from the edge to the center of the garden to encourage infiltration in the area underlain by the perforated plastic pipe. The perforated pipe was a temporary storage container during periods of high infiltration and slowly released stormwater as the surrounding materials dried. The perforated plastic pipe had a 0.3 m (12 inches) inner diameter and was 45 m (150 feet) long and was surrounded with 0.2 to 0.3 m (6 to 12 inches) of very coarse gravel and wrapped in a fabric root barrier to maintain long-term flow to the pipe. The perforated plastic pipe was accessed and instrumented at each end by way of 0.6 m (24 inches) inner diameter concrete dropdown structures. An overflow pipe connected the top of the eastern dropdown structure to the storm sewer. The surface of the rain garden was stabilized with native flowers and grasses.
The area of the completed green infrastructure implementation was 0.459 ha (49,500 square feet). The area of the completed rain garden was 0.037 ha (4000 square feet). The area draining to the rain garden, including streets and sidewalks, was 0.228 ha (24,500 square feet). Sub-drainages to the rain garden were delineated and each drained to a separate flume before entering the rain garden (Figure 1).
A study describing the water budget at the Gary City Hall rain garden in Gary, Indiana, during spring through fall, 2017–2018, determined that stormwater discharges to the combined sewer during warm-weather months were reduced by 80.3 percent as a result of green infrastructure installation [33]. Water that entered the rain garden as direct precipitation and stormwater runoff was redistributed as potential evapotranspiration (31 and 22 percent, respectively), direct groundwater recharge (13 and 19 percent, respectively), and temporary storage in the buried pipe and in the unsaturated zone (56 and 59 percent, respectively) [33]. Presumably, water in temporary storage and the unsaturated zone eventually recharged groundwater. Discharges from the rain garden overflow into the combined sewer were 0 and less than 1 percent in 2017 and 2018, respectively. Cold weather monitoring and water-quality data collection were not carried out as part of this study.
Atmospheric conditions at Gary City Hall during cold-weather months are characterized by average winter (December through February, as defined by National Weather Service) snowfall of 0.81 m (31.75 inches) and average air temperatures below freezing—1.89 °C (28.60 °F) ([34], Table 1). Runoff generated by snowmelt events is low-intensity and long-duration. During 2019–2020 cold weather monitoring (City Hall rain garden was monitored 21 November, through 31 March; 131 days), there were 50 days of precipitation and freezing conditions, including 49 days totaling 0.77 m (30.2 inches) snowfall and 0.26 m (10.1 inches) water equivalents. During 2020–2021 cold weather monitoring (City Hall rain garden was monitored 1 November through 31 March), there were 48 days with freezing precipitation, including 47 days totaling 1.2 m (48.8 inches) snowfall and 0.22 m (8.72 inches) water equivalents. The 30-year normal precipitation during summer is 0.32 m (12.51 inches). Spring and fall weather are transitional between summer and winter.
Deicers are applied to the parking area and walkways surrounding the rain garden and to the streets surrounding Gary City Hall during appropriate conditions by employees of the city. Deicer application rates are set by the truck operator’s discretion based on the anticipated moisture content and accumulation of snow. Deicers are additionally delivered by hand to the steps and sidewalks in front of City Hall. Records of deicer application dates and rates are not kept.
The collection of road salt and its redistribution in soil and water at the Gary City Hall rain garden was evaluated by the USGS as part of the Great Lakes Restoration Initiative program from November 2019 to May 2021. Cold weather monitoring of water-quality data in runoff and groundwater were collected through two complete road salt application seasons. Physical and chemical analyses of soil cores from the rain garden were carried out following the 2019–2020 road salt application season, and before and after the 2020–2021 road salt application season. Data were analyzed to evaluate the quantity and fate of road salt collected by the rain garden with implications for rain garden sustainability and maintenance and the potential for groundwater contamination.

3. Materials and Methods

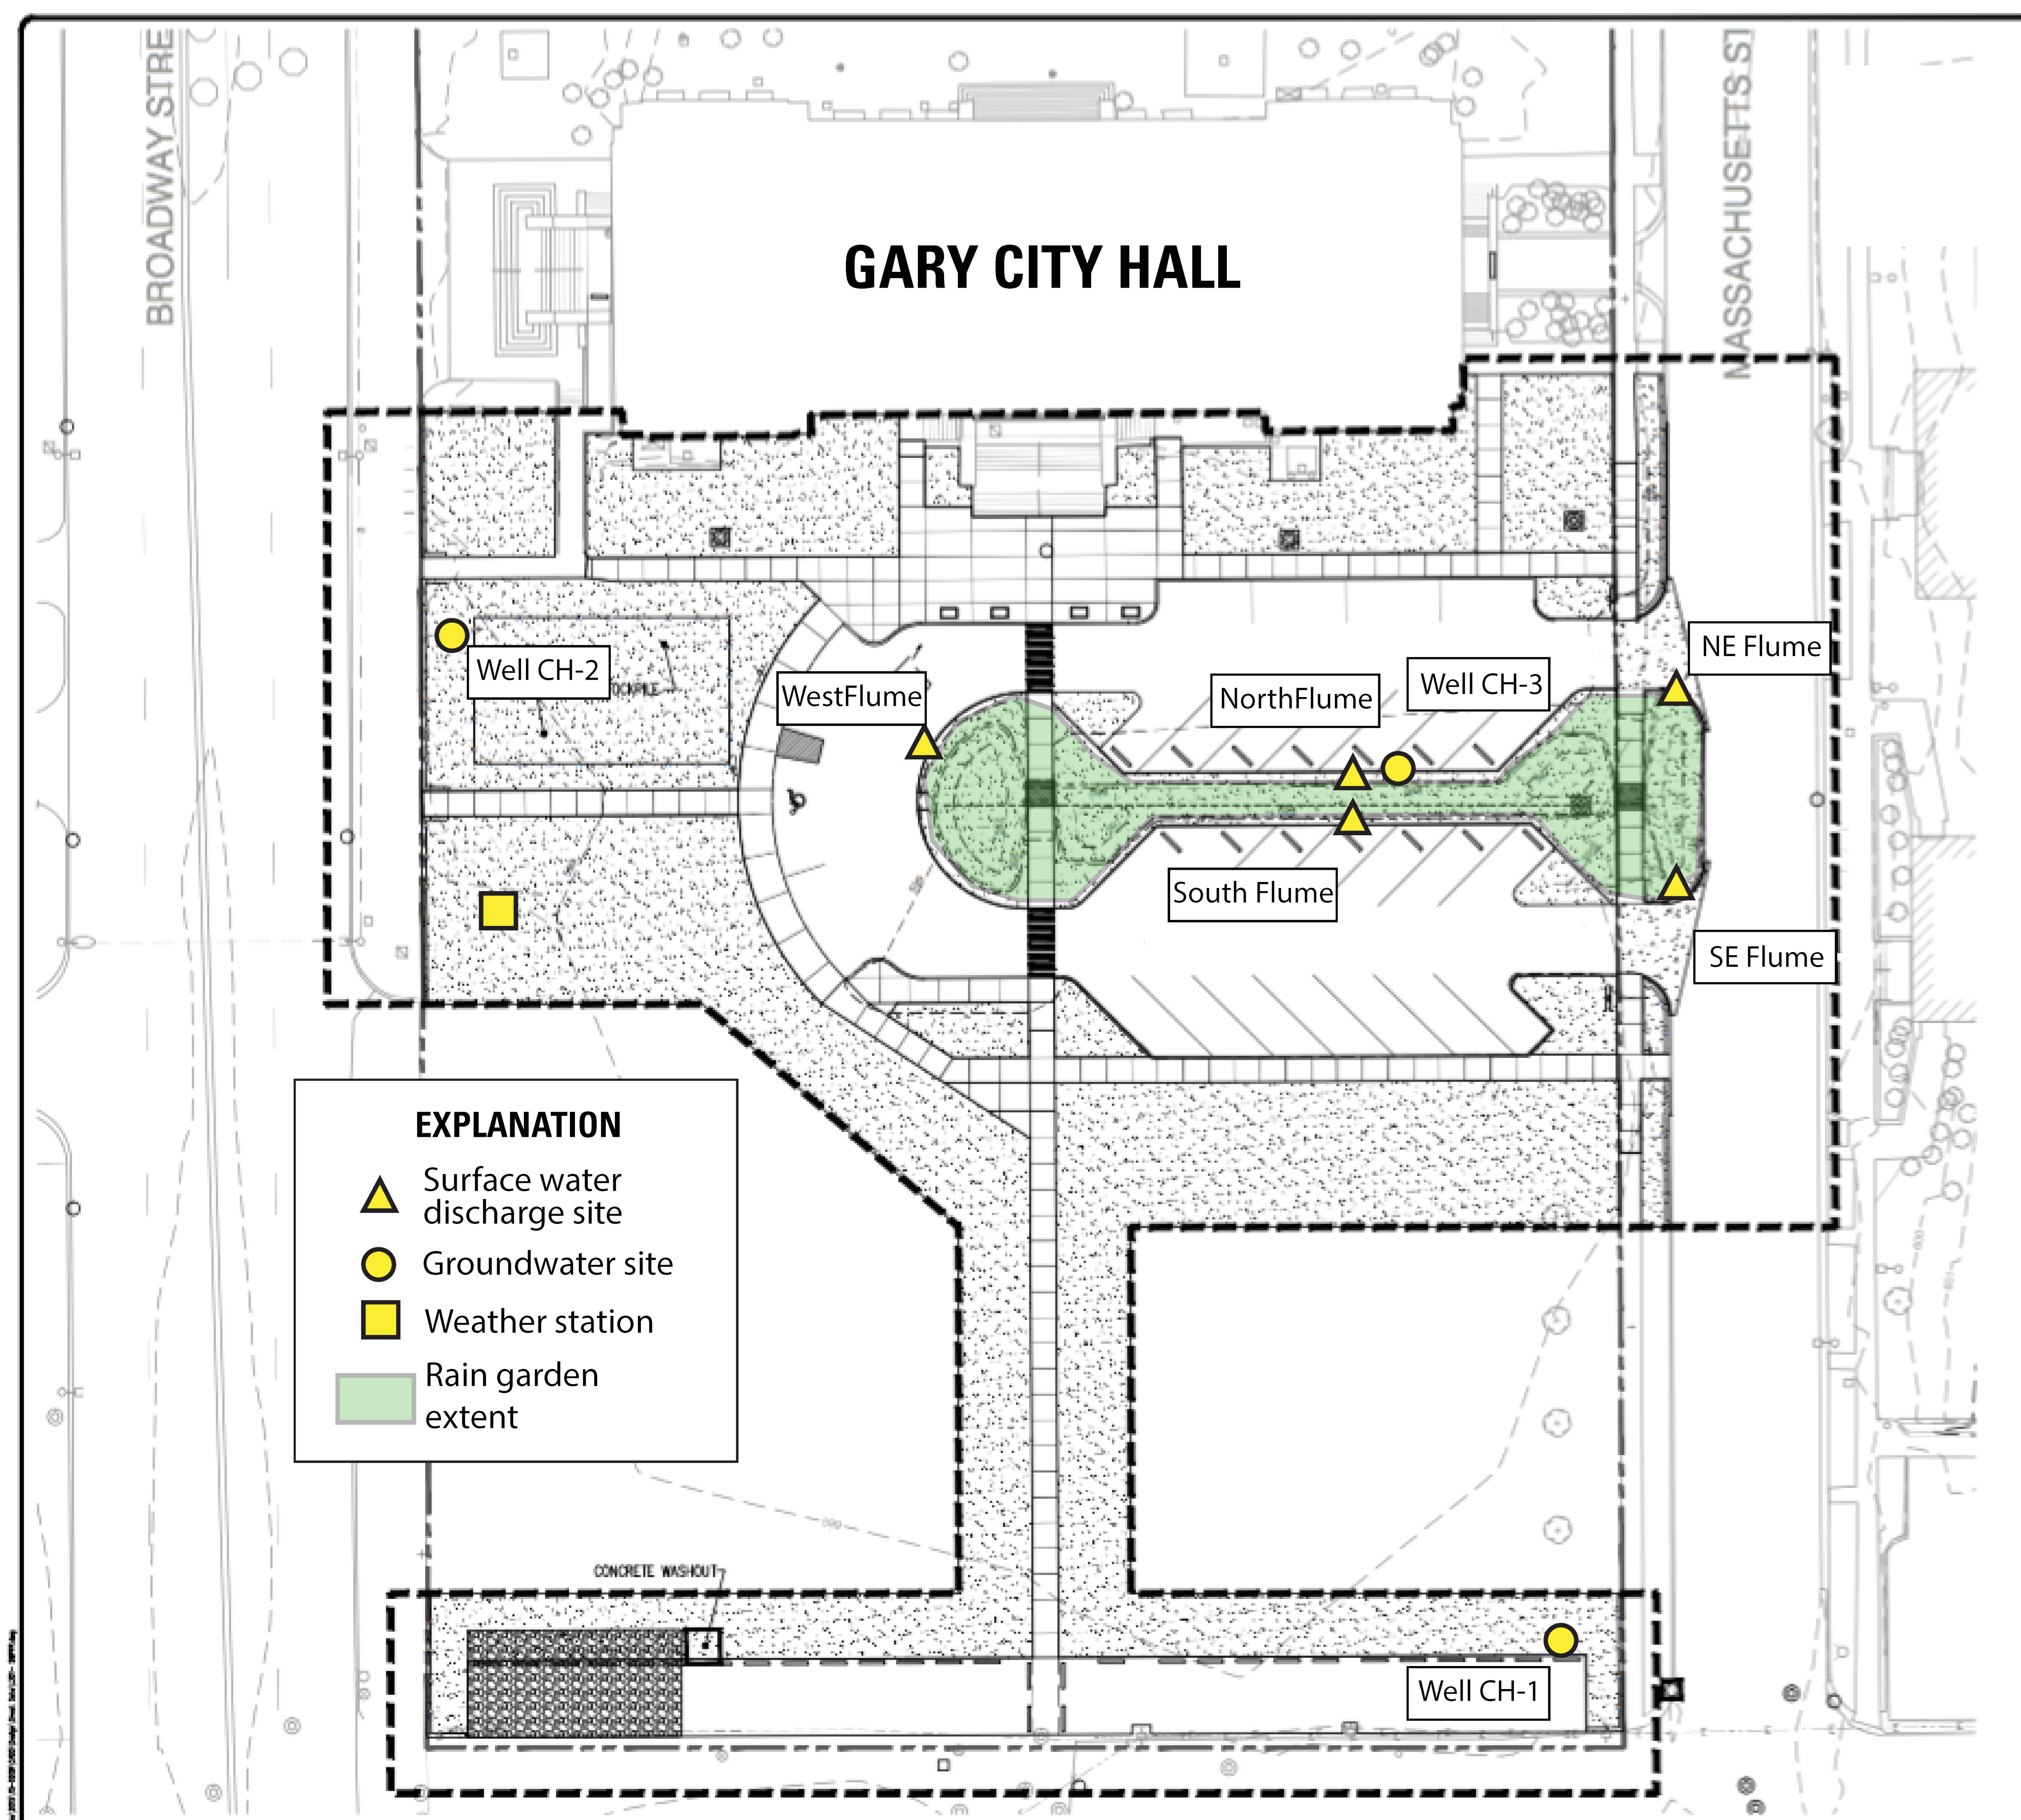
Instruments installed by the USGS [33] to monitor the water budget were used for this investigation and included five flumes, to continuously monitor runoff from the surrounding impermeable surfaces into the rain garden; a weather station, to measure wet precipitation and meteorological variables used to compute potential evapotranspiration; pressure transducers with specific conductivity sensors, to continuously measure groundwater levels and specific conductance in monitoring wells; and pressure transducers, to monitor the overflow of water from the rain garden into the combined sewer (Figure 2). Instruments added for this study included a heated precipitation gage and sensors beneath the pour points on the flumes to monitor the specific conductance of water passing through the flumes. The water-quantity data collection network was maintained with identical methods and procedures to those described in [33]. All data were preserved in the USGS’s National Water Information System database (see Data Availability Statement for more information regarding data access).
The specific conductance of groundwater was continuously monitored at three groundwater wells—CH-1, CH-2, and CH-3 (Figure 2). Monitoring well CH-3 was located near the center of the rain garden and screened from 3.2 m to 4.7 m (10.5 to 15.5 feet) below land surface and across the water table. Monitoring wells CH-1 and CH-2 were in the green infrastructure implementation area, immediately south and west of the rain garden (respectively), and completed about 1.52 m (5 feet) deeper than CH-3 [33]. Wells CH-1 and CH-2 were about 64.0 m (210 feet) and 65.5 m (215 feet) from CH-3, respectively. Well CH-1 was upgradient from CH-3 except during recharge events and CH-2 was downgradient from CH-3 [33].
The specific conductance of runoff into the rain garden was continuously monitored beneath the pour points on the five flumes. The perimeter of the rain garden was blocked with edging that forced runoff to flow through the flumes. The specific conductance sensors were positioned in 20 cm (8 inch) long by 10 cm wide (4-inch) sections of a PVC drainage channel with slotted covers. Covers were lined with a synthetic screen to reduce the accumulation of solids in the PVC chamber. One sensor was mounted in each PVC chamber. Water flowed from the flume into the PVC chamber and when the chamber was full it overflowed onto the ground in the rain garden. Flumes and chambers were emptied and cleaned before or after runoff events, and chambers and sensors were thoroughly rinsed with tap water. The manufacturer’s documented range for the specific conductance sensors was 0–120,000 μS/cm, with a resolution of 1 μS/cm and accuracy of 10 μS/cm or +/−10 percent [35]. Sensors were calibrated in the USGS laboratory before deployment and checked during eight site visits between November 2019 and March 2021 using standards ranging from 100 to 100,000 μS/cm.
Samples of runoff and groundwater were collected for most runoff and snowmelt events from 21 November 2019 to 11 March 2021. Runoff samples were collected during runoff events beneath the pour point on the flumes. Some flumes did not experience measurable flow for low-intensity events and could not be sampled. On-site measurements during sample collection included dissolved oxygen, pH, specific conductance, and temperature and were made using a multiparameter sonde on runoff collected below the pour point. The value reported by the continuous specific conductance sensor was simultaneously recorded. Runoff samples were chilled and sent to the USGS National Water Quality Laboratory (NWQL) for measurement of dissolved chloride, bromide, and iodide concentrations. All samples were collected using established techniques and methods [36].
Groundwater samples were collected as specified in the USGS Field Manual [36] and analyzed for concentrations of dissolved chloride, bromide, and iodide from wells CH-1, CH-2, and CH-3. From November 2019 through February 2020, groundwater samples were collected concurrently with runoff samples. Analysis of those groundwater samples and the continuous specific conductance data indicated that infiltrating runoff was probably not immediately affecting the chemistry of groundwater and collecting samples 1–2 days after the event would provide better data to describe the effect of infiltrating runoff on groundwater. From March 2020 through March 2021, groundwater samples were collected 1–2 days after runoff was sampled at the flumes.
Continuous specific conductance measurements at 1 min intervals in groundwater and runoff were compared to on-site measurements during site visits. Continuous data were corrected for instrument drift, voltage spikes, and data known to be erroneous. Instrument drift was corrected by applying a linear adjustment between discrete measurements. Erroneous data caused by water and debris accumulating in the PVC chambers between storms were removed from the data set. The approved data for the specific conductance of runoff only included periods when the on-site weather station, video surveillance, and/or stage sensors on the flumes indicated that runoff was occurring.
A sample of solid deicer was acquired from the Gary Department of Public Works and used to determine the chemical composition of the deicer applied on impervious surfaces at Gary City Hall. Samples of known mass were dissolved in deionized water and analyzed using the same methods as used for samples collected from the flumes for concentrations of calcium (Ca), sodium (Na), magnesium (Mg), potassium (K), chloride (Cl), and sulfate (SO4) in order to identify their composition from the commonly used chloride-based deicers [3]. Concentration data were used to compute molar equivalents and compared with an ideal 1:1 sodium-to-chloride molar ratio in NaCl.
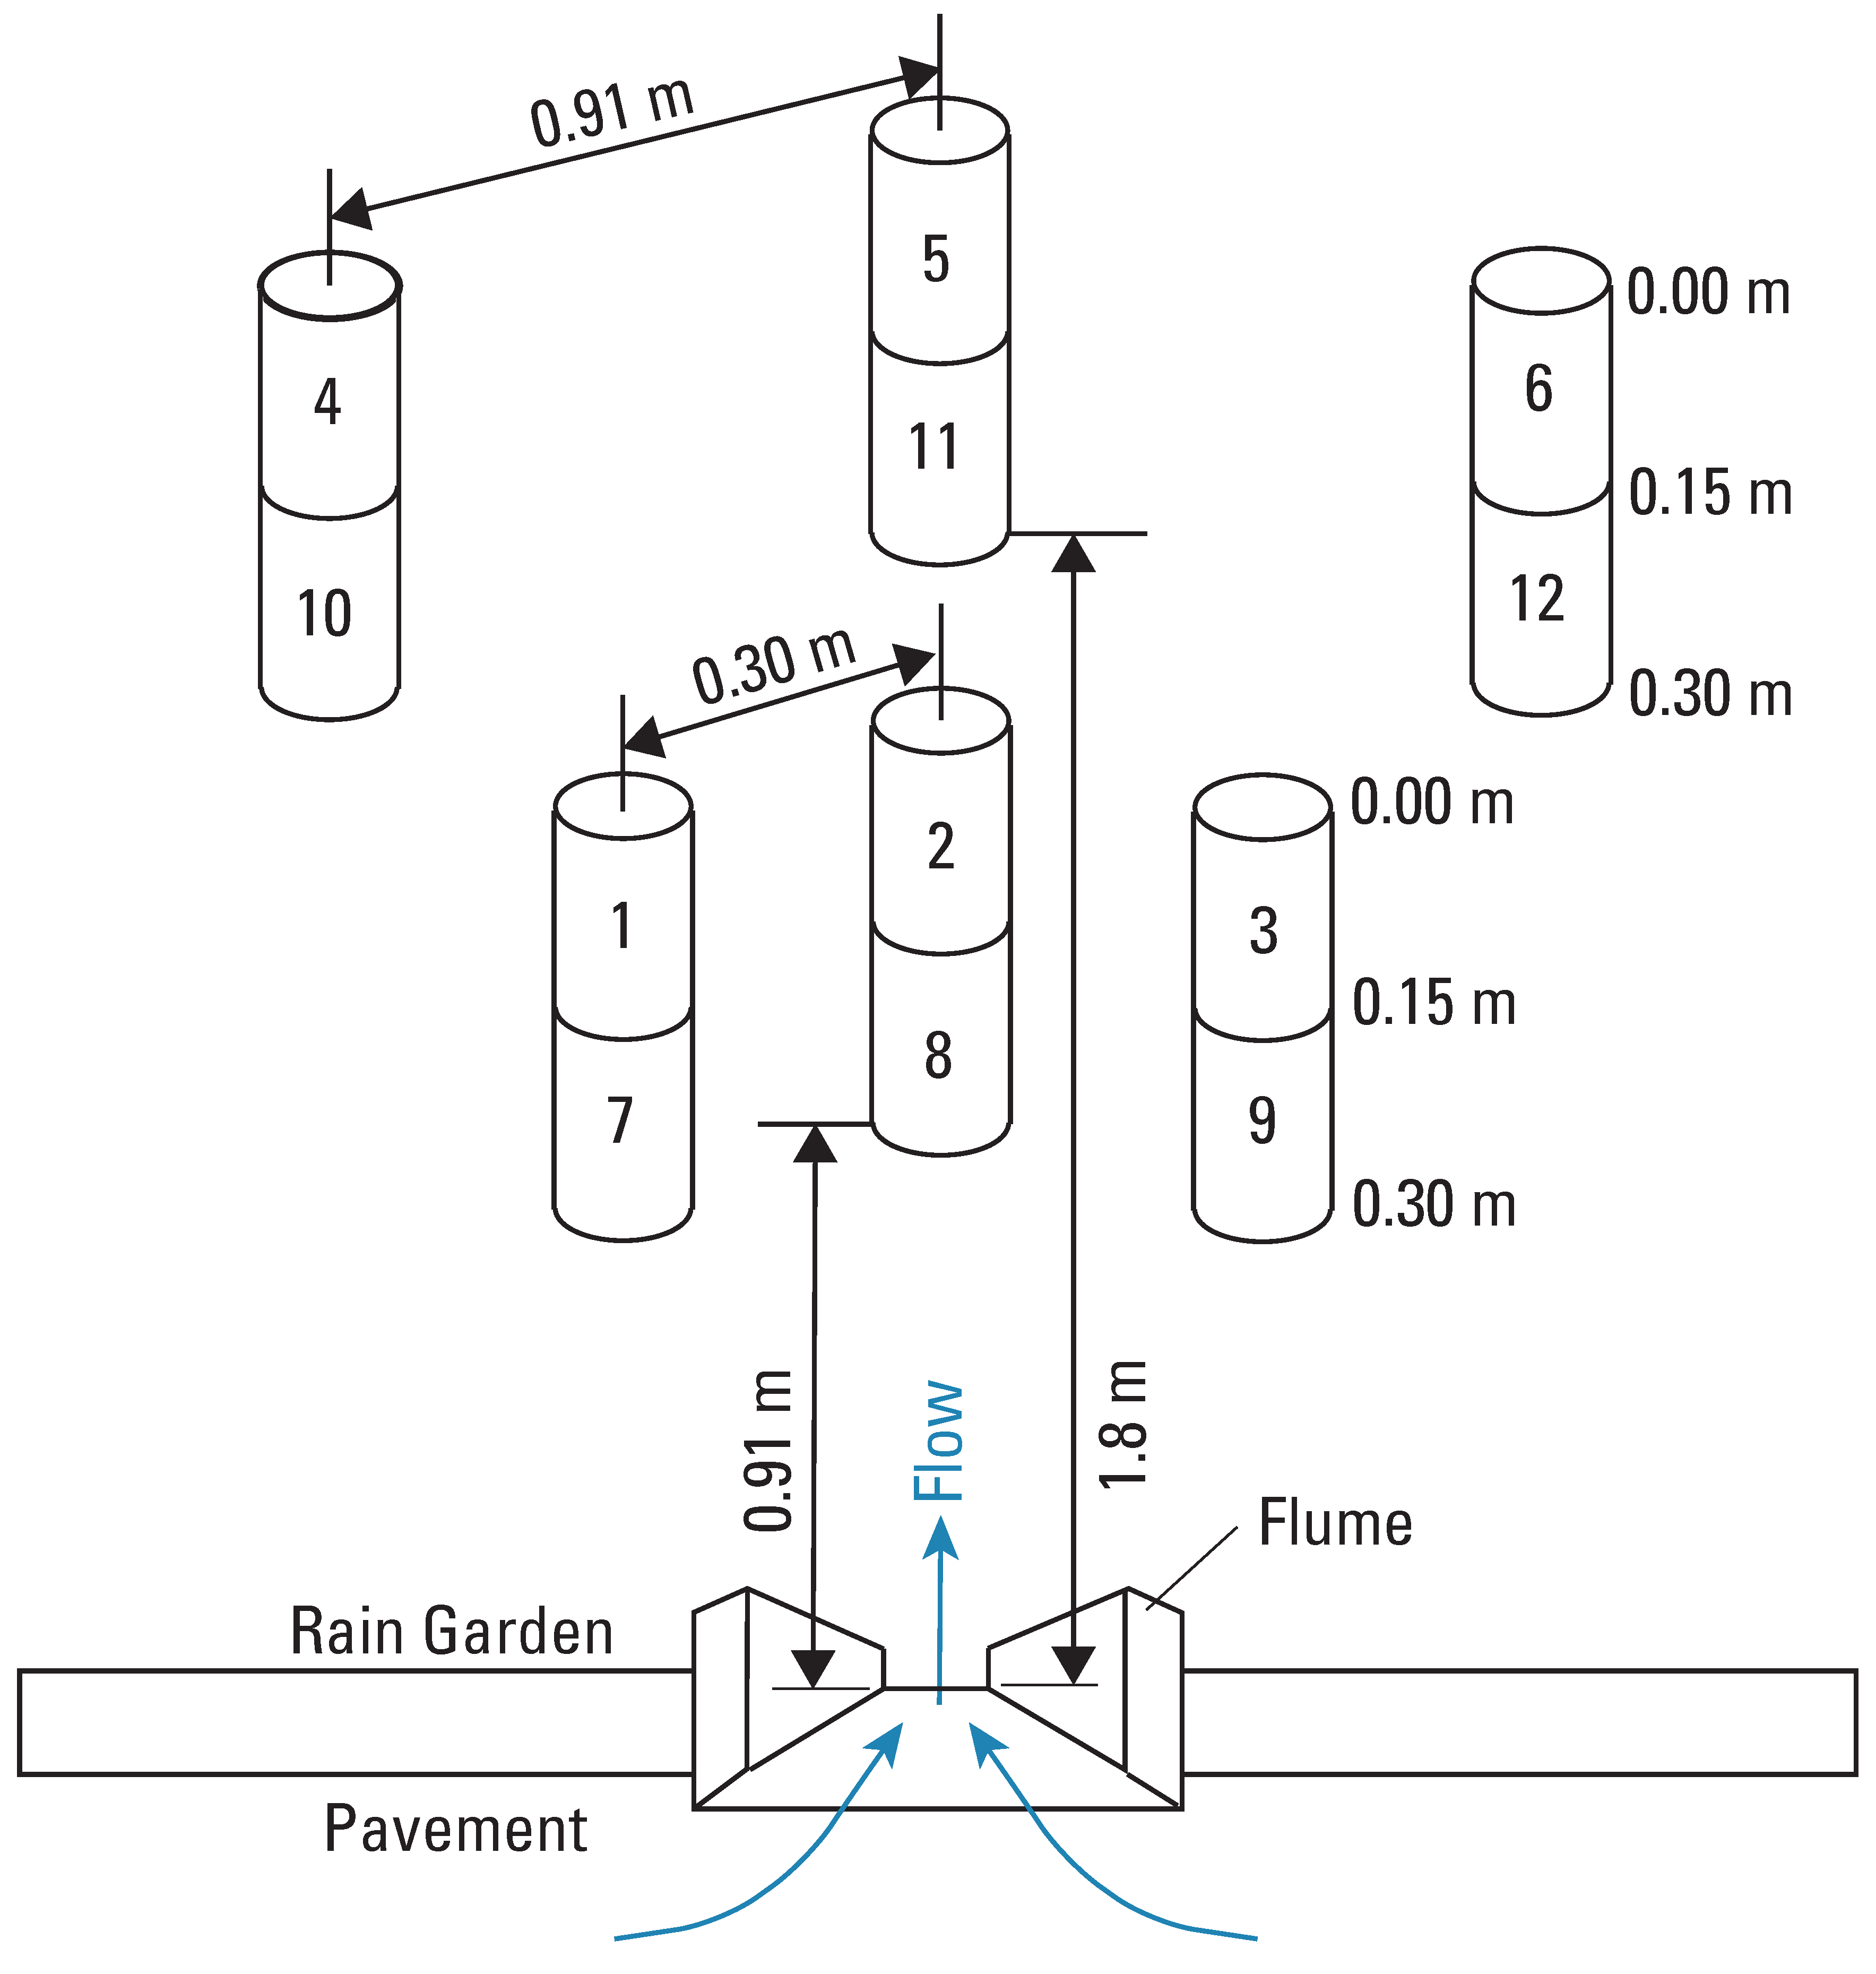
Three areas within the rain garden were selected to evaluate the range of runoff effects on soil chemistry and hydraulic properties. The three areas were 1.0 to 1.5 m (3.2 to 4.9 feet) downslope from flumes located at the northeastern corner of the rain garden, the north side at the center of the rain garden, and the western side of the rain garden. These flumes generally measured the highest, average, and lowest discharges during the study, respectively. Soil samples were collected on three occasions in a fan-shaped pattern from six positions and two depths, 0 to 0.15 m and 0.15 to 0.30 m (0–6 inches and 6–12 inches) (Figure 3). The three occasions represented pre-deicer application season (summer 2020 and summer 2021) and post-deicer application season (spring 2021). During the summer 2021 collection, additional samples were collected to identify potential deicer effects at greater depths (0.86–1.22 m); the gravel barrier surrounding the perforated drainage pipe precluded further penetration. A 0.06 m diameter hand-operated bucket auger was used to collect samples. Soil samples were preserved in zip-locked plastic bags and shipped to a contract laboratory for analyses. The analytical measurements were selected to provide information about detention of deicer-related constituents in the soil and temporal changes in the physical and chemical soil properties.
Infiltration rates were measured two times in April 2019 and April 2021, following deicer application season, to assess the effects of runoff constituents on the hydraulic properties of soils in the rain garden. Infiltration rates were measured near the locations where soil samples were collected. Measurements were made using a double-ring infiltrometer following documented standard procedures [37,38].

3.1. Quality Assurance Methods

In addition to collecting samples using well-documented, standardized procedures, quality assurance samples were collected and analyzed to validate the integrity of the data. Quality assurance of water samples included a combination of sequential duplicate samples and equipment blanks. Sequential duplicates were two samples collected in close succession from the same well or flume using the same equipment and methods. Sequential duplicates were used to assess the reproducibility of sample collection, preservation, shipping, and analytical procedures. Sequential duplicate samples of groundwater and runoff were collected from groundwater wells and flumes. Equipment blanks were used to determine if cleaning procedures successfully removed measurable concentrations of water-quality constituents from the pump, flow-through chamber, and hoses. Equipment blanks were collected after decontamination was completed by pumping deionized water through the pump, flow-through chamber, and hoses. Sequential duplicates and equipment blanks were submitted with environmental samples for identical analyses.
Sequential duplicate soil samples and permeability measurements were carried out to assess the reproducibility of sample collection procedures and the variability of chemical and physical measurements. Sequential duplicate soil samples were collected adjacent to the environmental sample and taken from the same depths. Sequential duplicate permeability measurements were made in the same location as initial measurements and used identical methods. Replicate permeability measurements reflected variability in method application but not spatial variability.

3.2. Computing Road Salt Collection from Discrete Chloride Concentrations, Continuous Specific Conductance Data, and Flume Discharges

Linear regression relations of chloride concentrations in discrete samples of groundwater and runoff with instantaneous, sensor-measured specific conductance were used to calculate continuous chloride concentrations in groundwater and runoff. The chloride-specific conductance relations for groundwater and runoff were computed separately. The relation between chloride concentration and specific conductance in runoff included all environmental samples of runoff collected from flumes. The relation between chloride concentration and specific conductance for groundwater included all environmental samples collected from wells. The coefficient of determination (r2) was computed for each relation to assess how well the data fit the equation. Linear regression equations had the following form:
Chloride (estimated, in mg/L) = a × (Specific conductance, in µS/cm) + b,
where
  • a = the slope of the linear regression relation;
  • b = the value of chloride (in mg/L) when specific conductance (in μS/cm) equals zero.
The total mass of dissolved NaCl that entered the rain garden in runoff through each flume was computed as the product of (1) the estimated continuous chloride concentration, (2) continuous flume discharge during the two monitored deicer application seasons, and (3) the length of time between sequential, continuous concentration and discharge measurements. Chloride concentration in runoff was not estimated where the discharge was less than the manufacturer’s suggested minimum reliable measurement (0.0007 feet3/s), where the specific conductance sensor ceased to report measurements indicating the sensor was dry, or if video surveillance indicated no runoff was occurring. Chloride concentrations that were estimated to be negative, resulting from a negative y-intercept in the computed relation between measured chloride concentration and specific conductance, were eliminated from the data set.
The equation used to compute the mass of NaCl passing through each flume during the study period was as follows:
Collected NaCl = Σ{Cl × [58.443/35.4453]} × (Q × 28.317 L/feet3) × t × 1/1000
where
  • Σ is the sum of NaCl estimated for all sequential periods of continuous specific conductance and chloride measurements, in kg;
  • Cl is the mean concentration of chloride estimated from continuous specific conductance over time t, in mg/L;
  • 58.443 is the atomic weight of NaCl, in g/mol;
  • 35.445 is the atomic weight of Cl, in g/mol;
  • 28.317 is a unit-conversion factor, in L/feet3;
  • Q is discharge, in feet3/s;
  • t is the time increment between successive specific conductance and flume discharge measurements, in s;
  • 1/1000 is a unit conversion factor, kg/mg.

3.3. Inferring Chloride Sources from Ion Ratios

Ratios of the aqueous concentrations of chloride to bromide (Cl/Br) and chloride to iodide (Cl/I) were plotted with chloride concentration and compared to similar plots with known sources to evaluate the sources of chloride in discrete water samples from the rain garden at Gary City Hall. Plotted data were visually compared with similar plots from published studies where the chloride sources were known [39,40,41]. Samples with concentrations of Br or I less than the reporting limit (<0.01 mg Br/L; <0.001 mg I/L) were not used in the analysis.

4. Results

4.1. Deicer Composition

Chemical analyses of three dissolved deicer samples yielded the following compositions:
  • Ca0.23 Mg0.64 Na99.05 K0.08 Cl 99.79 (SO4)0.20;
  • Ca0.18 Mg0.64 Na99.09 K0.10 Cl99.77 (SO4)0.23;
  • Ca0.12 Mg0.63 Na99.17 K0.10 Cl99.78 (SO4)0.23.
The approximate 1:1 ratios of Na to Cl confirmed that halite (NaCl) was the deicer applied to impervious surfaces that drained to the rain garden. Smaller concentrations of other ions, including bromide and iodide (not analyzed), represent impurities in the road salt.

4.2. Chloride Concentrations in Groundwater and Runoff

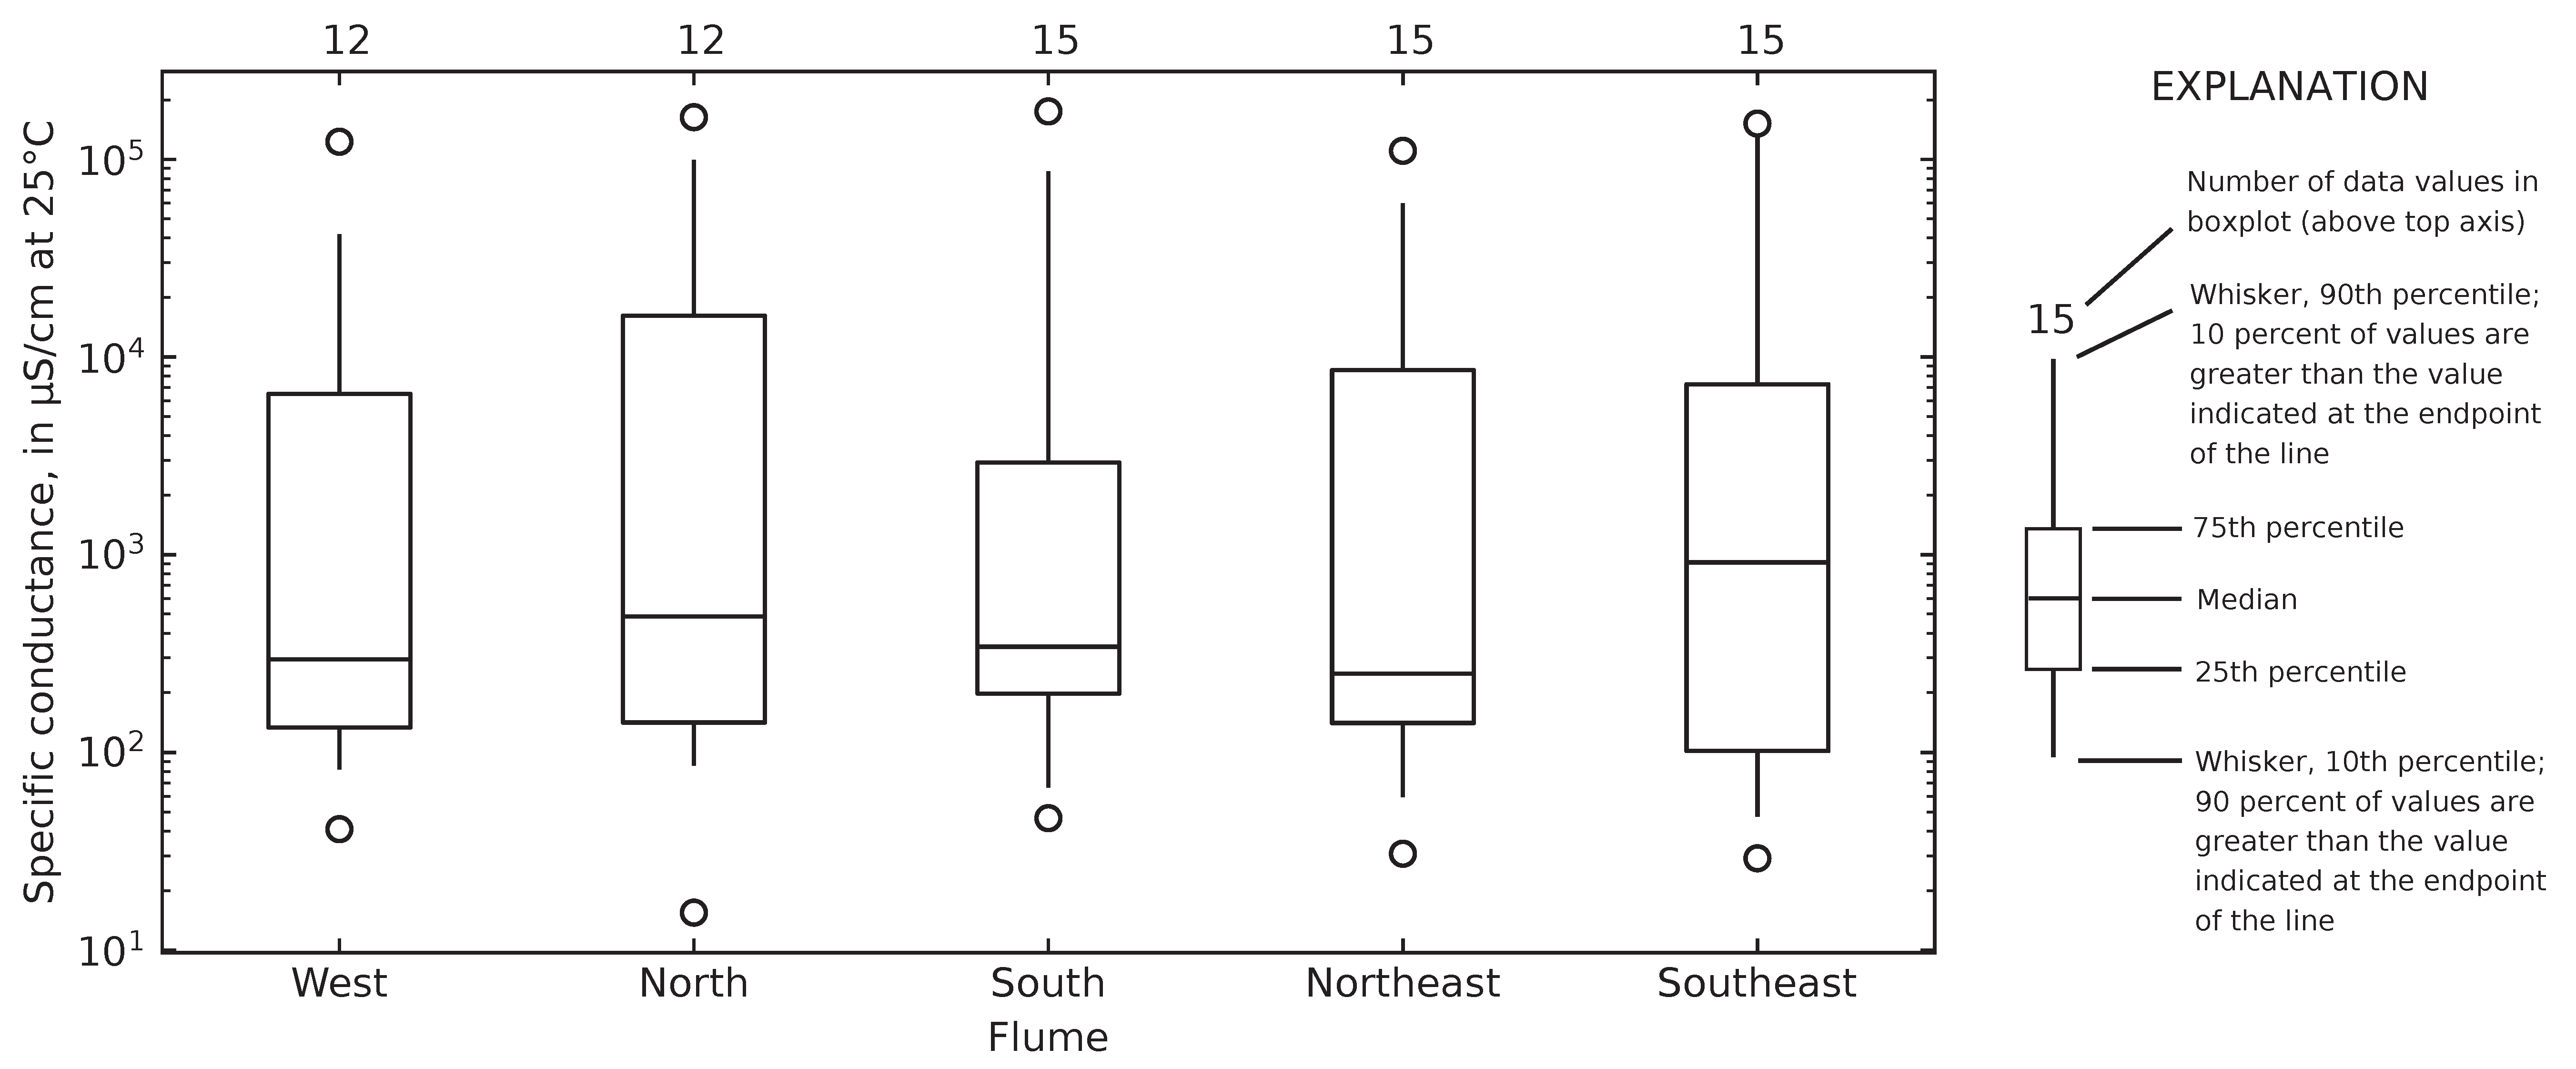
Sixty-nine runoff samples were collected at the flumes following 16 rainfall and snowmelt events and analyzed for aqueous concentrations of chloride, bromide, and iodide. Concentrations of chloride in runoff ranged from 0.84 to 72,200 mg/L (Figure 4). The greatest concentrations of chloride in runoff were collected during the cold-weather months. The smallest concentrations of chloride in discrete samples of runoff were collected during warm-weather months when no road salt was applied. The highest specific conductance in runoff generally occurred at the North flume and lowest occurred at the South flume (Figure 5). Visual evidence indicated that the stairs and walkways near the entrance to Gary City Hall received deicer applications by property custodians and may have contributed to relatively higher concentrations of dissolved solids at the North flume.
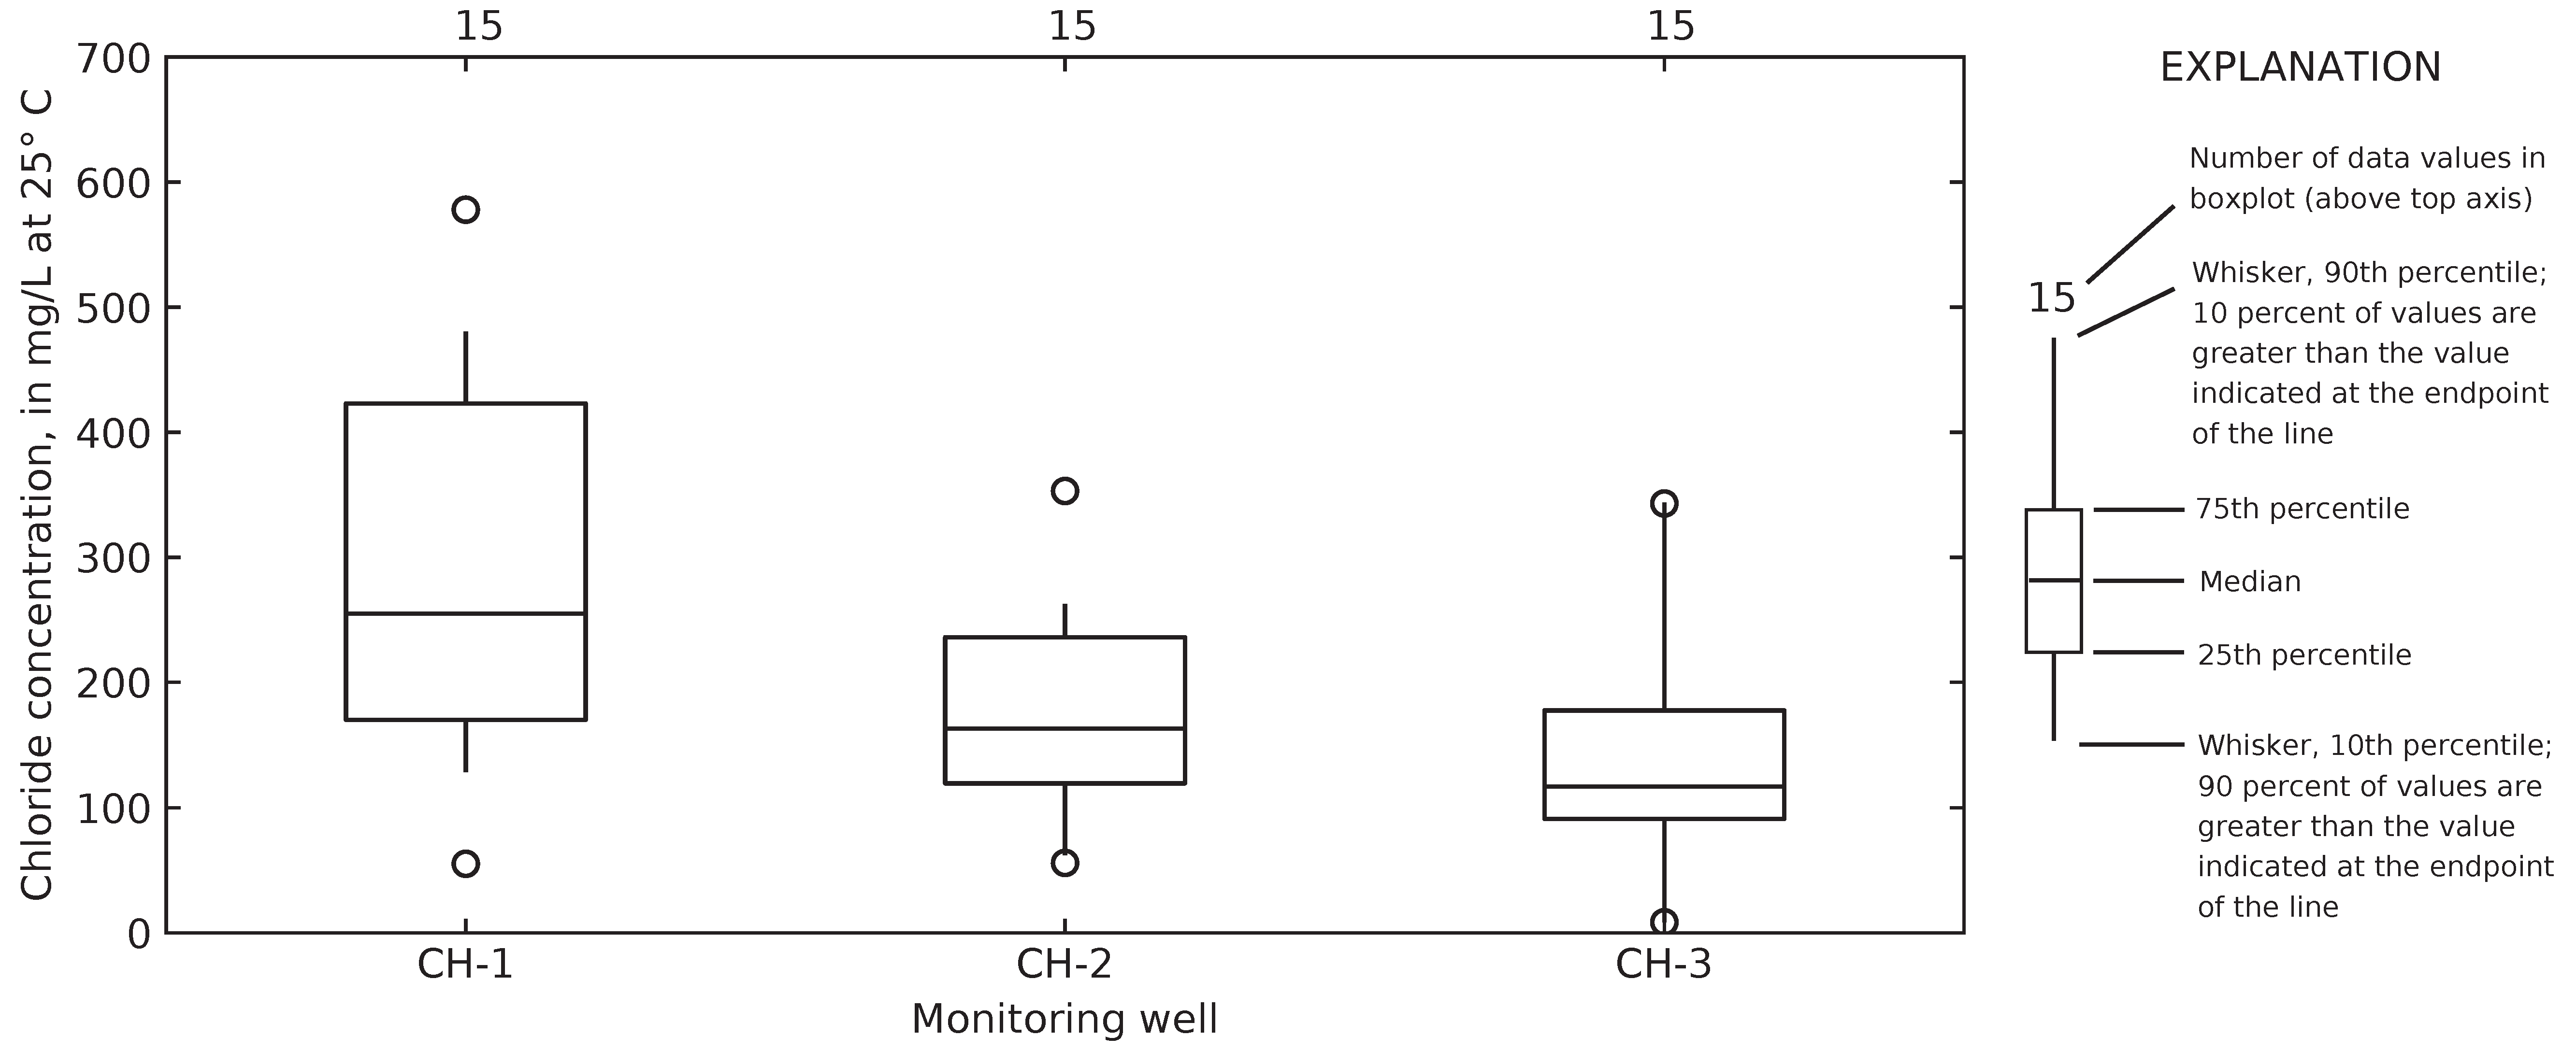
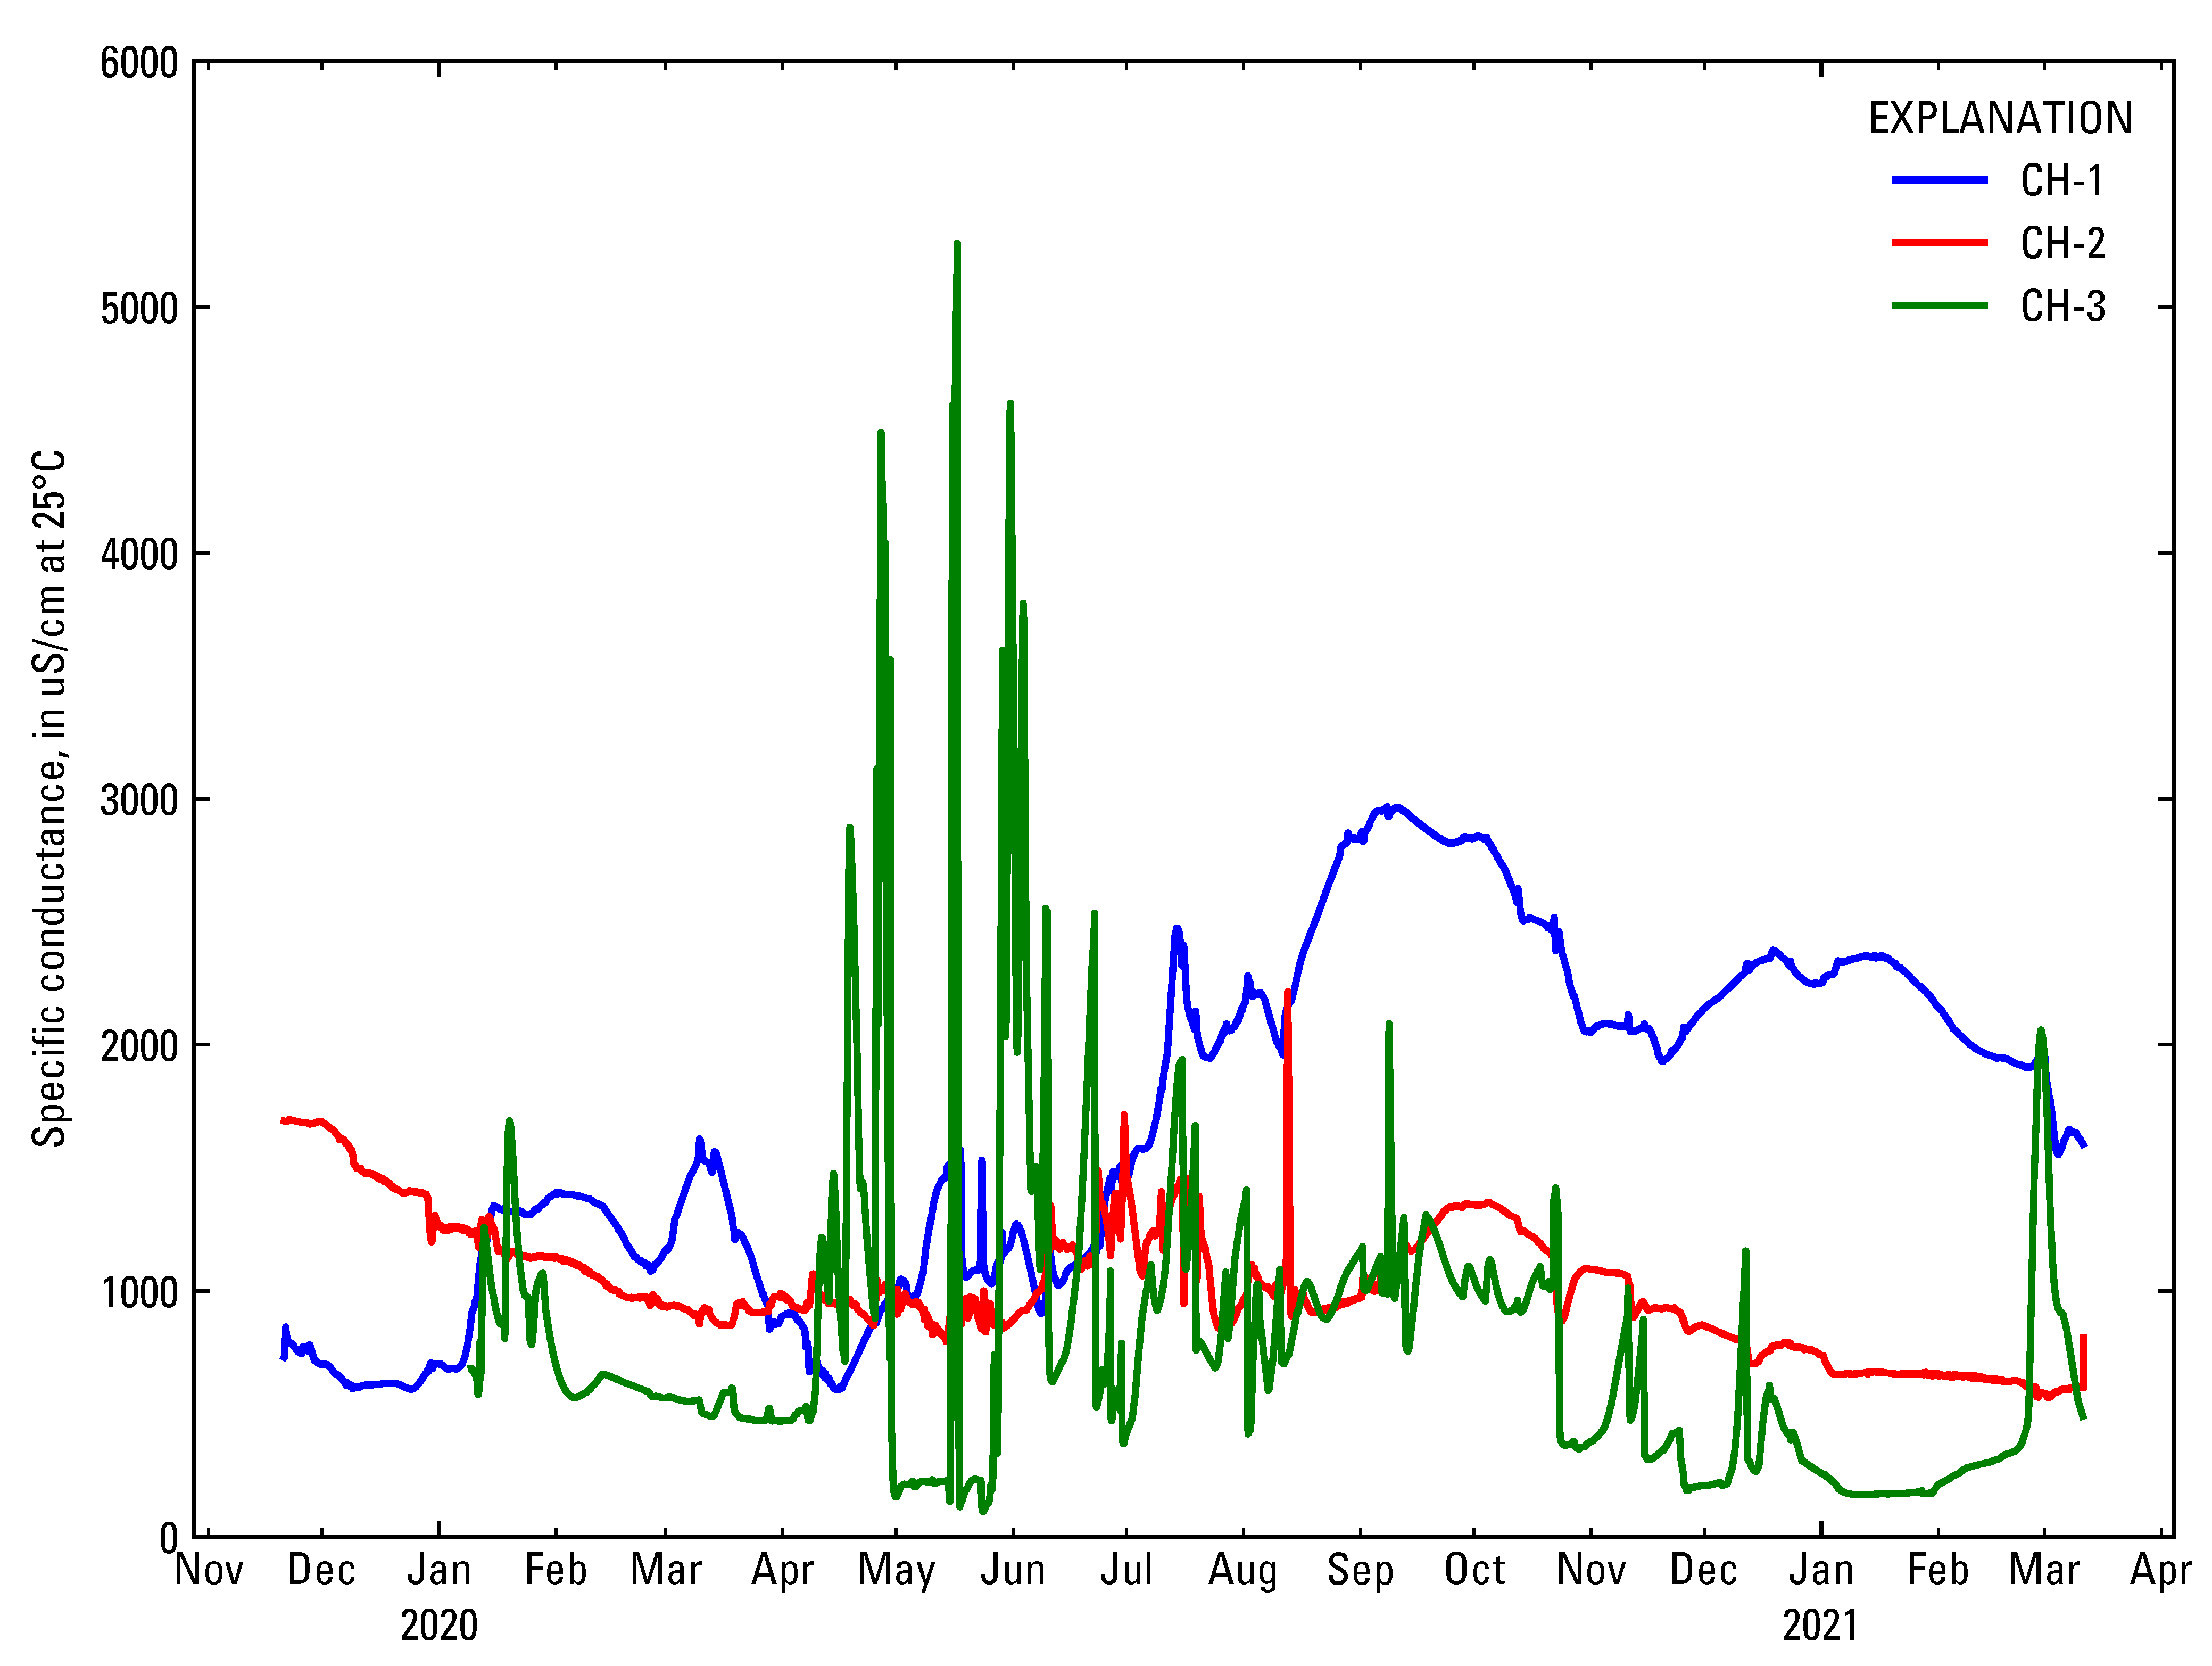
Forty-five groundwater samples were collected and analyzed from the three groundwater wells located near the raingarden for aqueous concentrations of chloride, bromide, and iodide (CH-1, CH-2, and CH-3; Figure 2). Concentrations of chloride in discrete groundwater samples ranged from 8.45 to 578 mg/L (Figure 6). Chloride concentrations in discrete samples were generally lowest during late spring and then increased during summer. Chloride concentrations in discrete samples from well CH-3 were generally lower than concentrations measured in wells CH-1 and CH-2, indicating that chloride is more present in the deeper aquifer than in the shallow aquifer closest to the rain garden (Figure 6). The specific conductance in CH-1, CH-2, and CH-3 followed similar trends except for brief periods at CH-3 occurring in late spring and early summer, possibly indicating groundwater recharge with saline water stored in the unsaturated zone (Figure 7). The ranges and median concentrations of Cl, Br, and I in discrete samples of groundwater were smaller than those measured in runoff. Discrete sampling was unable to collect samples during the brief periods of relatively high SC at CH-3.

4.3. Temporal Sources of Chloride

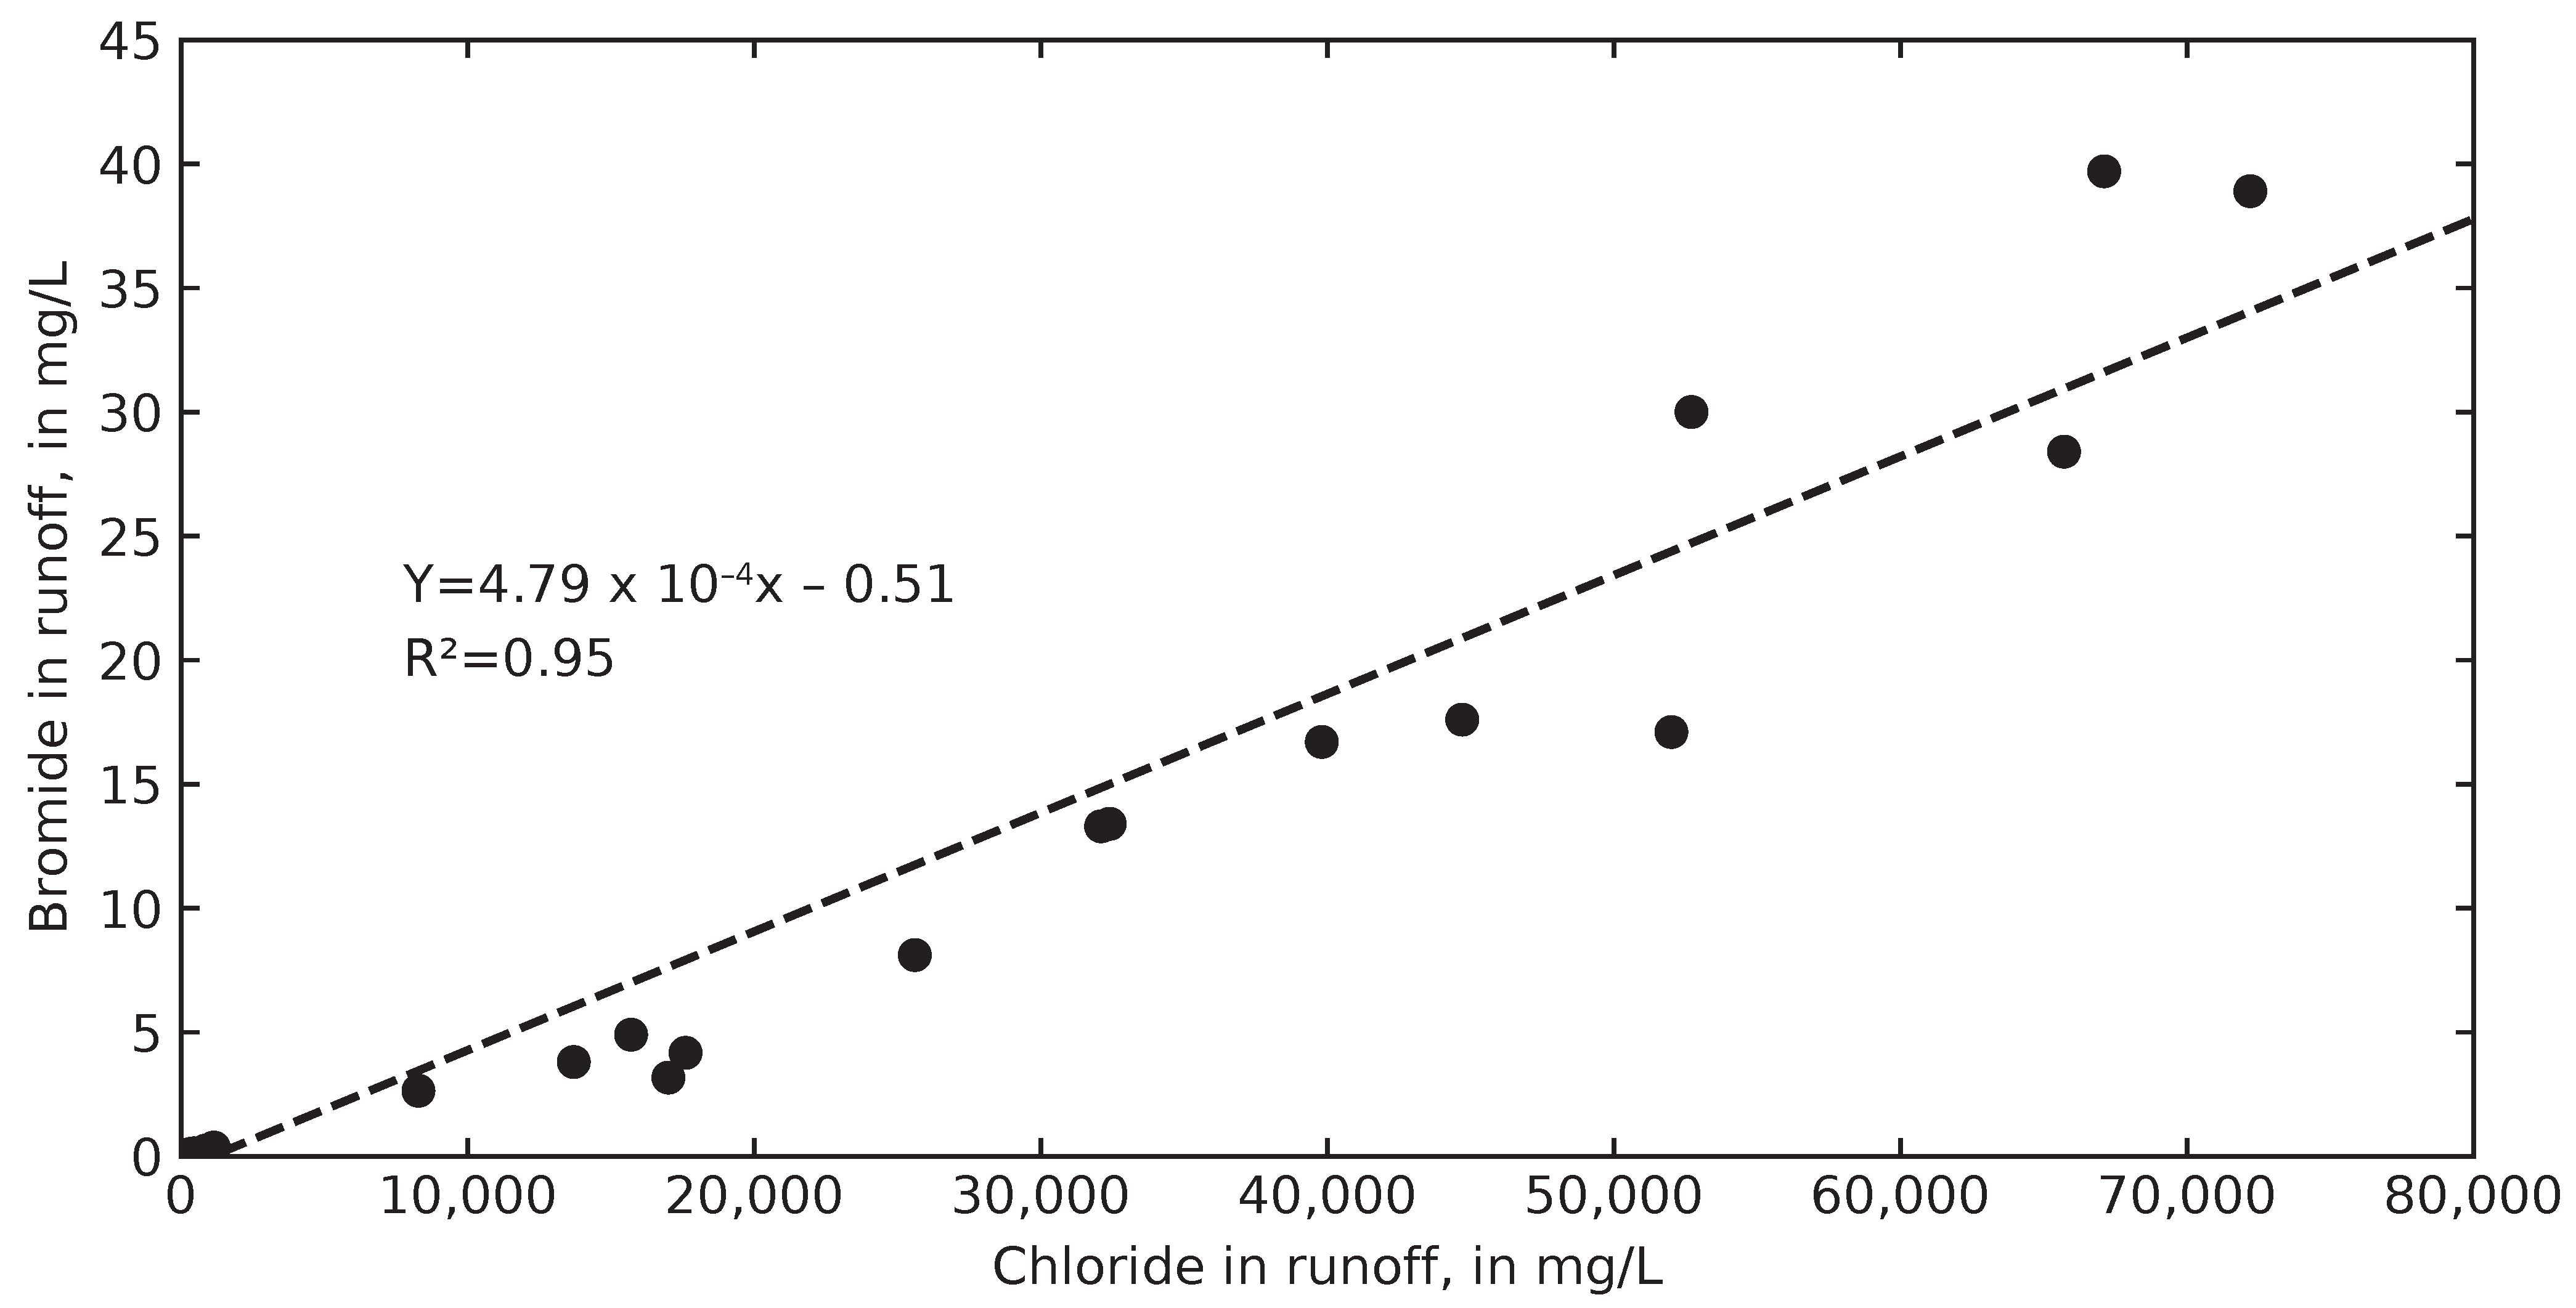
The coefficients of determination for plots of bromide and iodide concentration with chloride concentration in runoff indicated that most variability in bromide and iodide concentrations was related to variability in chloride concentration (Figure 8 and Figure 9). The correlation coefficients (r), computed from the coefficient of determination, indicated a very strong correlation of bromide and iodide concentration with chloride concentration in runoff (https://www.scribbr.com/statistics/correlation-coefficient/ (accessed on 27 January 2025)).
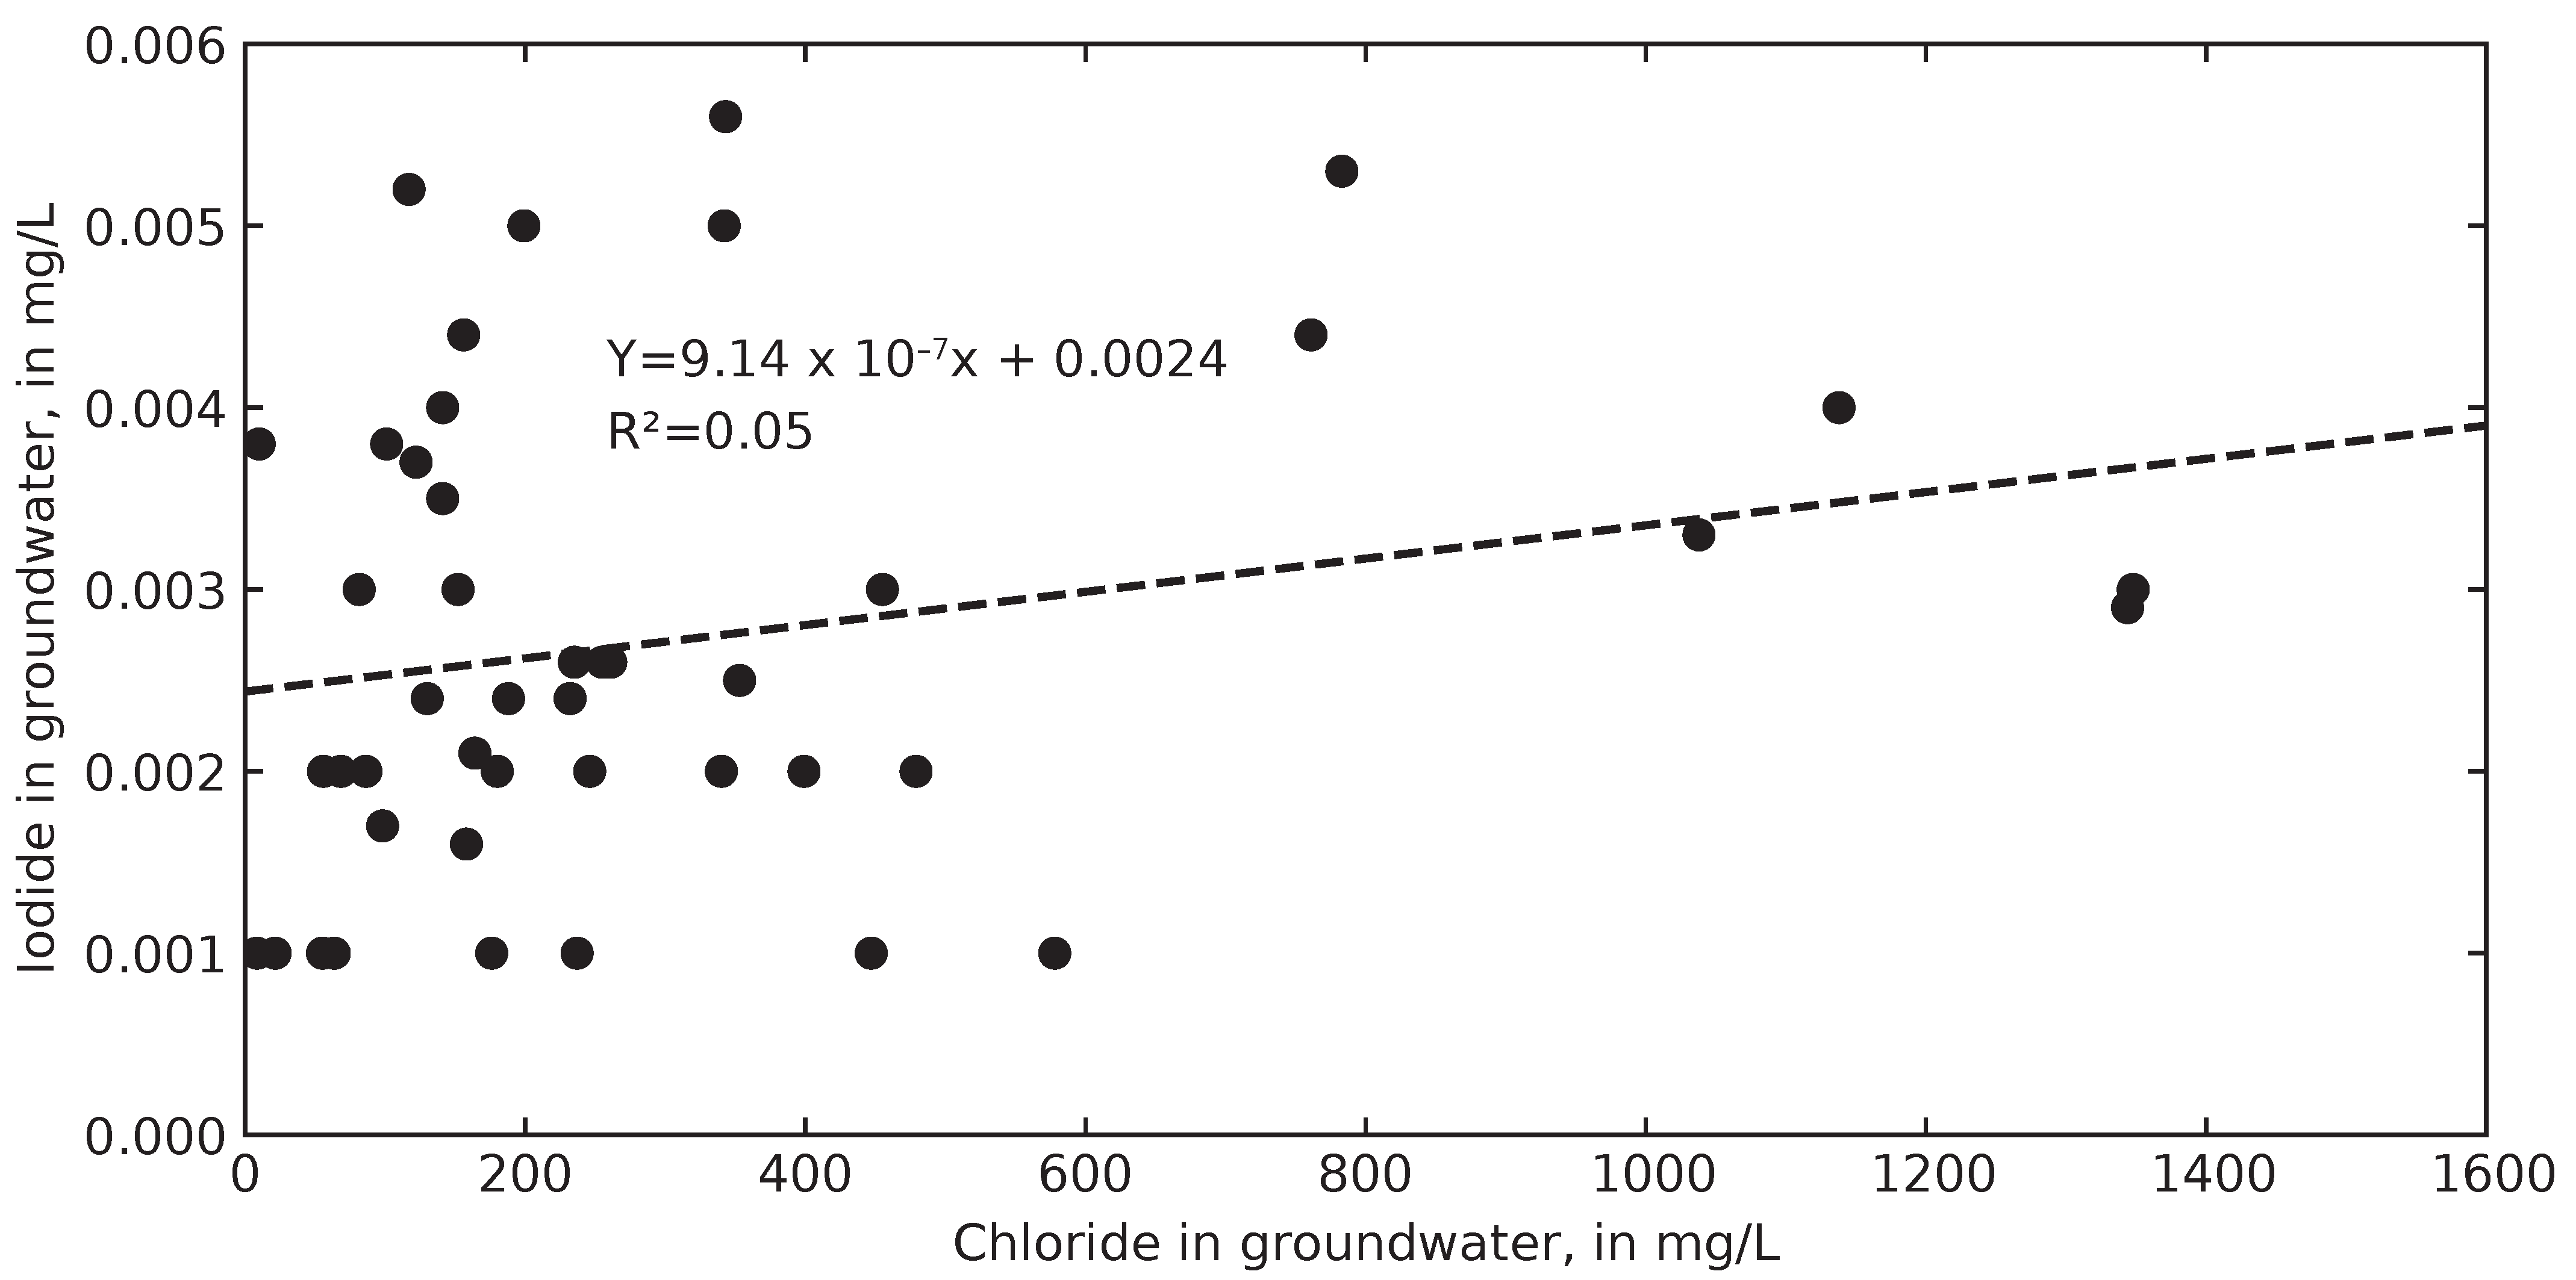
The coefficients of determination for plots of bromide and iodide concentration with chloride concentration in groundwater indicated that less than half of the variability in bromide and iodide concentrations was related to variability in chloride concentration (Figure 10 and Figure 11). The correlation coefficients (r), computed from the coefficient of determination, indicated a stronger correlation of bromide concentration with chloride concentration in groundwater than the correlation of iodide concentration with chloride concentration (https://www.scribbr.com/statistics/correlation-coefficient/ accessed on 27 January 2025).
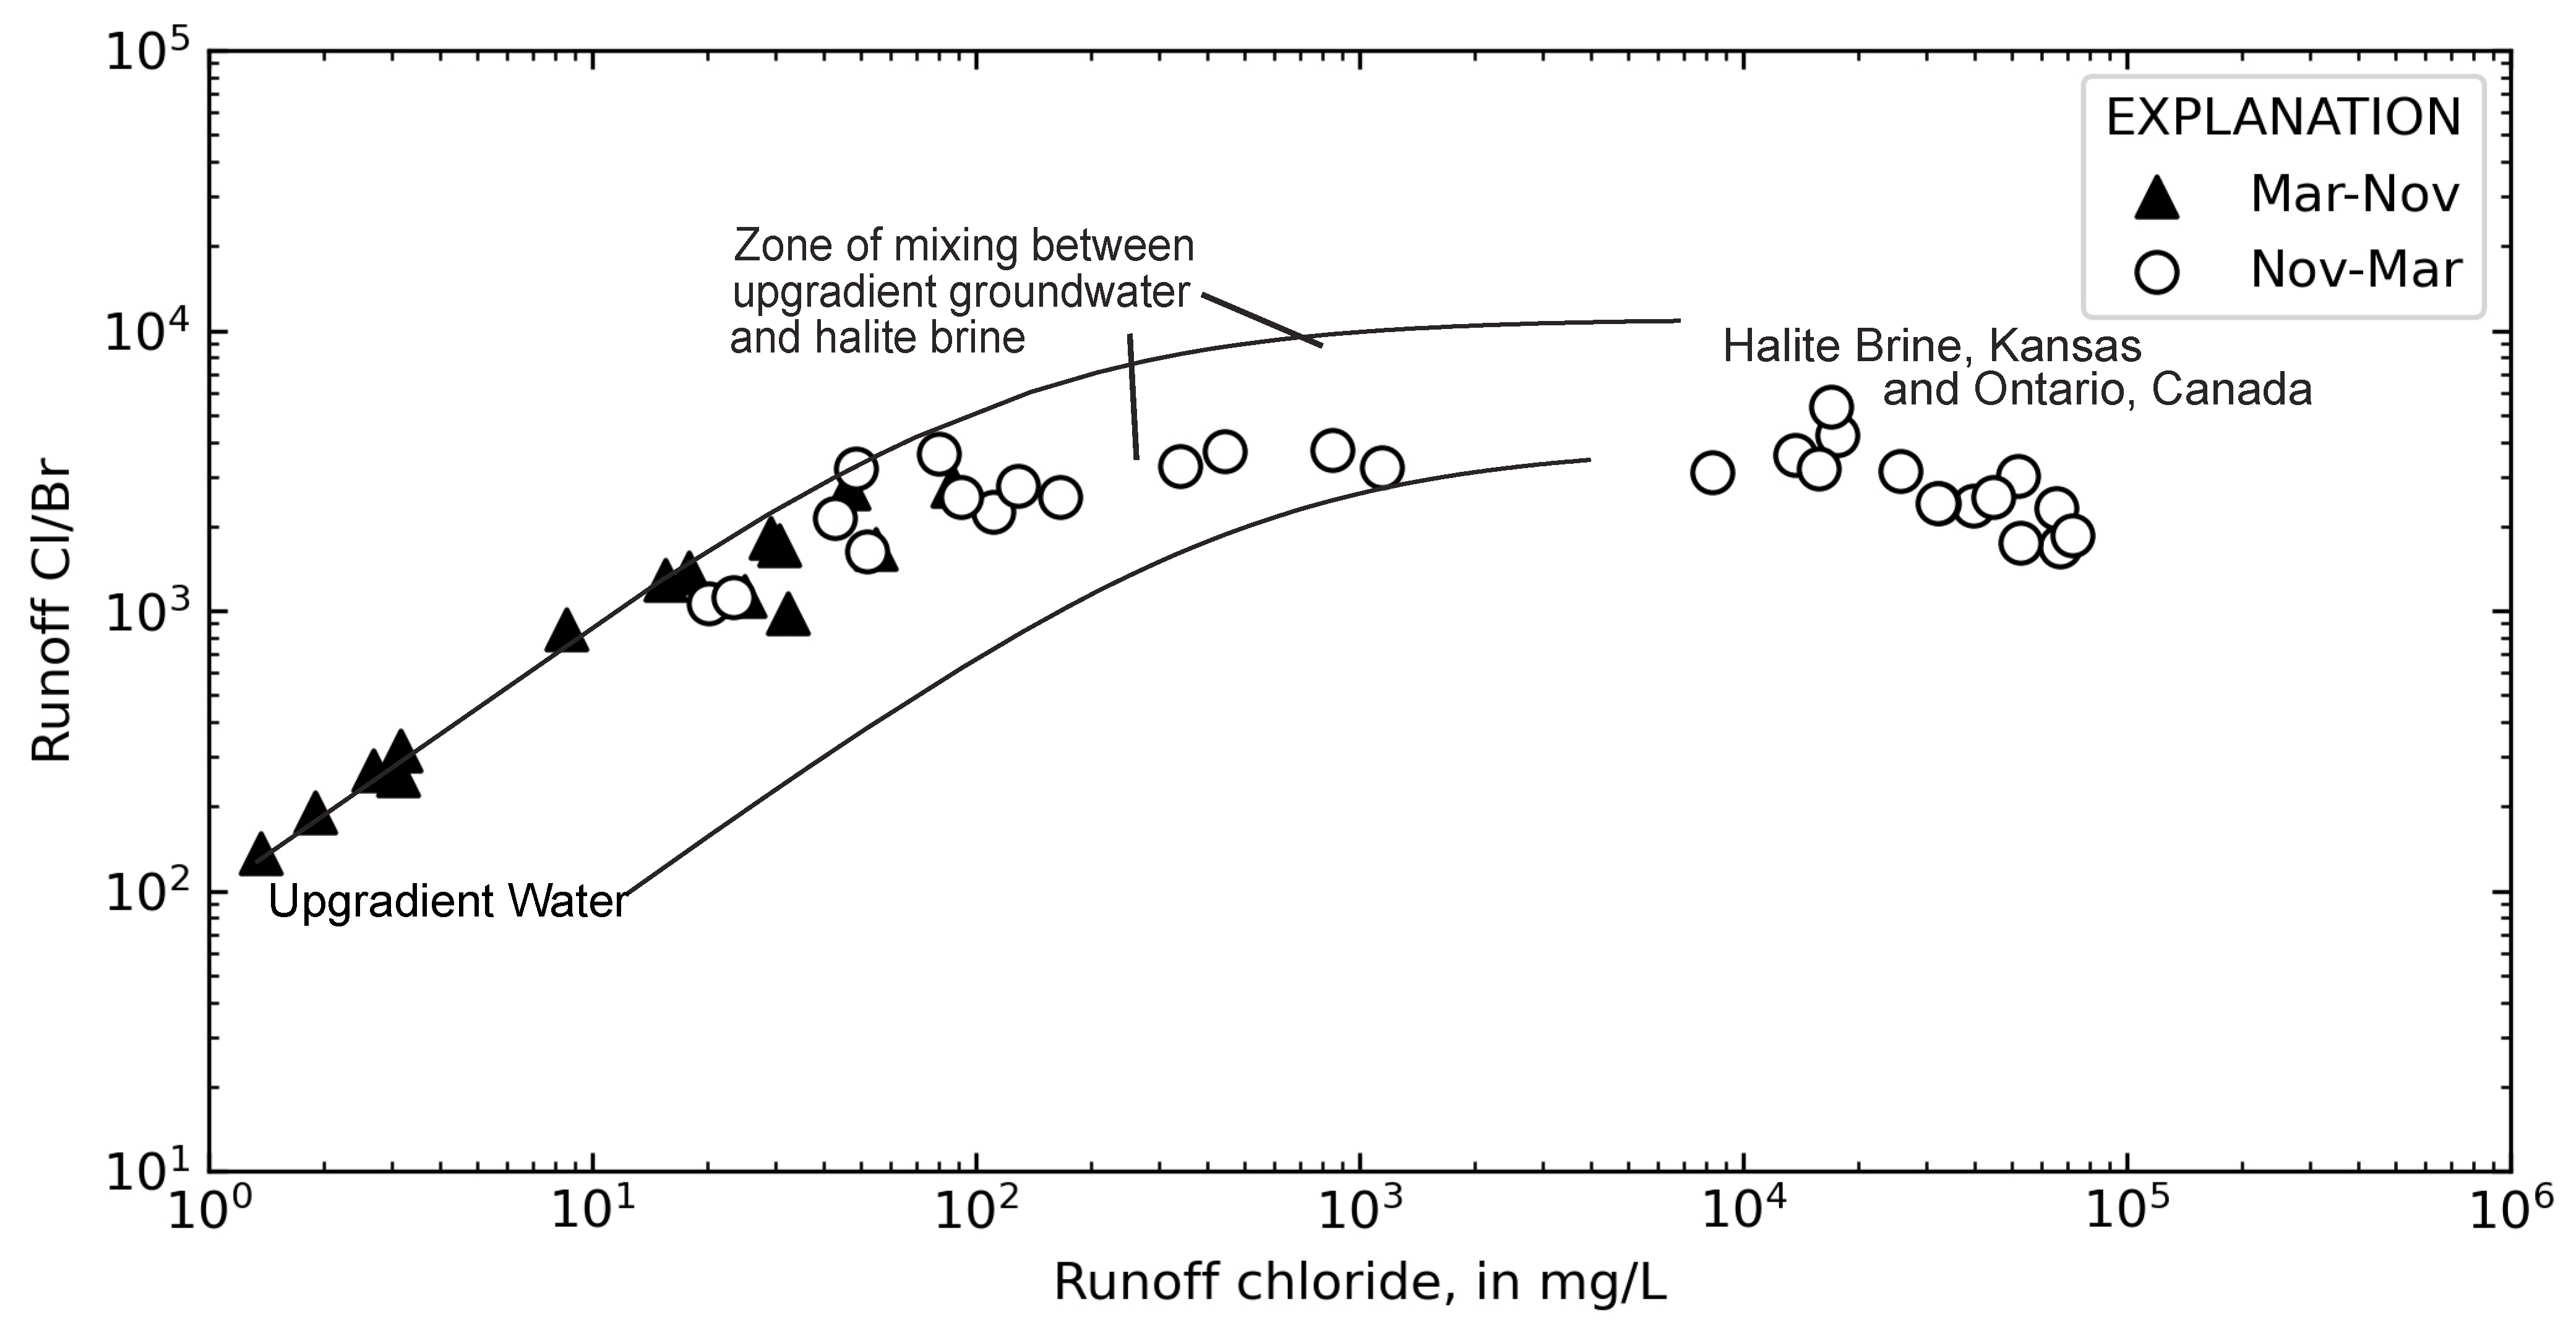
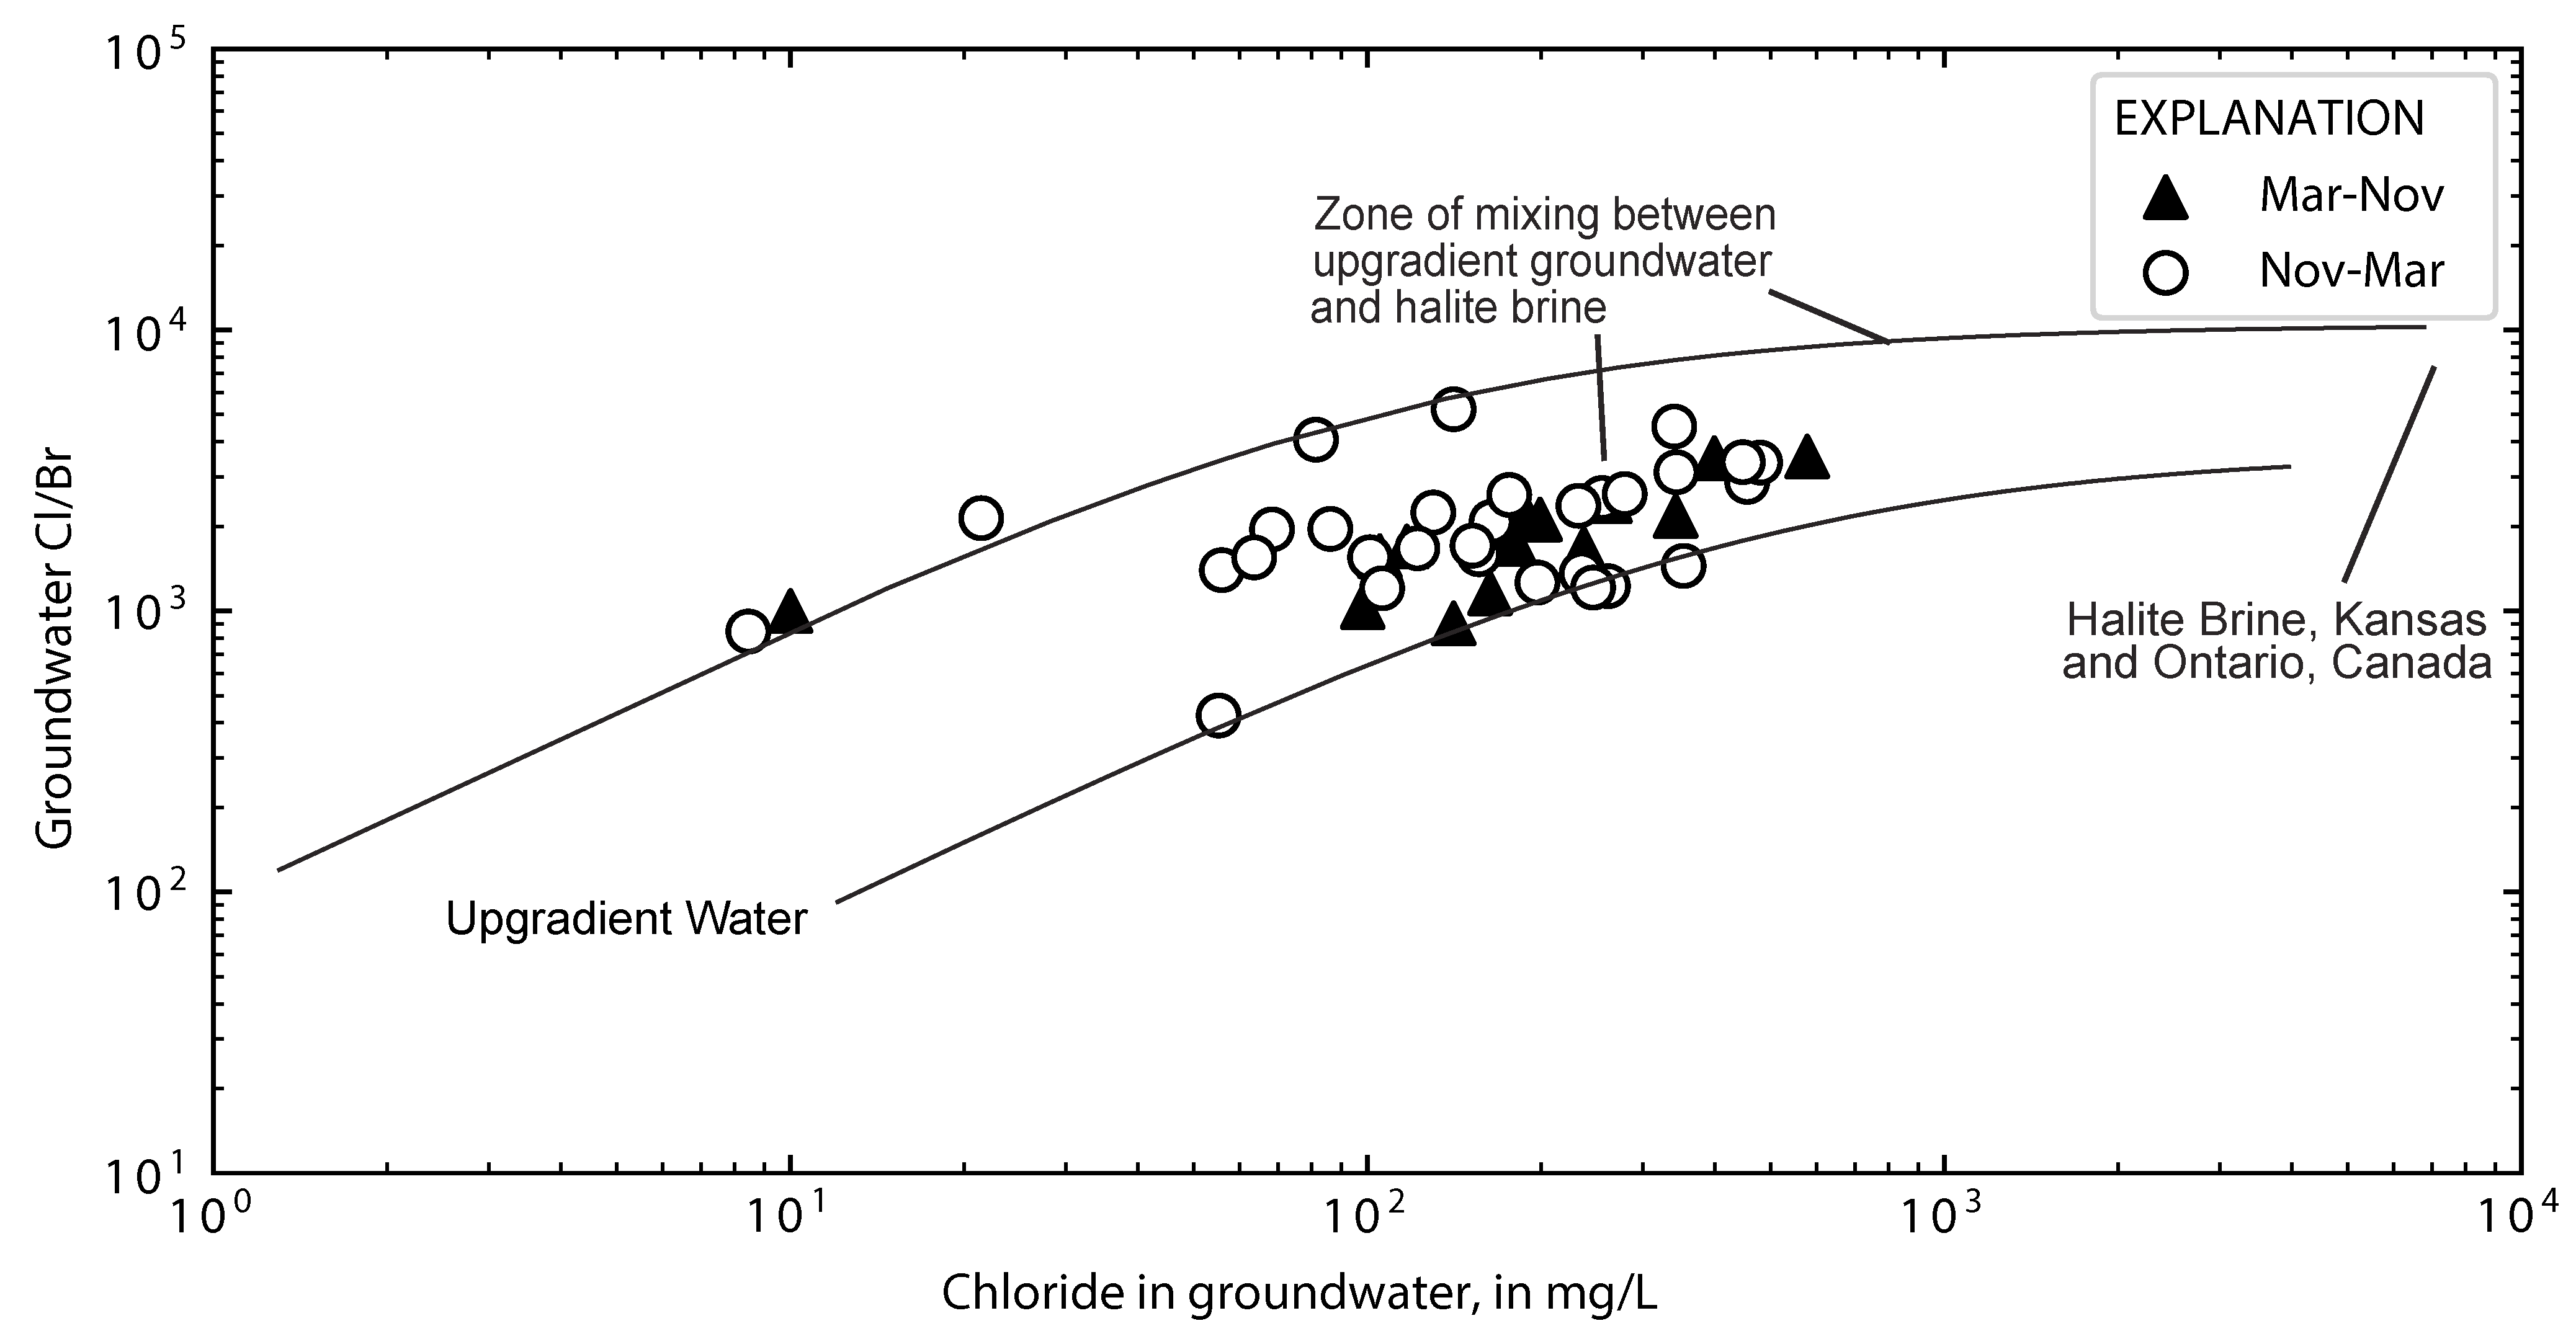
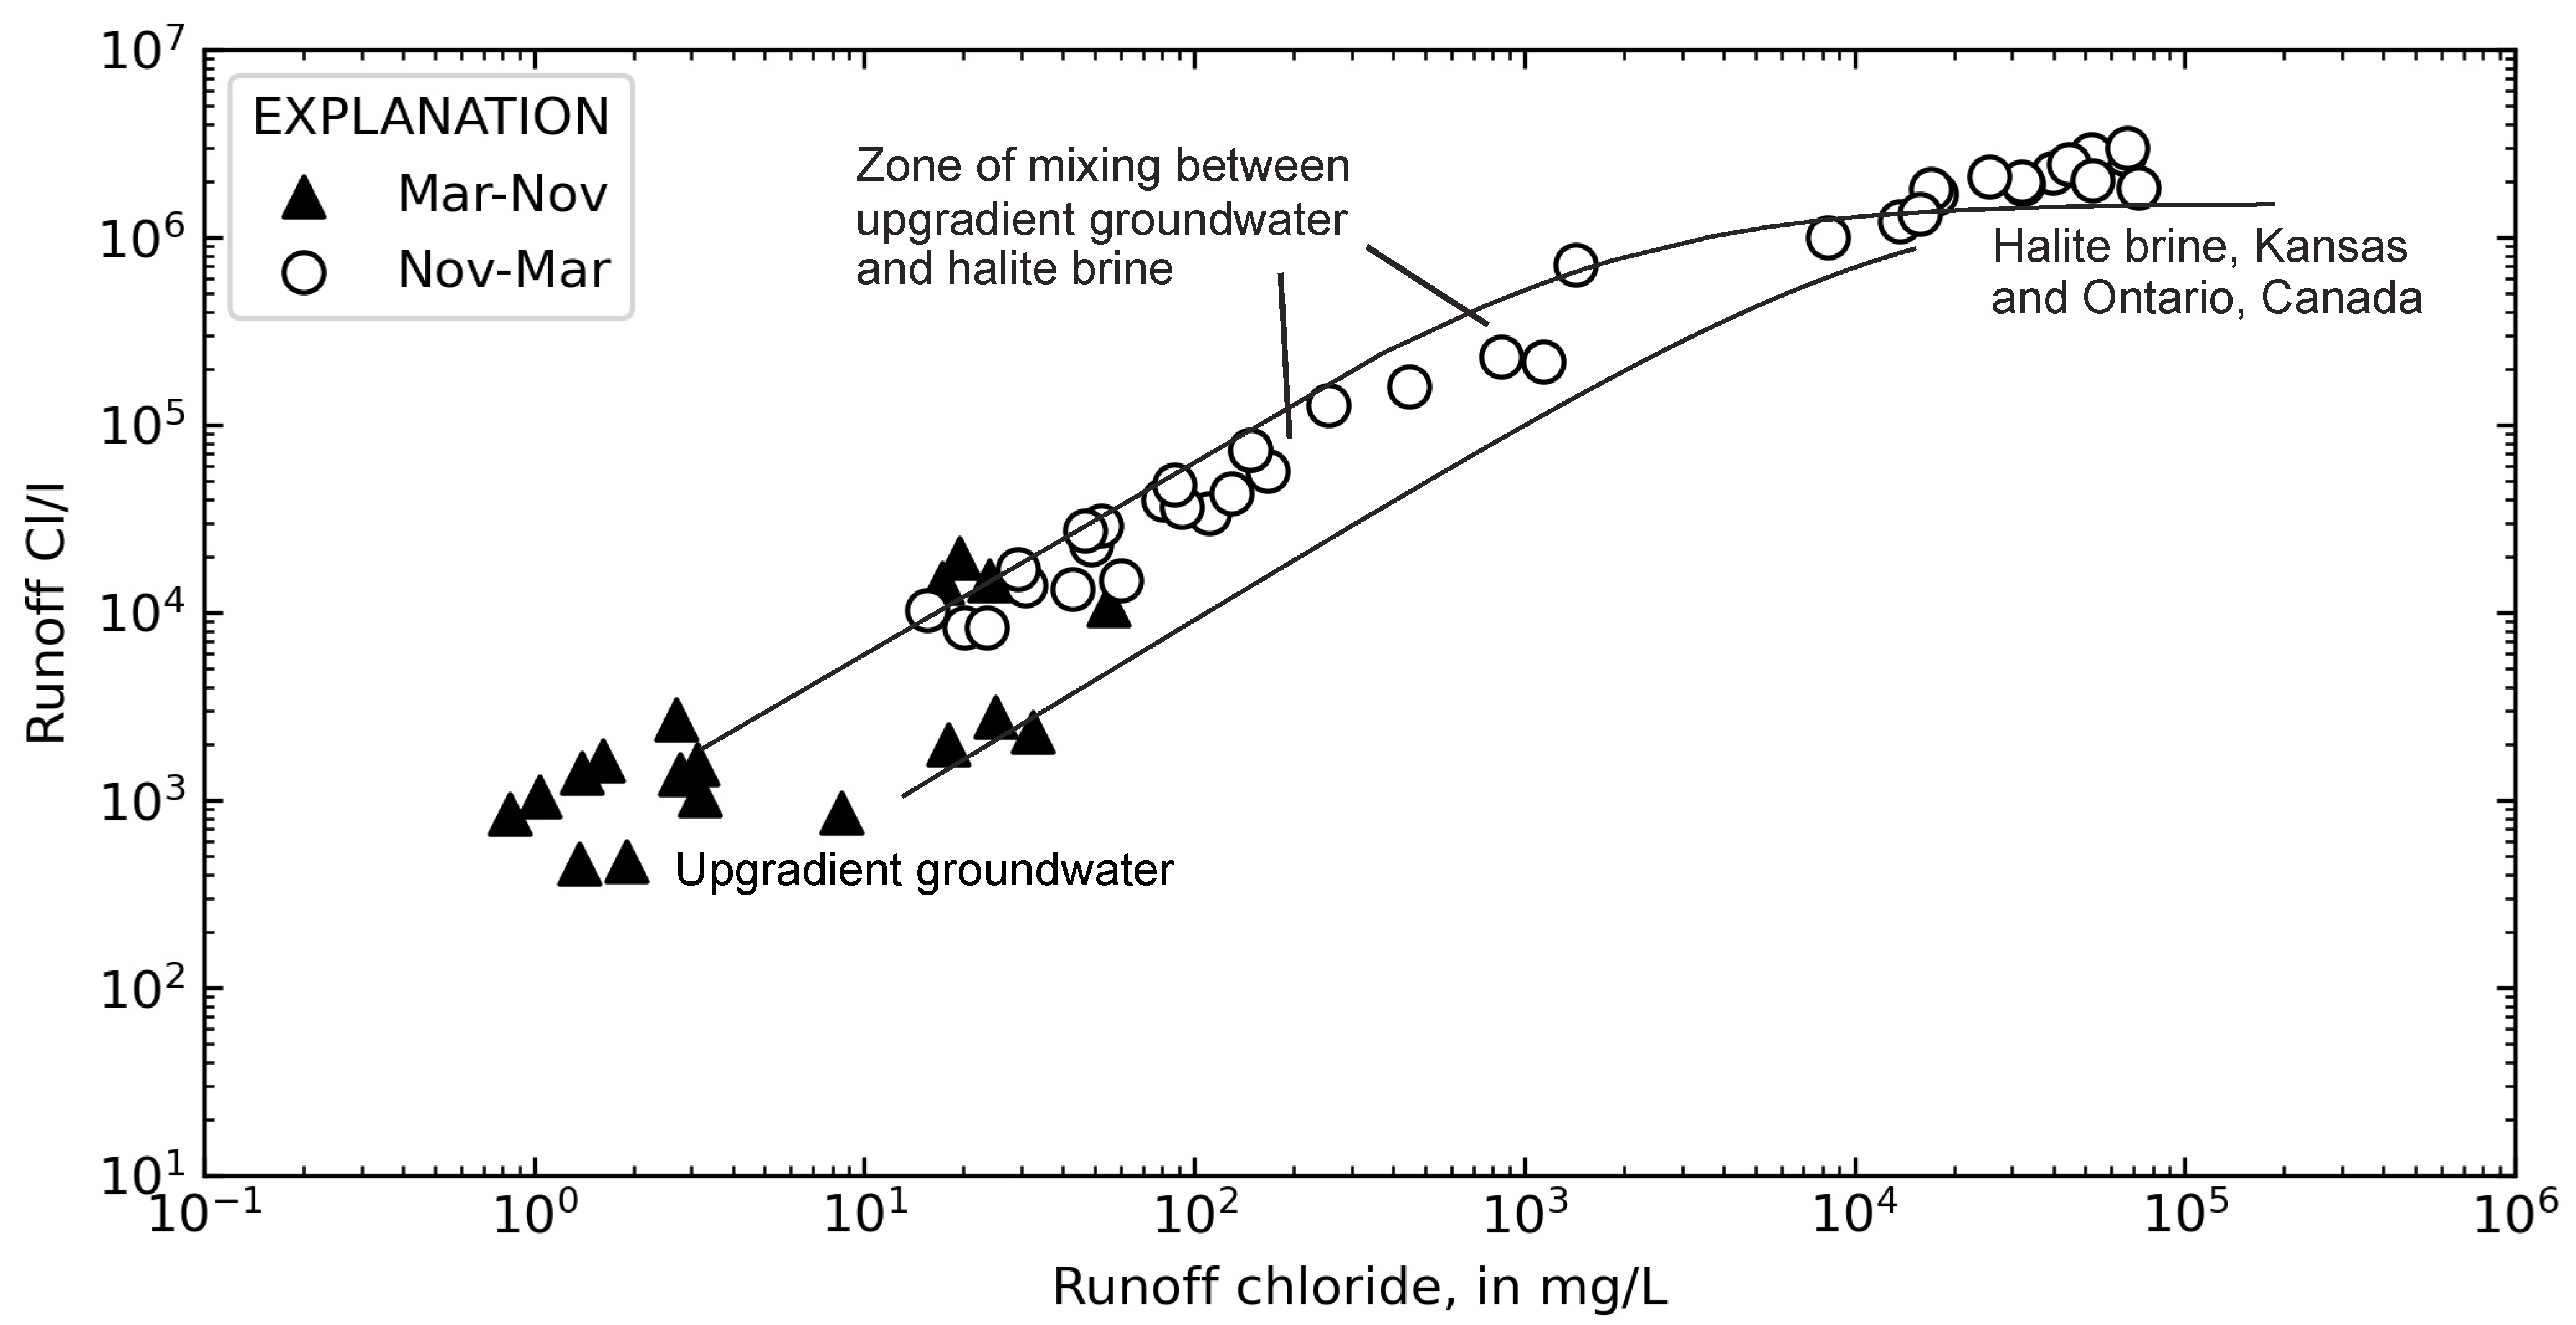
The temporal distribution of chloride sources in runoff and groundwater were examined using plots of Cl/Br and Cl/I with chloride concentration (Figure 12 and Figure 13). Plots of Cl/Br and Cl/I with chloride concentration in runoff indicated a halite source during the deicer application season (approximately November through March). The source of chloride during warmer months may be relatively constant throughout the year but be less apparent during the road salt application season. The source of chloride during warmer months is uncertain. The plots of Cl/Br and Cl/I with chloride concentration in groundwater indicated a less distinct source of chloride and possibly a mixture of sources. Sources of chloride in groundwater showed less seasonal variability than in runoff (Figure 14 and Figure 15).

4.4. Relating Chloride to Specific Conductance at Gary City Hall

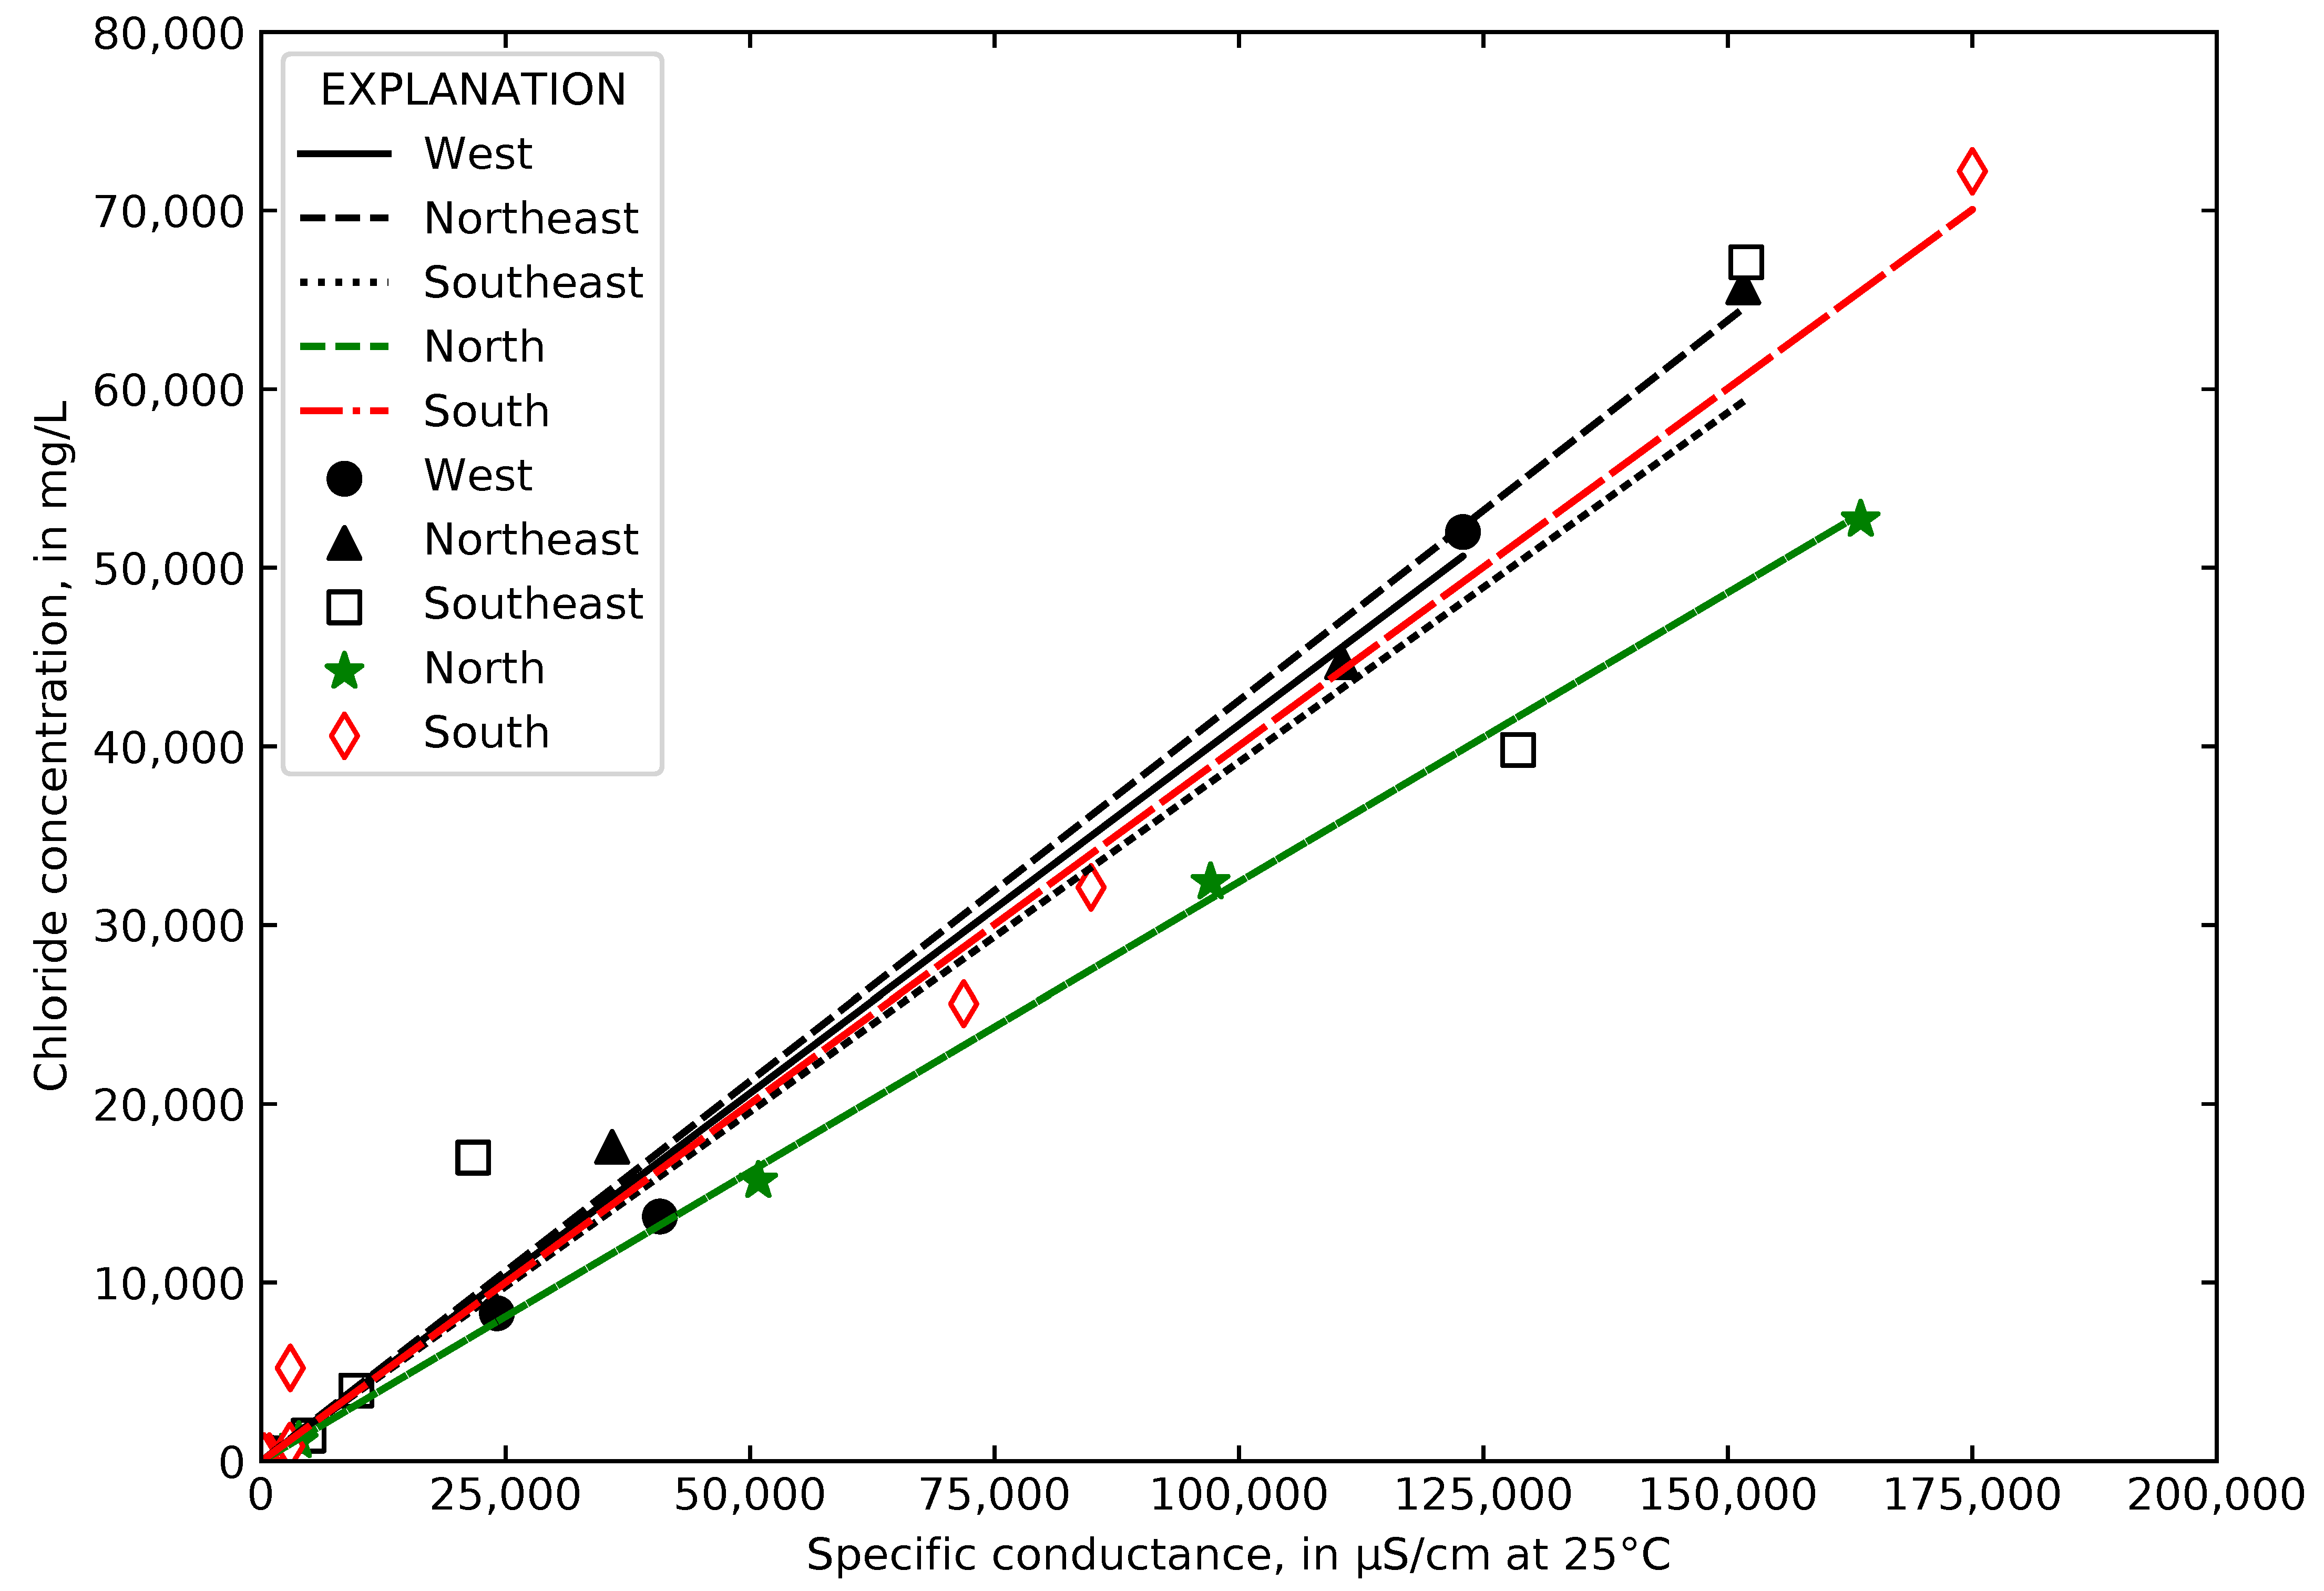
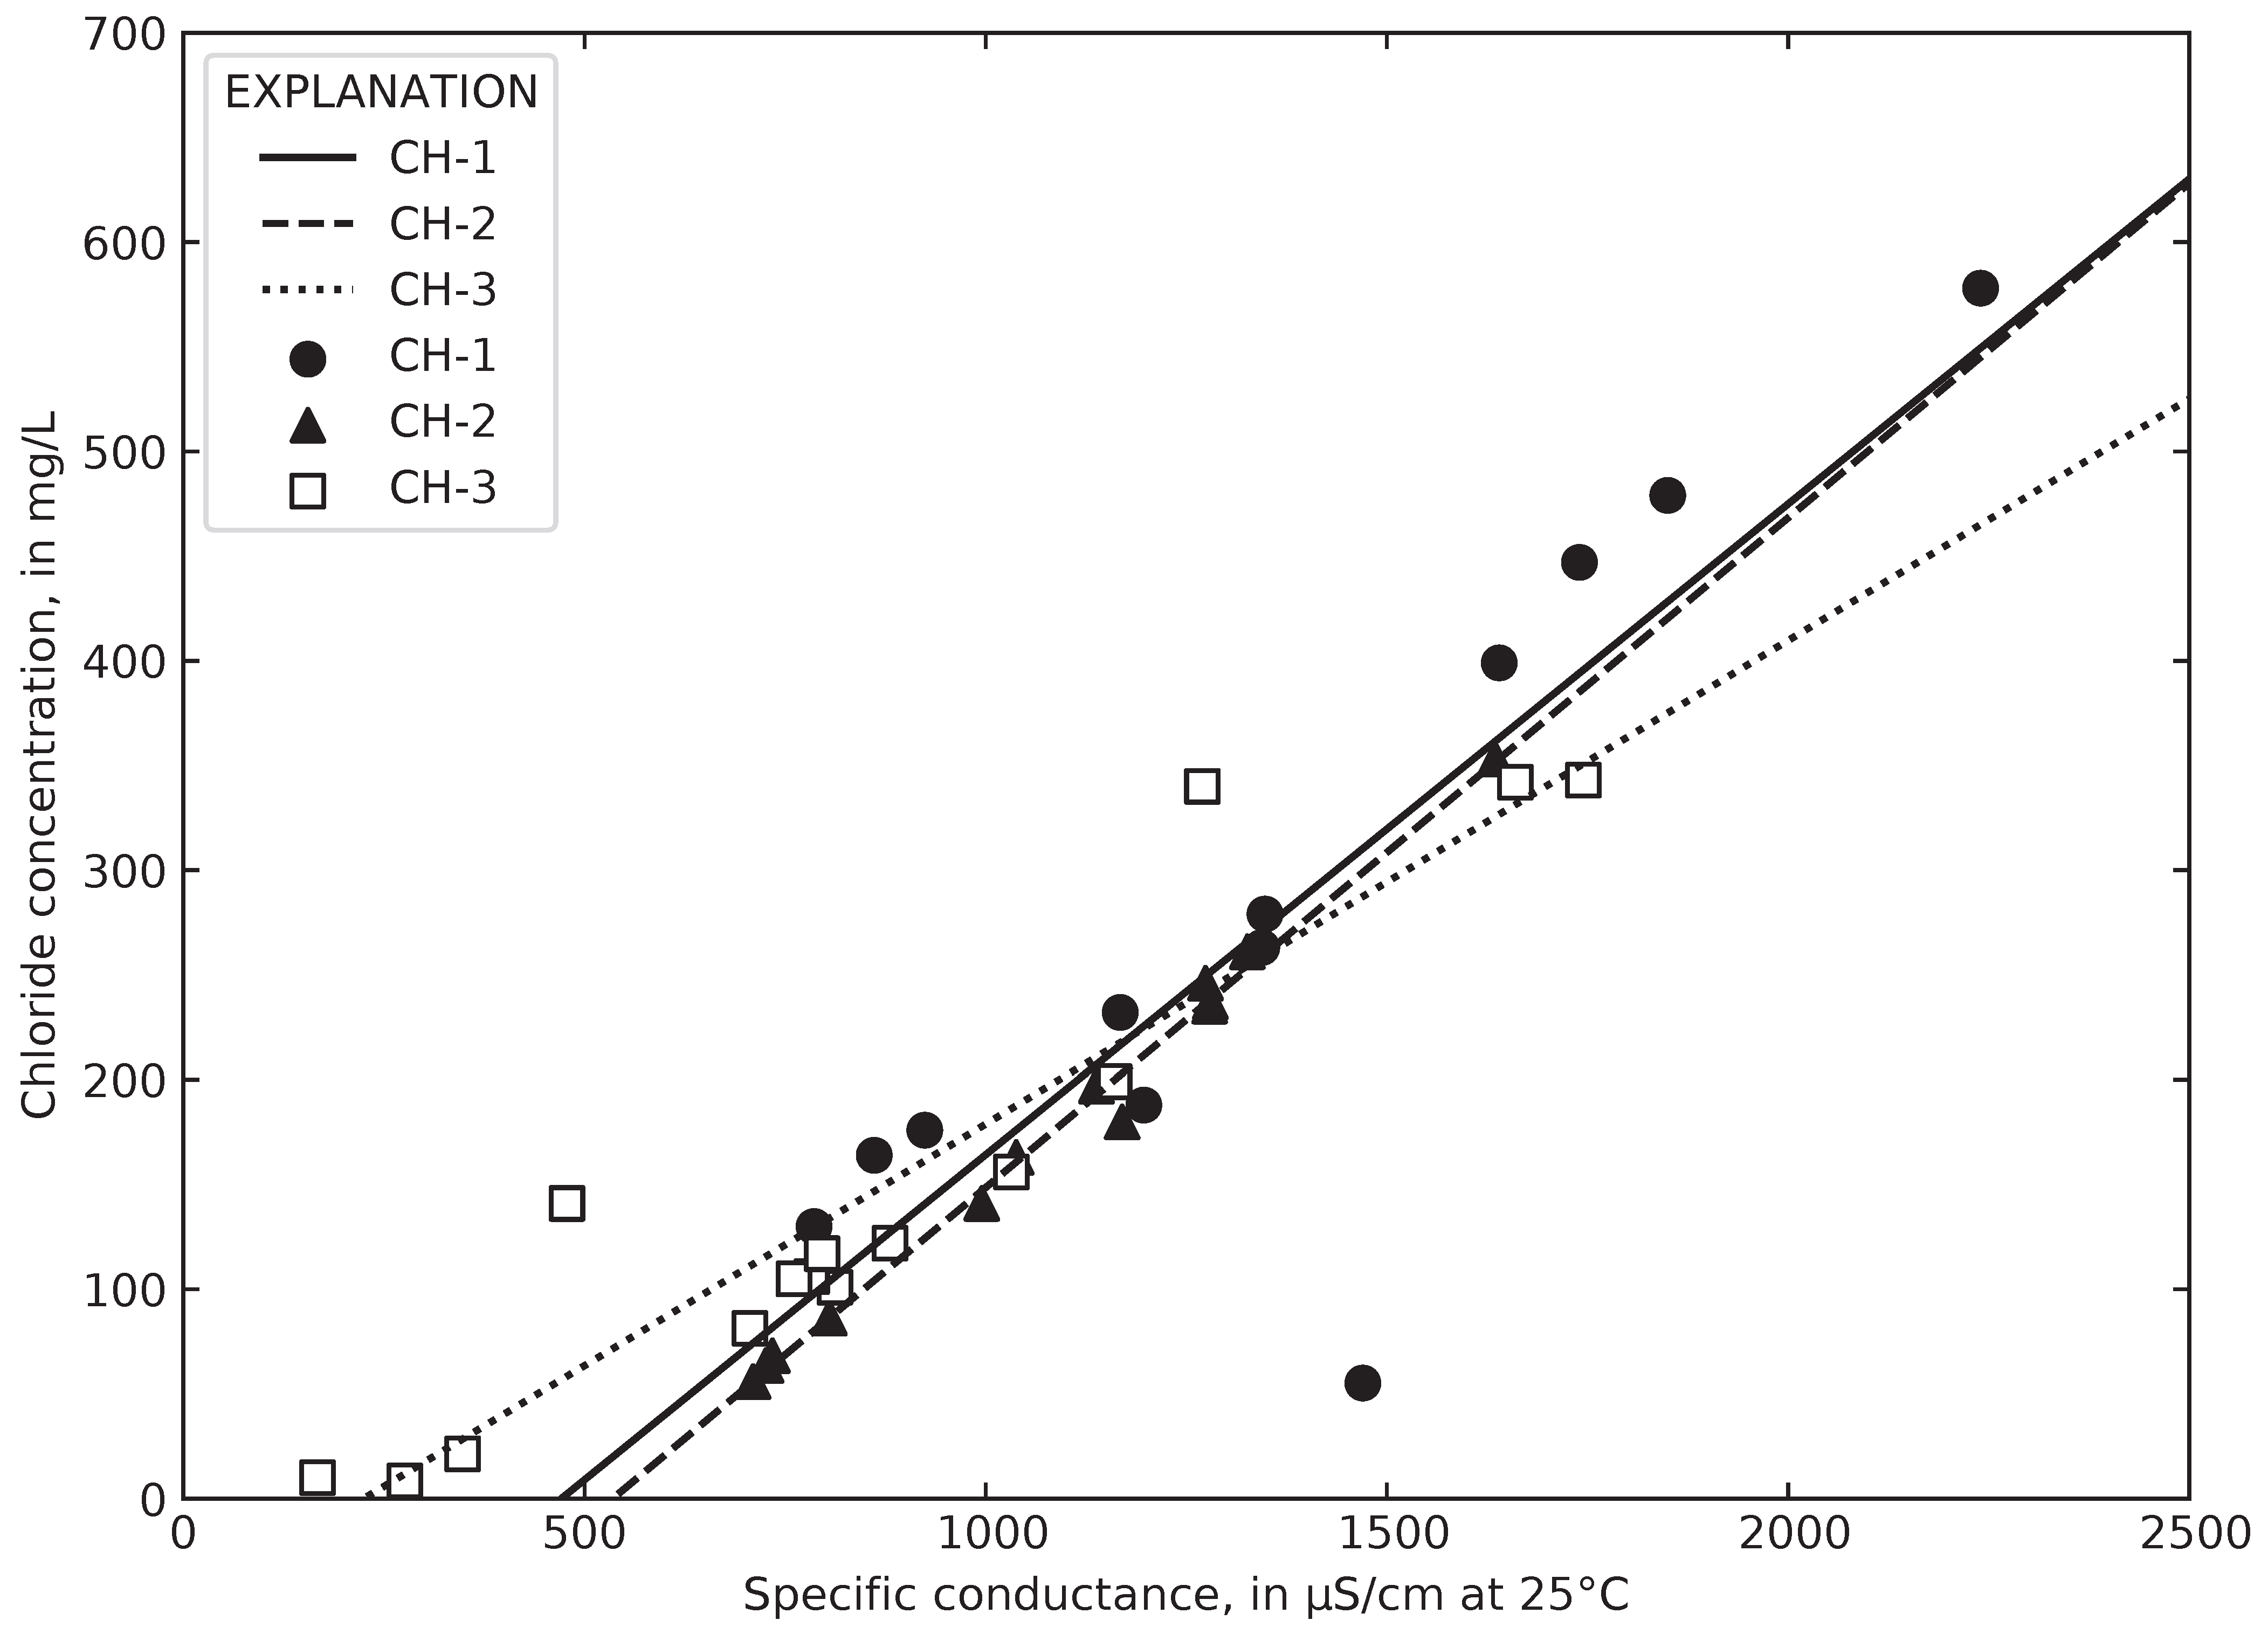
Least squares regression of chloride concentration in runoff measured at all flumes with synchronously measured specific conductance yielded a coefficient of determination of 0.98 and correlation coefficient of 0.99 and indicated a very strong correlation between chloride concentration and specific conductance (Figure 16; Table 2). Least squares regression equations of chloride concentration with specific conductance for wells CH-1, CH-2, and CH-3 yielded coefficients of determination of 0.72, 0.99, and 0.88, respectively (Figure 17; Table 2). The equations of lines for CH-1 and CH-2 were similar and visually distinct from the line for CH-3, indicating that the relationship between chloride and specific conductance varies slightly for the shallower water beneath the rain garden from groundwater deeper in the aquifer.
Least squares regression lines were not required to pass through the origin for groundwater data as the specific conductance values and water-quality data throughout the year indicated that non-chloride solutes were present and affecting the specific conductance measurements. Least squares regression lines relating chloride and specific conductance, unlike for groundwater data, were required to pass through the origin for flume data as the specific conductance and water-quality data indicated very small contributions of ionic solutes to samples collected at the flumes during warmer months. Coefficients of determination ranged from 0.96 to 0.99. The slope of data collected at the North flume was less than at the other four flumes and may be evidence that an ionic non-chloride deicer like calcium magnesium acetate was used on the City Hall sidewalk and steps, resulting in chloride concentrations that were lower at the same specific conductance value compared to other flumes. No information is available on the volumes or type of deicer used on the sidewalk or steps.

4.5. Computed Chloride Concentrations and Total Road Salt Mass in Collected Runoff

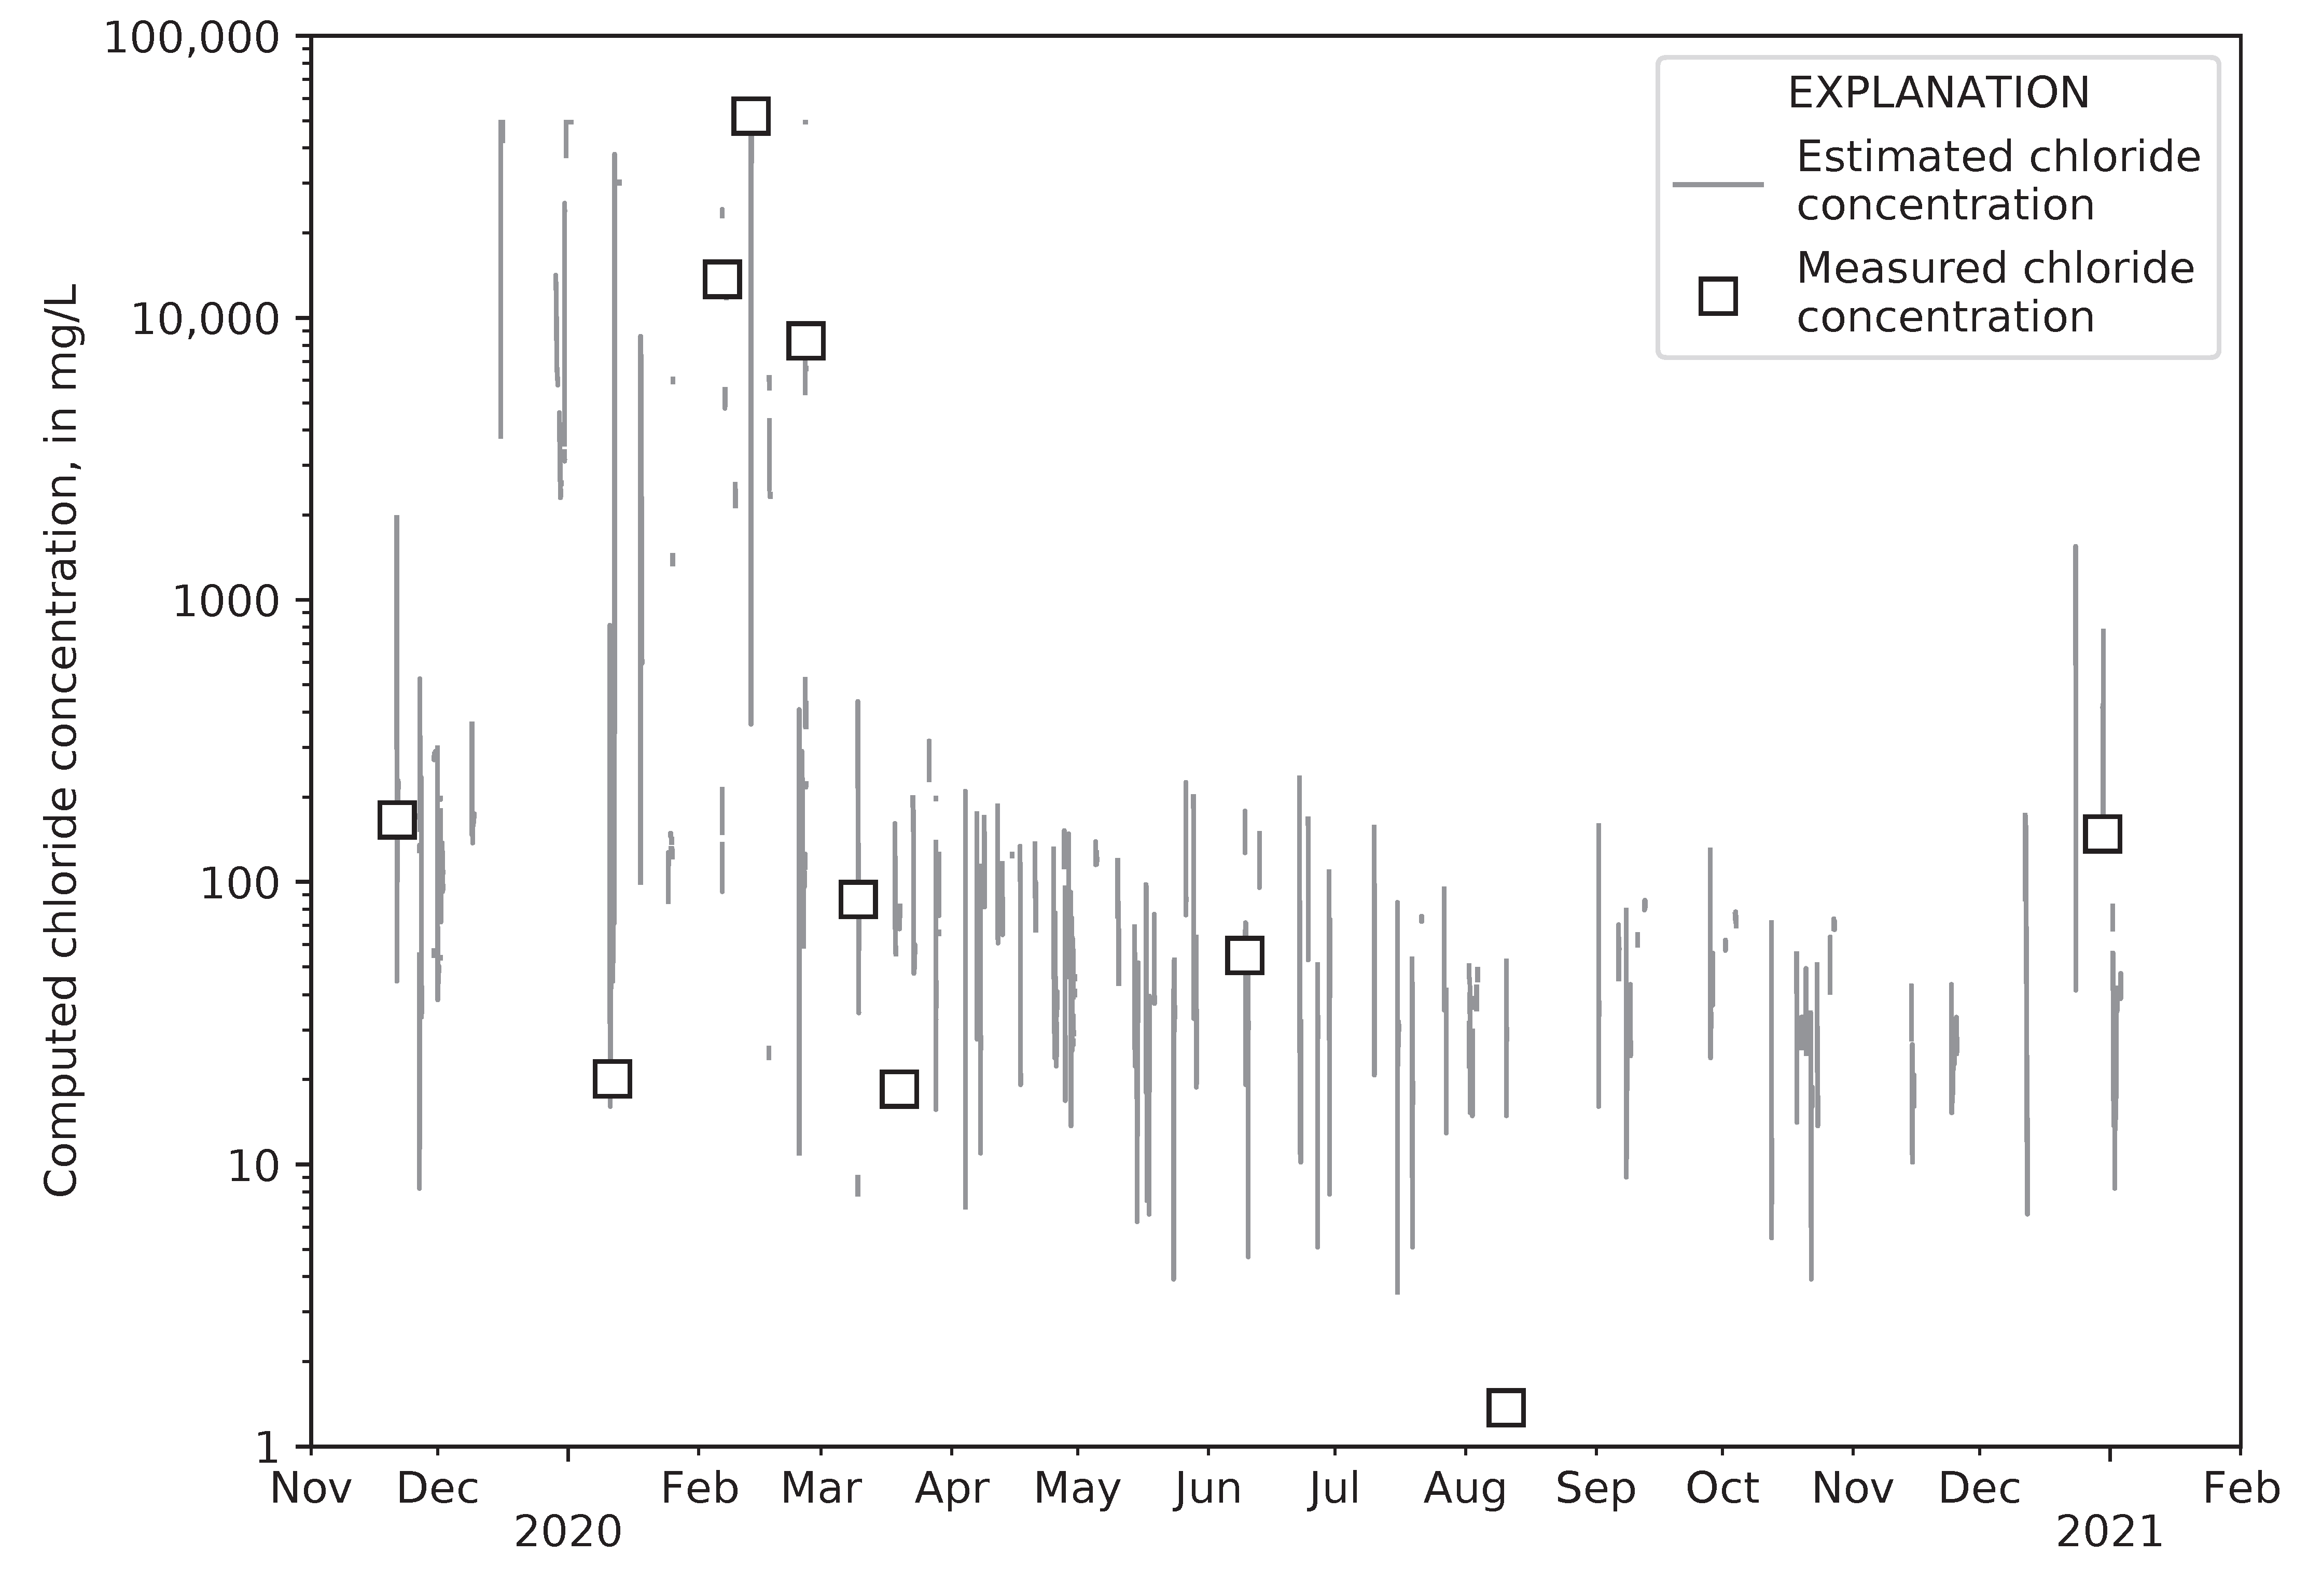
The equations in Table 2 relating instantaneous, field-measured specific conductance to chloride concentrations were used to compute the concentration of chloride discharged to the rain garden in runoff through each of the five flumes. Chloride concentrations in discrete samples and estimated from continuous specific conductance data compared favorably; a plot showing both is provided as an example (Figure 18). Concentrations of chloride were notably lower during the deicer application season of 2020–21 compared with the deicer application season of 2019–20. Gary City Hall was largely unoccupied during the COVID-19 pandemic, and maintenance of the parking area, including road salt application, was minimal based on visual inspection of conditions in 2020–21 as compared to the previous deicer application season, despite higher snowfall during 2020–2021.
The total mass of road salt collected by each flume was computed from Equation (2), and the total mass collected by the rain garden was the sum of the total mass collected at the five flumes (Table 3). The mass of NaCl collected by the rain garden (the sum of the five flumes) during the monitored period was 1490 kg. This represents a conservative estimate, as some runoff circumvented the edging that separated the parking area from the rain garden and was not measured at the flumes. Reduced application to roadways and parking surfaces during the 2020–21 deicer application season resulted in decreased road salt being collected by the rain garden, from 1297 kg to 159 kg. The total amount of collected road salt computed for this study, therefore, was mostly applied during a single deicer application season in Gary, Ind. The total amount of NaCl collected by flumes during the period between application seasons was 32.7 kg.

4.6. Computed Chloride Concentrations in Groundwater

Equation (1), relating instantaneous, field-measured specific conductance of groundwater to chloride concentrations measured in samples of groundwater, was used to compute the continuous concentration of chloride in monitoring well CH-3. Chloride concentrations in discrete samples and estimated from continuous specific conductance data compared favorably (Figure 19). Estimated chloride concentrations were notably less than concentrations estimated in runoff and indicated dilution by direct precipitation on the rain garden and by ambient groundwater. Peak concentrations occurred during spring and summer months as infiltrating precipitation transported chloride detained in the unsaturated zone to groundwater.

4.7. Soil Chemistry

Soil analyses showed notable increases in chloride and sodium concentrations from summer 2020 to spring 2021 in 33 of 36 samples, indicating the effects of deicer-affected runoff on rain garden soils. Soil analyses showed decreases in chloride and sodium concentrations (from spring 2021 to summer 2021) in 35 of 36 samples. The highest average concentrations of chloride and sodium and the highest bulk conductivity values were measured in the shallower soil samples throughout the year.
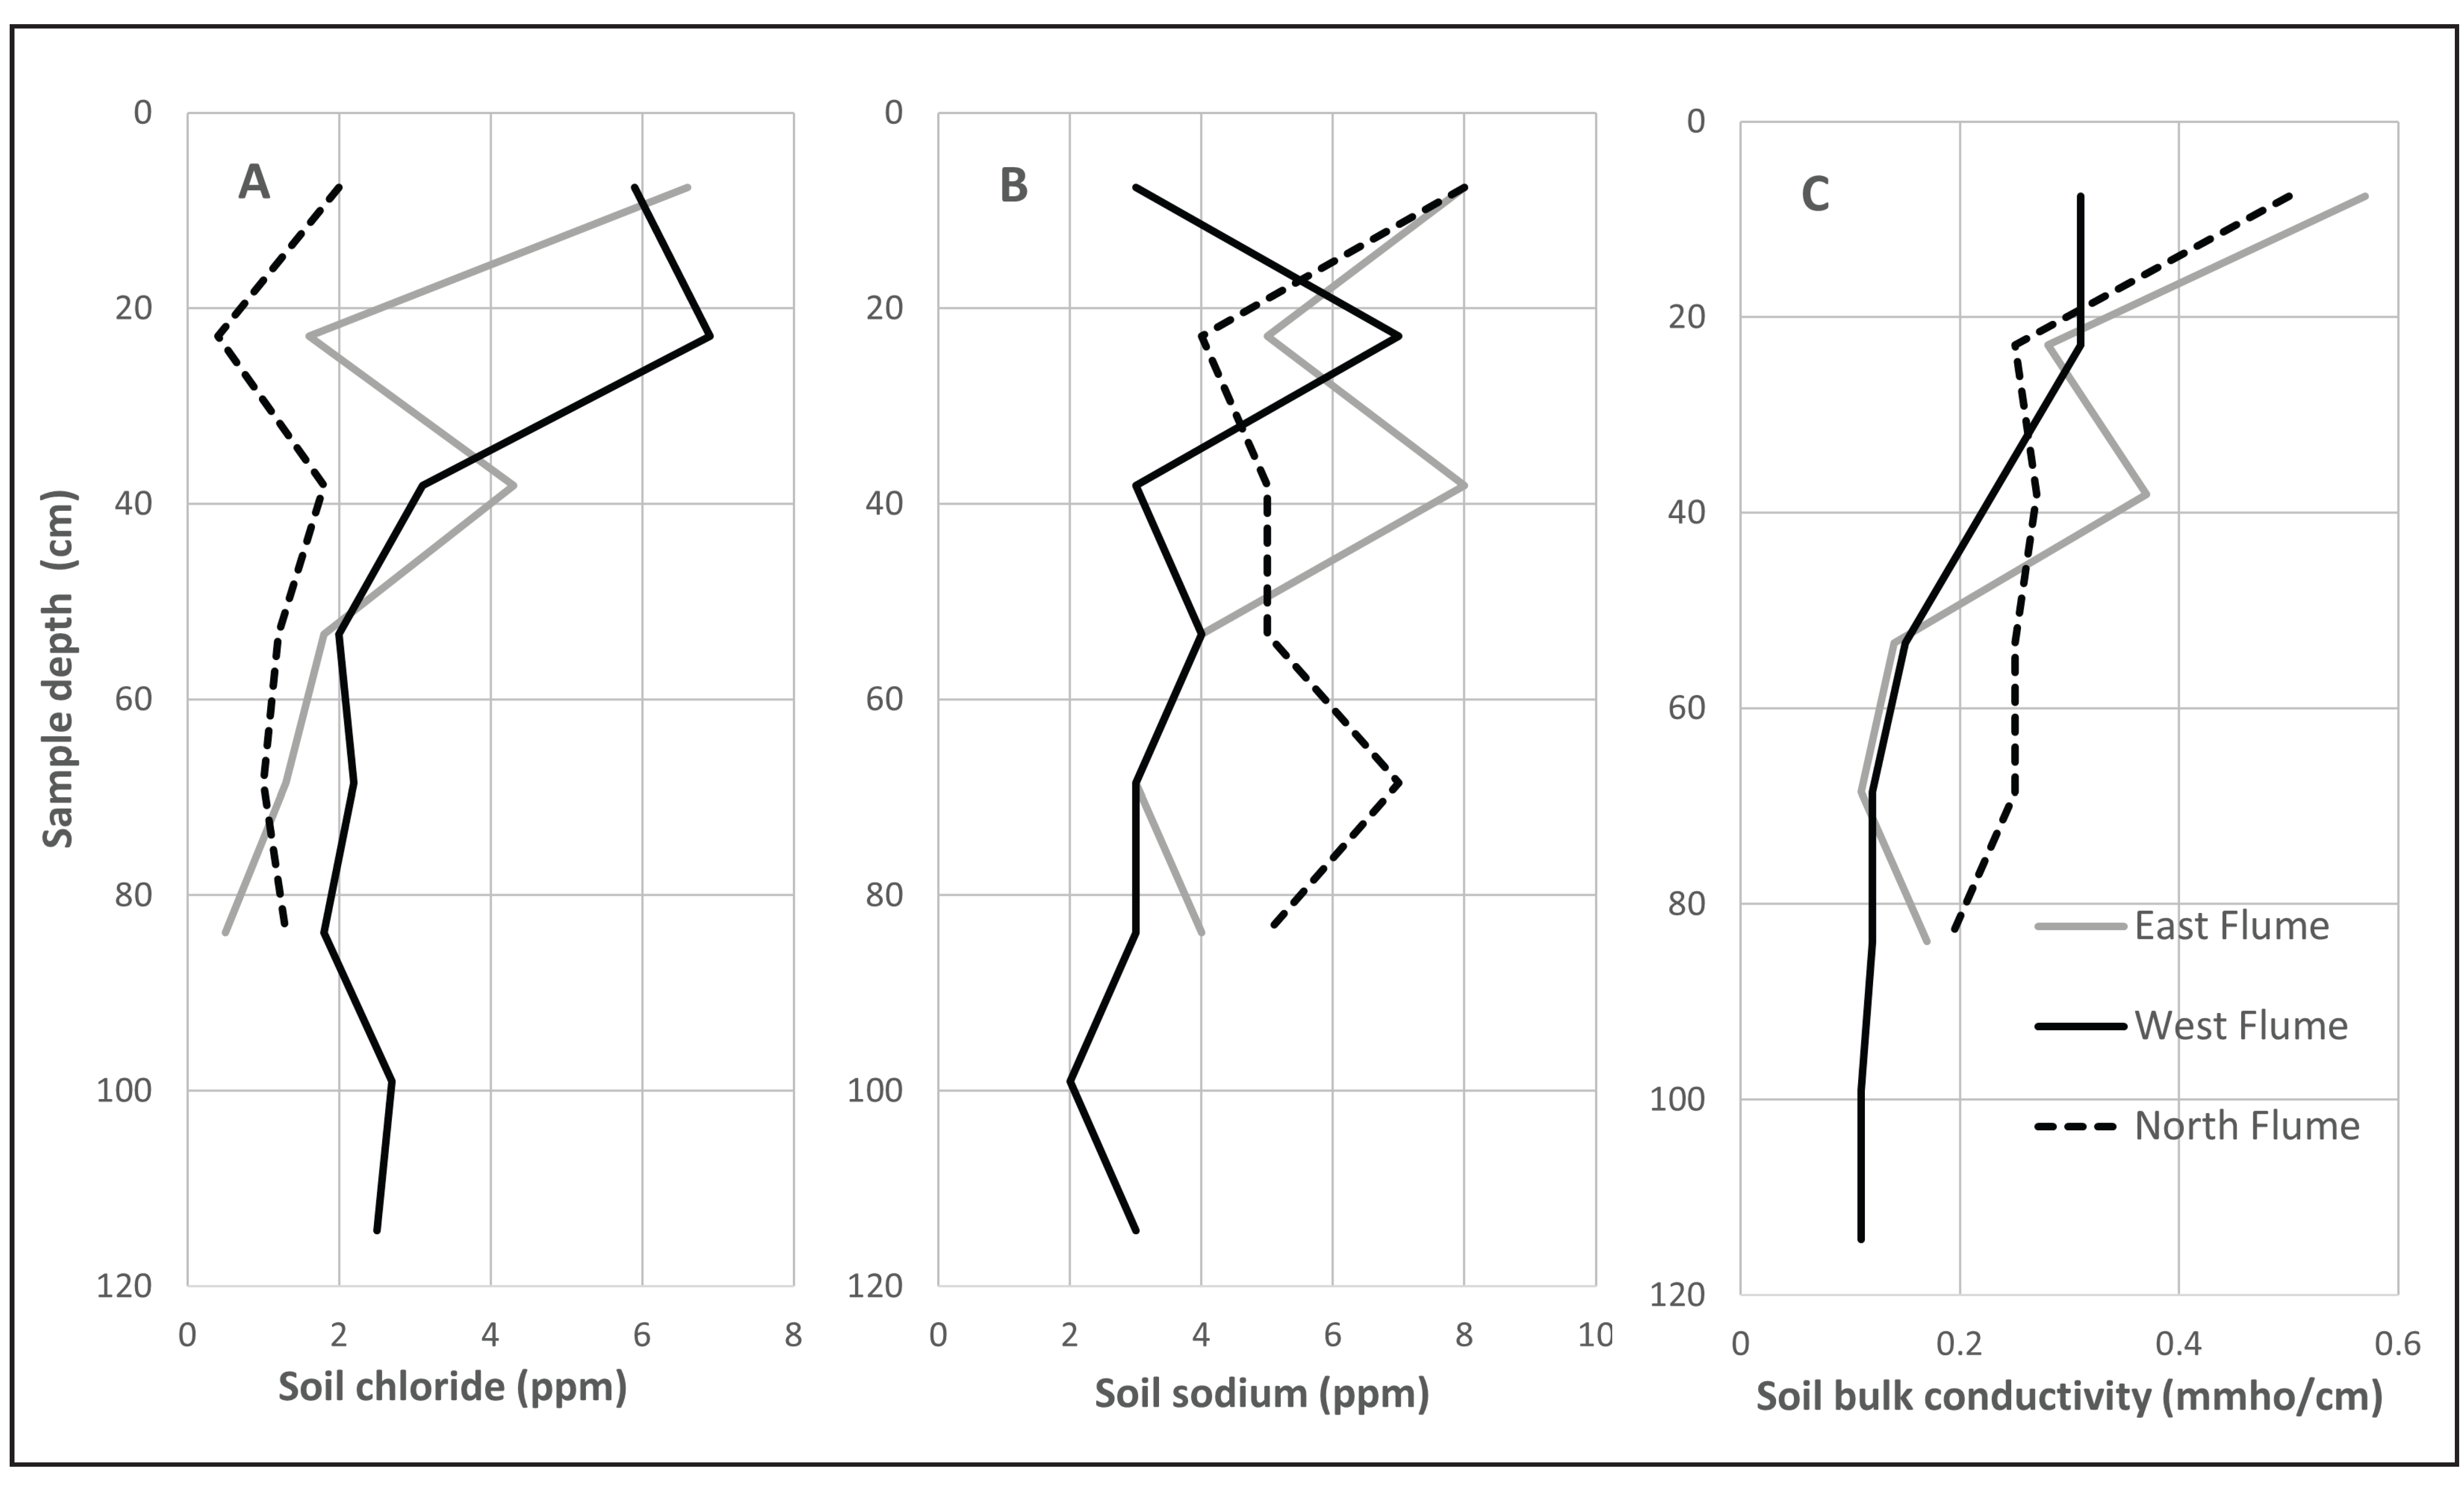
Rain garden soil chemical properties indicate seasonal variability with respect to sodium and chloride, but do not suggest accumulation of road salt constituents within the infrastructure. A seasonal analysis of soil chemistry between summer 2020 and summer 2021 indicates that road salt constituents accumulate in the rain garden during deicer application season and spring seasons but are flushed from the soil column by late summer. Compared with spring 2021 soil samples, samples collected during summer 2020 and summer 2021 have chloride and sodium concentrations that are reduced by an order of magnitude. Soil bulk electrical conductivity measured in summer samples is half that of samples collected in the spring. Soil chemistry profiles are established based on samples collected between the upper 0.15 and 1.2 m (6 and 48 inches) below the surface of the rain garden at the Northeast, North, and West flume monitoring sites. These profiles indicate a general reduction in chloride, sodium, and bulk electrical conductivity with depth (Figure 20). Soil sodium concentrations are slightly higher between 0.6 and 0.9 m (24 and 36 inches) at the North flume site when compared to the East and West flume sites, and this may be caused by lateral movement of solutes toward the rain garden drain that is located near the North flume [33].
Whereas the accumulation of road salt constituents impedes the establishment of native plant species, the retention of soil organic matter is a primary soil determinant for sustaining or increasing plant productivity [42]. Soil organic matter either increased or stayed constant at 30 of 36 sample locations between the summer of 2020 and the summer of 2021 (Figure 21). Soil organic matter is typically at a minimum during summer months [43], further supporting the upward trend. These data indicate healthy soil development under rain gardens planted with native plant species, consistent with previous work that suggests native prairie vegetation supports increased infiltration for rain gardens when compared to those planted with turf grass [44].

4.8. Soil Permeability

Soil permeability measurements identified no substantial changes from spring 2019 to spring 2021 and indicated that hydraulic properties were not substantially affected by runoff discharges to the rain garden. Measured infiltration rates in the rain garden were within an order of magnitude, ranging from 5.20 × 10⁻⁵ to 9.72 × 10⁻⁵ m/s at two flume monitoring locations. Average soil infiltration rates from infiltrometer measurements increased slightly at the West flume from spring 2019 (7.66 × 10⁻⁵ m/s) to spring 2021 (9.72 × 10⁻⁵ m/s), but the increase was consistent with the standard deviation of all West flume measurements (1.97 × 10⁻⁵ m/s), indicating a negligible change. North flume average soil infiltration rates decreased slightly from spring 2019 (6.19 × 10⁻⁵ m/s) to spring 2021 (5.20 × 10⁻⁵ m/s), but the decrease was within the standard deviation of all measurements at the North flume (1.07 × 10⁻⁵ m/s). This suggests that soil hydraulic properties are not rapidly degrading at the Gary City Hall rain garden three years following construction.

5. Discussion

The source of dissolved constituents in runoff to the rain garden was determined to be road salt during the deicer application season. A sample of applied deicer was submitted for chemical analysis and determined to primarily be composed of sodium (Na) and chloride (Cl). Plots of discrete water-quality data including concentration ratios of chloride to bromide (Cl/Br) and chloride to iodide (Cl/I) indicated that road salt was the source of most chloride entering the rain garden during deicer application season. In addition to road salt, wastewater and lawn amendments entering the rain garden with runoff can alter Cl/Br ratios. However, other unidentified sources of dissolved constituents were observed at substantially lower concentrations during the remainder of the year.
Coefficients of determination for least-squares regression lines fit to plots of discrete specific conductance and chloride concentration for flume data ranged 0.96–0.99 and 0.72–0.99 for groundwater data. Similar relationships between specific conductance and chloride concentration have been observed [4,5,45]. Continuous chloride loads were estimated in runoff as the product of discharge, measured at the flumes, and chloride concentration. Numerical integration of estimated chloride loads through time yielded the mass of chloride collected by rain gardens. The mass of chloride collected during deicer application season 2019–2020 was 1297 kg and during deicer application season 2020–2021 was 159 kg. Road salt collection by the rain garden during the 2020–2021 deicer application season was notably lower than during the 2019–2020 deicer application season because the COVID-19 pandemic closed City Hall and reduced vehicular traffic within the gated parking lot compared to pre-pandemic rates.
Permeability measurements of soils in the rain garden indicated infiltration rates were not lessened by geochemical reactions of dissolved road salt constituents with soils or by the accumulation of particulates. Chloride concentrations in soil samples collected at 0.3 m and 1 m of depth before and after road salt application season did not indicate carryover of chloride from year to year. The cation chemistry of soils did not indicate notable changes during the period of this study; however, only a few cations were measured which may not have collected changes in other exchangeable ions, as has been documented elsewhere for soils with different compositions [46]. Frequent improvements to maintain infiltration rates or eliminate accumulated road salt constituents may not be required for this rain garden.
Chloride concentrations in groundwater beneath the rain garden peaked during early summer and indicated a delay in arrival of infiltrating runoff reaching the water table. Similar observations have been attributed to temporary storage in the unsaturated zone [5,47]. Chloride concentrations in groundwater beneath the rain garden returned to pre-application season concentrations by late summer and indicated that, although intermittent water-quality degradation was observed, constituents are diluted by post-application season infiltration of rainwater and dispersed by flowing groundwater. Long-term degradation of groundwater quality beneath the rain garden resulting from stormwater infiltration best management practices has been documented elsewhere [3,17].
A weak correlation between chloride concentration and specific conductance in groundwater samples, particularly at the upgradient well CH-1, indicated non-deicer sources of constituents affecting specific conductance measurements. The magnitude of chloride concentration increases in groundwater beneath the rain garden were not observed at other nearby wells and indicated that the inflow of dissolved road salt constituents at CH-3 may not greatly affect chloride concentrations in groundwater beneath the larger green infrastructure.
Limitations of the data collection methods at Gary City Hall are acknowledged. Some runoff entered the rain garden without passing through the flumes. In addition, measuring low flows through the flumes proved problematic, as some low-intensity rainfall and snowmelt events did not generate gage heights exceeding the minimum level (0.02 ft) required for quantitation with the flumes. The result of this limitation may have been underestimating the total volume of runoff and the mass of collected road salt constituents.
Although field-scale hydrologic investigations of rain gardens can be challenging compared with studies conducted in a controlled laboratory environment, field data are essential for understanding how rain gardens function under natural conditions [48], and this is especially true when considering the variability of glaciated hydrogeologic settings around the Great Lakes. The results presented here suggest favorable conditions for reducing direct runoff to surface water features through stormwater retention in the Gary City Hall rain garden, located in a sandy Lake Michigan dune–beach complex hydrogeologic setting. Future studies that evaluate and compare rain gardens in other glacial hydrogeologic settings, with differing soil and aquifer properties (such as those characterized by clay-rich glacial tills), would be beneficial.

6. Conclusions

This study estimated chloride concentrations using continuously measured specific conductance to compute the total amount of road salt-derived constituents collected by an urban rain garden. The source of the dissolved constituents entering the rain garden was determined to be halite (or road salt) using Cl/Br and Cl/I concentration ratios and confirmed through wet chemistry of dissolved deicer samples. The total mass of collected road salt during November 2019 to April 2021 was 1490 kg (3285 pounds) as NaCl. The road salt constituents were mostly collected during the 2019–2020 deicer application season because Gary City Hall was closed in response to the COVID-19 pandemic and road maintenance in the vicinity was reduced during the 2020–2021 application season.
The deicer fate for this study area involved accumulation within the infiltration basin with subsequent flow to shallow groundwater. The permeability of rain garden soils under native plant vegetation ranged from 5.20 × 10⁻⁵ to 9.72 × 10⁻⁵ m/s and was unchanged during the study period. There was no accumulation of road salt constituents from year to year and soil organic matter increased at most rain garden sample sites between summer 2020 and summer 2021. These findings indicated no apparent degradation of soil or groundwater (no season-to-season carryover of chloride) and that rain garden installations carried out on sandy soils are sustainable and do not require regular, costly maintenance. The transferability of this study’s results to other rain gardens will depend on multiple factors, including similarities in design and construction, soil and aquifer properties, plant types and distribution, depth to groundwater, climate, contaminant properties, and rain garden capture rates. For the Gary City Hall rain garden, the road salt-affected water likely discharges to Lake Michigan; however, dilution and dispersion in groundwater results in a long-term, more constant effluent at substantially lower concentrations than direct discharge to combined storm–sanitary sewers over short periods of time.

Author Contributions

Conceptualization, E.R.B. and D.C.L.; methodology, E.R.B., S.N., D.C.L. and A.A.S.; formal analysis, E.R.B., S.N. and D.C.L.; investigation, E.R.B., S.N., D.C.L., A.A.S. and C.A.; data curation, E.R.B., S.N., D.C.L. and A.A.S.; visualization, E.R.B., S.N. and D.C.L.; project administration, E.R.B.; writing—original draft preparation, E.R.B.; writing—review and editing, S.N., D.C.L., A.A.S. and C.A. All authors have read and agreed to the published version of the manuscript.

Funding

This research was funded by the U.S. Environmental Protection Agency, Great Lakes Restoration Initiative. Any use of trade, firm, or product names is for descriptive purposes only and does not imply endorsement by the U.S. Government.

Data Availability Statement

The data presented in this study are openly available in the USGS Water Data for the Nation site at http://dx.doi.org/10.5066/F7P55KJN (accessed on 27 January 2025). To find the sites with data select Site Information as the data category and Indiana as the geographic area; then, under site selection criteria select Lake County as the site location and “City Hall” as the site name under site identifier. The USGS model archive and data release are available at https://doi.org/10.5066/P1S5NVF5 (accessed on 27 January 2025).

Acknowledgments

The authors would like to thank Brenda Scott-Henry and the staff of Gary City Hall in Gary, Indiana, USA, the Department of Sustainability and Environmental Affairs, and the Gary Sanitary District for their cooperation, assistance, and permission to access the site during the period of study.

Conflicts of Interest

The authors declare no conflicts of interest. The funders had no role in the design of the study; in the collection, analyses, or interpretation of data; in the writing of the manuscript, or in the decision to publish the results.

References

  1. Baker, N.T.; Sullivan, D.J.; Selbig, W.R.; Haefner, R.J.; Lampe, D.C.; Bayless, E.R.; McHale, M.R. Green Infrastructure in the Great Lakes—Assessment of Performance, Barriers, and Unintended Consequences; U.S. Geological Survey Circular 1496; U.S. Geological Survey: Reston, VA, USA, 2022; p. 70. [CrossRef]
  2. Lindsey, B.D.; Cravotta, C.A.; Szabo, Z.; Belitz, K.; Stackelberg, P. Relation between road-salt application and increasing radium concentrations in a low-pH aquifer, southern New Jersey. ACS EST Water 2021, 1, 2541–2547. [Google Scholar] [CrossRef]
  3. McQuiggan, R.; Andres, S.A.; Roros, A.; Sturchio, N.C. Stormwater drives seasonal geochemical processes beneath an infiltration basin. J. Environ. Qual. 2022, 51, 1198–1210. [Google Scholar] [CrossRef] [PubMed]
  4. Haefner, R.J.; Hoard, C.J.; Shuster, W. Hydrologic Study of Green Infrastructure in Poorly Drained Urbanized Soils at RecoveryPark, Detroit, Michigan, 2014–21; U.S. Geological Survey Scientific Investigations Report 2024–5018; U.S. Geological Survey: Reston, VA, USA, 2024; p. 29. [CrossRef]
  5. Watson, L.R.; Bayless, E.R.; Buska, P.M.; Wilson, J.T. Effects of Highway-Deicer Application on Ground-Water Quality in a Part of the Calumet Aquifer, Northwestern Indiana; U.S. Geological Survey Water Resources Investigations Report 01-4260; U.S. Geological Survey: Reston, VA, USA, 2001; p. 148. [CrossRef]
  6. Bäckström, M.; Karlsson, S.; Bäckman, L.; Folkeson, L.; Lind, B. Mobilisation of heavy metals by deicing salts in a roadside environment. Water Res. 2004, 38, 720–732. [Google Scholar] [CrossRef] [PubMed]
  7. Amrhein, C.; Strong, J.E.; Mosher, P.A. Effect of deicing salts on metal and organic matter mobilization in roadside soils. Environ. Sci. Technol. 1992, 26, 703–709. [Google Scholar] [CrossRef]
  8. Davis, S.N.; Whettenmore, D.O.; Fabryka-Martin, J. Uses of chloride/bromide ratios in studies of potable water. Groundwater 1998, 36, 338–350. [Google Scholar] [CrossRef]
  9. Vengosh, A.; Pankratov, I. Chloride/bromide and chloride/fluoride ratios of domestic sewage effluents and associated contaminated ground water. Groundwater 1998, 36, 815–824. [Google Scholar] [CrossRef]
  10. Risch, M.R.; Robinson, B.A. Use of Borehole and Surface Geophysics to Investigate Ground-Water Quality Near a Road-Deicing Salt-storage Facility, Valparaiso, Indiana; U.S. Geological Survey Water-Resources Investigations Report 00-4070; U.S. Geological Survey: Reston, VA, USA, 2001; p. 65. [CrossRef]
  11. Richter, B.C.; Kreitler, C.W. Identification of Sources of Ground-Water Salinization Using Geochemical Techniques; U.S. Environmental Protection Agency EPA-600/2-91/064; U.S. Environmental Protection Agency: Ada, OK, USA, 1991; p. 259. Available online: https://nepis.epa.gov/Exe/ZyPURL.cgi?Dockey=30000HXE.TXT (accessed on 28 January 2025).
  12. Holser, W.T. Trace elements and isotopes in evaporates. In Marine Minerals; Burns, R.G., Ed.; Mineralogical Society of America, Short Course Notes; Mineralogical Society of America: Washington, DC, USA, 1979; Volume 6, Chapter 9; pp. 295–345. [Google Scholar] [CrossRef]
  13. Whittemore, D.O.; Pollock, L.M. Determination of Salinity Sources in Water Resources of Kansas by Minor Alkali Metal and Halide Chemistry; Kansas State University, Kansas Water Resources Research Institute Contribution 208: Manhattan, NY, USA, 1979; p. 28. [Google Scholar]
  14. Knuth, M.; Jackson, J.L.; Whittemore, D.O. An integrated approach to identifying the salinity source contaminating a ground-water supply. Groundwater 1990, 28, 207–214. [Google Scholar] [CrossRef]
  15. Howard, K.W.F.; Beck, P.J. Hydrochemical interpretation of groundwater flow systems in Quaternary sediments of southern Ontario. Can. J. Earth Sci. 1986, 23, 938–947. [Google Scholar] [CrossRef]
  16. Keller, S.J. Analyses of Subsurface Brines in Indiana; Indiana Geological Survey Occasional Paper 41; Indiana Department of Natural Resources: Bloomington, IN, USA, 1983; p. 30. Available online: https://hdl.handle.net/2022/28165 (accessed on 28 January 2025).
  17. Masoner, J.R.; Kolpin, D.W.; Cozzarelli, I.M.; Barber, L.B.; Burden, D.S.; Foreman, W.T.; Forshay, K.J.; Furlong, E.T.; Groves, J.F.; Hladik, M.L.; et al. Urban stormwater: An overlooked pathway of extensive mixed contaminants to surface and groundwaters in the United States. Environ. Sci. Technol. 2019, 53, 10070–10081. [Google Scholar] [CrossRef] [PubMed]
  18. Granato, G.E.; DeSimone, L.A.; Barbaro, J.R.; Jeznach, L.C. Methods for Evaluating Potential Sources of Chloride in Surface Water and Groundwaters of the Conterminous United States; U.S. Geological Survey Open-File Report 2015-1080; U.S. Geological Survey: Reston, VA, USA, 2015; p. 89. [CrossRef]
  19. Snodgrass, J.W.; Moore, J.; Lev, S.M.; Casey, R.E.; Ownby, D.R.; Flora, R.F.; Izzo, G. Influence of modern stormwater management practices on transport of road salt to surface waters. Environ. Sci. Technol. 2017, 51, 4165–4172. [Google Scholar] [CrossRef] [PubMed]
  20. Schuler, M.S.; Relyea, R.A. A Review of the Combined Threats of Road Salts and Heavy Metals to Freshwater Systems. BioScience 2018, 68, 327–335. [Google Scholar] [CrossRef]
  21. Tornes, L.H. Effects of Rain Gardens on the Quality of Water in the Minneapolis-St. Paul Metropolitan Area of Minnesota; U.S. Geological Survey Scientific Investigations Report 2002-04; U.S. Geological Survey: Reston, VA, USA, 2005; p. 29. [CrossRef]
  22. Basu, A.; Sinha, S.; Carpenter, D. A Survey of Barriers and Opportunities to Adopting Green Stormwater Infrastructure in Michigan; Michigan Sea Grant Report MICHU-20-502; Lawrence Technological University: Southfield, MI, USA, 2020; p. 6. Available online: https://www.michiganseagrant.org/wp-content/uploads/2020/01/Executive-Summary-GI-Barriers-Survey-January-2020.pdf (accessed on 28 January 2025).
  23. Corsi, S.R.; De Cicco, L.A.; Lutz, M.A.; Hirsch, R.M. River chloride trends in snow-affected urban watersheds: Increasing concentrations outpace urban growth rate and are common among all seasons. Sci. Environ. 2015, 508, 488–497. [Google Scholar] [CrossRef]
  24. Darner, R.A.; Shuster, W.D.; Dumouchelle, D.H. Hydrologic Characteristics of Low-Impact Stormwater Control Measures at Two Sites in Northeastern Ohio, 2008–2013; U.S. Geological Survey Scientific Investigations Report 2015-5030; U.S. Geological Survey: Reston, VA, USA, 2015; p. 38. [CrossRef]
  25. Great Lakes Commission. Great Lakes Regional Green Infrastructure Policy Analysis: Addressing Barriers to Implementation; Great Lakes Commission: Ann Arbor, MI, USA, 2018; p. 51. [Google Scholar]
  26. Schneider, A.F. Physiography. In Naural Features of Indiana—A Symposium, 1966 (Indiana Sesqucentennial Volume, 1816–1966); Lindsey, A.A., Ed.; Indiana Academy of Science: Indianapolis, IN, USA, 1966; pp. 40–56. [Google Scholar]
  27. Leverett, F.; Taylor, F.B. The Pleistocene of Indiana and Michigan and the History of the Great Lakes; U.S. Geological Survey Monograph 53; U.S. Geological Survey: Reston, VA, USA, 1915; p. 529.
  28. Bretz, J.H. The stages of Lake Chicago; their causes and correlations. Am. J. Sci. 1951, 24, 401–419. [Google Scholar] [CrossRef]
  29. Hansel, A.K.; Mickelson, D.M.; Schneider, A.F.; Larsen, C.E. Late Wisconsinan and Holocene history of the Lake Michigan basin. In Quarternary Evolution of the Great Lakes; Karrow, P.F., Clakin, P.E., Eds.; Special Paper 30; Geological Association of Canada, The Canadian Copyright Licensing Agency: Toronto, ON, Canada, 1985; pp. 39–53. [Google Scholar]
  30. Hartke, E.J.; Hill, J.R.; Reshkin, M. Environmental Geology of Lake and Porter Counties, Indiana—An Aid to Planning; Indiana Geological Survey Special Report 11; Indiana Geological and Water Survey: Bloomington, IN, USA, 1975; p. 57. [Google Scholar]
  31. Brown, S.E.; Thompson, T.A. Geologic Terrains of Northwestern Lake County, Indiana; Indiana Geological Survey Open-File Report 5-05; Indiana Geological and Water Survey: Bloomington, IN, USA, 1995; Available online: https://hdl.handle.net/2022/28847 (accessed on 4 February 2025).
  32. Fenelon, J.M.; Watson, L.R. Geohydrology and Water Quality of the Calumet Aquifer, in the Vicinity of the Grand Calumet River/Indiana Harbor Canal, Northwestern Indiana; U.S. Geological Survey Water-Resources Investigations Report 92-4115; U.S. Geological Survey: Reston, VA, USA, 1993; p. 151. [CrossRef]
  33. Lampe, D.C.; Bayless, E.R.; Follette, D.D. Stormwater Reduction and Water Budget for a Rain Garden on Sandy Soil, Gary, Indiana, 2016–2018; U.S. Geological Survey Scientific Investigations Report 2022–5101; U.S. Geological Survey: Reston, VA, USA, 2022; p. 39. [CrossRef]
  34. Arguez, A.; Durre, I.; Applequist, S.; Vose, R.S.; Squires, M.F.; Yin, X.; Heim, R.R., Jr.; Owen, T.W. NOAA’s U.S. Climate Normals (1981–2010); NOAA National Centers for Environmental Information: Asheville, NC, USA, 2012. [CrossRef]
  35. Decagon Devices, Inc. ES-2, ES-2F Electrical Conductivity & Temperature Sensor, Operator’s Manual Version 1; Decagon Devices, Inc.: Pullman, WA, USA, 2012; Available online: https://manualzz.com/doc/8424000/es-2-manual (accessed on 28 January 2025).
  36. U.S. Geological Survey. National Field Manual (NFM) for the Collection of Water-Quality Data; U.S. Geological Survey Techniques and Methods; U.S. Geological Survey: Reston, VA, USA, 2019; Chapter A1–A10. Available online: https://pubs.water.usgs.gov/twri9A (accessed on 14 July 2024).
  37. Johnson, A.I. Measurement of Infiltration; U.S. Geological Survey Water-Supply Paper 1544-F; U.S. Geological Survey: Reston, VA, USA, 1963; p. 31. [CrossRef]
  38. ASTM D3385-03; Standard Test Method for Infiltration Rate of Soils in Field Using Double-Ring Infiltrometer. ASTM International: West Conshohocken, PA, USA, 2003. [CrossRef]
  39. Whittemore, D.O. Bromide as tracer in ground-water studies: Geochemistry and analytical determination. In Proceedings of the Ground Water Geochemistry Conference, Denver, CO, USA, 16–18 February 1988; National Water Well Association: Dublin, OH, USA, 1988; pp. 339–360. [Google Scholar]
  40. Howard, K.W.F.; Beck, P.J. Hydrogeochemical implications of groundwater contamination by road deicing chemicals. J. Contam. Hydrol. 1993, 12, 245–268. [Google Scholar] [CrossRef]
  41. Jones, A.L.; Sroka, B.N. Effects of Highway Deicing Chemicals on Shallow Unconsolidated Aquifers in Ohio, Interim Report, 1988–1993; U.S. Geological Survey Water-Resources Investigations Report 97-4027; U.S. Geological Survey: Reston, VA, USA, 1997; p. 139. [CrossRef]
  42. Schnitzer, M. Soil organic matter—The next 75 years. Soil Sci. 1991, 151, 41–58. [Google Scholar] [CrossRef]
  43. Henning, S.; Bornemann, L.; Welp, G. Seasonal variability of soil organic carbon fractions under arable land. Pedosphere 2017, 27, 380–386. [Google Scholar] [CrossRef]
  44. Selbig, W.R.; Balster, N. Evaluation of Turf-Grass and Prairie-Vegetated Rain Gardens in a Clay and Sand Soil, Madison, Wisconsin, Water Years 2004–08; U.S. Geological Survey Scientific Investigations Report 2010-5077; U.S. Geological Survey: Reston, VA, USA, 2010; p. 82. [CrossRef]
  45. Granato, G.E.; Smith, K.P. Estimating Concentrations of Road-Salt Constituents in Highway-Runoff from Measurements of Specific Conductance; U.S. Geological Survey Water Resources Investigation Report 99-4077; U.S. Geological Survey: Reston, VA, USA, 1999; p. 22. Available online: https://pubs.usgs.gov/wri/wri99-4077/ (accessed on 28 January 2025).
  46. Lazur, A.; VanDerwerker, T.; Koepenick, K. Review of implications of road salt use on groundwater quality—Corrosivity and mobilization of heavy metals and radionuclides. Water Air Soil Pollut. 2020, 231, 474. [Google Scholar] [CrossRef]
  47. Baraza, T.; Hasenmueller, E.A. Road salt retention and transport through vadose zone soils to shallow groundwater. Sci. Total Environ. 2021, 755, 142240. [Google Scholar] [CrossRef] [PubMed]
  48. Burszta-Adamiak, E.; Biniak-Pieróg, M.; Dąbek, P.B.; Sternik, A. Rain garden hydrological performance–Responses to real rainfall events. Sci. Total Environ. 2023, 877, 164153. [Google Scholar] [CrossRef]
Figure 1. Gary City Hall rain garden and sub-drainage areas contributing flow into the rain garden. The north drainage is outlined with yellow, the east with purple, the south with blue, and the west with brown.
Water 17 00510 g001
Figure 2. Locations of hydrologic monitoring equipment at Gary City Hall, Gary, Indiana.
Water 17 00510 g002
Figure 3. Schematic diagram showing the positions and numbering system for soil samples relative to the flume outfalls. Blue arrows indicate the flow direction of runoff into and out of the flume.
Water 17 00510 g003
Figure 4. Boxplots showing specific conductance of runoff at flumes discharging runoff to the rain garden at Gary City Hall, Gary, Indiana, November 2019–May 2021.
Water 17 00510 g004
Figure 5. Specific conductance through time at (A) West flume, (B) North flume, (C) Northeast flume, (D) Southeast flume, and (E) South flume.
Water 17 00510 g005
Figure 6. Box and whisker plots showing ranges and medians of discrete chloride concentrations measured in wells CH-1, CH-2, and CH-3.
Water 17 00510 g006
Figure 7. Continuous specific conductance of groundwater measured in wells CH-1, CH-2, and CH-3.
Water 17 00510 g007
Figure 8. Bromide concentration with chloride concentration in runoff. The dotted line is the best fit linear regression line.
Water 17 00510 g008
Figure 9. Plot of iodide concentration with chloride concentration in runoff. The dotted line is the best fit linear regression line.
Water 17 00510 g009
Figure 10. Plot of bromide concentration with chloride concentration in groundwater. The dotted line is the best fit linear regression line.
Water 17 00510 g010
Figure 11. Plot of iodide concentration with chloride concentration in groundwater. The dotted line is the best fit linear regression line.
Water 17 00510 g011
Figure 12. Plot of the chloride/bromide concentration ratio with chloride concentration in runoff.
Water 17 00510 g012
Figure 13. Plot of the chloride/bromide concentration ratio with chloride concentration in groundwater.
Water 17 00510 g013
Figure 14. Plot of the chloride/iodide concentration ratio with chloride concentration in runoff.
Water 17 00510 g014
Figure 15. Plot of the chloride/iodide concentration ratio with chloride concentration in groundwater.
Water 17 00510 g015
Figure 16. Plot of chloride concentration with instantaneous, field-measured specific conductance for the West flume, the Northeast flume, the Southeast flume, the North flume, and South flume sites. Lines fit to data using least squares regression.
Water 17 00510 g016
Figure 17. Plot of chloride concentrations with instantaneous, field-measured specific conductance for wells CH-1, CH-2, and CH-3. Lines fit to data using least squares regression.
Water 17 00510 g017
Figure 18. Estimated and measured chloride in the West flume during 21 November 2019 to 11 March 2021.
Water 17 00510 g018
Figure 19. Measured and estimated chloride concentration and potentiometric surface elevation in groundwater during 21 November 2019 to 11 March 2021 at monitoring well CH-3 (USGS 413611087201004).
Water 17 00510 g019
Figure 20. Chloride (A) and sodium concentrations (B) and electrical conductivity (C) with soil depth at Gary City Hall green infrastructure.
Water 17 00510 g020
Figure 21. Soil organic matter in 36 samples collected at the Gary City Hall rain garden.
Water 17 00510 g021
Table 1. Annual seasonal 30-year climate normals [34] in the vicinity of Gary, Indiana. [°C, degrees Celsius; m, meters].
SeasonMaximum Temperature, in °CMinimum Temperature, in °CAverage
Temperature, in °C
Precipitation, in mSnow, in m
Annual15.256.2210.721.021.00
Winter1.89−5.67−1.890.170.80
Spring14.694.899.780.280.17
Summer27.4717.8322.640.320.00
Autumn16.977.8312.390.250.03
Table 2. Equations of least squares regression lines fit to plots of chloride with specific conductance from discrete samples of runoff and groundwater and corresponding coefficients of determination (r2).
Well or FlumeUSGS Site IDEquation r2
CH-1413610087201001y = 0.3106x − 146.280.72
CH-2413612087201301y = 0.319x − 171.020.99
CH-3413611087201004y = 0.2308x − 51.8560.88
West Flume413611087201101y = 0.4121x0.99
Northeast Flume413612087200901y = 0.4257x0.99
Southeast Flume413611087200901y = 0.3913x0.96
North Flume413611087201001y = 0.3241x0.99
South Flume413611087201002y = 0.4003x0.99
Table 3. Mass of NaCl collected during the two monitored road salt application periods and the intervening period of no application.
Collected Mass of NaCl
2019–20
21 November 2019–10 March 2020
(kg NaCl)
Collected Mass of NaCl 2020
11 March 2020–20 November 2020
(kg NaCl)
Collected Mass of NaCl
2020–2021
21 November 2020–11 March 2021
(kg NaCl)
Total Collected Mass of NaCl by Flume
(kg NaCl)
West flume3252.432.06329
North flume28.50.060.629.1
Northeast flume24015.15.04260
Southeast flume8.065.59126139
South flume6969.4926.1731
Total NaCl collected by season129732.71591490
Disclaimer/Publisher’s Note: The statements, opinions and data contained in all publications are solely those of the individual author(s) and contributor(s) and not of MDPI and/or the editor(s). MDPI and/or the editor(s) disclaim responsibility for any injury to people or property resulting from any ideas, methods, instructions or products referred to in the content.