Article

Understanding the Relationship Between Water Quality and Soil Nutrient Dynamics in Qinghai Lake Through Statistical and Regression Models

1
Ecological Environment Planning and Environmental Protection Technology Center of Qinghai Province, Xining 810007, China
2
Sino-Danish College, University of Chinese Academy of Sciences, Beijing 100049, China
3
Key Laboratory of Land Surface Pattern and Simulation, Institute of Geographical Sciences and Natural Resources Research, Chinese Academy of Sciences, Beijing 100101, China
*
Author to whom correspondence should be addressed.
These authors contributed equally to this work.
Water 2025, 17(4), 472; https://doi.org/10.3390/w17040472
Submission received: 26 December 2024 / Revised: 21 January 2025 / Accepted: 31 January 2025 / Published: 8 February 2025
(This article belongs to the Special Issue Impacts of Climate Change & Human Activities on Wetland Ecosystems)

Abstract

:
Lakes are essential ecosystems that play a significant role in water quality and biodiversity, particularly in nutrient cycling. Nitrogen compounds, including ammonium (NH4+), nitrate (NO3), and nitrite (NO2), are critical elements in lake ecosystems, influencing productivity and water quality. This study aimed to investigate nitrogen compounds in Qinghai Lake, assess water and soil quality indicators, and evaluate the relationship between nitrogen (N) and phosphorus (P) levels in water and soil. Water samples from 17 locations around the lake and soil samples from nine sites at two depths were analyzed for various parameters. Statistical and regression analyses were performed to explore the correlations between N forms in water and other parameters in water and total P, total N, and pH in soil, as well as their interactions with environmental variables. The mean concentrations of NO3-N, NH4+-N, and NO2-N were 0.0189 mg/L, 0.112 mg/L, and 0.595 mg/L in Qinghai Lake, respectively. The regression models revealed that the total P in water and soil, along with other environmental factors, play crucial roles in regulating N levels. These findings contribute to our understanding of N cycling in high-altitude lakes and provide insight into managing eutrophication risks in Qinghai Lake.

1. Introduction

Lakes play a pivotal role in the Earth’s surface ecosystems, acting as hubs for the integration of ecological processes and serving as vital freshwater reservoirs, genetic biodiversity repositories, and flood control systems [1,2,3]. Their direct linkage to human livelihoods underscores their importance in global and regional environmental management [4]. In China alone, the presence of approximately 2693 natural lakes exceeding 1 km2, distributed across diverse geographical regions, highlights their ecological, cultural, and economic significance [5,6]. These lakes contribute approximately 81,000 km2 of surface area, serving functions such as providing potable water, supporting agricultural irrigation, and offering habitats for a vast array of species, thereby underpinning critical ecosystem services [5,6,7]. Lakes have long water renewal cycles, making them vulnerable to aggregating nitrogen (N) and phosphorus (P) nutrients [6,8]. This nutrient retention capability, while beneficial for supporting biodiversity under natural conditions, can lead to eutrophication when nutrient inputs exceed ecological thresholds [9,10]. Eutrophication, characterized by excessive algal growth and subsequent oxygen depletion, is a growing concern for global lake management, as it threatens biodiversity, water quality, and ecosystem stability [11,12,13]. The complex reaction dynamics of lakes further contribute to their susceptibility to eutrophication. The interaction between physical, chemical, and biological processes in lentic systems often results in slower nutrient cycling and increased retention of pollutants [14]. Anthropogenic activities, such as agricultural runoff, untreated wastewater discharge, and atmospheric deposition, exacerbate these natural vulnerabilities, turning many lakes into hotspots of ecological concern [15,16].
N and P are often the primary limiting factors for biological productivity, and their introduction into water bodies can have profound effects on both nutrient cycles and the structures of biological communities [17,18,19]. As a key element in the biogeochemical cycles of water systems, N exists in various chemical forms, including ammonium (NH4+-N), nitrate nitrogen (NO3-N), and nitrite nitrogen (NO2-N), each contributing to different ecological processes. The cycling and transformation of these N species are central to the productivity of aquatic ecosystems. NH4+, as the primary form of N in anoxic environments, is a direct product of organic matter decomposition and the mineralization of organic N [20]. High concentrations of NH4+ can contribute to eutrophication, especially when coupled with other nutrients like P [21]. NO3, produced through the oxidation of NH4+ by nitrifying bacteria in the process of nitrification, is the most common and bioavailable form of N in oxygenated water bodies [22,23,24]. In lakes, NO3 often acts as a limiting nutrient for primary producers, but its accumulation can lead to nutrient imbalances and excessive growth of phytoplankton [25]. NO2, an intermediate product of nitrification, is generally present in trace amounts in healthy aquatic systems, as it is quickly converted to NO3 by nitrite-oxidizing bacteria [26]. However, in disturbed or hypoxic environments, NO2 can accumulate and become toxic to aquatic organisms [27,28]. The transformation and cycling of these N species are influenced by a combination of biological, chemical, and physical factors, including microbial communities, oxygen levels, and temperature. Their concentrations in lake waters reflect the dynamic equilibrium between N inputs, microbial activity, and environmental conditions. P is a key limiting nutrient in water ecosystems and plays a crucial role in determining water quality in lakes [29]. Elevated P levels can lead to eutrophication, where excessive nutrients promote the overgrowth of algae, which in turn leads to a series of negative ecological and chemical changes [30,31]. Increases in P levels from agricultural runoff, wastewater discharge, or other sources can cause an overproduction of algae, especially cyanobacteria [32,33]. These blooms not only reduce water clarity but can also deplete dissolved oxygen, leading to hypoxic conditions and fish kills. Given the significance of N in lake ecosystems, the objectives of this study are the following: (1) to analyze the concentrations and distributions of N compounds (NH4+, NO3, and NO2) in Qinghai Lake; (2) to examine other water quality indicators in Qinghai Lake; and (3) to investigate the influence of specific soil factors (such as pH, TP, and TN) on the concentration and dynamics of various N forms in the surrounding lake environment.

2. Materials and Methods
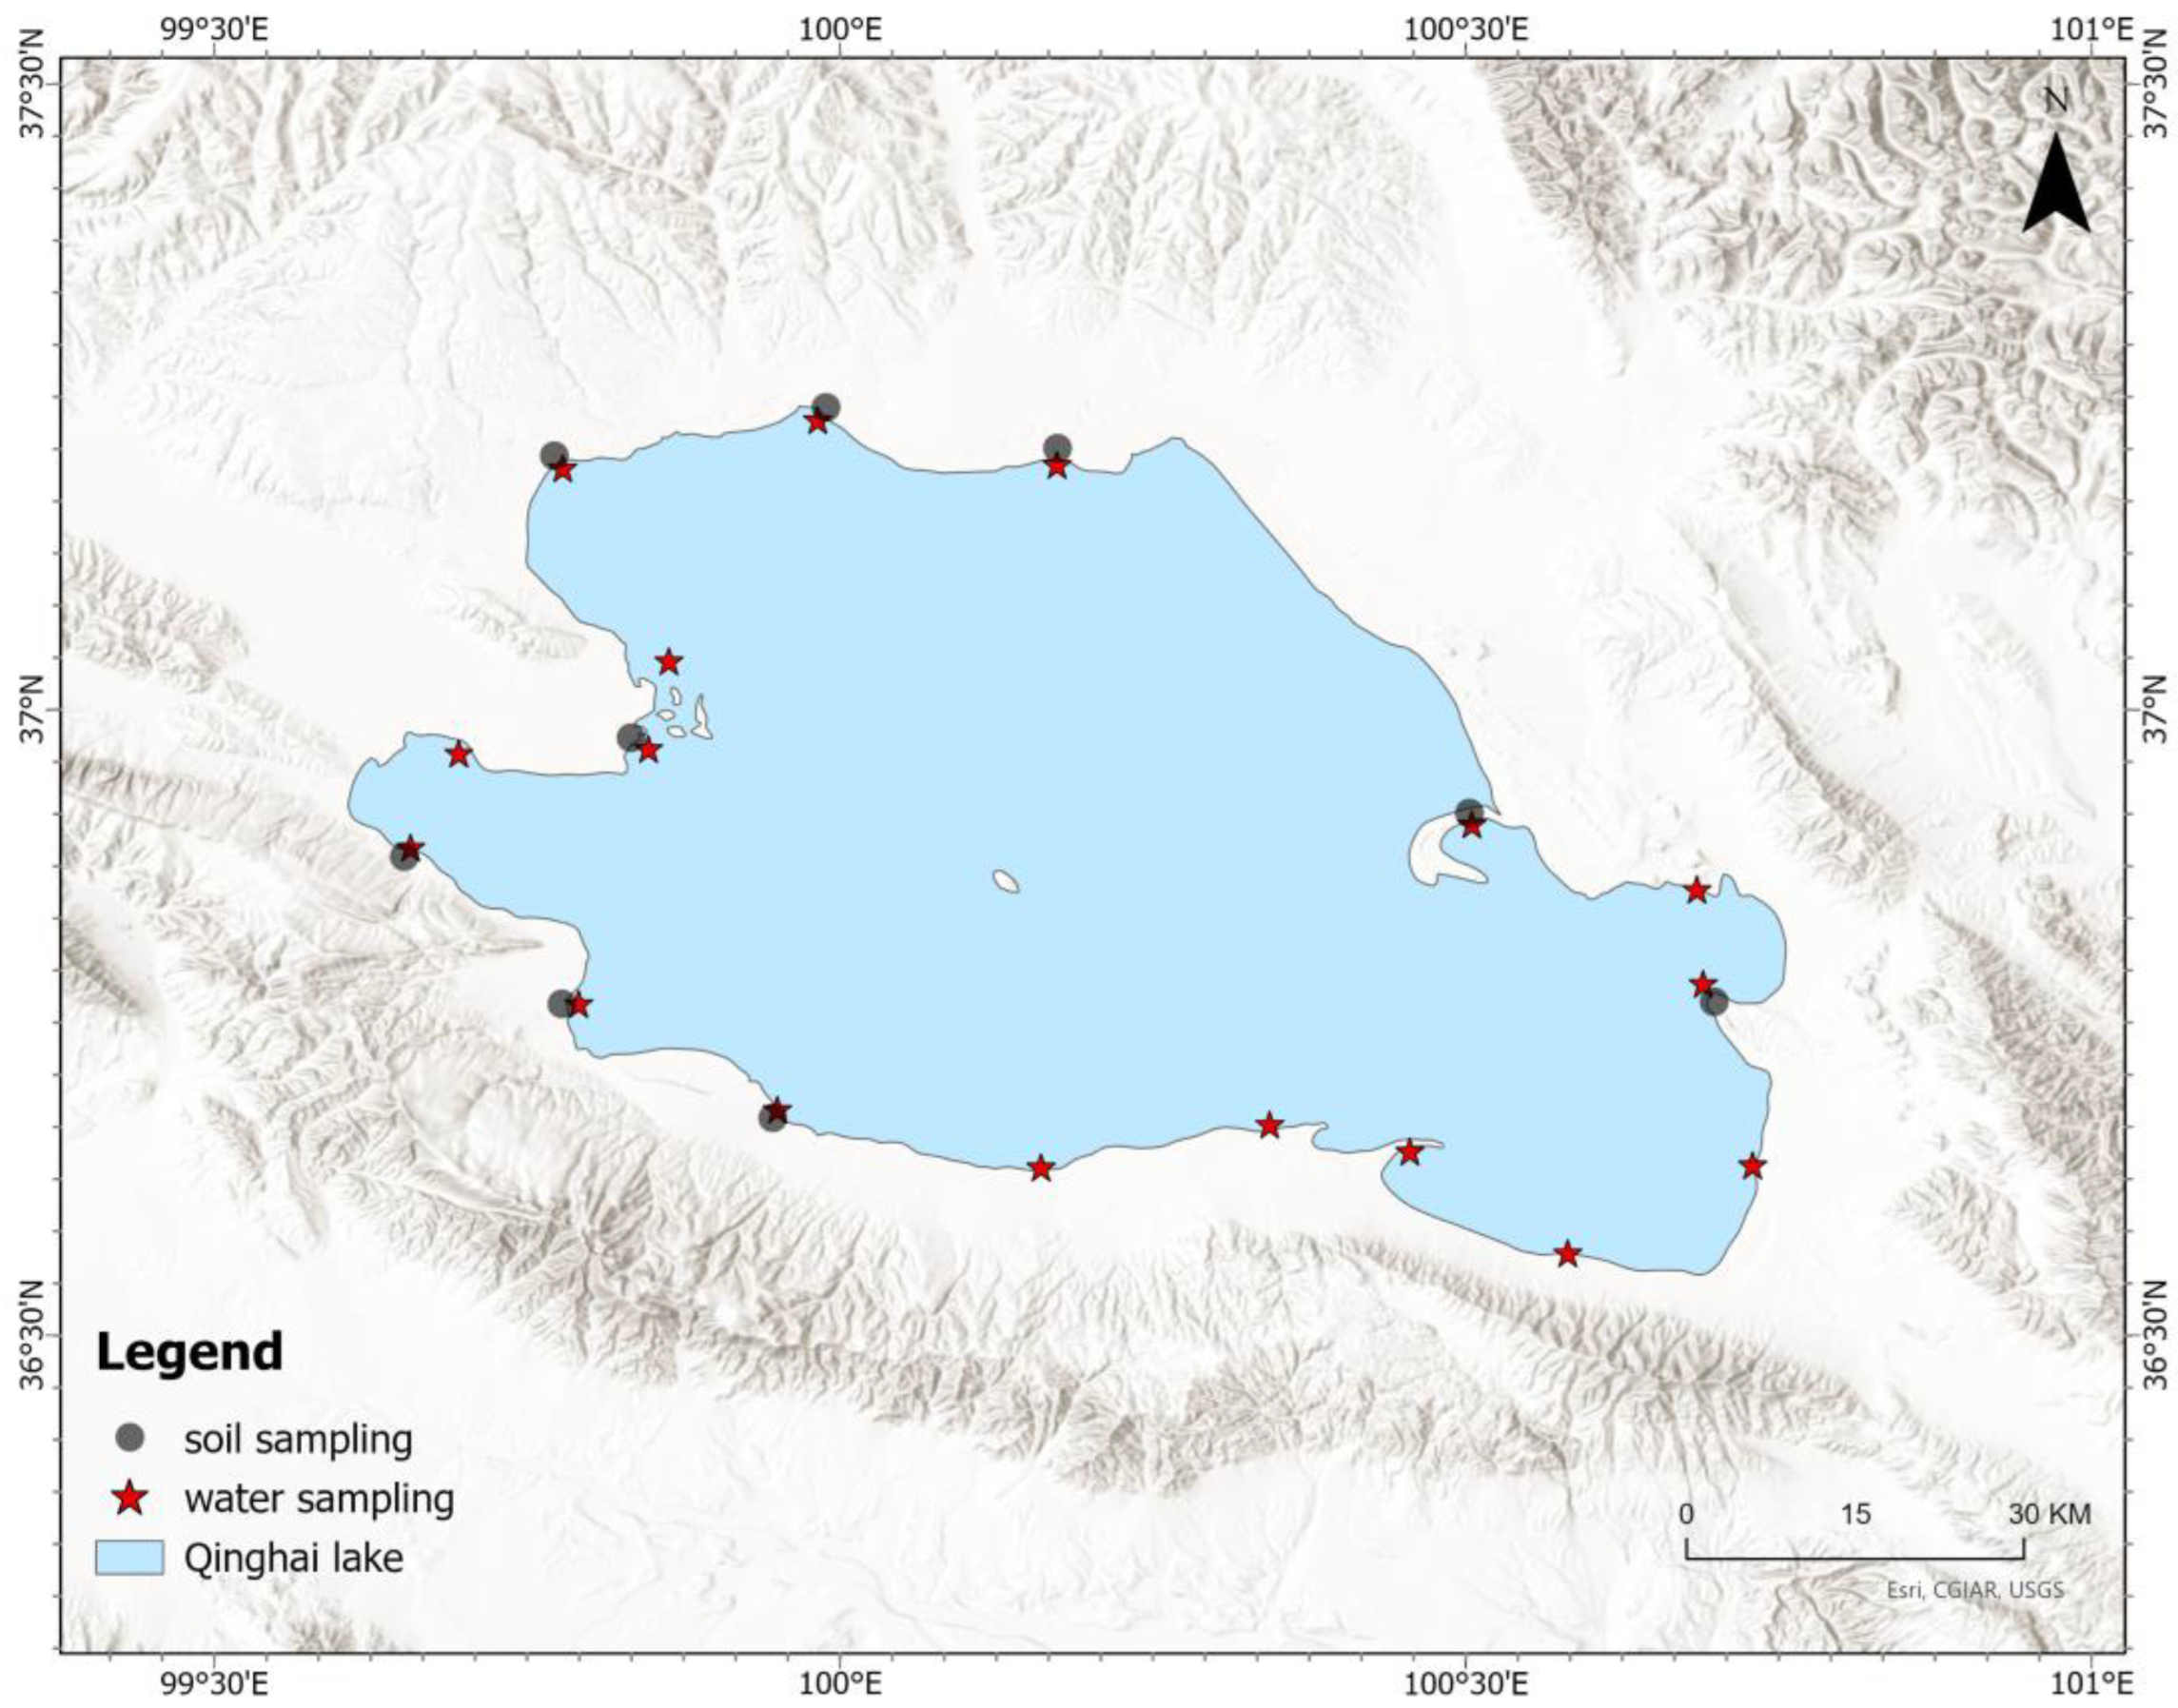
2.1. Study Area

Qinghai Lake, located in the northeastern part of the Tibetan Plateau, is the largest saline-alkaline lake in China and holds significant ecological, hydrological, and cultural importance. As a closed basin lake, it has no outflow, making it highly sensitive to environmental changes and human activities. The lake covers an area of approximately 4400 km2 and sits at an elevation of 3195 MASL. The lake’s alkaline nature, with high levels of dissolved salts, is a result of its unique geological and climatic conditions, as well as the limited water exchange due to its closed basin structure. Qinghai Lake plays a crucial role in the regional hydrological cycle [34]. In recent years, the increasing human activity in the surrounding areas, such as agricultural development, livestock farming, and urbanization, has led to elevated N inputs through runoff, wastewater discharge, and atmospheric deposition [34,35]. This influx of N can contribute to nutrient enrichment in the lake [10,35]. Moreover, Qinghai Lake is situated in a region highly sensitive to climate change, where altered precipitation patterns, temperature fluctuations, and shifting hydrological regimes are already influencing water quality and nutrient cycling.
The Qinghai Lake Basin, located in the northeastern part of the Qinghai–Tibet Plateau, is characterized by a high-altitude, cold environment. It lies at the intersection of the warm and humid monsoon zone in southeastern China and the cold air masses from the northwest, while also being influenced by the high-altitude cold region in the southwest. Additionally, the basin experiences the unique lake effects of Qinghai Lake itself. These factors contribute to a climate with long cold periods, short warm periods, indistinct seasonal transitions, arid conditions with minimal precipitation, strong solar radiation, and significant diurnal temperature variation. Understanding how N behaves can provide valuable information for predicting the future health of the lake.

2.2. Sampling and Analysis

2.2.1. Sample Collection

To comprehensively examine the water quality of Qinghai Lake, a total of 17 water samples were collected from various locations across the lake. In addition to water sampling, soil samples were collected from nine distinct locations around the periphery of Qinghai Lake. To understand the vertical distribution of potential influencing factors, such as nutrient leaching or deposition patterns, soil samples were taken at two depths: 50 cm and 300 cm. Therefore, a total of 18 soil samples were collected (Figure 1). The land use types of the soil sample collection sites are shown in Figure S1. After sample collection, the samples were promptly numbered and labels were attached. The collected samples, along with the sampling record sheets, were transported to the laboratory and handed over with proper documentation.

2.2.2. Chemical Analysis of Water Samples

Before analysis, all instruments involved in the analysis were within the validity period of their calibration/verification and preheated according to the manufacturer’s instructions. Standard solutions prepared and issued by the National Environmental Monitoring Center of China for instrument calibration were applied to calibrate. During sample analysis, internal control samples were used to monitor the controlled state of the analysis process. At least one certified reference material was used in each analysis.
The water samples were collected by preferably sterilized flasks. The water pH value was determined by the Electrode Method [36]. The NH4+-N in water was determined by the Nessler Reagent Spectrophotometric Method [37], NO3-N in water was determined by the Phenol Disulfonic Acid Spectrophotometric Method [38], and NO2-N in water was measured by Spectrophotometric Method [39]. The dissolved oxygen (DO) was determined by the Iodometric Method [40], TP in water was determined by the Ammonium Molybdate Spectrophotometric Method [41], and TN in water by Alkaline Potassium Persulfate Digestion and UV Spectrophotometry [42].

2.2.3. Chemical Analysis of Soil Samples

The sampling depth for surface soil was 0–20 cm. Soil profile samples were collected from depths of 50 cm and 300 cm. TN in the soil was measured by the Kjeldahl Method [43], and TP in the soil was measured by the Alkali Fusion Method [44]. In addition, soil pH was detected by the Potentiometric Method [45].

2.3. Multiple Linear Regression Analysis

Multiple linear regression (MLR) and Principal Component Analysis (PCA) are widely applied in various fields such as economics, social sciences, biology, and environmental studies [46,47]. In this study, NH4+-N, NO3-N, and NO2-N were set as dependent variables in MLR, and other parameters in water and soil were independent predictors, to model the relationship between them. To build the model, 300 cm soil data from the sample site S6 was not included as the sampling number difference. While previous research has identified a clear positive correlation between watershed precipitation and N and P concentrations in lake water [48], this study focuses solely on the influence of water and soil physicochemical properties.

3. Results and Discussion

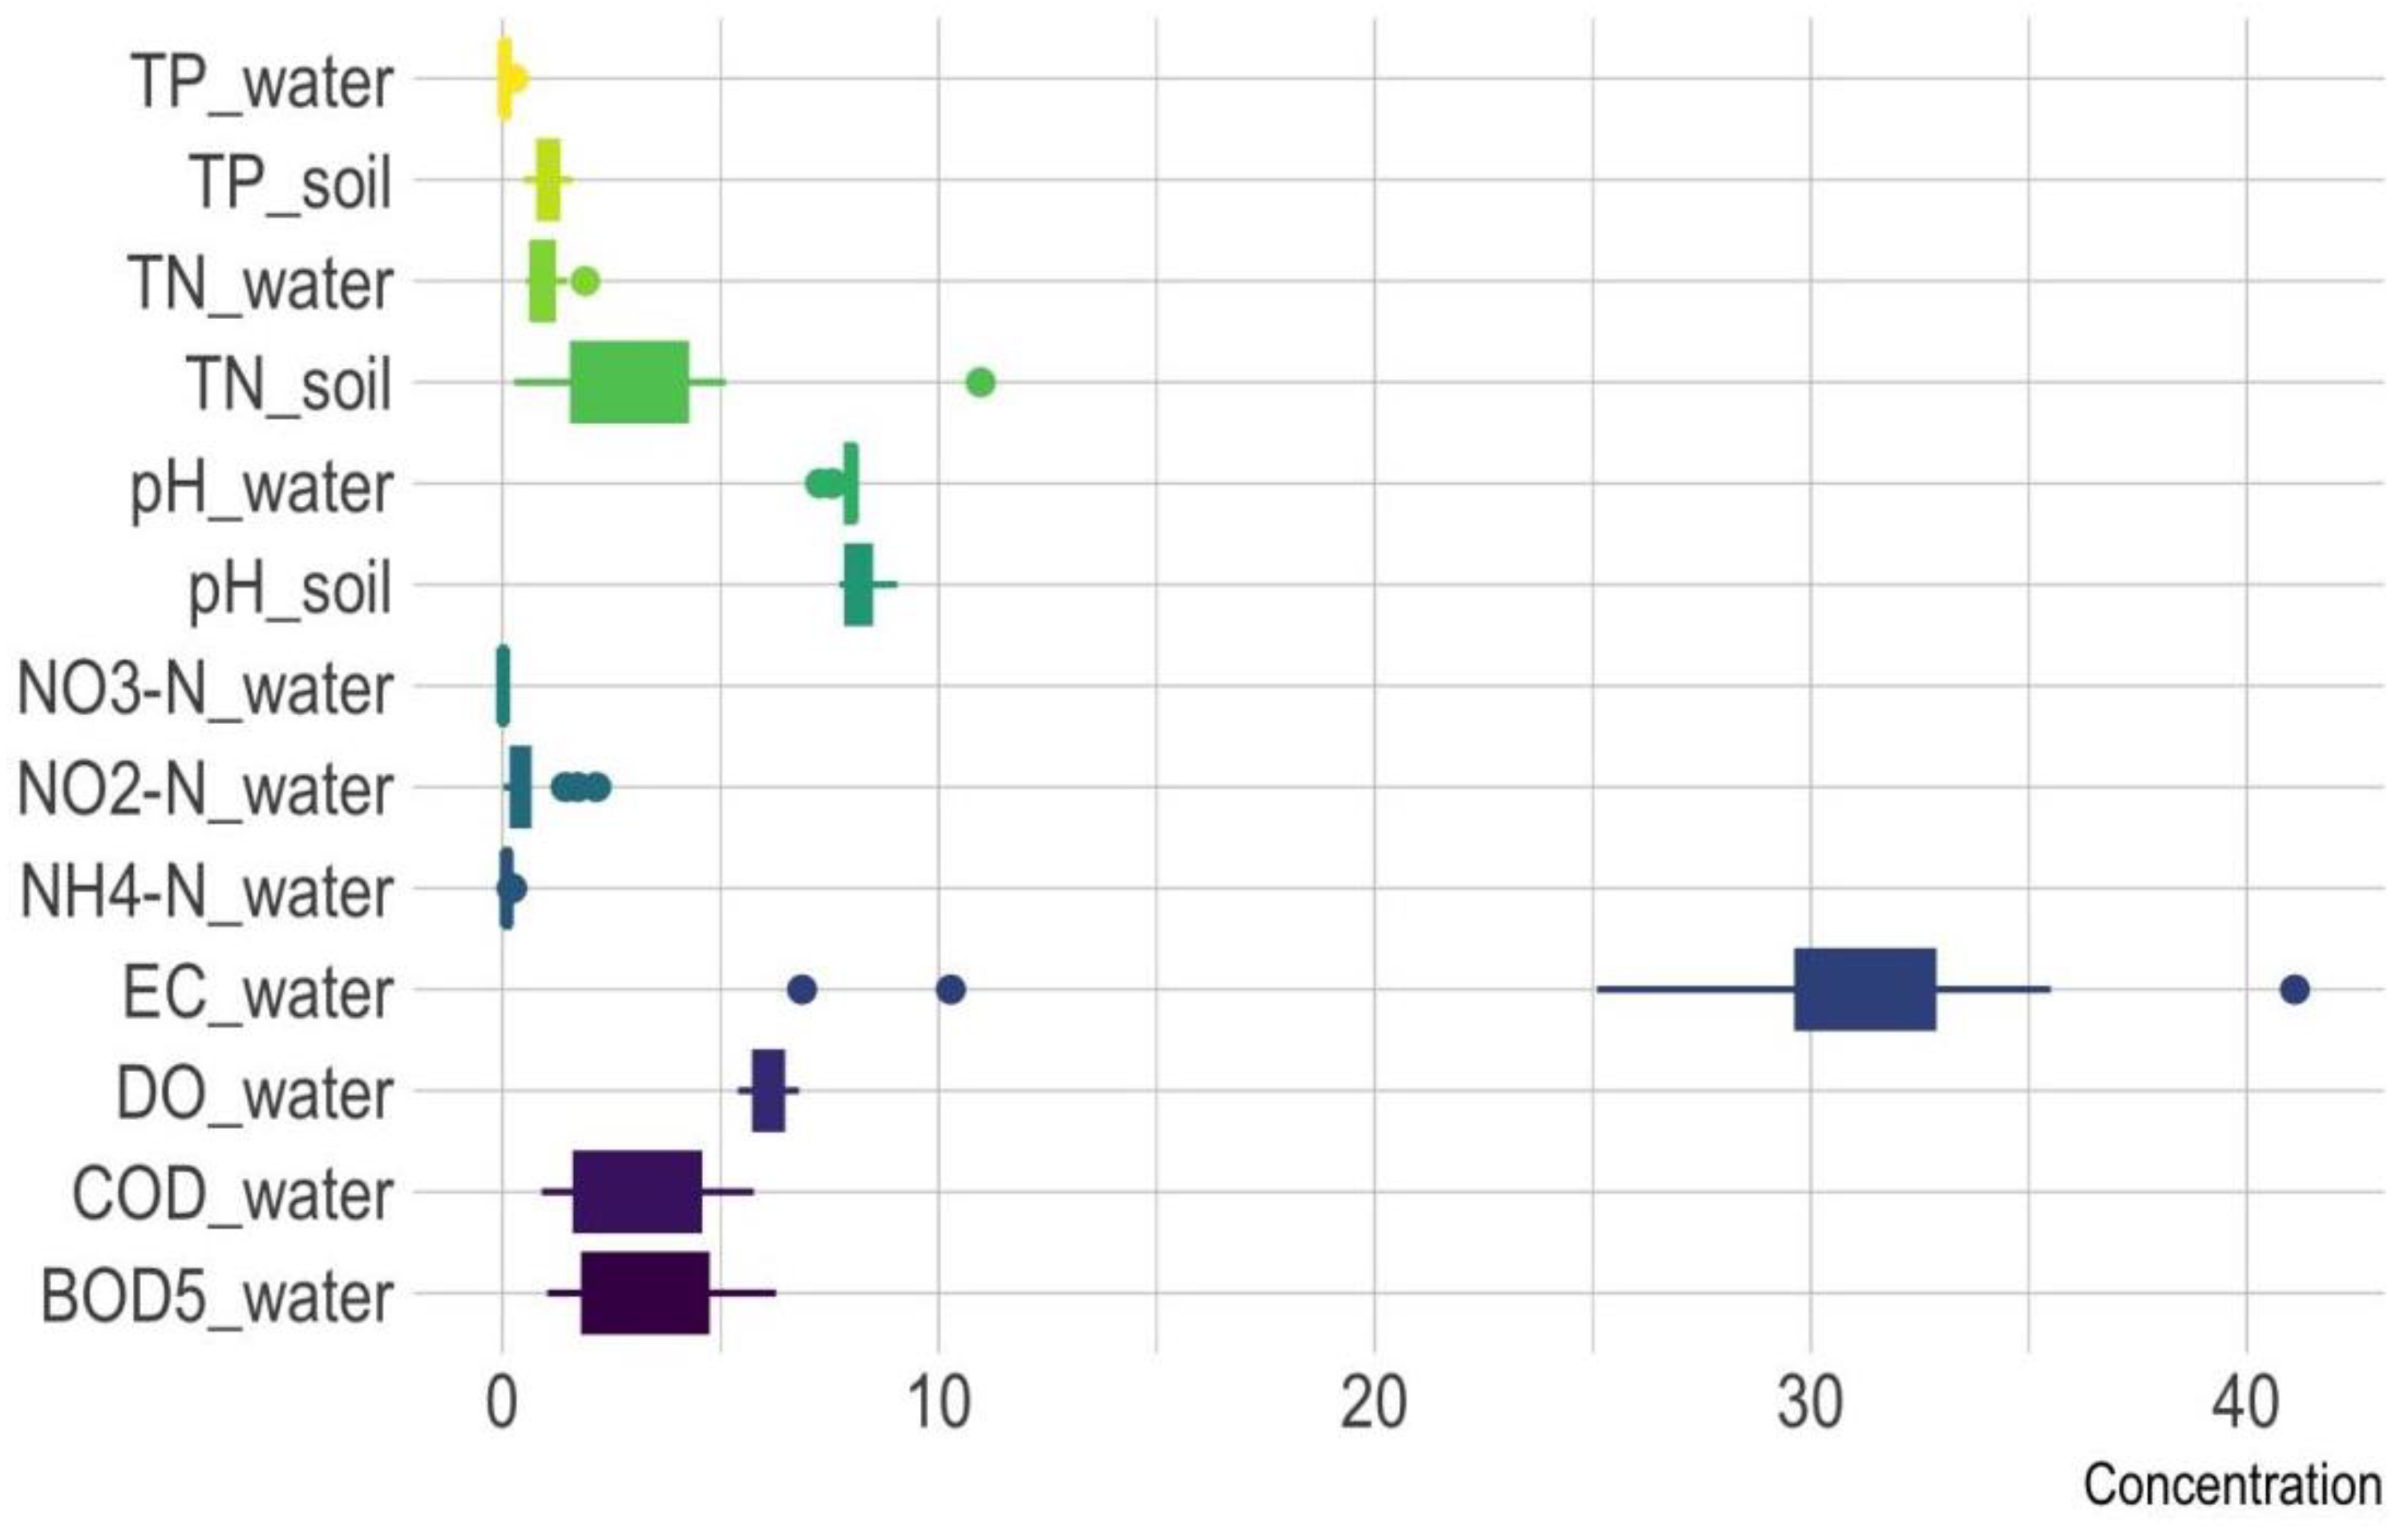
3.1. Statistical Description of Water Quality Parameters

Table 1 and Figure 2 present the water quality parameters of Qinghai Lake, including the TN, TP, NO3-N, NH4+-N, NO2-N, pH, DO, chemical oxygen demand (COD), and biochemical oxygen demand (BOD5) levels. The TN levels in Qinghai Lake ranged from 0.54 to 1.90 mg/L, with a mean of 0.96 mg/L and a standard deviation (SD) of 0.38 mg/L. These values are lower than the national average (mean: 1.55 mg/L, SD 0.92) reported by Zhou et al. [49] but align closely with TN levels in northeastern lakes (mean: 1.08 mg/L, SD: 0.31) (Table 2). Similarly, the TP levels (0.03–0.26 mg/L, mean: 0.07 mg/L) in Qinghai Lake were comparable to TP concentrations in northeastern and eastern lakes (mean: 0.07–0.09 mg/L). However, compared to southern lakes, lower variability was observed, where TN and TP exhibited the highest ranges (TN: 0.16–4.40 mg/L; TP: 0.01–0.52 mg/L). The relatively narrow range in Qinghai Lake may indicate less exposure to pollution or a more uniform sampling environment. The maximum values of TN and TP from this study were also higher in Qinghai–Tibet Plateau lakes (Table 2) [49]. The data from Zhou et al. [49] included multiple lakes in the Qinghai–Tibet Plateau, which could be one of the factors contributing to the variations.
The mean concentration of NO3-N was 0.0189 mg/L (0.0038–0.0372 mg/L), with a standard deviation of 0.0133 mg/L, indicating that NO3 contamination was minimal. With values ranging from 0.065 mg/L to 0.150 mg/L, NH4+-N had a higher standard deviation (0.0466 mg/L) suggesting more variability compared to NO3-N. Elevated NH4+ levels may indicate localized organic pollution or reduced nitrification efficiency. The large range (0.0270–0.5867 mg/L) of NO2-N with a standard deviation of 0.6082 mg/L suggests certain hotspots with potentially significant NO2 pollution. DO levels averaged 6.06 mg/L, suggesting relatively oxygen-rich conditions suitable for aquatic life. The mean COD was 3.02 mg/L, while the BOD5 averaged to 3.12 mg/L. A COD-to-BOD5 ratio near 1 indicates that the organic matter present is largely biodegradable. Elevated COD and BOD5 levels in certain locations suggest localized organic pollution that could affect water quality.

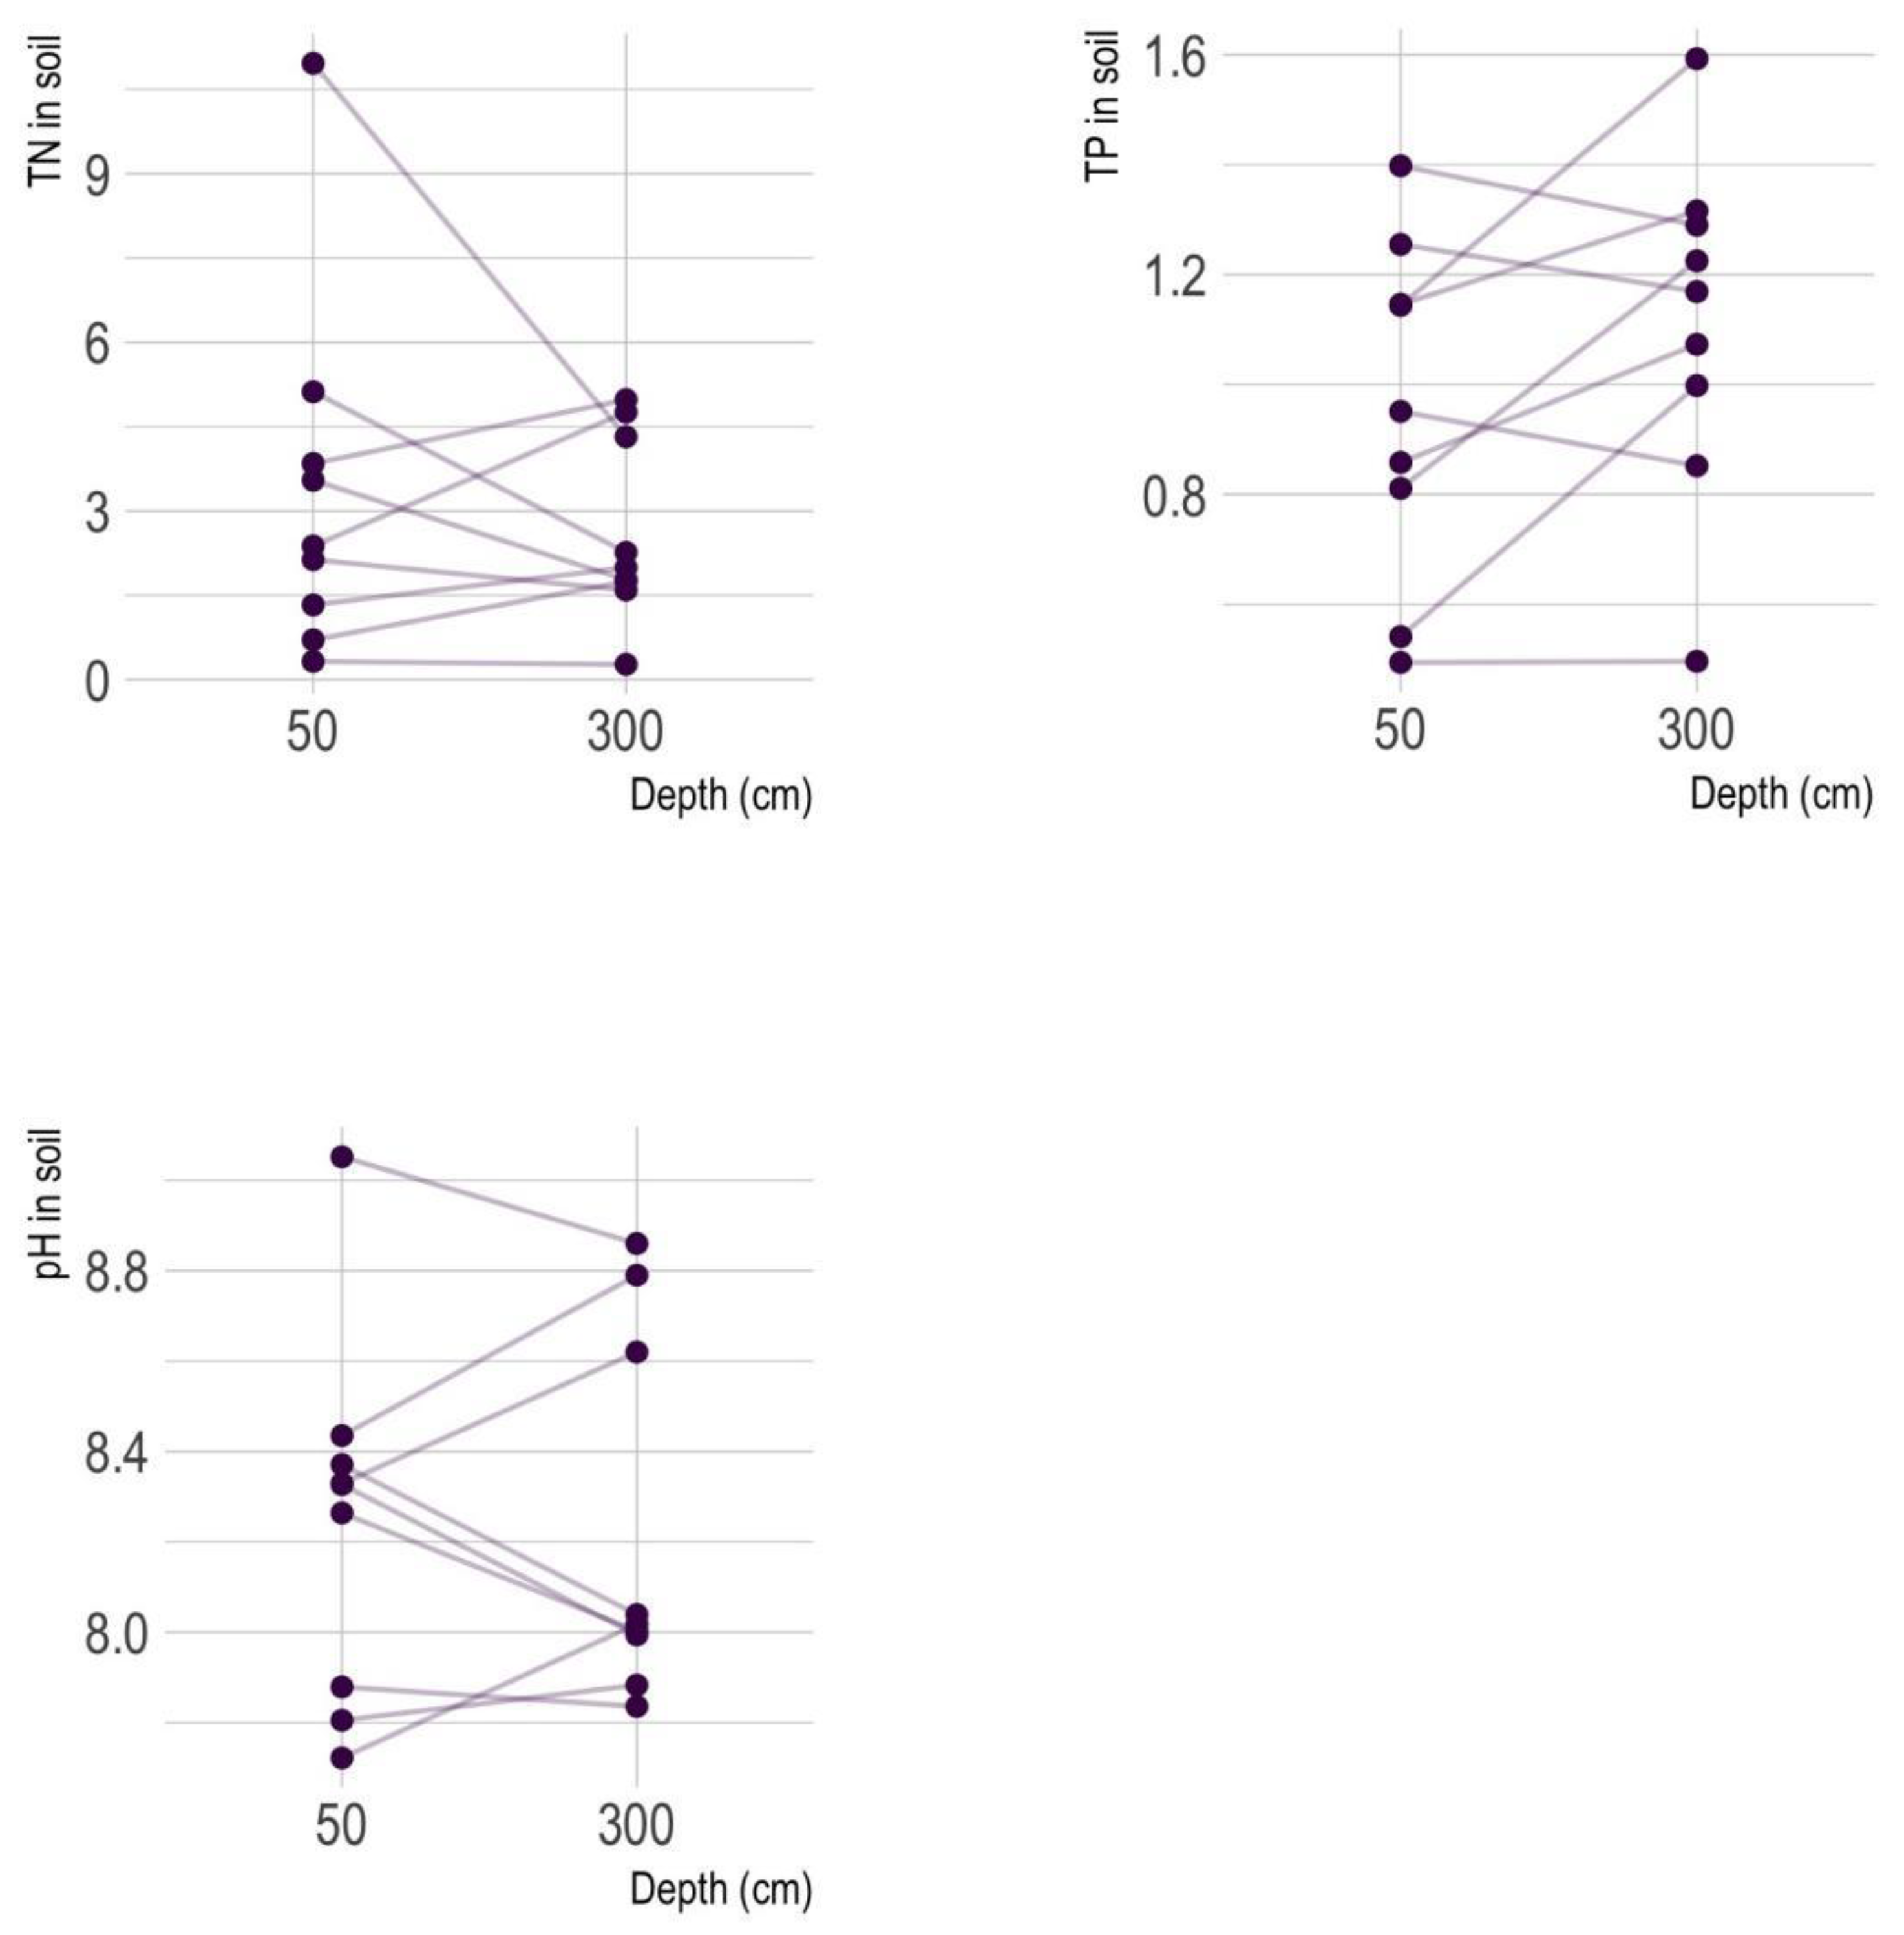
3.2. Statistical Description of Soil Characterization

The pH of soil samples collected around Qinghai Lake predominantly ranges from neutral to slightly alkaline, indicating that the soil is generally alkaline (Figure 2). TN levels exhibited a broad range (0.270–10.964 g/kg), with several samples showing elevated levels. TP values ranged from 0.494 to 1.593 g/kg, with moderate variability. Figure 3 of the pH, TN, and TP in the soil revealed distinct variations between the 50 cm and 300 cm soil depths. At the 50 cm depth, pH values ranged from 7.722 to 9.052, indicating moderately alkaline conditions, while at 300 cm, the range was narrower (7.836 to 8.860), suggesting more stable conditions. TN values were higher at 50 cm, peaking at 10.964 g/kg, compared to a maximum of 4.979 g/kg at 300 cm, likely due to greater organic matter accumulation in shallower soils. As depth increases, organic inputs decrease, and N cycling processes slow down [50]. Conversely, TP values exhibited less variation across depths, though higher concentrations at 300 cm (up to 1.593 g/kg) may reflect mineralization or phosphorus-rich parent materials. These results highlight greater variability and nutrient availability in shallow soils (50 cm) around Qinghai Lake, while deeper soils (300 cm) exhibited more stable conditions with lower N levels (Figure 3).

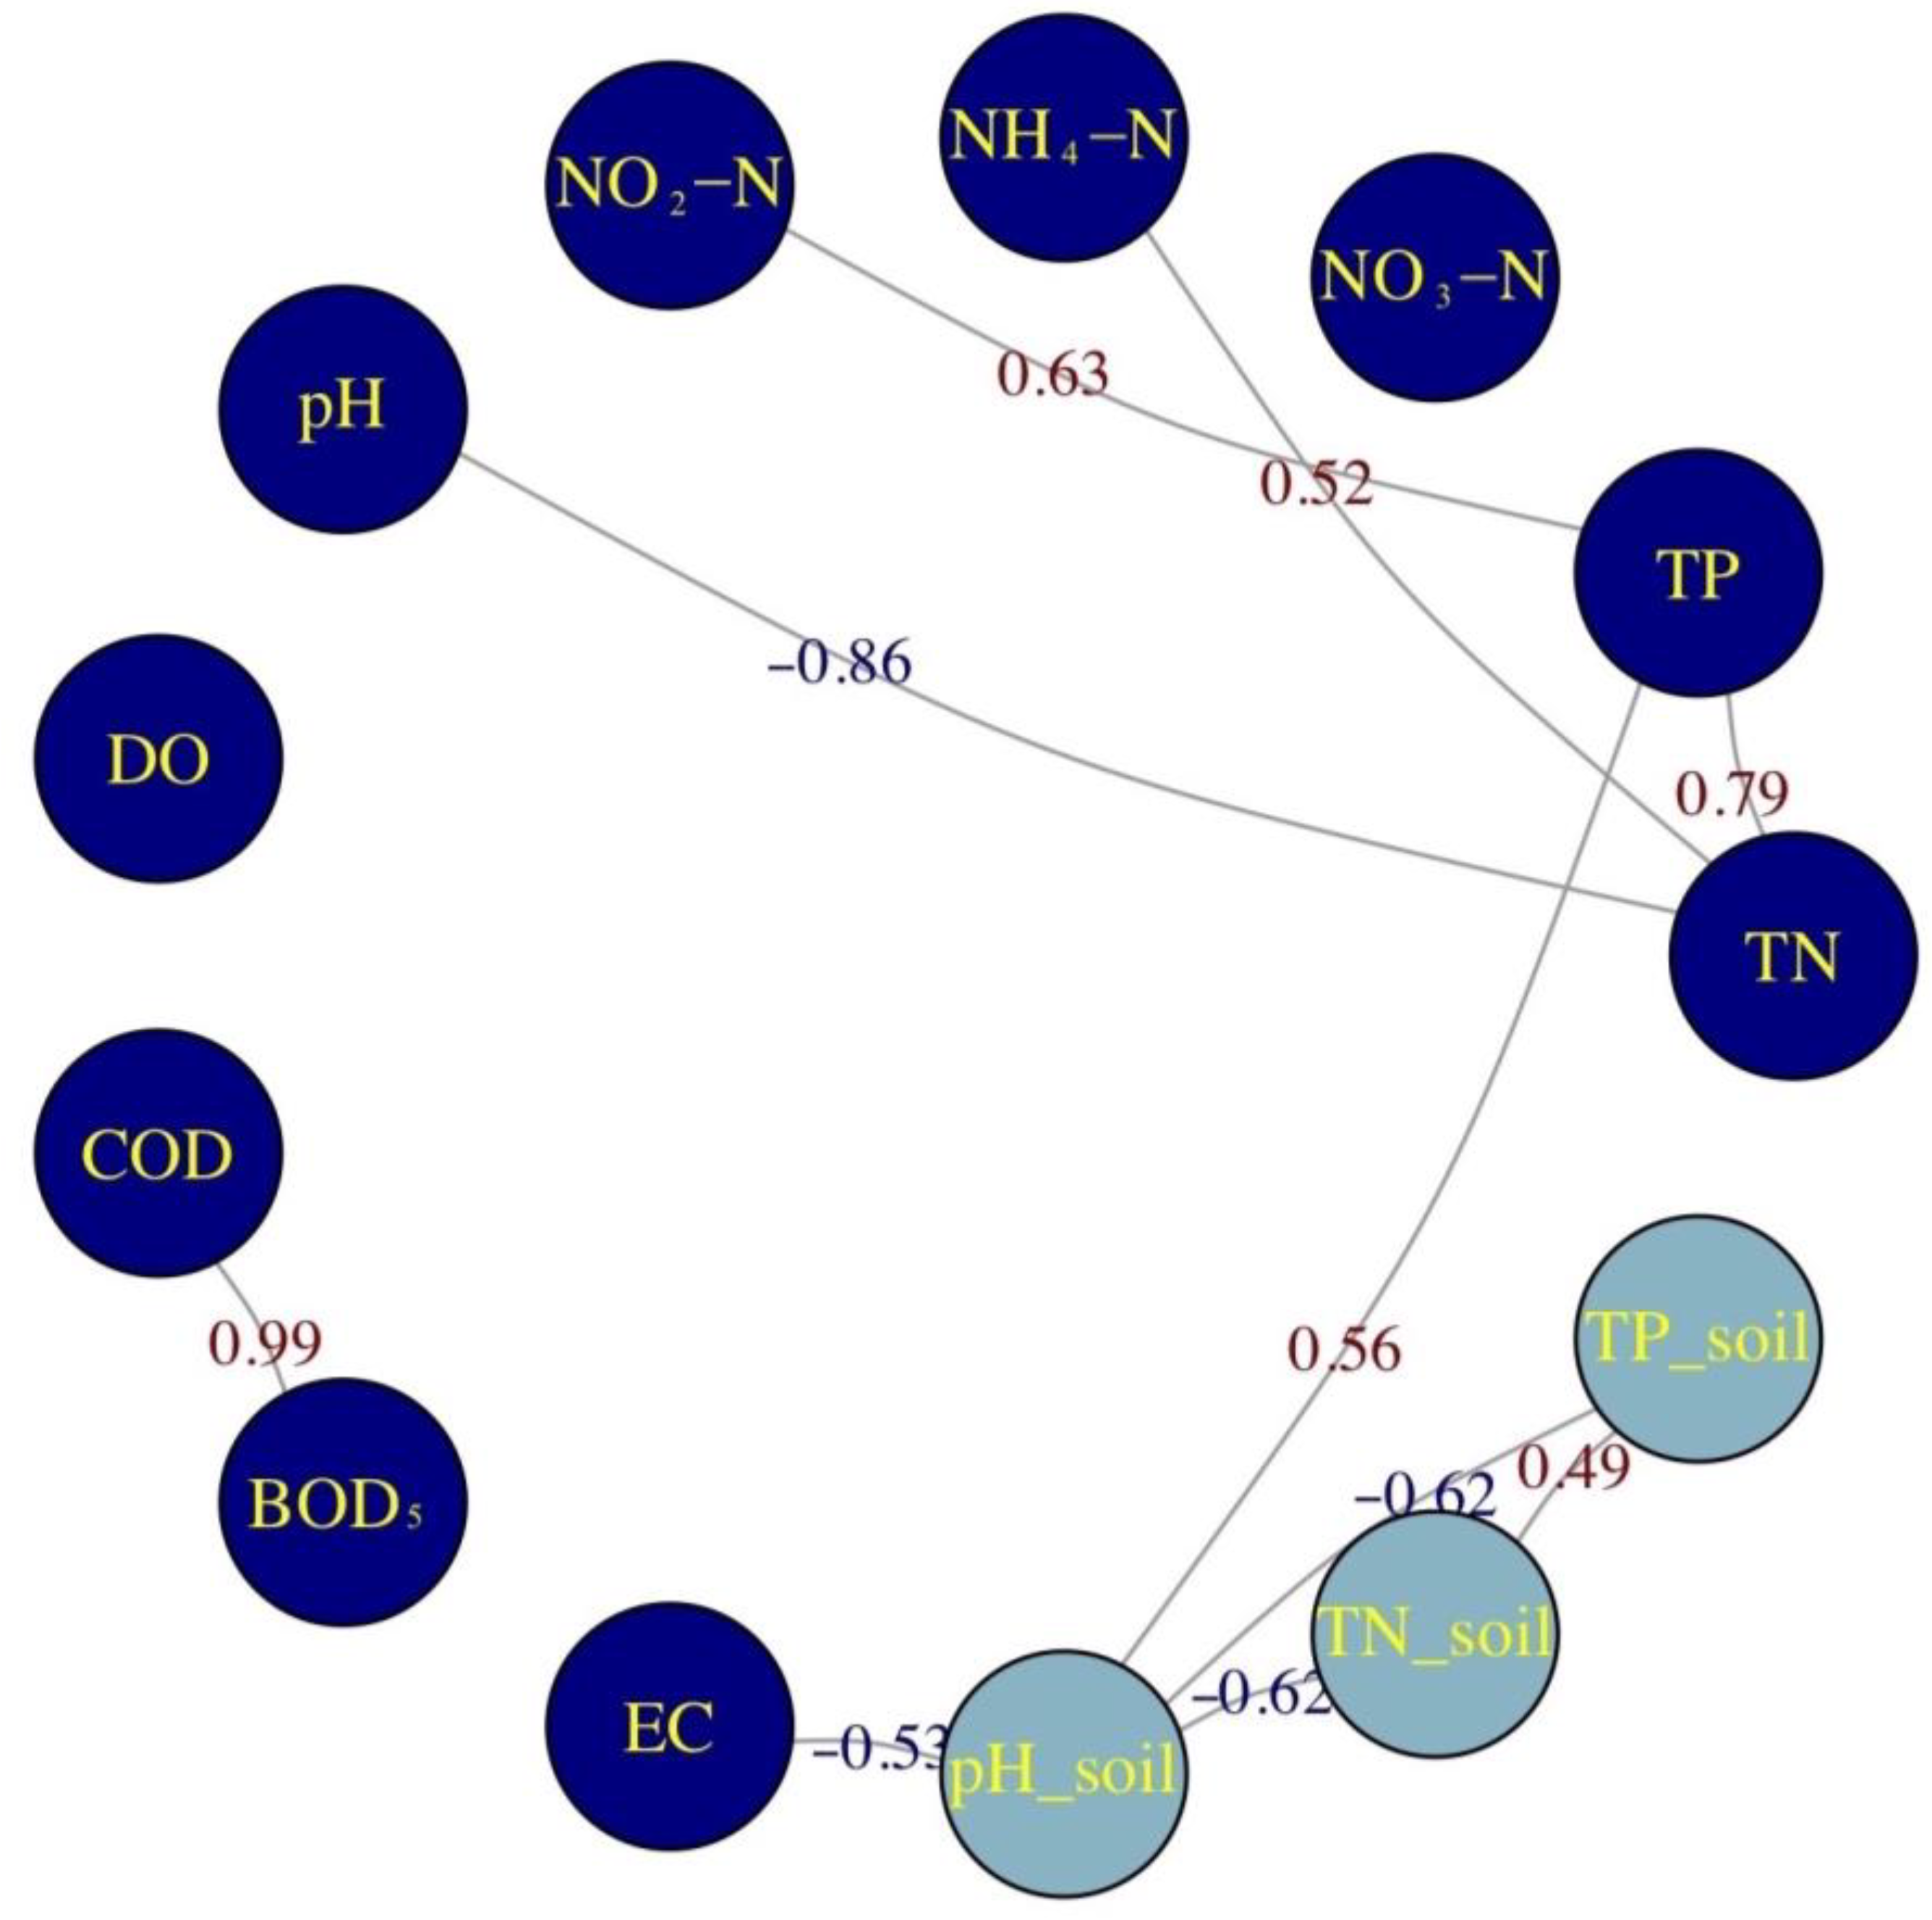
3.3. Correlation Analysis

Pearson correlation analysis was conducted to explore the relationships among water quality parameters (Figure 4). TN and TP had a strong correlation (r = 0.79, p < 0.001) as well as COD and BOD5 (r = 0.99, p < 0.001). Moderately positive correlations were observed between TN and NH4+-N (r = 0.52, p < 0.05). The relationship between TP and NO2-N (r = 0.629, p < 0.05) suggested a connection between total P and NO2-N. Significantly negative correlations were found between TN and pH. Elevated TN levels may lead to processes like nitrification, which lowers pH, suggesting interactions between nutrient levels and acidification, possibly due to nitrification releasing hydrogen ions [51,52]. Higher P levels in water significantly correlate with pH (r = 0.56) in soil. The relationship of TN and TP in soil (r = 0.49) indicates that TN and TP in soil likely share similar sources or accumulation patterns. The correlations highlight the interconnectedness of N and P cycles, both in water and soil. Significant correlation between the TN and TP in soil suggests co-occurrence of nutrients in terrestrial environments, which can influence nutrient leaching into aquatic systems.

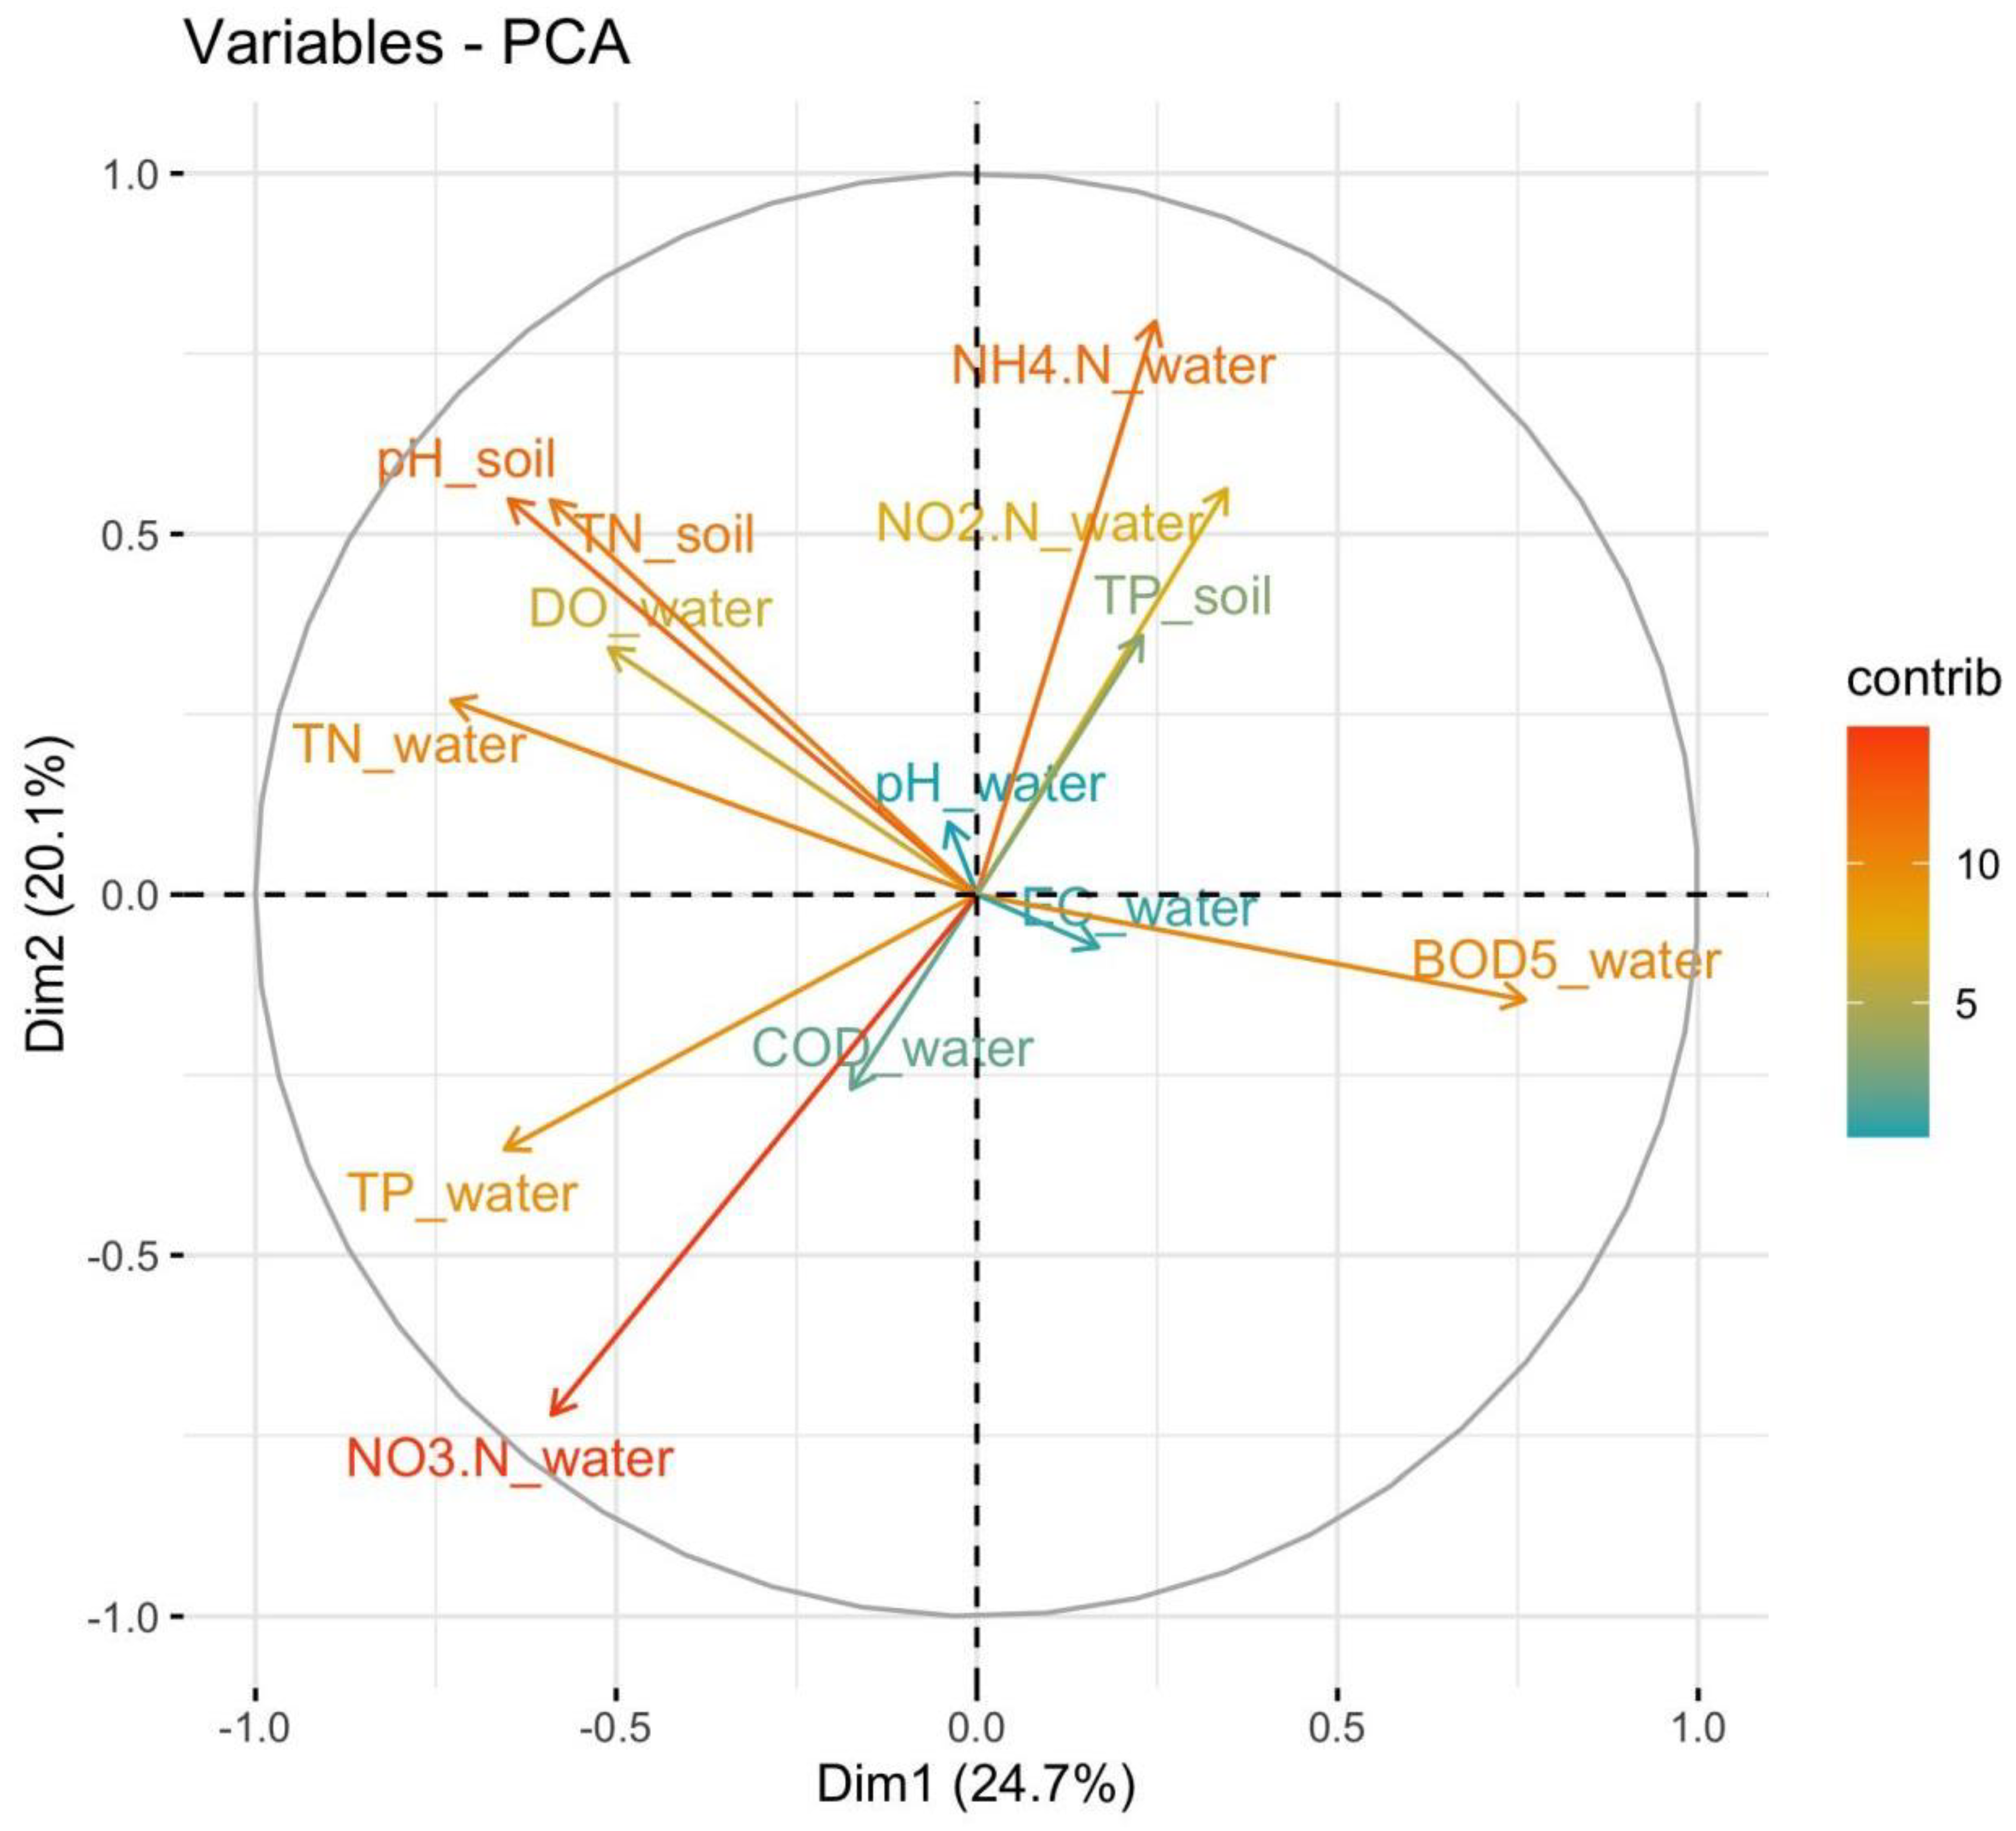
3.4. Principal Component Analysis

The results of the PCA of the data indicated that the first five principal components captured significant variation within the dataset, with an eigenvalue greater than 1 based on the Kaiser criterion, and explained 81.83% of the variables (Table S1) [47]. Figure 5 shows the contribution plot of variables for the first two principal components. The absolute value of the contribution indicates the loadings of these variables to the PC. The eigenvectors of variables of the first five PCs are presented in Table S2. The analysis focused on the first two principal components (PC1 and PC2), which together explained 44.81% of the total variance, providing a clear representation of the underlying patterns in the data. We chose to focus on them for further interpretation, which aligns with the common practice of reducing dimensionality while retaining key information.
PC1 appeared to capture a substantial portion of the variance (24.67%), reflecting a gradient of water quality impacted by nutrient load and organic pollution. BOD5_water (−0.4245), TN_water (0.4067), TP_water (0.3653), pH_soil (0.3623), and TN_soil (0.3298) were variables that had high positive loadings, meaning PC1 was strongly associated with nutrient levels in the water and soil (Table S2). The negative loading of BOD5_water indicated that higher biological oxygen demand, a sign of organic pollution, was inversely related to the gradient captured by PC1. This suggests that pollution or microbial activity reduces water quality relative to nutrient levels [53]. PC2 captured a secondary environmental gradient strongly influenced by N cycling, particularly NH4+ and NO2, as well as soil quality (pH and TN), suggesting that PC2 was associated with conditions of nutrient cycling and soil health. PC2 explained 20.14% of the variance, with the strongest positive loading for NH4+-N in water (0.491), indicating that PC2 was strongly associated with NH4+ concentrations.

3.5. Regression Model Results

The multiple linear regression model examined the relationship between NH4+-N, NO3-N, and NO2-N in water and various environmental factors, including water and soil quality indicators. The model results (Table 3) of NH4+-N showed a high explanatory power with an R2 value of 0.96 (p < 0.01), indicating that approximately 96% of the variability in NH4+-N could be explained by the selected predictors in water and soil. The significant predictors with p-values less than 0.05 included the TN in water, TP in water, pH in water, DO in water, COD in water, BOD5 in water, Electrical Conductivity (EC) in water, pH in soil, TN in soil, and TP in soil, suggesting strong associations between these variables and NH4+-N concentrations. Among the predictors, TN and TP in water exhibited negative coefficients, implying that higher levels of TN and TP in water are associated with lower NH4+-N concentrations. This may reflect nutrient cycling dynamics, where high nutrient loading could influence microbial processes, possibly favoring other N forms or contributing to nutrient imbalances that reduce NH4+-N availability [54]. The strong negative effect of TP in water highlights the importance of P in influencing N content. Increased P content, especially relative to N content, may lead to eutrophication, promoting the excessive growth of algae. As algae proliferate, they consume available N forms, such as NO3- and NH4+, potentially changing the N balance in water [55,56]. In contrast, positive relationships were observed for the DO in water, COD in water, and BOD5 in water, suggesting that increased oxygen levels and organic matter decomposition may contribute to higher NH4+-N values. The pH variables, both in water and soil, showed significantly negative effects, potentially indicating that lower pH values are associated with higher NH4+-N concentrations. Lower pH can enhance NH4+ solubility and availability, but the negative effect might indicate that acidic conditions, typical of high anthropogenic impact or acidification, might reduce NH4+-N concentrations through processes like volatilization or changes in N species dynamics [57].
Similarly, the TN and TP in the soil showed positive relationships with NH4+-N in water, suggesting that soil nutrient content is positively correlated with NH4+ concentrations, potentially due to soil microbial activity or mineralization processes. Lake ecosystems typically receive the majority of their nutrient inputs from surrounding watersheds [58]. In addition, in lakes situated in relatively undisturbed environments with low nutrient loading from their watersheds, atmospheric deposition of N and P may also play a significant role in the overall nutrient input dynamics [59]. Dissolved inorganic nutrients can enter the lake from many sources, including upstream, groundwater, and surface runoff, the waste products of mobile animals, and atmospheric inputs. Watersheds often contain a variety of land uses such as agriculture, forestry, and urban areas which can lead to nutrient runoff through surface water, groundwater, and even direct deposition into lakes [60,61]. Agricultural land uses with high fertilizer application rates are known to significantly increase N and P inputs to lakes, contributing to eutrophication [62,63,64]. The areas proximate to the input rivers of Qinghai Lake are known farmlands, which could lead to the TN and TP in soil contribution to the N in Qinghai Lake [65,66]. Reducing nutrient runoff from agricultural areas through measures such as riparian buffers, nutrient management, and improved wastewater treatment can significantly decrease the nutrient loading to lakes and mitigate eutrophication [67,68]. The model results did not show a robust performance after removing TN in water as a predictor with R2 of 0.80 (p < 0.1), indicating that TN in water may be a critical predictor for the NH4+-N in Qinghai Lake.
The results of the multiple linear regression model of NO3-N had a strong explanatory power with an R2 value of 0.90 (p < 0.05), indicating that about 90% of the variability in NO3-N could be explained by the included predictors (Table 4). The positive coefficient for TN in water (0.76, p > 0.05) suggests that while TN in water may have been positively associated with NO3-N concentrations, the relationship was not statistically strong. Previous studies have shown that N loading in aquatic systems can drive the conversion of NH4+ to NO3 through nitrification [69,70]. However, the non-significance here could suggest other dominant factors influencing NO3-N levels in the system, such as nutrient ratios or microbial activity. TN is often positively correlated with NO3 concentrations, but other factors like pH and dissolved oxygen can modify the strength of this relationship [71,72]. The positive relationship between TP in water and NO3-N (coefficient = 11.16173, p < 0.05) is statistically significant, suggesting that higher P concentrations in water promote higher NO3-N levels. This aligns with the findings of previous studies reported that TP can stimulate the growth of algae and other primary producers, which, in turn, could influence N dynamics in aquatic environments by enhancing nitrification and the production of NO3 [73,74,75]. However, a non-significant p-value of DO suggests no strong or clear relationship between DO and NO3-N in this model. However, Liu et al. [76] reported that DO influences the transformation of NO3-N by altering the microbial community structure, bacterial co-occurrence patterns, and expression of functional genes during the transition between aerobic and anoxic conditions. The positive relationship (coefficient = 0.63933, p < 0.05) between EC and NO3-N suggests that higher levels of dissolved ions in the water were associated with elevated NO3 concentrations. The negative coefficient for TP in soil (−0.02950, p < 0.01) suggests that higher P concentrations in soil may decrease NO3-N concentrations. This could be due to the fact that P and N are often limiting nutrients in aquatic ecosystems, and high P levels might shift the microbial community to favor processes that immobilize N [77,78].
When TN in water was removed as an independent variable to rerun the model, the results yielded a robust predictive performance with R2 of 0.87 (p < 0.05). The statistically significant indicators were TP in water, COD in water, and TP in soil, indicating that the TP in water and soil around Qinghai Lake are critical predictors for the NO3-N levels in Qinghai Lake.
No significant results of the regression model of NO2-N suggests that other environmental variables or other activities which may have influenced NO2-N concentrations were not included (Table 5). The predictors investigated here could not perform a regression model with accuracy.
The land use types of the soil sampling were mainly grassland, while only two of them were bare ground (Figure S1). Studies have reported that various factors influence NO3 leaching from rangeland soils, with the most important ones affecting leaching being texture and structure [8]. Soil erosion is also a major contributor of nutrients to streams and lakes [79]. N in rangeland may leach to groundwater or be lost to the atmosphere and transported to nearby streams and lakes [80]. During flooding, bank erosion occurs, transporting N and P from the adjacent land into a lake [81]. Iqbal et al. [82] reported that land use occupations, specifically farmland and rural areas, indicated a strong relationship with NO3--N in groundwater in the Nansi Lake Basin. In New Zealand, a study tried to determine the relationships between land use and N and P in lakes and found that grassland was the most important predictor of TN and TP in lakes [83]. Kosten et al. [84] also found that land use and hydrology played important roles in N and P limitations in lakes. Similarly, studies have reported that N processing in lakes is also sensitive to the hydrology and loading of the catchment [85]. In addition to hydrology, water’s physicochemical characteristics were also reported to affect nutrient dynamics in lakes. In a study trying to find the factors affecting N and P diffusive fluxes in Erhai Lake, the results indicated that the physicochemical properties of the water affected the N diffusive flux slightly [86].

4. Limitations and Further Research

The inclusion of more granular data, such as seasonal variations or temperature data, could provide a deeper understanding of the temporal and spatial variability in NO3 concentrations in the system. Processes like denitrification, sensitive to factors such as land management and seasonal fluctuations, could also not be fully captured by the regression model [87,88]. Further work including these aspects could provide deeper insights into N cycling processes in aquatic systems.

5. Conclusions

This study provides a comprehensive analysis of N compounds in Qinghai Lake and their relationship with environmental factors, including water and soil quality indicators. The results highlight the significant roles of TN and TP in grassland soil in influencing N dynamics in Qinghai Lake’s water. Regression analyses indicated that the TP in water and soil, along with the dissolved oxygen and chemical oxygen demand, are critical predictors of N concentrations, particularly of NH4+ and NO3 levels. Despite the valuable insights gained, this study’s limitations include the exclusion of seasonal, temperature, and precipitation variations, which could affect N cycling and transformation processes. Future research incorporating these factors, along with a focus on denitrification processes, would provide a more detailed understanding of N dynamics and improve water quality management strategies for Qinghai Lake and similar high-altitude aquatic ecosystems.

Supplementary Materials

The following supporting information can be downloaded at: https://www.mdpi.com/article/10.3390/w17040472/s1. Figure S1. Landuse of soil sampling sites; Table S1. Eigenvalues and explained variance of principal components; Table S2. Eigenvectors of variables in the first five principal components.

Author Contributions

Conceptualization, L.D. and L.W.; methodology, L.D.; software, J.Z.; validation, J.Z., Q.P. and G.L.; formal analysis, D.D. and J.Z.; investigation, M.D.; resources, Y.M.; data curation, J.Z. and D.D.; writing—original draft preparation, G.L. and J.Z.; writing—review and editing, L.D.; visualization, J.Z. and L.D.; supervision, L.W.; project administration, L.W.; funding acquisition, L.W. All authors have read and agreed to the published version of the manuscript.

Funding

This research was funded by the Basic Research Program of Qinghai Province (2023-ZJ-910M).

Data Availability Statement

The raw data supporting the conclusions of this article will be made available by the authors on request.

Acknowledgments

We also sincerely thank the editor and the anonymous reviewers for their valuable comments and suggestions, which have significantly improved the quality of this manuscript.

Conflicts of Interest

The authors declare no conflict of interest.

References

  1. Zeng, J.; Jiao, C.; Zhao, D.; Xu, H.; Huang, R.; Cao, X.; Yu, Z.; Wu, Q.L. Patterns and assembly processes of planktonic and sedimentary bacterial community differ along a trophic gradient in freshwater lakes. Ecol. Indic. 2019, 106, 105491. [Google Scholar] [CrossRef]
  2. Obiero, K.; Lawrence, T.; Ives, J.; Smith, S.; Njaya, F.; Kayanda, R.; Waidbacher, H.; Olago, D.; Miriti, E.; Hecky, R.E. Advancing Africa’s great lakes research and academic potential: Answering the call for harmonized, long-term, collaborative networks and partnerships. J. Great Lakes Res. 2020, 46, 1240–1250. [Google Scholar] [CrossRef]
  3. Hirji, R.F.; Duda, A. Integrated management of lakes, reservoirs, and their basins is critical for a climate-resilient planet: An urgent wake-up call from collective amnesia. Water Policy 2024, 27, wp2024296. [Google Scholar] [CrossRef]
  4. Biggs, E.M.; Bruce, E.; Boruff, B.; Duncan, J.M.; Horsley, J.; Pauli, N.; McNeill, K.; Neef, A.; Van Ogtrop, F.; Curnow, J.; et al. Sustainable development and the water–energy–food nexus: A perspective on livelihoods. Environ. Sci. Policy 2015, 54, 389–397. [Google Scholar] [CrossRef]
  5. Li, Q.; Dai, J.; Zhang, H.; Wan, Z.; Xu, J. Potentially toxic elements in lake sediments in China: Spatial distribution, ecological risks, and influencing factors. Sci. Total Environ. 2023, 868, 161596. [Google Scholar] [CrossRef]
  6. Qin, B.; Zhang, Y.; Zhu, G.; Gao, G. Eutrophication control of large shallow lakes in China. Sci. Total Environ. 2023, 881, 163494. [Google Scholar] [CrossRef]
  7. Chen, Y.; Wang, Y. Qionghai Lake, Sichuan, China: Environmental degradation and the need for multidimensional management. Mt. Res. Dev. 2003, 23, 65–72. [Google Scholar]
  8. Nieder, R.; Benbi, D.K.; Reichl, F.X.; Nieder, R.; Benbi, D.K.; Reichl, F.X. Reactive water-soluble forms of nitrogen and phosphorus and their impacts on environment and human health. In Soil Components and Human Health; Springer: Dordrecht, The Netherlands, 2018; pp. 223–255. [Google Scholar]
  9. Zaldívar, J.M.; Viaroli, P.; Newton, A.; De Wit, R.; Ibañez, C.; Reizopoulou, S.; Somma, F.; Razinkovas, A.; Basset, A.; Holmer, M.; et al. Eutrophication in transitional waters: An overview. Trans. Waters Monogr. 2008, 2, 1–78. [Google Scholar] [CrossRef]
  10. Paerl, H.W.; Scott, J.T.; McCarthy, M.J.; Newell, S.E.; Gardner, W.S.; Havens, K.E.; Hoffman, D.K.; Wilhelm, S.W.; Wurtsbaugh, W.A. It takes two to tango: When and where dual nutrient (N & P) reductions are needed to protect lakes and downstream ecosystems. Environ. Sci. Technol. 2016, 50, 10805–10813. [Google Scholar] [CrossRef]
  11. Mohamed, M.N.; Wellen, C.; Parsons, C.T.; Taylor, W.D.; Arhonditsis, G.; Chomicki, K.M.; Boyd, D.; Weidman, P.; Mundle, S.O.; Cappellen, V.; et al. Understanding and managing the re-eutrophication of Lake Erie: Knowledge gaps and research priorities. Freshw. Sci. 2019, 38, 675–691. [Google Scholar] [CrossRef]
  12. Ayele, H.S.; Atlabachew, M. Review of characterization, factors, impacts, and solutions of Lake eutrophication: Lesson for lake Tana, Ethiopia. Environ. Sci. Pollut. Res. 2021, 28, 14233–14252. [Google Scholar] [CrossRef]
  13. Suresh, K.; Tang, T.; Van Vliet, M.T.; Bierkens, M.F.; Strokal, M.; Sorger-Domenigg, F.; Wada, Y. Recent advancement in water quality indicators for eutrophication in global freshwater lakes. Environ. Res. Lett. 2023, 18, 063004. [Google Scholar] [CrossRef]
  14. Piacente, J.N.; Milanovich, J.R.; Berg, M.B.; Hoellein, T.J.; Muñoz, A.G.; Cann, A.A.; Lentini, I.S. Characterizing lentic habitats in golf courses and adjacent green spaces: Water quality, water chemistry, pesticide concentrations, and algal concentrations. J. Freshw. Ecol. 2020, 35, 507–522. [Google Scholar] [CrossRef]
  15. Hampton, S.E.; McGowan, S.; Ozersky, T.; Virdis, S.G.; Vu, T.T.; Spanbauer, T.L.; Kraemer, B.M.; Swann, G.; Mackay, A.W.; Powers, S.M.; et al. Recent ecological change in ancient lakes. Limnol. Oceanogr. 2018, 63, 2277–2304. [Google Scholar] [CrossRef]
  16. Best, J. Anthropogenic stresses on the world’s big rivers. Nat. Geosci. 2019, 12, 7–21. [Google Scholar] [CrossRef]
  17. Geider, R.J.; Delucia, E.H.; Falkowski, G.; Finzi, A.C.; Grime, J.P.; Grace, J.; Kana, T.M.; La Roche, J.; Long, S.P.; Osborne, B.A.; et al. Primary productivity of planet earth: Biological determinants and physical constraints in terrestrial and aquatic habitats. Glob. Change Biol. 2001, 7, 849–882. [Google Scholar] [CrossRef]
  18. LeBauer, D.S.; Treseder, K.K. Nitrogen limitation of net primary productivity in terrestrial ecosystems is globally distributed. Ecology 2008, 89, 371–379. [Google Scholar] [CrossRef] [PubMed]
  19. Sun, H.; Han, C.; Liu, Z.; Wei, Y.; Ma, S.; Bao, Q.; Zhang, Y.; Yan, H. Nutrient limitations on primary productivity and phosphorus removal by biological carbon pumps in dammed karst rivers: Implications for eutrophication control. J. Hydrol. 2022, 607, 127480. [Google Scholar] [CrossRef]
  20. Longhi, D.; Bartoli, M.; Nizzoli, D.; Laini, A.; Viaroli, P. Do oxic–anoxic transitions constrain organic matter mineralization in eutrophic freshwater wetlands? Hydrobiologia 2016, 774, 81–92. [Google Scholar] [CrossRef]
  21. Liu, X.; Li, Y.; Shen, R.; Zhang, M.; Chen, F. Reducing nutrient increases diatom biomass in a subtropical eutrophic lake, China–Do the ammonium concentration and nitrate to ammonium ratio play a role? Water Res. 2022, 218, 118493. [Google Scholar] [CrossRef]
  22. Ventura, M.; Liboriussen, L.; Lauridsen, T.; Søndergaard, M.; Søndergaard, M.; Jeppesen, E. Effects of increased temperature and nutrient enrichment on the stoichiometry of primary producers and consumers in temperate shallow lakes. Freshw. Biol. 2008, 53, 1434–1452. [Google Scholar] [CrossRef]
  23. Elser, J.J.; Andersen, T.; Baron, J.S.; Bergström, A.K.; Jansson, M.; Kyle, M.; Nydick, K.R.; Steger, L.; Hessen, D.O. Shifts in lake N: P stoichiometry and nutrient limitation driven by atmospheric nitrogen deposition. Science 2009, 326, 835–837. [Google Scholar] [CrossRef]
  24. Kuhn, D.D.; Drahos, D.D.; Marsh, L.; Flick Jr, G.J. Evaluation of nitrifying bacteria product to improve nitrification efficacy in recirculating aquaculture systems. Aquacult. Eng. 2010, 43, 78–82. [Google Scholar] [CrossRef]
  25. Moss, B.; Jeppesen, E.; Søndergaard, M.; Lauridsen, T.L.; Liu, Z. Nitrogen, macrophytes, shallow lakes and nutrient limitation: Resolution of a current controversy? Hydrobiologia 2013, 710, 3–21. [Google Scholar] [CrossRef]
  26. Moloantoa, K.M.; Khetsha, Z.P.; Van Heerden, E.; Castillo, J.C.; Cason, E.D. Nitrate water contamination from industrial activities and complete denitrification as a remediation option. Water 2022, 14, 799. [Google Scholar] [CrossRef]
  27. Liu, T.; Yuan, J.; Dong, W.; Wu, H.; Wang, H. Effects on inorganic nitrogen compounds release of contaminated sediment treatment with in situ calcium nitrate injection. Environ. Sci. Pollut. Res. 2015, 22, 1250–1260. [Google Scholar] [CrossRef]
  28. Pinheiro, J.P.S.; Windsor, F.M.; Wilson, R.W.; Tyler, C.R. Global variation in freshwater physico-chemistry and its influence on chemical toxicity in aquatic wildlife. Biol. Rev. 2021, 96, 1528–1546. [Google Scholar] [CrossRef] [PubMed]
  29. Qin, B.; Zhou, J.; Elser, J.J.; Gardner, W.S.; Deng, J.; Brookes, J.D. Water depth underpins the relative roles and fates of nitrogen and phosphorus in lakes. Environ. Sci. Technol. 2020, 54, 3191–3198. [Google Scholar] [CrossRef]
  30. Conley, D.J.; Paerl, H.W.; Howarth, R.W.; Boesch, D.F.; Seitzinger, S.P.; Havens, K.E.; Lancelot, C.; Likens, G.E. Controlling eutrophication: Nitrogen and phosphorus. Science 2009, 323, 1014–1015. [Google Scholar] [CrossRef]
  31. Dodds, W.K.; Smith, V.H. Nitrogen, phosphorus, and eutrophication in streams. Inland Waters 2016, 6, 155–164. [Google Scholar] [CrossRef]
  32. Carpenter, S.R.; Caraco, N.F.; Correll, D.L.; Howarth, R.W.; Sharpley, A.N.; Smith, V.H. Nonpoint pollution of surface waters with phosphorus and nitrogen. Ecol. Appl. 1998, 8, 559–568. [Google Scholar] [CrossRef]
  33. Solovchenko, A.; Verschoor, A.M.; Jablonowski, N.D.; Nedbal, L. Phosphorus from wastewater to crops: An alternative path involving microalgae. Biotechnol. Adv. 2016, 34, 550–564. [Google Scholar] [CrossRef]
  34. Fan, C.; Song, C.; Li, W.; Liu, K.; Cheng, J.; Fu, C.; Chen, T.; Ke, L.; Wang, J. What drives the rapid water-level recovery of the largest lake (Qinghai Lake) of China over the past half century? J. Hydrol. 2021, 593, 125921. [Google Scholar] [CrossRef]
  35. Bernhardt, E.S.; Band, L.E.; Walsh, C.J.; Berke, E. Understanding, managing, and minimizing urban impacts on surface water nitrogen loading. Ann. N. Y. Acad. Sci. 2008, 1134, 61–96. [Google Scholar] [CrossRef]
  36. HJ 1147-2020; Water Quality-Determination of Nitrite Nitrogen—Spectrophotometric Method. Environmental Protection Standard of the People’s Republic of China: Beijing, China, 2020.
  37. HJ 535-2009; Water Quality-Determination of Ammonia Nitrogen: Nesslerreagent Spectrophotometry. Environmental Protection Standard of the People’s Republic of China: Beijing, China, 2009.
  38. GB/T 7480-1987; Water Quality-Determination of Nitrate—Spectrophotometric Method with Phenol Disulfonic Acid. China National Standards: Beijing, China, 1987.
  39. GB 7493-87; Water Quality-Determination of Nitrogen (Nitrite)-Spectrophotometric Method. China National Standards: Beijing, China, 1987.
  40. GB 7489-87; Water Guality-Determination of Dissolved Oxygen-Iodometric Method. China National Standards: Beijing, China, 1987.
  41. GB 11893-89; Water Quality-Determination of Nitrogen (Nitrite)-Spectrophotometric Method. China National Standards: Beijing, China, 1989.
  42. HJ 636-2012; Water Quality-Determination of Total Nitrogen: Alkaline Potassium Persulfate Digestion UV Spectrophotometric Method. Environmental Protection Standard of the People’s Republic of China: Beijing, China, 2012.
  43. HJ 717-2014; Soil Quality-Determination of Total Nitrogen: Modified Kjeldahlmethod. Environmental Protection Industry Standard: Beijing, China, 2014.
  44. LY/T 1232-2015; Phosphorus Determination Methods of Forest Soils. Forestry Industry Standard: Beijing, China, 2015.
  45. HJ 962-2018; Soil–Determination of pH–Potentiometry. Environmental Protection Standard of the People’s Republic of China: Beijing, China, 2018.
  46. Nasir, M.F.M.; Samsudin, M.S.; Mohamad, I.; Awaluddin, M.R.A.; Mansor, M.A.; Juahir, H.; Ramli, N. River water quality modeling using combined principle component analysis (PCA) and multiple linear regressions (MLR): A case study at Klang River, Malaysia. World Appl. Sci. J. 2011, 14, 73–82. [Google Scholar]
  47. Matli, C.S. Water quality modelling of river mahanadi using principal component analysis (PCA) and multiple linear regression (MLR). Int. J. Environ. 2021, 10, 83–98. [Google Scholar] [CrossRef]
  48. Li, X.; Huang, T.; Ma, W.; Sun, X.; Zhang, H. Effects of rainfall patterns on water quality in a stratified reservoir subject to eutrophication: Implications for management. Sci. Total Environ. 2015, 521, 27–36. [Google Scholar] [CrossRef]
  49. Zhou, N.; Liu, Z.; Liu, K.; Li, X.; Lock, T.R.; Kallenbach, R.L.; Yuan, Z. Carbon, nitrogen, and phosphorus dynamics in China’s lakes: Climatic and geographic influences. Environ. Monit. Assess. 2023, 195, 113. [Google Scholar] [CrossRef]
  50. Van Groenigen, J.W.; Huygens, D.; Boeckx, P.; Kuyper, T.W.; Lubbers, I.M.; Rütting, T.; Groffman, M. The soil N cycle: New insights and key challenges. Soil 2015, 1, 235–256. [Google Scholar] [CrossRef]
  51. Kopcicek, J.; Prochazkova, L.; Stuchlik, E.; Blazka, P. The nitrogen phosphorus relationship in mountain lakes: Influence of atmospheric input, watershed, and pH. Limnol. Oceanogr. 1995, 40, 930–937. [Google Scholar] [CrossRef]
  52. Albina, P.; Durban, N.; Bertron, A.; Albrecht, A.; Robinet, J.C.; Erable, B. Influence of hydrogen electron donor, alkaline pH, and high nitrate concentrations on microbial denitrification: A review. Int. J. Mol. Sci. 2019, 20, 5163. [Google Scholar] [CrossRef]
  53. Lee, J.; Lee, S.; Yu, S.; Rhew, D. Relationships between water quality parameters in rivers and lakes: BOD5, COD, NBOPs, and TOC. Environ. Monit. Assess. 2016, 188, 252. [Google Scholar] [CrossRef]
  54. Liu, Y.; Wu, Z.; Lv, Y.; Jiang, L.; Wei, Y.; Li, Y.Y.; Liu, J. Recovery of an acidified food waste anaerobic digestion reactor via NH4+-N and trace metals addition: Performance, microbial community response, and mechanisms. J. Clean. Prod. 2023, 425, 138978. [Google Scholar] [CrossRef]
  55. Downing, J.A.; Watson, S.B.; McCauley, E. Predicting cyanobacteria dominance in lakes. Can. J. Fish. Aquat. Sci. 2001, 58, 1905–1908. [Google Scholar] [CrossRef]
  56. Paerl, H.W.; Otten, T.G. Harmful cyanobacterial blooms: Causes, consequences, and controls. Microb. Ecol. 2013, 65, 995–1010. [Google Scholar] [CrossRef]
  57. Tyson, R.V.; Simonne, E.H.; White, J.M.; Lamb, E.M. Reconciling water quality parameters impacting nitrification in aquaponics: The pH levels. Proc. Fla. State Hortic. Soc. 2004, 117, 79–83. [Google Scholar]
  58. Howarth, R.W.; Chan, F.; Swaney, D.P.; Marino, R.M.; Hayn, M. Role of external inputs of nutrients to aquatic ecosystems in determining prevalence of nitrogen vs. phosphorus limitation of net primary productivity. Biogeochemistry 2021, 154, 293–306. [Google Scholar] [CrossRef]
  59. Allan, D.J. Stream Ecology: Structure and Function of Running Waters; Chapman and Hall: New York, NY, USA, 1995. [Google Scholar]
  60. Valiela, I.; Bowen, J.L. Nitrogen sources to watersheds and estuaries: Role of land cover mosaics and losses within watersheds. Environ. Pollut. 2002, 118, 239–248. [Google Scholar] [CrossRef] [PubMed]
  61. Khatri, N.; Tyagi, S. Influences of natural and anthropogenic factors on surface and groundwater quality in rural and urban areas. Front. Life Sci. 2015, 8, 23–39. [Google Scholar] [CrossRef]
  62. Bechmann, M.E.; Berge, D.; Eggestad, H.O.; Vandsemb, S.M. Phosphorus transfer from agricultural areas and its impact on the eutrophication of lakes—Two long-term integrated studies from Norway. J. Hydrol. 2005, 304, 238–250. [Google Scholar] [CrossRef]
  63. Álvarez, X.; Valero, E.; Santos, R.M.; Varandas, S.G.P.; Fernandes, L.S.; Pacheco, F.A.L. Anthropogenic nutrients and eutrophication in multiple land use watersheds: Best management practices and policies for the protection of water resources. Land Use Policy 2017, 69, 1–11. [Google Scholar] [CrossRef]
  64. You, R.; Wang, S.; Wan, L.; Dong, F. Towards the development of a ‘land-river-lake’two-stage deep learning model for water quality prediction and its application in a large plateau lake. J. Hydrol. 2024, 645, 132173. [Google Scholar] [CrossRef]
  65. Dai, L.; Zhang, B.; Liao, X.; Wang, L.; Zhang, Q.; Tian, S.; Liang, T.; O’Connor, D.; Rinklebe, J. Catchment land use effect on mercury concentrations in lake sediments: A high-resolution study of Qinghai Lake. Sci. Total Environ. 2024, 916, 170260. [Google Scholar] [CrossRef] [PubMed]
  66. Wang, J.; Guan, Y.; Wang, H.; Zhang, H.; Zhou, W. Evaluation of farmland production potential in key agricultural production areas on the Qinghai-Tibet Plateau under multi-scenario simulation. Sci. Total Environ. 2024, 951, 175741. [Google Scholar] [CrossRef]
  67. Han, J.; Xin, Z.; Shan, G.; Liu, Y.; Xu, B.; Zhang, Q.; Zhang, C. Developing nutrient pollution management strategies on a watershed scale under climate change. Ecol. Indic. 2024, 159, 111691. [Google Scholar] [CrossRef]
  68. Tarabih, O.M.; Arias, M.E.; Santos, A.L.; Hua, J.; Cooper, R.Z.; Khanal, A.; Dang, T.D.; Khare, Y.P.; Charkhgard, H.; Rains, M.C.; et al. Effects of the spatial distribution of best management practices for watershed wide nutrient load reduction. Ecol. Eng. 2024, 201, 107211. [Google Scholar] [CrossRef]
  69. Liu, X.; Wu, Y.; Sun, R.; Hu, S.; Qiao, Z.; Wang, S.; Mi, X. NH4+-N/NO3-N ratio controlling nitrogen transformation accompanied with NO2-N accumulation in the oxic-anoxic transition zone. Environ. Res. 2020, 189, 109962. [Google Scholar] [CrossRef]
  70. Jiang, Q.; Jin, G.; Tang, H.; Xu, J.; Jiang, M. Ammonium (NH4+) transport processes in the riverbank under varying hydrologic conditions. Sci. Total Environ. 2022, 826, 154097. [Google Scholar] [CrossRef]
  71. Ignatius, A.R.; Rasmussen, T.C. Small reservoir effects on headwater water quality in the rural-urban fringe, Georgia Piedmont, USA. J. Hydrol. Reg. Stud. 2016, 8, 145–161. [Google Scholar] [CrossRef]
  72. Zhang, D.; Wang, P.; Cui, R.; Yang, H.; Li, G.; Chen, A.; Wang, H. Electrical conductivity and dissolved oxygen as predictors of nitrate concentrations in shallow groundwater in Erhai Lake region. Sci. Total Environ. 2022, 802, 149879. [Google Scholar] [CrossRef]
  73. Wu, S.; Wu, Z.; Liang, Z.; Liu, Y.; Wang, Y. Denitrification and the controlling factors in Yunnan Plateau Lakes (China): Exploring the role of enhanced internal nitrogen cycling by algal blooms. J. Environ. Sci. 2019, 76, 349–358. [Google Scholar] [CrossRef]
  74. Zhang, X.; Mei, X.; Gulati, R.D.; Liu, Z. Effects of N and P enrichment on competition between phytoplankton and benthic algae in shallow lakes: A mesocosm study. Environ. Sci. Pollut. Res. 2015, 22, 4418–4424. [Google Scholar] [CrossRef] [PubMed]
  75. Zhou, Z.; Liu, Y.; Wang, S.; Xiao, J.; Cao, X.; Zhou, Y.; Song, C. Interactions between phosphorus enrichment and nitrification accelerate relative nitrogen deficiency during cyanobacterial blooms in a large shallow eutrophic lake. Environ. Sci. Technol. 2023, 57, 2992–3001. [Google Scholar] [CrossRef]
  76. Liu, X.; Hu, S.; Sun, R.; Wu, Y.; Qiao, Z.; Wang, S.; Zhang, Z.; Cui, C. Dissolved oxygen disturbs nitrate transformation by modifying microbial community, co-occurrence networks, and functional genes during aerobic-anoxic transition. Sci. Total Environ. 2021, 790, 148245. [Google Scholar] [CrossRef]
  77. Elser, J.J.; Bracken, M.E.; Cleland, E.E.; Gruner, D.S.; Harpole, W.S.; Hillebrand, H.; Ngai, J.T.; Seabloom, E.W.; Shurin, J.B.; Smith, J.E. Global analysis of nitrogen and phosphorus limitation of primary producers in freshwater, marine and terrestrial ecosystems. Ecol. Lett. 2007, 10, 1135–1142. [Google Scholar] [CrossRef]
  78. Vitousek, M.; Porder, S.; Houlton, B.Z.; Chadwick, O.A. Terrestrial phosphorus limitation: Mechanisms, implications, and nitrogen–phosphorus interactions. Ecol. Appl. 2010, 20, 5–15. [Google Scholar] [CrossRef]
  79. Issaka, S.; Ashraf, M.A. Impact of soil erosion and degradation on water quality: A review. Geol. Ecol. Landsc. 2017, 1, 1–11. [Google Scholar] [CrossRef]
  80. Decau, M.L.; Simon, J.C.; Jacquet, A. Nitrate leaching under grassland as affected by mineral nitrogen fertilization and cattle urine. J. Environ. Qual. 2004, 33, 637–644. [Google Scholar] [CrossRef] [PubMed]
  81. Laubel, A.; Kronvang, B.; Hald, A.B.; Jensen, C. Hydromorphological and biological factors influencing sediment and phosphorus loss via bank erosion in small lowland rural streams in Denmark. Hydrol. Process. 2003, 17, 3443–3463. [Google Scholar] [CrossRef]
  82. Iqbal, J.; Su, C.; Abbas, H.; Jiang, J.; Han, Z.; Baloch, M.Y.J.; Xie, X. Prediction of Nitrate Concentration and the Impact of Land Use Types on Groundwater in the Nansi Lake Basin. J. Hazard. Mater. 2025, 487, 137185. [Google Scholar] [CrossRef]
  83. Abell, J.M.; Özkundakci, D.; Hamilton, D.P.; Miller, S.D. Relationships between land use and nitrogen and phosphorus in New Zealand lakes. Mar. Freshw. Res. 2011, 62, 162–175. [Google Scholar] [CrossRef]
  84. Kosten, S.; Huszar, V.L.; Mazzeo, N.; Scheffer, M.; Sternberg, L.D.S.; Jeppesen, E. Lake and watershed characteristics rather than climate influence nutrient limitation in shallow lakes. Ecol. Appl. 2009, 19, 1791–1804. [Google Scholar] [CrossRef]
  85. Olsen, S.; Jeppesen, E.; Moss, B.; Özkan, K.; Beklioğlu, M.; Feuchtmayr, H.; Gonzalez Sagrario, M.; Wei, L.; Larsen, S.; Lauridsen, T.S.; et al. Factors influencing nitrogen processing in lakes: An experimental approach. Freshw. Biol. 2015, 60, 646–662. [Google Scholar] [CrossRef]
  86. Zhao, H.; Zhang, L.; Wang, S.; Jiao, L. Features and influencing factors of nitrogen and phosphorus diffusive fluxes at the sediment-water interface of Erhai Lake. Environ. Sci. Pollut. Res. 2018, 25, 1933–1942. [Google Scholar] [CrossRef] [PubMed]
  87. Smith, J.; Wagner-Riddle, C.; Dunfield, K. Season and management related changes in the diversity of nitrifying and denitrifying bacteria over winter and spring. Appl. Soil Ecol. 2010, 44, 138–146. [Google Scholar] [CrossRef]
  88. Anderson, T.R.; Goodale, C.L.; Groffman, M.; Walter, M.T. Assessing denitrification from seasonally saturated soils in an agricultural landscape: A farm-scale mass-balance approach. Agric. Ecosyst. Environ. 2014, 189, 60–69. [Google Scholar] [CrossRef]
Figure 1. Water and soil sampling location.
Water 17 00472 g001
Figure 2. Boxplot of water quality and soil parameters in Qinghai Lake. (NO3_N: NO3-N; NO2-N: NO2-N; NH4-N: NH4+-N).
Water 17 00472 g002
Figure 3. The pH, TN, and TP levels in 50 cm and 300 cm soil.
Water 17 00472 g003
Figure 4. Correlations between soil and water quality parameters (dark blue indicates data measured in water, and pH_soil, TN_soil, and TP_soil represent the data measured in soil).
Water 17 00472 g004
Figure 5. Contributions of variables to principal components (NO3.N: NO3-N; NO2.N: NO2-N; NH4.N: NH4+-N; *_water: data measured in water; *_soil: data measured in soil).
Water 17 00472 g005
Table 1. Water quality parameters in this study.
n = 17TN (mg/L)
(n = 16)
TP
(mg/L)
NO3-N (mg/L)NH4+-N
(mg/L)
NO2-N
(mg/L)
DO
(mg/L)
COD
(mg/L)
BOD5
(mg/L)
pHElectrical
Conductivity
(ms/cm)
mean0.9630.0730.01890.1120.5956.0593.0253.1237.9229.23
SD0.3790.0580.01330.0470.6080.3891.5591.6170.238.48
min0.540.030.00380.0650.0275.4000.8961.0307.286.87
max1.90.260.04010.2192.1536.8005.7606.2708.0941.1
Note: SD: Standard Deviation; min: minimum; max: maximum.
Table 2. Water quality parameters in other lakes in China [49].
TN TP
min–maxmeanSDmin–maxmeanSD
China0.16–4.401.550.920.01–0.520.110.11
Northeastern lakes in China0.72–1.751.080.310.03–0.120.070.03
Eastern lakes in China1.37–2.471.830.460.07–0.190.090.02
Southern lakes in China0.16–4.401.871.410.01–0.520.190.18
Qinghai–Tibet Plateau lakes0.29–1.190.620.430.01–0.090.060.02
Table 3. Results of the regression model of NH4+-N.
Regression Model NH4+-N~TN_Water + TP_Water + pH_Water + DO_Water + COD_Water + BOD5_Water + EC_Water + pH_Soil + TN_Soil + TP_Soil
EstimatePr(>|t|)
X(Intercept)278.052910.000220 ***
TN_water−11.195700.002272 **
TP_water−83.161417.77 × 10−5 ***
pH_water−59.278820.031971 *
DO_water42.443000.003746 **
COD_water3.400490.001000 ***
BOD5_water−26.669480.000446 ***
EC_water−9.243146.60 × 10−5 ***
pH_soil−5.169230.030122 *
TN_soil4.721280.031085 *
TP_soil0.137280.003140 **
Multiple R-squared0.9621
p-value0.001699
F-statistic15.23 on 10 and 6 DF
Regression model NH4+-N~TP_water + pH_water + DO_water + COD_water + BOD5_water + EC_water + pH_soil + TN_soil + TP_soil
EstimatePr(>|t|)
X(Intercept)117.507980.00945 **
TP_water−56.334300.00683 **
pH_water−57.359290.24702
DO_water6.176650.63731
COD_water2.148010.09090
BOD5_water−8.945040.03535 *
EC_water−7.176700.00556 **
pH_soil−6.381110.14264
TN_soil6.260840.11953
TP_soil0.096800.14549
Multiple R-squared0.7992
p-value0.07513
F-statistic3.097 on 9 and 7 DF
Note: *_water: data measured in water; *_soil: data measured in soil; *: p < 0.05; **: p < 0.01; ***: p < 0.001.
Table 4. Results of the regression model of NO3-N.
Regression Model NO3-N~TN_Water + TP_Water + pH_Water + DO_Water + COD_Water + BOD5_Water + EC_Water + pH_Soil + TN_Soil + TP_Soil
EstimatePr(>|t|)
X(Intercept)−12.095240.20852
TN_water0.761140.20621
TP_water11.161730.00195 **
pH_water8.223240.16434
DO_water−2.465370.31601
COD_water−0.506810.01075 *
BOD5_water2.042570.07201
EC_water0.639330.03218 *
pH_soil0.177420.70424
TN_soil−0.152110.72364
TP_soil−0.029500.00572 **
Multiple R-squared0.9033
p-value0.02346
F-statistic5.606 on 10 and 6 DF
Regression model NO3-N~TP_water + pH_water + DO_water + COD_water + BOD5_water + EC_water + pH_soil + TN_soil + TP_soil
EstimatePr(>|t|)
X(Intercept)−1.18064350.77945
TP_water9.33789970.00135 **
pH_water8.09274350.18835
DO_water0.00018140.99991
COD_water−0.42166380.01625 *
BOD5_water0.83757710.08660
EC_water0.49884650.05979
pH_soil0.25981500.59948
TN_soil−0.25677420.57078
TP_soil−0.02674330.00765 **
Multiple R-squared0.871
p-value0.01991
F-statistic5.25 on 9 and 7 DF
Note: *_water: data measured in water; *_soil: data measured in soil. *: p < 0.05; **: p < 0.01.
Table 5. Results of the regression model of NO2-N.
Regression Model NO2-N~TN_Water + TP_Water + pH_Water + DO_Water + COD_Water + BOD5_Water + EC_Water + pH_Soil + TN_Soil + TP_Soil
EstimatePr(>|t|)
X(Intercept)30.7314050.0995
TN_water−1.4493070.1926
TP_water−9.2092440.0572
pH_water−9.1744590.3736
DO_water4.3050100.3389
COD_water0.4399450.1359
BOD5_water−3.1235480.1197
EC_water−0.5917460.2118
pH_soil0.0585290.9454
TN_soil−0.1135510.8853
TP_soil0.0087050.5257
Multiple R-squared0.5082
p-value0.7598
F-statistic0.62 on 10 and 6 DF
Regression model NO2-N~TP_water + pH_water + DO_water + COD_water + BOD5_water + EC_water + pH_soil + TN_soil + TP_soil
EstimatePr(>|t|)
X(Intercept)9.9485190.228
TP_water−5.7364170.133
pH_water−8.9259710.415
DO_water−0.3897460.895
COD_water0.2778090.301
BOD5_water−0.8290820.323
EC_water−0.3242400.458
pH_soil−0.0983520.914
TN_soil0.0857490.918
TP_soil0.0034660.803
Multiple R-squared0.3316
p-value0.9077
F-statistic0.3859 on 9 and 7 DF
Note: *_water: data measured in water; *_soil: data measured in soil.
Disclaimer/Publisher’s Note: The statements, opinions and data contained in all publications are solely those of the individual author(s) and contributor(s) and not of MDPI and/or the editor(s). MDPI and/or the editor(s) disclaim responsibility for any injury to people or property resulting from any ideas, methods, instructions or products referred to in the content.

