Article

Ground-Based Green Façade for Enhanced Greywater Treatment and Sustainable Water Management

by
Nisreen Obeidat
1,2,*,
Ahmad Abu Awwad
1,
Ahmed Al-Salaymeh
3,*,
Riccardo Bresciani
4,
Fabio Masi
4,
Anacleto Rizzo
4,
Jomanah AlBtoosh
1,5 and
Mutaz M. Zoubi
6
1
Department of Land, Water and Environment, The University of Jordan, Amman 11942, Jordan
2
Department of Civil Engineering, The University of Jordan, Amman 11942, Jordan
3
Mechanical Engineering Department, School of Engineering, The University of Jordan, Amman 11942, Jordan
4
Iridra Srl, Via La Marmora 51, 50121 Florence, Italy
5
Deutsche Gesellschaft fur Internationale Zusammenarbeit GmbH, Amman 11190, Jordan
6
Department of Chemistry, The University of Jordan, Amman 11942, Jordan
*
Authors to whom correspondence should be addressed.
Water 2025, 17(3), 346; https://doi.org/10.3390/w17030346
Submission received: 2 December 2024 / Revised: 19 January 2025 / Accepted: 23 January 2025 / Published: 26 January 2025

Abstract

:
Urban areas face challenges with water scarcity, and the use of non-conventional water resources for uses not requiring potable quality is being promoted more and more by governments and international agencies. However, non-conventional water resources, such as rainwater and greywater, need to be treated before use to avoid health risks and possible nuisance (smell, bacteria and algae proliferation in storage tanks, etc.). This study is aimed at demonstrating the feasibility of a system reusing treated greywater for toilet flushing, relying on a nature-based treatment technology—ground-based green façades—with limited maintenance requirements which is therefore easily replicable for decentralized treatment systems, like those of greywater reuse at building scales. The demonstrative system has been installed at the University of Jordan’s Al-Zahra dormitory in Amman and uses a degreaser as the primary treatment followed by ground-based green façade technology as a secondary treatment mechanism. The effluent is stored in an underground tank and directed to a tertiary treatment mechanism with UV lamps to remove pathogens before being reused for lawn irrigation and toilet flushing. Samples from influent and effluent were analyzed for various physical, chemical, and microbiological characteristics. The degreaser significantly reduced turbidity, TSS, total BOD5, and total COD levels in greywater. When combined with the green wall façades, the system demonstrated high removal efficiencies, particularly for turbidity, TSS, total COD, and total BOD5. The treated effluent met irrigation reuse standards for all the parameters, including total coliform and E. coli concentrations. The UV disinfection unit proved to be an effective post-treatment step, ensuring that water quality standards for reuse were met. The system’s overall performance highlights its ability to manage low- to medium-strength greywater. Results suggest the applied green wall system has significant potential for wider adoption in urban settings.

1. Introduction

Rapid urbanization has increased wastewater production, leading to the exploration of decentralized wastewater management systems, which treat and reuse water near its source, preserving public health, protecting the environment, and reducing costs [1,2,3,4].
Greywater, generated from activities like showering, dishwashing, and laundry, is less contaminated than blackwater and can be treated using nature-based solutions (NBSs) such as constructed wetlands, ponds, green walls, and green roofs [5,6,7,8]. These systems replicate natural processes with minimal energy input, offering sustainable methods for wastewater recycling. Constructed wetlands, scalable for smaller spaces via green walls, use biological processes to filter contaminants efficiently [9,10]. Recent studies underscore the potential of green walls for greywater treatment. Dal Ferro et al. [11] demonstrated significant reductions in organic compounds and nutrients using a green wall system with lightweight substrates and ornamental plants, highlighting its suitability for urban water recycling. Lakho et al. [12] reported 97% ammonium and 99% total coliform removal in a full-scale green wall system in Belgium, showcasing its sustainability despite substrate-induced increases in nitrate and phosphate levels. Aicher et al. [13] achieved 92% COD reduction with a modular green wall system using biochar and wood chips, meeting German standards. Galvão et al. [14] highlighted the flexibility of modular systems with recycled materials, achieving up to 75% COD and TSS reduction, with planted systems performing better than non-planted ones. Pucher et al. [15] evaluated a pot-based vertical greening system using untreated greywater, achieving 3.4 °C cooling and treatment efficiencies of 80% COD, 74% TOC, 70% TNb, 81% NH4-N, and 79% turbidity. Performance declined in the second year, highlighting the need for optimization.
The reuse of treated wastewater is crucial for addressing Jordan’s water scarcity, with the potential to meet up to 48% of water demand by 2025 [16]. It is crucial to comprehend water use management in order to effectively tackle water scarcity [17]. This study highlights the significance of wastewater as a sustainable resource, particularly in agriculture and industry, where over 90% of treated wastewater is used for irrigation [18]. Wastewater reuse reduces the need for chemical fertilizers and alleviates disposal concerns, contributing to long-term water supply viability [19,20]. Jordan is among the most water-scarce countries, with daily per capita water consumption at just 50 L, far below the global water scarcity threshold. The nation’s dry climate, low rainfall, and high evaporation, coupled with population growth, urbanization, and climate change, further stress its limited resources [21,22,23]. To combat this crisis, Jordan has turned to treated wastewater reuse, contributing 167 MCM to the national water supply in 2022, especially for agricultural and industrial use [24]. Decentralized treatment systems, such as green walls, further enhance sustainable wastewater management in urban areas.
Existing studies on green façades for water treatment primarily focus on wall-based systems such as pocket felt [12] or pot-based façades [14,15]. For classification, recent work by Langergraber et al. [25] or the conventional green wall classifications by Bustami et al. [26] can be referenced. Ground-based green façades, however, have only been tested at a small pilot scale in the studies of Kotsia et al. [27] and Stefanatou et al. [28,29]. This study represents the first full-scale pilot implementation of a ground-based green façade for greywater treatment and reuse, offering a novel, cost-effective solution within decentralized greywater treatment systems (DGWTSs). By assessing this system’s performance in treating greywater from dormitories and ensuring compliance with Jordanian reuse standards, the study highlights the potential of this innovative approach for sustainable water management in urban environments facing water scarcity.

2. Materials and Methods

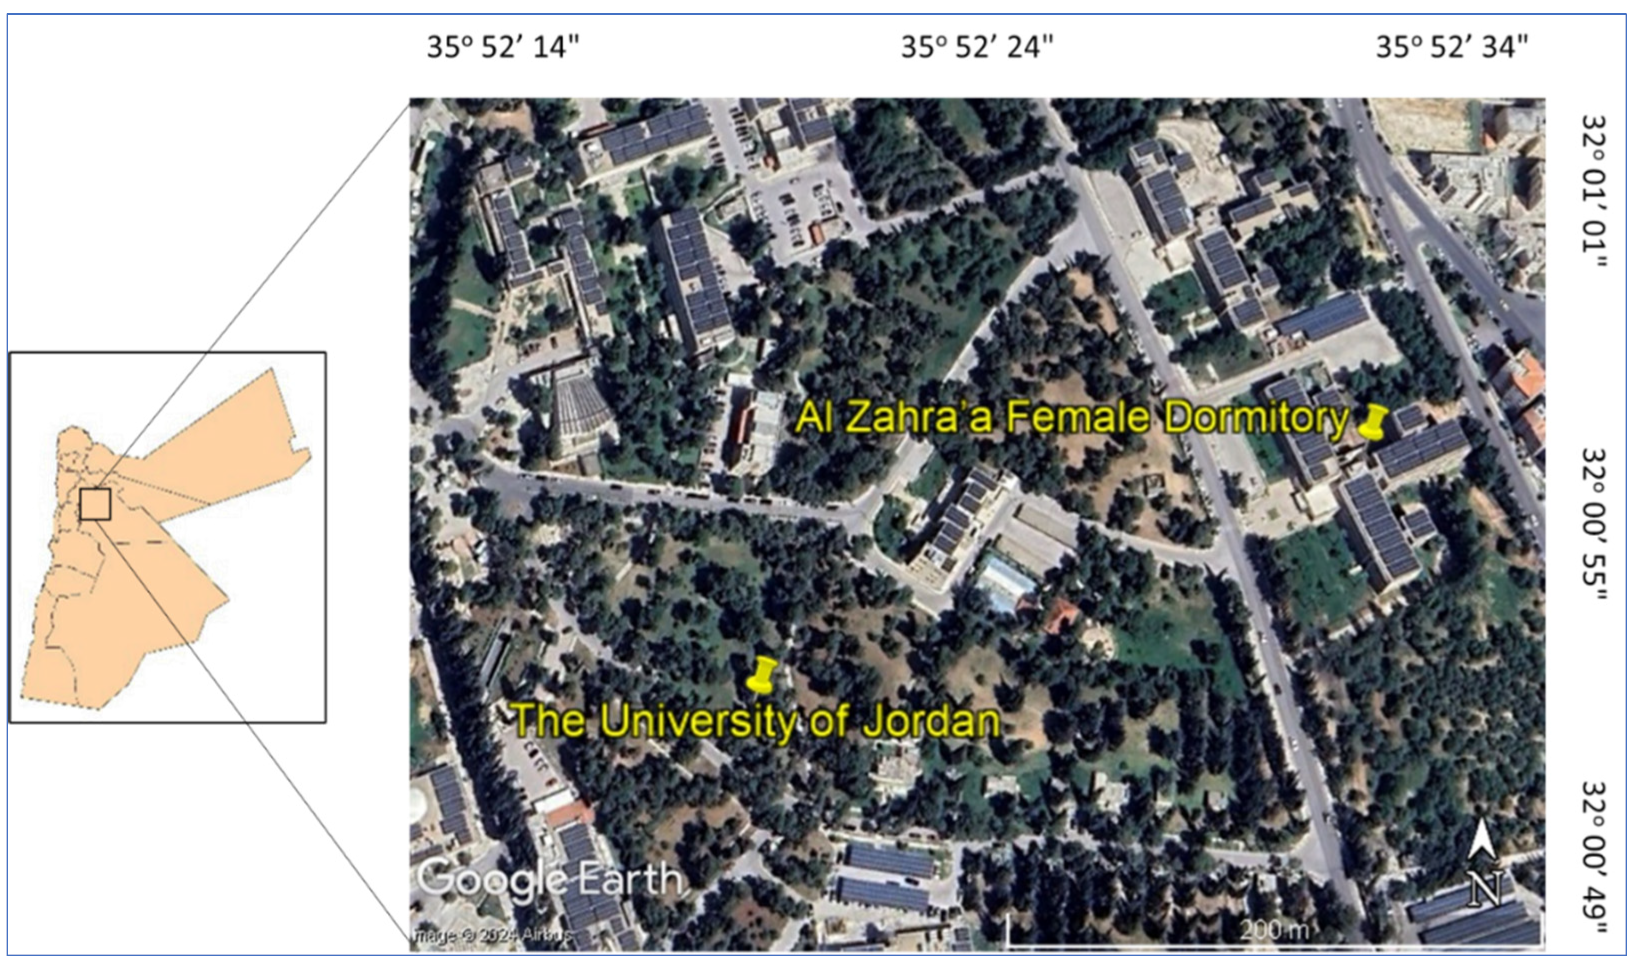
2.1. Study Site Description

A pilot scale of an on-site DGWTS, consisting mainly of green wall façades, was installed at Al-Zahra’a female dormitory located in the campus of the University of Jordan, located in an urban area of the capital Amman, Jordan. Figure 1 depicts the dormitory location within the University of Jordan campus. The dormitory hosts around 300 residents for ten months every year from different academic backgrounds and geographic locations. The dormitory is exclusively for female students. Two main residential blocks, referred to as areas A1 and A2, were selected to conduct the study in. On each floor of each area, there is a shower unit, a combined set of bathrooms, shared kitchens, and laundry facilities. Water for the dormitory is supplied by the municipal public water network, in addition to extra water tanks supplied by the university in case of water shortage when there is a gap between supply and demand. A study conducted to determine the average daily water consumption in area A1 revealed that each person in the dorm uses about 90 L of water per day on average. The generated total domestic wastewater from daily water usage in various forms is released into the central sewage network.
Climatic data for the study area are represented by data from Amman, as provided by the Ministry of Water and Irrigation in Jordan. The average annual temperature in Amman is 16.8 °C, and the average rainfall is around 485 mm per year. August has the greatest average temperature of 25 °C, making it the hottest month overall. January has the coldest average low temperature of 7 °C, making it the coldest month of the year.

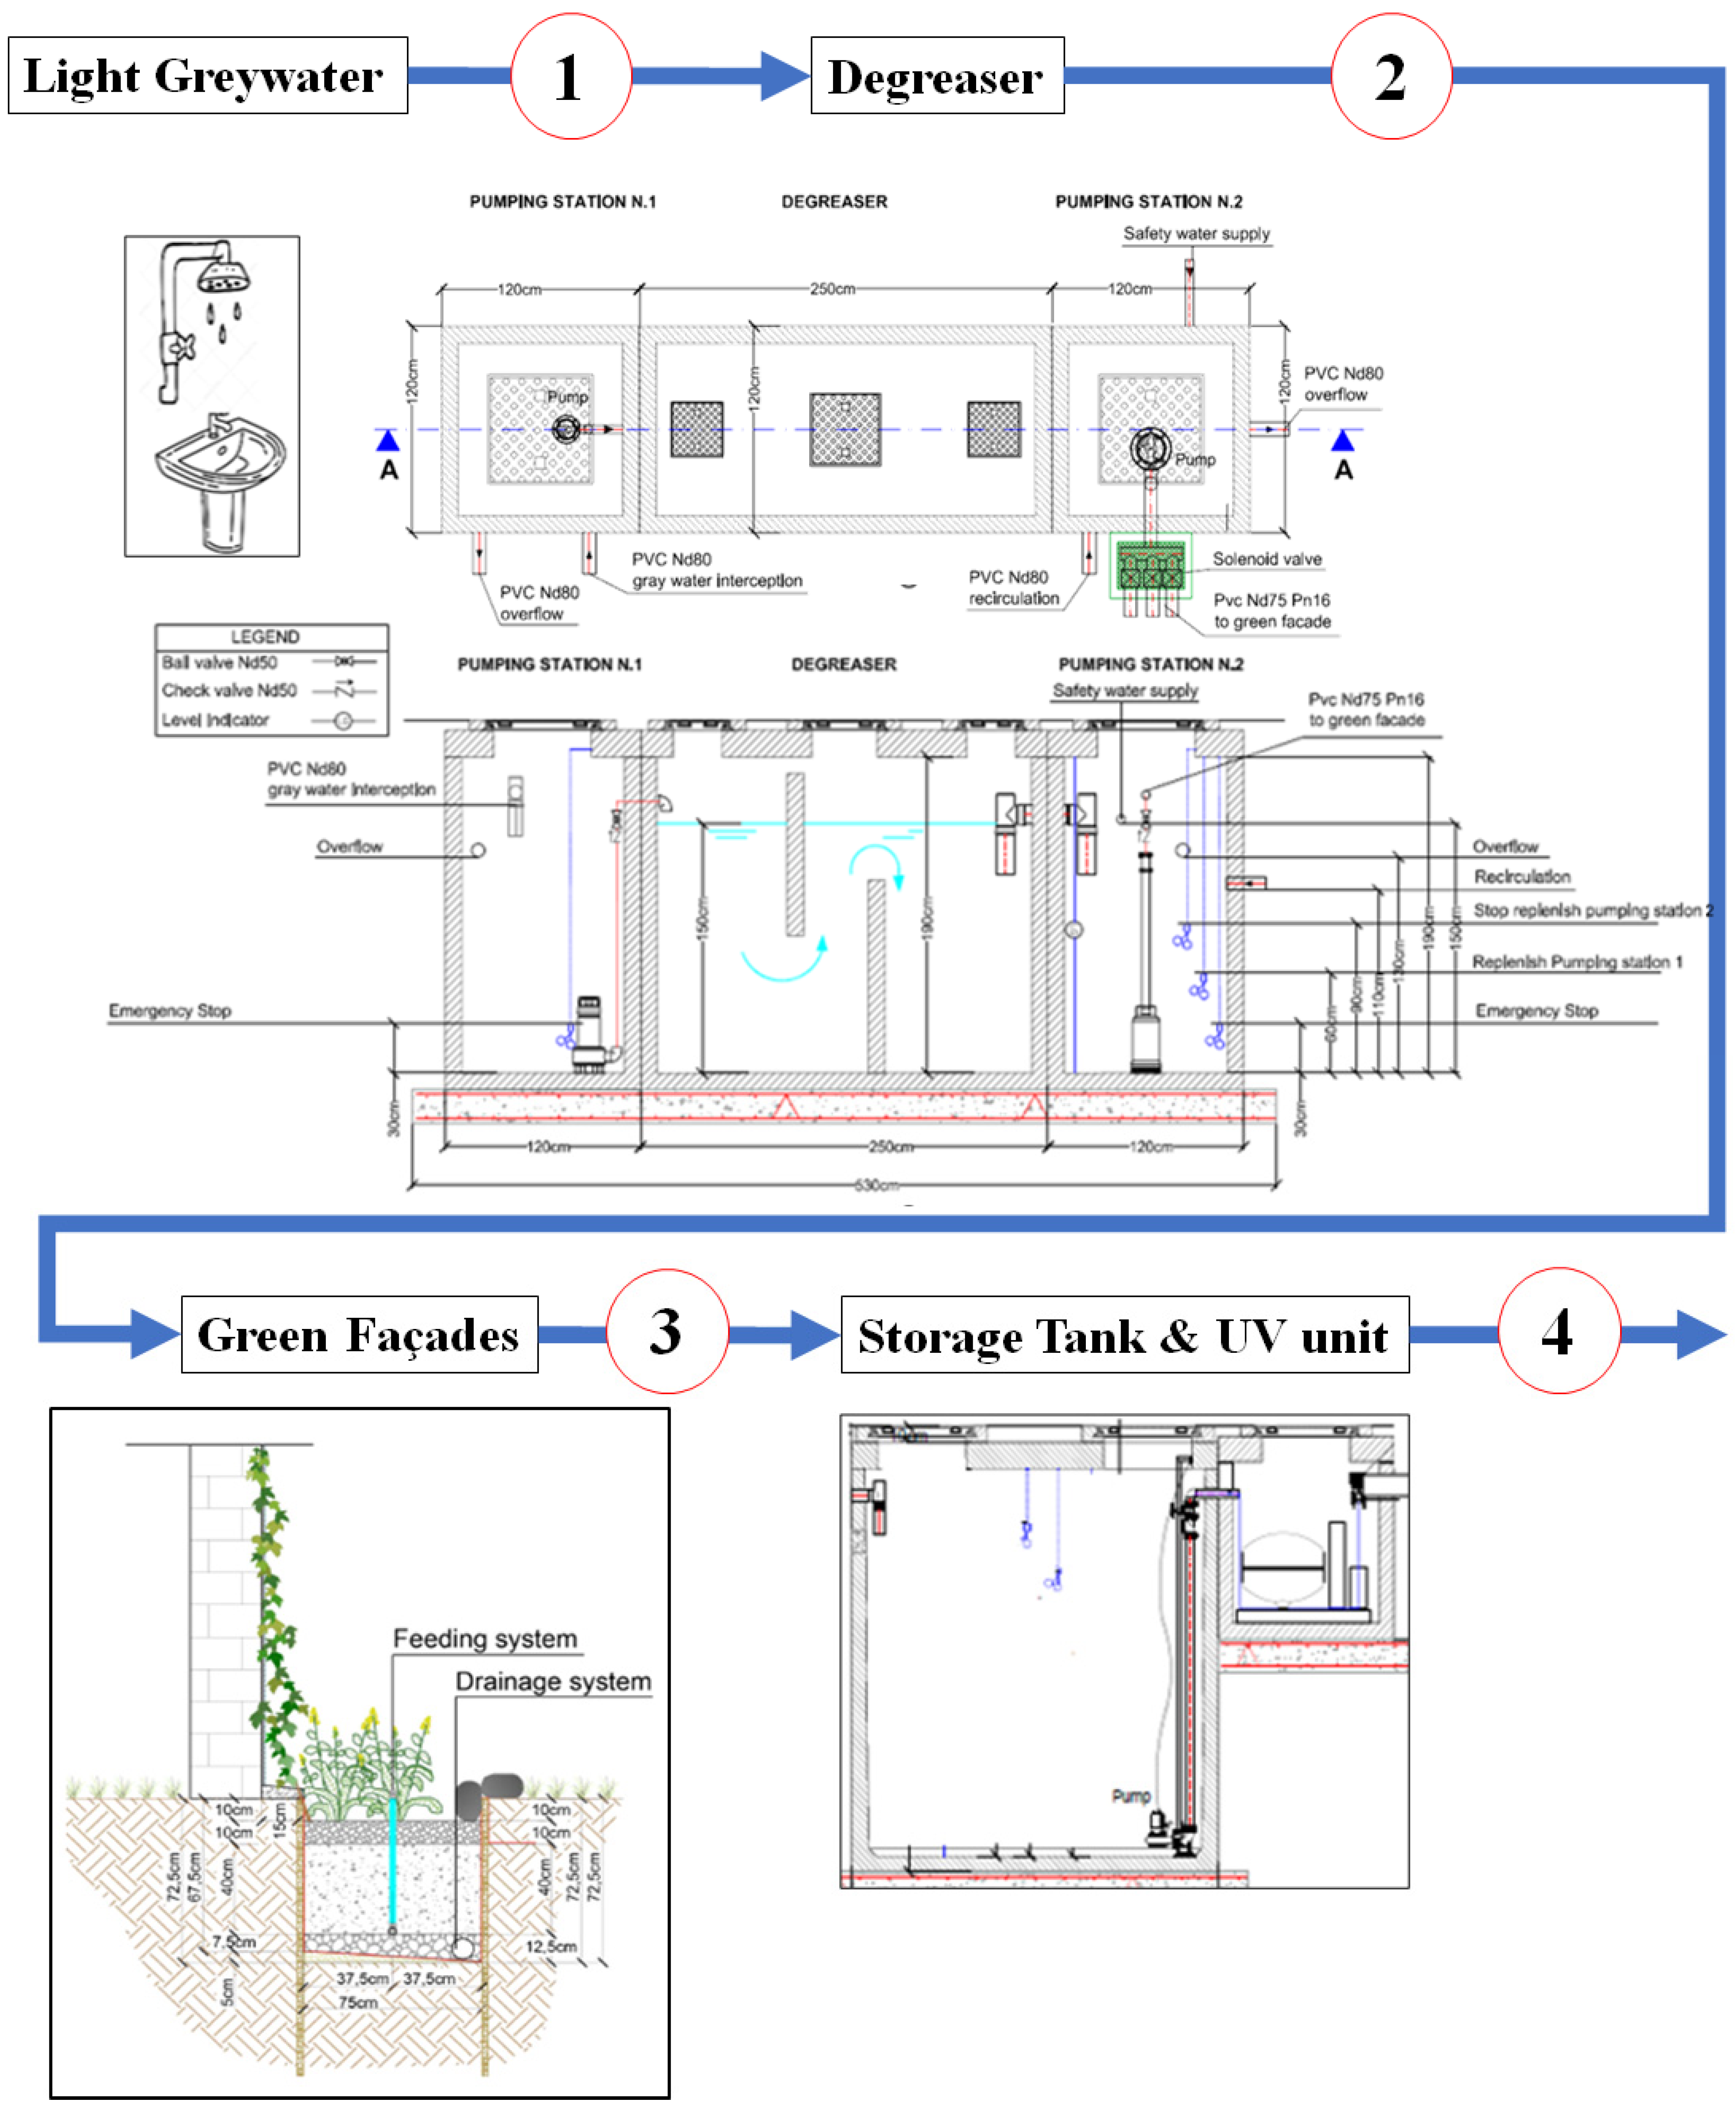
2.2. Description of the Decentralized Greywater Treatment System (DGWTS)

The DGWTS, consisting mainly of ground-based green facades, was installed at Al-Zahra’a female dormitory located in the campus of University of Jordan. The established DGWTS provides 288 m2 of green walls (72 m length × 4 m high), distributed over more than one area. With this setup, greywater was efficiently treated and recovered at a daily flow rate of about 1.6 m3 per area. Raw greywater was sourced from the water of the showers and wash basins of the two areas of dormitory referred to in the study as areas A1 and A2. The same system schemes were presented in each of the areas, which were arranged within the following order: light greywater flows from showers and washbasins to feed the degreaser. The degreaser is an internally reinforced concrete tank with dimensions of 2.30 × 1.00 m and an internal height of 1.9 m. To facilitate gravity feeding from the dormitory, the arrangement ensures a 50 cm elevation between the ground and the influent pipe. Effective removal of suspended solids and grease is achieved by maintaining a minimum water level of 1.5 m, which corresponds to a net water volume of 3.5 m3. Based on its internal dimensions, the degreaser has a total capacity of approximately 4.4 m3. To promote solid settlement, an internal wall is positioned within the degreaser, creating a U-shaped water movement. The gap between the internal wall and the bottom of the degreaser should be set at 30 cm to optimize this process. Effluent pipes must have a Tee installed at least 10 cm below the water level to prevent grease escape. Sludge in the first chamber must be extracted when it reaches a maximum height of 1.2 m. Additionally, grease layers must be regularly broken up and extracted when their thickness exceeds 10 cm above the internal height and the water level, to prevent excessive accumulation.
Degreaser effluent passes the green wall façade as the main treatment stage, and finally, the resulting effluent ends up in a manhole with a UV lamp for disinfection (intensity of 30 mW/cm2, a contact time of 10 s, a flow rate of 2 L/min, and a wavelength of 254 nm for effective microbial inactivation). Green facades were built as vertical subsurface flow wetlands, planted with ornamental climbing plants. The selection of plants was guided by their ability to tolerate greywater, adapt to intensive feeding and irrigation schedules, and develop roots suited to the available porous medium. Consideration was also given to local availability, climate, and sun exposure on the green wall. Two categories of plants, climbing and ornamental, were chosen. Examples include Hedera, Bougainvillea, Passiflora, Jasmine, Lonicera, Nandina, Lily, Acorus, Tulbaghia, and Peperomia. The technical specifications are resumed in Table 1. Figure 2 shows the schematic diagram of the installed combined system.
A suitable sand for a classical vertical flow system is currently not available in Jordan. All the tested sand samples presented D10 and percolation rates lower than the values generally considered in guidelines and manuals [30,31]. Moreover, the sand used by the contractor was even lower than the samples analyzed during design and works preparation phases. The selected sand presents a D10 of only 0.1 mm; the D60 of 0.25 mm allows at least a good uniformity of the product. However, the used sand is more prone to clogging even using greywater, and the time of percolation is much higher, potentially impacting the recovery of unsaturated conditions inside the filters, which is important to guarantee good oxygen diffusion for the process. According to these findings, it was decided to operate the filters with a larger flush volume to enhance uniform distribution and to increase as much as possible the resting time between each batch (12 h). In the short term, the measure led to good results in terms of hydraulic functioning of the system; however, it should be verified in the medium and long term.
The system employs three submersible pumps specifically designed for wastewater handling, each tailored to its role within the treatment process. The pump at the first pumping station operates with a flow rate of 30–60 L per minute (0.5–1 L per second) and a head of 3 m, effectively transferring raw greywater for initial processing. At the second pumping station, a higher-capacity pump delivers a flow rate of 120 L per minute (2 L per second) with a head of 7 m, ensuring the efficient movement of treated greywater. The reuse pump, designed for final distribution, operates with the highest capacity, achieving a flow rate of 140 L per minute and a head of 20 m, making it ideal for reusing treated water for applications like irrigation and toilet flushing.
The operation of the implemented system in each of the two areas of the dorm was monitored and controlled throughout the study. Grab samples were collected from four key points, as shown in Figure 2. The initial sample was taken at Point 1 after the first pump station. Treated greywater samples from the degreaser were collected at Point 2, which represents the second pump station. After further treatment, water passed through the green walls and into a storage tank, with samples from Point 3 collected at the wall effluent outlet. The final treated effluent, intended for reuse in irrigation and toilet flushing, was sampled at Point 4. The overall period of monitoring lasted 16 weeks, and the frequency at which samples were collected was one sample per two weeks. A sampling schedule was adopted due to logistical constraints related to accessibility and availability at the university during the study period. Samples from locations 1, 2, and 3 were tested and analyzed for the following parameters: pH, total dissolved solids (TDSs), total suspended solids (TSSs), total biochemical oxygen demand (BOD5), total chemical oxygen demand (COD), dissolved oxygen (DO), turbidity, nitrate (NO3), ammonium (NH4+), total nitrogen (TN), phosphate (PO43−), total coliform (TC), and Escherichia Coliform (E. coli), while samples from location 4 (outlet of UV) were tested and analyzed for TC and E. coli only. The chemical analyses were performed at the Jordanian Ministry of Water and Irrigation laboratories. The pH and TDS were measured using a calibrated portable multi-parameter probe. TSS was determined gravimetrically by filtering samples through a pre-weighed glass fiber filter, following APHA Standard Methods [32]. BOD5 was analyzed using the 5-day BOD test [32], while COD was measured using the closed reflux colorimetric method [32]. DO was determined using a DO meter. Turbidity was measured with a nephelometric turbidity meter [32]. Nitrate and ammonium were quantified using ion chromatography. TN was analyzed using the persulfate digestion method [32], and PO43− was determined using the ascorbic acid method [32]. TC and E. coli were assessed using membrane filtration, followed by incubation on selective media [32].
Various sample volumes were collected according to the requirements of the analysis. For the pathogens test, a 300 mL sterilized bottle was utilized, and for the PO43− test, a 100 mL dark glass was used. A three-liter plastic bottle was used to measure other parameters. The collected samples were analyzed at the laboratories of the Water Authority of Jordan according to the procedures of Standard Methods for the Examination of Water and Wastewater [32]. The collected data were analyzed to evaluate the overall performance of the on-site DGWTS.
The results of the final treated effluent were compared with the Jordanian Standards (JS) (1776/2013) in the Jordan Standards and Metrology Organization [33] (Table 2) in order to assess the suitability of the treated water for reuse, considering irrigation and toilet flushing potential uses within the University of Jordan. Identical primary treatment facilities, including pumping stations and collection tanks, have been designed and implemented in both dormitory areas for this purpose. This research primarily evaluated the technical performance of DGWTS through field observations, sample collection, and laboratory analysis.

2.3. Statistical Analysis

The Statistical Analysis System (SAS) software (sas.com) was employed to analyze results from various sampling points, including influent and effluent locations. Descriptive statistics identified greywater characteristics, while Tukey–Kramer and ANOVA tests assessed significant differences between treatment steps and sample sites. The University of Jordan’s Center for Education and Excellence conducted the analysis.

3. Results and Discussion

3.1. Characterization of Influent Greywater

This study examined the light greywater from the dormitory showers and sinks. Greywater constitutes 55% to 90% of household water use [34,35,36,37,38]. The current study assumed 80% greywater, averaging 72 L/cap/d, consistent with findings in Jordanian cities [39]. Al-Mashaqbeh et al. [40] reported 50 L/cap/d in Jordan, typical of developing countries.
The greywater characteristics from Al-Zahra’a dormitory (Table 3) had average total COD values of 260 to 348 mg/L, total BOD5 of 156 to 165 mg/L, and TSS of 45 to 50 mg/L, similar to those reported by Sonune et al. [41] for laundry effluent in India. These values align with the low- to medium-strength wastewater described by Metcalf and Eddy and Tchobanoglous [42]. The BOD5/COD ratio was 0.53, which indicated that about half of the organic matter in greywater from the dormitory was biodegradable [43], making it suitable for biological treatment [42]. The dorm’s greywater had nitrogen and PO43− levels of 20.65 to 22.14 mg/L and 1.96 to 2.53 mg/L, respectively, lower than dark greywater and residential wastewater [36,44]. Dissolved oxygen ranged from 2.15 to 2.45 mg/L, and pH was between 8.14 and 8.24, reflecting its alkaline nature [45]. The greywater also showed high concentrations of TC and E. coli, indicating manageable microbial contamination [46,47].

3.2. Performance Evaluation of the On-Site Treatment System

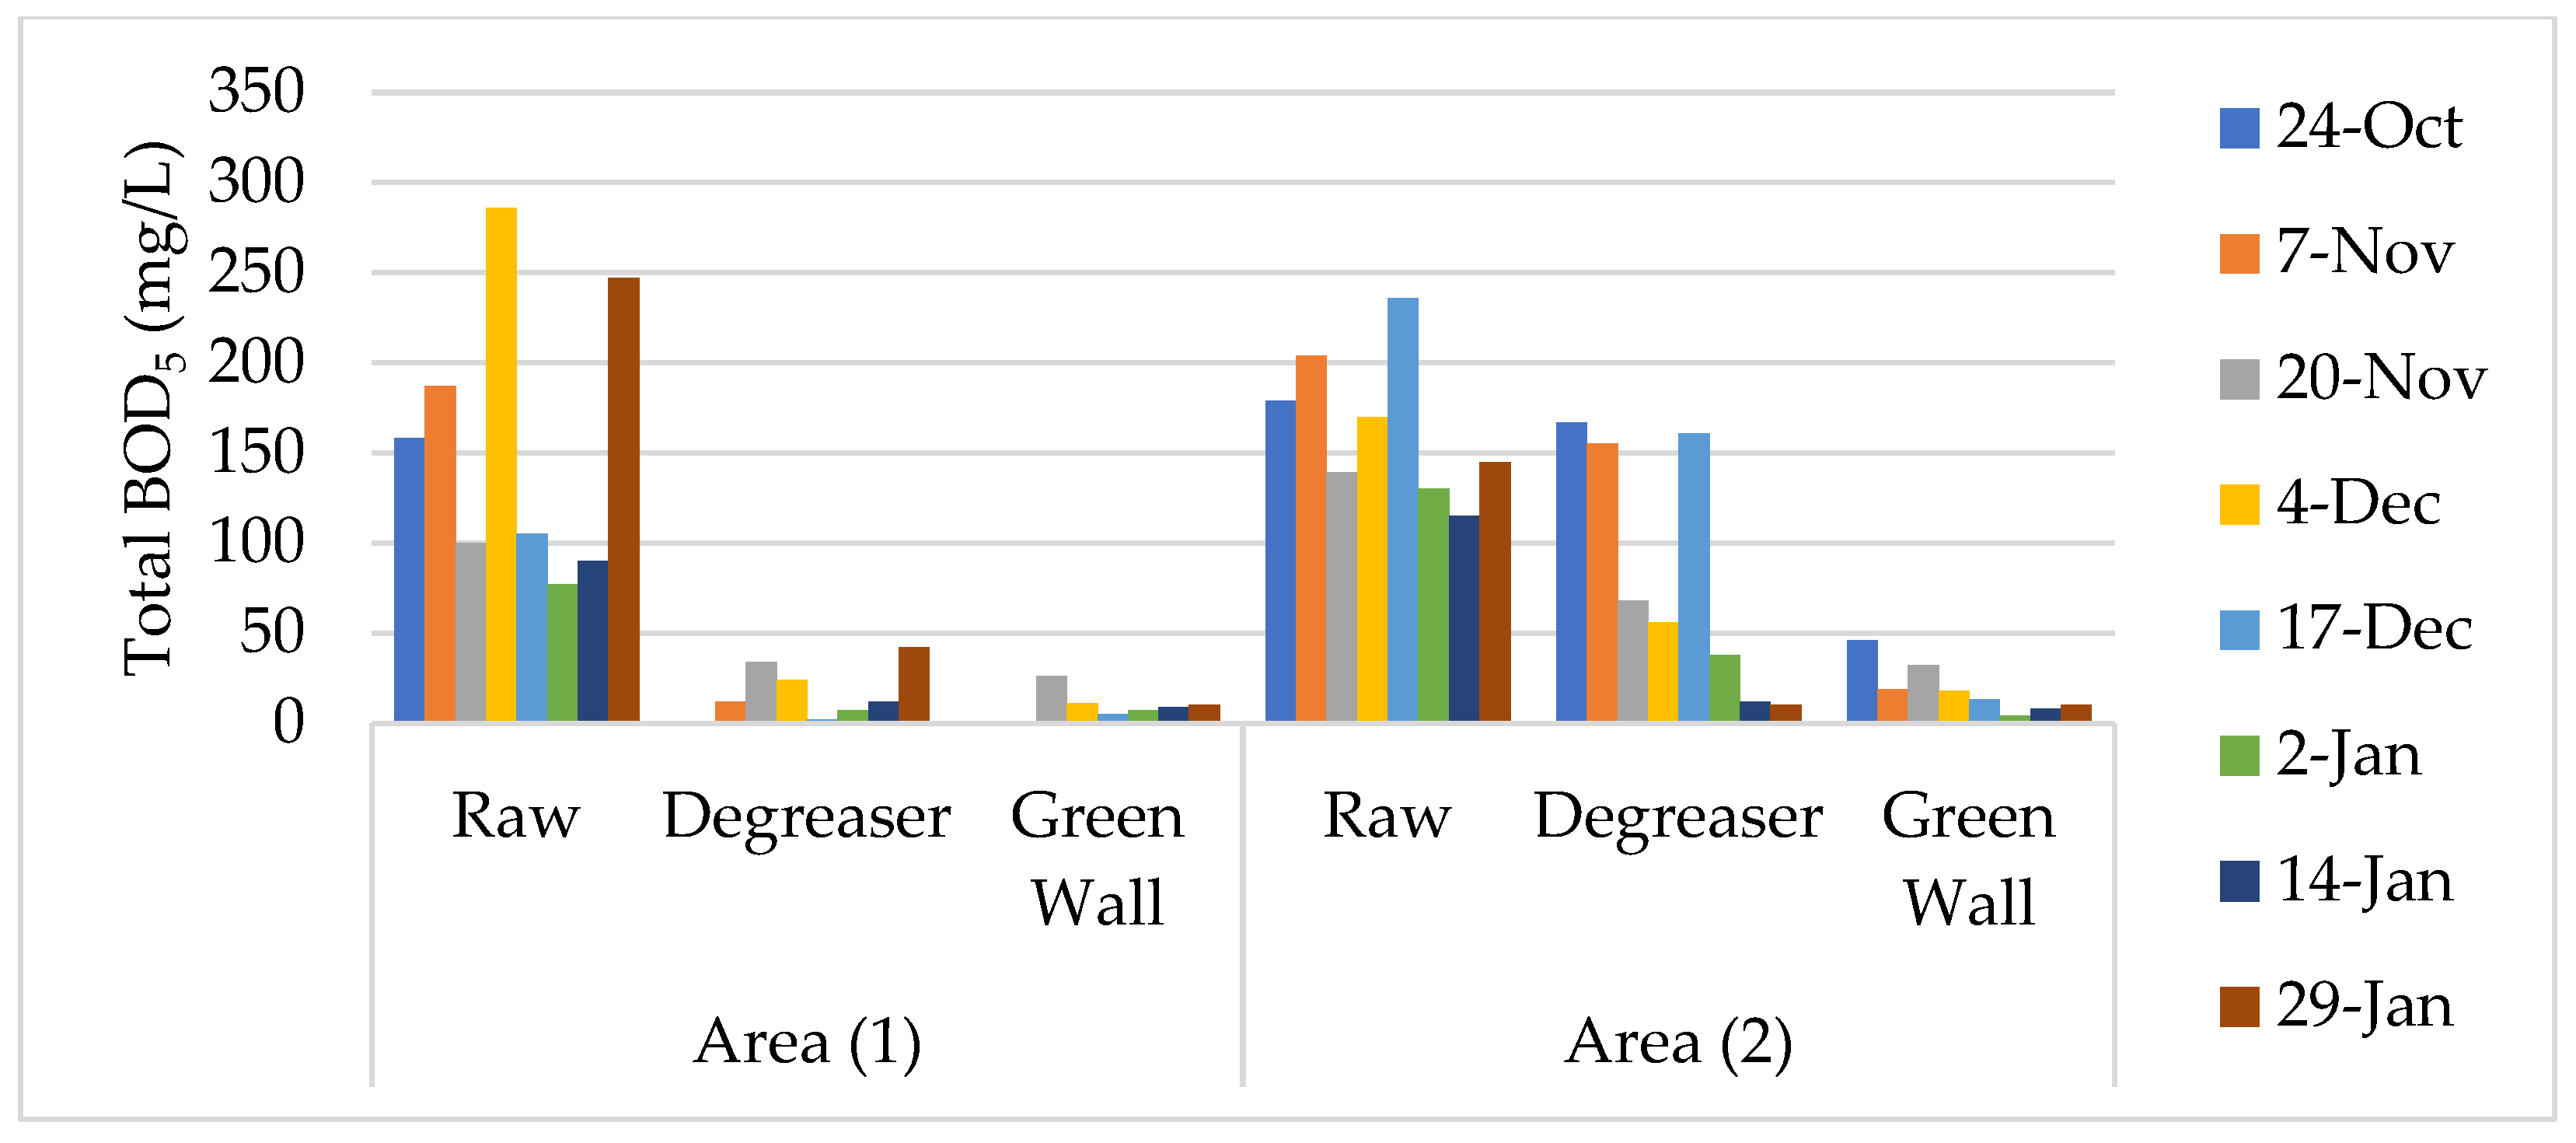
3.2.1. Total Chemical Oxygen Demand and Total Biochemical Oxygen Demand

The on-site DGWTS demonstrates effective chemical reduction in total COD and total BOD5 levels, showcasing its potential as a decentralized greywater treatment system. In area A1, total COD levels decreased from 260 mg/L in raw greywater to 26 mg/L after the degreaser, and further to 16 mg/L following the green wall treatment, achieving a 93.8% overall removal efficiency. Similarly, total BOD5 levels in area A1 dropped from 156 mg/L to 17 mg/L post-degreaser and to 9 mg/L after green wall treatment, with an efficiency of 94.4%. For area A2, total COD levels reduced from 348 mg/L to 165 mg/L post-degreaser and to 39 mg/L post-green wall, achieving an 88.9% removal efficiency. Total BOD5 levels in area A2 declined from 165 mg/L to 83 mg/L post-degreaser and further to 19 mg/L after green wall treatment, yielding 88.6% efficiency.
The chemical processes in the degreaser primarily involve physical separation mechanisms such as sedimentation and flotation, which effectively remove particulate organic matter. Area A1 greywater likely contains a higher fraction of particulate organic carbon compounds, which are easier to separate via these mechanisms. Conversely, area A2 greywater may contain a greater proportion of dissolved or emulsified organic compounds, such as fatty acids, alcohols, or surfactants, which are more resistant to physical separation. These compounds contribute to the observed lower removal efficiencies in area A2. Subsequent treatment in the green wall utilizes biological processes, including microbial metabolism and enzymatic degradation, to further break down soluble organic compounds. These biochemical reactions involve the oxidation of organic carbon, reducing total COD, and the consumption of biodegradable organic matter, decreasing total BOD5 levels. The high removal efficiency in area A1 suggests a more favorable composition of biodegradable substrates, whereas the lower efficiency in area A2 may reflect a higher proportion of recalcitrant compounds that are less easily metabolized.
While biodegradation in the degreaser is minimal, other factors such as differences in greywater inflow rates, hydraulic retention times, and influent composition also influence the observed disparities. For example, variations in the concentration of oxidizable substances, such as sugars or proteins, and the presence of emulsifiers or detergents can alter the system’s performance between the two areas.
These results align with prior research, which reports significant variability in total COD and total BOD5 removal efficiencies [4]. Average removal rates in some systems are reported at 65% and 60%, respectively, while others achieve lower efficiencies not exceeding 30% [48,49,50]. The superior performance observed in this study highlights the importance of optimizing chemical and biological processes in decentralized greywater treatment systems. Further investigation into the chemical composition and microbial dynamics of greywater in both areas is needed to confirm these findings and refine treatment strategies.
Figure 3 and Figure 4 illustrate the influent and effluent levels of total COD and total BOD5, providing a visual representation of the system’s performance across different treatment stages.

3.2.2. pH and Dissolved Oxygen

The on-site DGWTS for areas A1 and A2 exhibited varying pH levels across three treatment stages. In area A1, raw greywater pH ranged from 7.66 to 8.47, decreasing after degreaser treatment to 7.47–7.99, and stabilizing between 7.50 and 8.25 post-green wall. Regarding area A2, pH ranged from 7.64 to 8.77, dropping slightly to 7.47–8.31 post-degreaser, and adjusting to 7.78–8.19 after the green wall. The green wall’s role in stabilizing pH aligns with the findings from previous studies, supporting effective treatment. All areas exhibited a slight pH decrease after degreaser treatment, as noted by Samayamanthula et al. [51] and Tusiime et al. [52]. The green wall stabilized pH, enhancing treatment performance. This aligns with previous studies that found similar pH trends with wetland plants aiding in regulation [53,54].
The DO levels in the DGWTS show substantial improvement across different stages. In area A1, raw greywater DO levels ranged from 1.21 to 4.70 mg/L, rising to 1.93 to 8.99 mg/L after degreaser treatment, and further improving to 4.43 to 9.16 mg/L following green wall treatment. Area A2 exhibited similar trends, with DO levels increasing from 1.28 to 2.68 mg/L in raw greywater to 0.57 to 4.17 mg/L post-degreaser, and 4.78 to 8.52 mg/L after the green wall. The green wall consistently enhanced DO levels, aligning with the findings by Boano et al. [55] and Alateeqi et al. [56]. The green wall’s effective oxygen transfer and biological activity significantly contribute to improved water quality, emphasizing its critical role in the treatment process.

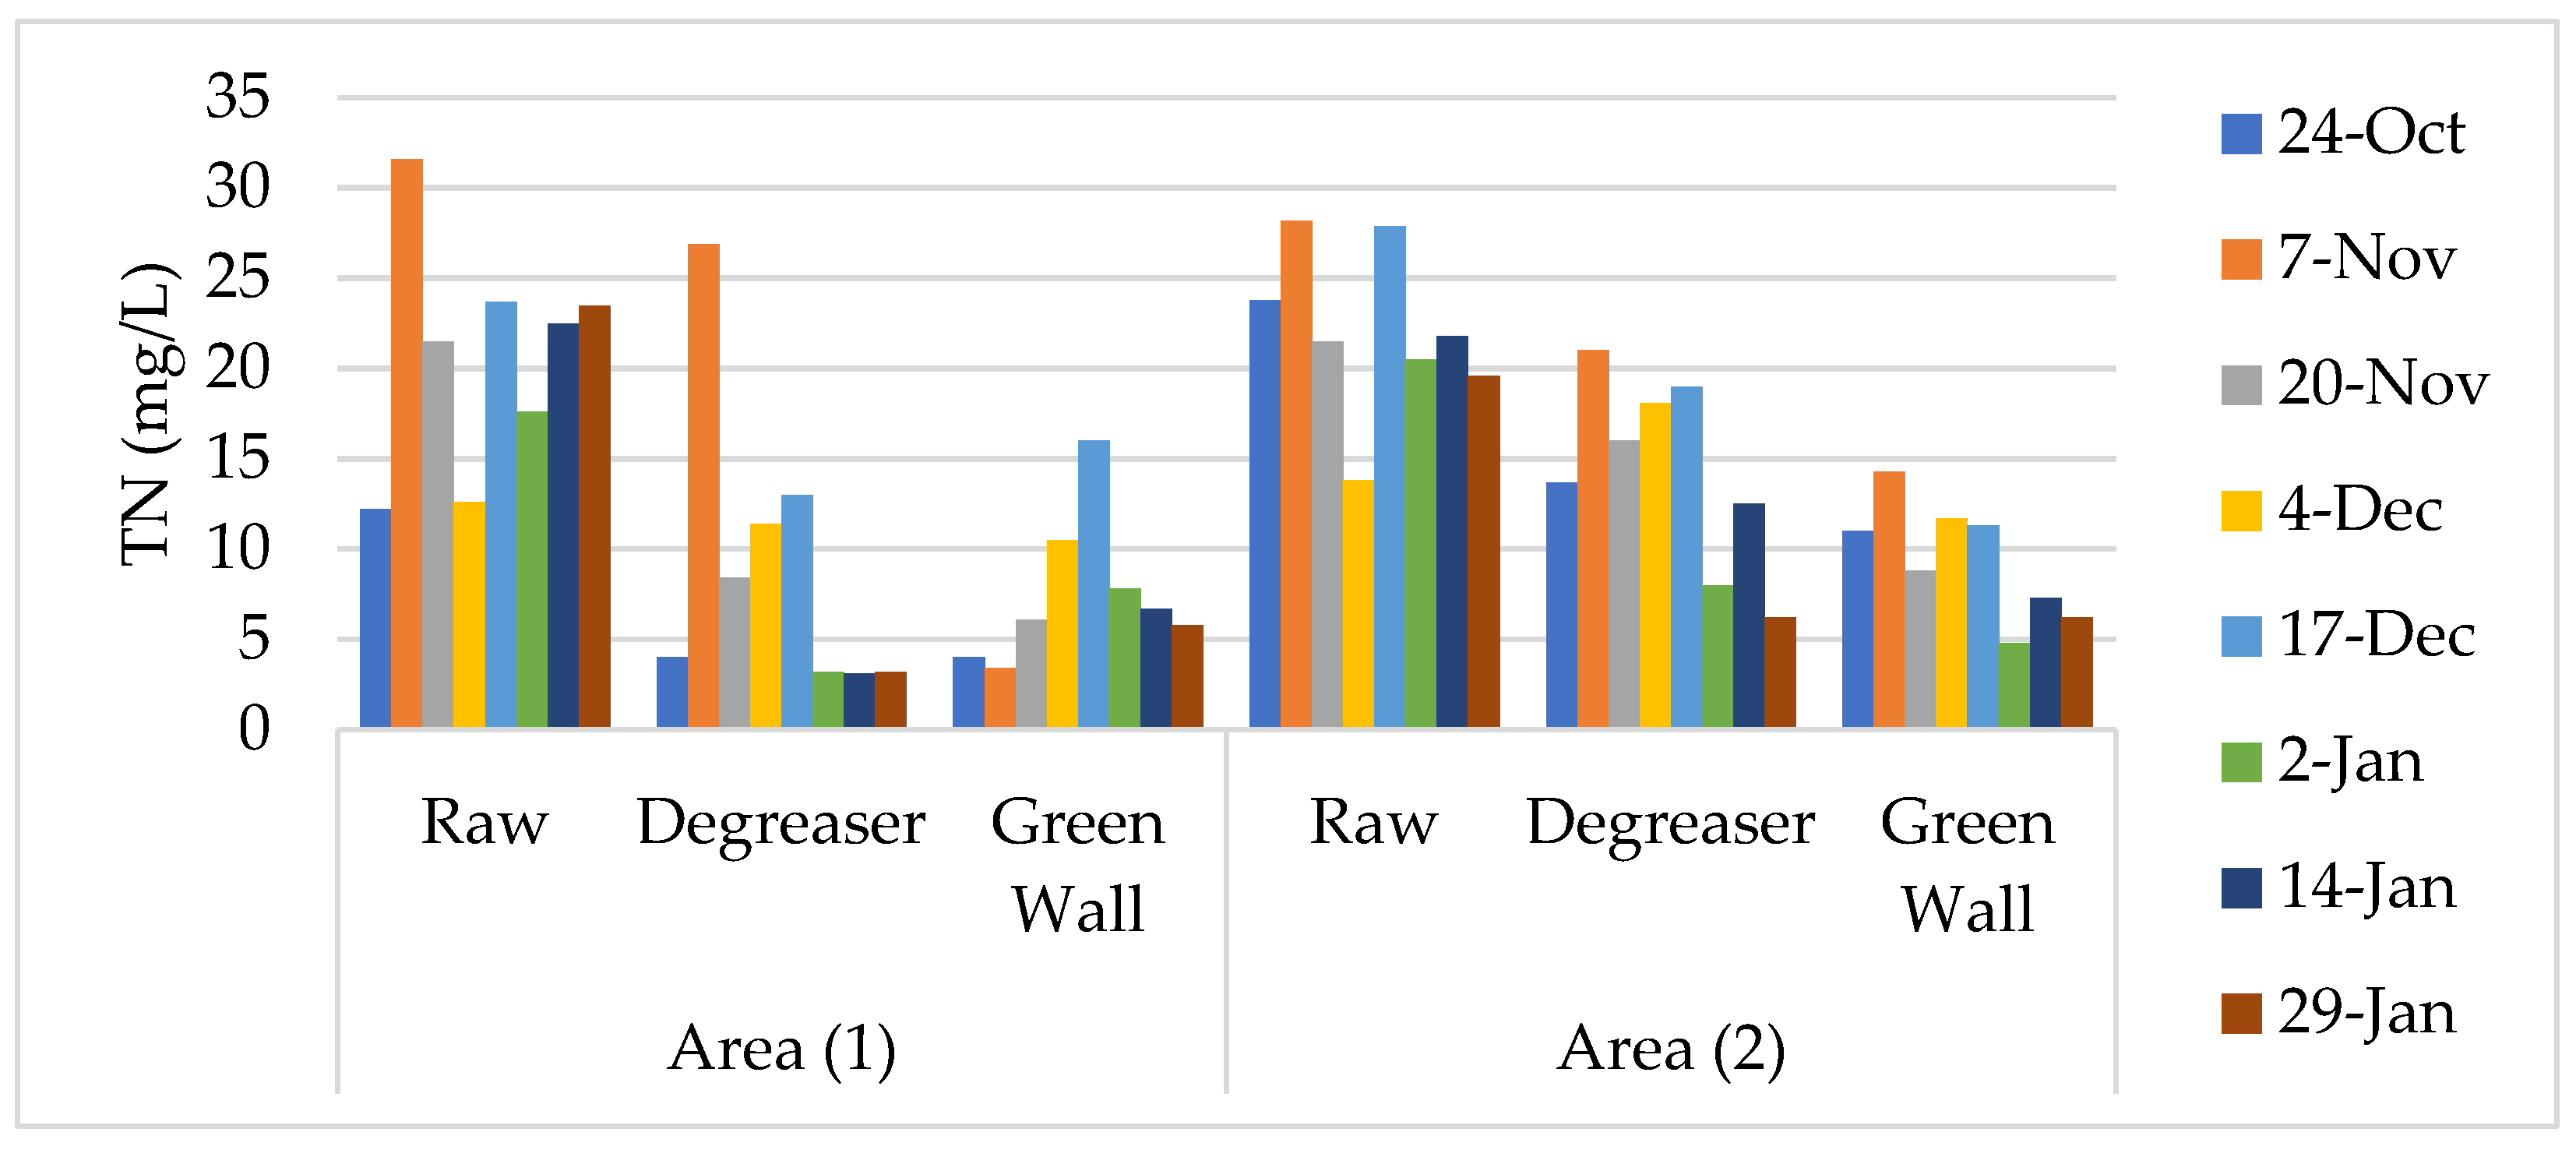
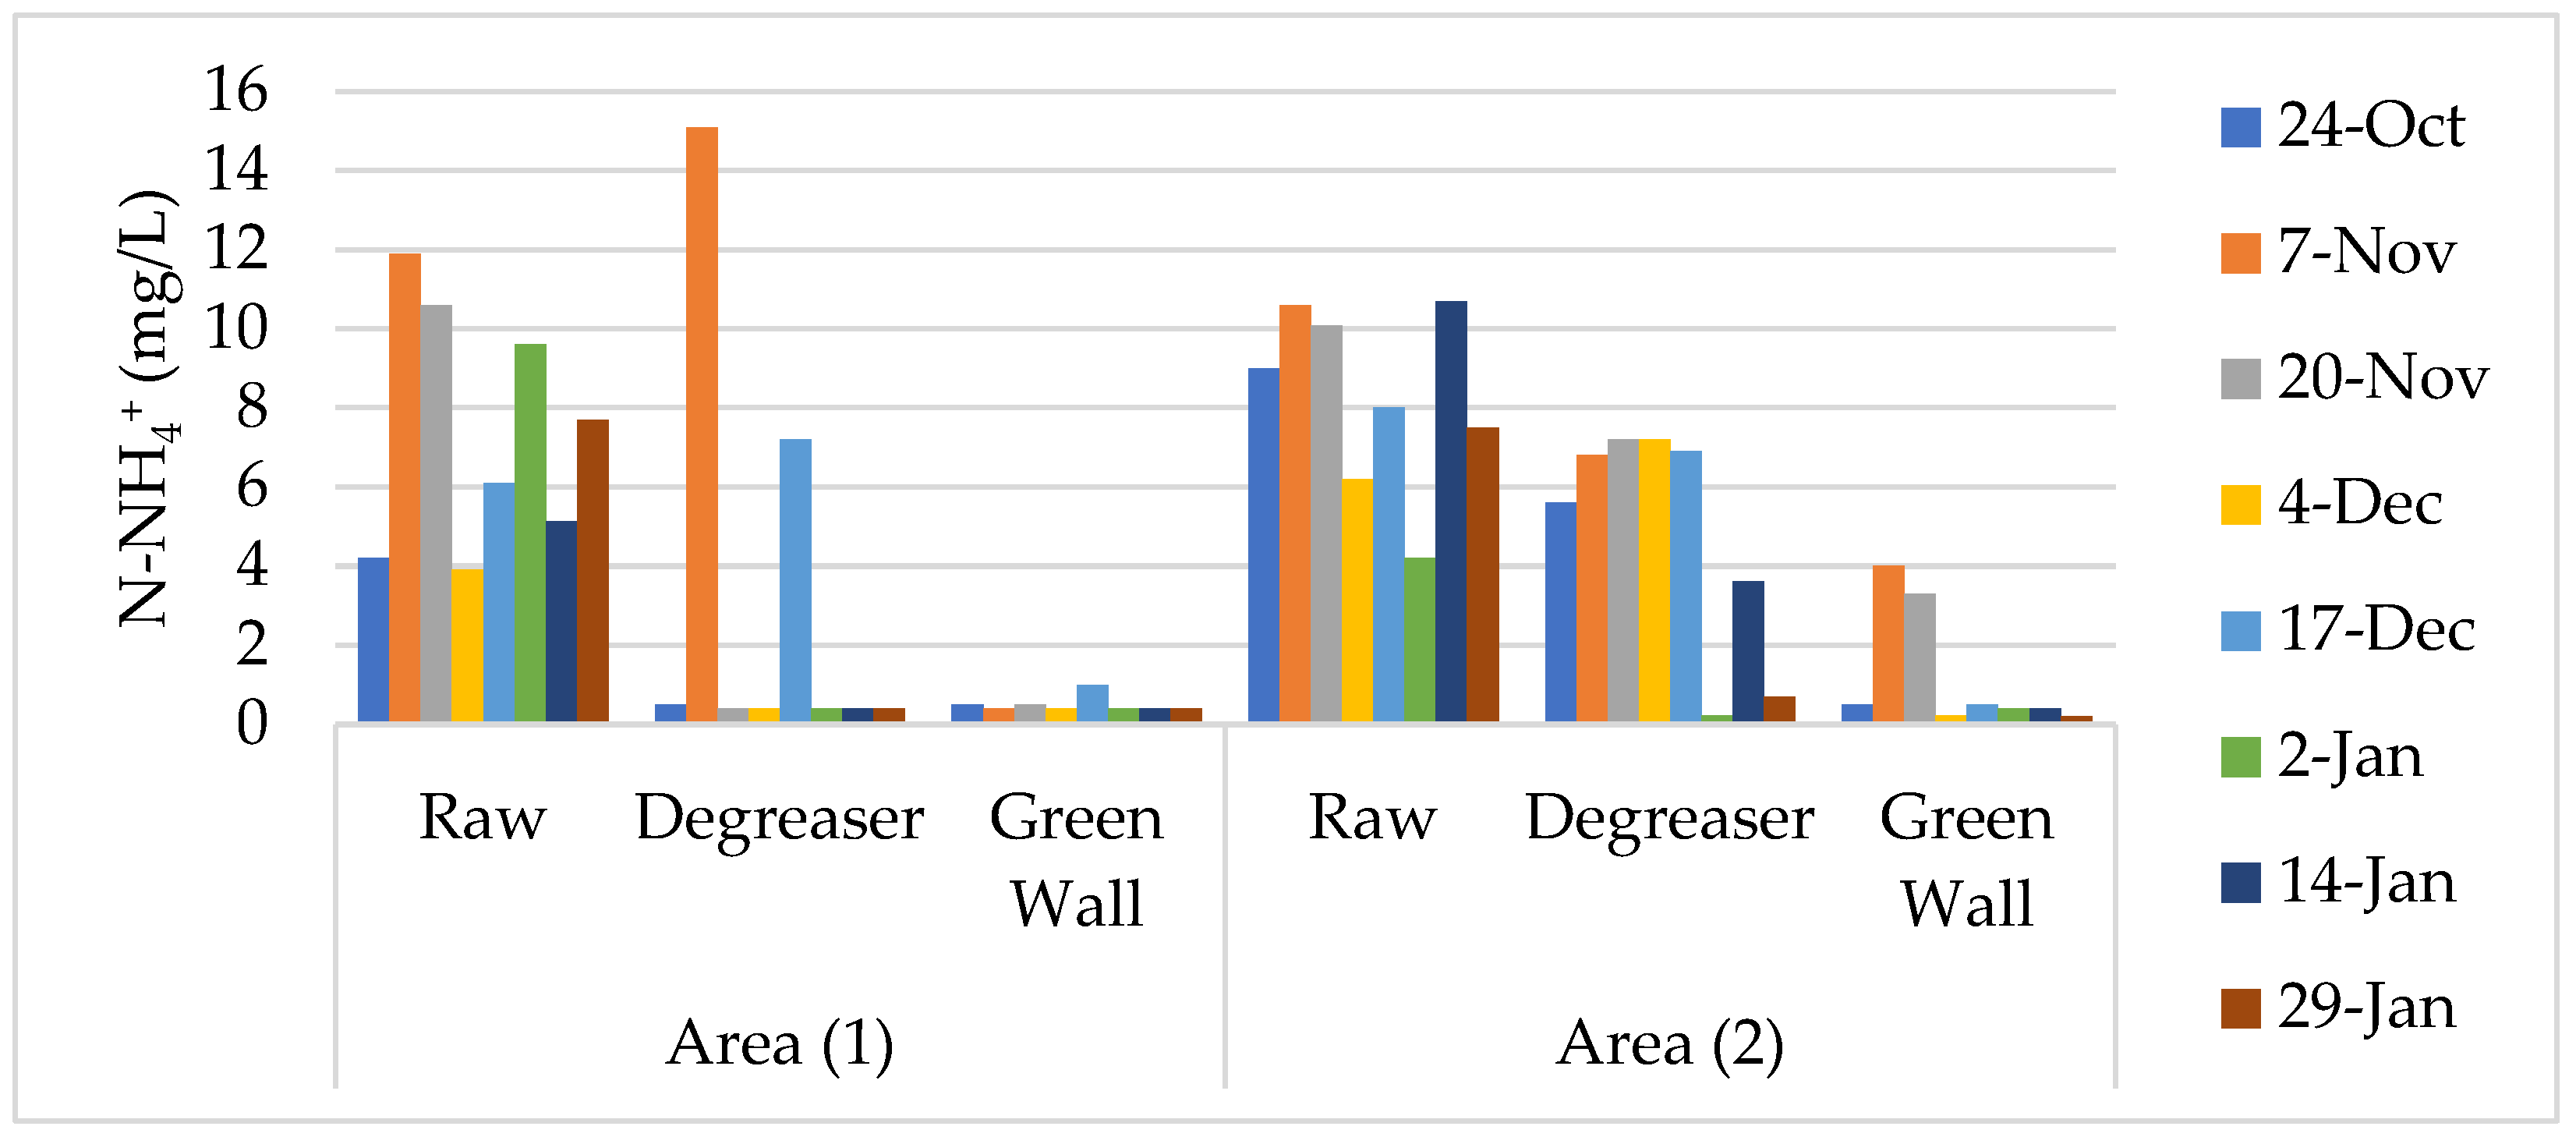
3.2.3. Nutrients (Nitrogen and Phosphate)

Degreasers primarily remove greases, fats, oils, and suspended solids, indirectly reducing organic substances like particulate phosphate and organic nitrogen. However, their nutrient removal efficiency is generally low, with TN and total phosphorus (TP) removal often below 10% [35,57]. In this study, area A1’s raw greywater had an average PO43− concentration of 1.96 mg/L, reducing to 1.24 mg/L after degreaser treatment and stabilizing at 0.65 mg/L post-green wall. In area A2, raw PO43− was 2.53 mg/L, decreasing to 1.59 mg/L after degreaser treatment and 0.74 mg/L post-green wall, as shown in Figure 5.
The green wall shows effective PO43− removal compared to both raw greywater and degreaser treatment. Area A1 achieves a PO43− removal efficiency of 36.9%, while area A2 reaches 37.1%. For TN, area A1’s raw greywater has an average TN of 20.65 mg/L, which decreases to 9.15 mg/L after degreaser treatment and stabilizes at 7.54 mg/L post-green wall. Area A2’s TN decreases from 22.14 mg/L to 14.31 mg/L after the degreaser and stabilizes at 9.43 mg/L post-green wall. Figure 6 shows the influent and effluent TN of the system.
Area A1 achieves 55.7% TN removal after degreaser treatment, compared to 35.3% in area A2, though the Tukey test shows no significant TN difference between the areas. The green wall significantly enhances TN removal, vital for nitrogen pollution control. For N-NH4+, area A1’s levels drop from 7.39 mg/L to 0.50 mg/L post-green wall, while area A2’s NH₄⁺ decreases from 8.29 mg/L to 1.19 mg/L. The green wall demonstrates superior N-NH4+ removal, with areas A1 and A2 achieving 93% and 86% reductions, respectively, as illustrated in Figure 7.
The on-site DGWTS shows distinct trends in NO3 levels. In area A1, NO3 begins at 0.19 mg/L in raw greywater, increases to 4.94 mg/L post-degreaser, and further rises to 6.43 mg/L after the green wall. In area A2, NO3 starts at 0.16 mg/L, climbs to 1.73 mg/L post-degreaser, and stabilizes at 4.03 mg/L post-green wall. The green walls, designed with a vertical wetland concept, enhance nitrogen transformation, yet the rising N-NO3 levels suggest incomplete denitrification, possibly due to limited anoxic zones. Mietto and Borin [58] and Nivala et al. [59] observed similar issues, where high N-NO3 levels indicated expected denitrifying bacterial activity. The increase in nitrate levels after treatment, due to nitrification, can benefit irrigation by supporting plant growth but may risk groundwater contamination or affect nitrate-sensitive plants. Regular monitoring and adherence to irrigation water quality standards are essential, with potential for integrating nitrate reduction measures if needed.

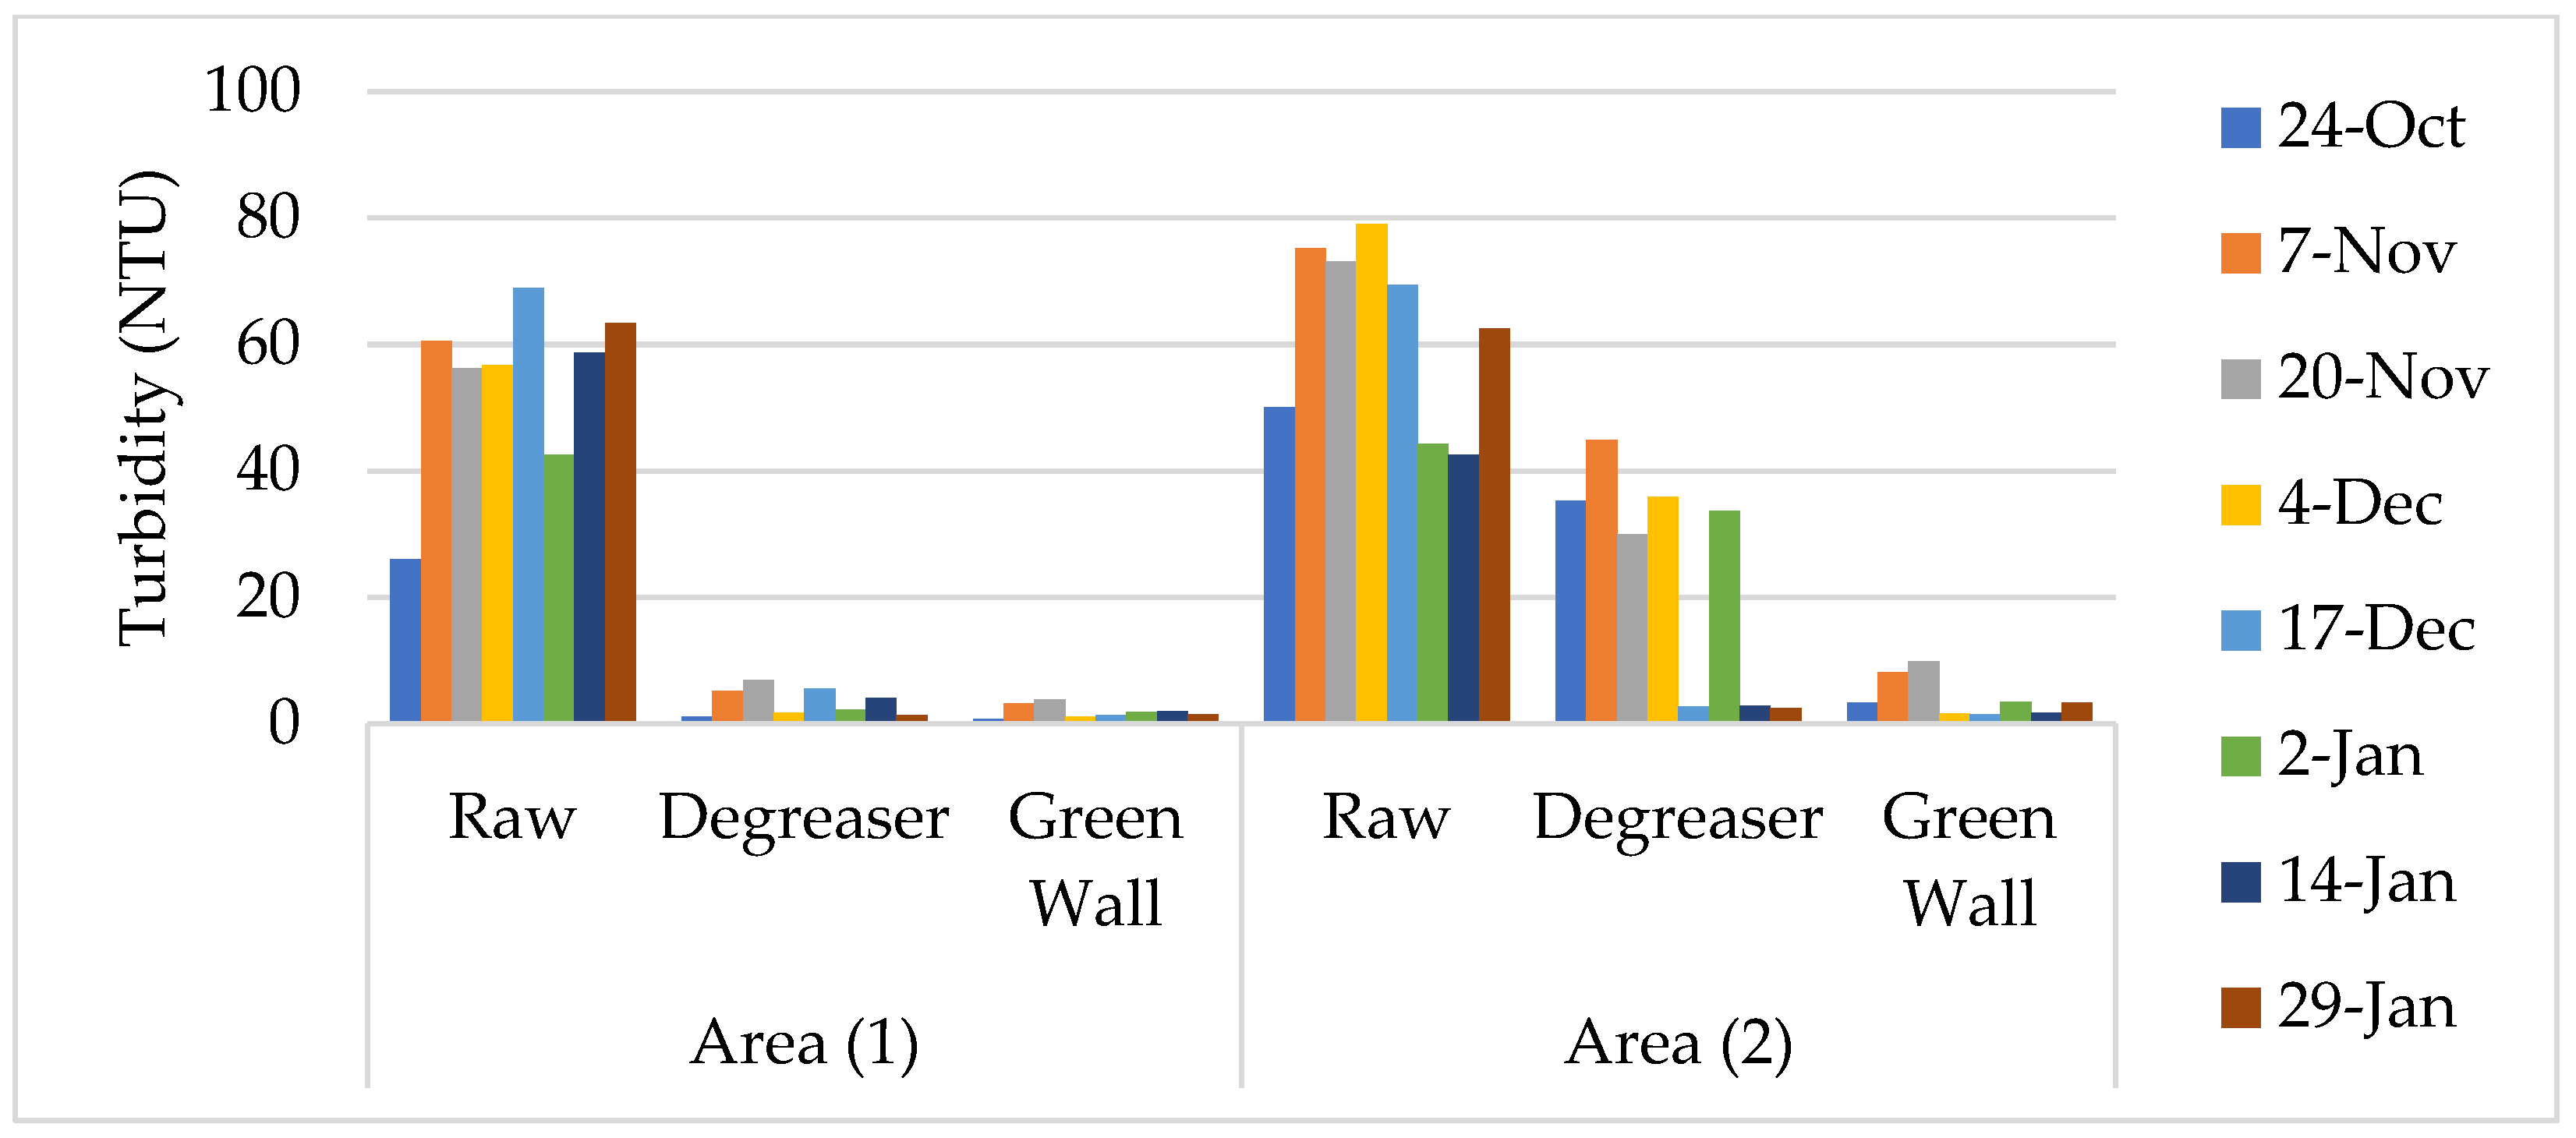
3.2.4. Total Dissolved Solids, Total Suspended Solids, and Turbidity

The TDS in greywater treated was evaluated within the DGWTS. In area A1, TDS rose from 611 mg/L in raw greywater to 1192 mg/L after degreaser treatment, stabilizing at 986 mg/L post-green wall. Area A2 showed a slight increase from 644 mg/L to 666 mg/L after the degreaser, remaining stable at 662 mg/L after the green wall. The increase in TDS after the degreaser was likely caused by soluble minerals leaching from the concrete in the degreaser’s internal tank, while the green wall’s impact was linked to ion desorption from filter media, aligning with studies by Chandran and Nijam [54] and Manga et al. [60].
The DGWTS significantly reduces TSS and turbidity, as illustrated in Figure 8 and Figure 9. In area A1, TSS decreases from 45 mg/L in raw greywater to 7 mg/L post-green wall, achieving 84.4% removal efficiency. Area A2 shows a reduction from 50 mg/L to 7 mg/L, with 86% efficiency. Turbidity in area A1 drops from 54 NTU to 2 NTU, achieving 96.4% efficiency, while area A2 reduces from 62 NTU to 4 NTU, with 93.5% efficiency. Overall, the system consistently enhances water quality by significantly reducing both turbidity and TSS. The degreaser tank effectively removes TSS and turbidity from greywater through physical separation. In area A1, it achieved 76.5% TSS and 93.4% turbidity removal, while area A2 saw 50.6% TSS and 62.1% turbidity reduction. These findings are consistent with Subramanian et al. [61], who reported 65% TSS and 89% turbidity removal using grease traps. Similar results were documented by Patil et al. [50]. The green wall system further enhanced TSS removal, outperforming the degreaser, with up to 94% TSS removal, as supported by Abou-Elela and Hellal [62] and Kotsia et al. [27]. Overall, the green wall significantly improved water quality by effectively reducing suspended solids.

3.2.5. Biological Characteristics of the Treatment System

Focusing on microbial contamination within the DGWTS, particularly TC and E. coli, the degreaser tank effluent in area A1 achieved a 95.5% reduction in E. coli, while area A2 showed a 38.5% reduction. The variation in E. coli removal at this stage was attributed to factors such as influent composition and hydraulic conditions [52]. Since the degreaser tank was not designed for pathogen removal, a significant amount of pathogens remained, highlighting the need for additional treatment steps [50].
Subsequently, the green wall system provided further treatment. In area A1, the green wall system achieved a 99.6% removal efficiency for TC and 99.82% (2.76 log) for E. coli, significantly reducing microbial counts. Area A2 exhibited similar performance, with a 99.3% TC removal efficiency and a 99.96% (3.39 log) reduction in E. coli. These results align with previous studies [55], which reported a 98.9% E. coli removal in another green façade. However, studies like Bakheet et al. [63] and Arden and Ma [64] indicated the need for additional disinfection to meet stricter reuse standards. When comparing the results to the Jordanian Standard (JS 1776/2013), the green wall-treated effluent met the criteria for irrigation reuse but did not fulfill the stricter requirements for toilet flushing, which requires E. coli levels below 10 MPN/100 mL. This highlights the need for additional treatment, such as UV disinfection, to achieve higher safety standards.
The UV treatment was evaluated as a post-treatment step for greywater. In area A1, UV disinfection achieved a 99.99% (5.49 log) removal efficiency for TC and 99.999% (5.14 log) for E. coli, reducing counts to 1.70 MPN/100 mL. Area A2 showed similar results, with UV treatment achieving a 99.90% (3.01 log) TC reduction and a 99.998% (4.97 log) E. coli reduction. These findings highlight the effectiveness of combining green wall systems with UV treatment for safe water reuse, providing an environmentally friendly alternative to chemical disinfection methods [65,66].

3.3. Performance Evaluation of Ground-Based Green Facades Systems

The green wall system in this study demonstrated high greywater treatment efficiency, consistent with previous research (Table 4). On average, it achieved over 92% removal of total COD and total BOD5, 84% removal of TSS, 71% removal of phosphorus, 58% removal of nitrogen, and 95% reduction in turbidity across both areas. These results are aligned with previous researchers’ findings, including Kotsia et al. [27] and Yadav et al. [67]. While some studies, like Boano et al. [7], demonstrated varying COD removal efficiency due to factors like biofilm growth and temperature changes, this study consistently maintained a high BOD5 removal efficiency. Plant presence in green wall systems significantly improved turbidity and TSS removal, as shown by Stefanatou et al. [29]. For TN removal, this study’s results were consistent with those of previous research [68], which highlighted the role of aerobic, non-saturated conditions and microbial activity in nitrogen transformation. Phosphorus removal efficiency varied across different studies [7,67] achieving significant TP removal using substrates like coconut fiber, perlite, and cocopeat. In this study, using gravel and sand substrates, TP removal ranged from 68% to 74%, comparable to other research but lower than systems with longer retention times or more effective substrates. Prodanovic et al. [68] attributed lower TP removal to short retention times that limited plant uptake.
While some studies included general information on the removal of microbes, others lacked details particular to the elimination of TC and E. coli. The current study demonstrated significant removal efficiency for TC (4.3 log) and E. coli (5.1 log) using sand and gravel as the substrate in addition to the UV disinfection unit, similar to Boano et al. (2021) and corroborating the findings of Stefanatou et al. [29] and Arden and Ma [64]. Arden and Ma [64] found that disinfection processes, including chlorination, ozonation, and UV radiation, are essential for improving greywater effluent quality, particularly in meeting microbiological standards. When used with either raw or pre-treated greywater, these methods enhance water safety for nonpotable reuse. Their research identifies the optimal setup as a combination of vertical flow wetlands with UV radiation and a chlorine residual, which consistently produces high-quality effluent suitable for various nonpotable applications, effectively addressing both chemical and microbiological requirements.
Incorporating sand substrate in green wall systems significantly extended contact duration between pathogens and biofilm, leading to a larger reduction in E. coli, but not enough to satisfy reuse criteria without an additional disinfection step, as indicated by studies like Stefanatou et al. [29] and Sami et al. [69], and further supported by Arden and Ma’s [64] review. To meet safety standards for greywater reuse in applications like toilet flushing, post-treatment processes such as UV disinfection or chlorination are essential. The treated effluent from the DGWTS was evaluated against Jordanian standards for lawn irrigation and toilet flushing. The effluent from areas A1 and A2 met JS 1776/2013 for lawn irrigation and JS 893/2021 [33] for TDS and DO, confirming its suitability for irrigation. For toilet flushing, the effluent met standards for pH, DO, TSS, and turbidity, with area A1 consistently meeting total COD and total BOD5 standards. The TN, PO43−, and E. coli levels were within acceptable limits, making the treated effluent suitable for reuse in both applications. Overall, the findings underscore the potential of green wall systems for greywater treatment in urban settings. Despite variations in substrates and monitoring periods, the decentralized green wall system used in this study proves to be an effective alternative for greywater treatment, contributing to improved effluent quality suitable for reuse. In terms of plant growth, the aquatic species placed in the vertical flow filter demonstrated good results during the first year of operation; on the other hand, climbing plants are still showing a significant delay in their growth.

3.4. Effects of Treatment Phases on Greywater Quality

The Tukey–Kramer method was used to statistically compare the impact of treatment phases (Degreaser, Green Wall, and UV) on greywater quality parameters, with a significance threshold of p < 0.05. Letter groups (A, B, C) in the table indicate whether the treatment means differ significantly across phases. For example:
  • pH: The raw greywater has the letter A, while both the degreaser and green wall systems have letter B. This indicates that the pH difference between raw greywater and the degreaser is significant. However, the pH difference between the degreaser and the green wall systems is not significant.
  • DO: The letters C, B, and A are associated with raw greywater, degreaser, and green wall systems, respectively. This suggests that DO values increase significantly at each treatment phase, from raw greywater to the degreaser and further to the green wall façade system.
  • TSS and Turbidity: Both parameters show a similar trend with letter groups A, B, and C for raw greywater, degreaser, and green wall systems, respectively. This indicates a significant reduction in TSS and turbidity at each treatment phase, with the green wall showing the most effective removal.
  • TDS: For TDS, raw greywater has the letter B, while both the degreaser and green wall systems have the letter A. This suggests that TDS values do not differ significantly between the degreaser and the green wall but do differ significantly between raw greywater and the degreaser.
  • Total COD and total BOD5: These parameters follow the A, B, C trend, indicating significant reductions at each treatment step, with the green wall achieving the most notable reductions in total COD and total BOD5.
  • Nutrients (TN, N-NH4+, and PO43−): These parameters also follow the A, B, C trend, reflecting significant reductions across all treatment phases, with the green wall being the most effective.
  • N-NO3: The letter groups C, B, and A are shown for raw greywater, degreaser, and green wall systems, respectively. This indicates significant increases in nitrate levels at each treatment stage, likely due to nitrification processes.
  • TC and E. coli: The letter groups A, B, B, and B are associated with raw greywater, degreaser, green wall, and UV systems, respectively. This indicates that the TC and E. coli concentrations decrease significantly from raw greywater to the degreaser but do not differ significantly between the degreaser, green wall, and UV systems.
The findings of Arden and Ma [64] are aligned with our results and show that the performance of constructed wetlands varies by type, such as surface flow, subsurface flow, vertical, and recirculating vertical flow, with each type offering unique advantages in achieving water quality standards. Their study, like ours, demonstrated that while these wetlands can meet chemical and physical standards with adequate retention time or recirculation, achieving consistent microbiological compliance remains challenging. Despite optimization efforts, wetlands alone often fall short of reliably meeting microbiological safety requirements, underscoring the need for supplementary treatment processes. Significant reductions in TC and E. coli levels were noted, with treatment steps effectively lowering these levels compared to raw greywater. The results are detailed in Table 5.

3.5. Sustainability Evaluation of the DGWTS System

The sustainability of the DGWTS system was assessed in a related study by Obeidat et al. [71], which explored the social dynamics surrounding the implementation of decentralized greywater treatment systems. The study focused on fostering public acceptance and ensuring sustainable adoption in urban contexts, with specific attention to Al-Zahra’a Dormitory at the University of Jordan. The technical performance of the system was evaluated by analyzing treated effluent quality against Jordanian standards to determine its suitability for reuse in irrigation and toilet flushing. Additionally, a structured questionnaire distributed to dormitory residents and staff assessed social acceptance. This mixed-methods approach grouped responses into four themes: Awareness and Understanding, Perceptions and Attitudes, Environmental Impact, and Participation and Support. Key findings revealed strong community interest, with 90% of respondents acknowledging water scarcity and the need for innovative solutions. The majority supported expanding the green wall-based system to other residential areas and expressed interest in training programs for system operation and maintenance. However, concerns about potential odors and health risks were noted, highlighting the importance of addressing these issues through clear protocols and community involvement. The study demonstrates the potential for decentralized greywater treatment systems to address water scarcity while emphasizing the need for stakeholder collaboration, training, and proactive management to ensure long-term sustainability. Expanding these systems beyond the dormitory, coupled with ongoing community outreach, can amplify their environmental and social impact.

4. Conclusions

The DGWTS, composed of a degreaser, a green wall façade, and UV disinfection, has shown considerable effectiveness as a decentralized solution for treating greywater in urban areas of Jordan. The system’s overall performance highlights its ability to manage low- to medium-strength wastewater, a characteristic of greywater generated in dormitories due to varying water use patterns, lifestyles, and cultural practices. The degreaser, serving as the initial treatment step, exhibited moderate removal efficiencies for key parameters such as TSS and turbidity. However, the system’s inability to prevent an increase in TDS levels—attributable to the lack of insulation or coating in the degreaser tank—raises concerns. This issue is compounded by the degreaser’s limited capacity to remove pathogens and nutrients from the greywater.
The subsequent green wall façade treatment step proved highly effective, showing substantial removal rates for total COD, total BOD5, TSS, and turbidity. These findings highlight the green wall system’s potential for broader implementation in urban areas of Jordan. The treated effluent from the green wall system, post UV disinfection, meets Jordanian standards for lawn irrigation reuse, particularly in reducing E. coli concentrations to acceptable levels for irrigation purposes. However, the effluent fails to meet the stricter standards required for toilet flushing, underscoring the need not just for additional treatment but also for optimization to address microbial safety concerns. Instead of introducing more treatment steps, the solution lies in enhancing the maintenance of the existing system. With low TSS and turbidity levels, UV disinfection can achieve near-complete pathogen removal. During the system startup, higher levels of TSS or turbidity may have been released, affecting its effectiveness, and it is likely that cleaning the UV lamps would restore optimal performance. Despite achieving compliance with standards for pH, DO, and TSS, turbidity remains a challenge, particularly in area A2 of the dormitory. The reduction in organic pollutants in area A2 indicates potential for further reuse applications, such as toilet flushing.
The system’s success underscores the feasibility of using a combination of degreaser, green wall façades, and UV disinfection for greywater treatment in Jordanian urban communities. These findings also have significant implications for urban water management strategies, particularly in regions facing water scarcity. By reducing the reliance on freshwater resources and alleviating the burden on centralized wastewater infrastructure, decentralized systems like the DGWTS can serve as a sustainable and localized solution for water reuse. However, addressing challenges related to maintenance, microbial safety, and system optimization is critical for ensuring long-term feasibility. The modular and adaptable nature of the system makes it well suited for broader application in urban environments, fostering sustainable water management practices through community engagement and ongoing monitoring.
The study recommends enhancing the DGWTS by adding a second main treatment unit to improve effluent quality, as the current degreaser does not meet Jordanian standards for irrigation and toilet flushing. To address increased TDS levels, the degreaser tank should be painted with epoxy paint or constructed from alternative materials, and filter materials should be washed thoroughly before use. Additional UV disinfection is suggested to meet toilet flushing standards. Continuous monitoring is crucial for maintaining system performance, and community education and training programs are essential for successful implementation and long-term sustainability. Routine maintenance will address odor and environmental concerns, supporting future expansion.

Author Contributions

Conceptualization, N.O. and A.A.-S.; methodology, N.O., A.A.-S. and R.B.; software, N.O., F.M., M.M.Z. and A.R.; validation, M.M.Z., R.B. and F.M.; formal analysis, M.M.Z. and R.B.; investigation, N.O. and M.M.Z.; resources, A.R. and N.O.; data curation, N.O., F.M. and J.A.; writing—original draft preparation, F.M. and M.M.Z.; writing—review and editing, A.A.-S., A.R., J.A. and R.B.; visualization, F.M., M.M.Z. and A.R.; supervision, A.A.-S. and A.A.A.; project administration, A.A.-S. All authors have read and agreed to the published version of the manuscript.

Funding

The decentralized treatment unit (green wall facades) was created for greywater exiting Al-Zahra’a, a female student dormitory on the University of Jordan campus under the funding of the European Union (UN) in partnership with the Nature Based Solutions for Domestic Water Reuse in Mediterranean Countries (NAWAMED) Project (No.: A_B.4.1_0290).

Data Availability Statement

The data supporting the results of this study are not publicly available due to privacy restrictions imposed by the relevant ministries. However, interested parties may contact the corresponding author for inquiries regarding data access under appropriate ethical guidelines.

Acknowledgments

The authors would like to express their sincere gratitude to the University of Jordan, Amman, Jordan, for providing the resources and support necessary for this research.

Conflicts of Interest

Authors Riccardo Bresciani, Fabio Masi and Anacleto Rizzo were employed by the company Iridra Srl, author Jomanah AlBtoosh was employed by the company Deutsche Gesellschaft fur Internationale Zusammenarbeit GmbH. The remaining authors declare that the research was conducted in the absence of any commercial or financial relationships that could be construed as a potential conflict of interest.

References

  1. Wilderer, P.A.; Schreff, D. Decentralized and Centralized Wastewater Management: A Challenge for Technology Developers. Water Sci. Technol. 2000, 41, 1–8. [Google Scholar] [CrossRef]
  2. Kujawa-Roeleveld, K.; Zeeman, G. Anaerobic Treatment in Decentralised and Source-Separation-Based Sanitation Concepts. Rev. Environ. Sci. BioTechnol. 2006, 5, 115–139. [Google Scholar] [CrossRef]
  3. Alrbaihat, M.R.; Abu-Afifeh, Q. Eco-Friendly Microplastic Removal through Physical and Chemical Techniques: A Review. Ann. Adv. Chem. 2023, 7, 14–24. [Google Scholar]
  4. Obeidat, N.; Shatanawi, K.; Kassab, G.; Halalsheh, M. Performance of Decentralized Wastewater Treatment System Employing Upflow Anaerobic Sludge Blanket and Vertical Flow Constructed Wetland. Case Stud. Chem. Environ. Eng. 2024, 9, 100695. [Google Scholar] [CrossRef]
  5. Al-Jayyousi, O.R. Greywater Reuse: Towards Sustainable Water Management. Desalination 2003, 156, 181–192. [Google Scholar] [CrossRef]
  6. Sushmitha, M.B.; Chanakya, H.N.; Khuntia, H.K. Efficient Grey Water Treatment and Reuse Options for India—A Review. In Proceedings of the Waste Water Recycling and Management: 7th IconSWM—ISWMAW 2017, Fairfield, OH, USA, 11–18 October 2017; Volume 3, pp. 143–149. Available online: https://link.springer.com/chapter/10.1007%2F978-981-13-2619-6_12 (accessed on 26 January 2022).
  7. Boano, F.; Caruso, A.; Costamagna, E.; Fiore, S.; Demichelis, F.; Galvão, A.; Pisoeiro, J.; Rizzo, A.; Masi, F. Assessment of the Treatment Performance of an Open-Air Green Wall Fed with Graywater under Winter Conditions. ACS EST Water 2020, 1, 595–602. [Google Scholar] [CrossRef]
  8. Castellar, J.A.C.; Torrens, A.; Buttiglieri, G.; Monclús, H.; Arias, C.A.; Carvalho, P.N.; Galvao, A.; Comas, J. Nature-Based Solutions Coupled with Advanced Technologies: An Opportunity for Decentralized Water Reuse in Cities. J. Clean. Prod. 2022, 340, 130660. [Google Scholar] [CrossRef]
  9. Tilley, E.; Ulrich, L.; Luethi, C.; Reymond, P.; Zurbruegg, Z. Compendium of Sanitation Systems and Technologies, 2nd ed.; SSWM, 2014; Available online: https://sswm.info/sites/default/files/reference_attachments/TILLEY%20et%20al%202014%20Compendium%20of%20Sanitation%20Systems%20and%20Technologies%202nd%20Revised%20Edition.pdf (accessed on 1 December 2024).
  10. Rysulova, M.; Kaposztasova, D.; Vranayova, Z. Green Walls as an Approach in Grey Water Treatment. IOP Conf. Ser. Mater. Sci. Eng. 2017, 245, 072049. [Google Scholar] [CrossRef]
  11. Dal Ferro, N.; De Mattia, C.; Gandini, M.A.; Maucieri, C.; Stevanato, P.; Squartini, A.; Borin, M. Green Walls to Treat Kitchen Greywater in Urban Areas: Performance from a Pilot-Scale Experiment. Sci. Total Environ. 2021, 757, 144189. [Google Scholar] [CrossRef]
  12. Lakho, F.H.; Vergote, J.; Ihsan-Ul-Haq Khan, H.; Depuydt, V.; Depreeuw, T.; Van Hulle, S.W.H.; Rousseau, D.P.L. Total Value Wall: Full Scale Demonstration of a Green Wall for Grey Water Treatment and Recycling. J. Environ. Manag. 2021, 298, 113489. [Google Scholar] [CrossRef]
  13. Aicher, A.; Boermel, M.; Londong, J.; Beier, S. Vertical Green System for Gray Water Treatment: Analysis of the VertiKKA-Module in a Field Test. Front. Environ. Sci. 2022, 10, 976005. [Google Scholar] [CrossRef]
  14. Galvão, A.; Martins, D.; Rodrigues, A.; Manso, M.; Ferreira, J.; Silva, C.M. Green Walls with Recycled Filling Media to Treat Greywater. Sci. Total Environ. 2022, 842, 156748. [Google Scholar] [CrossRef] [PubMed]
  15. Pucher, B.; Zluwa, I.; Spörl, P.; Pitha, U.; Langergraber, G. Evaluation of the Multifunctionality of a Vertical Greening System Using Different Irrigation Strategies on Cooling, Plant Development and Greywater Use. Sci. Total Environ. 2022, 849, 157842. [Google Scholar] [CrossRef] [PubMed]
  16. Abu Qdais, H.; Abdulla, F.; Kurbatova, A. Wastewater Reuse in Jordan and Its Potential as an Adaptation Measure to Climate Change. J. Environ. Eng. Sci. 2019, 14, 203–211. [Google Scholar] [CrossRef]
  17. AlBtoosh, J.; Abu-Awwad, A.; Obeidat, N. A Statistical Approach to the Water Scarcity Implications on Food Security. Global J. Environ. Sci. Manag. 2024, 10, 201–218. [Google Scholar]
  18. Al-Mashaqbeh, O.; Alsafadi, D.; Dalahmeh, S.; Bartelt-Hunt, S.; Snow, D. Removal of Selected Pharmaceuticals and Personal Care Products in Wastewater Treatment Plant in Jordan. Water 2019, 11, 2004. [Google Scholar] [CrossRef]
  19. Ibrahim, M. Effluent Quality Assessment of Selected Wastewater Treatment Plant in Jordan for Irrigation Purposes: Water Quality Index Approach. J. Ecol. Eng. 2019, 20, 206–216. [Google Scholar] [CrossRef]
  20. Al Hadidi, N.; Al Hadidi, M. Suitability of Reclaimed Wastewater Effluent from Decentralized Wastewater Plant for Irrigation. Appl. Water Sci. 2021, 11, 173. [Google Scholar] [CrossRef]
  21. Abu-Afifeh, Q.; Rahbeh, M.; Al-Afeshat, A.; Al-Omari, S.; Qutishat, T.A.; Brezat, A.; Alkayed, A. Dam Sustainability’s Interdependency with Climate Change and Dam Failure Drivers. Sustainability 2023, 15, 16239. [Google Scholar] [CrossRef]
  22. Al-Afeshat, A.; Zoubi, M.M.; Abu Afifeh, Q.Y.; Al-Jawaldeh, H.; Qutishat, T.A.; Masoud, A.M.N.; Rahbeh, M. Interrelation of Dams Sustainability with the Local Communities and Water Quality. Global J. Environ. Sci. Manag. 2025, 11, 1–20. [Google Scholar]
  23. Hroub, H.A.; Rahbeh, M.; Zoubi, M.M.; Abu-Afifeh, Q.Y.; Al-Jawaldeh, H.; Obeidat, N. Projection of Future Temperature Variations in River Basins under Climate Change Scenarios Using General Circulation Models. Global J. Environ. Sci. Manag. 2025, 11. [Google Scholar] [CrossRef]
  24. MWI. Annual Reports; Ministry of Water and Irrigation: Amman, Jordan, 2022.
  25. Langergraber, G.; Castellar, J.A.C.; Pucher, B.; Baganz, G.F.M.; Milosevic, D.; Andreucci, M.-B.; Kearney, K.; Pineda-Martos, R.; Atanasova, N. A Framework for Addressing Circularity Challenges in Cities with Nature-Based Solutions. Water 2021, 13, 2355. [Google Scholar] [CrossRef]
  26. Bustami, R.A.; Belusko, M.; Ward, J.; Beecham, S. Vertical Greenery Systems: A Systematic Review of Research Trends. Build. Environ. 2018, 146, 226–237. [Google Scholar] [CrossRef]
  27. Kotsia, D.; Deligianni, A.; Fyllas, N.M.; Stasinakis, A.S.; Fountoulakis, M.S. Converting Treatment Wetlands into “Treatment Gardens”: Use of Ornamental Plants for Greywater Treatment. Sci. Total Environ. 2020, 744, 140889. [Google Scholar] [CrossRef] [PubMed]
  28. Stefanatou, A.; Lagkadas, M.; Petousi, I.; Schiza, S.; Stasinakis, A.S.; Fyllas, N.; Fountoulakis, M.S. Vertical Flow Constructed Wetlands as Green Facades and Gardens for On-Site Greywater Treatment in Buildings: Two-Year Mesocosm Study on Removal Performance. Sci. Total Environ. 2024, 906, 167362. [Google Scholar] [CrossRef]
  29. Stefanatou, A.; Vouzi, L.; Petousi, I.; Koukoura, A.; Gatidou, G.; Stasinakis, A.S.; Fountoulakis, M.S. Treatment of Real Laundry Wastewater Using Vertical Flow Constructed Wetland Planted with the Ornamental Climbing Plant Trachelospermum Jasminoides: Assessing the Removal of Conventional Pollutants and Benzotriazoles. Environ. Sci. Pollut. Res. 2024, 31, 43281–43291. [Google Scholar] [CrossRef]
  30. Platzer, C. Design Recommendations for Subsurface Flow Constructed Wetlands for Nitrification and Denitrification. Water Sci. Technol. 1999, 40, 257–263. [Google Scholar] [CrossRef]
  31. Stefanakis, A.I.; Tsihrintzis, V.A. Performance of Pilot-Scale Vertical Flow Constructed Wetlands Treating Simulated Municipal Wastewater: Effect of Various Design Parameters. Desalination 2009, 248, 753–770. [Google Scholar] [CrossRef]
  32. APHA; AWWA; WEF. Standard Methods for the Examination of Water and Wastewater, 21st ed.; American Public Health Association: Washington, DC, USA, 2005. [Google Scholar]
  33. Al Arni, S.; Elwaheidi, M.; Salih, A.A.M.; Ghernaout, D.; Matouq, M. Greywater Reuse: An Assessment of the Jordanian Experience in Rural Communities. Water Sci. Technol. 2022, 85, 1952–1963. [Google Scholar] [CrossRef]
  34. Ghunmi, L.A.; Zeeman, G.; van Lier, J.; Fayyed, M. Quantitative and Qualitative Characteristics of Grey Water for Reuse Requirements and Treatment Alternatives: The Case of Jordan. Water Sci. Technol. 2008, 58, 1385–1396. [Google Scholar] [CrossRef]
  35. Hernández Leal, L.; Temmink, H.; Zeeman, G.; Buisman, C.J.N. Comparison of Three Systems for Biological Greywater Treatment. Water 2010, 2, 155–169. [Google Scholar] [CrossRef]
  36. Noutsopoulos, C.; Andreadakis, A.; Kouris, N.; Charchousi, D.; Mendrinou, P.; Galani, A.; Mantziaras, I.; Koumaki, E. Greywater Characterization and Loadings—Physicochemical Treatment to Promote Onsite Reuse. J. Environ. Manag. 2018, 216, 337–346. [Google Scholar] [CrossRef] [PubMed]
  37. Roshan, A.; Kumar, M. Water End-Use Estimation Can Support the Urban Water Crisis Management: A Critical Review. J. Environ. Manag. 2020, 268, 110663. [Google Scholar] [CrossRef] [PubMed]
  38. Van de Walle, A.; Kim, M.; Alam, M.K.; Wang, X.; Wu, D.; Dash, S.R.; Rabaey, K.; Kim, J. Greywater Reuse as a Key Enabler for Improving Urban Wastewater Management. Environ. Sci. Ecotechnol. 2023, 16, 100277. [Google Scholar]
  39. Jamrah, A.; Ayyash, S. Greywater Generation and Characterization in Major Cities in Jordan. Jordan J. Civ. Eng. 2008, 2, 376–390. [Google Scholar]
  40. Al-Mashaqbeh, O.A.; Ghrair, A.M.; Megdal, S.B. Grey Water Reuse for Agricultural Purposes in the Jordan Valley: Household Survey Results in Deir Alla. Water 2012, 4, 580–596. [Google Scholar] [CrossRef]
  41. Sonune, N.; Mungal, N.; Kamble, S. Study of Physico-Chemical Characteristics of Domestic Wastewater in Vishnupuri, Nanded, India. Int. J. Curr. Microbiol. Appl. Sci. 2015, 4, 533–536. [Google Scholar]
  42. Metcalf and Eddy; Tchobanoglous, G. Wastewater Engineering: Treatment and Resource Recovery, 4th ed.; Mcgraw-Hill: New York, NY, USA, 2004. [Google Scholar]
  43. Albalawneh, A.; Chang, T.-K. Review of the greywater and proposed greywater recycling scheme for agricultural irrigation reuses. Int. J. Res. Granthaalayah 2015, 3, 16–35. [Google Scholar]
  44. Boyjoo, Y.; Pareek, V.K.; Ang, M. A Review of Greywater Characteristics and Treatment Processes. Water Sci. Technol. 2013, 67, 1403–1424. [Google Scholar] [CrossRef]
  45. Ghaly, A.; Mahmoud, N.; Ibrahim, M.; Mostafa, E.; Abdelrahman, E.; Emam, R.; Kassem, M.; Hatem, M. Greywater Sources, Characteristics, Utilization and Management Guidelines: A Review. Adv. Environ. Waste Manag. Recycl. 2021, 4, 2795–2809. [Google Scholar]
  46. Oteng-Peprah, M.; de Vries, N.K.; Acheampong, M.A. Greywater Characterization and Generation Rates in a Peri Urban Municipality of a Developing Country. J. Environ. Manag. 2018, 206, 498–506. [Google Scholar] [CrossRef]
  47. Mahmoudi, A.; Mousavi, S.A.; Darvishi, P. Greywater as a Sustainable Source for Development of Green Roofs: Characteristics, Treatment Technologies, Reuse, Case Studies and Future Developments. J. Environ. Manag. 2021, 295, 112991. [Google Scholar] [CrossRef] [PubMed]
  48. Abdel-Shafy, H.I.; El-Khateeb, M.A.; Shehata, M. Greywater Treatment Using Different Designs of Sand Filters. Desalin. Water Treat. 2013, 52, 5237–5242. [Google Scholar] [CrossRef]
  49. Korkusuz, E.A.; Beklioǧlu, M.; Demirer, G.N. Treatment Efficiencies of the Vertical Flow Pilot-Scale Constructed Wetlands for Domestic Wastewater Treatment. Turk. J. Eng. Environ. Sci. 2004, 28, 333–344. [Google Scholar]
  50. Patil, Y.M.; Patki, V.K.; Jahagirdar, S.; Karale, R.; Angathekar, V. Greywater Treatment by Vegetated Vermifilter: A Low Cost Material for Rural Sanitation in India. Mater. Today Proc. 2021, 45, 6946–6950. [Google Scholar] [CrossRef]
  51. Samayamanthula, D.R.; Sabarathinam, C.; Bhandary, H. Treatment and Effective Utilization of Greywater. Appl. Water Sci. 2019, 9, 90. [Google Scholar] [CrossRef]
  52. Tusiime, A.; Solihu, H.; Sekasi, J.; Mutanda, H.E. Performance of Lab-Scale Filtration System for Grey Water Treatment and Reuse. Environ. Chall. 2022, 9, 100641. [Google Scholar] [CrossRef]
  53. Abunaser, S.G.; Abdelhay, A. Performance of a Novel Vertical Flow Constructed Wetland for Greywater Treatment in Rural Areas in Jordan. Environ. Technol. 2020, 1–11. [Google Scholar] [CrossRef]
  54. Chandran, N.; Nijam, S. Performance Evaluation of Pumice as Green Wall Medium for Grey Water Recycling. Int. J. Sci. Eng. Res. 2020, 11, 84–90. [Google Scholar]
  55. Boano, F.; Caruso, A.; Costamagna, E.; Ridolfi, L.; Fiore, S.; Demichelis, F.; Galvão, A.; Pisoeiro, J.; Rizzo, A.; Masi, F. A Review of Nature-Based Solutions for Greywater Treatment: Applications, Hydraulic Design, and Environmental Benefits. Sci. Total Environ. 2020, 711, 134731. [Google Scholar] [CrossRef]
  56. Alateeqi, M.; Khajah, M.; Abu-Arabi, M.; AlMansour, H. Greywater Treatment Using Vertical Subsurface Flow Constructed Wetland System. J. Eng. Res. 2023, 11, 100052. [Google Scholar] [CrossRef]
  57. Micek, A.; Jóżwiakowski, K.; Marzec, M.; Listosz, A.; Malik, A. Efficiency of Pollution Removal in Preliminary Settling Tanks of Household Wastewater Treatment Plants in the Roztocze National Park. J. Ecol. Eng. 2020, 21, 9–18. [Google Scholar]
  58. Mietto, A.; Borin, M. Performance of Two Small Subsurface Flow Constructed Wetlands Treating Domestic Wastewaters in Italy. Environ. Technol. 2013, 34, 1085–1095. [Google Scholar]
  59. Nivala, J.; van Afferden, M.; Hasselbach, R.; Langergraber, G.; Molle, P.; Rustige, H.; Nowak, J. The New German Standard on Constructed Wetland Systems for Treatment of Domestic and Municipal Wastewater. Water Sci. Technol. 2018, 78, 2414–2426. [Google Scholar]
  60. Manga, M.; Ngobi, T.G.; Okeny, L.; Acheng, P.; Namakula, H.; Kyaterekera, E.; Nansubuga, I.; Kibwami, N. The Effect of Household Storage Tanks/Vessels and User Practices on the Quality of Water: A Systematic Review of Literature. Environ. Syst. Res. 2021, 10, 18. [Google Scholar]
  61. Subramanian, P.S.G.; Raj, A.V.; Jamwal, P.; Connelly, S.; Yeluripati, J.; Richards, S.; Ellis, R.; Rao, L. Decentralized Treatment and Recycling of Greywater from a School in Rural India. J. Water Process Eng. 2020, 38, 101695. [Google Scholar]
  62. Abou-Elela, S.I.; Hellal, M.S. Municipal Wastewater Treatment Using Vertical Flow Constructed Wetlands Planted with Canna, Phragmites and Cyprus. Ecol. Eng. 2012, 47, 209–213. [Google Scholar]
  63. Bakheet, B.; Prodanovic, V.; Deletic, A.; McCarthy, D. Effective Treatment of Greywater via Green Wall Biofiltration and Electrochemical Disinfection. Water Res. 2020, 185, 116228. [Google Scholar]
  64. Arden, S.; Ma, X. Constructed Wetlands for Greywater Recycle and Reuse: A Review. Sci. Total Environ. 2018, 630, 587–599. [Google Scholar]
  65. Winward, G.P.; Avery, L.M.; Stephenson, T.; Jefferson, B. Ultraviolet (UV) disinfection of grey water: Particle size effects. Environ. Technol. 2008, 29, 235–244. [Google Scholar]
  66. Ofori, S.; Abebrese, D.K.; Růžičková, I.; Wanner, J. Reuse of Treated Wastewater for Crop Irrigation: Water Suitability, Fertilization Potential, and Impact on Selected Soil Physicochemical Properties. Water 2024, 16, 484. [Google Scholar] [CrossRef]
  67. Yadav, R.K.; Sahoo, S.; Yadav, A.K.; Patil, S.A. Green Wall System Coupled with Slow Sand Filtration for Efficient Greywater Management at Households. npj Clean Water 2023, 6, 73. [Google Scholar]
  68. Prodanovic, V.; McCarthy, D.; Hatt, B.; Deletic, A. Designing Green Walls for Greywater Treatment: The Role of Plants and Operational Factors on Nutrient Removal. Ecol. Eng. 2019, 130, 184–195. [Google Scholar]
  69. Sami, M.; Hedström, A.; Kvarnström, E.; McCarthy, D.T.; Herrmann, I. Greywater Treatment in a Green Wall Using Different Filter Materials and Hydraulic Loading Rates. J. Environ. Manag. 2023, 340, 117998. [Google Scholar]
  70. Masi, F.; Bresciani, R.; Rizzo, A.; Edathoot, A.; Patwardhan, N.; Panse, D.; Langergraber, G. Green Walls for Greywater Treatment and Recycling in Dense Urban Areas: A Case-Study in Pune. J. Water, Sanit. Hyg. Dev. 2016, 6, 342–347. [Google Scholar]
  71. Obeidat, N.; Abu-Awwad, A.; Al-Salaymeh, A.S.; AlBtoosh, J.; Zoubi, M.M.; Abu-Afifeh, Q.Y.; Seif, M.A.; Hroub, H.; Arabiat, O. Social Acceptance of Water Quality through Decentralized Greywater Treatment Using Green Wall System. Global J. Environ. Sci. Manag. 2025, 11. [Google Scholar] [CrossRef]
Figure 1. Dormitory location at the University of Jordan campus (by Google Earth).
Water 17 00346 g001
Figure 2. Schematic diagram of the installed greywater treatment system. It includes the degreaser, presented with a top view and a full front-sectional view along line A-A, the green façades with a full side-sectional view of the wall and sand bed, and the storage tank and UV unit shown with a full front-sectional view. The diagram also identifies the sampling points (1, 2, 3, and 4) and depicts the process flow path using blue arrows.
Water 17 00346 g002
Figure 3. Total chemical oxygen demand values at influent and effluent of the treatment system.
Water 17 00346 g003
Figure 4. Total biological oxygen demand values at influent and effluent of the treatment system.
Water 17 00346 g004
Figure 5. Phosphate concentration at influent and effluent of the treatment system.
Water 17 00346 g005
Figure 6. Total nitrogen concentration at influent and effluent of the treatment system.
Water 17 00346 g006
Figure 7. Ammonium concentration at influent and effluent of the treatment system.
Water 17 00346 g007
Figure 8. Total suspended solid concentration at influent and effluent of the treatment system.
Water 17 00346 g008
Figure 9. Turbidity values at influent and effluent of the treatment system.
Water 17 00346 g009
Table 1. Characteristics of the ground-based green façade (I and II).
ParameterType I Type II
Flow0.5 m3/d0.6 m3/d
Number of beds12
Bottom surface area VF-trench per bed6.84 m23.78 m2
L VF-trench per bed11.4 m6.3 m
W VF-trench per bed0.6 m0.60 m
Total VF surface6.84 m27.56 m2
Hydraulic Loading Rate (HLR)73 mm79 mm
Flush volume250 L300 L
Flush duration60 s75 s
Average resting period 12 h12 h
Total height of the filter media (from the bottom)0.6 m0.6 m
Height of the gravel—Ø 5–10 mm0.1 m0.1 m
Height of the sand—Ø 0.1–3 mm0.4 m0.4 m
Height of the gravel—Ø 5–10 mm0.1 m0.1 m
Plant speciesHedera, Bougainvillea, Passiflora, Jasmine, Lonicera, Nandina, Lily, Acorus, Tulbagh, and Peperomia
Table 2. Greywater standards in Jordan (Jordan Standards and Metrology Organization, 2013: JS 1776/2013) [33].
ParameterIrrigating Cooked Vegetables, Gardens, Green Lands, and Other CropsIrrigating Raw EatenParameter
Total BOD5 (mg/L)6060≤10
Total COD (mg/L)120120≤20
TSS (mg/L)10050≤10
pH6–96–96–9
N O 3 (mg/L)707070
Total Nitrogen (TN) (mg/L)505050
Total Phosphorus (TP) (mg/L)151515
Turbidity (NTU)--≤5
E. coli (CFU/100 mL)104103≤10
Fat, oil and grease, FOG (mg/L)888
Table 3. Characteristics of raw and treated greywater 1.
ParameterUnitRaw Greywater (Point 1)Degreaser (Point 2)Green Façade (Point 3)
A1A2A1A2A1A2
pHunit8.14 ± 0.38.24 ± 0.37.88 ± 0.27.99 ± 0.27.94 ± 0.28.02 ± 0.2
DOmg/L2.45 ± 1.442.15 ± 0.846.49 ± 2.872.38 ± 2.1237.19 ± 1.735.64 ± 2.43
TSSmg/L45 ± 1550 ± 1811± 525 ± 147 ± 37 ± 3
TurbidityNTU54 ± 1462 ± 154 ± 223 ± 182 ± 14 ± 3
TDSmg/L611 ±1 68644 ± 1211192 ± 292666 ± 179986 ± 472662 ± 107
COD 2mg/L260 ± 79348 ± 6626 ± 16165 ± 9916 ± 1439 ± 24
BOD5 2mg/L156 ± 78165 ± 4117 ± 1583 ± 679 ± 819 ±14
TNmg/L20.65 ± 6.422.14 ± 4.079.15 ± 8.1914.31 ± 5.257.54 ± 4.079.43 ± 3.2
N-NH4+mg/L7.39 ± 3.048.29 ± 2.293.10 ± 5.44.78 ± 2.920.5 ± 0.211.19 ± 0.53
N-NO3mg/L0.19 ± 0.20.16 ± 0.184.94 ± 3.561.73 ± 2.196.43 ± 3.884.03 ± 1.85
PO43−mg/L1.96 ± 12.53 ± 21.24 ± 1.011.59 ± 0.840.65 ± 0.560.74 ± 0.86
TC 3MPN/100 mL 4(5.2 ± 6.8) × 106(5.3 ± 6.9) × 106(1.2 ± 3.2) × 106(1.6 ± 3.1) × 106(1.9 ± 4.5) × 104(3.5 ± 6.2) × 104
E. coli 3MPN/100 mL 4(2.3 ± 3.1) × 105(2.3 ± 1.7) × 105(1.1 ± 1.8) × 104(1.4 ± 2.8) × 105(4.1 ± 4.5) × 102(1.0 ± 1.1) × 102
Notes: 1 all values are presented as (μ ± σ: mean ± standard deviation) of 8 samples for each area and treatment stage. 2 COD and BOD values are presented as total COD and total BOD. 3 After UV disinfection, the TC and E. coli concentrations at area A1 were (1.7 ± 2.5) × 101 MPN/100 mL and 1.7 ± 1.3 MPN/100 mL, respectively, while at area A2, they were (0.5 ± 1.1) × 104 MPN/100 mL and 2.5 ± 2.6 MPN/100 mL. 4 MPN/100 mL stands for Most Probable Number per 100 milliliters.
Table 4. Comparison between the performance results of the green wall applied in this study and in other studies.
Study ReferenceMonitoring PeriodSubstrate UsedRemoval Efficiency (%)Key Findings
TSSTurbidityTotal CODTotal BOD5TNTPTCE. coli
Current study in Jordan16 weeksSand and gravel84%95%92%92%58%71%4.3 log5.1 logThe decentralized green wall system is an effective alternative for greywater treatment in urban areas.
Stefanatou et al. [29]Two YearsSand and vermiculite-82–98%86–95%---5 log4 logPlanted VFCW for greywater treatment improve system efficiency and esthetics.
Yadav et al. [67]15 WeeksCocopeat and Granular activated charcoal-90%85%-73%61%--Affordable green wall solutions efficiently manage greywater while using fewer resources and utilizing up a smaller footprint.
Sami et al. [69]10 MonthsBiochar, pumice, hemp fiber, spent coffee grounds, and composted fiber soil.---96–99%58–82%57–85%-2.2–4.0 logGreywater treatment with green walls may have an impact on future urban greywater management developments.
Galvão et al. [14]4 MonthsTiles, Coconut mix and recycled fibers50–70%-60–70%-----Greywater treatment with green walls constructed using recycled materials can support the circular economy.
Boano et al. [7]3 MonthsMix of coconut fiber and perlite--40%97%61%57%-99%Potential of an open-air green wall for greywater treatment, even in difficult conditions.
Chandran and Nijam [54]-Pumice and Sand--56%-----Additional research is required to identify the most appropriate media combinations for greywater recycling.
Kotsia et al. [27]Two YearsCoarse gravel, Fine gravel, and washed sand.94%-96%99%--2.2 log-Green walls improve the attractiveness of urban, semi-urban, and touristic environments by providing a technically economically feasible option for greywater treatment.
Prodanovic, et al. [68]12 MonthsMix of Perlite and Coco coir----88%27–53%--Greywater treatment and reuse perform effectively with well-designed green walls.
Masi et al. [70]9 MonthsLECA plus sand and LECA plus coconut fibers.--7–86%25–54%----Only Phase II samples were appropriate for flushing toilets, even though all samples satisfied irrigation reuse standards.
Table 5. Statistical comparison of measured parameters across treatment phases.
ParameterLetter Group
Raw GreywaterDegreaserGreen WallUV
pHABB-
DOCBA-
TSSABC-
TurbidityABC-
TDSBAA-
Total CODABC-
Total BOD5ABC-
TNABC-
N-NH4+ABC-
N-NO3CBA-
PO43−ABC-
TCABBB
E. coliABBB
Disclaimer/Publisher’s Note: The statements, opinions and data contained in all publications are solely those of the individual author(s) and contributor(s) and not of MDPI and/or the editor(s). MDPI and/or the editor(s) disclaim responsibility for any injury to people or property resulting from any ideas, methods, instructions or products referred to in the content.

