Article

Seepage Modeling in Filled Tortuous Fractures Coupled with Porous Media Matrix: Influence of Filling Material Properties

1
College of Energy and Mining Engineering, Shandong University of Science and Technology, Qingdao 266590, China
2
China Zuoquan Wulihou Coal Industry Co., Ltd., Shanxi Lu’ an Group, Zuoquan 032600, China
*
Author to whom correspondence should be addressed.
Water 2025, 17(23), 3386; https://doi.org/10.3390/w17233386 (registering DOI)
Submission received: 30 September 2025 / Revised: 11 November 2025 / Accepted: 17 November 2025 / Published: 27 November 2025
(This article belongs to the Topic Human Impact on Groundwater Environment, 2nd Edition)

Abstract

Nonlinear seepage behavior within rock fractures represents a critical and actively researched challenge in underground engineering, energy exploitation, and environmental sciences. Through the integration of nonlinear seepage theory with coupled numerical simulations of fracture flow and matrix flow, this study systematically investigates the synergistic mechanisms governing the influence of filling particles, tortuous fractures, and porous matrices on fluid transport within fracture–porous matrix seepage systems. Key findings reveal that: (1) Horizontal fractures continuously receive fluid influx from the surrounding porous matrix, where the flow field maintains remarkable symmetry, with a critical matrix height-to-fracture aperture ratio regulating streamline divergence and convergence at the fracture outlet; (2) The flow field within horizontal fractures undergoes substantial transformation when the Reynolds number exceeds a critical threshold, while maintaining stable flow patterns and -ΔP-Q relationships below this value, demonstrating a distinct inertial-controlled flow regime transition; (3) Tortuous fracture geometries induce localized vortex formation and significant velocity fluctuations, particularly in the front and rear dip-angle zones, substantially enhancing fluid exchange efficiency compared to horizontal configurations; (4) The volumetric flow rate exhibits a non-monotonic relationship with inclination angle, peaking at approximately 36°, while a synergistic effect between fracture inclination and infill particle diameter systematically modulates pressure-drop-flow-rate relationships, with a critical d/h = 0.5 threshold distinguishing fundamentally different flow behaviors. These findings provide quantitative criteria for predicting nonlinear seepage in practical engineering scenarios involving complex fracture networks and filling materials, offering significant implications for risk assessment and drainage design in deep underground projects.

1. Introduction

In recent years, as deep energy extraction and underground engineering ventures extend into more complex geological conditions, the dynamic evolution mechanisms of seepage pathways in filled fracture media and their coupling effects with filling material properties have garnered increasing research attention [1,2,3,4]. The nonlinear characteristics of seepage behavior in fractured rock masses and their multi-physical field coupling effects represent significant challenges and focal points in the fields of geotechnical engineering and underground resource development. While Darcy’s law is well-suited for describing low-Reynolds-number seepage, it often fails to capture the pronounced nonlinear flow behaviors observed under high hydraulic pressures, large flow velocities, or in filled fracture systems. Such behaviors not only complicate the accurate characterization of permeability parameters but may also trigger major engineering hazards such as water inrush, mud outburst, and gas outburst [5,6].
From a methodological standpoint, foundational studies on discrete fracture models, such as the mathematical analysis by Knabner and Roberts [7] coupling Darcy flow in the matrix with Darcy-Forchheimer flow in the fracture, provide a rigorous theoretical basis for handling non-Darcy effects. The theoretical frameworks are strongly supported by experimental investigations; for instance, Chen et al. [8] conducted systematic flow tests on deformable rough-walled fractures, empirically evaluating the Forchheimer equation coefficients and demonstrating the critical roles of fracture roughness and confining stress in controlling nonlinear flow behavior. Concurrently, unified discretization frameworks like the mixed-dimensional approach proposed by Nordbotten et al. [9] offer versatile strategies for integrating diverse numerical schemes across the fracture and matrix domains. These methodological advances are particularly crucial for addressing the multi-scale nature of flow in fractured media, a challenge comprehensively outlined in critical reviews such as that by Wang et al. [10], which synthesizes the intricate coupling between nanoscale transport mechanisms and macroscopic fracture flow.
It is noteworthy that repeated impact loading significantly exacerbates the propagation and failure of fractures in surrounding rock. Through experiments on surrounding rock in extra-thick coal seam roadways, Gao Minshi et al. [11] observed that an increase in the number of impacts led to a approximately 12% rise in the fractal dimension of the fracture network and a 1.5-fold increase in the permeability compared to static conditions. This phenomenon is particularly prominent in deep dynamic disturbance environments.
The coupling effects of fracture geometric parameters and filling characteristics significantly influence the nonlinear evolution of seepage. Guo Haijun et al. [12] further confirmed through fractal experiments on pore-fracture structures in molded coal that the fractal dimension exhibits a negative correlation with permeability (R2 = 0.87), and the particle size distribution of fillings exerts a notable modulating effect on fractal characteristics. Research indicates that fracture surface tortuosity distorts local flow velocity distributions, while an increase in filling particle size amplifies flow resistance. For instance, Pan Ruijiang et al. [13] demonstrated in experimental studies on rough single-fracture seepage that a 10% increase in fracture surface tortuosity reduces equivalent permeability by approximately 15%. Yang Mijia et al. [14] further highlighted that highly tortuous fractures, under the influence of fillings, may induce secondary flow structures, leading to a 2–3 fold increase in pressure drop. Moreover, Wu Zhijun et al. [15], using real-time nuclear magnetic resonance imaging, revealed the dynamic evolution of vortex structures within filled fractures under high hydraulic pressure conditions, indicating that the competition between inertial effects and viscous dissipation governs the nonlinear seepage regimes.
However, existing studies have predominantly focused on the isolated effects of single factors, leaving a considerable gap in the systematic quantitative analysis of the coupling effects between fillings and fracture tortuosity angles [16,17]. In particular, the dynamic mechanisms underlying the multi-scale interactions between geometric parameters and fillings remain poorly understood.
In terms of numerical modeling, conventional approaches often treat fracture flow (e.g., open fractures) and porous domains governed by Darcy-type flow. separately, making it difficult to accurately characterize the flow coupling mechanisms in interfacial transition regions [18,19]. For example, independent solution strategies for the traditional Navier–Stokes equations and Darcy’s law fail to capture the modulation effect of porosity gradients in filled media on interfacial flow. Although high-pressure water injection tests and nuclear magnetic resonance imaging can provide local seepage parameters, full-scale flow visualization and multi-field coupled modeling remain technically challenging. For instance, Zhang Xiaodong et al. [20] observed that supercritical CO2 significantly alters the fracture structure of coal, yet its dynamic impact on seepage pathways has not been adequately represented in numerical models. Similarly, Gong Haijun et al. [21], through experiments on fracture propagation in mining floor strata, revealed zonal and staged fracture expansion under critical stress conditions, demonstrating that when the normal stress exceeds 8 MPa, the fracture propagation rate increases exponentially. Recent developments in fracture-matrix coupling methodologies have provided new insights for modeling multi-scale flow systems. Particularly noteworthy is the upscaling framework proposed by Zhong and Leung [22], which couples an Upscaled Discrete Fracture Matrix (UDFM) with pressure-dependent apparent permeability modeling to capture non-Darcy flow mechanisms across scales. Their pore-network inspired approach demonstrates how nanoscale flow mechanisms can enhance matrix-matrix and matrix-fracture interactions in complex fracture networks. This methodology offers valuable perspectives for addressing the cross-scale coupling challenges encountered in filled fracture systems, particularly in characterizing the interface transitions between fracture channels and porous matrices.
Nevertheless, most existing models assume constant fracture tortuosity angles, overlooking the modulating effect of dynamic fracture tortuosity variations on seepage pathways [23,24,25], especially the energy dissipation mechanisms under the coupled influence of fillings and fracture tortuositys, which require urgent quantification.
To address these fundamental gaps, we formulate the following scientific questions: How does fluid migrate from the rock matrix into fracture channels, and how does this process govern the development of flow along the fracture path? How does the fluid exchange process differ between horizontal and tortuous fractures, and what role does fracture geometry play in modulating matrix-fracture interactions? How do filling materials and fracture tortuosity interact to collectively control flow resistance and nonlinear seepage behavior?
Guided by these questions, we propose three corresponding working hypotheses: Continuous fluid infiltration from the matrix into the fracture leads to progressive accumulation of volumetric flow rate along the fracture path. Tortuous fractures enhance fluid exchange efficiency between the porous matrix and fracture through extended path length and geometric asymmetry. Under specific conditions where filling particles mitigate flow resistance by regulating flow paths and reducing the energy dissipation caused by fracture tortuosity.
In summary, to address these questions and test the proposed hypotheses, this study establishes an integrated seepage model that incorporates fillings, tortuous fractures, and a porous matrix. The findings aim to provide a theoretical basis for optimizing reservoir productivity and preventing water inrush disasters in deep energy extraction.

2. Materials and Methods

2.1. Engineering Context

Naturally occurring and engineering-disturbed rock masses (such as those surrounding chambers, roadways, and excavation faces) contain widespread fractures that form critical seepage channel networks between groundwater sources and underground engineering spaces.
The seepage behavior within these fractures exhibits notable complexity: some fractures directly connect water sources to underground roadways, forming potential channels for water inrush and posing immediate threats to engineering safety; others, though not directly linked to water sources, continuously receive and collect groundwater through seepage within the internal micro-fracture networks of the rock mass, forming dominant fracture-driven seepage paths. It is noteworthy that fractures often contain natural detritus and other infill materials. Under the hydraulic transport action of fracture flow, some of these materials are carried out of the fracture system, while others deposit and remain within the fractures due to gravitational forces, particularly at locations influenced by the fracture tortuosity angle.
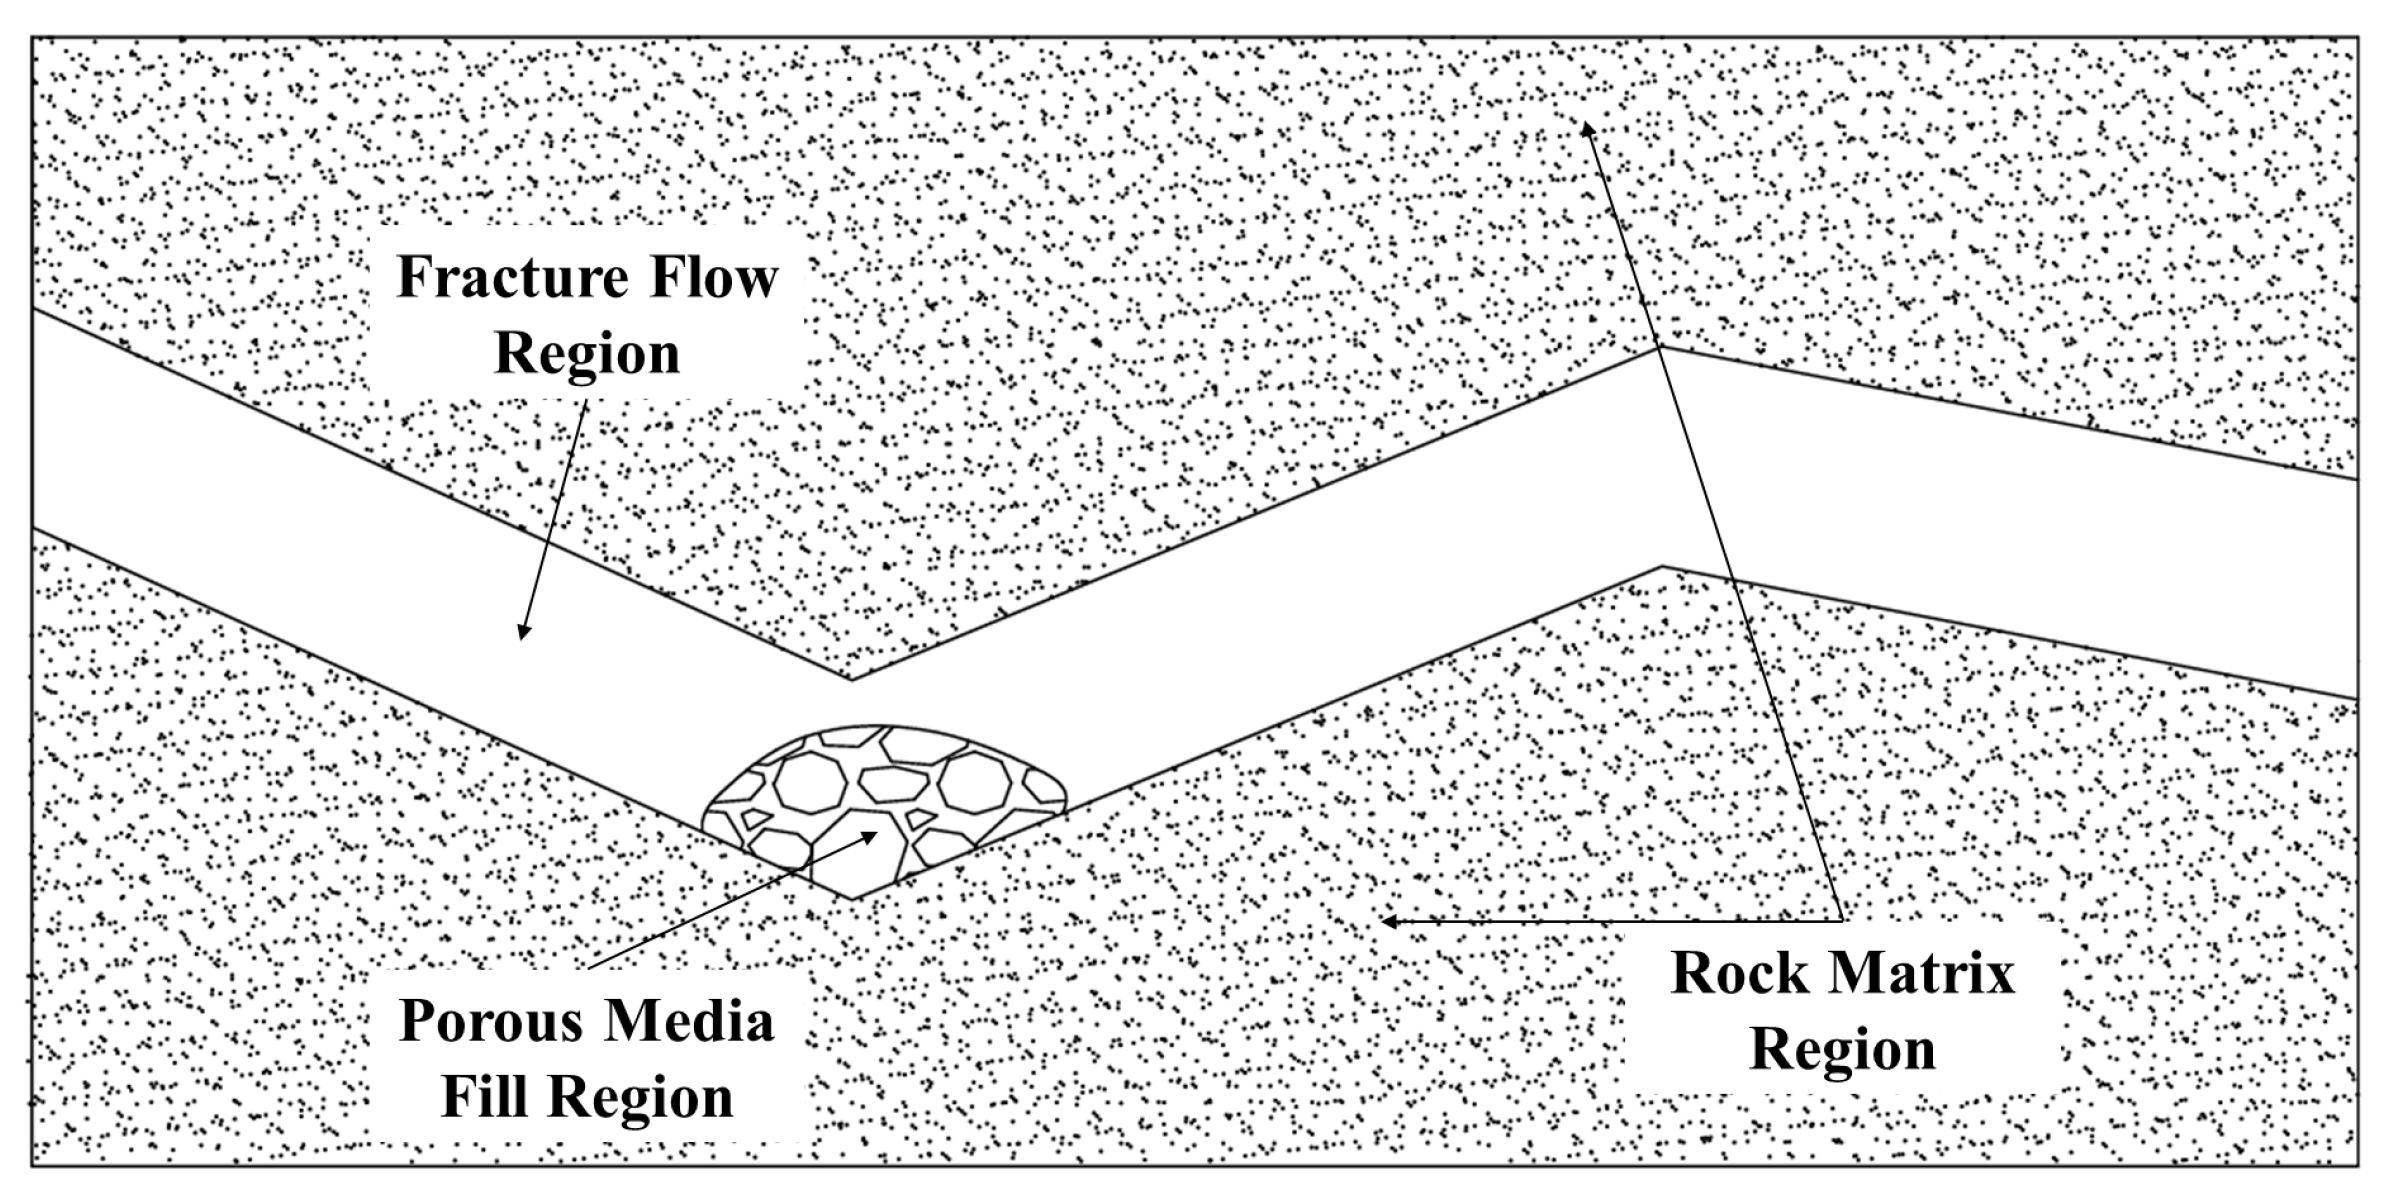
Therefore, water sources, fracture networks (including their geometry, connectivity, and aperture), fracture infill materials, and engineering structures such as underground roadways collectively form a complex coupled fracture flow and seepage system that involves infill materials, tortuous fractures, and a porous matrix, as illustrated in Figure 1. In practical engineering scenarios, fractures and the surrounding rock matrix form interconnected networks of geometrically complex conduits that facilitate the transport of incompressible, fully developed viscous Newtonian fluids. These natural fracture systems exhibit multi-scale characteristics, where macroscopic fractures serve as primary flow channels while microscopic pores within the matrix contribute to secondary seepage pathways. The geometrical complexity of these systems manifests through tortuous fracture paths, varying aperture distributions, and heterogeneous infill materials, where the interplay between fracture geometry and fluid properties dominates the flow regime transition from linear to nonlinear behavior under increasing hydraulic gradients, collectively governing fluid migration patterns in subsurface environments.

2.2. Nonlinear Seepage Theory

Fractures within the rock matrix serve as conduits for complex, incompressible, and fully developed viscous Newtonian fluid flow. A dual-porosity model for gas seepage proposed by Qin Yueping [26] indicates that the permeability contrast between the porous matrix and the fractures leads to a nonlinear variation in flow distribution ratio. To describe the flow within this system, the domain is partitioned into three interacting physical subdomains (Figure 2): the Fracture Flow Region, which corresponds to unfilled fracture voids where fluid acts as a free stream; the Porous Media Fill Region, which pertains to fracture spaces partially filled with porous media where flow is characterized as matrix seepage; and the Rock Matrix Region, which constitutes the low-permeability rock body surrounding the fractures, where flow likewise occurs as matrix flow.
In the fracture flow region (Figure 2), assuming the fluid is an incompressible Newtonian fluid and the flow is fully developed, the flow characteristics are predominantly governed by inertia-driven nonlinear behavior. The dynamics in this region are controlled by the Navier–Stokes equations coupled with the mass conservation equation [27,28], expressed as follows:
p = μ 2 u ρ ( u t + u u ) + f u = 0
where ρ is the fluid density, u is the velocity vector, t is time, p is the pressure field, μ is the dynamic viscosity, and f is the body force vector.
In the Porous Media Fill Region and Rock Matrix Region (Figure 2), fluid motion is described by the Forchheimer–Brinkman–Darcy (FBD) [29,30] equation:
p = μ p K u + μ n 2 u ρ β u u + f 1 n V p = 0
where K is the permeability of the porous medium, β is the inertial resistance coefficient, μp is the effective viscosity, and f is the body force vector, n is the porosity, Vp is the pore velocity vector. The fluid motion within the infill-tortuous fracture-porous matrix seepage system is simulated by solving the Navier–Stokes equations coupled with the FBD equations under Stokes-Brinkman boundary conditions.
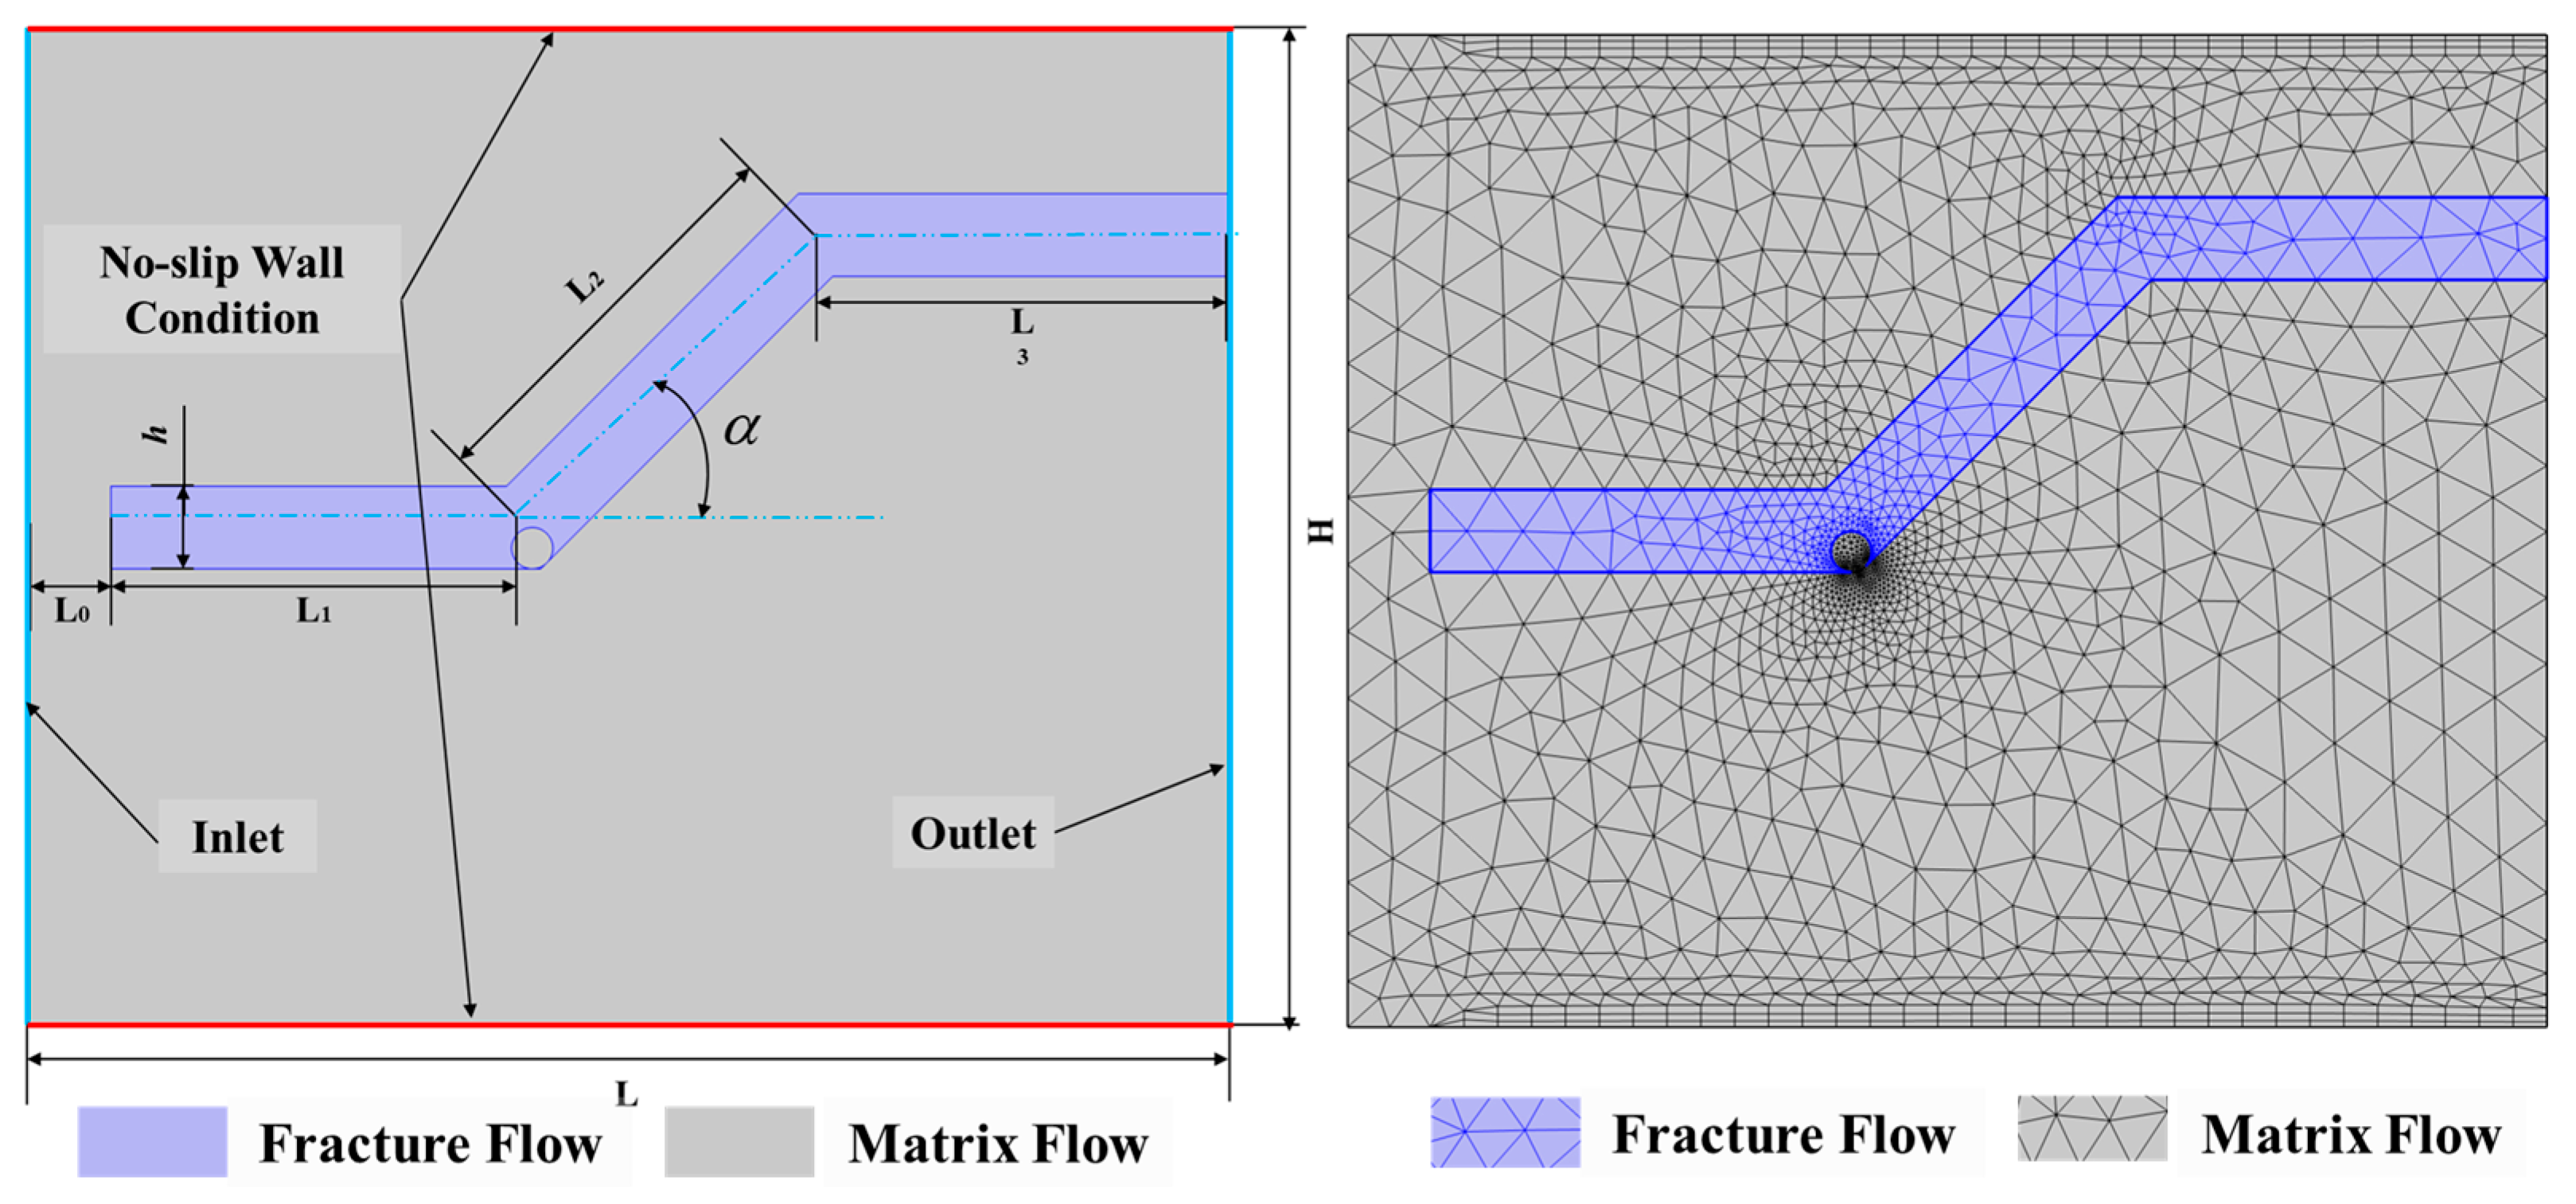
Building upon the engineering context outlined above, the development of a representative conceptual model requires balancing physical fidelity with computational tractability. The geometrical configuration of fractures—particularly their tortuosity and partial filling—plays a decisive role in controlling both preferential flow pathways and local fluid exchange. To quantitatively analyze these effects, a numerical model of seepage through tortuous fractures embedded in a porous matrix was con-structed based on the COMSOL Multiphysics 6.0 simulation platform (Figure 3), with adjustable dip angle and fillings in tortuous fracture This configuration allows systematic examination of fracture-matrix interaction and inertial flow transitions, which are fundamental mechanisms underlying nonlinear seepage in fractured rock masses. While natural fractures exhibit morphological and mineralogical complexity at multiple scales, the present model abstracts the infill as a homogeneous porous medium with uniform particle diameter. This simplification emphasizes the primary influence of filling on flow obstruction and local aperture reduction, rather than resolving granular-scale heterogeneity. Similarly, the assumption of smooth fracture walls and constant aperture focuses the analysis on the macro-scale effects of fracture orientation and filling extent.
The numerical simulations were performed using the “Free and Porous Media Flow” module in COMSOL Multiphysics [18]. The seamless coupling between regions was achieved by implementing Stokes–Brinkman boundary conditions. This modeling approach not only accurately captures the influence of porosity gradient variations in the filled media on flow resistance but also quantitatively characterizes the anisotropic effects induced by fracture tortuosity angles. Although three-dimensional fracture flow models can more realistically reflect the hydrodynamic characteristics of natural fractures, directly solving the three-dimensional Navier–Stokes equations involves handling a sharp increase in computational complexity due to high-dimensional spatial discretization [31], along with challenges in numerical stability control and exponentially growing computational resource demands. Given these considerations, this study employs a simplified two-dimensional model to investigate the synergistic effects of fillings, tortuous fractures, and the porous matrix on the seepage system within tortuous fracture–porous matrix.
The fluid enters the system from the left porous medium boundary, flows through the partially filled fractures and the rock matrix, and exits through the right fracture boundary and the porous medium outlet. It should be noted that, as the fractures are fully embedded within the porous domain, fluid from the porous medium can seep into the fracture channel through the up-per/lower and left boundaries of the fracture, eventually converging at the right outlet. The tortuous fracture is embedded within the rock matrix and consists of two horizontal segments and one inclined segment. The fracture walls are defined as smooth no-slip boundaries, while the fracture interior is modeled as a homogeneous porous medium characterized by particle diameter (d). The left boundary of the model is connected to an underground water source, while the right boundary serves as the outlet. The rock matrix has a height H and width S. The three fracture segments have lengths L1, L2, and L3, respectively, with a uniform aperture ‘h’. The fracture tortuosity of the inclined fracture is α. A standardized meshing strategy was implemented to balance computational accuracy and efficiency. The fluid was assumed to be a single-phase, incompressible, laminar flow. The numerical model was constructed at a millimeter geometric scale, and the permeability of the porous medium was considered isotropic.

2.3. Simulation Parameters

The boundary conditions were set as follows: the inlet boundary was a constant velocity inlet (with flow velocities set independently for each case); the outlet boundary was a static pressure outlet (p = 0); the top and bottom boundaries of the rock mass were set as no-slip fixed walls; the initial conditions were zero velocity and zero pressure fields throughout the domain, and gravitational effects were neglected.
To simplify calculations and control variables, the geometrically complex infill was idealized as a homogeneous porous continuum by particle diameter d, which maintains tangential contact with the fracture walls, forming a unified porous matrix domain as detailed in Figure 3. For a model with a horizontal fracture, the maximum diameter of the infill material is 10 mm. However, for a tortuous fracture, the presence of the fracture angle (Figure 4) means that a circular infill with d = 10 mm cannot completely block the fracture. Therefore, the maximum diameter required to block the tortuous fracture under limiting conditions is calculated as dmax = 2 × h × cos−1 (0.5 α).
In the numerical model shown in Figure 3, the physical coupling between the fracture flow region and the porous medium region is achieved through the unified Stokes–Brinkman governing equations. This framework strictly satisfies the continuity constraints of mass conservation and momentum transfer at the interface. Specifically, the normal flow velocity on both sides of the interface automatically satisfies the continuity condition given by Equation (3), ensuring no mass accumulation across the boundary:
u p n = u f n
where up denotes the Darcy velocity vector within the porous matrix, and uf represents the velocity vector in the fracture domain. Simultaneously, the viscous resistance term in the Brinkman equation, expressed in Equation (4), naturally coordinates tangential momentum transfer, fundamentally avoiding the need for empirical slip boundary conditions required in traditional Darcy–Stokes methods:
μ 2 u μ K u = p
where u is the velocity vector. The coupling of the pressure fields between the porous medium and secondary fractures is directly ensured by solving the global Navier–Stokes–Brinkman equations:
P p Γ = P f Γ
where Pp indicates the pore pressure field in the porous matrix and Pf represents the pressure field in the fracture domain, these variables are coupled through the interface condition, with Γ denoting the shared boundary between the matrix and fracture domains. This formulation models the filled fracture system as a unified domain featuring a spatially heterogeneous permeability tensor K(x), where the fracture zone exhibits substantially higher permeability. Numerically, this continuum framework eliminates interfacial data transfer between subdomains, thereby avoiding spurious oscillations commonly associated with partitioned solution methods. This formulation proves particularly effective for simulating bidirectional fluid exchange between the porous rock matrix and fracture channel, a key physical mechanism examined in this study.
To systematically investigate the synergistic effects of infill materials, tortuous fractures, and the porous matrix on the seepage system, a comprehensive parametric study was designed. The Reynolds number (Re) spanned multiple orders of magnitude (10−2 to 104), designed to encompass the complete progression from Darcy-type linear flow to fully developed nonlinear regimes. This expanded range enables observation of the complete flow transition process, from the initial emergence of inertial effects (Re ≈ 1–10) through the establishment of strong nonlinear behavior (Re > 100) and up to conditions dominated by significant inertial-viscous interactions (Re > 103). Twelve infill diameters (d = 0, 1, 2, …, 10 mm, dmax) were examined, encompassing the complete spectrum from unfilled fractures to fully blocked conditions. Thirteen fracture tortuosity angles (α = 0–60°) were investigated to systematically examine both subtle and pronounced geometric influences on flow patterns. The width and height of the tortuous fracture–porous matrix seepage model are 135 mm and 125 mm, respectively. The fracture aperture h is 10 mm. The lengths of the front horizontal segment and the central inclined segment are both 50 mm. The length of the rear horizontal segment L3 is dynamically adjusted according to the fracture tortuosity angle α, calculated as S–L1–L2 sin α. Due to the constraints of the porous matrix dimensions and boundary effects, the fracture tortuosity angle α varies from 0° to 60°. Additional geometric parameters are summarized in Table 1.

3. Analysis of Seepage Characteristics in Horizontal Fractures

3.1. Flow Field Architectures of Horizontal Fractures Simulation

To systematically investigate the synergistic effects of infill materials and fracture tortuosity angles on the nonlinearity of seepage, the horizontal fracture case (α = 0°) was first established as the baseline. By controlling the infill diameter (d) and isolating the influence of the fracture tortuosity variable, the independent effect of infill parameters on Forchheimer-type non-Darcy seepage was analyzed. For a horizontal fracture without infill (α = 0°), numerical simulations were conducted under multiple Reynolds number conditions (Re = 0.01, 0.1, 1, 10, 100, 1000). Figure 4 illustrates the flow field structure of the horizontal fracture–porous matrix seepage model specifically for Re = 100.
The flow field within the porous matrix exhibits significant symmetry: after entering from the left boundary, the streamlines deflect from both sides towards the horizontal fracture, driven by its high conductivity [32,33]. Fluid farther from the central axis of the horizontal fracture continues to migrate laterally through the main channels of the matrix after deflection, while fluid near the central axis preferentially converges into the fracture channel. The flow velocity within the fracture displays a single-peak distribution along the path, with the peak located slightly to the right of the midpoint.
Velocity occurs in the segment preceding the outlet due to flow confinement, accompanied by streamlines diverging towards both sides. Some fluid diffuses back into the porous matrix region through the fracture-matrix interface [34,35]. The underlying mechanism for this phenomenon is that within the fracture–porous matrix seepage system, the fracture acts as the primary conduit with a permeability 103–104 times higher than the matrix, resulting in significantly higher internal flow velocities. The porous matrix primarily functions for storage and secondary fluid exchange [36]. When fluid enters the left open boundary, a substantial pressure gradient between it and the porous matrix drives the rapid convergence of matrix fluid into the fracture, forming high-speed fracture flow. However, upon reaching the right outlet, a local pressure reversal occurs due to the mismatch in drainage capacity between the fracture and the matrix, forcing some fluid to diffuse back into the porous matrix and creating the characteristic streamline divergence (Figure 5).
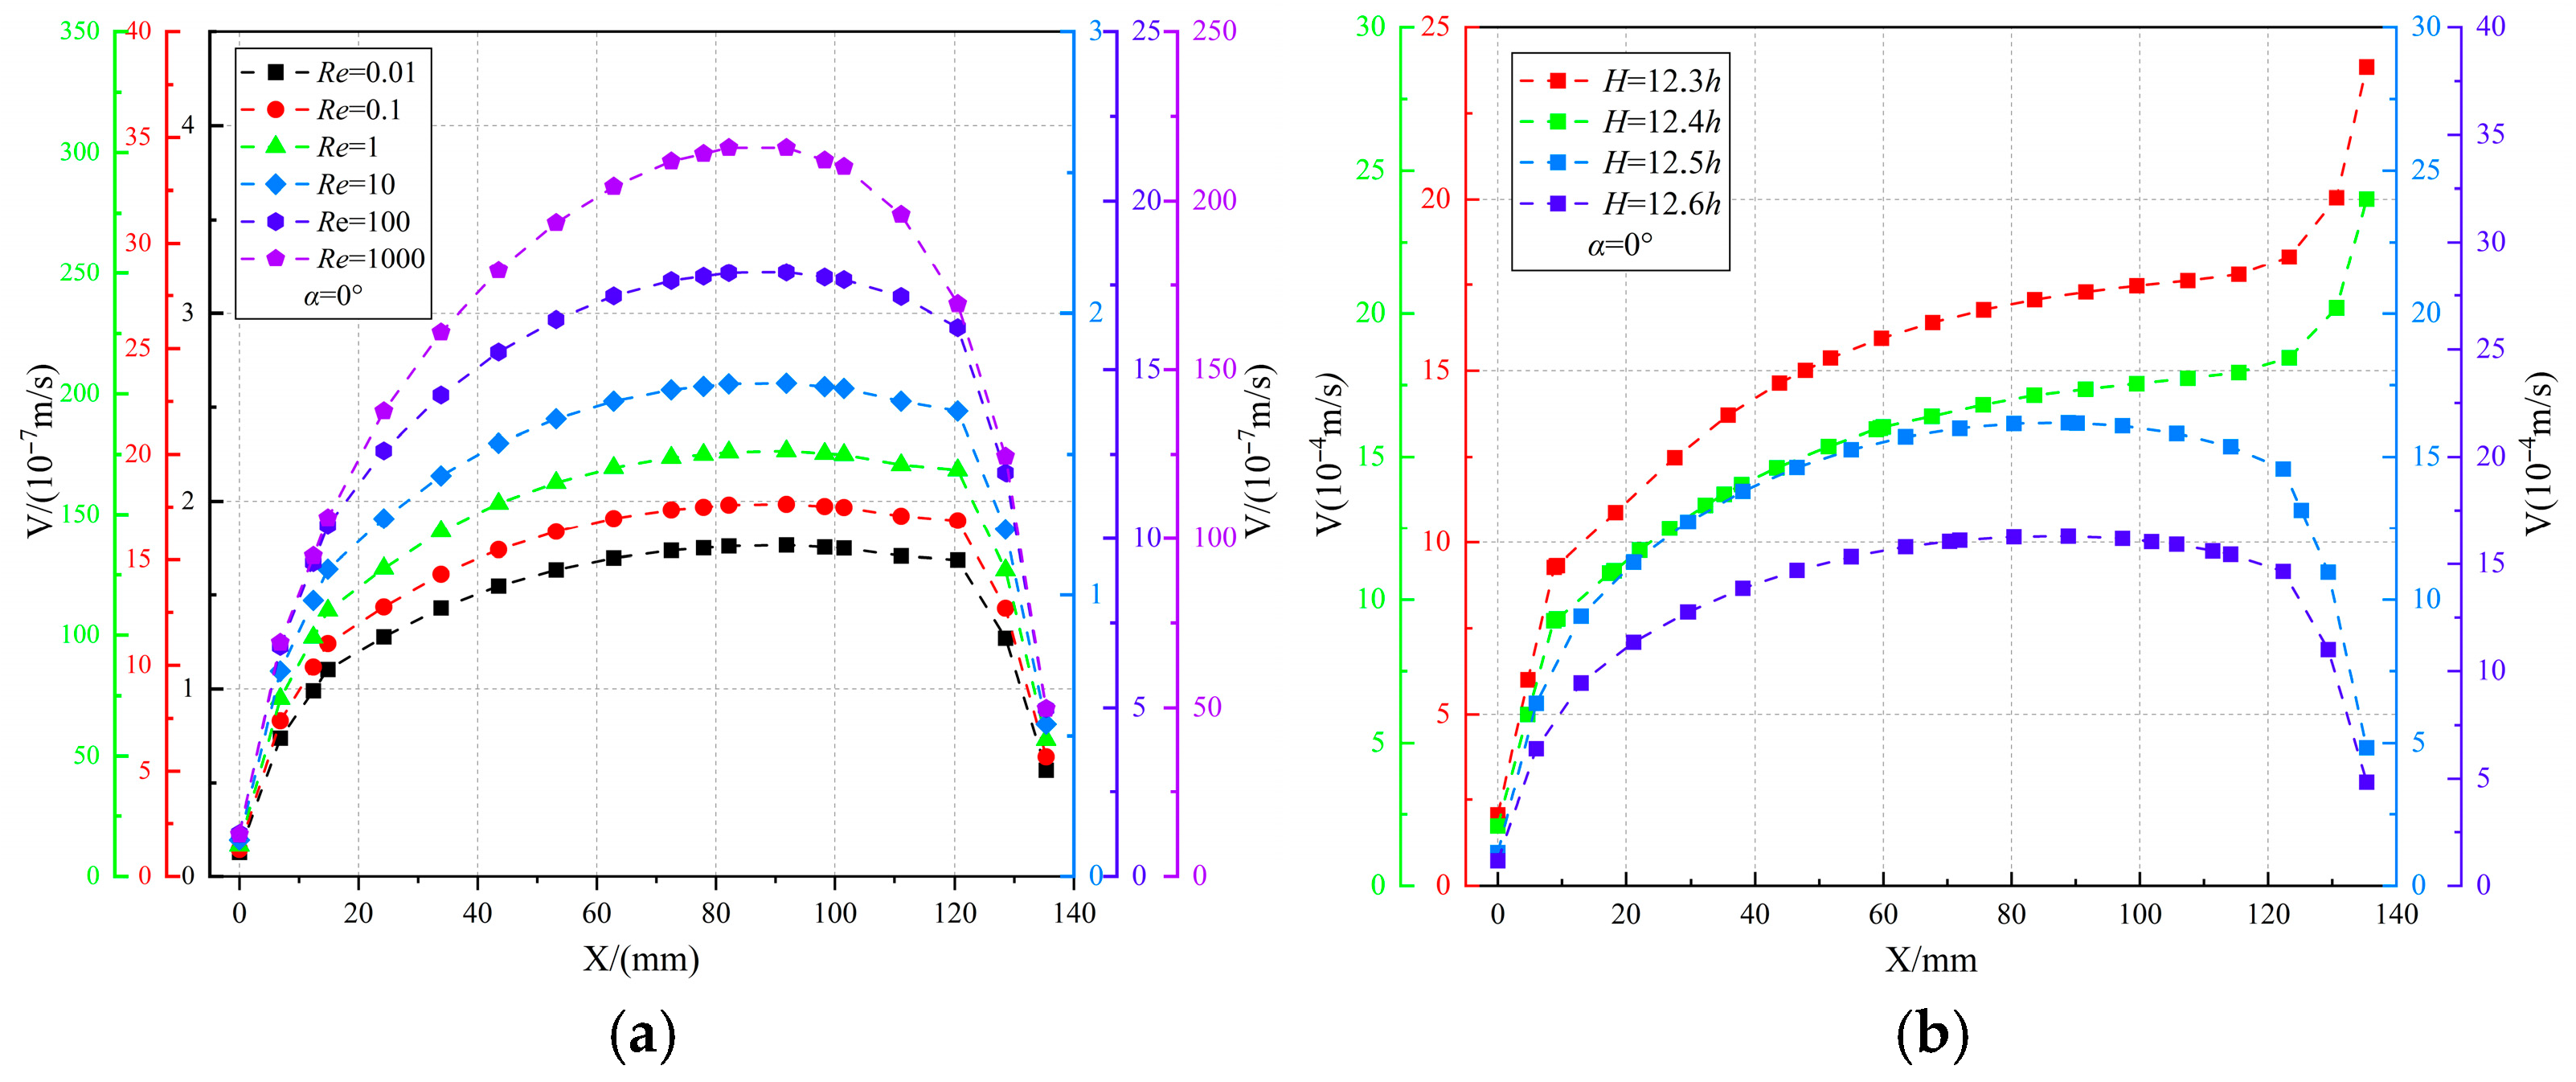
To validate this explanation, a sensitivity analysis was performed under six Reynolds number conditions (Re = 0.01–1000), keeping the fracture and porous matrix dimensions constant (α = 0°, H = 15 h). A two-dimensional cross-section was defined along the central axis of the horizontal fracture to measure the flow velocity profile (Figure 6a). The results indicate a consistent single-peak velocity profile across all conditions, with the peak position stable within the range of L = 82–92 mm. Velocity was observed in the final segment of the flow path, consistent with the velocity and streamline distributions in Figure 6a. This also confirms the consistency of the fracture’s role as the main transport channel under Reynolds numbers of varying magnitudes.
To further investigate the influence of porous matrix height on fracture flow characteristics, multiple simulations were conducted with varying matrix heights (H = 12.3–12.6 h) while keeping the horizontal fracture aperture constant. The results are shown in Figure 6b. When H < 12.5 h, the flow velocity increases continuously along the path, with rapid increases in the inlet and outlet segments Figure 6a. When H ≥ 12.5 h, the velocity curve in the inlet segment remains consistent with the former cases, but deviates in the middle segment, showing an opposite trend where velocity drops sharply in the outlet segment Figure 6b. These results indicate a critical value effect of matrix height on the fracture flow and matrix flow coupling model, with a critical matrix height Hcrit ≈ 12.5 h. Below this critical height, enhanced longitudinal pressure drop suppresses diffusion, promotes flow uniformity, and consequently inhibits the longitudinal diffusion of fracture fluid into the adjacent porous media.

3.2. Pressure Drop and Volumetric Flow Rate in Horizontal Fractures

To study the effect of infill on non-Darcy behavior in horizontal fractures, coupled fracture flow and matrix flow simulations were performed under multiple infill diameter (d = 0–10 mm) and Reynolds number (Re = 10−2–103) conditions, while keeping α = 0° and H = 12 h (Figure 7).
As shown in Figure 7a, when the horizontal fracture contains no porous infill (d = 0), the fluid velocity increases continuously along the flow direction, and the area of high velocity gradually expands, reaching its maximum velocity and spatial extent at the fracture outlet. The flow path is clear, the flow pattern is relatively stable, and it exhibits a regular morphological structure. With small infill diameters (d = 1–3 mm), local acceleration zones form around the infill material. The high-velocity zone expands upwards, and the velocity peak remains located at the fracture outlet. As the infill diameter increases (d = 4–7 mm), its obstructive effect on the fracture flow becomes more pronounced. The fluid flow channel gradually narrows, the outlet velocity decreases, the extent of the high-velocity region shrinks and shifts above the infill material. The peak velocity occurs over the infill material. When the infill size nearly blocks the fracture (d = 8–10 mm) [14], the flow path is obstructed. Fluid on the left side of the infill must slowly permeate through the porous infill material to enter the right side of the fracture. The maximum flow velocity occurs at the narrowest constriction between the fracture and the infill material.
Figure 7a–f show that the evolution of the free flow regime within the fracture exhibits significant Re dependence. At low Reynolds numbers (Re = 10−2 and Re = 10−1), the flow field within the fracture shows negligible change. Flow is dominated by viscous forces, streamlines are smooth, no evident vortices are present, and increasing the Reynolds number has a minimal impact on the flow field. At moderate Reynolds numbers (Re = 100 and Re = 101), fluctuations in the flow field induced by the infill become more pronounced as Re increases. Vortex phenomena [13,14,15] gradually emerge, the pressure drop increases, and the fracture’s capacity to drive flow is enhanced. Under high Reynolds number conditions (Re = 102 and Re = 103), the flow field within the fracture becomes highly complex. The extent of vortices increases, the pressure drop reaches its maximum, and significant inertial effects are observed. Driven by strong inertia, the fracture flow interacts with the granular porous infill material, forming complex secondary flow structures. Fluid on the left side begins to extensively permeate through the infill material into the right side of the fracture, forming a relatively high-velocity fracture flow. Batchelor’s theory of fluid dynamics indicates that inertial effects dominate energy dissipation in high-speed flows [37], which is highly consistent with the vortex formation mechanism observed in the high-Re conditions of this study.
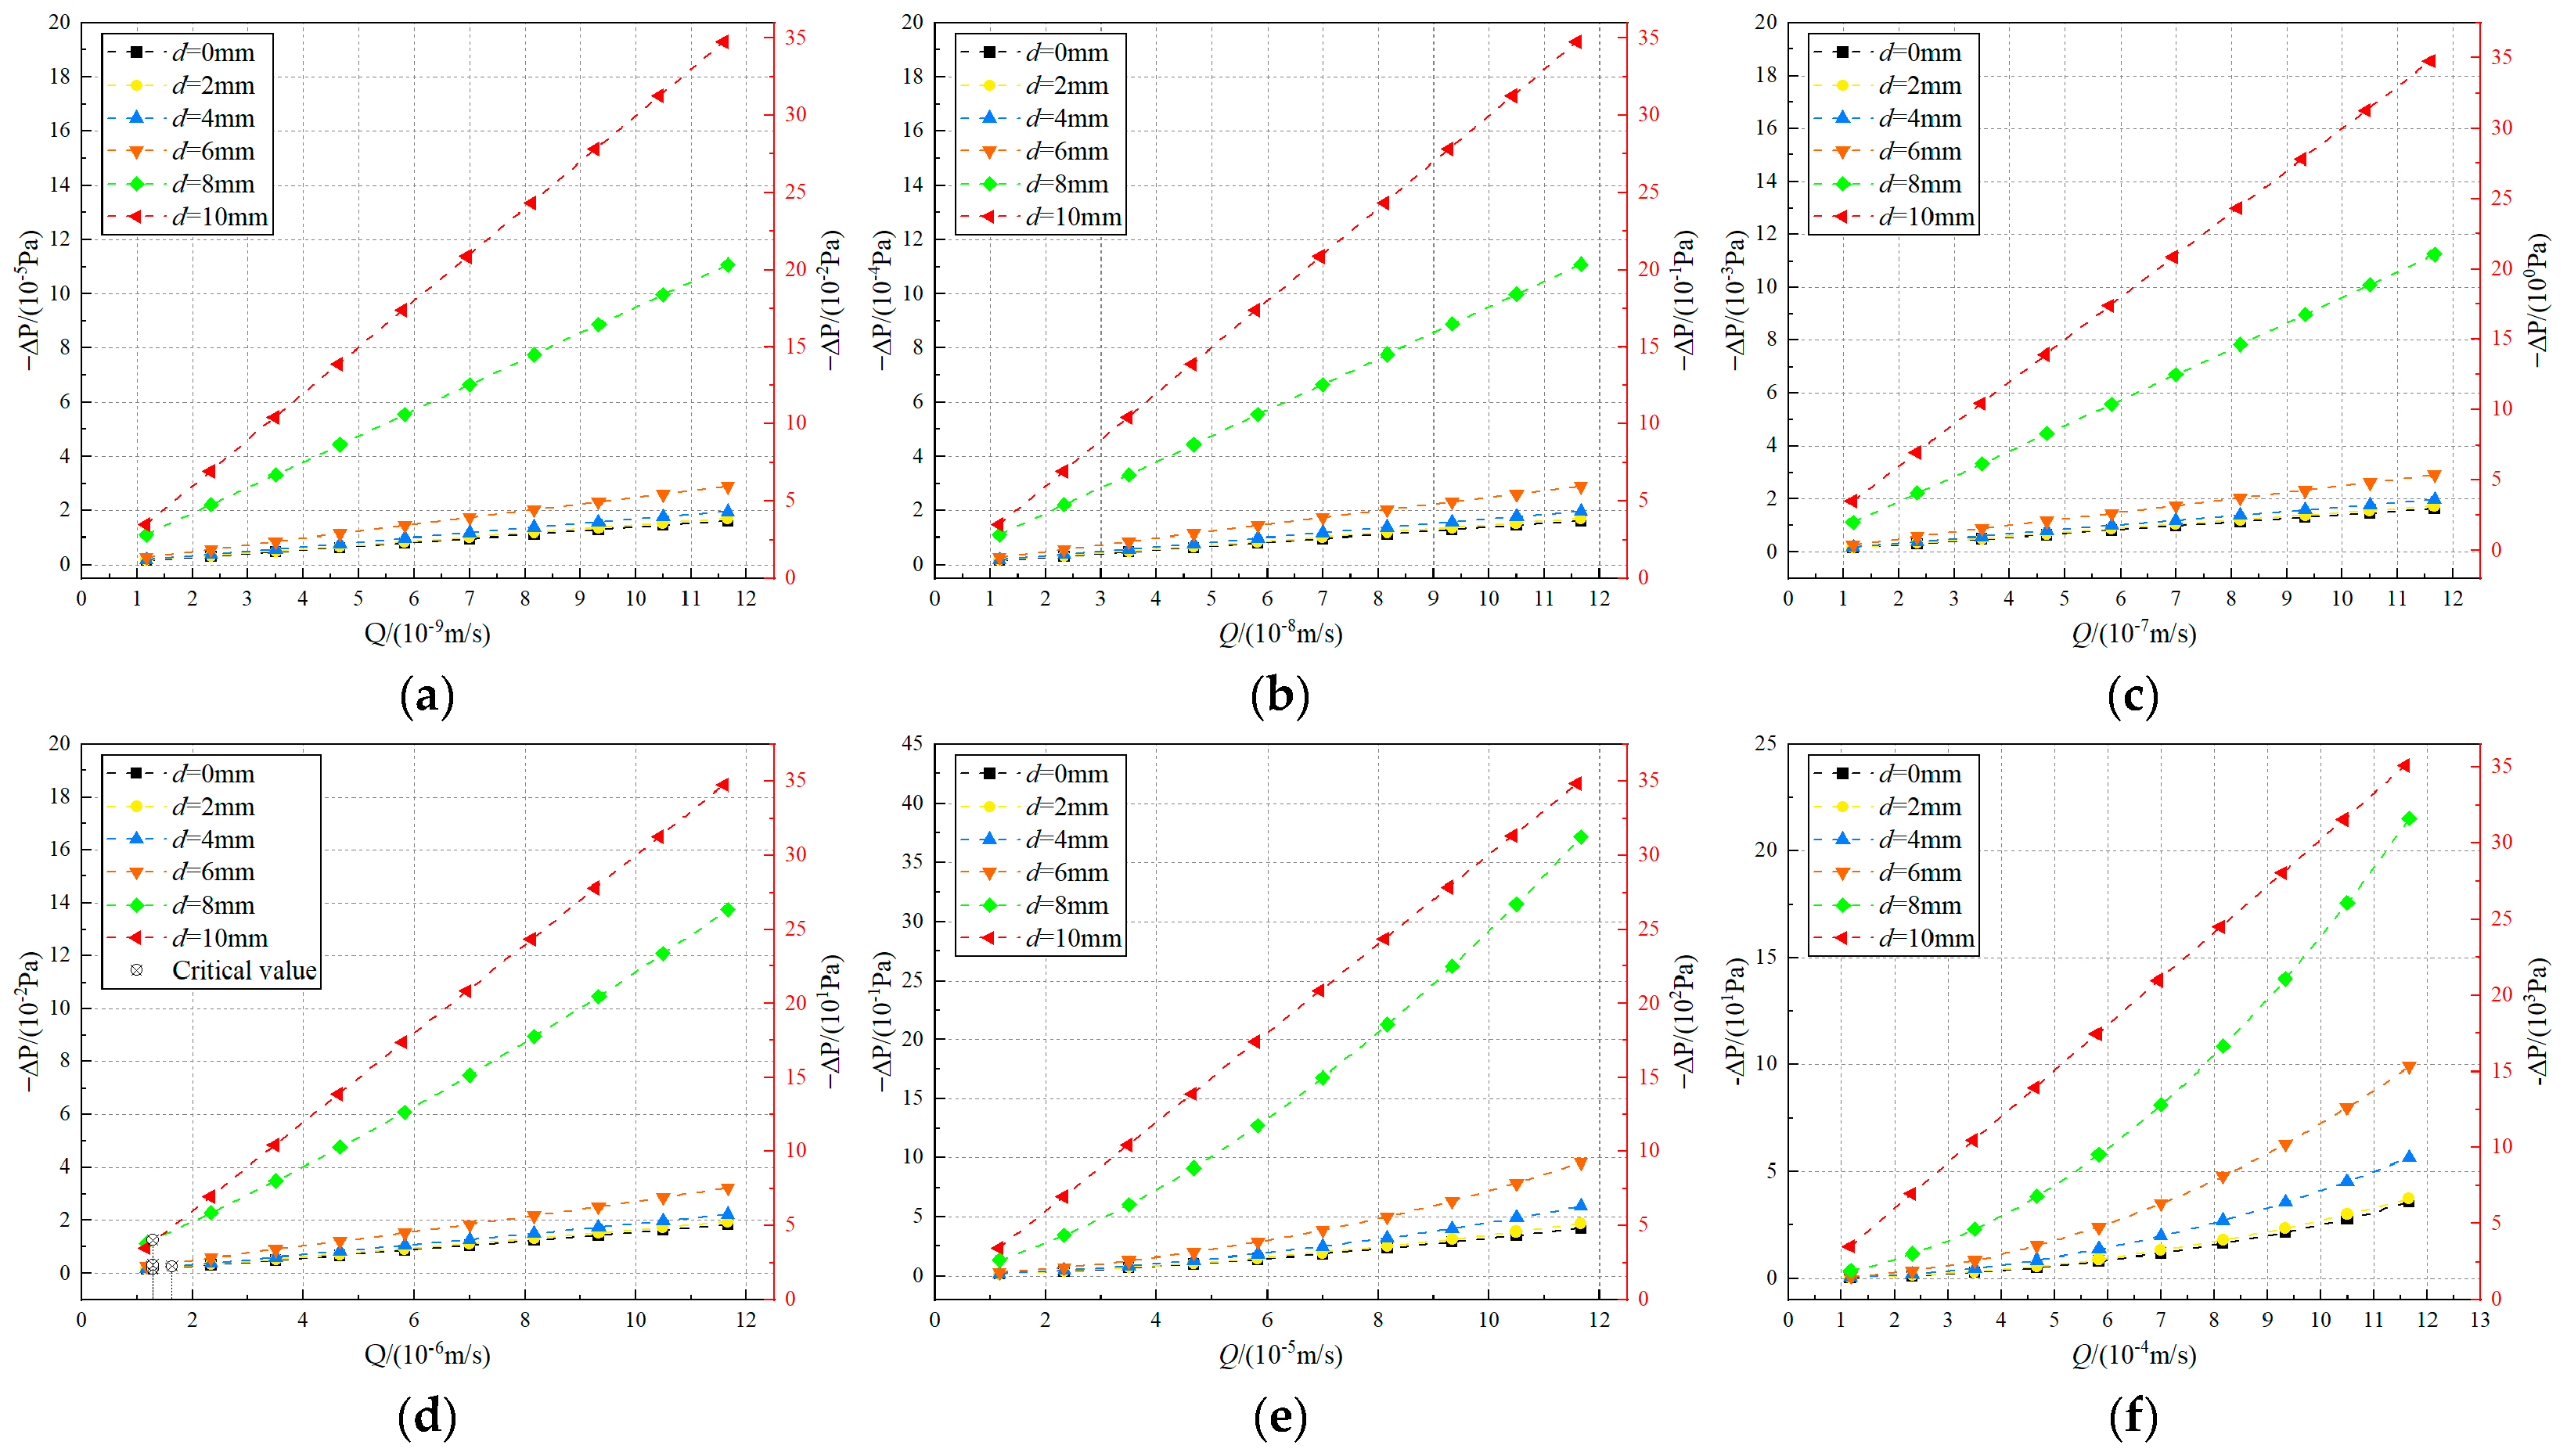
Analysis of the 60 simulation cases presented in Figure 6 was conducted by extracting pressure drop (–ΔP) and volumetric flow rate (Q) data to construct characteristic curves, illustrating the nonlinear evolution between pressure drop and volumetric flow rate. Figure 8a–f shows results covering six orders of magnitude of Reynolds number. Due to the large volume of raw data, each plot displays curves corresponding to six selected filling particle diameters (d = 0, 1, 2, 3, 4, and 5 mm).
At low flow rates, the relationship between pressure and flow for fluid moving through the fractures can be described by the traditional linear Darcy’s law. However, as inertial effects intensify, nonlinear seepage behavior becomes apparent [16,17,18,19,20,21,22]. The -ΔP and Q for fracture flow (Figure 8) reflect the evolution of the flow regime and the energy dissipation mechanisms within the fracture network. The linear relationship at low flow rates (Figure 8a–c), consistent with Darcy’s law, indicates a viscosity-dominated laminar state. Once the flow rate exceeds a critical value (Recrit = 11–14), the curve exhibits convex nonlinear growth (Figure 8d–f), signifying strengthened inertial effects and a transition towards transitional or turbulent flow. The combined action of inertial and viscous resistances within the pores causes the curve to convex towards the flow rate axis. As the particle diameter d increases from 0 to 10 mm, the flow resistance through the fracture correspondingly rises, leading to a progressive increase in the slope of the -ΔP–Q curves. For d < 10 mm, the -ΔP–Q relationship exhibits a transition from linear to nonlinear behavior as the Reynolds number Re increases. In contrast, when the filling material completely blocks the fracture (d = h = 10 mm), the -ΔP–Q relationship remains linear across the entire range of flow rates investigated.

4. Analysis of Seepage Characteristics in Tortuous Fractures

4.1. Flow Field Architectures of Tortuous Fractures Simulation

Numerical simulations coupling fracture flow and matrix flow were conducted for fracture models with varying fracture tortuositys (α = 5–60°, H = 15 h, Re = 100). Each fracture model was simulated under six different Reynolds number conditions (Re = 10−2–103). To illustrate the differences in streamline characteristics between tortuous fracture models and the horizontal fracture model, representative simulation results for a specific case (α = 60°) are presented in Figure 9.
The tortuous fracture is fully embedded within the porous matrix and can receive fluid from it through its upper, lower, and left boundaries. Consequently, the flow rate within the fracture varies along its path and is influenced by the fracture tortuosity angle, which also affects the velocity profile in the longitudinal cross-section. Two-dimensional cross-sectional lines were defined perpendicular to the flow path at multiple longitudinal positions along the tortuous fracture (Figure 9b) to extract the velocity profiles.
The streamlines in the tortuous fracture model differ significantly from those in the horizontal model (Figure 5). In the horizontal fracture, velocity streamlines are uniformly distributed along the fracture, concentrated without significant vortices, showing weaker coupling between the porous media and the fracture, lower velocities, and a regularly extended horizontal flow path. In contrast, the tortuous fracture drives inertial flow through geometric asymmetry, resulting in intense velocity variations. Inertial effects generate local vortices in the front and rear dip-angle fracture zones, while the inclined fracture enhances the fluid exchange efficiency between the porous media and the fracture, significantly increasing the velocity in the porous media near the fracture.
Owing to the complex geometry of the tortuous fracture, the domain is partitioned into five distinct zones based on geometric characteristics and relative position along the fracture path (Figure 9b): the front horizontal fracture zone (L = 0–40 mm), the front dip-angle fracture zone (L = 40–60 mm), the central inclined fracture zone (L = 60–90 mm), the rear dip-angle fracture zone (L = 90–110 mm), and the rear horizontal fracture zone (L = 110–160 mm). Since the tortuous fracture is fully embedded within the porous matrix, it receives continuous fluid influx through its upper, lower, and left boundaries. Consequently, the volumetric flow rate evolves progressively along the fracture path and is modulated by the fracture dip angle, which correspondingly affects the velocity distribution in longitudinal cross-sections. To quantitatively analyze these effects, longitudinal Vertical intercept lines were defined perpendicular to the fracture path at monitoring locations ①–⑦ (Figure 9b). Additionally, a streamwise intercept line was established along the central axis of the inclined tortuous fracture (Figure 9) to measure the velocity profile for subsequent analysis.
As shown in Figure 9a, the flow velocity increases most rapidly in the front horizontal fracture zone. The velocity is significantly lower in the front and rear dip-angle fracture zones compared to the adjacent zones. The central inclined fracture zone and the rear horizontal fracture zone exhibit a trend of initial velocity increase followed by a decrease. These results are consistent with the velocity and streamline distributions shown in Figure 10a.This phenomenon occurs because fluid flow within the fracture is influenced by the shape and size of the inclined fracture and its hydrodynamic characteristics. Local vortices form as fluid passes through the fracture regions. The fluid streamlines follow an asymmetric parabolic distribution along the fracture path, with the peak velocity located near the upper fracture wall. Consequently, the primary flow path in the front and rear dip-angle zones does not coincide with the defined cross-sectional line, leading to abrupt velocity gradient changes and resulting in lower measured velocities in these regions. The velocity decrease in the rear horizontal fracture zone is consistent with the mechanism described earlier for the horizontal fracture model.
As shown in Figure 10b, near the end of the front horizontal fracture zone, the fracture receives fluid from the surrounding porous matrix, resulting in a velocity profile characterized by higher velocities at the sides and a lower velocity in the center at location ①. As the flow field stabilizes along the front horizontal fracture zone, the velocity profile at location ② evolves into a parabolic distribution, which persists towards the fracture outlet. However, the presence of the fracture tortuosity angle alters the flow direction, causing the velocity profile curves at locations ③ (front dip-angle zone) and ④ (rear dip-angle zone) to shift towards the direction of inclination. Furthermore, the velocity distribution differs between the two sides of the central inclined fracture zone, and the internal velocity profile evolves along the fracture path from location ③ to ⑤. The flow state stabilizes again in the rear horizontal fracture zone, where the velocity profiles at locations ⑥ and ⑦ nearly coincide.

4.2. Pressure Drop and Volumetric Flow Rate in Tortuous Fractures

To investigate the synergistic effect of infill diameter (d) and fracture tortuosity angle (α), a total of 120 simulations were performed on 12 sets of tortuous fracture models with different fracture tortuositys (α = 5–60°) under a fixed Reynolds number (Re = 100). Each numerical model incorporated a different infill diameter (d = 0–10 mm) (Figure 11).
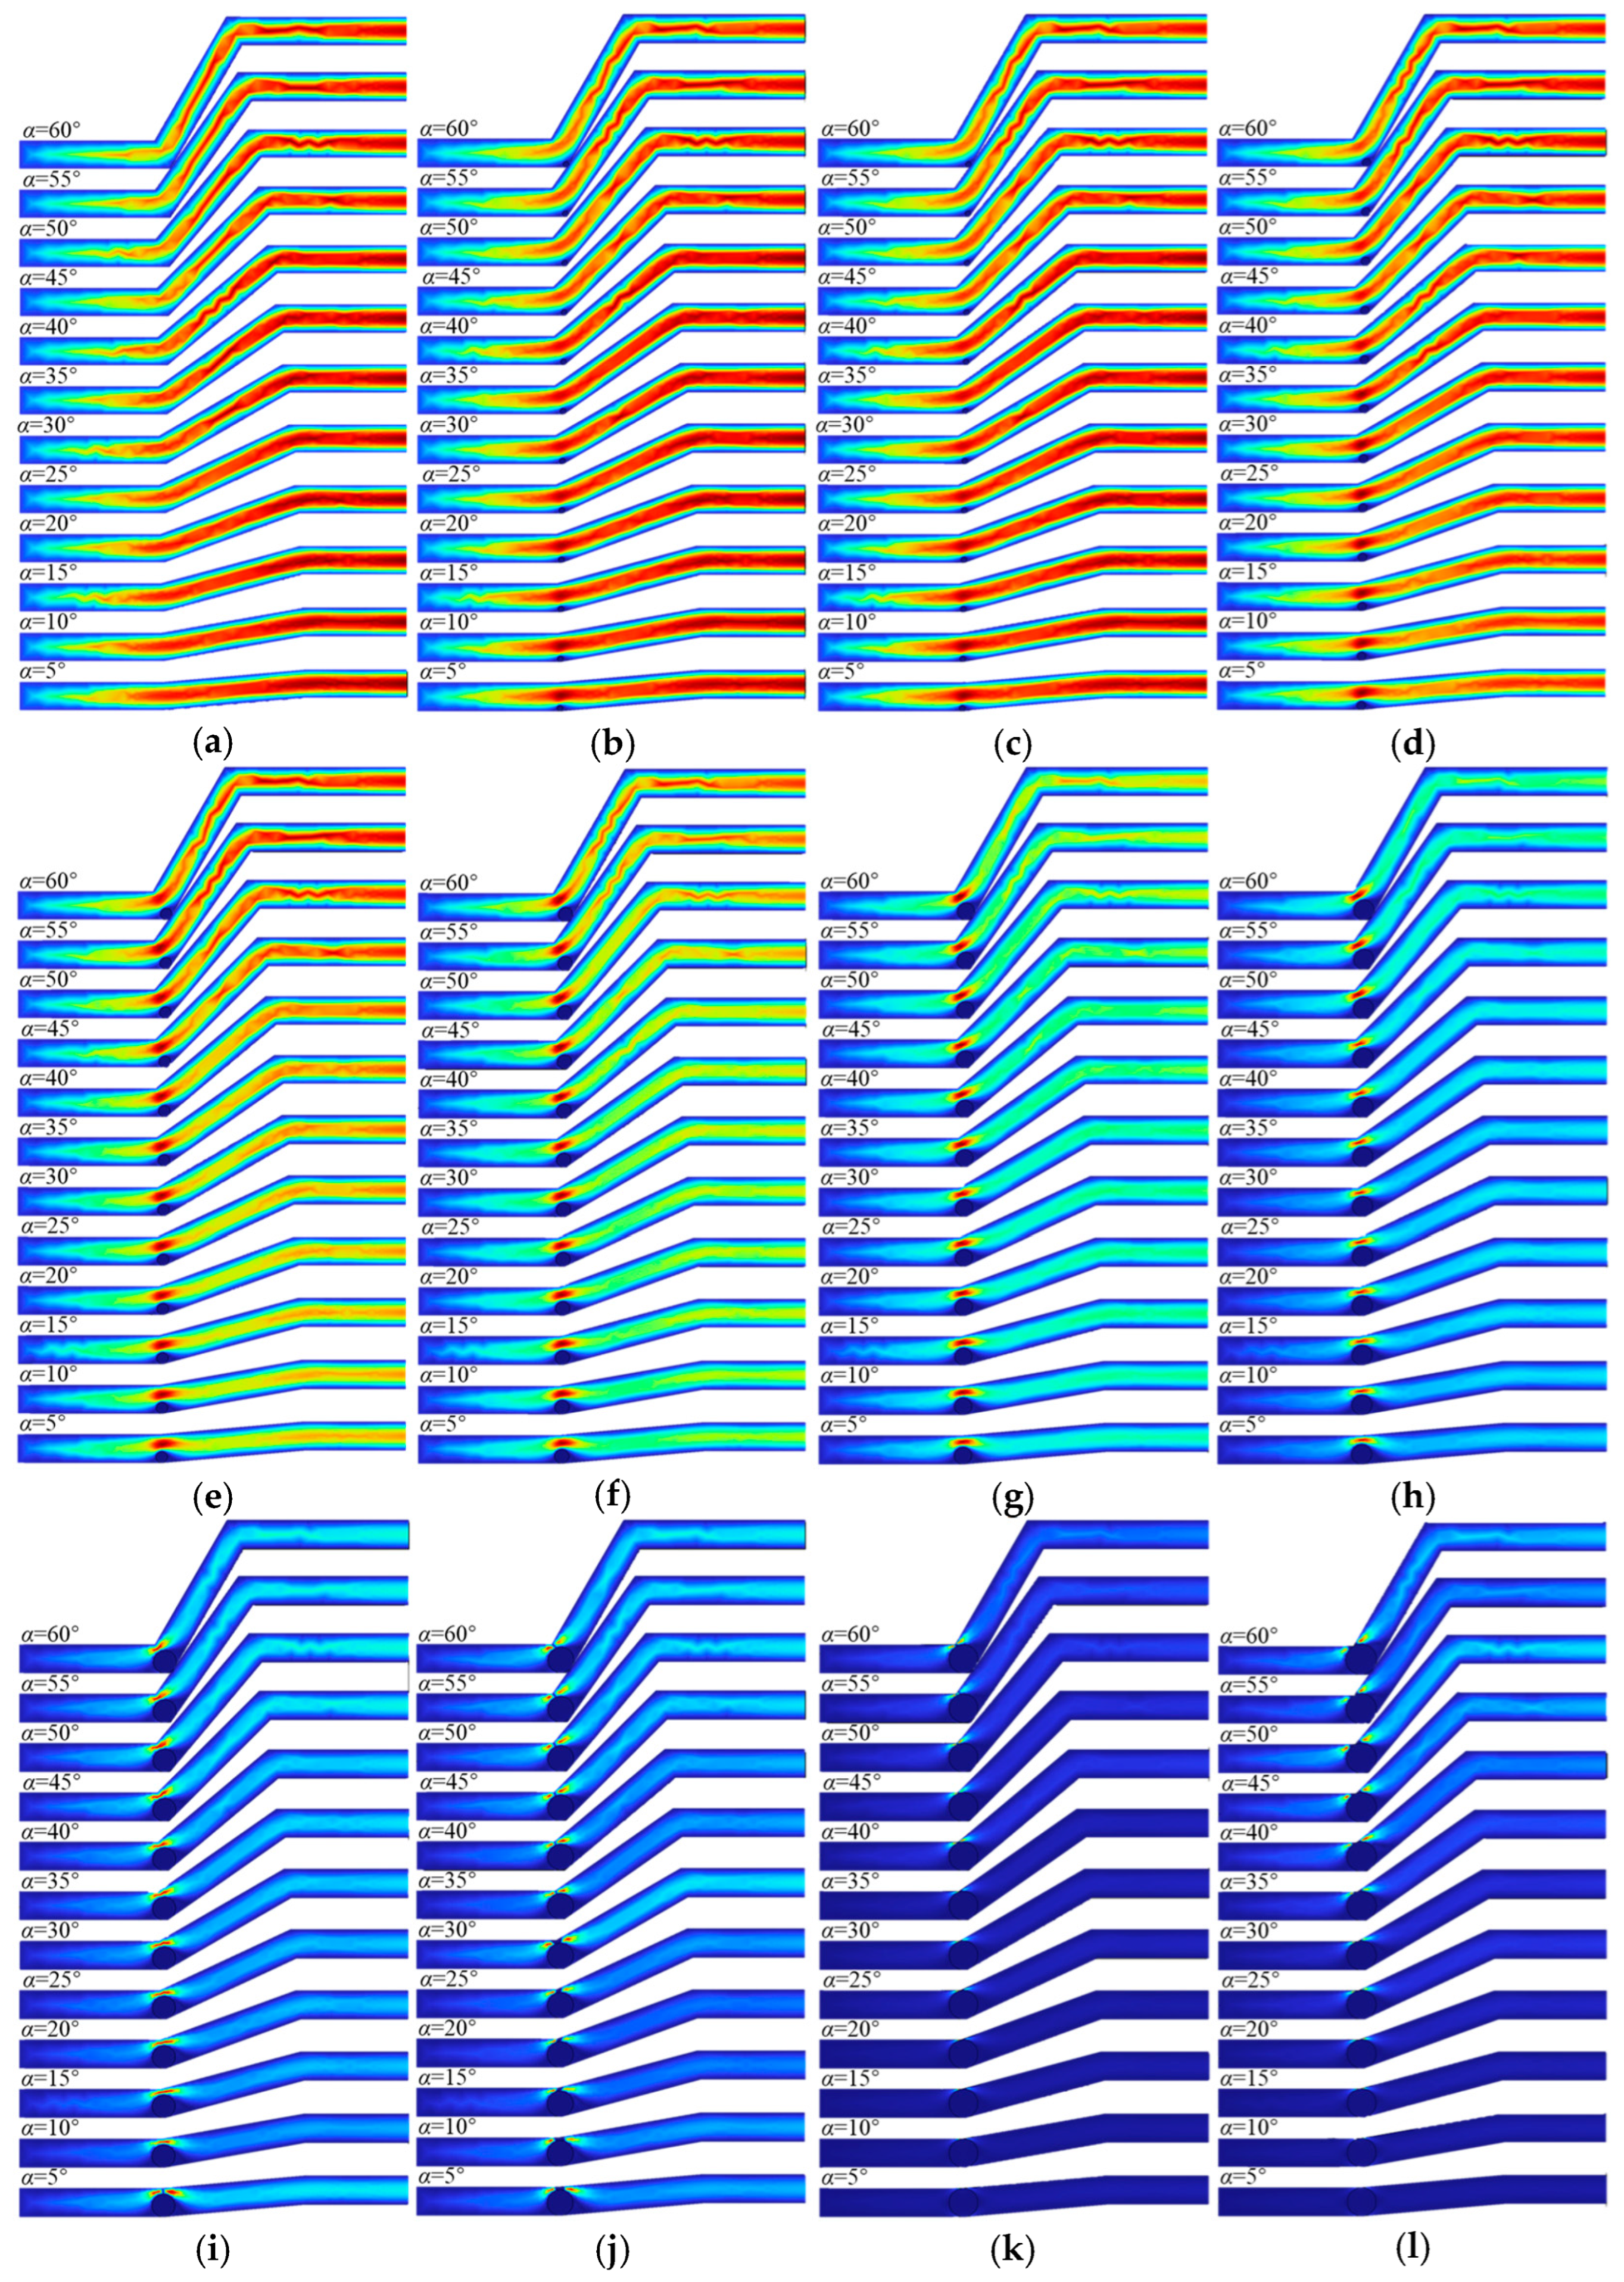
Figure 11a shows results for six cases of inclined fractures without infill, representing a fracture flow regime. At low fracture tortuositys (α = 5–15°), the flow is viscosity-dominated, with smooth streamlines and an approximately symmetric velocity distribution along the fracture path; the peak velocity is located in the central region of the fracture. At medium fracture tortuositys (α = 30–35°), the velocity distribution becomes asymmetric, with the peak shifting towards the upper fracture wall and the velocity at the lower wall dropping to a fraction of the peak value. Vortices appear at the fracture bends, causing abrupt velocity gradient changes. At high fracture tortuositys (α = 50–55°), inertial effects become significant, increasing flow field complexity. The peak velocity region narrows considerably, forming a high-speed flow channel.
As shown in Figure 11b,c (d = 1–2 mm), representing a micro-obstructed flow regime with small infill diameters, the infill material causes slight perturbation in the main flow area. The central peak velocity decreases slightly, but the overall distribution remains nearly symmetric. Figure 11d,f (d = 2–4 mm) represent a channel-blocking flow regime. Small-particle infill alters the flow path through local constriction effects, causing slight local thickening of the boundary layer and a moderate increase in the velocity gradient near the infill material. However, significant bypass flow channels or vortex structures do not form.
Figure 11g–l (d = 4–10 mm) depict a completely blocked flow regime. The infill material forcibly reconstructs the flow path, forming narrow, high-velocity bypass channels. The velocity distribution becomes highly asymmetric, with significantly reduced velocity in the central region. Boundary layer separation intensifies, generating large-scale, high-energy vortex regions. The flow morphology approaches turbulent characteristics, with energy dissipation dominated by inertial collisions and vortices.
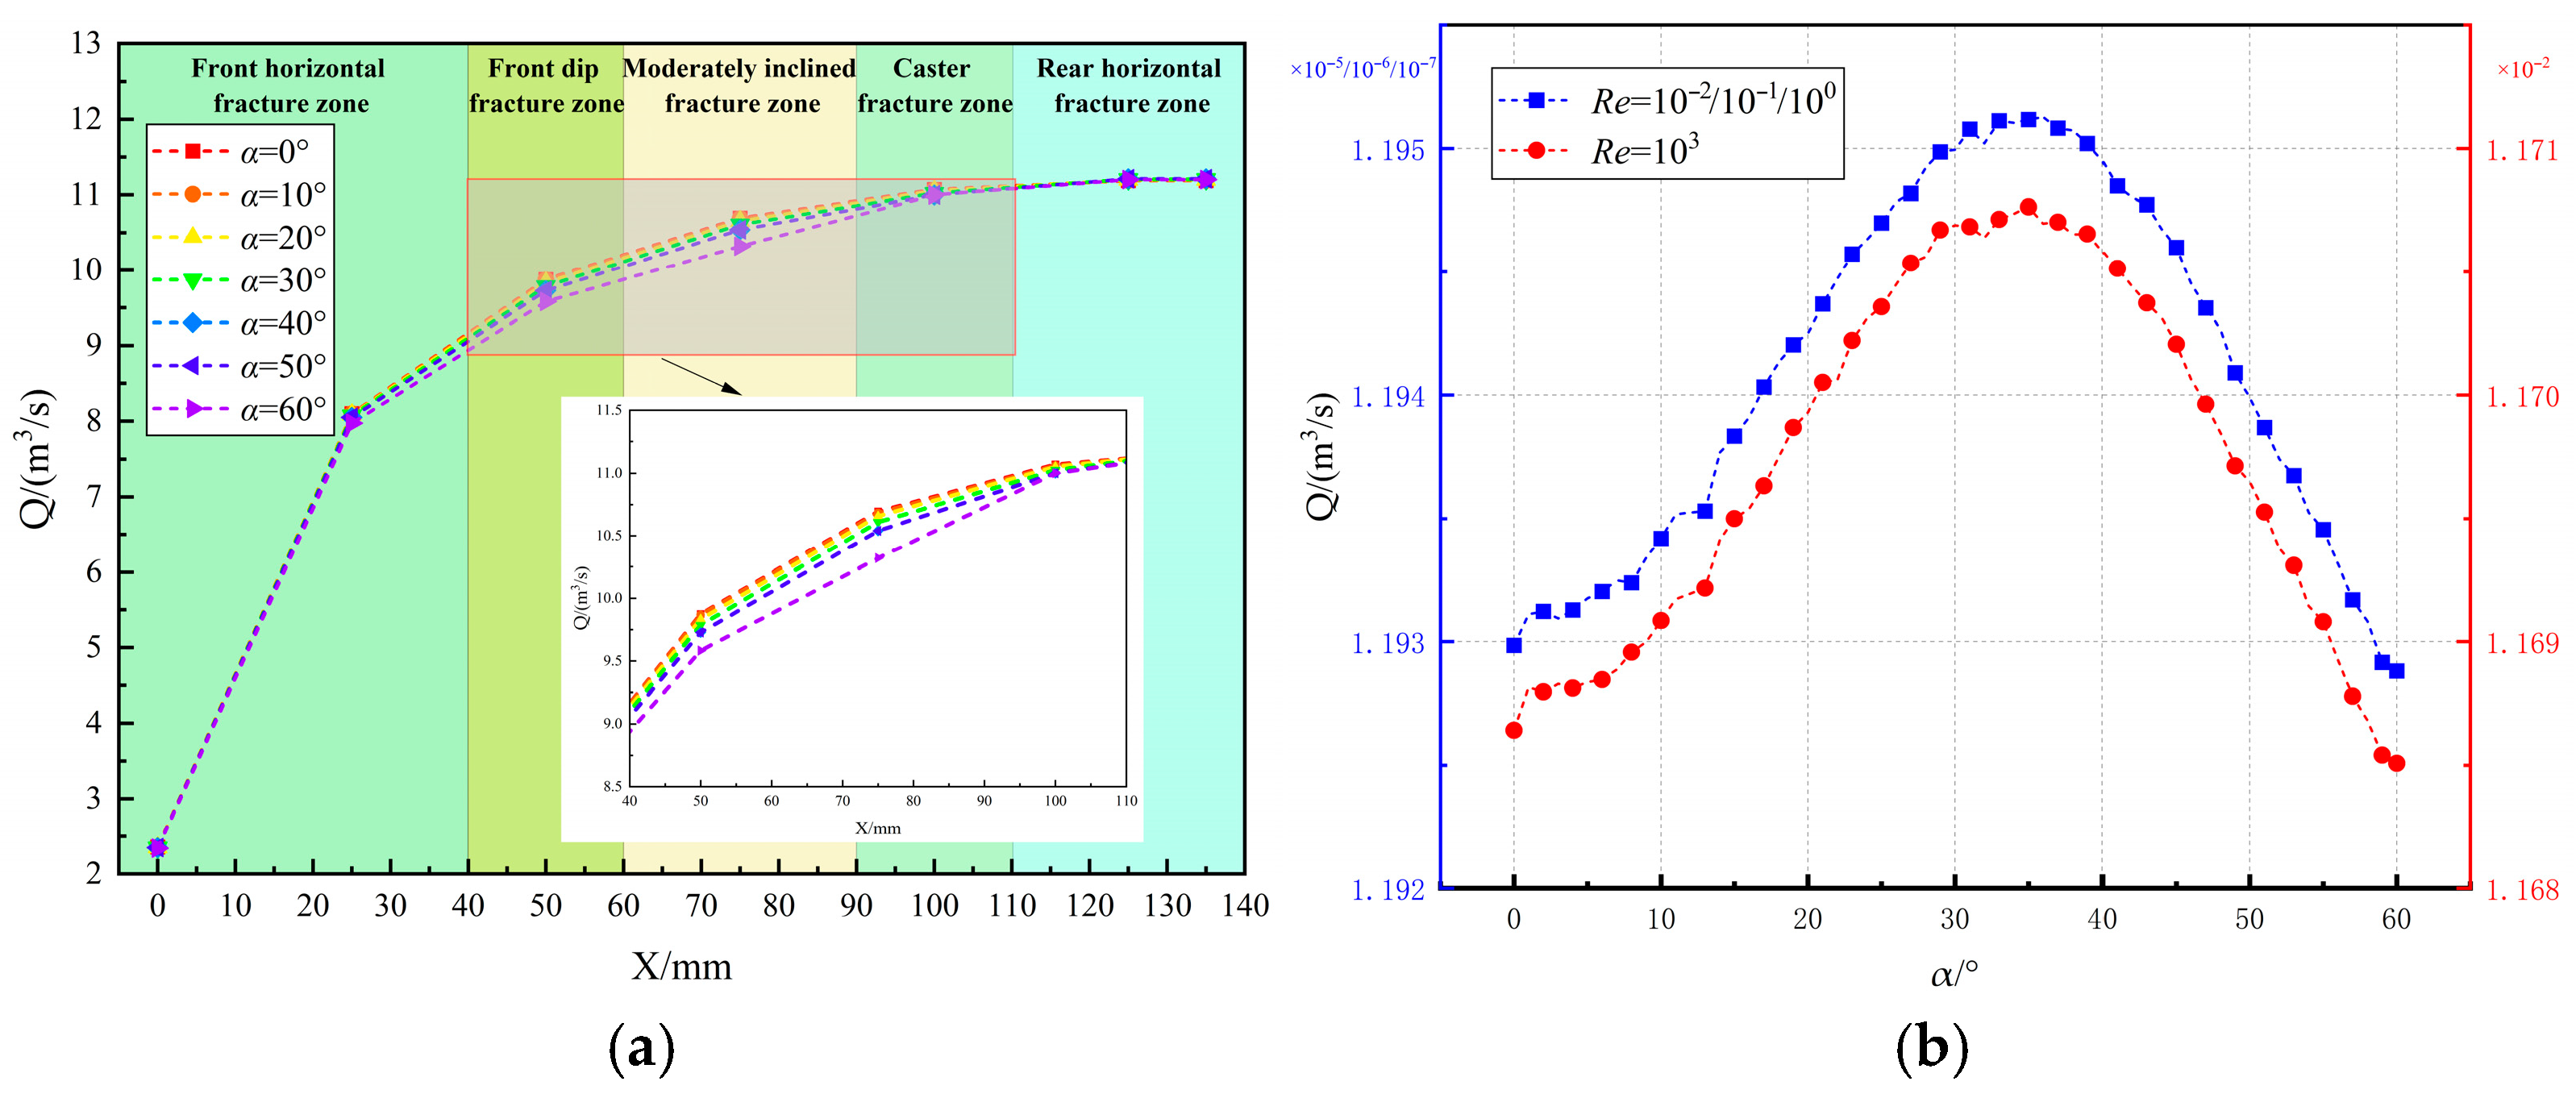
Longitudinal velocity profiles were extracted at multiple locations along tortuous fractures with varying dip angles (α = 0–60°). By integrating these profiles and multiplying by the fracture aperture and thickness, the volumetric flow rates at different positions along the fracture path were obtained, as shown in Figure 11a. Additionally, the outlet flow rates from the tortuous fracture models presented in Figure 10 were compiled for the same range of dip angles. The resulting curves are presented in Figure 11b, which includes comparative data from two additional Reynolds number regimes differing by orders of magnitude.
As shown in Figure 12a, the flow rate distribution curves along the path exhibit remarkably similar trends across different dip angles. The volumetric flow rate increases rapidly within the front horizontal fracture zone, after which the rate of increase gradually diminishes along the flow path. Variations in flow distribution among different angles are primarily concentrated in the front, central, and rear dip-angle fracture zones. With increasing dip angle, the overall fracture flow rate decreases, while the gradient of flow rate increase becomes steeper, resulting in closely matched total flow rates for tortuous fractures with different inclinations. Figure 12b demonstrates that the outlet flow rate of tortuous fractures initially increases and subsequently decreases with increasing dip angle, peaking at 36°. The completely overlapping curves for the low Reynolds number case (Re = 1) indicate a linear relationship between flow rate and dip angle under these conditions. In contrast, at high Reynolds numbers (Re = 1000), the relative peak of the curve gradually decreases with increasing Reynolds number, demonstrating a nonlinear enhancement of flow rate with Reynolds number.
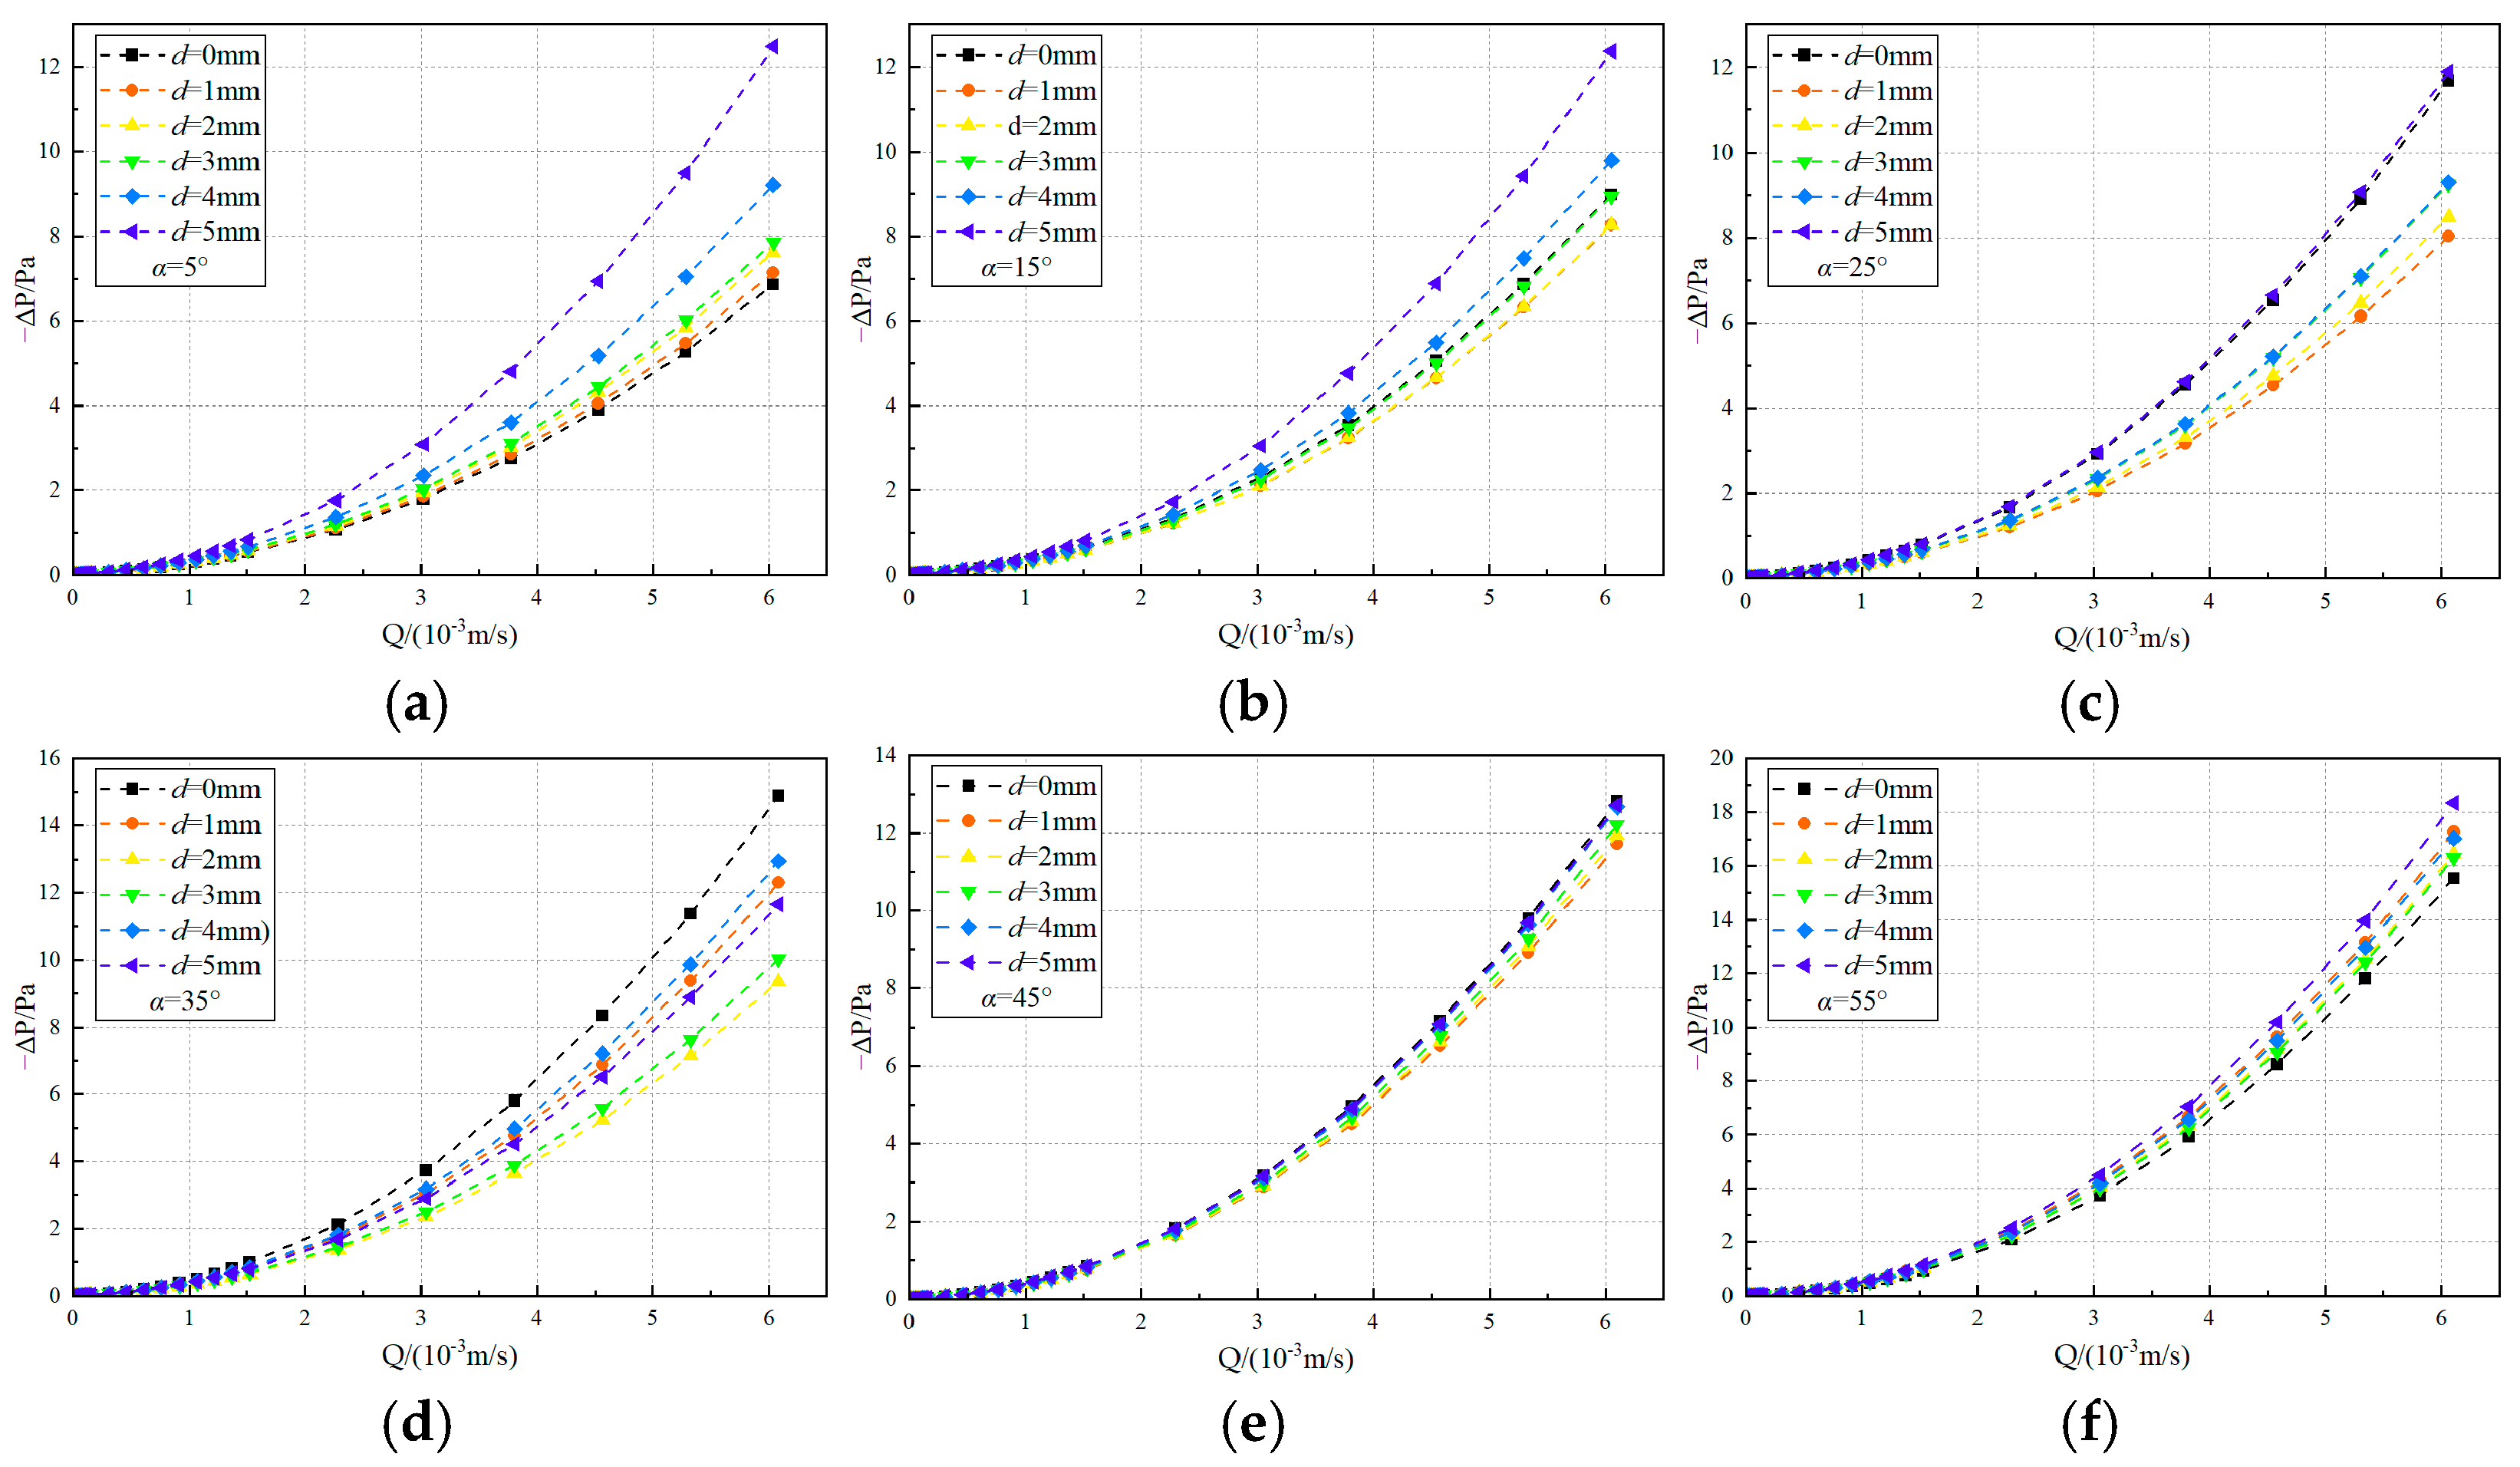
Numerical simulations spanning six orders of magnitude of Reynolds number (Re = 0.01 to 1000) were conducted on 120 tortuous fracture models with varying infill particle diameters (d) and fracture inclination angles (α), as referenced in Figure 10 [19,20,21,22,23]. These investigations revealed the synergistic control mechanism of fracture inclination angle and infill particle diameter on seepage resistance under the condition of a constant fracture aperture (h = 10 mm). Pressure drop (–ΔP) and flow rate (Q) data were extracted from all 120 simulation results for analysis. A systematic variation in the relative positioning of the pressure drop–flow rate (–ΔP vs. Q) curves was observed for infill diameters d ≤ 5 mm. Due to the volume of raw data, Figure 13a–f present selected results for specific inclination angles (α = 5°, 15°, 25°, 30°, 45°, 50°, 55°) to illustrate the nonlinear evolution of pressure drop versus volumetric flow rate. Each panel includes comparison curves for six infill diameters (d = 0, 1, 2, 3, 4, 5 mm).
Analysis of Figure 13a,b, corresponding to the low inclination angle region (α ≤ 15°), shows that pressure drop is lowest at α = 5°. The curve for d = 0 mm lies below all curves for d = 1–5 mm, indicating surface friction dominates flow resistance. At α = 15°, the overall pressure drop increases. The d = 0 mm curve rises slightly above the d = 3 mm curve but remains below those for d = 4–5 mm, suggesting the geometric structure of the fracture inclination zone begins to influence seepage resistance, although the infill diameter remains the dominant factor.
For the medium inclination angle region (15° ≤ α ≤ 35°, Figure 13c,d), the position of the d = 0 mm curve shifts progressively upward. At α = 25°, it lies between the curves for d = 4 mm and d = 5 mm, slightly lower than the latter. Notably, at α = 35°, the d = 0 mm curve jumps to the highest position among all d = 1–5 mm curves, indicating that fracture geometry becomes the primary factor governing energy dissipation. The presence of infill material appears to mitigate drastic flow direction changes caused by the fracture inclination, thereby reducing energy dissipation.
In the high inclination angle region (α ≥ 45°, Figure 13e,f), the d = 0 mm curve shows a slight decrease at α = 50° but remains somewhat higher than the d = 5 mm curve. At α = 55°, the d = 0 mm curve returns to the lowest position, suggesting fracture geometry again dictates the dominant energy dissipation mode.
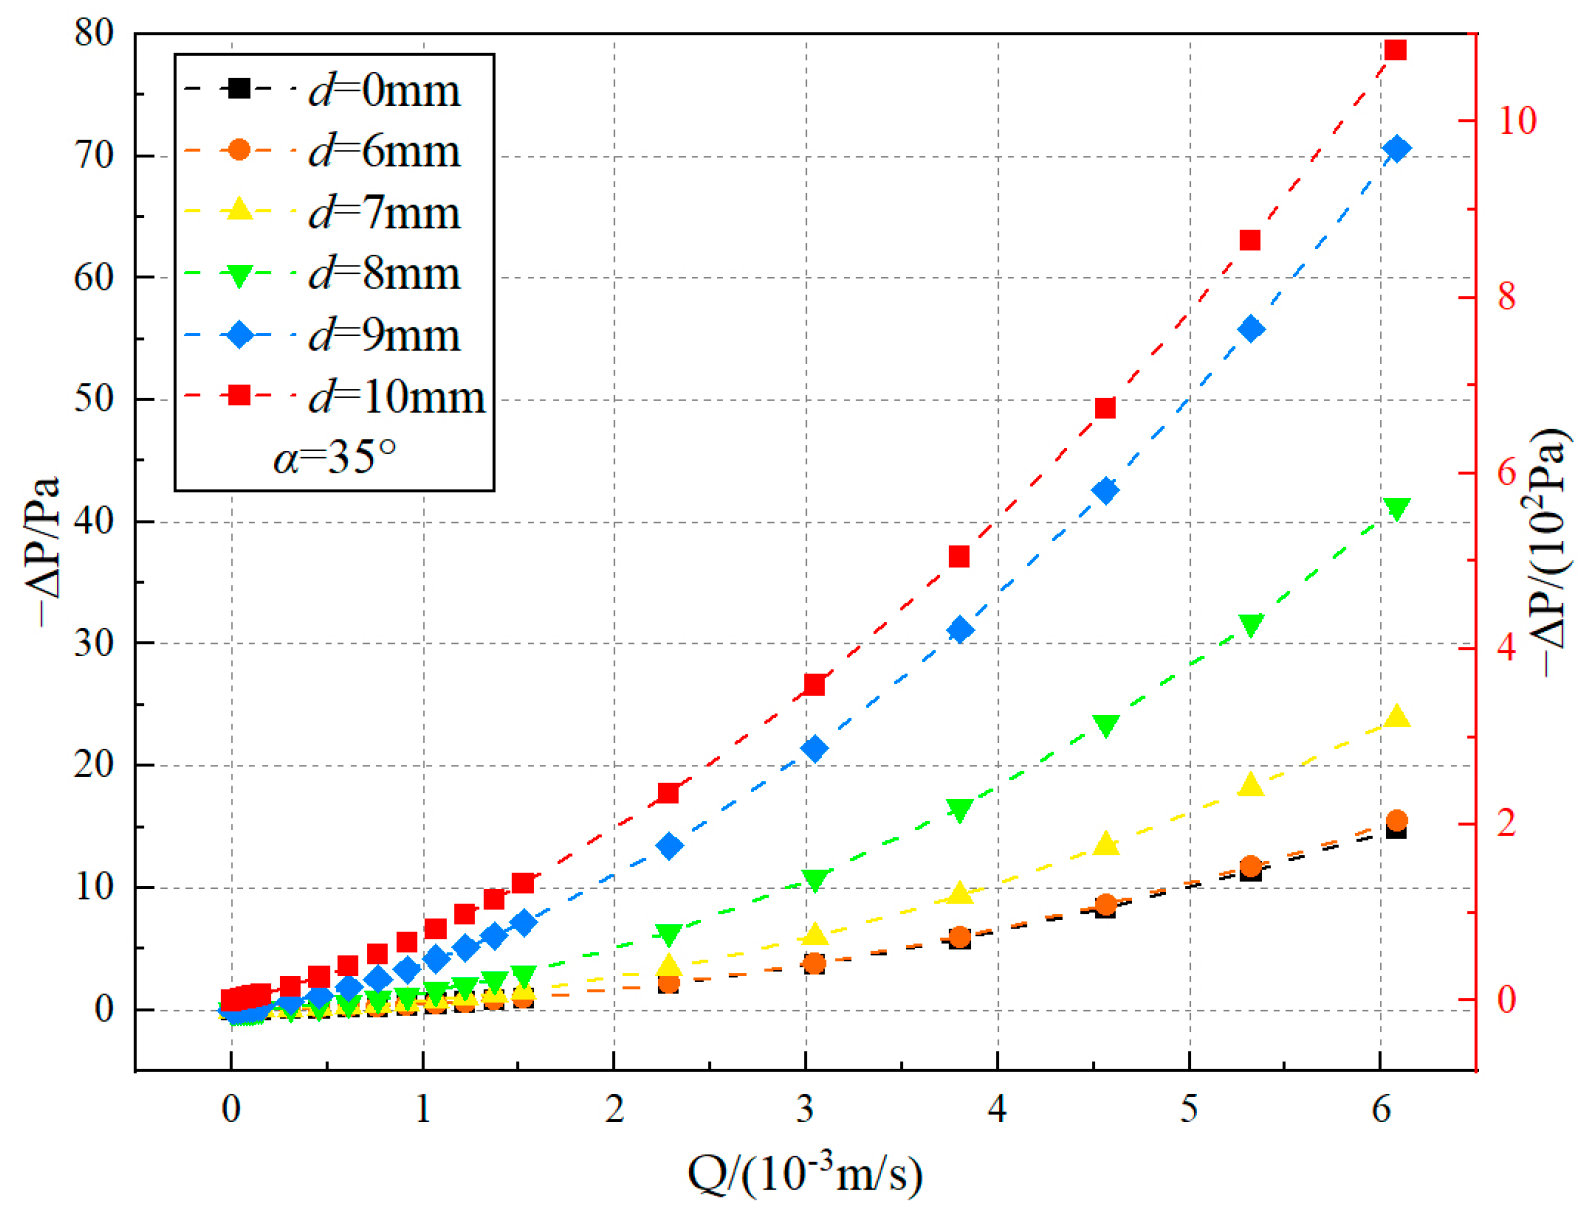
It is important to note that all infill diameters in Figure 13 satisfy d ≤ 5 mm, meaning the ratio of infill diameter to fracture aperture d/h ≤ 0.5. When d > 5 mm (d/h > 0.5), the curves shift uniformly upward with increasing infill diameter without the relative positional changes described above. Furthermore, for d ≥ 10 mm, the pressure-drop flow rate curves are positioned significantly higher than those for d < 10 mm, as shown in Figure 14.

5. Conclusions

This study developed a comprehensive seepage model that integrates infill materials, tortuous fractures, and a porous matrix to systematically investigate the synergistic interactions governing fluid transport in fracture-porous media systems. The principal findings are summarized as follows:
(1)
Horizontal fractures continuously receive fluid influx from the surrounding porous matrix, where the flow field maintains remarkable symmetry. A critical matrix height-to-fracture aperture ratio (Hcrit ≈ 12.5 h) regulates the divergence and convergence of streamlines at the fracture outlet, governing the transition between different flow regimes.
(2)
The flow field within horizontal fractures undergoes substantial transformation when the Reynolds number exceeds a critical threshold (Recrit = 11–14), while the flow patterns and -ΔP-Q relationships remain essentially unchanged below this value. This demonstrates the existence of a distinct flow regime transition controlled by inertial effects.
(3)
Tortuous fracture geometries induce localized vortex formation and significant velocity fluctuations, particularly in the front and rear dip-angle zones. Compared to horizontal fractures, the tortuous configuration enhances fluid exchange efficiency between the porous matrix and fracture channels, while generating geometrically asymmetric flow fields in the adjacent porous media.
(4)
The volumetric flow rate in tortuous fractures exhibits a non-monotonic dependence on inclination angle, initially increasing then decreasing with rising dip angle to reach a maximum at approximately 36°. A distinct synergistic effect between fracture inclination angle and infill particle diameter jointly regulates local flow resistance and kinetic energy dissipation. This interaction produces systematic shifts in the relative positions of pressure-drop-flow-rate curves when d/h ≤ 0.5, while this phenomenon vanishes when the infill particle diameter becomes substantial (d/h > 0.5).
These findings provide fundamental insights into the complex interplay between geometric parameters and filling characteristics in controlling nonlinear seepage behavior, offering practical guidance for predicting fluid transport in engineered and natural fracture systems. Specifically, the revealed synergistic mechanisms between fracture geometry and filling characteristics enable more accurate prediction of dominant seepage pathways in complex fracture systems, with direct implications for water inrush prevention in deep mining and tunnel engineering.

Author Contributions

Conceptualization, W.L. and D.K.; methodology, W.L., D.K. and J.Z.; software, W.L., D.K. and J.Z.; validation, D.K. and J.Z.; formal analysis, W.L., D.K. and J.Z.; investigation, D.K. and J.Z.; resources, D.K.; data curation, D.K.; writing—original draft preparation, D.K.; writing—review and editing, D.K.; visualization, D.K.; supervision, D.K.; project administration, D.K., L.S. and Z.M.; funding acquisition, D.K., L.S. and Z.M. All authors have read and agreed to the published version of the manuscript.

Funding

This research was funded by the National Natural Science Foundation of China, grant number 52304238; Shandong Provincial Natural Science Foundation, grant number ZR2023ME002; The Open Foundation of State Key Laboratory of Disaster Prevention and Ecology Protection in Open-pit Coal Mines, grant number MDPC2025ZR01; and Postdoctoral Innovation Project Special Fund of Shandong Province, grant number SDCX-ZG-202502107.

Data Availability Statement

The datasets generated and analyzed during the current study are not publicly available due to the proprietary nature of the numerical models and simulation parameters, but are available from the corresponding author on reasonable request for academic and research purposes.

Acknowledgments

We also wish to thank our colleagues from the State Key Laboratory of Mining Disaster Prevention and Control for their technical assistance in data acquisition and analysis. Special thanks are extended to the anonymous reviewers whose constructive comments significantly improved the quality of this manuscript.

Conflicts of Interest

Authors Lihong Shi and Zhenguo Mao were employed by the company China Zuoquan Wulihou Coal Industry Co., Ltd., Shanxi Lu’ an Group. The remaining authors declare that the research was conducted in the absence of any commercial or financial relationships that could be construed as a potential conflict of interest.

References

  1. Wei, J.; Yao, B.; Liu, Y.; Wang, D.; Cui, P.; Yao, S. Grout Diffusion Law and Variable Mass Seepage Model in Fractured Coal Mass. J. China Coal Soc. 2020, 45, 204–212. [Google Scholar] [CrossRef]
  2. Zheng, C.; Han, F.; Jiang, B.; Sheng, X.; Guofu, L.; Shuaili, L. Multi-Scale Pore-Fracture Evolution and Permeability Jump Law of Coal Under In Situ Hydraulic Fracturing. J. China Univ. Min. Technol. 2024, 53, 710–725. [Google Scholar] [CrossRef]
  3. Li, X.L.; Chen, S.J.; Li, Z.H.; Wang, E.Y.; Li, Z.H. Rock burst mechanism in coal rock with structural surface and the microseismic (MS) and electromagnetic radiation (EMR) response. Eng. Fail. Anal. 2021, 124, 105396. [Google Scholar] [CrossRef]
  4. Li, X.L.; Wang, E.Y.; Li, Z.H.; Liu, Z.; Song, D.; Qiu, L. Rock burst monitoring by integrated microseismic and electromagnetic radiation methods. Rock Mech. Rock Eng. 2016, 49, 4393–4406. [Google Scholar] [CrossRef]
  5. Zhou, Y.; Li, S.; Li, L.; Shi, S.; Zhang, Q.; Chen, D.; Song, S. 3D Fluid-Solid Coupling Model Test on Mechanism of Water Inrush Caused by Permeability Instability in Karst Conduits of Tunnels. Chin. J. Rock Mech. Eng. 2015, 34, 1739–1749. [Google Scholar] [CrossRef]
  6. Li, S.; Lin, P.; Xu, Z.; Li, L.; Guo, M.; Sun, C.; Wang, J.; Song, S. Minimum Safe Thickness of Water and Mud Inrush in Filled Karst Water-Bearing Structures Based on Slice Method. Rock Soil Mech. 2015, 36, 1989–1994+2002. [Google Scholar] [CrossRef]
  7. Knabner, P.; Roberts, J.E. Mathematical analysis of a discrete fracture model coupling Darcy flow in the matrix with Darcy-Forchheimer flow in the fracture. ESAIM Math. Model. Numer. Anal. 2014, 48, 1451–1472. [Google Scholar] [CrossRef]
  8. Chen, Y.F.; Zhou, J.Q.; Hu, S.H.; Hu, R.; Zhou, C.-B. Evaluation of Forchheimer equation coefficients for non-Darcy flow in deformable rough-walled fractures. J. Hydrol. 2015, 529, 993–1006. [Google Scholar] [CrossRef]
  9. Nordbotten, J.M.; Boon, W.M.; Fumagalli, A.; Keilegavlen, E. Unified approach to discretization of flow in fractured porous media. Comput. Geosci. 2019, 23, 225–237. [Google Scholar] [CrossRef]
  10. Wang, H.; Chen, L.; Qu, Z.G.; Yin, Y.; Kang, Q.; Yu, B.; Tao, W.-Q. Modeling of multi-scale transport phenomena in shale gas production—A critical review. Appl. Energy 2020, 262, 114575. [Google Scholar] [CrossRef]
  11. Gao, M.; Zhao, S.; Xi, G.; Iao, B.; Shi, X.; He, S. Fracture Evolution and Failure Characteristics of Surrounding Rock in Ultra-Thick Coal Seam Roadway Under Repeated Impact. J. China Univ. Min. Technol. 2024, 53, 634–646. [Google Scholar] [CrossRef]
  12. Guo, H.; Wang, K.; Cui, H.; Xu, C.; Yang, T.; Zhang, Y.; Teng, T. Experimental Study on Pore-Fracture Structure and Fractal Characteristics of Briquette Coal. J. China Univ. Min. Technol. 2019, 48, 1206–1214. [Google Scholar] [CrossRef]
  13. Pan, R.; He, X. Seepage Law of Rough Single Fracture Under Influence of Rock Fracture Surface Tortuosity. J. Liaoning Tech. Univ. (Nat. Sci. Ed.) 2020, 39, 293–298. [Google Scholar] [CrossRef]
  14. Yang, M.; Chen, M.; He, Y. Influence of Single Fracture Tortuosity on Fluid Seepage Process. Rock Soil Mech. 2001, 78–82. [Google Scholar] [CrossRef]
  15. Wu, Z.; Lu, H.; Weng, L.; Liu, Q.; Shen, J. Seepage Characteristics of Fractured Sandstone Based on Real-Time Nuclear Magnetic Resonance Imaging Technology. Chin. J. Rock Mech. Eng. 2021, 40, 263–275. [Google Scholar] [CrossRef]
  16. Zhang, W.; Wang, Y.; Ni, X. Characteristics Analysis of Forchheimer-Type Non-Darcy Seepage Parameters. Water Resour. Power 2014, 32, 52–54+164. [Google Scholar] [CrossRef]
  17. Wang, D.; Wei, Q.; Wei, J.; Bai, X.; Yu, C.; Zhang, P. Fractal Characteristics of Coal Fractures and Fractal Seepage Model. J. China Univ. Min. Technol. 2020, 49, 103–109+122. [Google Scholar] [CrossRef]
  18. Zhao, Q.; Xu, G. Hybrid Method for Rotor Flow Field Simulation Based on Navier-Stokes Equations/Free Wake/Full Potential Equations. Acta Aerodyn. Sin. 2006, 1, 15–21. [Google Scholar] [CrossRef]
  19. Liu, M.; Hu, S.; Chen, Y.; Zhou, C. Analytical Model of Nonlinear Seepage Parameters for Fractured Rock Mass Based on High-Pressure Water Injection Test. J. Hydraul. Eng. 2016, 47, 752–762. [Google Scholar] [CrossRef]
  20. Zhang, X.; Jin, S.; Zhang, Y.; Zhang, S.; Han, L. Mechanism of Pore and Fracture Structure Changes in Coals with Different Moisture Contents Under SCCO2. J. China Coal Soc. 2024, 49, 3143–3153. [Google Scholar] [CrossRef]
  21. Gong, H.; Liu, Y.; Zhao, H.; LI, Y.; Jing, S. Zoning Characteristics and Critical Stress Conditions of Floor Fracture Propagation in Stopes. J. China Univ. Min. Technol. 2024, 53, 1132–1143. [Google Scholar] [CrossRef]
  22. Zhong, C.; Leung Juliana, Y. Coupling Upscaled Discrete Fracture Matrix and Apparent Permeability Modelling in DFNWORKS for Shale Reservoir Simulation. Adv. Water Resour. 2024, 192, 104776. [Google Scholar] [CrossRef]
  23. Meng, R.; Hu, S.; Chen, Y.; Zhou, C. Permeability Characteristics of Fractured Rock Mass Based on Non-Darcy Flow Under High Seepage Pressure. Chin. J. Rock Mech. Eng. 2014, 33, 1756–1764. [Google Scholar] [CrossRef]
  24. Zhu, Y. Analysis of Influence of Fracture tortuosity Angle on Grouting Diffusion Radius. China Mine Eng. 2014, 43, 55–58+62. [Google Scholar] [CrossRef]
  25. Nian, G.; Chen, Z.; Zhou, Z.; Zhang, L.; Bao, M. Seepage and Stability Analysis of Fractured Rock Slope Based on Dual Media Model. J. China Coal Soc. 2020, 45 (Suppl. S2), 736–746. [Google Scholar] [CrossRef]
  26. Qin, Y.; Liu, P.; Liu, W.; Hao, Y.; Yang, Y.; He, C. Dual-Permeability Model and Numerical Solution for Gas Seepage in Boreholes of Dual-Porosity Coal. J. China Univ. Min. Technol. 2016, 45, 1111–1117. [Google Scholar] [CrossRef]
  27. Zhang, S.; Liu, X.; Wang, E. Quantitative evaluation of the onset and evolution for the non-Darcy behavior of the partially filled rough fracture. Water Resour. Res. 2024, 60, e2023WR036521. [Google Scholar] [CrossRef]
  28. Landau, L.D.; Lifshitz, E.M. Fluid Mechanics, 2nd ed.; Pergamon Press: Oxford, UK, 1987. [Google Scholar]
  29. Schlichting, H.; Gersten, K. Boundary-Layer Theory, 9th ed.; Springer: Berlin/Heidelberg, Germany, 2017. [Google Scholar]
  30. Brinkman, H.C. A Calculation of the Viscous Force Exerted by a Flowing Fluid on a Dense Swarm of Particles. Appl. Sci. Res. 1947, 1, 27–34. [Google Scholar] [CrossRef]
  31. Idelchik, I.E. Handbook of Hydraulic Resistance, 3rd ed.; CRC Press: Boca Raton, FL, USA, 1994. [Google Scholar] [CrossRef]
  32. Zhu, J.; Liu, G.; Lu, S. Analysis of Unsteady Seepage in Saturated-Unsaturated 3D Porous Media. Eng. J. Wuhan Univ. 2001, 5–8+26. [Google Scholar]
  33. Wei, M.; Huangpu, H.; Lu, C.; Gao, K.; Wei, L.; Guo, F. Experimental Measurement Method for Matrix and Fracture Permeability of Coal Rock. J. China Univ. Min. Technol. 2024, 54, 413–422. [Google Scholar] [CrossRef]
  34. Wang, G.; Chen, H.; Chen, X.; Yang, B. Seepage Characteristics of Variable Aperture Fractures in Coal Based on CT 3D Reconstruction. J. China Univ. Min. Technol. 2024, 53, 59–67. [Google Scholar] [CrossRef]
  35. Ma, Y.; Huang, Q.; Kong, X.; Feng, J.; Yin, Z.; Wang, C. Experimental Study on Pore and Fracture Structure Evolution of Bituminous Coal Under Multiple Shock Loads. J. China Coal Soc. 2024, 49, 1882–1893. [Google Scholar] [CrossRef]
  36. White, F.M. Viscous Fluid Flow, 3rd ed.; McGraw-Hill: New York, NY, USA, 2011. [Google Scholar]
  37. Batchelor, G.K. An Introduction to Fluid Dynamics; Cambridge University Press: Cambridge, UK, 2000. [Google Scholar]
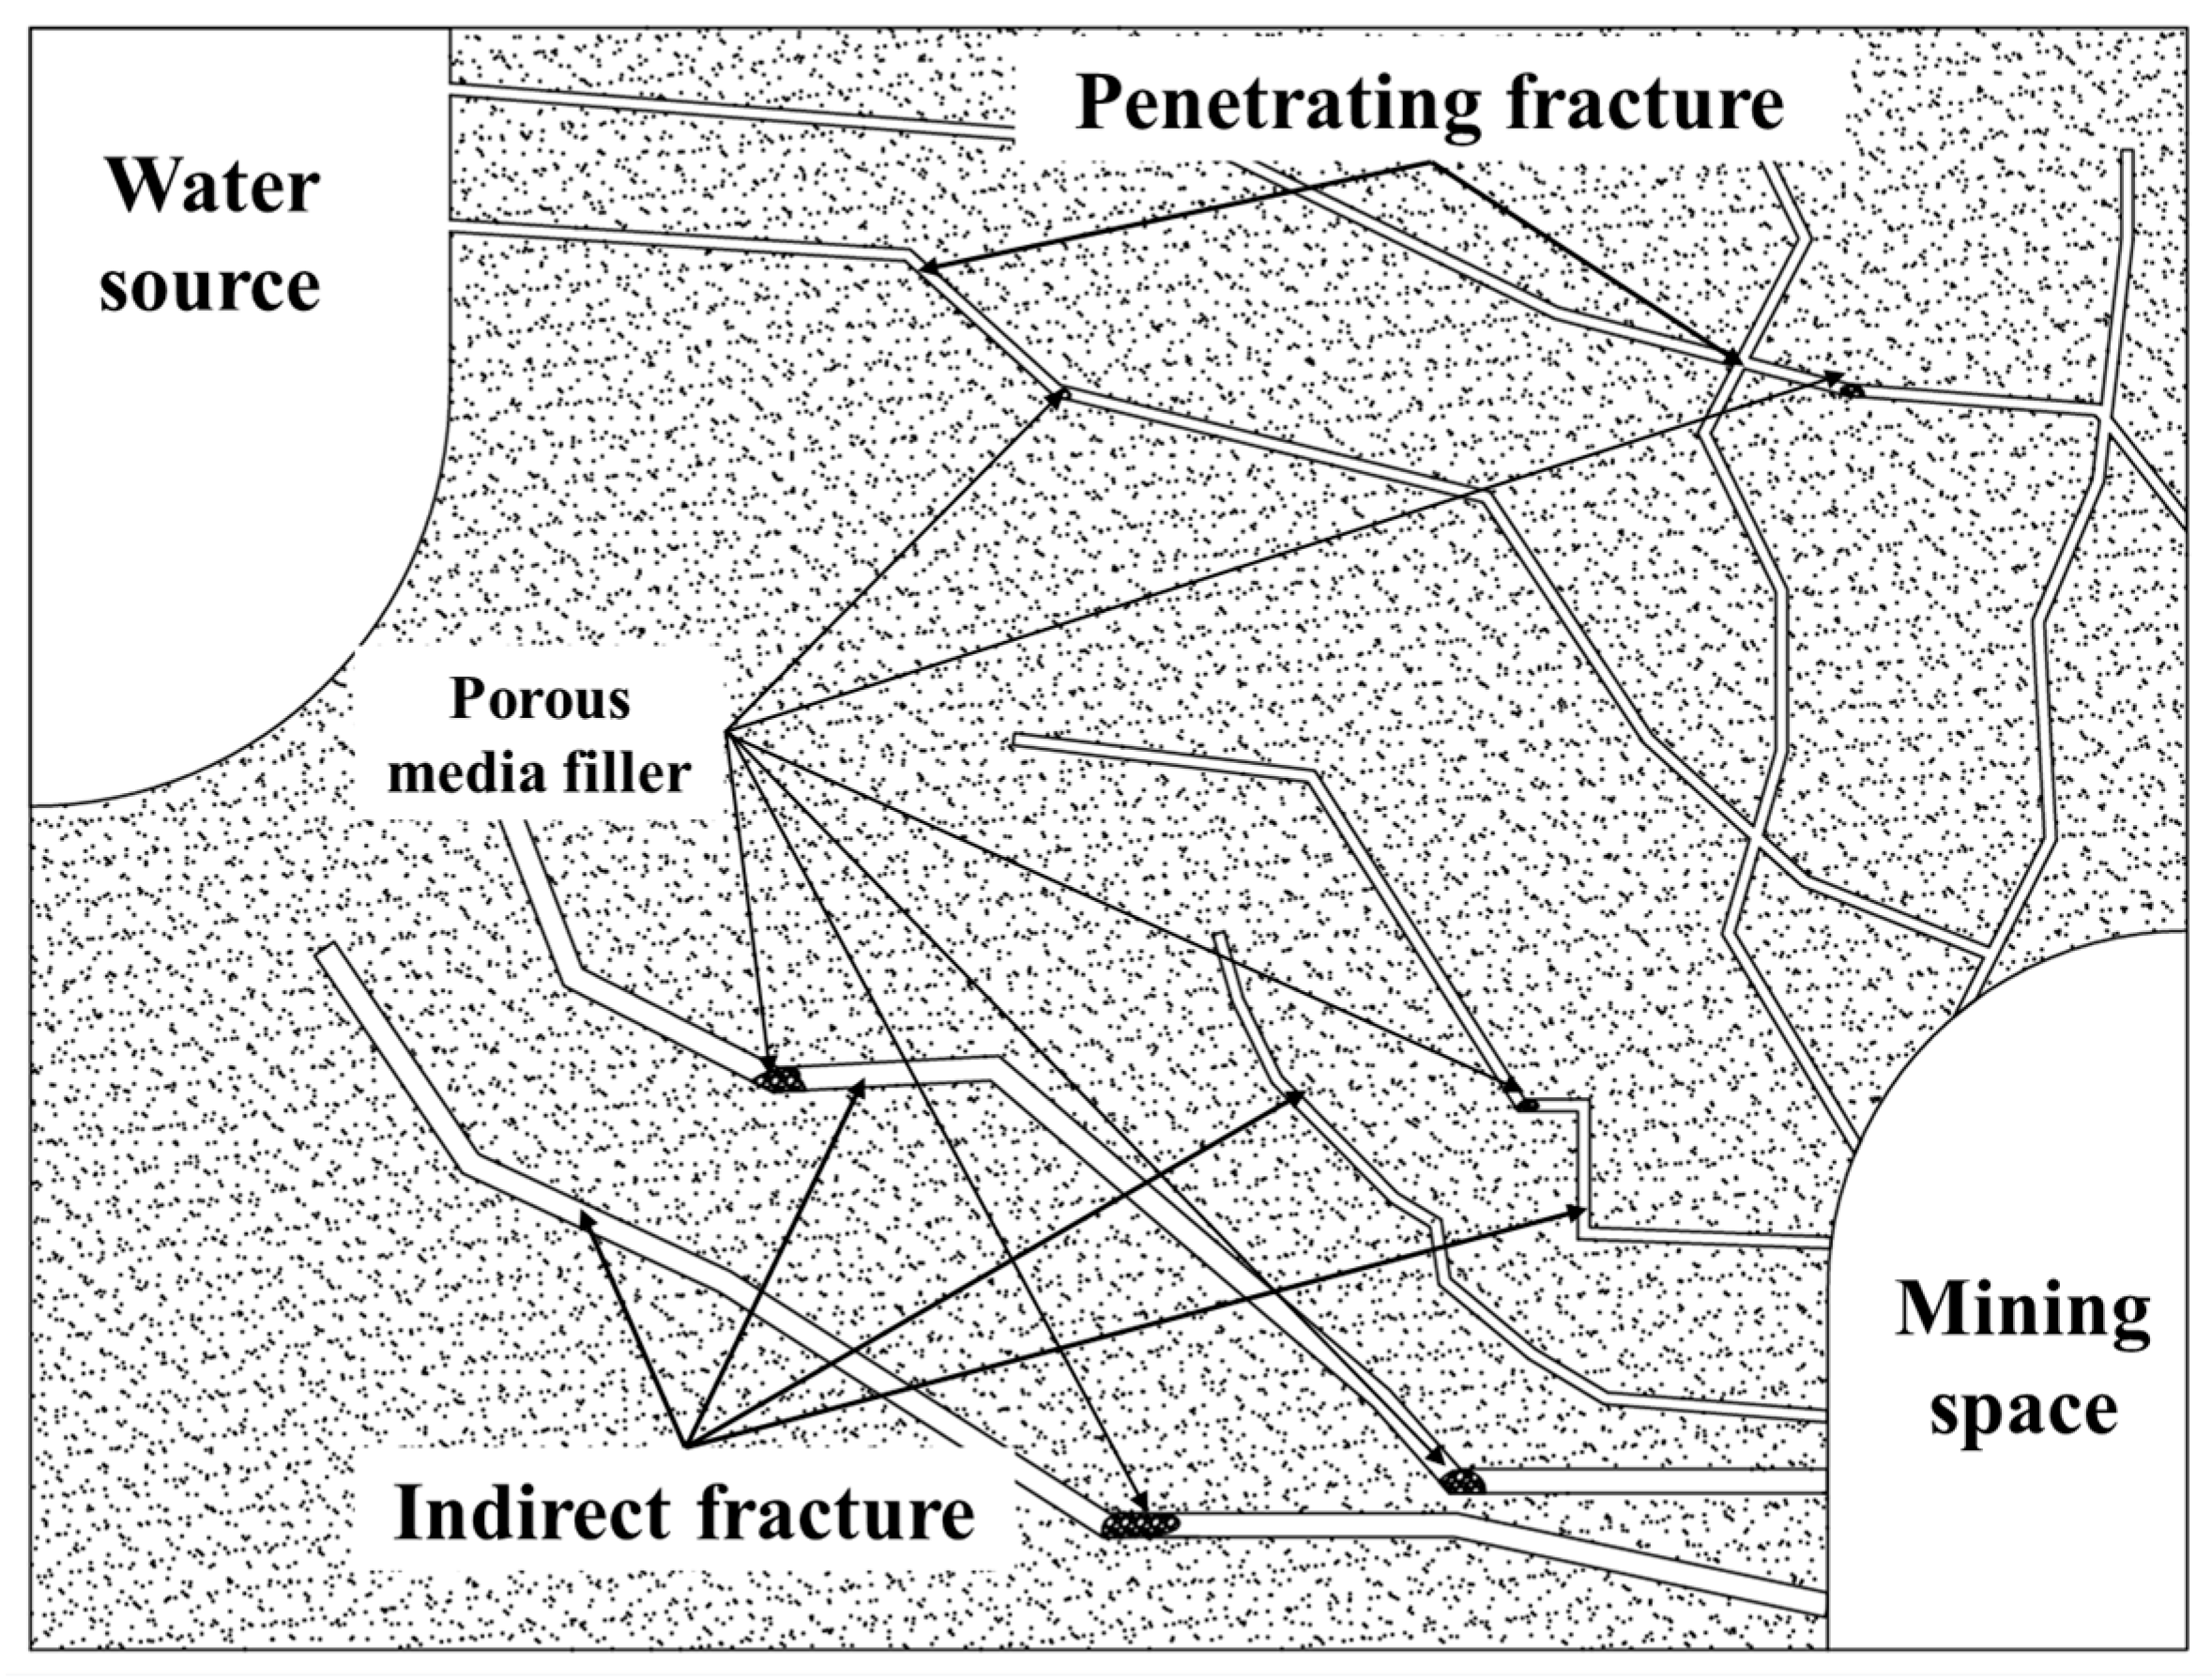
Figure 1. Seepage system comprising infill materials, tortuous fractures, and a porous matrix.
Water 17 03386 g001
Figure 2. Geometrical domains of the fracture flow and matrix flow model.
Water 17 03386 g002
Figure 3. Fracture–Porous Matrix Seepage Models and Mesh Discretization.
Water 17 03386 g003
Figure 4. Required infill size for blocking tortuous fractures.
Water 17 03386 g004
Figure 5. Flow Field Structures in Horizontal Fracture-Porous Matrix Seepage Models under different matrix height (H). (a) H = 12 h; (b) H = 12.5 h.
Water 17 03386 g005
Figure 6. Horizontal fissures flow velocity distributions with Re. (a) Re = 10−2–10−2; (b) H = 12.3–12.6 h.
Water 17 03386 g006
Figure 7. Flow velocity distribution along path under different H. (a) Re = 10−2; (b) Re = 10−1; (c) Re = 100; (d) Re = 101; (e) Re = 102; (f) Re = 103.
Water 17 03386 g007aWater 17 03386 g007b
Figure 8. Pressure drop-flow rate curves under different particle diameter (d) and Reynolds number (Re). (a) Re = 10−2–10−1; (b) Re = 10−1–100; (c) Re = 100–101; (d) Re = 101–102; (e) Re = 102–103; (f) Re > 104.
Water 17 03386 g008
Figure 9. Flow Field Architectures in Tortuous Fracture-Porous Matrix Seepage Models and different locations of cross-sectional and Streamwise at along tortuous fractures. (a) flow field architectures; (b) locations of cross-sectional and profiles.
Water 17 03386 g009
Figure 10. Cracks fissures flow velocity distributions under different Re and Cross-sectional velocity profiles under different locations. (a) streamwise velocity profile; (b) vertical velocity profile.
Water 17 03386 g010
Figure 11. Flow field structures in tortuous fractures under var-ying aperture sizes (d) and inclination angles (α). (a) d = 0 mm; (b) d = 1 mm; (c) d = 2 mm; (d) d=3mm; (e) d = 4 mm; (f) d = 5 mm; (g) d = 6 mm; (h) d = 7 mm; (i) d = 8 mm; (j) d = 9 mm; (k) d = 10 mm; (l) d = dmax.
Water 17 03386 g011
Figure 12. Volumetric flow rate (Q) distribution along tortuous fractures under different dip angles and monitoring locations and volumetric flow rate (Q) of tortuous fractures under different dip angles and Reynolds numbers. (a) different dip angles and locations; (b) different dip angles and Re.
Water 17 03386 g012
Figure 13. Pressure drop-flow rate curves under different particle diameter (d) and inclination angles (α). (a) α = 5°; (b) α = 15°; (c) α = 25°; (d) α = 35°; (e) α = 45°; (f) α = 55°.
Water 17 03386 g013
Figure 14. Pressure drop-flow rate curves for different infill particle diameters (d > 5 mm).
Water 17 03386 g014
Table 1. Geometric parameters of the seepage simulation model for filled tortuous fractures in a porous matrix.
SymbolValue/Range
H125 mm
S135 mm
h10 mm
L010 mm
L150 mm
L250 mm
L3S–L1–L2 sin α
α0–60°
Re10−2–104
d0–10 mm/dmax
Disclaimer/Publisher’s Note: The statements, opinions and data contained in all publications are solely those of the individual author(s) and contributor(s) and not of MDPI and/or the editor(s). MDPI and/or the editor(s) disclaim responsibility for any injury to people or property resulting from any ideas, methods, instructions or products referred to in the content.