Article

Rainfall Impact Experiments on a Clay Soil Covered by Rock Fragments

1
Department of Agricultural, Food and Forest Sciences, University of Palermo, Viale delle Scienze, Building 4, 90128 Palermo, Italy
2
National Biodiversity Future Center (NBFC), 90133 Palermo, Italy
*
Author to whom correspondence should be addressed.
Water 2025, 17(23), 3387; https://doi.org/10.3390/w17233387
Submission received: 5 November 2025 / Revised: 21 November 2025 / Accepted: 26 November 2025 / Published: 27 November 2025
(This article belongs to the Section Water Erosion and Sediment Transport)

Abstract

The effect of rock cover on rainfall impact and hydrodynamic flow behavior is a topic that needs to be further explored. In this paper, the effects of rock fragments embedded (trapped in the topsoil layer) in clay soil on runoff and sediment yield under simulated rainfall are investigated. The experiments were performed on 0.25 m × 0.25 m sloping microplots with bare soil (control) or a surface covered by 35 embedded rock elements (rock). For each configuration, three rainfall intensities (260.2, 444.0, and 605.2 mm h−1), obtained by Kamphorst’s simulator, were tested, and the whole suspension was collected to determine runoff and sediment yield. The microplots were surveyed before and after the runs to obtain a Digital Elevation Model (DEM) and a DEM of Difference (DoD) and determine sediment yield. The obtained results demonstrated that both runoff and sediment yield (both measured from bowls and calculated from the DoD) increase with increasing rainfall intensity and rock percentage cover. For embedded elements, a higher rate of the sediments moving along the microplots reaches the downstream end of the microplot due to flow channelization. Finally, for the control condition, the erosive phenomena are concentrated under the nozzles, while for the rock configuration, they are also spread in the areas among the rock elements.

1. Introduction

Soil erosion is a remarkable environmental problem whose repercussions are often underrated, even though many field investigations [1,2,3,4] underline its relevance. Many previous investigations [5] have established that a rock fragment cover on the soil surface is able to reduce erosion processes in comparison with a bare soil surface. This reduction is attributed to the protective action of the soil surface from the impact of the rainfall. To explain the effects of rock fragment cover on runoff and soil loss, the element size, its geometry and concentration (percentage of covered area referred to the plot size or number of elements per unit of plot area), and soil properties (texture, organic matter, and water content) are the main variables to be considered. Poesen [6] also demonstrated that the position of rock fragments, distinguishing between elements resting on the soil surface or completely embedded in the top layer, can affect soils susceptible to surface sealing. The experiments by Poesen et al. [5] demonstrated that rock cover reduces runoff when the rock elements rest on the soil surface, while if the rock elements are well embedded in the topsoil, they reduce the infiltration rate and, as a consequence, enhance runoff. The differences between the two rock fragment positions, in terms of runoff, become more important for increasing values of the rock cover percentage. In particular, if the rock fragments are well embedded in the soil top layer, the increase in the rock element cover will increase the area of impermeabilized topsoil and the corresponding runoff.
Bunte and Poesen [7] concluded that an increment in rock cover from 0% to 20% determines an increment in sediment yield due to scouring phenomena localized around the individual rock fragments.
Zhang et al. [8] reviewed the available literature on rock fragments with reference to their effects on hydrological processes, highlighting the relevance of rock element architecture (coverage, size, position, and morphology). To protect soils from erosion processes, rock fragment coverage is also used as a mulching treatment, even if the results of the mulching effect on hydrological processes are considered inconsistent. In particular, Guo et al. [9] and Wang et al. [10] revealed a decrease in runoff and soil erosion for increasing values of rock coverage from 0 to 40%, whereas other studies [5,11] reported a negative relationship. For the rock elements resting on the soil surface, the increase of rock fragment coverage determines a reduction in runoff velocity, and the consequent decrease in detachment and transport flow capacity of flow produces a reduction in soil loss [12]. Previous studies have also demonstrated that rock element size affects the relationship between hydrological processes and rock coverage [13]. In particular, runoff is limited in the case of the smallest rock fragments because of flow tortuosity and its discontinuity.
Poesen et al. [12] summarized the following effects of rock fragments on soil erosion: (1) rock elements can protect soil from raindrop impact and flow detachment; (2) a rock cover is able to reduce the physical soil degradation of the underlying soil; and (3) when the rock elements are resting on the soil surface, the flow resistance of these elements produces a retardation of flow velocity [14].
Sun et al. [15] carried out some experimental runs using Cinnamon soil packed in a soil box arranged on a 17.6% slope, covered with five gravel fragment coverages (0, 10, 20, 30, and 40%), and subjected to three rainfall intensities (30, 60, and 90 mm h−1). The gravel elements, resting on the soil surface, were spread evenly on the soil surface. The measurements demonstrated that runoff and sediment yield significantly decreased with the increase in coverage percentage and were negatively correlated with rainfall intensity.
Opposing results were obtained for the effects of soil surface roughness on soil erosion [16]. The increase in soil surface roughness generally determines an increase in flow resistance [14,17,18] and a consequent decrease in flow velocity, leading to a reduction in the associated soil loss. This conclusion has been applied in many erosion models to estimate soil loss, such as USLE-based models [19,20] and the Watershed Erosion Prediction Project (WEPP) [14,21,22]. However, an increase in soil loss has also been detected on rougher surfaces and is attributed to flow concentration phenomena due to the motion around elements or along rills [16,23].
Gong et al. [23] highlighted that the pattern of rock elements in the soil crucially affects the hillslope hydrological processes and summarized the arrangements into three types: (1) below the soil surface, (2) embedded in the soil surface, and (3) covering the soil surface (resting on the soil surface). It is evident that erosion processes developing on a soil containing rock fragments first determine their exposure in the topsoil (embedding pattern), and finally, when the soil between the rock elements is eroded totally, rock fragments cover the soil surface. According to Gong et al. [23], the embedding pattern represents a transition status from conditions (1) to (3). These authors [23] performed a laboratory experiment on a clay loam soil embedded with rock fragments (rock fragment content ranging from 0 to 40%) and concluded that embedded-rock elements can accelerate soil erosion by changing the ratio between infiltration and runoff, surface roughness, and related hydraulic variables. The obtained results established that the mulching effect of rock cover is workable only for low slope gradients and rock fragment covers.
Li et al. [24] studied the effects of rock fragments resting on soils using a sloping flume (slope of 26.8%), a single rainfall intensity of 60 mm h−1, and a silty clay soil. Four rock fragment coverages (15, 30, 45, and 60%) and eight rock element sizes (0.7–36.6 cm) were used. The results showed that rock fragments resting on the soil surface reduce flow velocity and increase flow resistance.
Liu et al. [25] investigated the effect of gravel coverage on hydraulic variables by carrying out scouring experiments with ten different gravel coverages, four slope gradients, and nine flow discharges. The flow velocity decreased, and the Darcy–Weisbach friction factor increased with an increase in gravel coverage.
Table 1 summarizes the main results of the available literature investigations regarding the effects of both rock fragments embedded in or resting on the soil surface.
In conclusion, the analysis of the available literature revealed that (i) hydrological behavior is related to the two rock fragment arrangements (embedded or resting on the soil surface), and (ii) for rock elements resting on the soil surface, runoff and sediment yield significantly decreased with the increase in coverage percentage, while, for embedded elements, the opposite result was detected. However, the effects of rock cover on runoff and sediment yield should be further investigated to understand the interactions between the studied types of soils, rock fragment arrangements, and rainfall intensities.
The evolution of the soil surface under rainfall can be evaluated using a photogrammetric technique. Close-range photogrammetry, which obtains high-resolution images of the soil surface before and after rainfall events, allows for accurate and non-invasive measurement of the erosion processes. Moreover, in comparison with the traditional method of surveying the soil surface using local erosion depth measurements (e.g., pins), close-range photogrammetry allows for a continuous reconstruction of the soil surface. Detached soil particles are available to be transported by runoff and can also be deposited in downstream areas. Recent studies [26,27,28,29] have demonstrated the effectiveness of photogrammetry in quantifying soil surface changes due to erosion in small-scale features. Despite significant advancements in soil erosion research, the characterization of raindrop effects for plots covered by rock fragments under simulated rainfall remains poorly understood.
With reference to the framework of the rock element arrangements (below the soil surface, embedded in the soil surface, and covering the soil surface), this paper investigates the effects of rock fragments embedded in a clay soil on runoff and sediment yield under simulated rainfall at the plot scale through direct measurements and using close-range photogrammetry. This study aims to assess the literature results for the embedded arrangement for a clay soil using innovative measurement techniques. The specific aims of this investigation are to (1) compare runoff and sediment yield values obtained for plots with different rock cover percentages (0 and 16%) and (2) address how rock fragments affect hillslope hydrological processes.

2. Materials and Methods

2.1. Experimental Setup and Runs

The experimental runs were conducted on the experimental plot of the Department of Agriculture, Food, and Forest Science of the University of Palermo. The plot was filled with a clay soil (62% clay, 26.4% silt, and 11.6% sand) taken from the Sparacia experimental area (Sicily, Italy) [30]. Within the plot (7 m × 2 m), 18 microplots (0.25 m × 0.25 m, with a consequent microplot area, Ap, of 0.0625 m2) with a slope of 13% were placed.
The microplots were prepared to investigate two experimental configurations: bare soil (control) and a surface covered by 35 rock elements (rock). For each configuration, three rainfall intensities (low, intermediate, and high, as described below) were applied, and two replicates were performed. Therefore, two microplots for each pair configuration–rainfall intensity were tested (Table 2). Before the experimental runs, each microplot was prepared by compacting the soil surface using a concrete block to achieve the same soil bulk density across the microplots.
The rock elements were selected through a standardized sieving protocol. The sieving was conducted using mesh sizes corresponding to particle diameters between 9.5 mm and 19 mm, ensuring uniformity in size and minimizing variability in shape among the selected elements. For the rock configuration, 35 elements were distributed in seven rows of five elements each, following a staggered pattern (Figure 1b) to reach an intermediate rock coverage falling in the range 0–40% examined in the literature. The rock elements were manually embedded into the soil, assuring uniform insertion depth and orientation across all microplots. Before the experimental runs, the soil was wet until the ponding condition was reached.
The experimental runs were conducted under simulated rainfall using the Kamphorst rain simulator [31] (Figure 2). Using a constant water volume, the Kamphorst rainfall simulator enables the generation of different simulated rainfall intensities through adjustments to the pressure head. In fact, the Kamphorst simulator is characterized by a sprinkling head connected to a 2.3 L Mariotte bottle [31,32] (Figure 2). A plate with 49 glass capillaries (having a length of 10 ± 1 mm and a diameter of 0.6 ± 0.08 mm), which ensures a uniform rainfall distribution across microplots, is located at the base of the sprinkling head. Water starts (or stops) flowing from the capillaries after removing (or positioning) the cap on the top of the aeration tube, while the determination of different values of simulated rainfall intensity is made by moving the aeration tube upward or downward, causing a change in the pressure head, H, at the capillaries’ inlet section. For this simulator, H can be set varying from 1.9 cm to 11.9 cm. For low (≤5 cm) H values, since the lower edge of the aeration tube was deeper as compared with the plane passing through the bottom of the cylindrical reservoir of the sprinkler, the simulation lasted until the water level reached this plane. Conversely, for pressure head values in the range 5–12 cm, the simulation lasted until the water level reached the plane passing through the lower edge of the aeration tube. By doing so, the pressure head on the orifices remained stable during a simulation. This simulator is characterized by a drop-falling height of 0.4 m.
In the present study, three simulated rainfall intensities, Is (260.2, 444.0, and 605.2 mm h−1), were generated by H values equal to 1.9 cm, 3.9 cm, and 5.9 cm, respectively. These intensities were obtained by dividing the fixed water volume (2.3 L) by the time (measured by a chronometer) required for complete emptying of the Mariotte bottle. For clarity, in subsequent analyses, the simulated rainfall intensities were labeled as low (260.2 mm h−1), intermediate (444.0 mm h−1), or high (605.2 mm h−1). Of course, these values of rainfall intensities do not correspond to those of natural rainfalls with the same kinetic power. According to the formulation proposed by Carollo et al. [32], the kinetic power of rainfall, Pn (J m−2 s−1), is expressed as a function of the falling height, fh, and intensity of the simulated rainfall, Is (mm h−1), as follows:
P n = 2.5 10 4     f h   I s
Given that the falling height, fh, was held constant at 0.4 m, application of Equation (1) yielded kinetic power values of 0.25, 0.43, and 0.59 J m−2 s−1 corresponding to the low, intermediate, and high rainfall intensities, respectively.
Based on the calculated kinetic power values, the corresponding natural rainfall intensities, In, were derived using the empirical relationship proposed by Wischmeier and Smith [33], which enables the comparison of simulated rainfall events with natural rainfall conditions exhibiting equivalent energetic characteristics.
P n = I n 11.9 + 8.73 log I n
Accordingly, the simulated rainfall events used in this study correspond to natural rainfall intensities of 35.9, 57.3, and 75.2 mm h−1, respectively. A summary of the rainfall energy characterization and microplot configurations is presented in Table 2.
For each microplot, the whole suspension, made of runoff and sediment, generated during the rainfall simulation, was collected in a plastic bowl. The experimental runs were stopped when the Mariotte bottle was empty. After the experimental runs, the suspension collected in each bowl was weighed and subsequently oven-dried at 105 °C for 48 h to determine the soil dry weight, representing sediment yield, SY. The runoff weight, used to obtain the corresponding runoff volume, R, was calculated as the difference between the wet and dry weights.
For each experimental condition, defined by the combination of configuration (control and rock) and rainfall intensity (low, intermediate, or high), the mean runoff volume (L) and sediment yield (g) were determined by averaging the measurements obtained from the replicates.

2.2. Microplot Survey and 3D Model Analysis

Before and after each experimental run, microplots were surveyed using the close-range photogrammetry technique. Specifically, photogrammetric surveys were conducted using a mobile device equipped with a 24 MP (4284 × 5712) camera (iPhone 15; Apple Inc., Cupertino, CA, USA) featuring a fixed focal length of 5.96 mm. For each survey, approximately 30 images were acquired from a nadir perspective, maintaining an average object-to-camera distance of approximately 0.3 m. The camera was stabilized by using a Gimbal system (DJI Osmo Mobile SE, Shenzhen, China). The resulting mean ground sample distance (GSD), defined as the linear dimension of a pixel projected onto the ground surface [34], was approximately 0.12 mm.
Ground control points (GCPs) were established by marking black cross-targets at the four corners of each microplot (highlighted as yellow points in Figure 1). The spatial coordinates of each target center (x, y, and z) were measured using a tape for the horizontal axes (x and y) and a vernier caliper for the vertical axis (z).
The model generation workflow was conducted using Agisoft Metashape Professional (Agisoft LLC, St. Petersburg, Russia, https://www.agisoft.com). The photos were used as the primary input for generating three-dimensional point clouds, 2.5D surface models (commonly referred to as Digital Elevation Models (DEMs)), and orthophotos of the microplots. The 2.5D models provide a vertically projected representation of the surveyed area and were employed for subsequent analyses.
The 3D surface models were generated through an automated workflow integrating structure from motion (SfM) and multi-view stereo (MVS) techniques, as described by Di Stefano et al. [34].
A DEM was generated using the Agisoft Metashape Professional software (version 2.1.1; Agisoft LLC, St. Petersburg, Russia) by applying the inverse distance weighting (IDW) interpolation method to a dense 3D point cloud. Prior to DEM generation, photo alignment was performed to produce an unscaled sparse point cloud based on match points identified using the scale-invariant feature transform algorithm [35]. During this phase, GCPs were used to optimize camera orientation parameters and to georeference the sparse point cloud. Following photo alignment, the multi-view stereo (MVS) image-matching technique application allowed for the generation of a dense point cloud.
The resulting dense point cloud was used to generate both triangulated irregular network (TIN) and DEM surface models, following the procedures described by Di Stefano et al. [34] and Koci et al. [36]. Camera calibration settings were configured in Agisoft Metashape (version 2.1.1) using the self-calibration option and specifying a frame camera type. For each survey, a 2.5D surface model with a spatial resolution of 1 mm per pixel and an orthophoto with a pixel size corresponding to the ground sample distance (GSD) were produced from the 3D point cloud.
For each microplot, erosion processes were quantified by differencing the pre- and post-simulation DEMs using the Geomorphic Change Detection (GCD) 7.2 extension for ArcGIS [37]. The output was a raster file representing the DEM of Difference (DoD), in which negative values correspond to surface-lowering due to soil erosion. Additionally, the GCD tool incorporates uncertainty analysis through the application of the minimum level of detection (LoDmin), as described by Prosdocimi et al. [38], Smith and Vericat [39], and Wheaton et al. [37]. The LoDmin represents the threshold below which elevation changes are considered indistinguishable from measurement noise. It is calculated according to the methodology proposed by Smith and Vericat [39], as follows:
L o D m i n = t   R M S E Z   p r e s i m 2 + R M S E Z   p o s t s i m 2
where t is the critical Student’s t value for a given confidence interval, and RMSEZ pre−sim and RMSEZ post−sim are the root mean square errors associated with the z-coordinate (elevation) of the GCPs in the pre- and post-simulation DEMs, respectively. The RMSEZ values for both pre- and post-simulation DEMs ranged between 0.2 mm and 0.6 mm. A threshold confidence interval of 90% (t = 1.65), as suggested by Vinci et al. [40], was adopted for uncertainty analysis. Based on these parameters, the LoDmin was calculated to be 1 mm, below which elevation changes were considered statistically insignificant. Thus, microtopographic changes in the range ±1 mm were not considered in the developed analysis.
For each microplot, the volume of surface-lowering was calculated, and it was then multiplied by the soil bulk density (1120 kg m−3), obtaining the soil weight lost from the lowering areas. Theoretically, the estimated weight corresponding to lowering should correspond to the soil loss. However, since the formation of the craters and the presence of rock fragments determined deposition phenomena, it is more correct to refer to sediment yield.
To understand the sediment delivery dynamics, the values of sediment yield, SY (dry soil weight measured from the bowl), and sediment yield obtained from the DoD, SYDoD (g), were used to calculate the sediment delivery ratio, SDR, as follows:
S D R = S Y / A p S Y D o D / A e
where Ap is the microplot area, and Ae is the investigated portion of the microplot. The mathematical shape of Equation (4) also allows for the calculation of the SDR value if the area for which SYDoD is calculated is smaller than the microplot area. This choice is due to the fact that the experimental runs using this type of rainfall simulator over a microplot (i.e., small spatial scale) could be affected by disturbances in runoff and sediment dynamics determined by the microplot boundaries. Of course, if the SYDoD value is determined for the entire microplot, Ae is equal to Ap.
Gravel surfaces were determined using a methodology based on RGB orthophotography analysis derived from each survey. Given the distinct color of gravel, typically exhibiting a gray to whitish hue in contrast to the surrounding brown soil, an unsupervised classification approach was employed using the ArcGIS Pro 3.5 software (ESRI, Redlands, CA, USA) [41]. The ISO Cluster tool was first applied to identify groupings, followed by the Maximum Likelihood Classification algorithm to generate a binary raster dataset comprising two classes: Class 1, corresponding to gravel surfaces, and Class 2, corresponding to bare soil. Subsequently, Class 1 raster pixels were converted into polygon features, each representing one or more contiguous pixels. These polygons were used to spatially define and quantify the extent of gravel-covered areas. The rock fragment percentage cover, obtained by the ratio between the area covered by rock fragments and the total area, was equal to 16% for the configuration with 35 rock fragments. This value represents an intermediate value falling within the range (0–40%) generally investigated in the literature.

3. Results

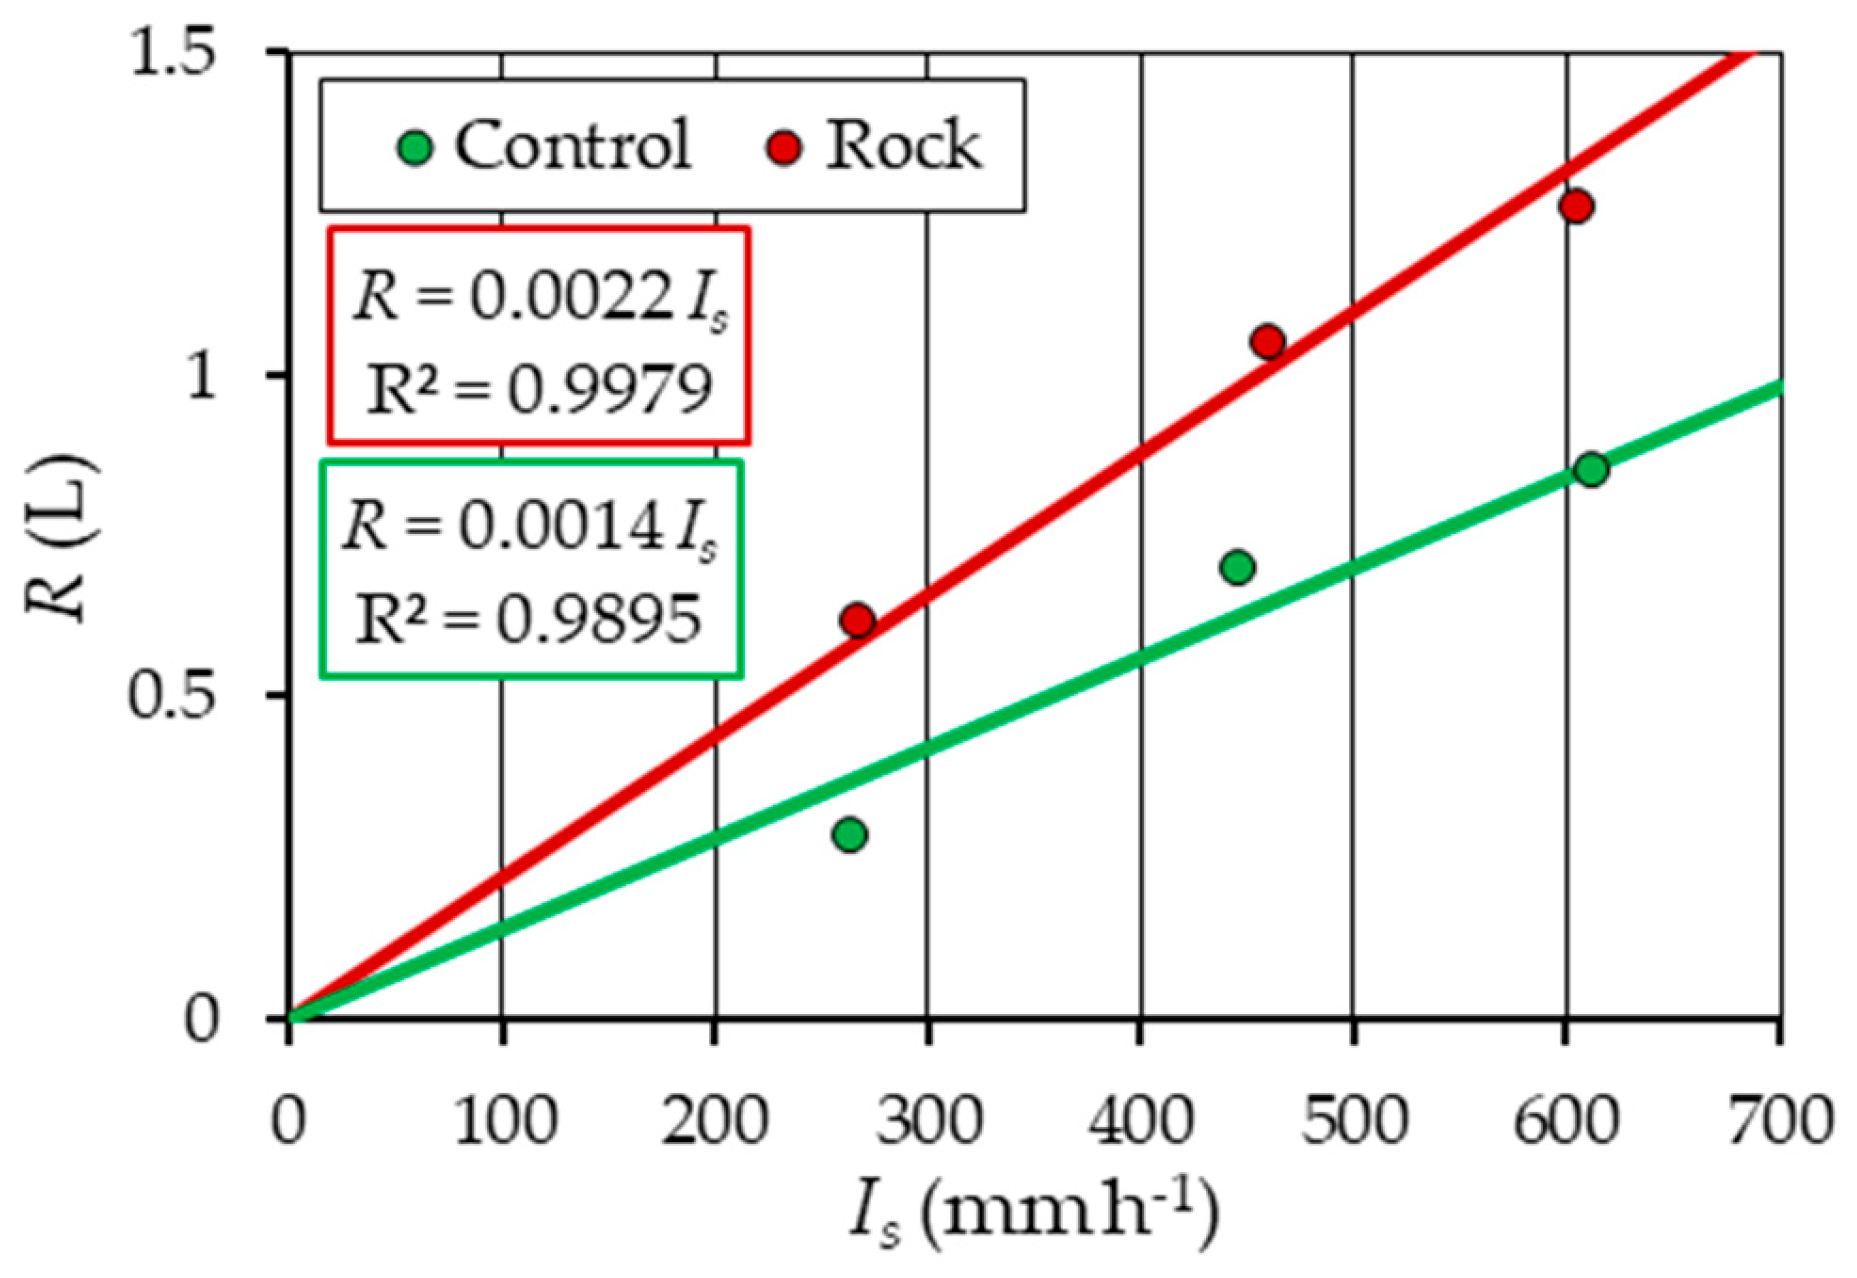
At first, the effects of both rock coverage and rainfall intensity on runoff were investigated (Figure 3). In particular, as expected, for fixed surface conditions, runoff values increased with increasing rainfall intensities. The relationship between runoff and rainfall intensity is characterized by a coefficient of determination, R2, of 0.9895 for the control condition and 0.9979 for the rock configuration. These linear relationships are statistically significant for a significance level of 0.05, according to the F-Fisher test.
Moreover, for all the investigated rainfall intensities, the control condition is, on average, characterized by the lowest values of runoff. In other words, the presence of embedded rock elements increased runoff.
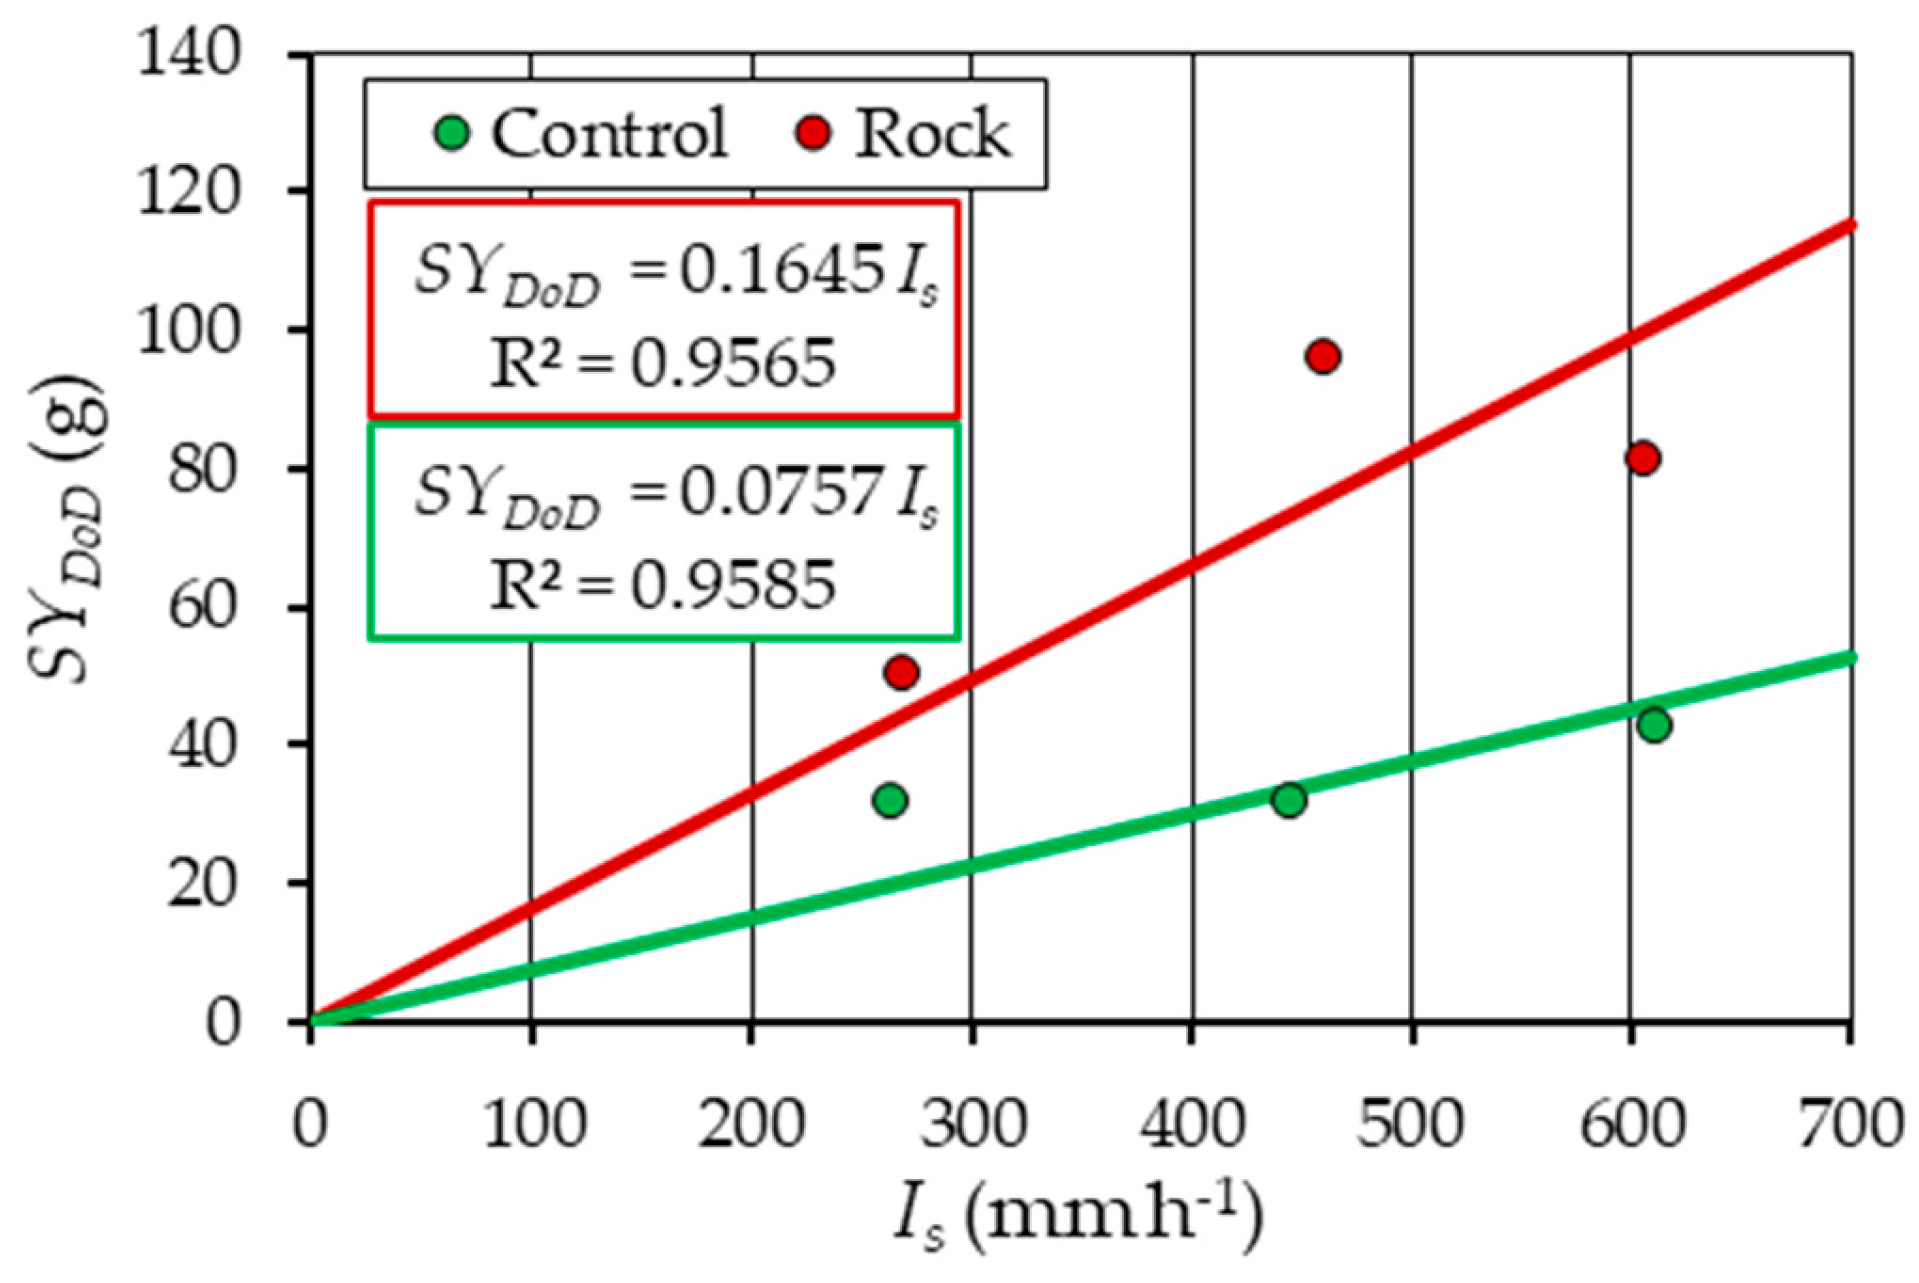
The sediment yield, SY, analysis, shown in Figure 4, revealed a consistent pattern of increasing erosion with both rock coverage and rainfall intensity. Also, these linear relationships are statistically significant for a significance level of 0.05, according to the F-Fisher test.
In fact, for fixed surface conditions, the sediment yield values also increased with rainfall intensity. Furthermore, for each rainfall intensity, the highest sediment yield values were obtained for the “rock” condition, while the lowest ones were for the “control” condition. These findings indicate that both runoff volume, R, and sediment yield, SY, are correlated with rock coverage.
The analysis performed on sediment yield values, SYDoD (Figure 5), obtained from the DoD analysis, confirmed the trend observed for the sediment yield, SY. Also in this case, for a significance level of 0.05, the linear relationships are statistically significant according to the F-Fisher test.
In this case, SYDoD values increase with increasing rainfall intensities, and the mean values obtained for the configuration characterized by the presence of rock fragments are systematically higher than those obtained for the control runs.
Figure 6 shows the relationship between the values of sediment yield obtained by the direct measurement (bowl), SY, and those obtained from the DoD analysis, SYDoD. The red (rock) and green (control) lines shown in this figure demonstrate that the relationship between these two variables depends on the examined configuration. In fact, the slope coefficients, which represent the mean sediment delivery ratios, SDR, of the two configurations, are different. In particular, for fixed sediment yield obtained from the DoD analysis SYDoD, the rock configuration is, on average, characterized by higher sediment yield values observed in the bowls.
Figure 7 shows the relationship between the SDR values and rainfall intensities. For both the investigated configurations, the sediment delivery grows with increasing rainfall intensities. Moreover, for comparable values of rainfall intensity, the rock configuration is characterized by slightly higher SDR values. However, the slope coefficients (0.0013 and 0.001) of the two relationships are not statistically different.
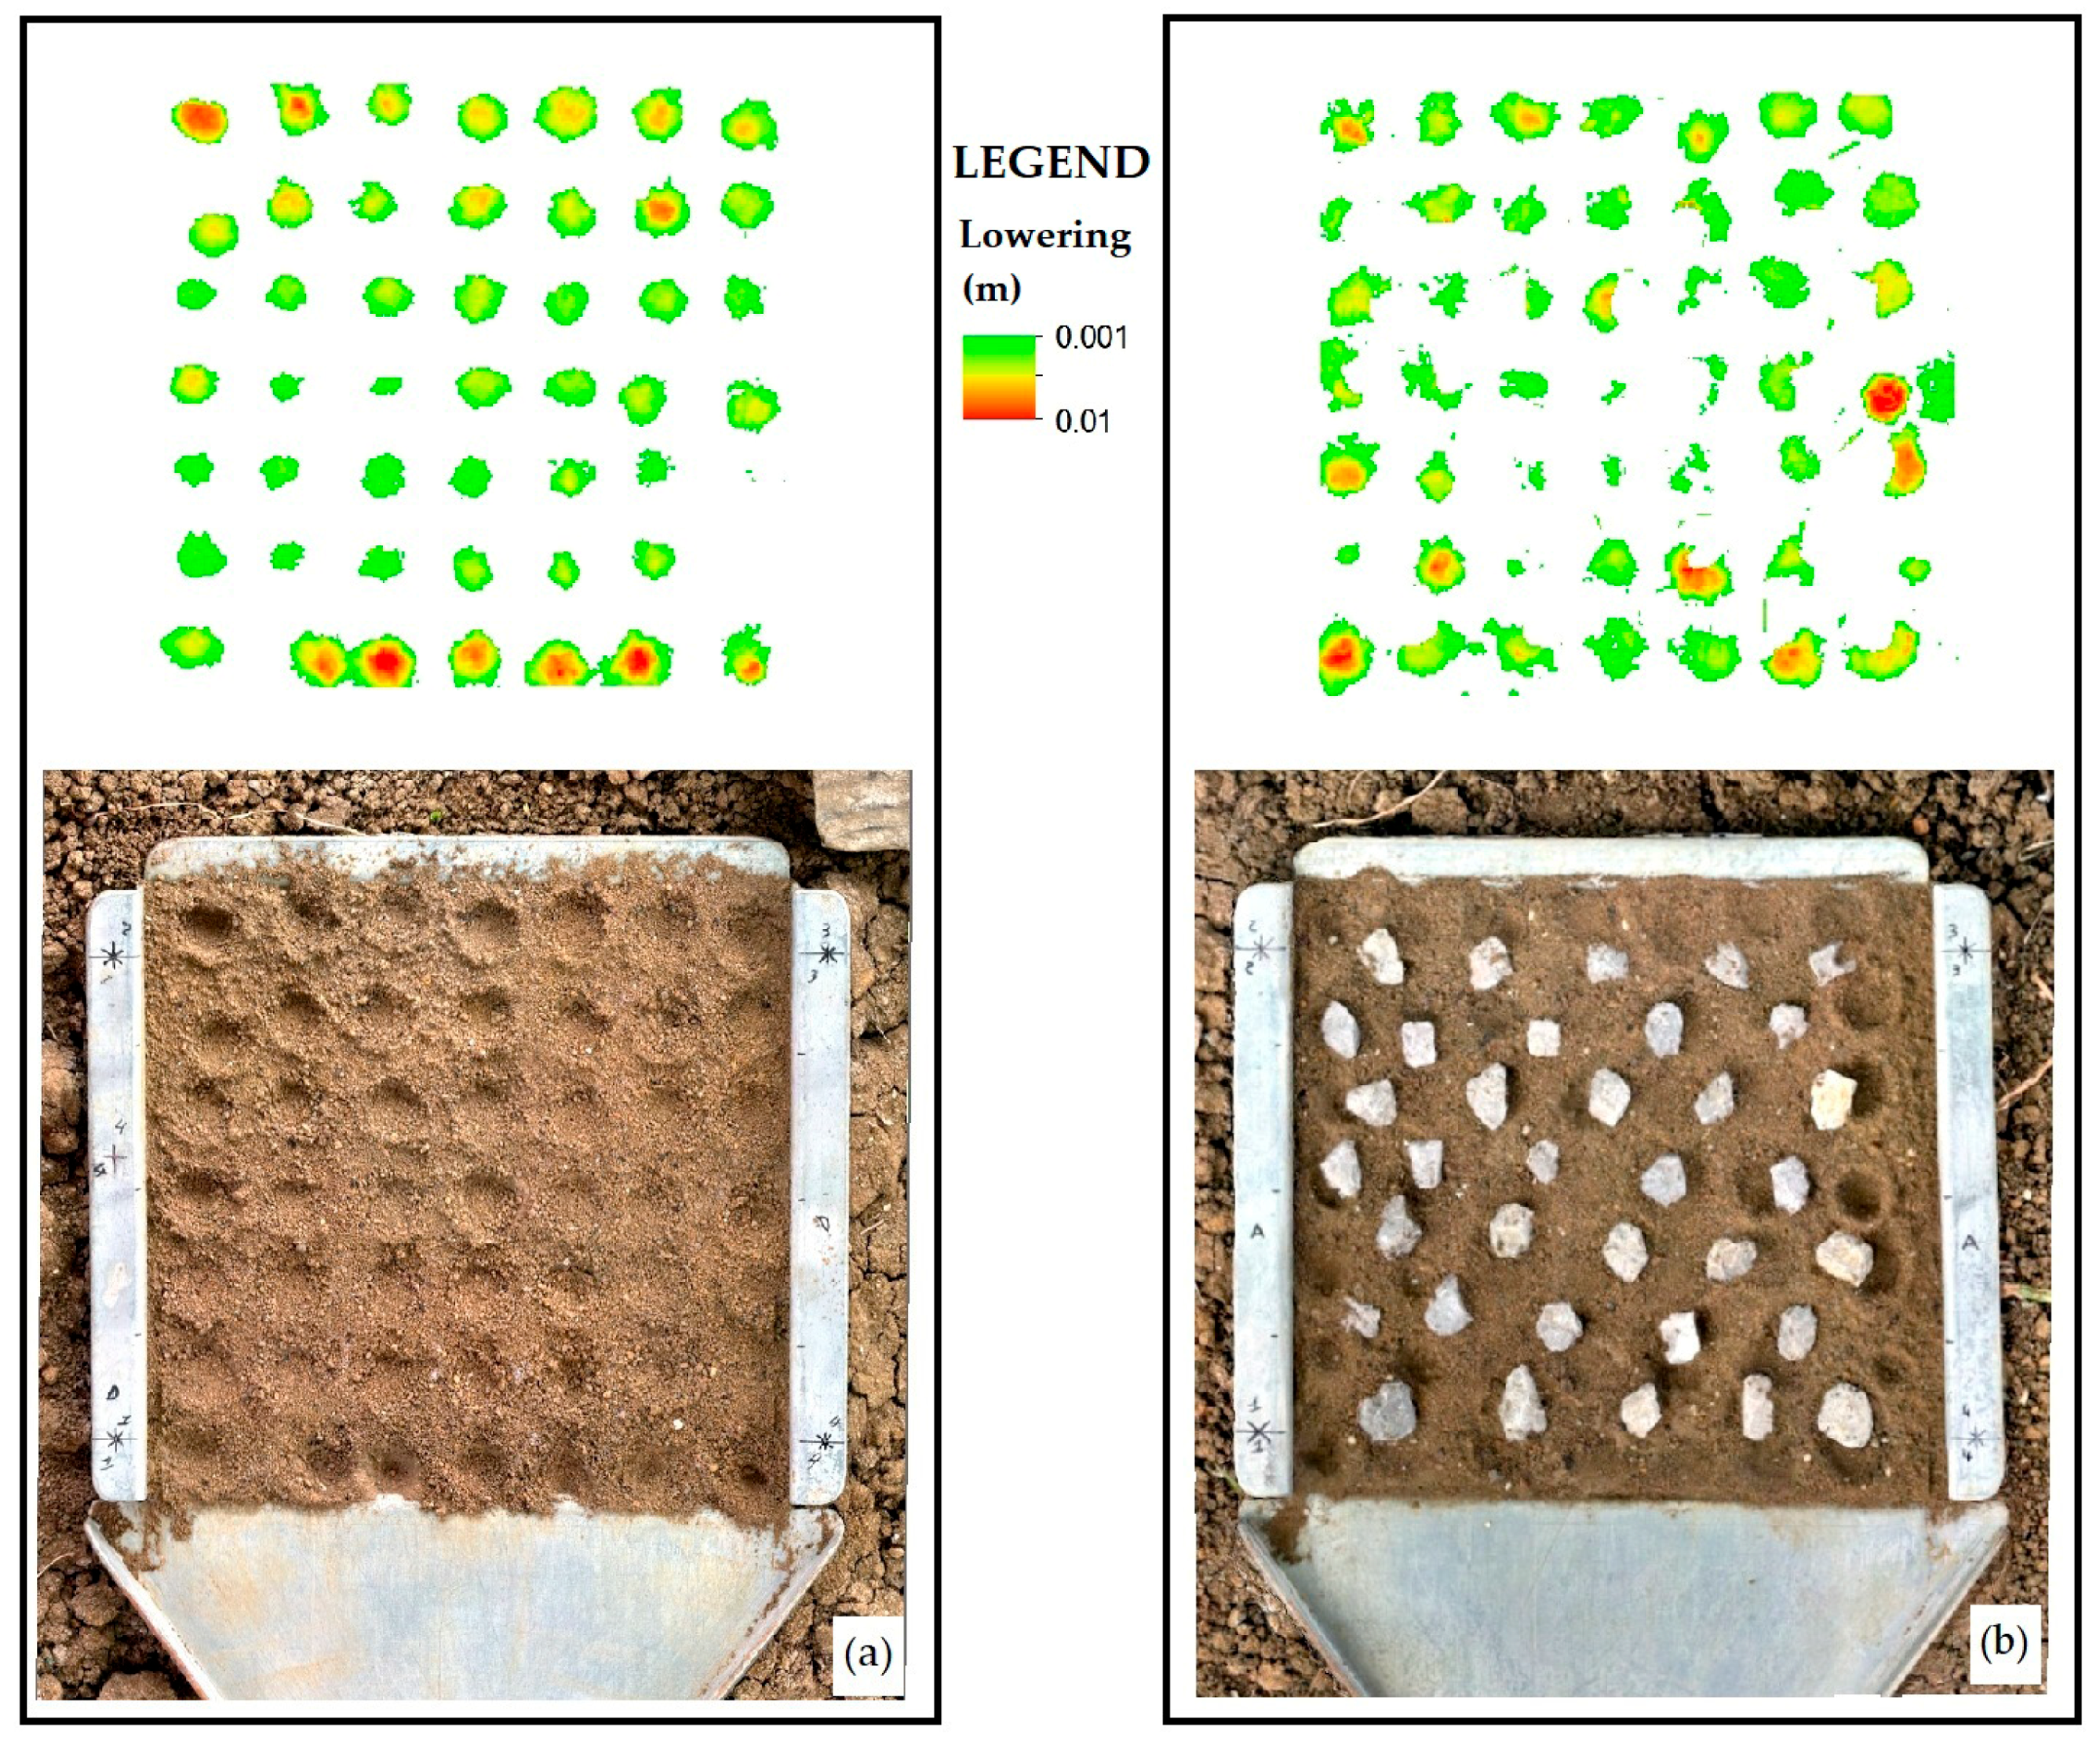
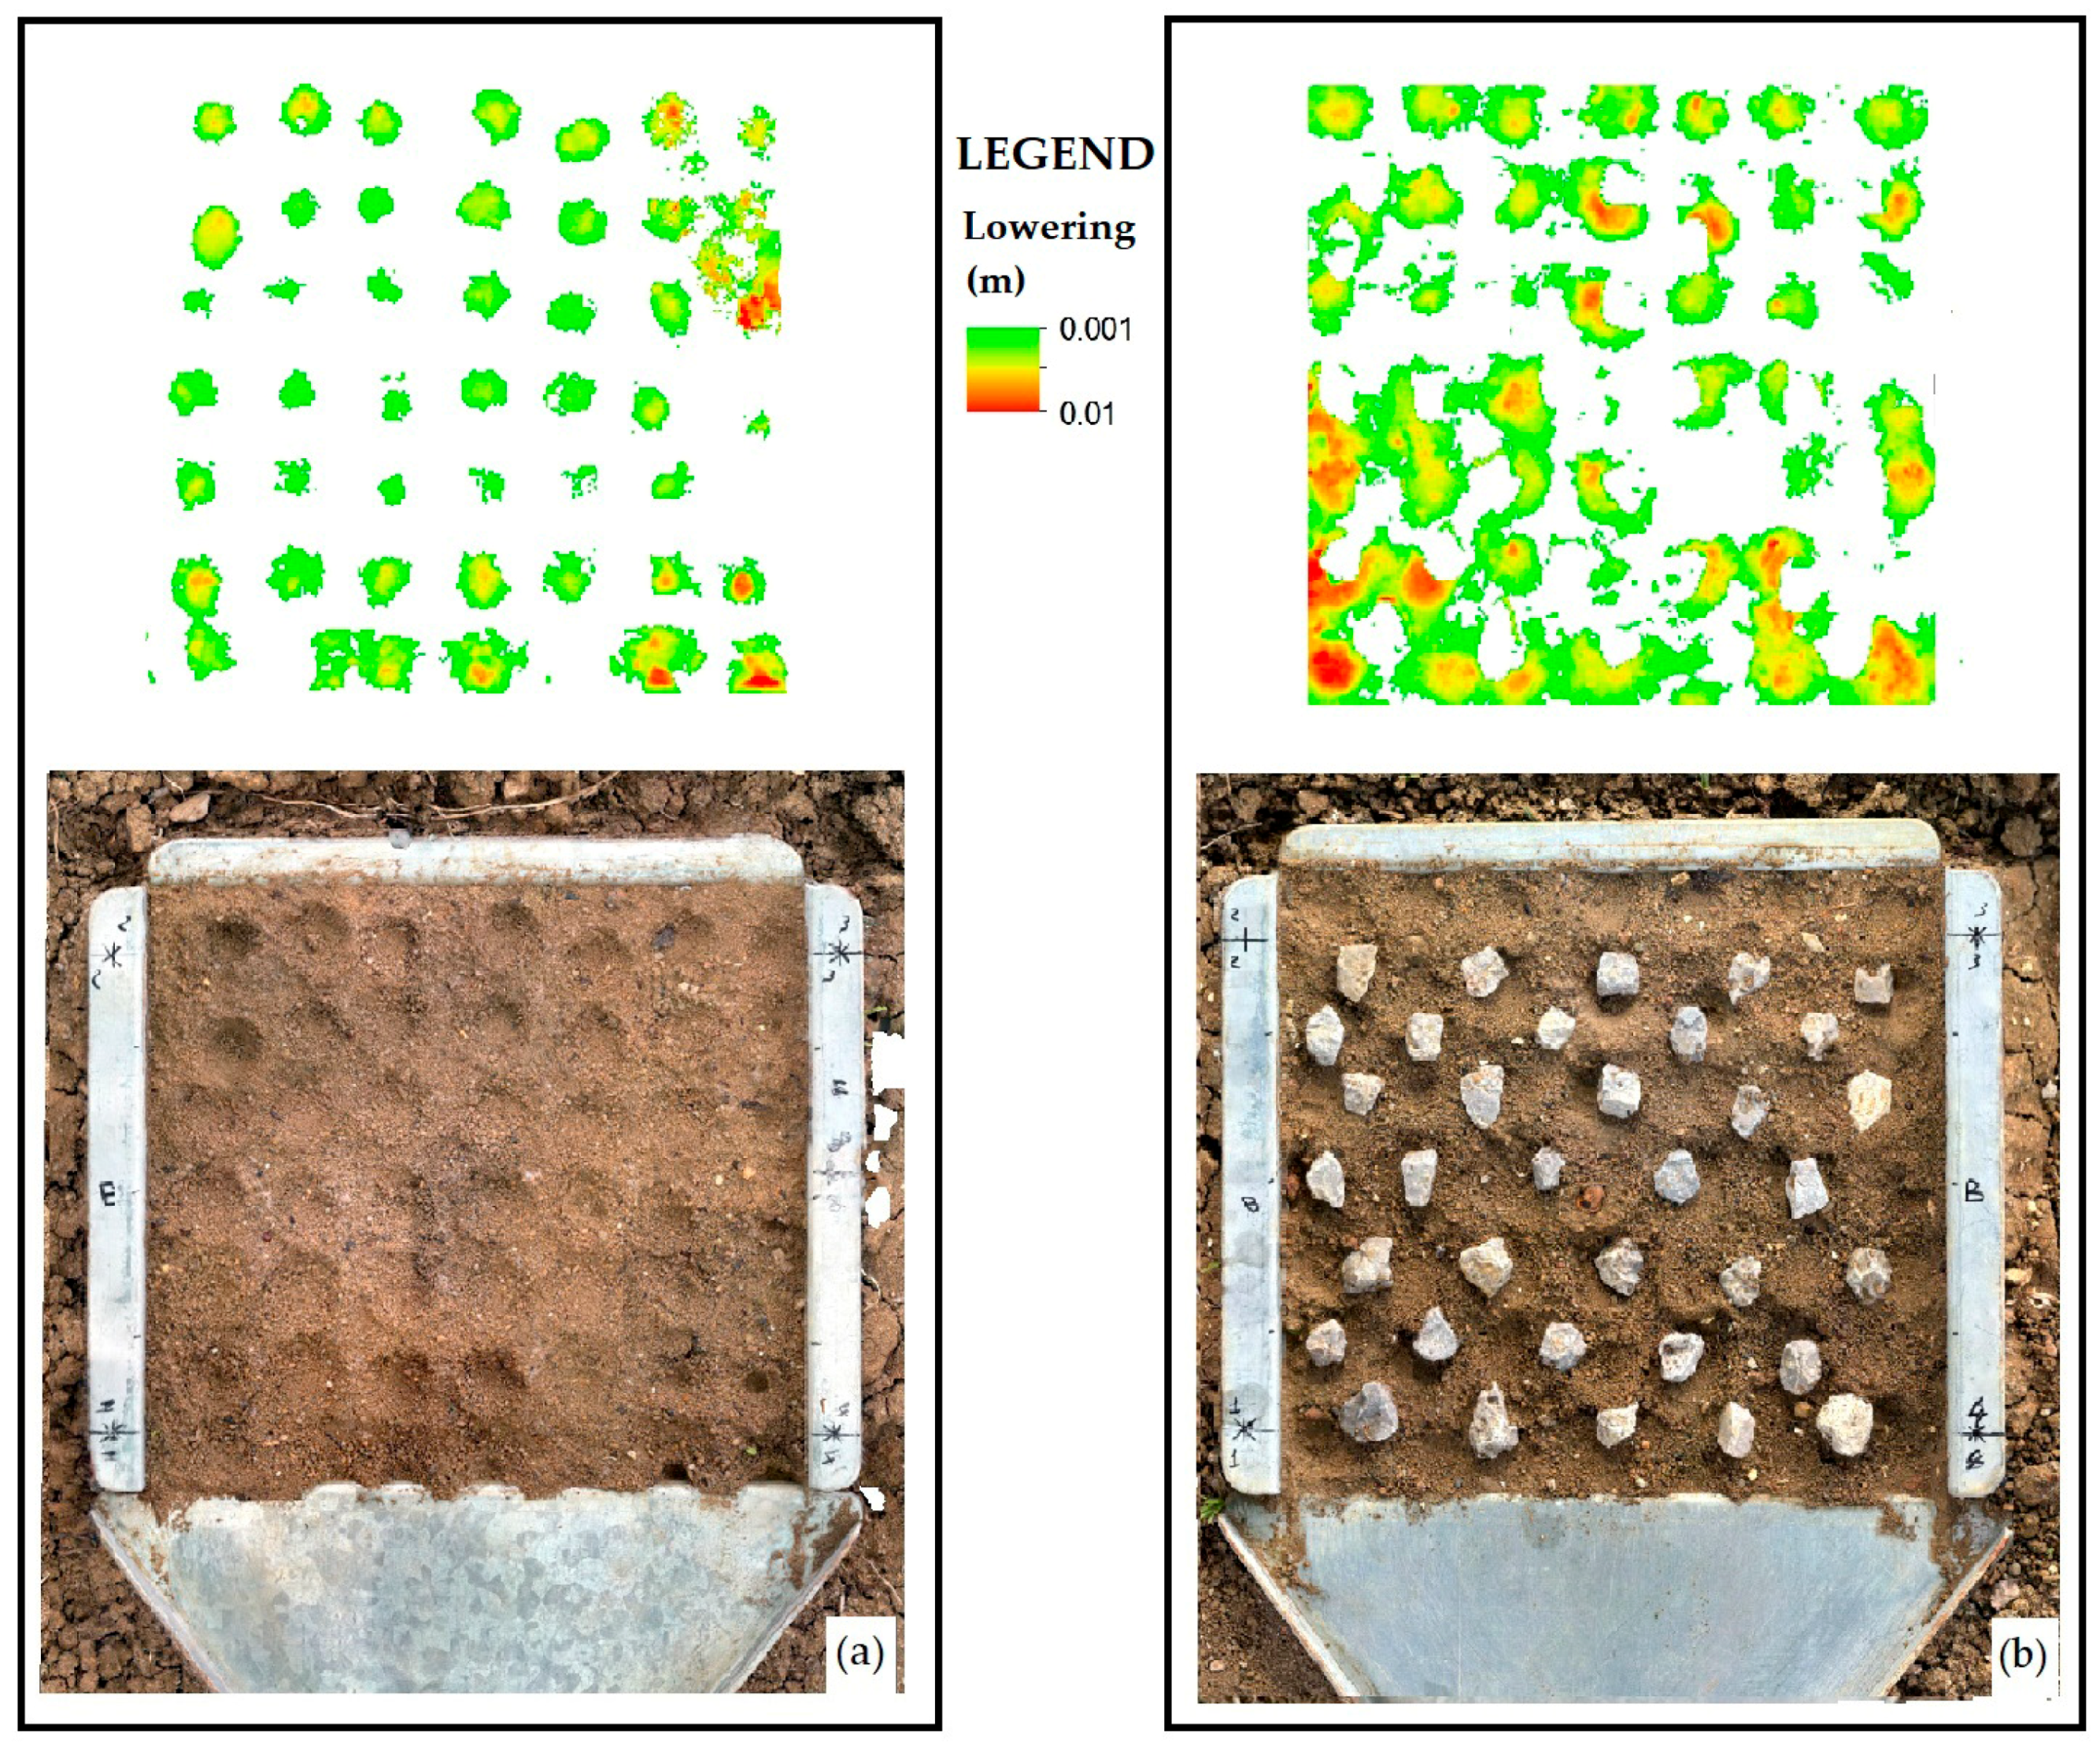
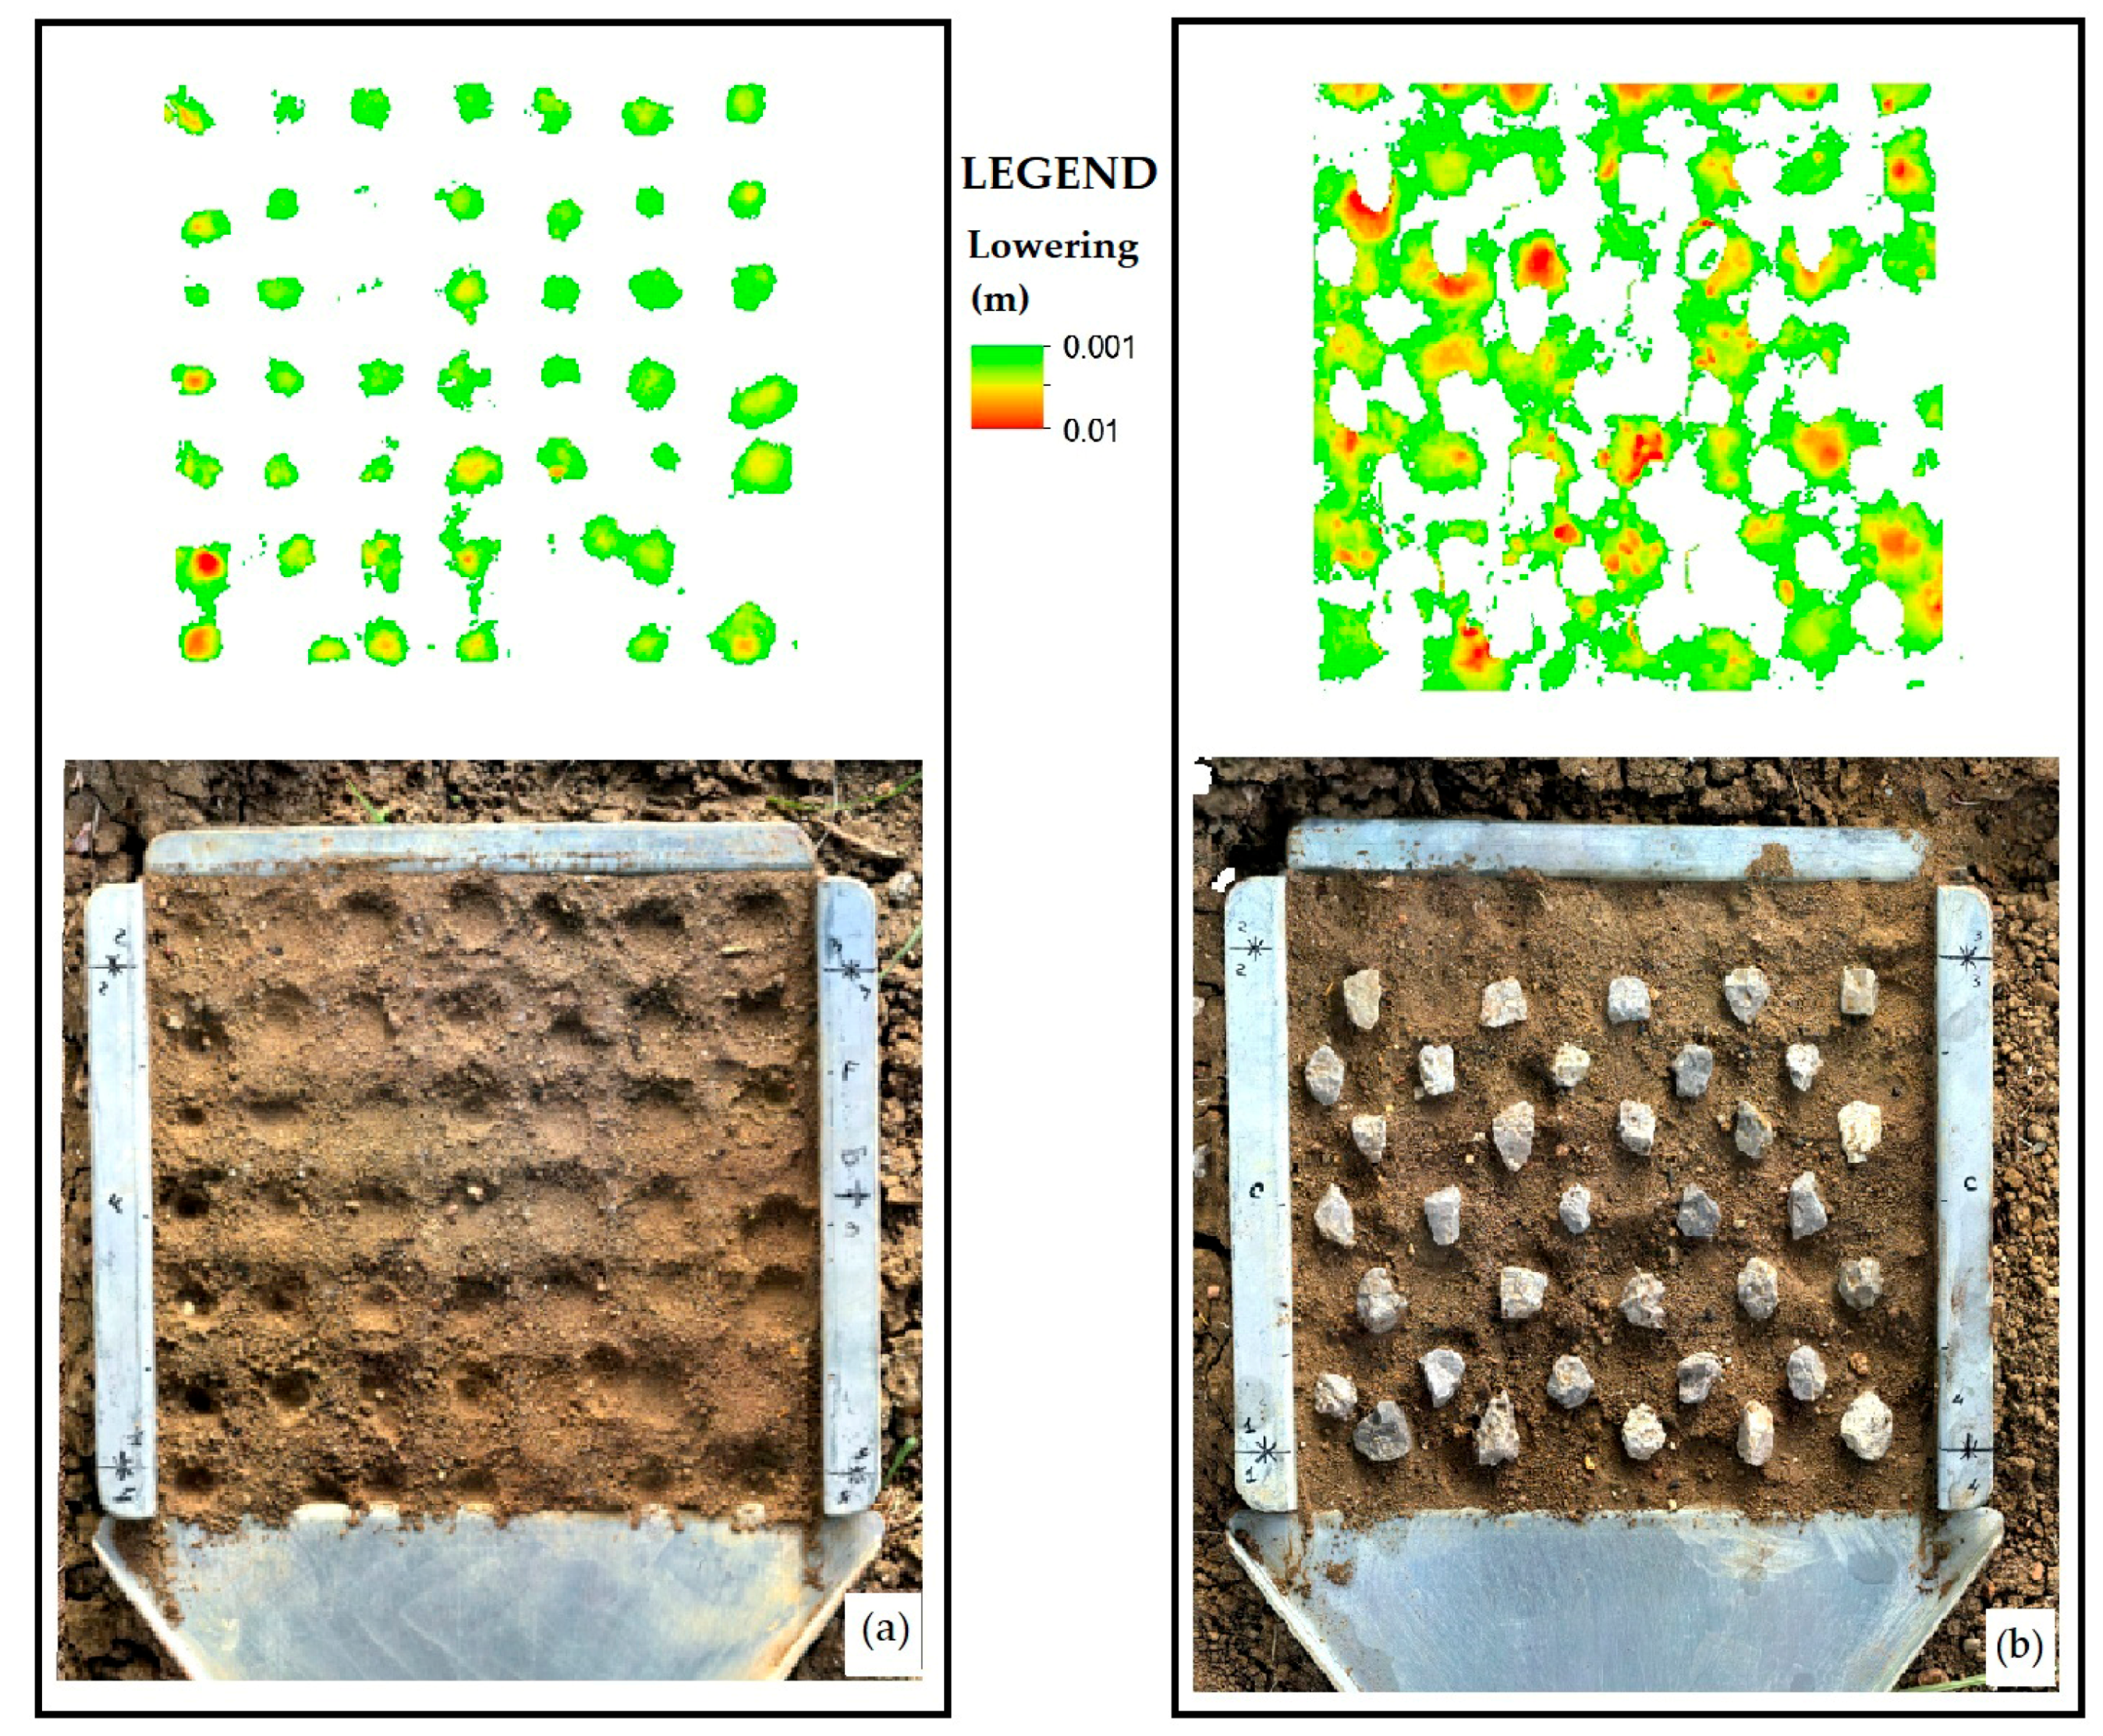
For low rainfall intensities (Figure 8), the DoD analysis revealed that scouring phenomena are mainly localized in correspondence to the craters formed under the simulator nozzles. This result is evident especially for the control runs, while the runs for the rock configuration have some incipient scouring areas outside the craters. This difference between the control configuration and the rock configuration is more evident for the runs under intermediate rainfall intensity (Figure 9), for which the scouring phenomena of the control configuration exactly correspond to the nozzles, while, for the rock configuration, the scours are much more widespread along the microplot. For high rainfall intensities (Figure 10), the same behavior observed for intermediate rainfall intensities is found, with even more widespread scours along the microplot for the rock runs.
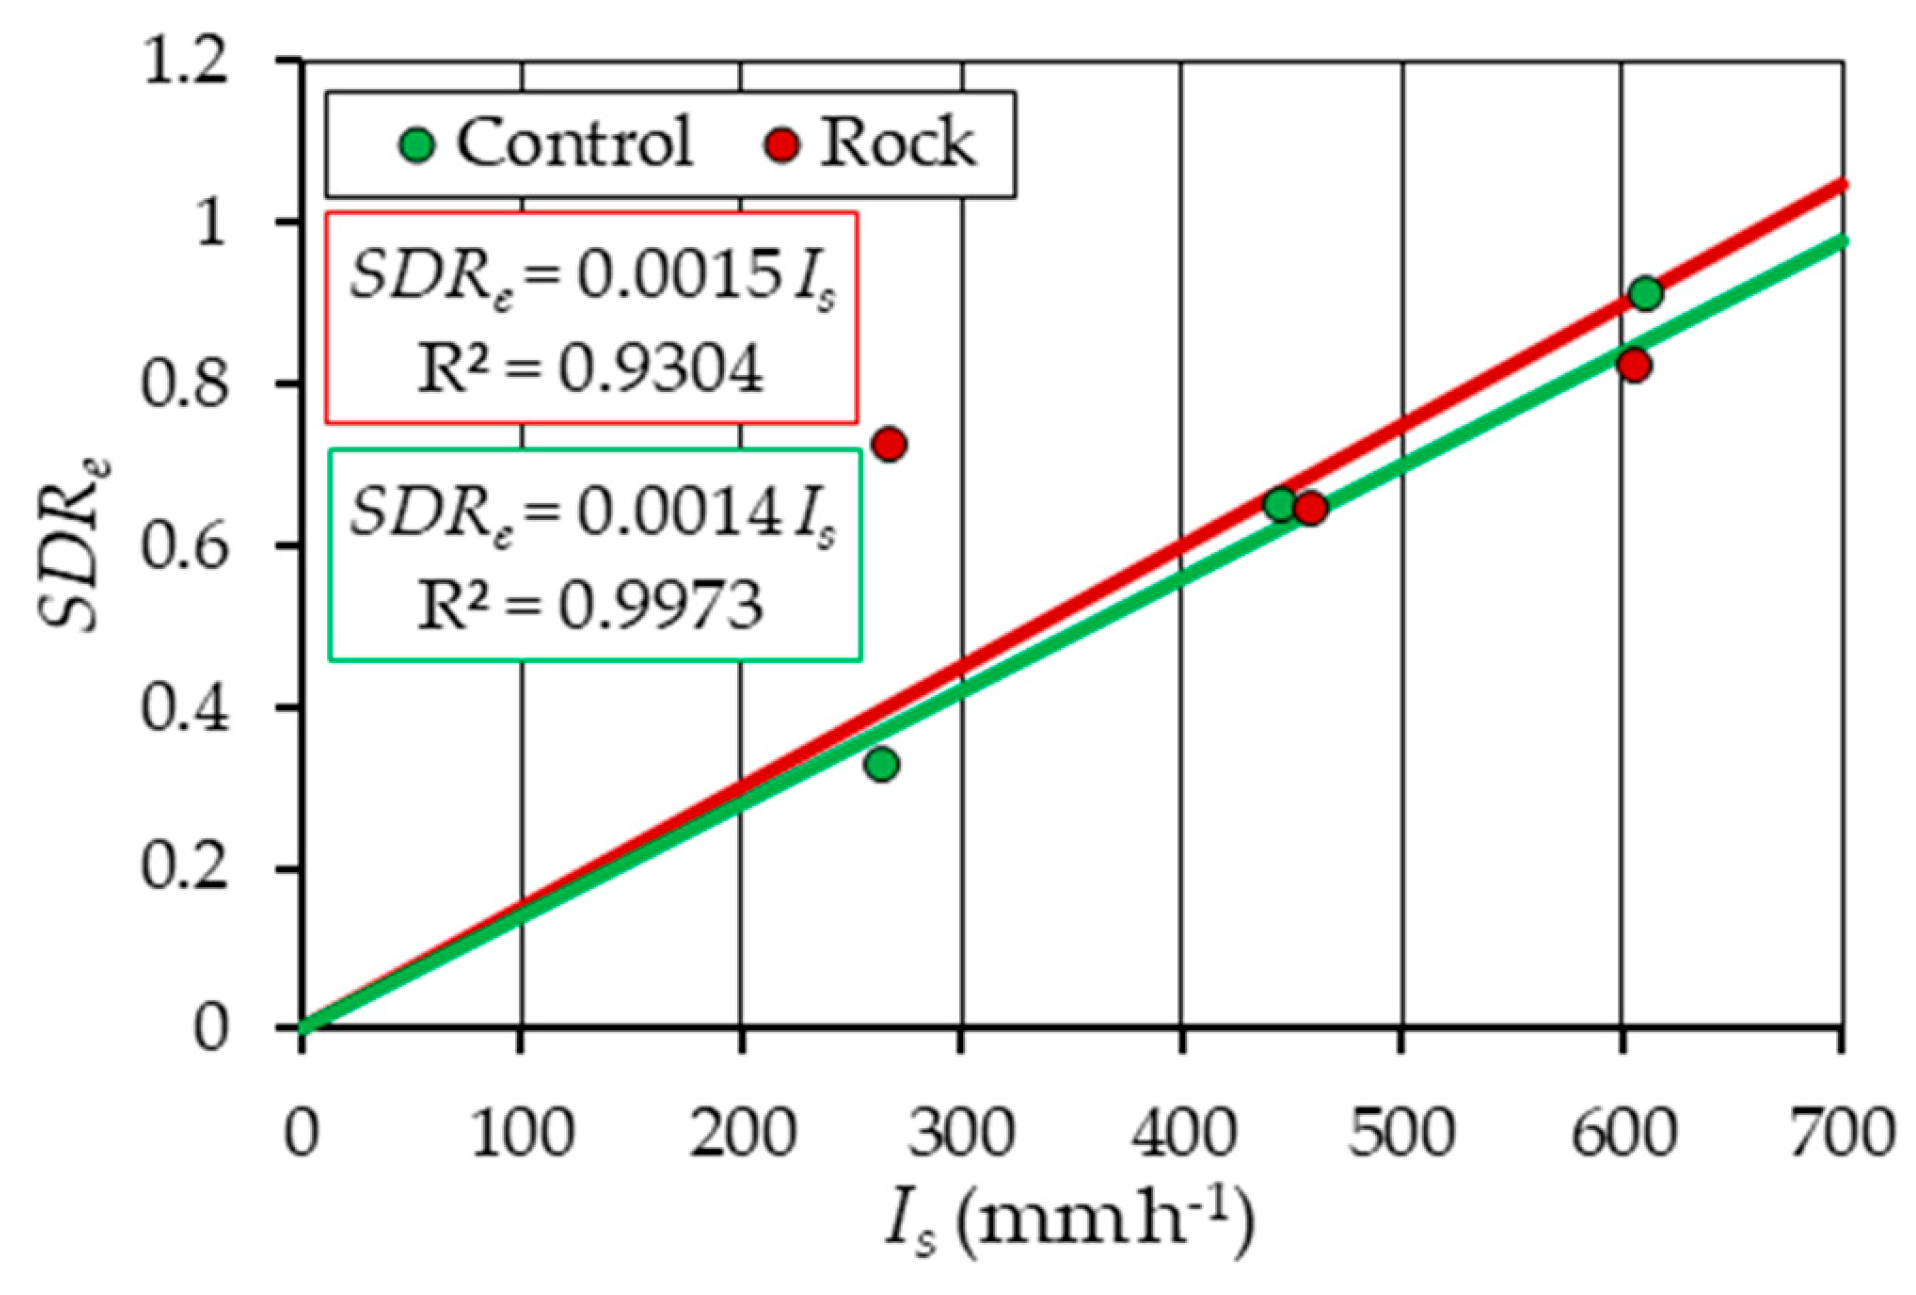
From the reported examples of the DoD analysis (Figure 8, Figure 9 and Figure 10), it is evident that, for the rock configuration, the flow channelization is more pronounced for increasing rainfall intensity. Moreover, these figures highlight that the effects of microplot boundaries on erosion processes are significant. For this reason, the SDR values were recalculated considering a reduced microplot area (0.2 m × 0.2 m, with a consequent Ae = 0.04 m2), which excludes the areas corresponding to the perimetral craters (i.e., areas close to the microplot boundaries). Figure 11 shows the relationship between the SDR values calculated by Equation (4) for Ae = 0.04 m2, SDRe, and the rainfall intensity. This figure highlights that, also excluding the boundary effects, both configurations are characterized by comparable slope coefficients (0.0015 and 0.0014) of the relationship between these two variables. In other words, as also shown in Figure 7, the differences between the configurations are not statistically different.

4. Discussion

The results of this study (Figure 3) demonstrate that runoff increased due to the presence of embedded rock elements. This result agrees with that obtained by Poesen et al. [5], who found that embedded rock elements decrease infiltration and favor runoff. The findings in terms of sediment yield (both measured from the bowls and calculated from the DoD) (Figure 4 and Figure 5) agree with those reported by Bunte and Poesen [7], who found that sediment yield increases for increasing rock coverage, and Gong et al. [23], who reported that rock cover can increase soil erosion. Instead, the analyses shown in Figure 3, Figure 4 and Figure 5 disagree with the results reported in several studies available in the literature [9,10,12,15]. In fact, these studies [9,10,12,15] reported that both runoff and sediment yield decreased with increasing rock cover. Furthermore, the increasing relationships of both runoff (Figure 3) and sediment yield (Figure 4 and Figure 5) with rainfall intensity contrast with the decreasing trend reported in the study by Sun et al. [15]. It is worth noting that the results [5,7,23] in agreement with those of this study were all obtained for embedded rock fragments. Conversely, all the contrasting results [9,10,12,15] were obtained for rock elements resting on the soil surface. From the literature results and the findings of this study, it can be confirmed that the rock fragment arrangement (i.e., embedded or resting on the soil surface) is a driving factor of soil erosion processes. In fact, for embedded rock elements, the surface of contact between rock elements and soil is much greater than that for elements resting on the soil surface. Thus, for a fixed investigated area and number of rock elements, for the embedded arrangement, the non-erodible surface increases and the flow tends to channelize, according to the preferential flow path, to avoid the rock elements. An increase in overland flow velocity [14,17]—due to flow contraction between the rock fragments—and sediment transport capacity determine higher erosion rates. The latter determines an increase in erosion processes, as observed in the present study. Conversely, the rock elements resting on the soil surface are characterized by a reduced area of rock–soil contact, and, as demonstrated in the literature [5], the top layer underneath rock fragments resting on the soil is characterized by vesicles, where an increased infiltration into the unsealed soil surface under the rock fragments occurs, provided that they are not completely embedded in the top layer.
Figure 6 demonstrates that the sediment yield measured in the bowl (SY) is lower than that calculated by the DoD (SYDoD). This result can be explained considering that most of the transported sediments can fill the craters and deposit in the areas located among the rock fragments. Therefore, this rate of transported sediment does not reach the downstream end of the microplot. However, the sediment delivery for the rock configuration (mean sediment delivery ratio equal to the slope coefficient, 0.5843) is more efficient than that of the control condition. This result is confirmed by the analysis shown in Figure 7, which shows that, for fixed rainfall intensity, the SDR values of the rock configuration are slightly higher than those of the control one. In other words, for the rock configuration, a higher rate of the sediments moving along the microplots (SYDoD) is able to reach the downstream end of the microplot (SY). This result can be explained by the fact that the embedded rock fragments cause flow channelization, and the erosive phenomena are not only concentrated under the nozzles, as observed for the control condition (Figure 8a, Figure 9a and Figure 10a), but they are also spread in the areas among the rock elements (Figure 8b, Figure 9b and Figure 10b). The discrepancies between control and rock configurations increase with rainfall intensity due to increased runoff. However, for the control condition, an increase in runoff determines only a marginal increase in sediment yield (Figure 4 and Figure 5), as the overland flow (spread all over the microplot) has a limited increase in sediment transport capacity. Instead, for the rock configuration, the increase in runoff determines a more significant increase in the sediment transport capacity of the channelized flow.
Furthermore, the comparison between the results shown in Figure 7 and Figure 11 demonstrates that the boundary effects do not influence differences in results obtained for the two examined configurations.
Finally, this study confirmed that the rock fragments embedded in the soil surface also determine an increase in runoff and erosion phenomena for the investigated experimental conditions. The results should be tested, adding further rock element coverages and exploring flow behavior with rock elements resting on the soil surface for the same experimental conditions (slope, soil texture, and rainfall intensities).

5. Conclusions

In this study, the effects of rock fragments embedded in clay soil on runoff, sediment yield, and soil loss under simulated rainfall were investigated. The obtained results demonstrated that both runoff and sediment yield (both measured from bowls and calculated from the DoD) increase with increasing rainfall intensity and rock cover. This result agrees with the findings reported in the literature for embedded rock elements, while it is the opposite of those obtained for elements resting on the soil surface. These differences are due to the different interactions between flow and rock elements that determine discrepancies in infiltration, runoff, and erosion phenomena. The developed analysis demonstrates that, for the rock configuration, a higher rate of the sediments moving along the microplots reaches the downstream end of the microplot due to an increase in sediment transport capacity determined by flow channelization. The results also point out that the control condition is characterized by erosion phenomena concentrated under the nozzles, while the rock configuration shows erosion spots that are spread in the areas among the rock elements. Finally, the findings of this study can be expanded by testing further rock element coverages and exploring flow behavior with rock elements resting on the soil surface for the same experimental conditions (slope, soil texture, and rainfall intensities).
Considering the obtained results, it can be concluded that, for practical purposes, the use of embedded rock fragments is not a useful soil conservation practice. Moreover, for a natural soil characterized by a remarkable gravel content, soil erosion processes can partially expose these elements, demonstrating a soil surface with embedded rock fragments that enhances runoff and soil loss values.

Author Contributions

Conceptualization, V.P., G.G., A.L., A.N., and V.F.; methodology, V.P., G.G., A.L., A.N., and V.F.; software, V.P., G.G., A.L., A.N., and V.F.; formal analysis, V.P., G.G., A.L., A.N., and V.F.; investigation, V.P., G.G., A.L., A.N., and V.F.; data curation, V.P., G.G., A.L., A.N., and V.F.; writing—original draft preparation, V.P., G.G., A.L., A.N., and V.F.; writing—review and editing, V.P., G.G., A.L., A.N., and V.F.; visualization, V.P., G.G., A.L., A.N., and V.F.; supervision, V.F.; All authors have read and agreed to the published version of the manuscript.

Funding

This research was funded under the National Recovery and Resilience Plan (NRRP), Mission 4, Component 2, Investment 1.4-Call for tender No. 3138 of 16 December 2021, rectified by Decree n. 3175 of 18 December 2021 of the Italian Ministry of University and Research, funded by the European Union–NextGenerationEU Project Code CN_00000033, Concession Decree No. 1034 of 17 June 2022, adopted by the Italian Ministry of University and Research, CUP B73C22000790001, Project Title “National Biodiversity Future Center-NBFC”.

Data Availability Statement

The raw data supporting the conclusions of this article will be made available by the authors upon request.

Conflicts of Interest

The authors declare no conflicts of interest.

References

  1. Panagos, P.; Ballabio, C.; Poesen, J.; Lugato, E.; Scarpa, S.; Montanarella, L.; Borrelli, P. A soil erosion indicator for supporting agricultural, environmental and climate policies in the European Union. Remote Sens. 2020, 12, 1365. [Google Scholar] [CrossRef]
  2. Kuhn, N.J.; Greenwood, P.; Fister, W. Use of field experiments in soil erosion research. In Developments in Earth Surface Processes; Elsevier: Amsterdam, The Netherlands, 2014; Volume 18, pp. 175–200. [Google Scholar]
  3. Carollo, F.G.; Di Stefano, C.; Nicosia, A.; Palmeri, V.; Pampalone, V.; Ferro, V. A new strategy to assure compliance with soil loss tolerance at a regional scale. CATENA 2023, 223, 106945. [Google Scholar] [CrossRef]
  4. Di Stefano, C.; Nicosia, A.; Palmeri, V.; Pampalone, V.; Ferro, V. Rill flow resistance law under sediment transport. J. Soils Sediments 2022, 22, 334–347. [Google Scholar] [CrossRef]
  5. Poesen, J.; Ingelmo-Sanchez, F.; Mucher, H. The hydrological response of soil surfaces to rainfall as affected by cover and position of rock fragments in the top layer. Earth Surf. Process. Landf. 1990, 15, 653–671. [Google Scholar] [CrossRef]
  6. Poesen, J. Surface sealing as influenced by slope angle and position of simulated stones in the top layer of loose sediments. Earth Surf. Process. Landf. 1986, 11, 1–10. [Google Scholar] [CrossRef]
  7. Bunte, K.; Poesen, J. Effects of rock fragment covers on erosion and transport of noncohesive sediment by shallow overland flow. Water Resour. Res. 1993, 29, 1415–1424. [Google Scholar] [CrossRef]
  8. Zhang, Y.; Zhang, M.; Niu, J.; Li, H.; Xiao, R.; Zheng, H.; Bech, J. Rock fragments and soil hydrological processes: Significance and progress. CATENA 2016, 147, 153–166. [Google Scholar] [CrossRef]
  9. Guo, T.; Wang, Q.; Li, D.; Zhuang, J. Effect of surface stone cover on sediment and solute transport on the slope of fallow land in the semi-arid loess region of northwestern China. J. Soils Sediments 2010, 10, 1200–1208. [Google Scholar] [CrossRef]
  10. Wang, X.; Li, Z.; Cai, C.; Shi, Z.; Xu, Q.; Fu, Z.; Guo, Z. Effects of rock fragment cover on hydrological response and soil loss from Regosols in a semi-humid environment in South-West China. Geomorphology 2012, 151, 234–242. [Google Scholar] [CrossRef]
  11. Simanton, J.R.; Renard, K.G. Seasonal change in infiltration and erosion from USLE plots in southeastern Arizona. Water Resour. Ariz. Southwest 1982, 12, 37–46. [Google Scholar]
  12. Poesen, J.W.; Torri, D.; Bunte, K. Effects of rock fragments on soil erosion by water at different spatial scales: A review. CATENA 1994, 23, 141–166. [Google Scholar] [CrossRef]
  13. Bunte, K.; Poesen, J. Effects of rock fragment size and cover on overland flow hydraulics, local turbulence and sediment yield on an erodible soil surface. Earth Surf. Process. Landf. 1994, 19, 115–135. [Google Scholar] [CrossRef]
  14. Li, L.; Nearing, M.A.; Polyakov, V.O.; Nichols, M.H.; Pierson, F.B.; Cavanaugh, M.L. Evolution of rock cover, surface roughness, and its effect on soil erosion under simulated rainfall. Geoderma 2020, 379, 114622. [Google Scholar] [CrossRef]
  15. Sun, J.; Yu, X.; Fan, D.; Huang, C. Hydrological and erosive response of soil surfaces to rainfall intensity as affected by gravel fragment coverage. J. Soil Water Conserv. 2018, 73, 353–362. [Google Scholar] [CrossRef]
  16. Ding, W.; Huang, C. Effects of soil surface roughness on interrill erosion processes and sediment particle size distribution. Geomorphology 2017, 295, 801–810. [Google Scholar] [CrossRef]
  17. Govers, G.; Takken, I.; Helming, K. Soil roughness and overland flow. Agronomie 2000, 20, 131–146. [Google Scholar] [CrossRef]
  18. Smith, M.W.; Cox, N.J.; Bracken, L.J. Applying flow resistance equations to overland flows. Prog. Phys. Geogr. 2007, 31, 363–387. [Google Scholar] [CrossRef]
  19. Alewell, C.; Borrelli, P.; Meusburger, K.; Panagos, P. Using the USLE: Chances, challenges and limitations of soil erosion modelling. Int. Soil Water Conserv. Res. 2019, 7, 203–225. [Google Scholar] [CrossRef]
  20. Pampalone, V.; Nicosia, A.; Palmeri, V.; Serio, M.A.; Ferro, V. Rill and interrill soil loss estimations using the USLE-MB equation at the Sparacia Experimental Site (South Italy). Water 2023, 15, 2396. [Google Scholar] [CrossRef]
  21. Flanagan, D.C.; Ascough, J.C.; Nearing, M.A.; Laflen, J.M. The water erosion prediction project (WEPP) model. In Landscape Erosion and Evolution Modeling; Springer: Boston, MA, USA, 2001; pp. 145–199. [Google Scholar]
  22. Flanagan, D.C.; Nearing, M.A. Sediment particle sorting on hillslope profiles in the WEPP model. Trans. ASAE 2000, 43, 573–583. [Google Scholar] [CrossRef]
  23. Gong, T.; Zhu, Y.; Shao, M. Effect of embedded-rock fragments on slope soil erosion during rainfall events under simulated laboratory conditions. J. Hydrol. 2018, 563, 811–817. [Google Scholar] [CrossRef]
  24. Li, X.; Fu, S.; Liu, B. Response of flow hydraulic parameters to different rock fragment coverages and sizes under simulated rainfall. Soil Till. Res. 2023, 230, 105707. [Google Scholar] [CrossRef]
  25. Liu, J.; Zhang, K.; Peng, Y.; Rubinato, M.; Zhang, H.; Li, P. Effect of gravel coverage on the hydrodynamic characteristics of overland flow on the Loess Plateau in China. J. Hydrol. 2023, 627, 130322. [Google Scholar] [CrossRef]
  26. Laburda, T.; Krása, J.; Zumr, D.; Devátý, J.; Vrána, M.; Zambon, N.; Johannsen, L.L.; Klik, A.; Strauss, P.; Dostál, T. SfM-MVS Photogrammetry for splash erosion monitoring under natural rainfall. Earth Surf. Process. Landf. 2021, 46, 1067–1082. [Google Scholar] [CrossRef]
  27. Sochan, A.; Beczek, M.; Mazur, R.; Polakowski, C.; Ryżak, M.; Bieganowski, A. Splash erosion and surface deformation following a drop impact on the soil with different hydrophobicity levels and moisture content. PLoS ONE 2023, 18, e0285611. [Google Scholar] [CrossRef] [PubMed]
  28. Balaguer-Puig, M.; Marqués-Mateu, Á.; Lerma, J.L.; Ibáñez-Asensio, S. Estimation of small-scale soil erosion in laboratory experiments with Structure from Motion photogrammetry. Geomorphology 2017, 295, 285–296. [Google Scholar] [CrossRef]
  29. Kaiser, A.; Erhardt, A.; Eltner, A. Addressing uncertainties in interpreting soil surface changes by multitemporal high-resolution topography data across scales. Land Degrad. Dev. 2018, 29, 2264–2277. [Google Scholar] [CrossRef]
  30. Pampalone, V.; Carollo, F.G.; Nicosia, A.; Palmeri, V.; Di Stefano, C.; Bagarello, V.; Ferro, V. Measurement of water soil erosion at Sparacia experimental area (Southern Italy): A summary of more than twenty years of scientific activity. Water 2022, 14, 1881. [Google Scholar] [CrossRef]
  31. Kamphorst, A. A small rainfall simulator for the determination of soil erodibility. Neth. J. Agricul. Sci. 1987, 35, 407–415. [Google Scholar] [CrossRef]
  32. Carollo, F.G.; Caruso, R.; Ferro, V.; Serio, M.A. Characterizing the Kamphorst rainfall simulator for soil erosion investigations. J. Hydrol. 2024, 643, 132025. [Google Scholar] [CrossRef]
  33. Wischmeier, W.H.; Smith, D.D. Predicting Rainfall Erosion Losses: A Guide to Conservation Planning (No. 537); Department of Agriculture, Science and Education Administration: Washington, DC, USA, 1978.
  34. Di Stefano, C.; Nicosia, A.; Pampalone, V.; Palmeri, V.; Ferro, V. New technique for measuring water depth in rill channels. CATENA 2019, 181, 104090. [Google Scholar] [CrossRef]
  35. Lowe, D.G. Distinctive image features from scale-invariant keypoints. Int. J. Comput. Vis. 2004, 60, 91–110. [Google Scholar] [CrossRef]
  36. Koci, J.; Jarihani, B.; Leon, J.X.; Sidle, R.; Wilkinson, S.; Bartley, R. Assessment of UAV and ground-based structure from motion with multi-view stereo photogrammetry in a gullied savanna catchment. ISPRS Int. J. Geo-Inf. 2017, 6, 328. [Google Scholar] [CrossRef]
  37. Wheaton, J.M.; Brasington, J.; Darby, S.E.; Sear, D.A. Accounting for uncertainty in DEMs from repeat topographic surveys: Improved sediment budgets. Earth Surf. Process. Landf. 2010, 35, 136–156. [Google Scholar] [CrossRef]
  38. Prosdocimi, M.; Calligaro, S.; Sofia, G.; Dalla Fontana, G.; Tarolli, P. Bank erosion in agricultural drainage networks: New challenges from structure-from-motion photogrammetry for post-event analysis. Earth Surf. Process. Landf. 2015, 40, 1891–1906. [Google Scholar] [CrossRef]
  39. Smith, M.W.; Vericat, D. From experimental plots to experimental landscapes: Topography, erosion and deposition in sub-humid badlands from structure-from-motion photogrammetry. Earth Surf. Process. Landf. 2015, 40, 1656–1671. [Google Scholar] [CrossRef]
  40. Vinci, A.; Todisco, F.; Brigante, R.; Mannocchi, F.; Radicioni, F. A smartphone camera for the structure from motion reconstruction for measuring soil surface variations and soil loss due to erosion. Hydrol. Res. 2017, 48, 673–685. [Google Scholar] [CrossRef]
  41. Rozenstein, O.; Karnieli, A. Comparison of methods for land-use classification incorporating remote sensing and GIS inputs. Appl. Geogr. 2011, 31, 533–544. [Google Scholar] [CrossRef]
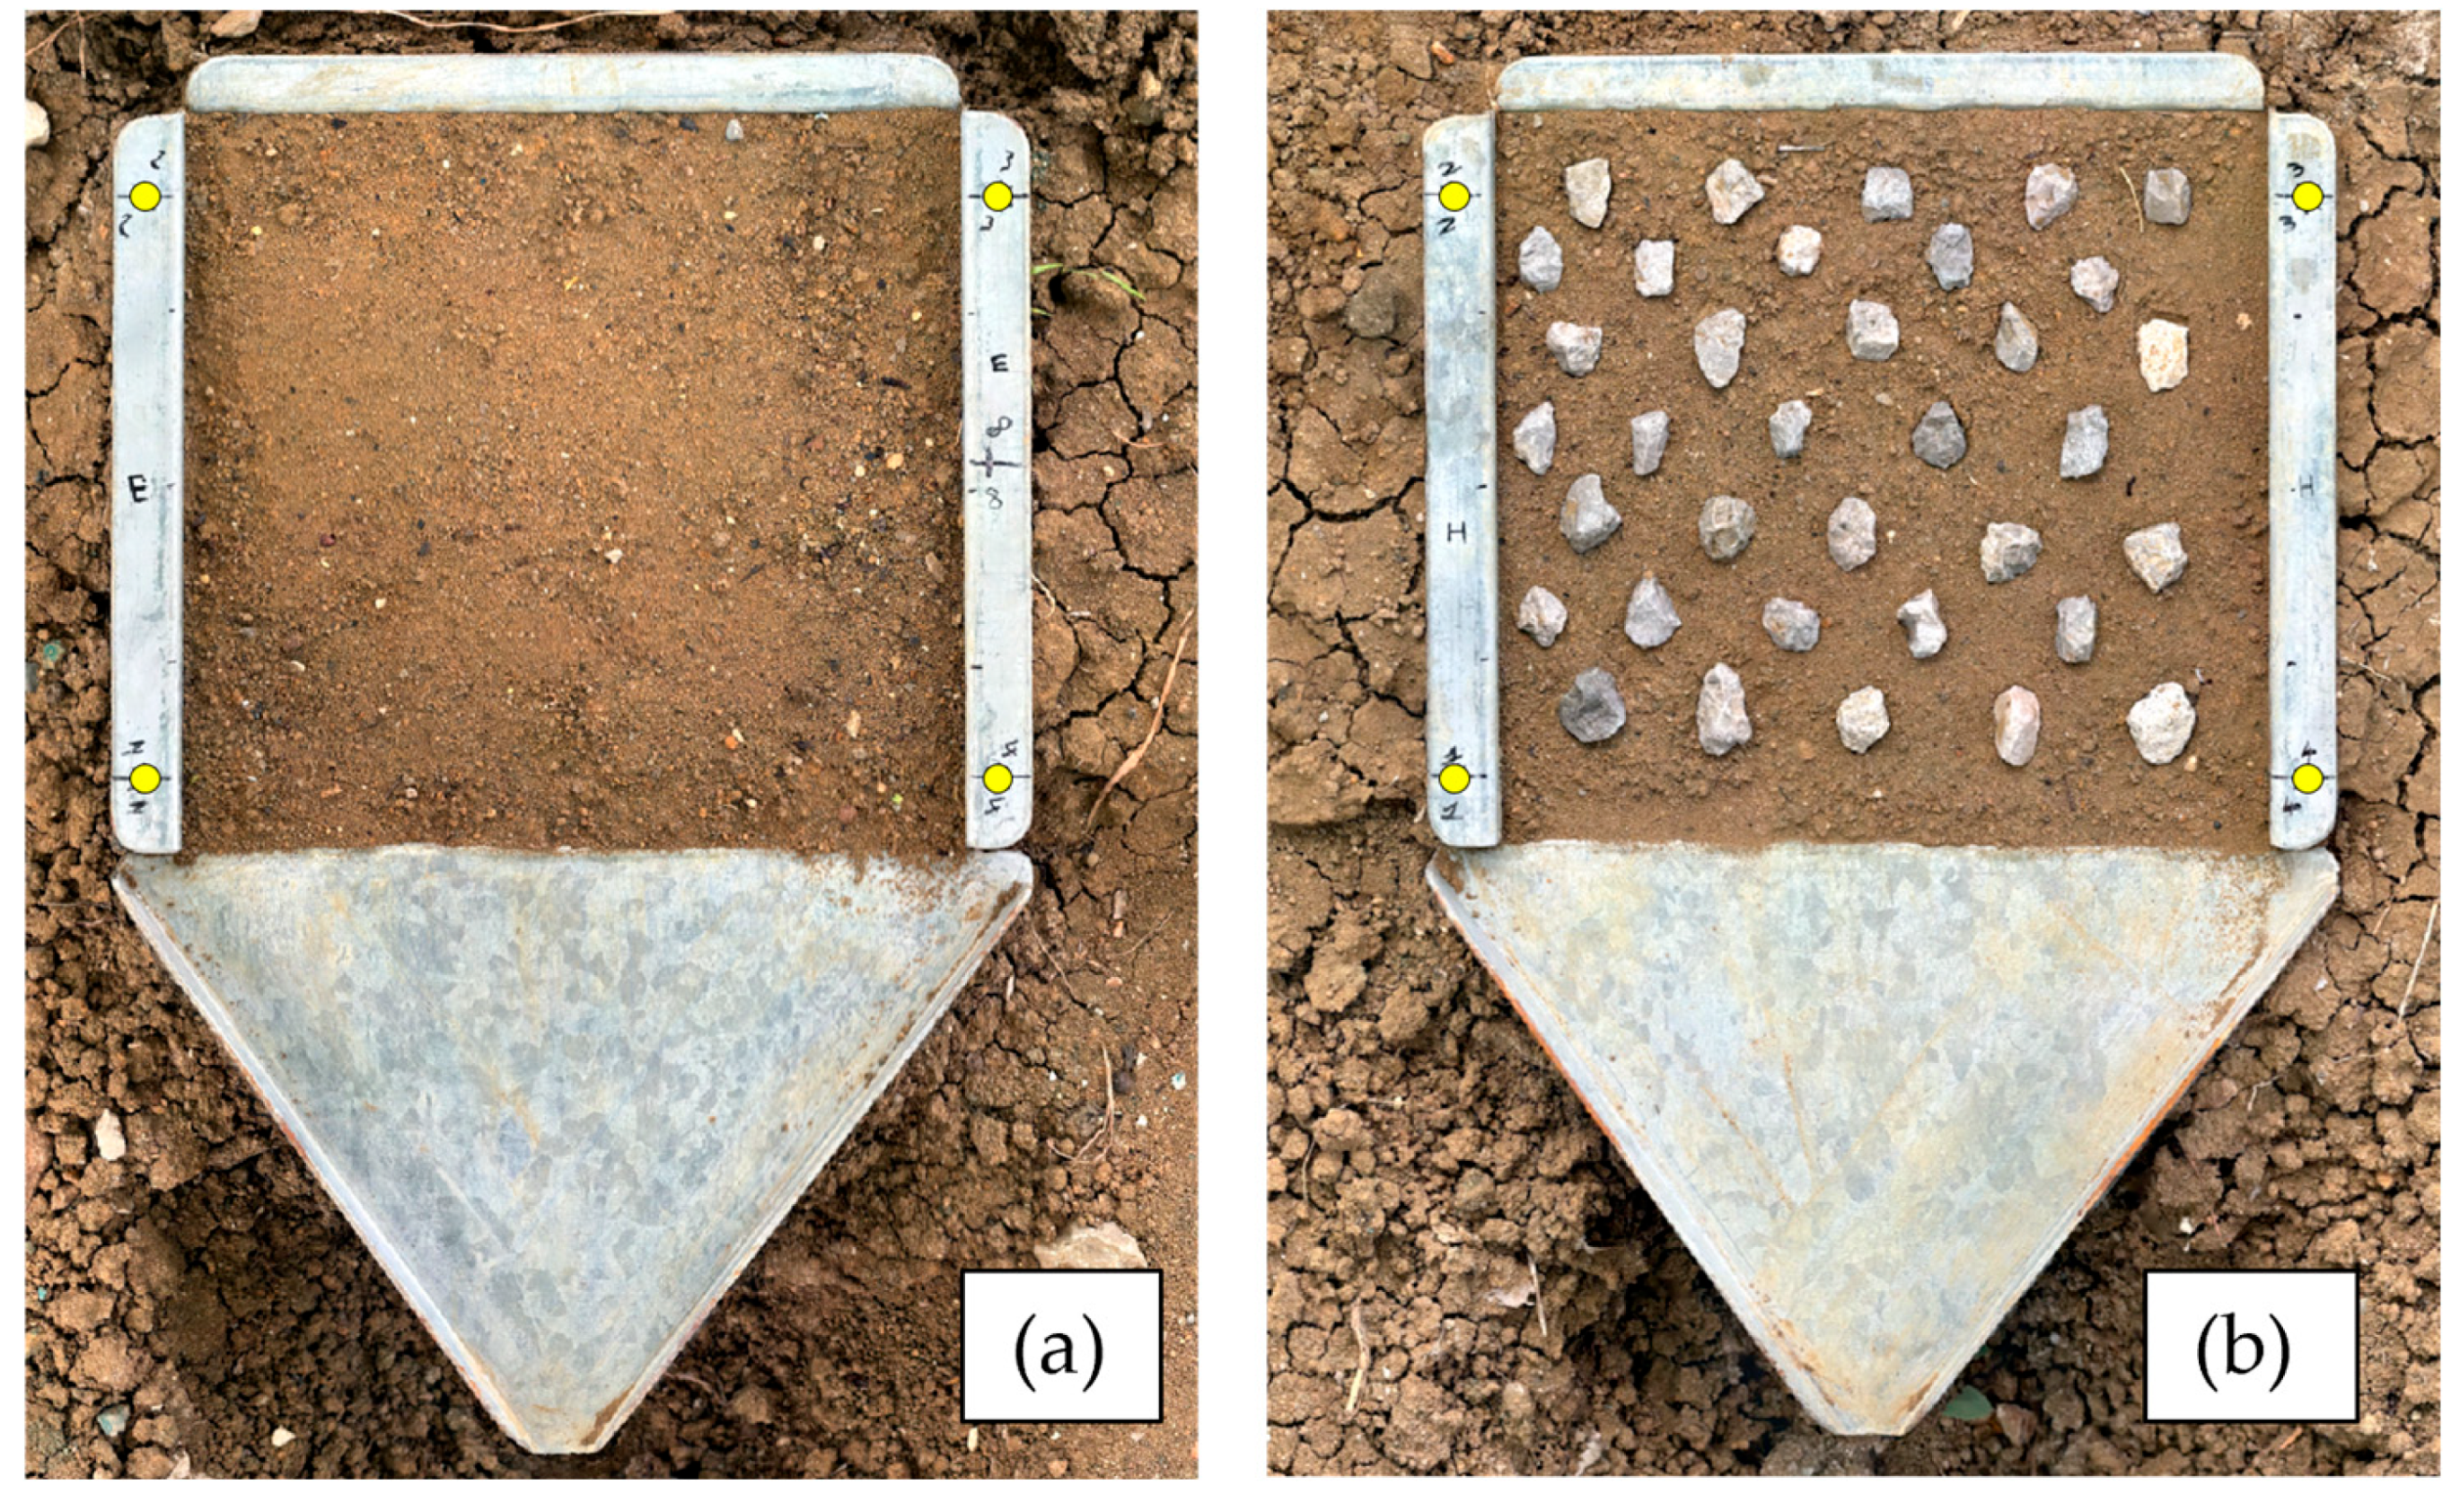
Figure 1. View of the control (a) and rock (b) configurations. Ground control points (GCPs) were highlighted as yellow points in the corners of the boxes.
Water 17 03387 g001
Figure 2. View of the Kamphorst rainfall simulator (drop falling height = 0.4 m) on a 0.25 m × 0.25 m microplot.
Water 17 03387 g002
Figure 3. Runoff, R, values for different rainfall intensities, Is, and surface conditions.
Water 17 03387 g003
Figure 4. Sediment yield, SY, values for different rainfall intensities, Is, and surface conditions.
Water 17 03387 g004
Figure 5. Sediment yield values, SYDoD, obtained from the DoD for different rainfall intensities, Is, and surface conditions.
Water 17 03387 g005
Figure 6. Relationship between the sediment yield values obtained by the direct measurement (bowl), SY, and those obtained from the DoD analysis, SYDoD.
Water 17 03387 g006
Figure 7. Relationship between sediment delivery ratio, SDR, values and rainfall intensities.
Water 17 03387 g007
Figure 8. Examples of DEM of Difference (DoD) and orthophoto for the microplots subjected to low rainfall intensity for control (a) and rock (b) configurations.
Water 17 03387 g008
Figure 9. Examples of DEM of Difference (DoD) and orthophoto for the microplots subjected to intermediate rainfall intensity for control (a) and rock (b) configurations.
Water 17 03387 g009
Figure 10. Examples of DEM of Difference (DoD) and orthophoto for the microplots subjected to high rainfall intensity for control (a) and rock (b) configurations.
Water 17 03387 g010
Figure 11. Sediment delivery ratio, SDRe, values, obtained for Ae = 0.04 m2, for different rainfall intensities and surface conditions.
Water 17 03387 g011
Table 1. Summary of the main literature results.
AuthorsRock Fragment ArrangementMain Results
Poesen [6]Embedded and restingArrangement effects on soil susceptibility to surface sealing
Poesen et al. [5]Embedded and restingRock cover reduces runoff for resting elements and enhances runoff for embedded elements. For embedded fragments, the increase in rock cover percentage increases the impermeabilized area.
Bunte and Poesen [7]RestingWhen rock cover increases from 0% to 20%, an increment in sediment yield (scouring phenomena localized around each rock fragment) occurs.
Zhang et al. [8]Embedded and restingRelevance of rock element architecture (coverage, size, position, and morphology).
Guo et al. [9];
Wang et al. [10]
RestingRunoff and soil erosion decrease with increasing rock coverage, from 0 to 40%.
Poesen et al. [12]Resting(1) Rock elements protect soil from raindrop impact and flow detachment, (2) rock coverage reduces degradation of the underlying soil, and (3) flow resistance of resting elements produces a retardation of flow velocity.
Bunte and Poesen [13]RestingRock element size affects the relationship between hydrological processes and rock coverage.
Li et al. [14]Embedded to restingSurface rock cover increases as rainfall progresses, leading to reductions in flow velocity and soil loss rate.
Sun et al. [15]RestingRunoff and sediment yield decreased with an increase in coverage percentage and were negatively correlated with rainfall intensity.
Gong et al. [23]Embedded to restingEmbedding pattern represents a transition status from the conditions below the soil surface to resting on the soil surface. Embedded elements can accelerate soil erosion.
Li et al. [24]RestingRock fragments reduce flow velocity and increase flow resistance
Liu et al. [25]RestingIncrease in gravel coverage decreases flow velocity and increases the Darcy–Weisbach friction factor.
Table 2. Simulated rainfall energetic characterization and experimental microplot setup.
Class of Rainfall IntensityPressure Head
H
(cm)
Simulated Rainfall Intensity
Is
(mm h−1)
Kinetic Power
Pn
(J m−2 s−1)
Natural Rainfall Intensity
In
(mm h−1)
Low1.9260.20.2535.9
Intermediate3.9444.00.4357.3
High5.9605.20.5975.2
Disclaimer/Publisher’s Note: The statements, opinions and data contained in all publications are solely those of the individual author(s) and contributor(s) and not of MDPI and/or the editor(s). MDPI and/or the editor(s) disclaim responsibility for any injury to people or property resulting from any ideas, methods, instructions or products referred to in the content.