Article

Overland Flow Generation Under Clear-Cut, 40% Thinning, and Control Conditions in a Japanese Cypress Plantation

1
Ecohydrology Research Institute, Graduate School of Agriculture and Life Sciences, University of Tokyo, Seto 489-0031, Japan
2
The University of Tokyo Hokkaido Forest, Graduate School of Agricultural and Life Sciences, The University of Tokyo, Furano 079-1563, Japan
3
Toyota Yahagi River Institute, Toyota 471-0025, Japan
4
Executive Office, Graduate School of Agricultural and Life Sciences, The University of Tokyo, Bunkyo 113-8657, Japan
*
Author to whom correspondence should be addressed.
Water 2025, 17(23), 3385; https://doi.org/10.3390/w17233385
Submission received: 8 October 2025 / Revised: 18 November 2025 / Accepted: 25 November 2025 / Published: 27 November 2025
(This article belongs to the Section Hydrology)

Abstract

Managing overland flow (OF) is essential in steep high-rainfall regions. A key strategy is to increase ground cover either naturally or through management. In Japanese cypress plantations, low ground cover increases OF and flood risks during intense rainfall. We analyzed OF and soil water content (SWC) in three plots of a Japanese cypress plantation under clear-cutting, 40% thinning, and control conditions over one year (2022–2023). The SWC remained consistently higher in the clear-cut plot than in the thinned and control plots. In contrast, the OF rate was greatest in the control plot (1.97%), intermediate in the thinned plot (1.03%), and lowest in the clear-cut plot (0.58%) with 5, 5, and 35% ground cover, respectively. Event-based analyses showed that in the clear-cut plot, OF was correlated with total rainfall (r = 0.597, p = 0.003), suggesting a tendency toward subsurface flow. Conversely, in the control plot, OF was correlated with 60 min of maximum rainfall (r = 0.90, p < 0.001), indicating Hortonian flow. No significant relationships were observed in the thinned plot, likely because of response variability. Our findings imply that ground cover dynamics following management regulate OF, emphasizing the importance of continued monitoring.

1. Introduction

Hydrological processes in forested landscapes often undergo substantial changes following natural or anthropogenic disturbances [1]. Such disturbances can strongly affect rainfall–runoff relationships, particularly by enhancing overland flow (OF). OF refers to the downslope movement of excess rainwater across the land surface once the infiltration capacity of the soil is exceeded, or the soil profile becomes saturated. For example, in the subalpine coniferous forests of Italy, Koyanagi et al. [2] reported that large-scale windthrow events enhanced OF, underscoring the importance of preventive measures. Similarly, Sadeghi et al. [3] showed that forest degradation in northern Iran contributes to elevated OF generation. In northwestern Ethiopia, Tamer et al. [4] emphasized that widespread deforestation and subsequent conversion to rain-fed agriculture make watersheds particularly vulnerable to OF, highlighting the urgent need for effective management. These studies have highlighted that disturbances in forest ecosystems, whether natural or anthropogenic, can fundamentally alter hydrological processes, leading to OF increases.
In Japan, flooding is often linked to dense monoculture plantations of the Japanese cypress (Chamaecyparis obtusa Siebold et Zucc.), which is typically characterized by low ground cover [5]. Since the early 2000s, numerous studies have investigated the influence of forest management on OF in these plantations [6,7,8,9]. Thinning, generally involving the removal of 25–35% of trees per hectare, has been the most widely applied practice [10]. For example, Farahnak et al. [11] demonstrated that 40% thinning combined with contour-felled logs effectively reduced OF, whereas Kuraji et al. [12] reported that such treatments lowered peak runoff compared with a grassland control plot. Although clear-cutting has been considered a management option, it is typically avoided in Japan because of the high risk of landslides on steep terrain. Historical evidence from the Shirasaka Experimental Watershed in Aichi Prefecture, Central Japan, shows that intensive logging in the late 19th century dramatically increased sediment transport and downstream flood risks, with recovery taking over 60 years [13]. Despite these insights, no study has directly compared the hydrological responses of clear-cut, thinned, and untreated stands in Japanese cypress plantations.
Vegetation cover is widely recognized as a key regulator of soil hydrological processes and OF generation. For instance, in the United Kingdom, woodland soils show higher infiltration than pasture soils, whereas rough vegetation slows OF, highlighting the role of ground cover in flood mitigation [14]. However, in dense Japanese cypress plantations, sparse understory vegetation often leads to localized Hortonian OF during high-intensity storms, owing to interception and stemflow inputs [15]. Clear-cut areas lacking canopy interception are more prone to saturation-excess OF once the soil storage capacity is exceeded [16]. Thinned stands represent an intermediate condition, where reduced canopy density enhances infiltration and promotes ground cover development. However, compacted soil or limited infiltration zones may still generate Hortonian flow, while saturation-excess flow can occur during prolonged or intense rainfall [7]. Yet most of these insights come from separate case studies at different sites and rainfall conditions, and few investigations have directly compared clear-cut, thinned, and untreated cypress stands in the same environmental setting.
In a previous study, we found that thinning significantly reduced OF and that the effect persisted for at least three years after treatment in a Japanese cypress stand [11]. In the present study, we returned to the same site ~4 years after the treatment to further examine the development of hydrological conditions. Unlike our previous study, the focus here was not on pre- and post-thinning changes, but on the simultaneous monitoring and comparison of OF generation mechanisms under three distinct forest management conditions, clear-cutting, 40% thinning, and no intervention, under the same rainfall regime. Because clear-cut, thinned, and unmanaged stands are typically studied at different sites, it is difficult to attribute their hydrological differences solely to their management. Our design eliminates this limitation by examining three conditions under identical rainfall and soil environments with unified monitoring. This design enables a direct evaluation of how forest management influences OF generation, while minimizing differences in rainfall characteristics and site conditions. We hypothesized that differences in forest management would produce distinct OF responses when exposed to the same rainfall patterns. Specifically, we expected that (i) the clear-cut plot, with the greatest ground-cover recovery, would generate the least OF; (ii) the 40% thinned plot would show intermediate OF; and (iii) the unmanaged control plot, characterized by sparse ground cover and lower soil water content, would generate the highest OF.

2. Materials and Methods

2.1. Study Site

This study was conducted in a Japanese cypress (Chamaecyparis obtusa Siebold et Zucc.) plantation catchment area (1.45 ha) in the northern part of Toyota City, Aichi Prefecture, Japan (35°16′ N, 137°15′ E; 585 m a.s.l.) (Figure 1a,b). The plantation was established in 1991, making the stand 32 years old at the beginning of the monitoring period (November 2022–2023). According to the Toyota City Forest Inventory records, the stand density in the study area is ~2100 trees ha−1 [17]. The site has a warm temperate, fully humid climate with hot summers (Cfa) according to the Köppen–Geiger classification [18]. During 1991 to 2020, mean annual precipitation was 1470.4 mm and mean air temperature 15.3 °C [19]. Rainfall occurs throughout the year, with the rainy season typically from May to June and the typhoon season between September and October. During winter (January to early February), air temperatures often fall below 5 °C, and precipitation is relatively low, 48.0 mm in January and 61.2 mm in February, often occurring as light rain or snow. Mean monthly temperatures during this period range from 3.6 to 4.5 °C [19].

2.2. Slope Soil Properties

The geology of the study area consists of Mesozoic Late Cretaceous granite bedrock [20]. The soil is classified as brown forest soil [21], equivalent to Cambisol [22]. On 6 August (2025), five disturbed soil samples were collected from a depth of 0–10 cm for the laboratory analysis of soil texture and organic matter. Soil texture, determined using the hydrometer method, was classified as sandy clay loam (coarse sand, 40.74%; fine sand, 31.52%; silt, 9.14%; clay, 18.60%). Soil organic matter, measured using the loss-on-ignition method, had a mean of 8.16%, with a standard deviation (SD) of 1.30 and a range of 6.77–9.75%. On the same date, 15 intact soil samples were collected from a depth of 0–10 cm using a steel cylinder (100 cm3) to measure saturated hydraulic conductivity. Falling head measurements yielded a mean, SD, and range of 372.35, 404.24, and 27.55–1289.47 mm h−1, respectively. The litter layer was <1 cm thick, and the root mat was ~3 cm thick [23]. Both the biomat and soil surface become strongly water-repellent during rain-free summer periods [23]. On 2 September 2025, a mini-disk infiltrometer experiment was conducted at six locations to estimate the unsaturated hydraulic conductivity of the soil surface. This experiment followed a prolonged rain-free period (15 August–2 September), during which daily maximum air temperatures ranged from 30.5 to 35.2 °C. Measurements were conducted using a tension mini-disk infiltrometer (Decagon Devices, Inc., Pullman, WA, USA) at a suction of −1 cm. The mean unsaturated hydraulic conductivity, SD, and range were 3.59, 4.90, and 0–13.11 mm h−1, respectively.

2.3. Study Plots

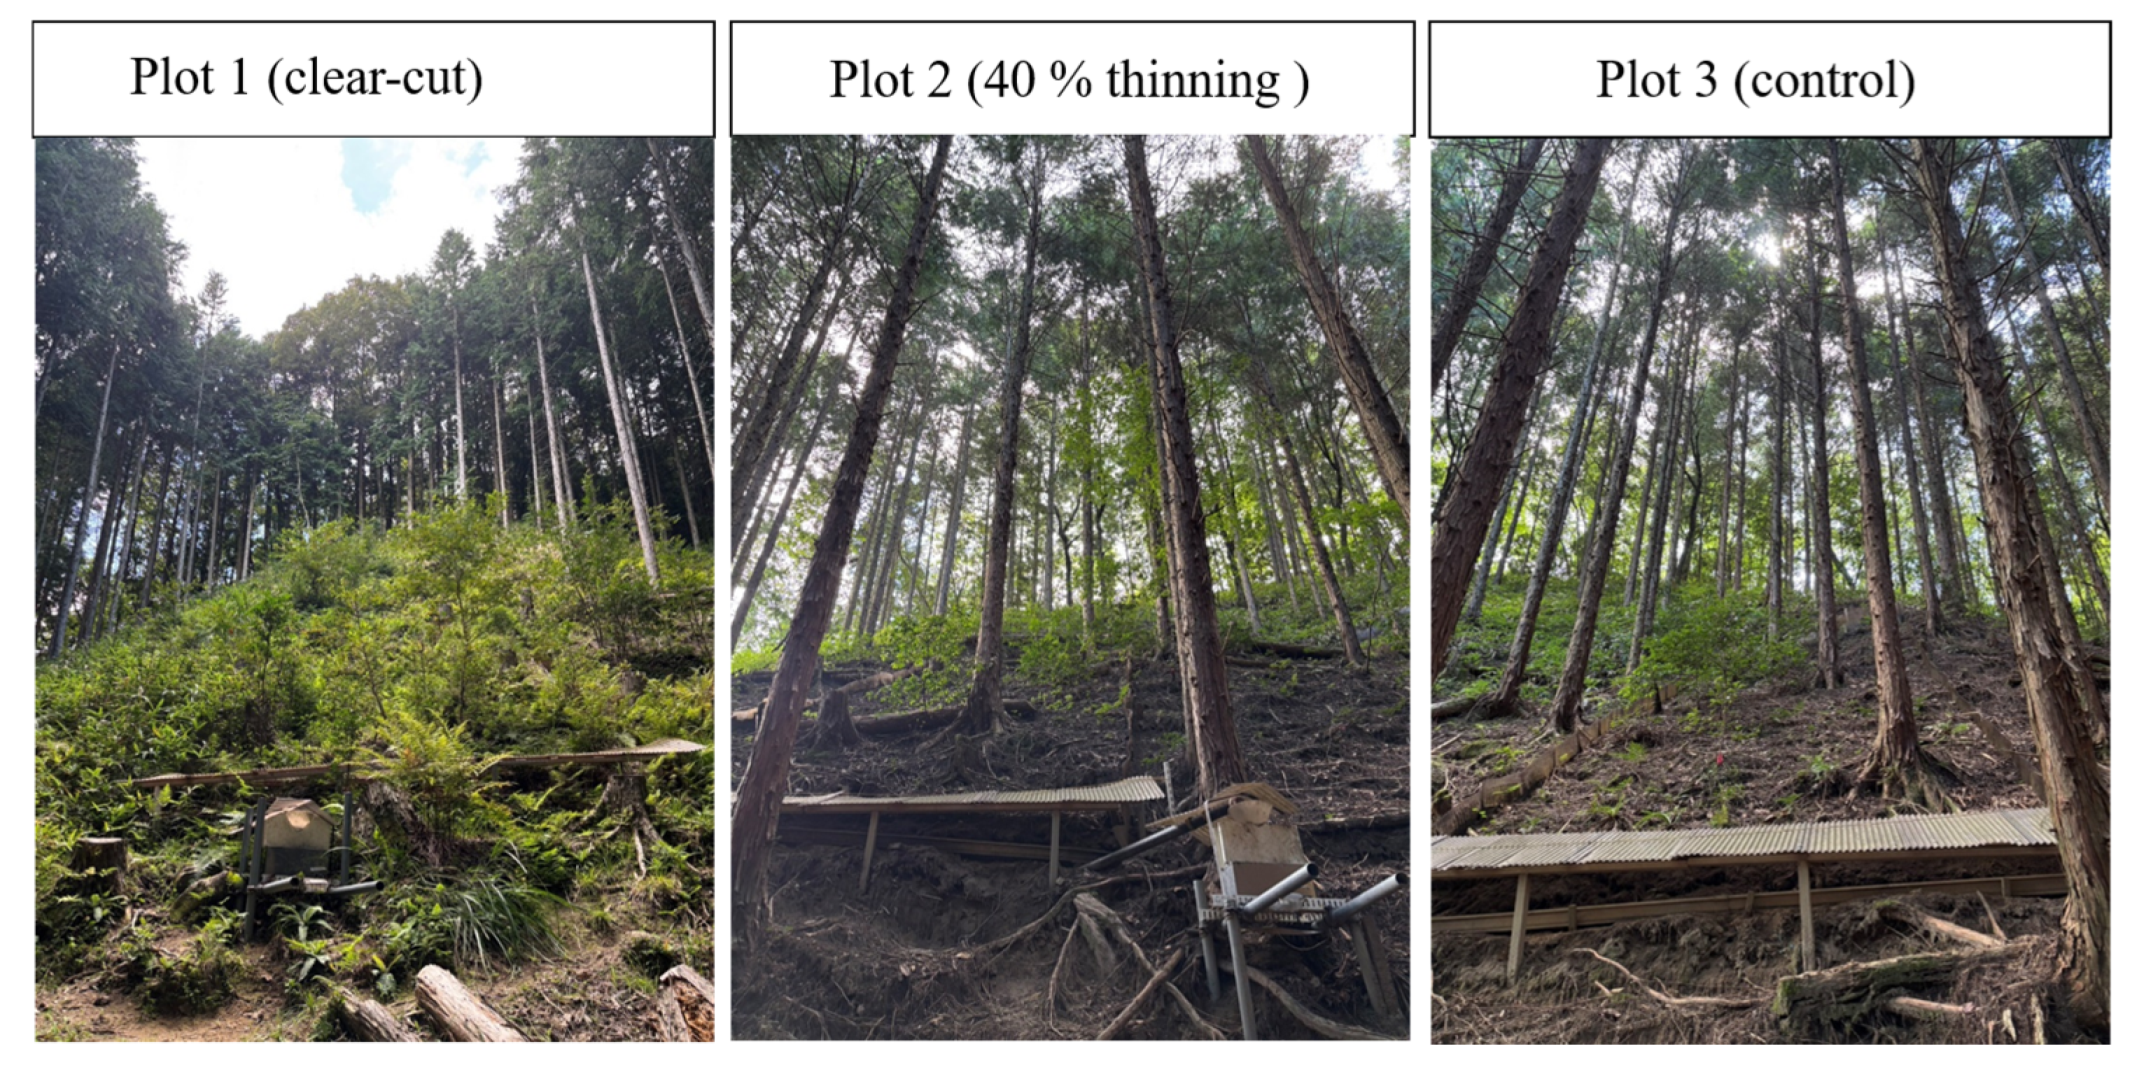
Three study plots (4 m wide × 10 m long) (Figure 1c and Figure 2) were established on plantation slopes within the catchment, situated on both the northwest- and north-facing aspects (Figure 1c; Table 1). Plot 1 was clear-cut in early 2019 with all trees removed (31.1 m2). Plot 2 underwent 40% thinning (based on tree density per hectare) at the same time as Plot 1, and felled logs were placed on the slope to reduce OF and soil erosion (30.8 m2). Plot 3 served as the untreated control and received no management intervention since the monitoring began (32.1 m2).
The understory vegetation conditions in 2023 varied substantially among the plots (Figure 2). Plot 1 had the most abundant understory because of greater light availability, with 35% ground cover consisting of diverse species such as evergreen shrubs (Eurya japonica), deciduous shrubs (Hydrangea hirta, Rhododendron kaempferi), and ferns. Plot 2 had a sparse understory (5% ground cover) dominated by shade-tolerant species, including E. japonica and Chengiopanax sciadophylloides. Plot 3 also had very limited understory (5% ground cover), primarily composed of shade-tolerant evergreen species, particularly E. japonica.

2.4. Measurements

2.4.1. Overland Flow and Rainfall

All three plots were bordered with plastic sheets inserted 10 cm into the ground to isolate OF. The flow generated within each plot was collected using a gutter installed along the lower boundary and directed towards a tipping-bucket rain gauge (Uizin UIZ-TB200; Uizin Co., Ltd., Tokyo, Japan; 200 mm per tip; Figure 2). An additional plastic sheet was installed above the gutter to prevent direct rainfall from entering it.
Rainfall was measured at a weather station located ~500 m from the plots (Figure 1c) using a tipping-bucket rain gauge (OW-34-BP, Ota Keiki Seisakusho Co., Ltd., Tokyo, Japan, 0.1 mm per tip). Although minor spatial variations in rainfall may exist over this distance, the stations and plots experienced the same rainfall events. Therefore, the recorded data were considered representative of all plots. A rain event was defined as a period separated by at least six consecutive dry hours with a total rainfall of at least 10.9 mm, corresponding to the smallest rainfall that generated OF in all three plots during the study period. Tipping times for both OF and rainfall were recorded with identical data loggers (Onset HOBO Pendant® Event Data Logger UA-003-64, Onset Computer Corporation, Bourne, MA, USA). Due to a data logger malfunction caused by low temperatures, OF data were not recorded between 7 December 2022 and 5 April 2023, a period that typically experiences little rainfall.

2.4.2. Soil Water Content

A capacitive soil moisture sensor (ECH2O EC-5; METER Environment, formerly Decagon Devices, Inc., Pullman, WA, USA) was installed horizontally at a depth of 0–10 cm at the lower end of each plot (three sensors in total) immediately upslope of the OF gutter. Although only one sensor was installed per plot, this location was deliberately chosen because it represented the point at which changes in soil moisture were most directly connected to initiation of OF at the plot outlet. To avoid the influence of direct rainfall, each sensor was placed beneath the plastic roof (Figure 2) to ensure that the observed increases in soil moisture reflected subsurface wetting rather than direct rainfall. It should be noted that SWC at this point reflects local near-surface wetting and does not necessarily indicate plot-scale saturation or predict the magnitude of OF. Soil moisture was recorded every 30 min using CR10X data loggers (Campbell Scientific, Logan, UT, USA) and converted to volumetric soil water content (m3 m−3). Between June and August 2023, the CR10X logger for Plots 2 and 3 malfunctioned, leading to a loss of soil water content (SWC) data for this period. Although this missing period reduced the number of events with available SWC data, the overall dataset was sufficient to examine the main patterns and relationships discussed here.

2.5. Statistical Analyses

Only OF events that occurred in all three study plots were included in the analyses to enable event-based comparisons. Events with missing OF or SWC data were also excluded. The relationships among OF, rainfall, and soil characteristics were examined using Pearson’s correlation coefficient (r) to identify the factors influencing OF generation in each plot. The rainfall characteristics considered were total rainfall, rainfall duration, average rainfall intensity, and 10-, 30-, and 60-min maximum rainfall. The initial SWC was defined as that measured one hour before the onset of rainfall, representing the antecedent soil moisture conditions. The peak SWC was defined as the maximum recorded SWC during each event, indicating the degree of soil saturation. These soil characteristics were extracted and analyzed for each rainfall–OF event to clarify the role of soil moisture in runoff generation. All statistical analyses were performed using R software (version 3.4.2; R Development Core Team, Vienna, Austria).

3. Results

3.1. Rainfall-Overland Flow Events

A total of 22 rainfall–OF events were identified and analyzed to evaluate OF generation across the three study plots (Table 2). The cumulative rainfall during these events was 1111.3 mm, with individual events ranging from 10.9 mm (events 11 and 13) to 215.2 mm (event 6). During the study period, the total recorded OF was 6.46 mm in Plot 1, 11.45 mm in Plot 2, and 21.88 mm in Plot 3. These results indicate that the control plot (Plot 3) produced the highest OF, the clear-cut plot (Plot 1) produced the lowest OF, and the thinned plot (Plot 2) produced intermediate responses (Table 2).
The event that produced the highest total OF occurred between 1–3 June 2023 (event 6). This storm delivered 215.2 mm of rainfall over 29.4 h, with an average intensity of 7.3 mm h−1. Among the plots, Plot 3 recorded the largest OF (2.75 mm), followed by Plot 2 (1.68 mm) and Plot 1 (1.16 mm), yielding a combined total of 5.59 mm (Table 2). The highest OF observed in a single plot occurred during event 17 (1 October 2023), when Plot 3 produced 3.20 mm under 40.0 mm of rainfall with an average intensity of 3.51 mm h−1 (Table 2). The OF in Plots 1 and 2 during event 17 was minimal (0.15 and 0.33 mm, respectively), highlighting localized differences in OF generation. In contrast, the lowest OF was observed during 29–30 April 2023 (event 4), which produced 65.1 mm of rainfall over 21.5 h with an average intensity of 3.0 mm h−1. The OF was negligible across all plots: 0.04, 0.07, and 0.05 mm in Plots 1, 2, and 3, respectively, for a combined total of only 0.16 mm (Table 2).

3.2. Overview of Rainfall, Overland Flow, and Soil Water Content

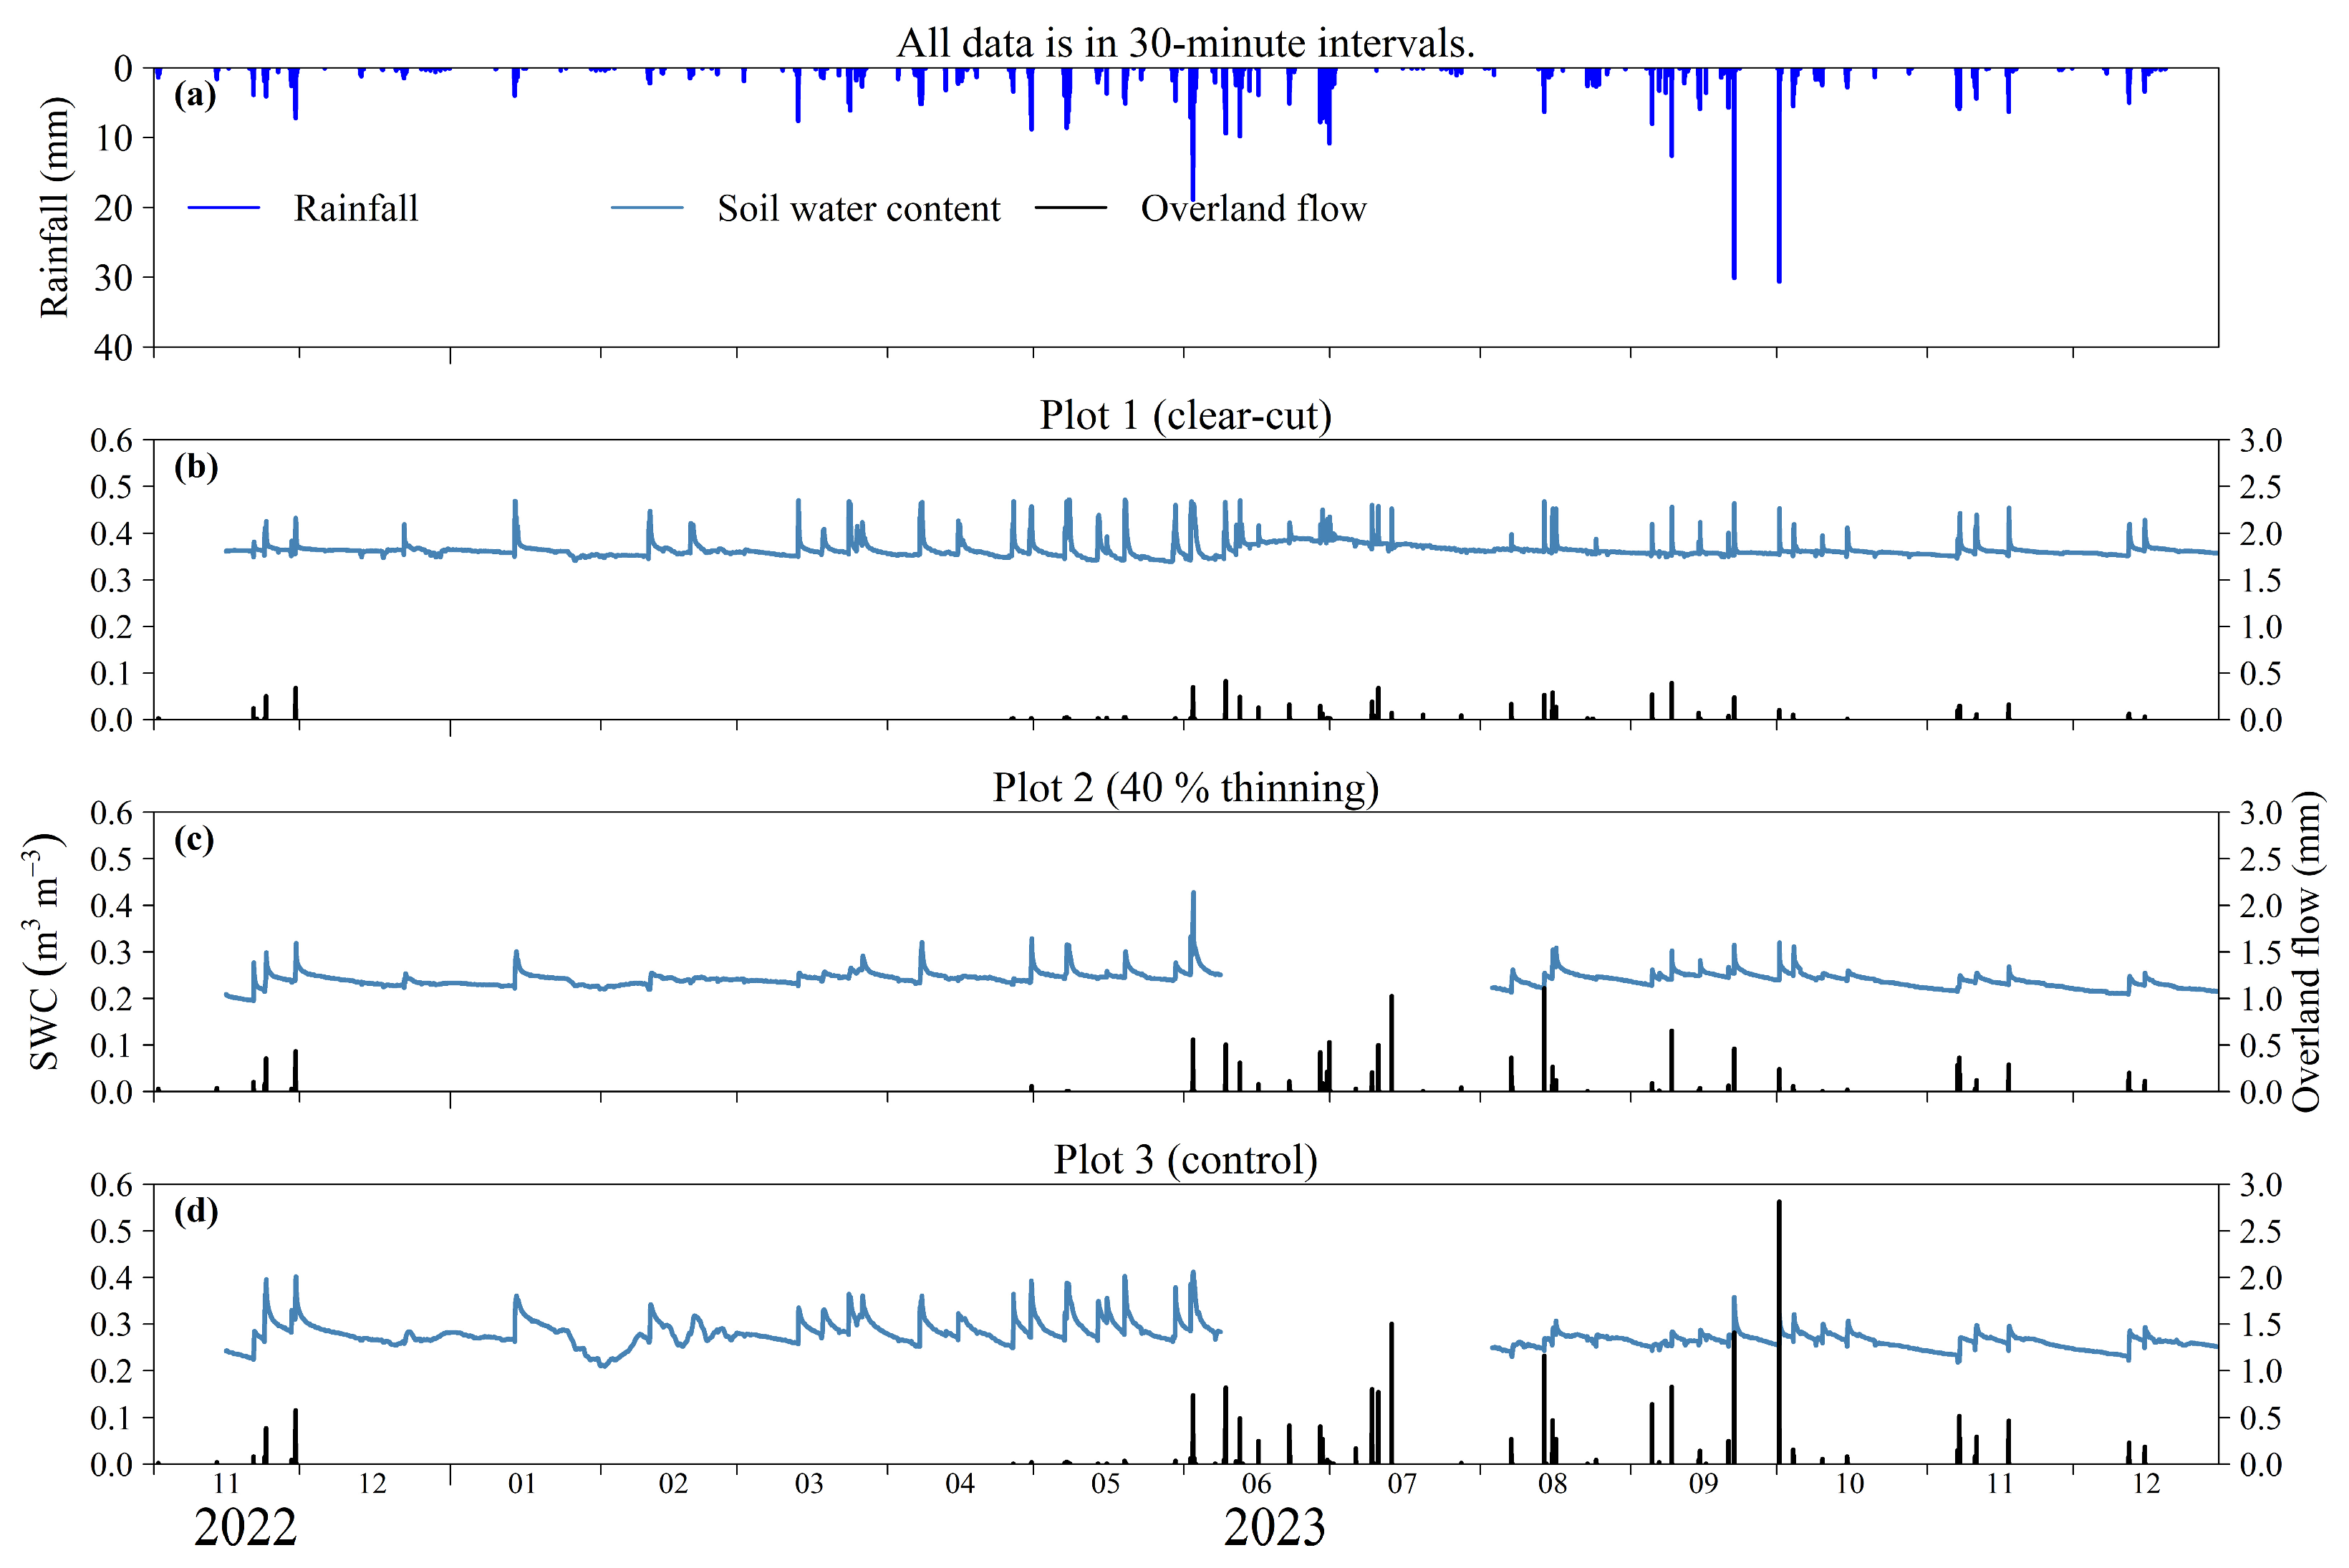
Throughout the observation period, distinct differences in SWC and OF dynamics were evident among the three plots (Figure 3). Plot 1 consistently showed a larger SWC, with sharp peaks during rainfall events that quickly returned to the baseline, while producing the lowest OF volumes. This pattern indicated a greater infiltration capacity and reduced OF generation (Figure 3). Another noteworthy point is that more SWC peaks were observed in Plot 1, where the sensor responded to nearly every rainfall event, indicating a higher soil moisture than in the other plots. In contrast, Plots 2 and 3 both maintained a lower SWC than Plot 1, with more gradual declines after peak values. Plot 2 generally had a lower SWC than Plot 3 and showed muted responses to rainfall fluctuations, whereas Plot 3 exhibited greater SWC variability and generated the most frequent and highest OF, reflecting restricted infiltration under a dense canopy (Figure 3). Overall, Plot 2 exhibited an intermediate pattern, with moderate OF generation and weaker SWC responses to rainfall compared to Plots 1 and 3.

3.3. Mechanism of Overland Flow Generation

Correlation Between Overland Flow and Event Characteristics

In Plot 1, total rainfall showed a strong and significantly positive correlation with total OF (r = 0.60, p = 0.003), indicating that rainfall volume was the primary factor controlling OF generation (Table 3). Peak SWC had a moderate positive correlation with OF (r = 0.42, p = 0.05), suggesting that OF occurred as subsurface flow rather than under infiltration-excess (Hortonian) conditions (Table 3). In Plot 2, no rainfall or SWC variables were significantly correlated with OF (Table 3). These weak and inconsistent relationships indicate that OF generation was spatially heterogeneous and not dominated by a single rainfall or soil moisture factor (Table 3). Conversely, in Plot 3, short-term maximum rainfall exerted the strongest influence on OF (Table 3). The 10-, 30-, and 60-min maximum rainfall all showed significantly positive correlations with total OF (r = 0.55–0.75, p < 0.01), while total rainfall showed only a weak, non-significant relationship (Table 3). These results suggest that Hortonian OF occurred in Plot 3, where intense short-duration rainfall bursts exceeded the infiltration capacity of the undisturbed forest floor (Table 3).

3.4. High-Amount vs. High-Intensity Rainfall Events

During event 6 (1–3 June 2023), the highest total rainfall of the study period (215.2 mm) was recorded over 29.4 h, with an average intensity of 7.3 mm h−1 (Figure 4), the second highest during the study period. In Plot 1, SWC peaked earlier than the rainfall intensity and then remained high and stable for several hours before and after the rainfall peak, indicating sustained soil subsurface saturation. In Plot 2, SWC and rainfall peaks were closely aligned, suggesting a quicker but less intense soil subsurface saturation response. Conversely, Plot 3 displayed multiple SWC peaks during the event, reflecting the variable soil moisture dynamics under the dense canopy. In contrast to the SWC patterns, the cumulative OF was the lowest in Plot 1 (1.16 mm), intermediate in Plot 2 (1.68 mm), and the highest and most prolonged in Plot 3 (2.75 mm) (Table 2 and Figure 4).
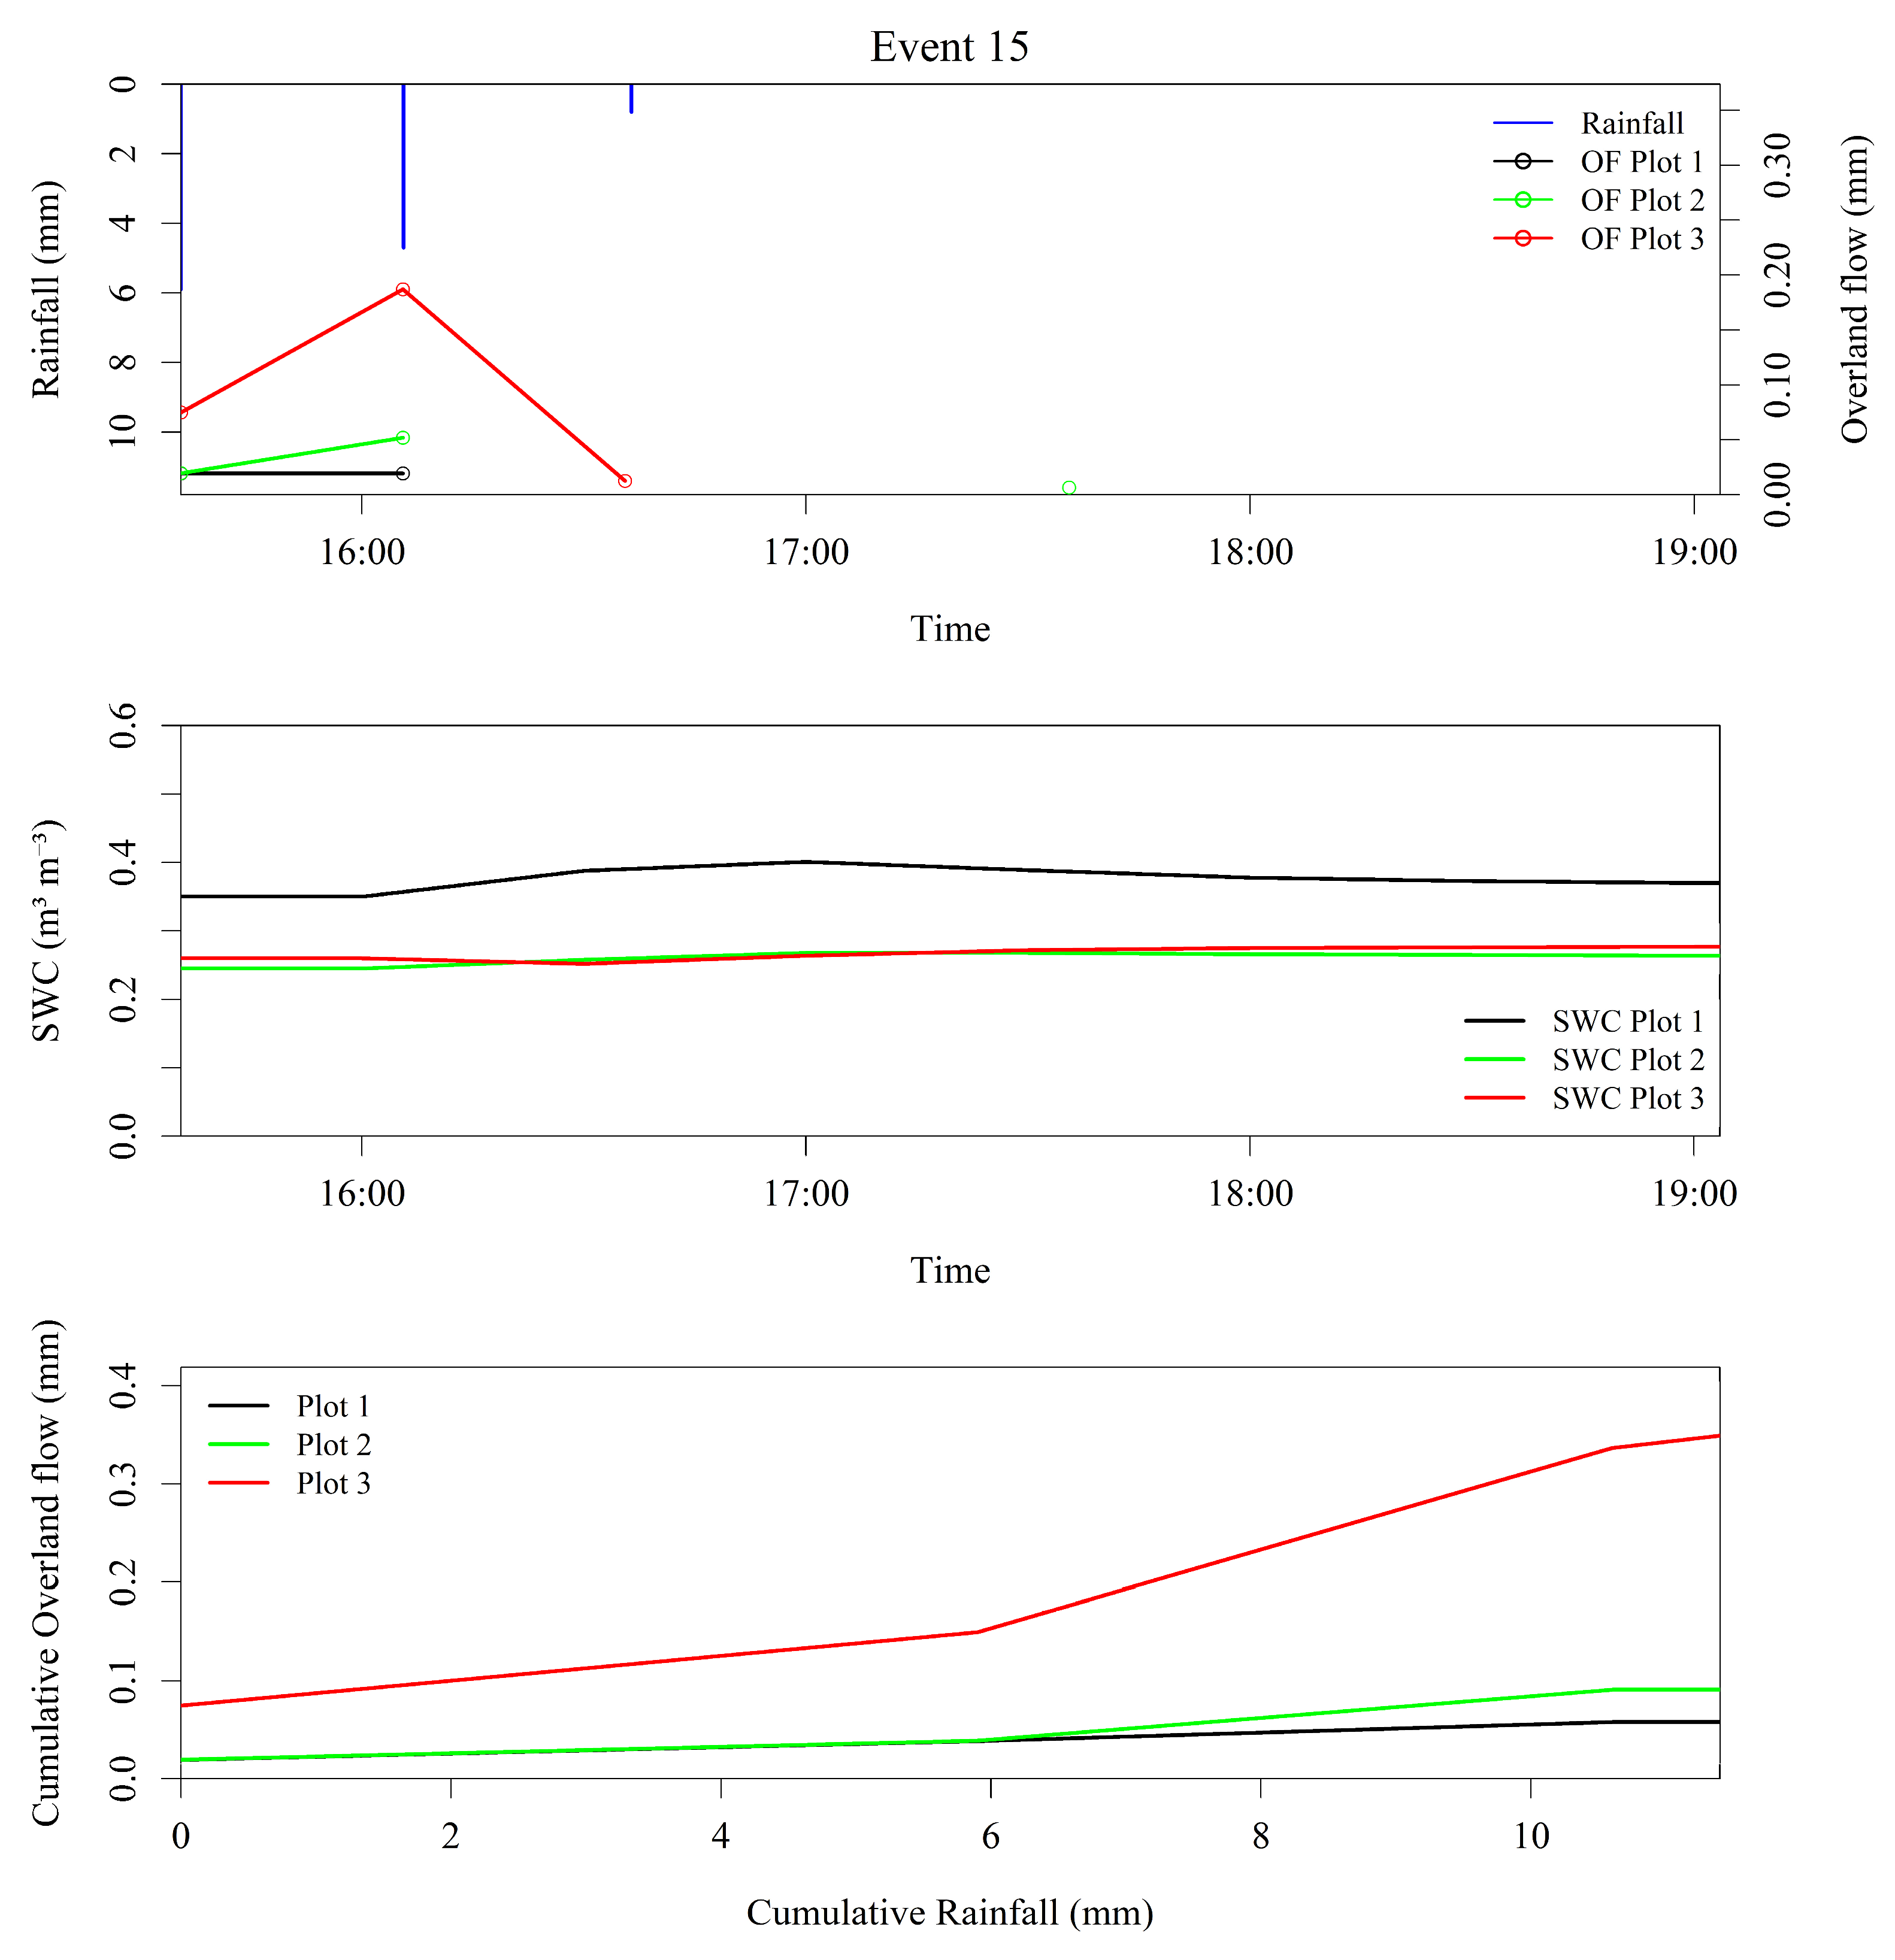
During event 15 (20 September 2023), the highest average rainfall intensity of the study period was recorded (7.8 mm h−1), with a total of 11.4 mm over 1.5 h (Figure 5). In Plot 1, SWC was the highest among the plots and showed a slight increase following the rainfall peak. In contrast, SWC in Plots 2 and 3 remained largely unchanged, indicating a limited soil moisture response under such short-duration, high-intensity conditions. The cumulative OF responses differed among the plots: sharp in Plot 3 (0.27 mm), intermediate in Plot 2 (0.08 mm), and lowest in Plot 1 (0.04 mm) (Figure 5).

4. Discussion

OF was the greatest in Plot 3, where OF generation was primarily driven by short-term maximum rainfall intensities, particularly the 10-, 30-, and 60-min peak rainfall intervals. In the managed plots, especially Plot 1, OF generation was more strongly related to the total rainfall amount, and the absence of a measurable time lag between rainfall and OF peaks suggests that flow occurred mainly as rapid subsurface flow rather than as surface saturation excess. In Plot 2, OF generation appeared to be influenced by a combination of factors, indicating a more complex and transitional hydrological response. These findings are consistent with our hypothesis that OF was lowest in Plot 1 with higher ground cover, intermediate in Plot 2, and highest in Plot 3 with sparse cover.
Pre- and post-thinning monitoring by Farahnak et al. [11] showed that thinning with felled logs reduced OF for up to three years relative to the untreated control in a similar cypress plantation. Here, we found that clear-cutting, which increased ground cover by 35% within four years, produced lower OF than 40% thinning, where ground cover remained sparse (5%). These results highlight the critical role of ground cover in mitigating OF and enhancing infiltration [16]. Comparable effects have been reported elsewhere, such as in Mediterranean vineyards, where straw mulch reduced surface runoff [24], and in cypress plantations in Mie Prefecture, Japan, where dense understory ferns (>85% cover) delayed and reduced OF compared to sparse understory conditions (<10%) [25]. Collectively, these studies reinforce the notion that increased ground or understory cover, whether managed or natural, strongly regulates OF generation.
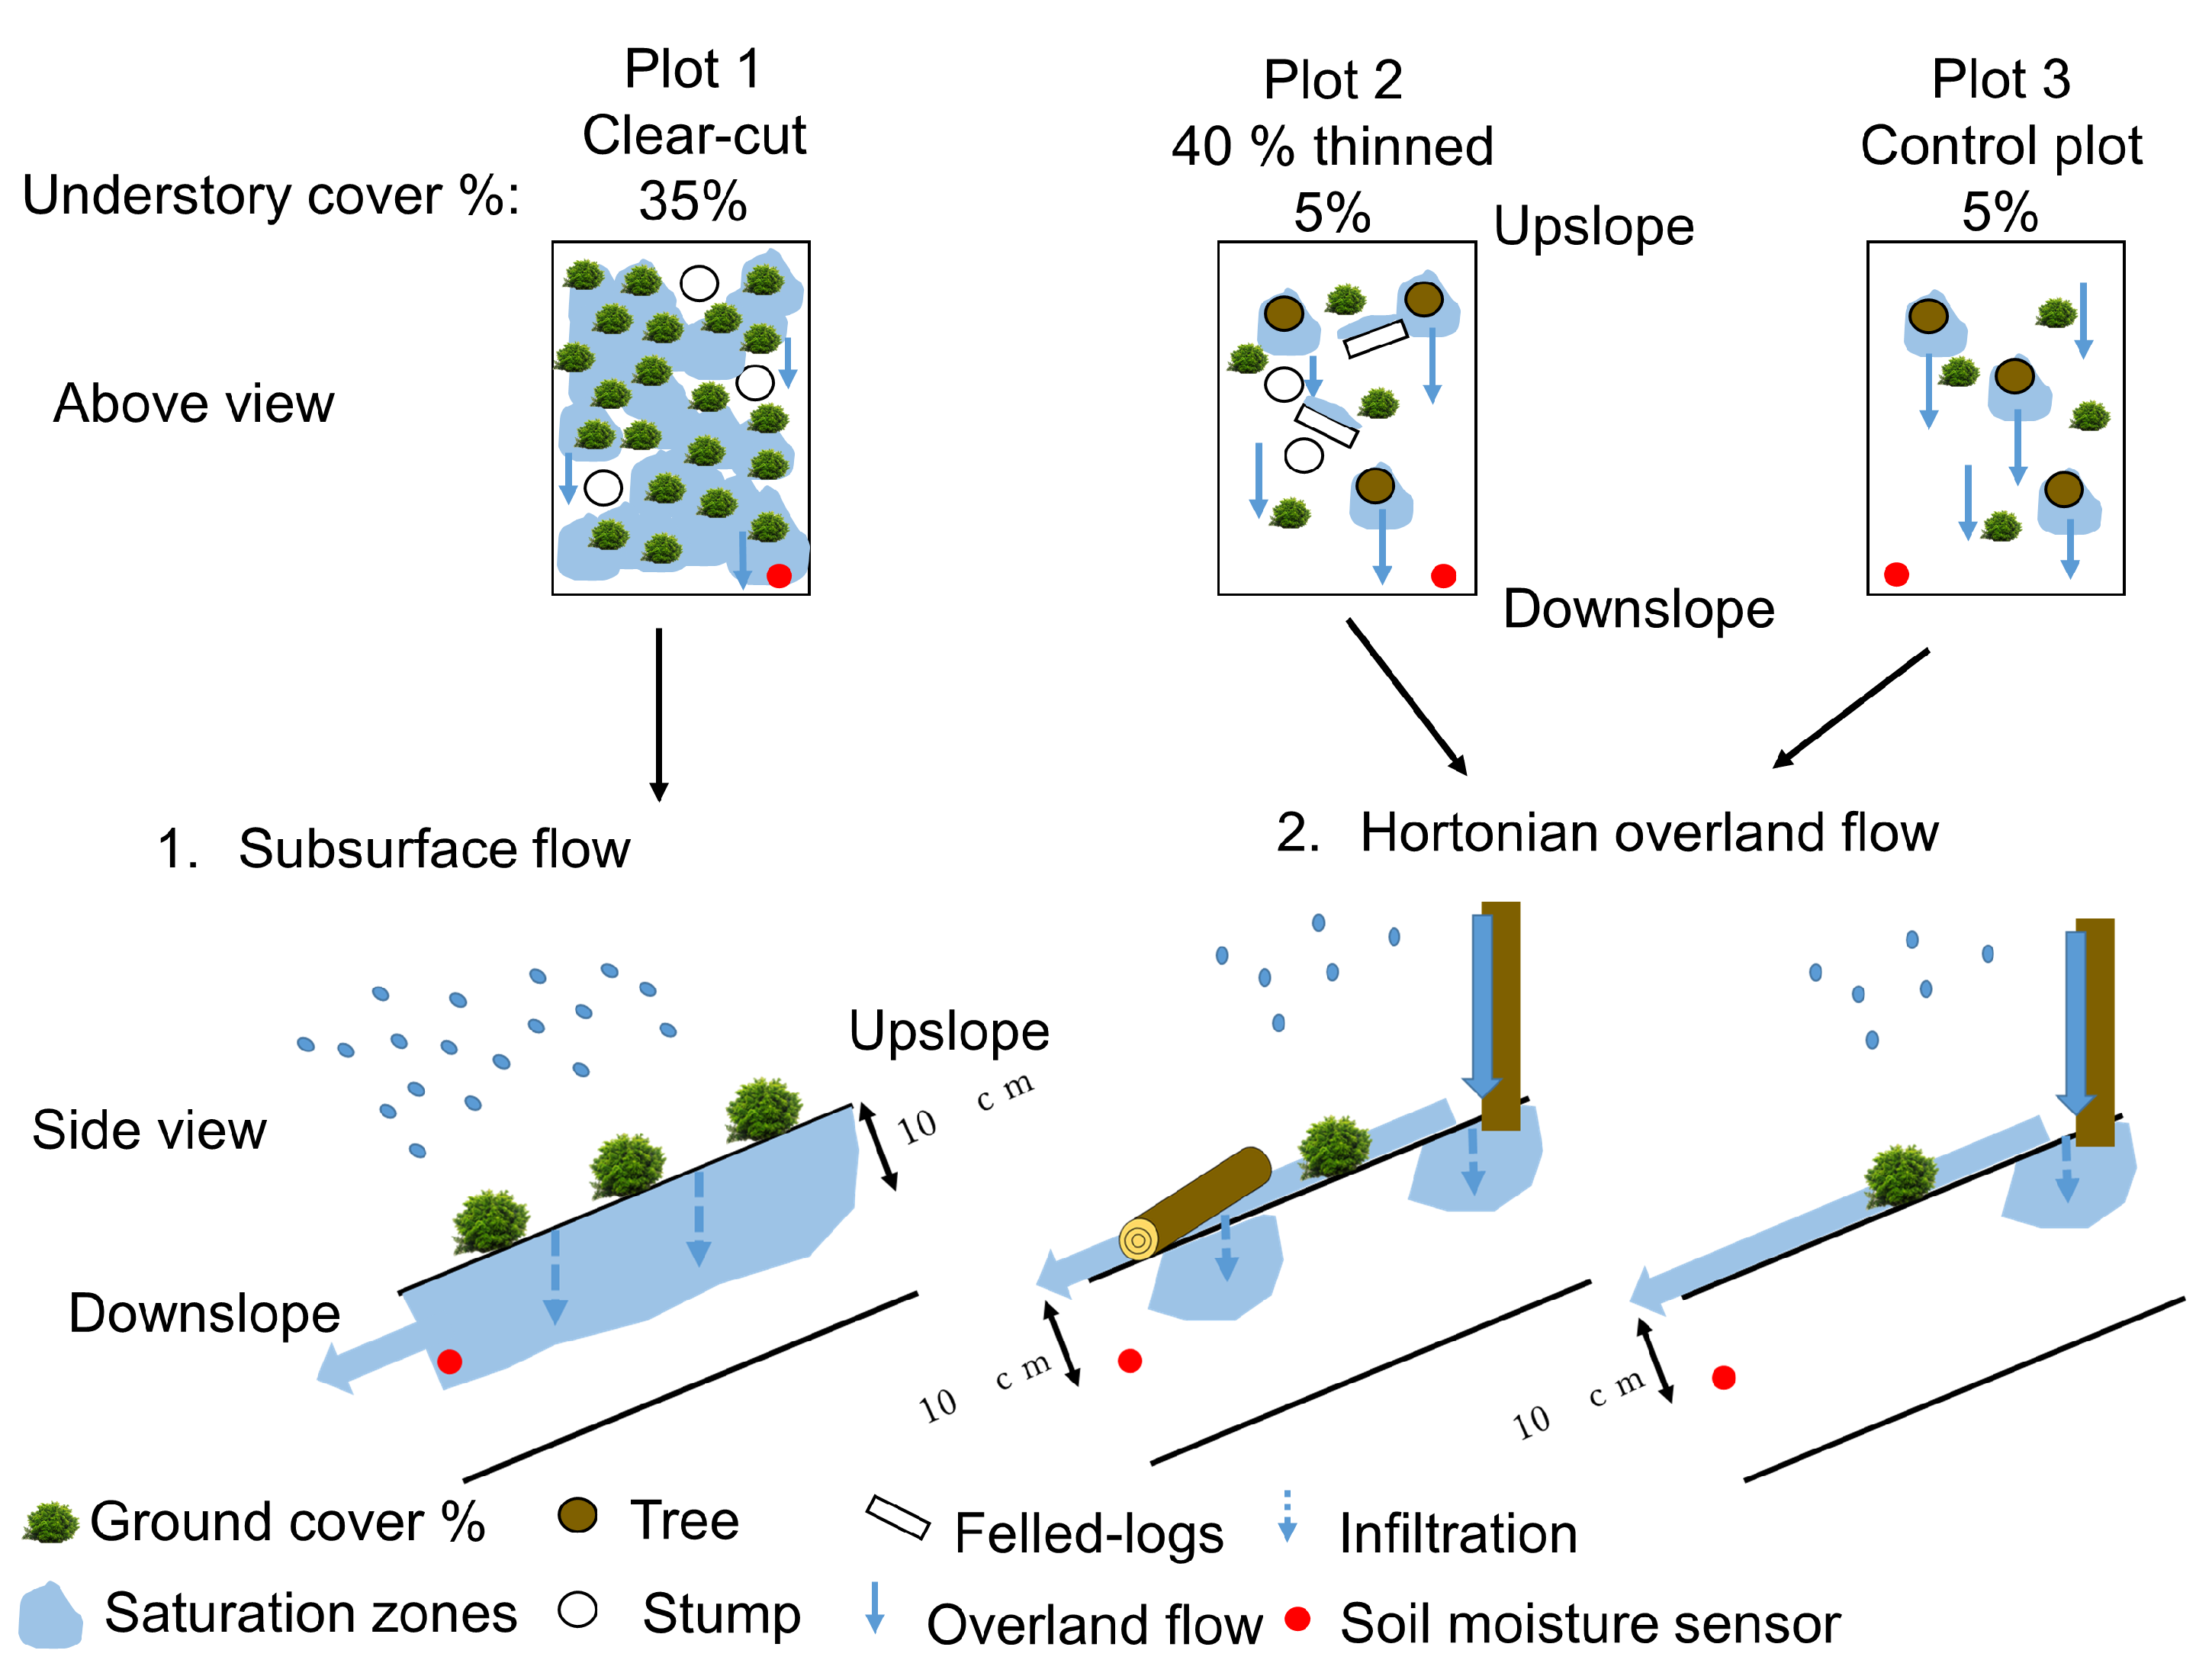
Mechanistically, OF in Plot 3 was consistent with Hortonian processes. Under the dense canopy, short bursts of rainfall were concentrated as throughfall and stemflow, rapidly encountering a water-repellent surface layer that suppressed infiltration and triggered OF [26]. In contrast, Plot 1 showed subsurface flow indicating that rainfall was more evenly distributed across the surface, and increased ground cover enhanced infiltration until the soil neared saturation, where subsurface flow occurred. Plot 2 showed intermediate responses, as the canopy opening increased throughfall, while felled logs added roughness and disrupted shallow flow paths, reducing direct delivery downslope [7].
Previous work has also highlighted the influence of forest floor litter and root mats in facilitating rapid near-surface “biomat flow” during intense rainfall [27,28,29,30,31]. At our site, both Plots 2 and 3 contained root mats ~3 cm thick [23]. The strongest Hortonian OF occurred in Plot 3 during event 17 after 20 rain-free days when soil repellency likely suppressed infiltration [23]. Moreover, the average rainfall intensity during this event (3.5 mm h−1) was very close to the measured unsaturated hydraulic conductivity of the soil (3.59 mm h−1), and together with the elevated soil water repellency, infiltration capacity was likely reduced, resulting in Hortonian OF generation in the control plot [32]. Conversely, clear-cutting often reduces fine root density [33], which explains the shift toward subsurface flow and a larger infiltration response in clear-cut plots.
Case studies of events 6 and 15 further illustrate these contrasts, representing the largest total rainfall and highest rainfall intensity observed during the monitoring period, respectively. In event 6, Plot 1 generated OF at the SWC peak preceding the rainfall peak, consistent with subsurface flow responses, whereas Plot 3 showed OF before the SWC increased, indicating Hortonian flow. At event 15, Plot 1 showed only minimal OF despite a clear increase in SWC, whereas Plot 3 produced the highest OF. Plot 2 consistently showed intermediate behavior, with muted SWC responses but with runoff amounts between Plots 1 and 3. These examples demonstrate a gradient from the subsurface saturation control OF in Plot 1 with high ground cover through mixed responses in Plot 2 to intensity-driven Hortonian flow in Plot 3 (Figure 6), findings consistent with Miyata et al. [34].
Although clear-cutting reduced OF in our study by enhancing ground cover, its broader application should be considered carefully, because site-specific factors such as slope and root dynamics may influence long-term stability [35]. In the humid climate of Japan, it is likely that partial or small-scale clear-cutting can be hydrologically safe when implemented on gentle slopes with sufficient sunlight (e.g., south–southeast-facing slopes), where post-harvest vegetation tends to recover quickly. In contrast, large-scale clear-cutting on steep slopes should be avoided because the risk of slope failure may increase following stump-root decay over time.
However, this study was conducted using small experimental plots (4 m wide × 10 m long), and the design allowed for the precise monitoring of rainfall, OF, and SWC under controlled conditions. As such, the results primarily clarify the mechanisms of OF generation under different forest management treatments, rather than their quantitative effects at the slope or catchment scales. Future research should extend these observations to larger plots or catchment-level studies to assess spatial variability and evaluate how these mechanisms influence total runoff and sediment yield at broader scales.

5. Conclusions

We examined OF generation under clear-cut, 40% thinning, and control conditions in a Japanese cypress plantation. OF, SWC, and rainfall were monitored over 1 year to clarify treatment differences. The control plot (Plot 3), with limited ground cover (5%) and low SWC, produced the highest OF, consistent with intensity-driven Hortonian OF. In contrast, the clear-cut plot (Plot 1), with higher ground cover (35%) and higher SWC, produced the lowest OF, consistent with subsurface flow and larger infiltration responses. The 40% thinned plot (Plot 2) showed OF amounts between the clear-cut and control plots. The presence of contour-felled logs likely helped disperse shallow lateral flow and reduce concentrated OF, contributing to the reduced OF compared with the control plot. Overall, our findings highlight the importance of forest management in enhancing ground cover and reducing susceptibility to Hortonian flows in Japanese cypress plantations. However, the implications of clear-cutting should be interpreted with caution. Our findings show that different management methods lead to different types of OF, and that forest cover and ground surface conditions are key factors.

Author Contributions

Conceptualization, M.F. and T.O.; methodology, K.K. and N.T.; software, M.F.; validation, K.K., N.T., T.S. and T.O.; formal analysis, M.F.; investigation, M.F. and T.S.; resources, K.K. and N.T.; data curation, M.F.; writing—original draft preparation, M.F.; writing—review and editing, M.F., T.O., N.T. and K.K.; visualization, M.F.; supervision, K.K. and N.T.; project administration, K.K. and N.T.; funding acquisition, K.K. All authors have read and agreed to the published version of the manuscript.

Funding

This work was supported in part by Toyota City Municipality.

Data Availability Statement

The original contributions presented in this study are included in the article. Further inquiries can be directed to the corresponding author.

Acknowledgments

We gratefully acknowledge the staff of the Ecohydrology Research Institute for their invaluable assistance during fieldwork. We also thank Haruhiko Suzuki and Yoshimasa Nakane of Toyota City Municipality for their kind support throughout this study.

Conflicts of Interest

The authors declare no conflict of interest. The funders had no role in the study design; collection, analyses, or interpretation of data; writing of the manuscript; or decision to publish the results.

References

  1. Bruijnzeel, L.A.; Mulligan, M.; Scatena, F.N. Hydrometeorology of tropical montane cloud forests: Emerging patterns. Hydrol. Process. 2011, 25, 465–498. [Google Scholar] [CrossRef]
  2. Koyanagi, K.; Andreoli, A.; Nordio, G.; Pitscheider, F.; Tomelleri, E.; Comiti, F. Disturbance-intervention interactions on post-windthrow hillslope runoff and erosion processes in the Eastern Italian Alps. J. Hydrol. 2025, 656, 133001. [Google Scholar] [CrossRef]
  3. Sadeghi, S.H.R.; Khazayi, M.; Mirnia, S.K. Effect of soil surface disturbance on overland flow, sediment yield, and nutrient loss in a hyrcanian deciduous forest stand in Iran. Catena 2022, 218, 106546. [Google Scholar] [CrossRef]
  4. Tamer, M.; Adego, E.; Abiyu, A. Understanding rainfall runoff dynamics across various land uses and landscape positions in North Western Ethiopia. Sci. Rep. 2025, 15, 15287. [Google Scholar] [CrossRef] [PubMed]
  5. Japan Forestry Agency. Annual Report on Forest and Forestry in Japan Fiscal Year 2022 (Summary); Ministry of Agriculture, Forestry and Fisheries: Tokyo, Japan; Japan Forestry Agency: Chiyoda, Japan, 2023; p. 42. Available online: https://www.maff.go.jp/e/data/publish/attach/pdf/index-193.pdf (accessed on 23 July 2024).
  6. Kubota, T.; Tsuboyama, Y.; Nobuhiro, T. Effects of thinning on canopy interception loss, evapotranspiration, and runoff in a small headwater Chamaecyparis obtusa catchment in Hitachi Ohta Experimental Watershed in Japan. Bull. For. For. Prod. Res. Inst. 2018, 17, 63–73. [Google Scholar]
  7. Dung, X.B.; Miyata, S.; Gomi, T. Effect of forest thinning on overland flow generation on hillslopes covered by Japanese cypress. Ecohydrology 2011, 4, 367–378. [Google Scholar] [CrossRef]
  8. Iwakiri, K.; Ito, S.; Mitsuda, Y.; Hirata, R. Short-term effects of different thinning methods on degradation and recovery of understory vegetation of a hinoki (Chamaecyparis obtusa) plantation. Veg. Sci. 2019, 36, 43–59, (In Japanese with English Abstract). [Google Scholar]
  9. Junsuk, K.; Kubota, T.; Shiraki, K. Long-term effects of thinning on runoff change from coniferous forest plantations in headwater catchments. Hydrol. Res. Lett. 2025, 19, 72–79. [Google Scholar] [CrossRef]
  10. Japan Forestry Agency. Annual Report on Forest and Forestry in Japan Fiscal Year 2023 (Summary); Ministry of Agriculture, Forestry and Fisheries: Tokyo, Japan; Japan Forestry Agency: Chiyoda, Japan, 2024; p. 15. Available online: https://www.maff.go.jp/e/data/publish/attach/pdf/AnnualReportonForestandForestryinJapan_FY2023_web.pdf (accessed on 4 September 2025).
  11. Farahnak, M.; Tanaka, N.; Sato, T.; Nainar, A.; Gomyo, M.; Kuraji, K.; Suzaki, T.; Suzuki, H.; Nakane, Y. Enhancing Overland Flow Infiltration through Sustainable Well-Managed Thinning: Contour-Aligned Felled Log Placement in a Chamaecyparis obtusa Plantation. Sustainability 2023, 15, 14124. [Google Scholar] [CrossRef]
  12. Kuraji, K.; Gomyo, M.; Nainar, A. Thinning of cypress forest increases subsurface runoff but reduces peak storm-runoff: A lysimeter observation. Hydrol. Res. Lett. 2019, 13, 49–54. [Google Scholar] [CrossRef]
  13. Asano, Y.; Mizuuchi, Y.; Kishimoto, K.; Tanaka, N.; Bunte, K. Changes in sediment discharge over the 20th century from a mountain catchment that has experienced severe anthropogenic disturbances. Earth Surf. Process. Landf. 2025, 50, e6071. [Google Scholar] [CrossRef]
  14. Monger, F.; Bond, S.; Spracklen, D.V.; Kirkby, M.J. Overland flow velocity and soil properties in established semi-natural woodland and wood pasture in an upland catchment. Hydrol. Process. 2022, 36, e14567. [Google Scholar] [CrossRef]
  15. Miyata, S.; Onda, Y.; Gomi, T.; Mizugaki, S.; Asai, H.; Hirano, T.; Fukuyama, T.; Kosugi, K.; Sidle, R.C.; Terajima, T.; et al. Factors affecting generation of Hortonian overland flow in forested hillslopes: Analysis of observation results at three sites with different geology and rainfall characteristics. J. Jpn. For. Soc. 2009, 91, 398–407, (In Japanese with English Summary). [Google Scholar] [CrossRef]
  16. Castillo, V.M.; Martinez-Mena, M.; Albaladejo, J. Runoff and soil loss response to vegetation removal in a semiarid environment. Soil Sci. Soc. Am. J. 1997, 61, 1116–1121. [Google Scholar] [CrossRef]
  17. Farahnak, M.; Sato, T.; Tanaka, N.; Nainar, A.; Chaus, I.M.; Kuraji, K. Impact of thinning and contour-felled logs on overland flow, soil erosion, and litter erosion in a monoculture Japanese cypress forest plantation. Water 2024, 16, 2874. [Google Scholar] [CrossRef]
  18. Kottek, M.; Grieser, J.; Beck, C.; Rudolf, B.; Rubel, F. World map of the Köppen-Geiger climate classification updated. Meteorol. Z. 2006, 15, 259–263. [Google Scholar] [CrossRef] [PubMed]
  19. JMA (Japan Meteorological Agency). The Normal Value of Toyota City, Aichi Prefecture. 2020. Available online: https://www.data.jma.go.jp/stats/etrn/view/nml_amd_ym.php?prec_no=51&block_no=0464&year=&month=&day=&view= (accessed on 26 September 2024). (In Japanese)
  20. Tobe, H.; Chigira, M.; Doshida, S. Comparisons of landslide densities between rock types in weathered granitoid in Obara village, Aichi prefecture. J. Jpn. Soc. Eng. Geol. 2007, 48, 66–79, (In Japanese with English Abstract). [Google Scholar] [CrossRef]
  21. Forest Soil Division. Classification of forest soil in Japan (1975). Bull. Gov. For. Exp. Stn. 1976, 280, 1–28, (In Japanese with English Summary). [Google Scholar]
  22. IUSS Working Group WRB. World reference base for soil resources 2014, update 2015: International soil classification system for naming soils and creating legends for soil maps. World Soil Sci. Res. 2015, 106, 192. [Google Scholar]
  23. Farahnak, M.; Sato, T.; Otani, Y.; Kuraji, K.; Suzaki, T. The Differences in Water Repellency in Root Mat (Biomat) and Soil Horizons of Thinned and Non-thinned Chamaecyparis obtusa (Siebold et Zucc.) Endl. Plantations. Forests 2023, 14, 210. [Google Scholar] [CrossRef]
  24. Prosdocimi, M.; Jordán, A.; Tarolli, P.; Keesstra, S.; Novara, A.; Cerdà, A. The immediate effectiveness of barley straw mulch in reducing soil erodibility and surface runoff generation in Mediterranean vineyards. Sci. Total Environ. 2016, 547, 323–330. [Google Scholar] [CrossRef]
  25. Gomi, T.; Sidle, R.C.; Ueno, M.; Miyata, S.; Kosugi, K.I. Characteristics of overland flow generation on steep forested hillslopes of central Japan. J. Hydrol. 2008, 361, 275–290. [Google Scholar] [CrossRef]
  26. Levia, D.F.; Germer, S. A review of stemflow generation dynamics and stemflow-environment interactions in forests and shrublands. Rev. Geophys. 2015, 53, 673–714. [Google Scholar] [CrossRef]
  27. Moody, J.A.; Shakesby, R.A.; Robichaud, P.R.; Cannon, S.H.; Martin, D.A. Current research issues related to post-wildfire runoff and erosion processes. Earth-Sci. Rev. 2013, 122, 10–37. [Google Scholar] [CrossRef]
  28. Lee, H.H.; Shibano, H. Hydraulic characteristics of storm water flowing through litter layer. J. Jpn. For. Soc. 1990, 72, 223–229. (In Japanese) [Google Scholar]
  29. Sidle, R.C.; Hirano, T.; Gomi, T.; Terajima, T. Hortonian overland flow from Japanese forest plantations—An aberration, the real thing, or something in between? Hydrol. Process. 2007, 21, 3237–3247. [Google Scholar] [CrossRef]
  30. Leuteritz, A.; Gauthier, V.A.; van Meerveld, I. Spatial and Temporal Variability in Event Water in Near-Surface Flow Pathways in a Humid Steep Headwater Catchment. Hydrol. Process. 2025, 39, e70186. [Google Scholar] [CrossRef]
  31. Ide, J.; Shinohara, Y.; Higashi, N.; Komatsu, H.; Kuramoto, K.; Otsuki, K. A preliminary investigation of surface runoff and soil properties in a moso-bamboo (Phyllostachys pubescens) forest in western Japan. Hydrol. Res. Lett. 2010, 4, 80–84. [Google Scholar] [CrossRef]
  32. Badoux, A.; Witzig, J.; Germann, P.F.; Kienholz, H.; Lüscher, P.; Weingartner, R.; Hegg, C. Investigations on the runoff gen-eration at the profile and plot scales, Swiss Emmental. Hydrol. Process. 2006, 20, 377–394. [Google Scholar] [CrossRef]
  33. Farahnak, M.; Mitsuyasu, K.; Hishi, T.; Katayama, A.; Chiwa, M.; Jeong, S.; Otsuki, K.; Sadeghi, S.M.M.; Kume, A. Relationship between very fine root distribution and soil water content in pre-and post-harvest areas of two coniferous tree species. Forests 2020, 11, 1227. [Google Scholar] [CrossRef]
  34. Miyata, S.; Kosugi, K.I.; Gomi, T.; Mizuyama, T. Effects of forest floor coverage on overland flow and soil erosion on hillslopes in Japanese cypress plantation forests. Water Resour. Res. 2009, 45, W06402. [Google Scholar] [CrossRef]
  35. O′Loughlin, C.; Ziemer, R.R. The importance of root strength and deterioration rates upon edaphic stability in steepland forests. In Proceedings of the I.U.F.R.O. Workshop P.1.07-00 Ecology of Subalpine Ecosystems as a Key to Management, Corvallis, OR, USA, 2–3 August 1982; Oregon State University: Corvallis, OR, USA; pp. 70–78. [Google Scholar]
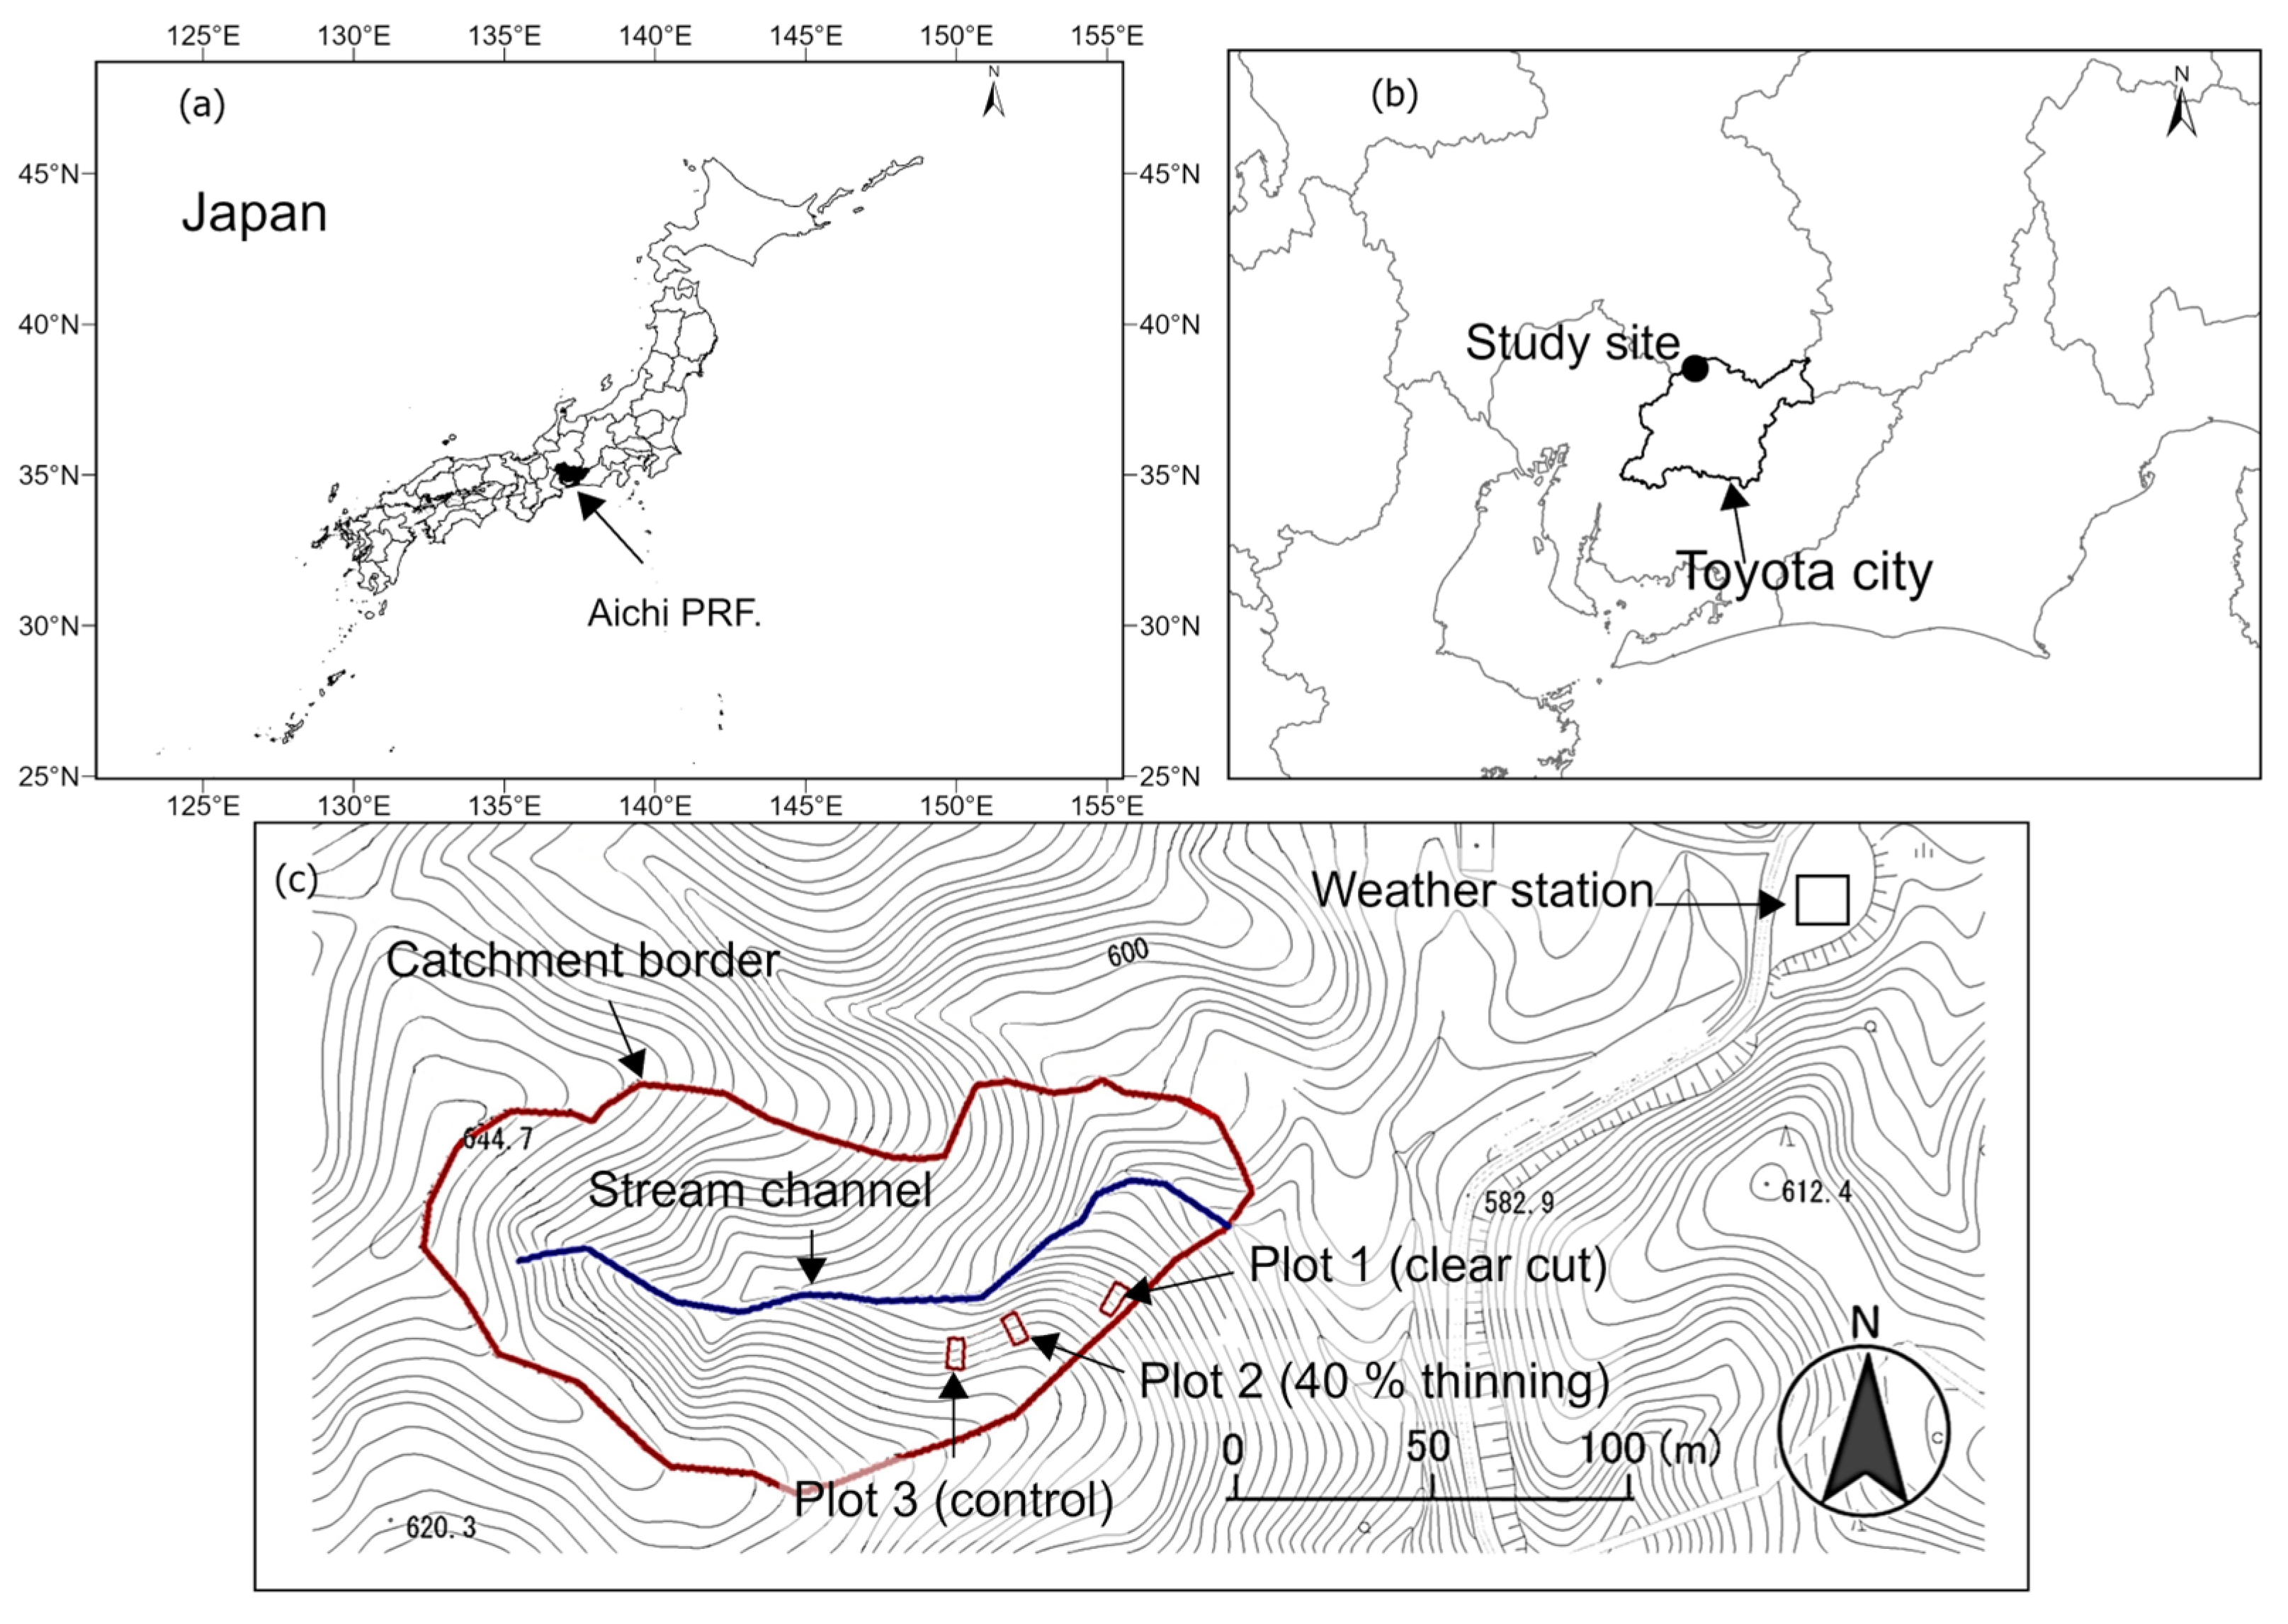
Figure 1. Map of the study site (a,b) and plots (c) in a Japanese cypress forest plantation in Toyota City, Aichi Prefecture, Japan.
Water 17 03385 g001
Figure 2. Plot conditions in September 2025. While photographs from 2023 are unavailable, understory conditions did not change substantially between 2023 (study year) and 2025.
Water 17 03385 g002
Figure 3. General trends of rainfall, overland flow, and soil water content across the three study plots from November 2022 to November 2023. The upper panel shows rainfall (a), while the lower panels show soil water content (blue lines) and overland flow (black bars) for Plot 1 (b), Plot 2 (c), and Plot 3 (d).
Water 17 03385 g003
Figure 4. Rainfall, soil water content (SWC), and overland flow (OF) dynamics during event 6.
Water 17 03385 g004
Figure 5. Rainfall, soil water content (SWC), and overland flow (OF) dynamics during event 15.
Water 17 03385 g005
Figure 6. Schematic illustration of soil-moisture dynamics and overland-flow mechanisms under different management treatments.
Water 17 03385 g006
Table 1. General statistics of the study plots in 2023.
Plot No.Treatment 1Plot Area (m2)Tree Density (Tree ha−1)Understory Cover
(%)
Slope Degree (Face)Tree Height (m)DBH (cm)
1Clear-cut31.1035.032° (NE)00
240% thinning30.86495.037° (NW)13.717.2
3Control32.19745.037° (NW)14.321.8
Note: 1. Treatment was conducted in early 2019. DBH: diameter at breast height.
Table 2. Rainfall–OF events in the study plots during the study period.
EventsRain AmountRain DurationRain IntensityOF Plot 1OF Plot 2OF Plot 3
mmhmm h−1mmmmmm
115.8012.521.260.150.270.17
231.6015.971.980.320.790.80
362.8039.861.580.731.221.96
465.1021.543.020.040.070.05
5174.1032.975.280.210.030.19
6215.2029.377.331.161.682.75
753.7015.133.550.640.751.74
854.9047.511.160.350.470.90
928.6016.461.740.260.221.09
1049.6020.322.440.330.560.95
1110.906.231.750.060.230.08
1235.9035.271.020.060.560.17
1310.905.931.840.280.150.69
1422.909.052.530.440.881.13
1511.401.477.780.040.080.27
1640.107.215.560.270.531.50
1740.0011.403.510.150.333.20
1840.4012.893.140.060.110.37
1928.8020.011.440.010.040.22
2049.9016.483.030.491.601.72
2140.8020.052.030.080.250.69
2227.9015.611.790.340.641.21
Total rain1111.30 Total OF6.4611.4521.88
OF rate (%)0.581.031.97
Note: OF denotes overland flow, and digits indicate the plot number. The OF rate (%) was calculated as (total OF/total rain) × 100.
Table 3. Results of Pearson’s correlation (r) analysis between total overland flow (OF) and rainfall and soil water content (SWC) characteristics in the three plots.
PlotPredictornrp-ValueSlopeInterceptSignificant
Plot 1 (clear-cut)Total rainfall220.5970.0030.0030.127**
Rain duration220.3170.1510.0070.154ns
Average rain intensity220.2890.1920.0420.171ns
10 min Max. rainfall220.2510.2610.0030.191ns
30 min Max. rainfall220.3390.1230.0180.130ns
60 min Max. rainfall220.4010.0640.0120.126ns
Initial SWC22−0.3890.073−8.1963.260ns
Peak SWC220.4180.0534.612−1.729ns
Plot 2 (40% thinning)Total rainfall220.3850.0770.0040.334ns
Rain duration220.2680.2270.0110.316ns
Average rain intensity220.1460.5160.0360.413ns
10 min Max. rainfall220.2300.3040.0040.357ns
30 min Max. rainfall220.2670.2300.0250.298ns
60 min Max. rainfall220.3120.1570.0160.295ns
Initial SWC16−0.0900.739−3.3131.323ns
Peak SWC160.3920.1334.686−0.851ns
Plot 3 (control)Total rainfall220.3290.1340.0060.704ns
Rain duration220.0740.7450.0050.892ns
Average rain intensity220.2780.2100.1260.624ns
10 min Max. rainfall220.5490.0080.0190.285**
30 min Max. rainfall220.6260.0020.1070.045***
60 min Max. rainfall220.7500.0000.0720.010**
Initial SWC160.1230.6517.093−0.806ns
Peak SWC160.2090.4383.425−0.056ns
Note: OF, total rainfall, and 10-, 30-, and 60 min maximum rainfall are in mm; rain duration in hours; average rain intensity in mm h−1; and initial and peak SWC in m3 m−3. ns indicates not significant; ** p < 0.01; *** p < 0.001.
Disclaimer/Publisher’s Note: The statements, opinions and data contained in all publications are solely those of the individual author(s) and contributor(s) and not of MDPI and/or the editor(s). MDPI and/or the editor(s) disclaim responsibility for any injury to people or property resulting from any ideas, methods, instructions or products referred to in the content.