1. Introduction
Ocean wave energy has received considerable attention over the past decade thanks to its great potential potential to reduce carbon footprint [
1]. Wave energy converters (WECs) are specific devices designed to convert wave power into electricity. Numerous WEC concepts have been proposed to date, with oscillating water column (OWC) type among the leading categories. Due to their simplicity in structure and reliability of working performance, the OWC-WECs have the largest number of prototypes deployed in the sea [
2], Even so, the wave-to-wire efficiency of energy conversion has long been recognized as the bottleneck of an OWC-WECs [
3]. making efficiency enhancement a primary focus of current technical research.
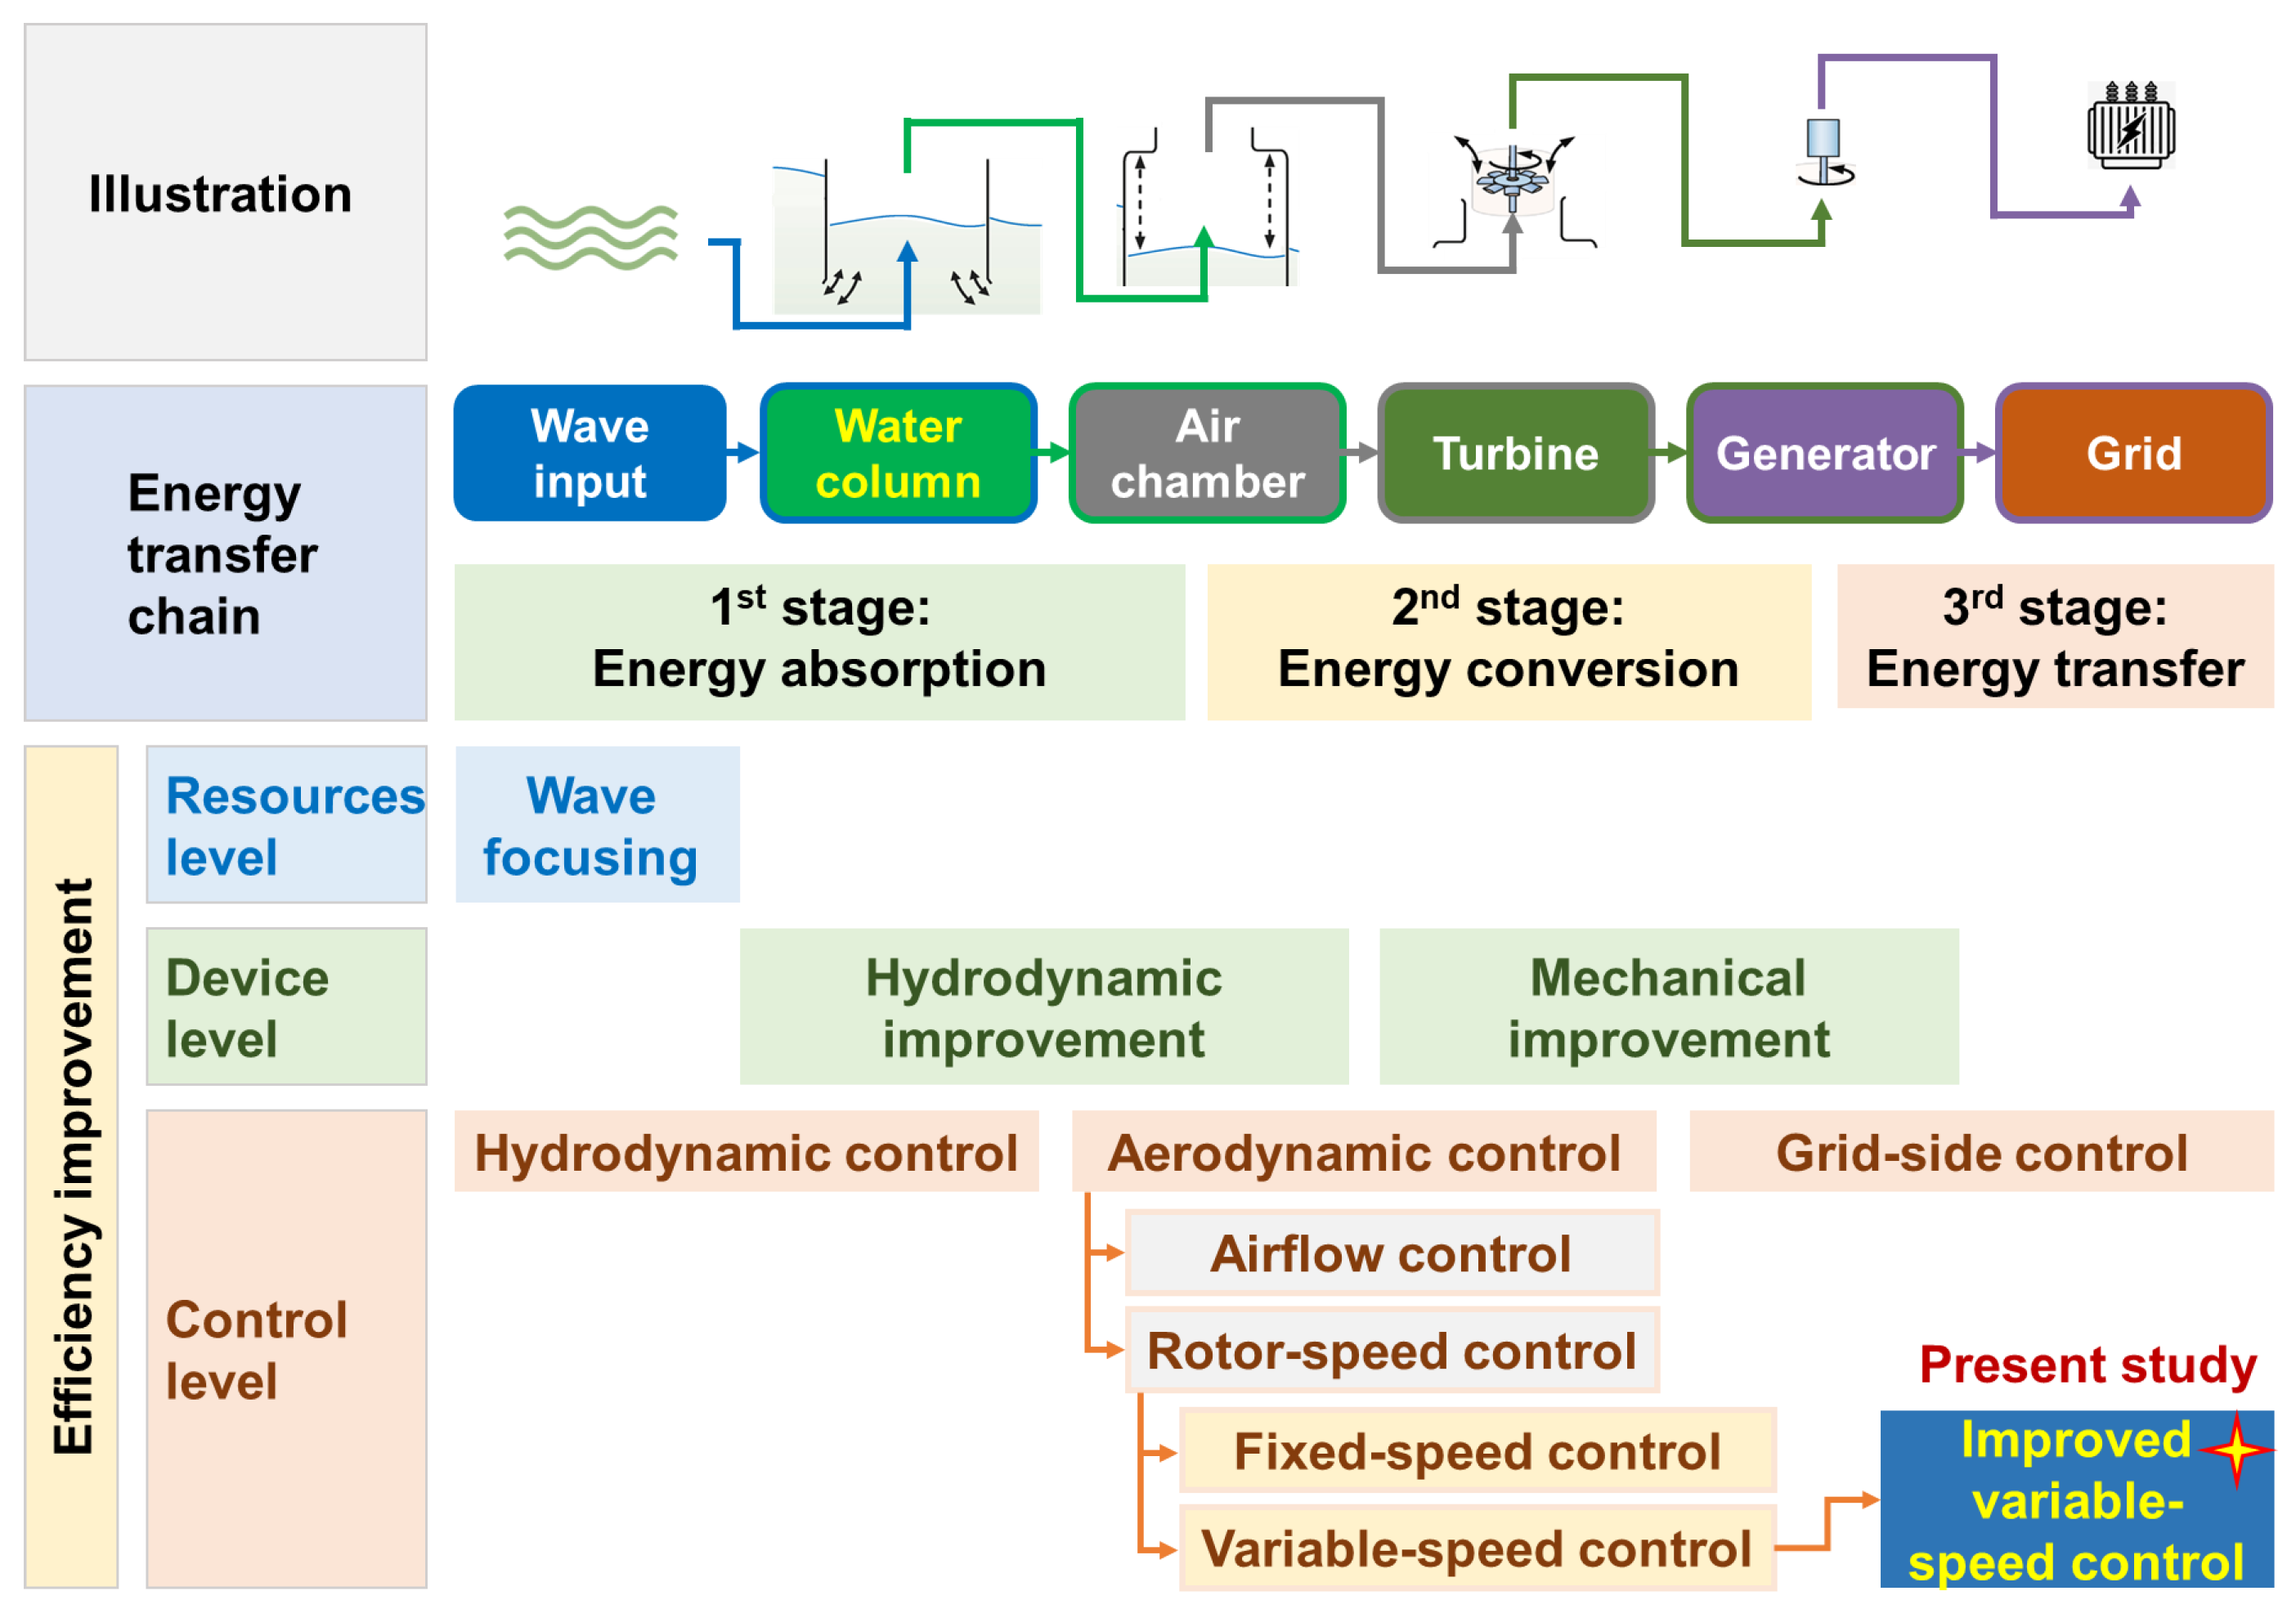
For an OWC-WEC, energy is transferred along the chain of wave environment, water column, air chamber, turbine, and generator before finally entering the grid. As shown in
Figure 1, the efficiency improvement can be made at various “nodes” of the chain. In theory, efficiency can be improved on the level of resources, equipment, and control, respectively.
On the level of resources, the key idea is to amplify or accumulate the total energy in the wave field. Among the few pioneers, Zhang and Ning [
4] first proposed the concept of using parabolic openings to focus propagating waves toward specific positions in a wave farm for energy harvesting. The effectiveness of the idea was subsequently confirmed in different scenarios of WEC applications [
3,
5,
6].
On the level of device, either the hydrodynamic or mechanical efficiency of an OWC-WEC device can be increased. Hydrodynamic efficiency is normally improved by modifying the geometrical configuration of the chamber [
7] or design parameters of the air orifice opening [
8]. For mechanical efficiency, efforts are mainly made to reduce the aerodynamic losses of the self-rectifying air turbine, through configuration modification of guide vanes or rotor blades [
9,
10,
11].
On the level of control, additional strategies can be introduced at various stages of the energy transfer chain. The performance of OWC-WECs can be dynamically adjusted based on the instantaneous or short-term working status of the device. Improvement on the control level is the focus of this study, which is to be described in more detail.
Improvement on the level of control is mainly developed to adapt irregular wave states with strong time-varying characteristics, which can be further classified as hydrodynamic, aerodynamic, and grid-side control, respectively [
12].
The hydrodynamic control is for the purpose of increasing the capture-width-ratio (CWR) of a WEC device of the energy absorption stage (or the “first stage”). The latching strategy, first proposed by Budal and Falnes [
13], is often adopted. In practice, the floater can be locked and released alternatively, so that the velocity of the floater and the force acting on it can reach an in-phase status. For fixed OWC-WECs, such a phase control process can be achieved by closing the valve in series with the turbine for some duration. The hydrodynamic control is achievable in theory, which requires no reactive power flow and two-way energy transfer.
The aerodynamic control is mainly introduced to improve the working conditions of the air turbine. It has been recognized that both of the most popular self-rectifying air turbines, i.e., the Wells turbine and the impulse turbine, have non-negligible defects for energy conversion from airflow to turbine rotor. To be specific, the Wells turbine suffers from the stalling issue characterized by a significant drop in the turbine efficiency at certain airflow conditions [
14]. The impulsive turbine has to face an incompatibility situation that it is impossible to simultaneously have the right flow incidence at the rotor blades and at the second guide-vane row. Aerodynamic control strategies are developed to maximize turbine efficiency, which is determinant to the energy conversion stage (or the “second stage”) [
12].
The grid-side control is applied in the energy transmission stage (or the “third stage”). It mainly focuses on the improvement of the output power quality [
15], the fault ride-through (FRT) capability [
16,
17], and the overall stability of the grid [
18]. The energy storage equipment (e.g., supercapacitors and batteries) is often used in the grid-connected system of the WEC device to smooth the output power, suppress short-term fluctuations, and regulate the frequency and voltage signals [
15]. The output power fluctuation can be suppressed by controlling the fast switch to charge and discharge the energy storage system.
The above three control strategies have different focus areas. Hydrodynamic control highlights the improvement of hydrodynamic efficiency in the energy absorption stage. The main purpose of aerodynamic control is to solve the essential defect of the air turbine. The grid-side control mainly aims to increase the overall stability of power output to the grid. It is noted that grid-side control does not determine the energy harvesting capacity and efficiency level of an OWC-WEC, which can be investigated independently of hydrodynamic and aerodynamic control strategies [
19]. Hydrodynamic control is often impractical for OWC-WECs. For example, it is difficult to determine the release time of the latching process in irregular waves, which normally relies on an accurate prediction of the excitation force 10–20 s in advance [
20]. Furthermore, due to spring effects of the chamber air, closing the turbine valve can neither effectively suppress the oscillation of the water column nor preciously control the movement of the float in practice. In addition, it requires additional sensors and actuators to perform the latching action, which inevitably causes mechanical losses or undesired strokes.
Besides the various direct control methods mentioned above, an efficiency optimization method for oscillating water column (OWC) air turbines based on adaptive model predictive control (AMPC) has also emerged at the current stage; this method is specifically proposed to optimize air turbine efficiency while improving the overall OWC efficiency [
21]. Additionally, a nonlinear model predictive controller (NMPC) has been presented to maximize the generated electromechanical power without compromising the efficiency of a self-rectifying turbine attached to an OWC wave energy converter (OWC-WEC) [
22], while machine learning methods have been further utilized to reduce energy costs in such systems [
23]. Furthermore, targeted control strategies have been implemented to optimize the wave-to-wire energy conversion process, thereby maximizing OWC system efficiency [
24]; to this end, a new independent multi-stage design approach has been proposed for enhancing the performance of OWC-based OWEC systems: firstly, an optimal control stage for airflow and rotational speed is employed to improve power capture in Wells turbine-based OWC plants; secondly, compared with conventional control strategies, the proposed permanent magnet synchronous generator control integrates an adaptive nonlinear backstepping control algorithm based on Lyapunov stability theory; thirdly, introducing reconfigurable control into the conventional six-leg power converter ensures the uninterrupted operation of OWEC systems; lastly, a model predictive control-based energy management system is integrated with a bidirectional DC-DC converter to deliver stable power from grid-connected OWC-OWEC systems [
25]. Moreover, a method applying deep learning algorithms has been proposed, which predicts the instantaneous rotational speed of turbine generators and performs rated power control based on these predictions—this enables precise control by operating high-speed safety valves before energy input exceeds the rated value [
26]. Finally, a fuzzy logic controller (FLC) combined with an airflow reference generator (ARG) has been designed and validated in a simulation environment; by regulating turbine speed, this framework enhances OWC system efficiency, and results indicate it not only increases system output power but also avoids stalling under different pressure profiles [
27].
This study focuses on the aerodynamic control of Wells turbines. Compared to hydrodynamic control, the aerodynamic control approach is usually more practical in implementation. For a Wells turbine, the operating condition is closely related to a dimensionless parameter called the
. The
is defined as the ratio of the axial air velocity in the turbine entry duct to the tangential velocity of the rotor tip. It is recognised that, if the value of
exceeds a critical
, the efficiency of the turbine would drop significantly, leading to the “stalling issue” [
28]. The critical value has been identified as
[
28].
The essential idea to solve the stalling issue is to dynamically adjust the
, guaranteeing
. According to the definition, the
can be affected by either regulating airflow through the orifice of the OWC chamber or controlling the rotor speed of the turbine. Based on this, aerodynamic control can be further classified as airflow control and rotor-speed control. The airflow control can be achieved by opening a bypass valve installed in parallel with Wells or closing a throttle valve installed in series with Wells turbine. Such air valves are also used to ensure that the turbine rotor speed never exceeds a specified safety limit in extreme sea conditions. Mishra et al. [
29] proposed a two-phase airflow control scheme, with a proportional integral (PI) controller designed for the first phase and an inverse proportional-integral-derivative (PID) controller for the second phase. M’zoughi et al. [
30] studied the airflow control strategy for the NEREIDA wave power station in Mutrico, Spain. The particle swarm optimization algorithm, the fuzzy control algorithm, and an adaptive global harmony search (SGHS) algorithm were used comprehensively. The rotor-speed control works by increasing the maximum rotational speed of the rotor, so that the
can be suppressed to a reference value
that is less than
.
The rotor-speed control can be further classified as fixed- and variable-speed controls. The fixed-speed control strategy forces the turbine to rotate at a suitable fixed reference value to ensure
in most conditions. Unfortunately, this control strategy can cause Wells turbines to stall in partial wave conditions, especially when wave conditions are high. The variable-speed control strategy only takes action if the flow coefficient exceeds
. Compared to the fixed-speed control method, variable-speed control can avoid Wells turbine stalling under high wave conditions and greatly improve the power of OWC power generation system. The effects of both fixed- and variable-speed control strategies are often compared in speed-control-related references. Typical examples are as follows. Mishra et al. [
31] proposed an event-triggered nonlinear controller for an OWC-WEC device. Both the backstepping controller (BSC) and the sliding mode controller (SMC) were used to control the speed of the turbine rotor coupled with the generator. Napole et al. [
27] adopted a fuzzy logic controller (FLC) to adjust the rotor speed. Barambones et al. [
32] adjusted the speed using an adaptive SMC to obtain an optimal flow coefficient. Gaebele et al. [
33] used the second-order SMC. A smooth torque signal was sent to the direct-drive generator to maintain the reference angular velocity of the motor. M’zoughi et al. [
34] used the SMC to regulate the angular velocity of the turbine generator, with an FLC to adjust the switching gain of the SMC. Roh et al. [
26] used a deep learning (DL) algorithm to predict the speed of the turbo-generator. There are also examples that use both airflow and rotor-speed control simultaneously. For example, Alberdi et al. [
35] proposed a complementary scheme, which used rotor-speed control for a rapid response to short-term abrupt changes in turbine speed, and throttle valve to increase energy generation at high-level sea states. Lekube et al. [
36] studied a control scheme based on the relationship between airflow velocity and rotor speed, while the air valve limits airflow speed when needed.
In the above studies, the reference value is always set as the critical flow coefficient, i.e., . However, although can effectively solve the stalling issue, it does not necessarily correspond to the Wells turbine’s maximum power output efficiency. With the same axial air velocity in the turbine entry duct, the increase of from 0 to 0.3 requires a reduction in rotor speed. Meanwhile, the torque acting on the turbine increases with the flow coefficient monotonically in conditions. The output power of the turbine is determined by torque and speed, which do not necessarily reach the maximum value at . In other words, the choice of is less likely to be optimal from the standpoint of maximizing the power generation of the air turbine.
For an OWC-WEC equipped with the Wells turbine, the optimal reference value of the flow coefficient is still an open question, which is to be addressed in this study. With an optimized
determined, an improved dynamic rotor-speed control strategy for the Wells turbine of OWC-WECs can be established. The improved control is expected to further increase power generation, while avoiding the stalling issue of the turbo-generator system. Additionally, OWC-WECs are normally located in irregular wave environments. The performance of the improved control strategy under such strong time-varying wave conditions should be examined.
Section 2 describes the mathematical model.
Section 3 gives the hydrodynamic analysis.
Section 4 gives the numerical process.
Section 5 gives the results and discussion.
Section 6 draws conclusions.
2. Methodology
2.1. Description of OWC-Buoy Design
The OWC-buoy proposed by the authors [
7], as a practical OWC-WEC device, is considered for case study. A full-scale prototype of OWC-buoy has been deployed at the Dalian sea trial site for long-term demonstration verification since 2022 (i.e.,
Figure 2).
Figure 3 depicts a simplified geometry of the OWC-buoy. The OWC-buoy, with a total mass of
kg, consists of a buoy body moored to the seabed, two annular air chambers around the buoy body, two sets of turbo-generator systems, and the necessary electrical and control devices. The buoy body is a cylindrical platform with a diameter of
m and a height of
m, providing buoyancy and room for electrical and control devices. The air chamber is formed by an annular “skirt” around the buoy body, piercing through the water surface. The outer diameter and the height of the “skirt” are
m and
m, respectively. Two bulkheads are used to divide the annular air chamber into two isolated subchambers, chamber-1 and chamber-2. A turbine duct with a diameter of
is at the top of each subchamber, in which a turbo-generator system exists. Both the buoy body and the chamber are made of steel plates of thickness
m by welding.
2.2. Numerical Wave Tank for OWC-Buoy
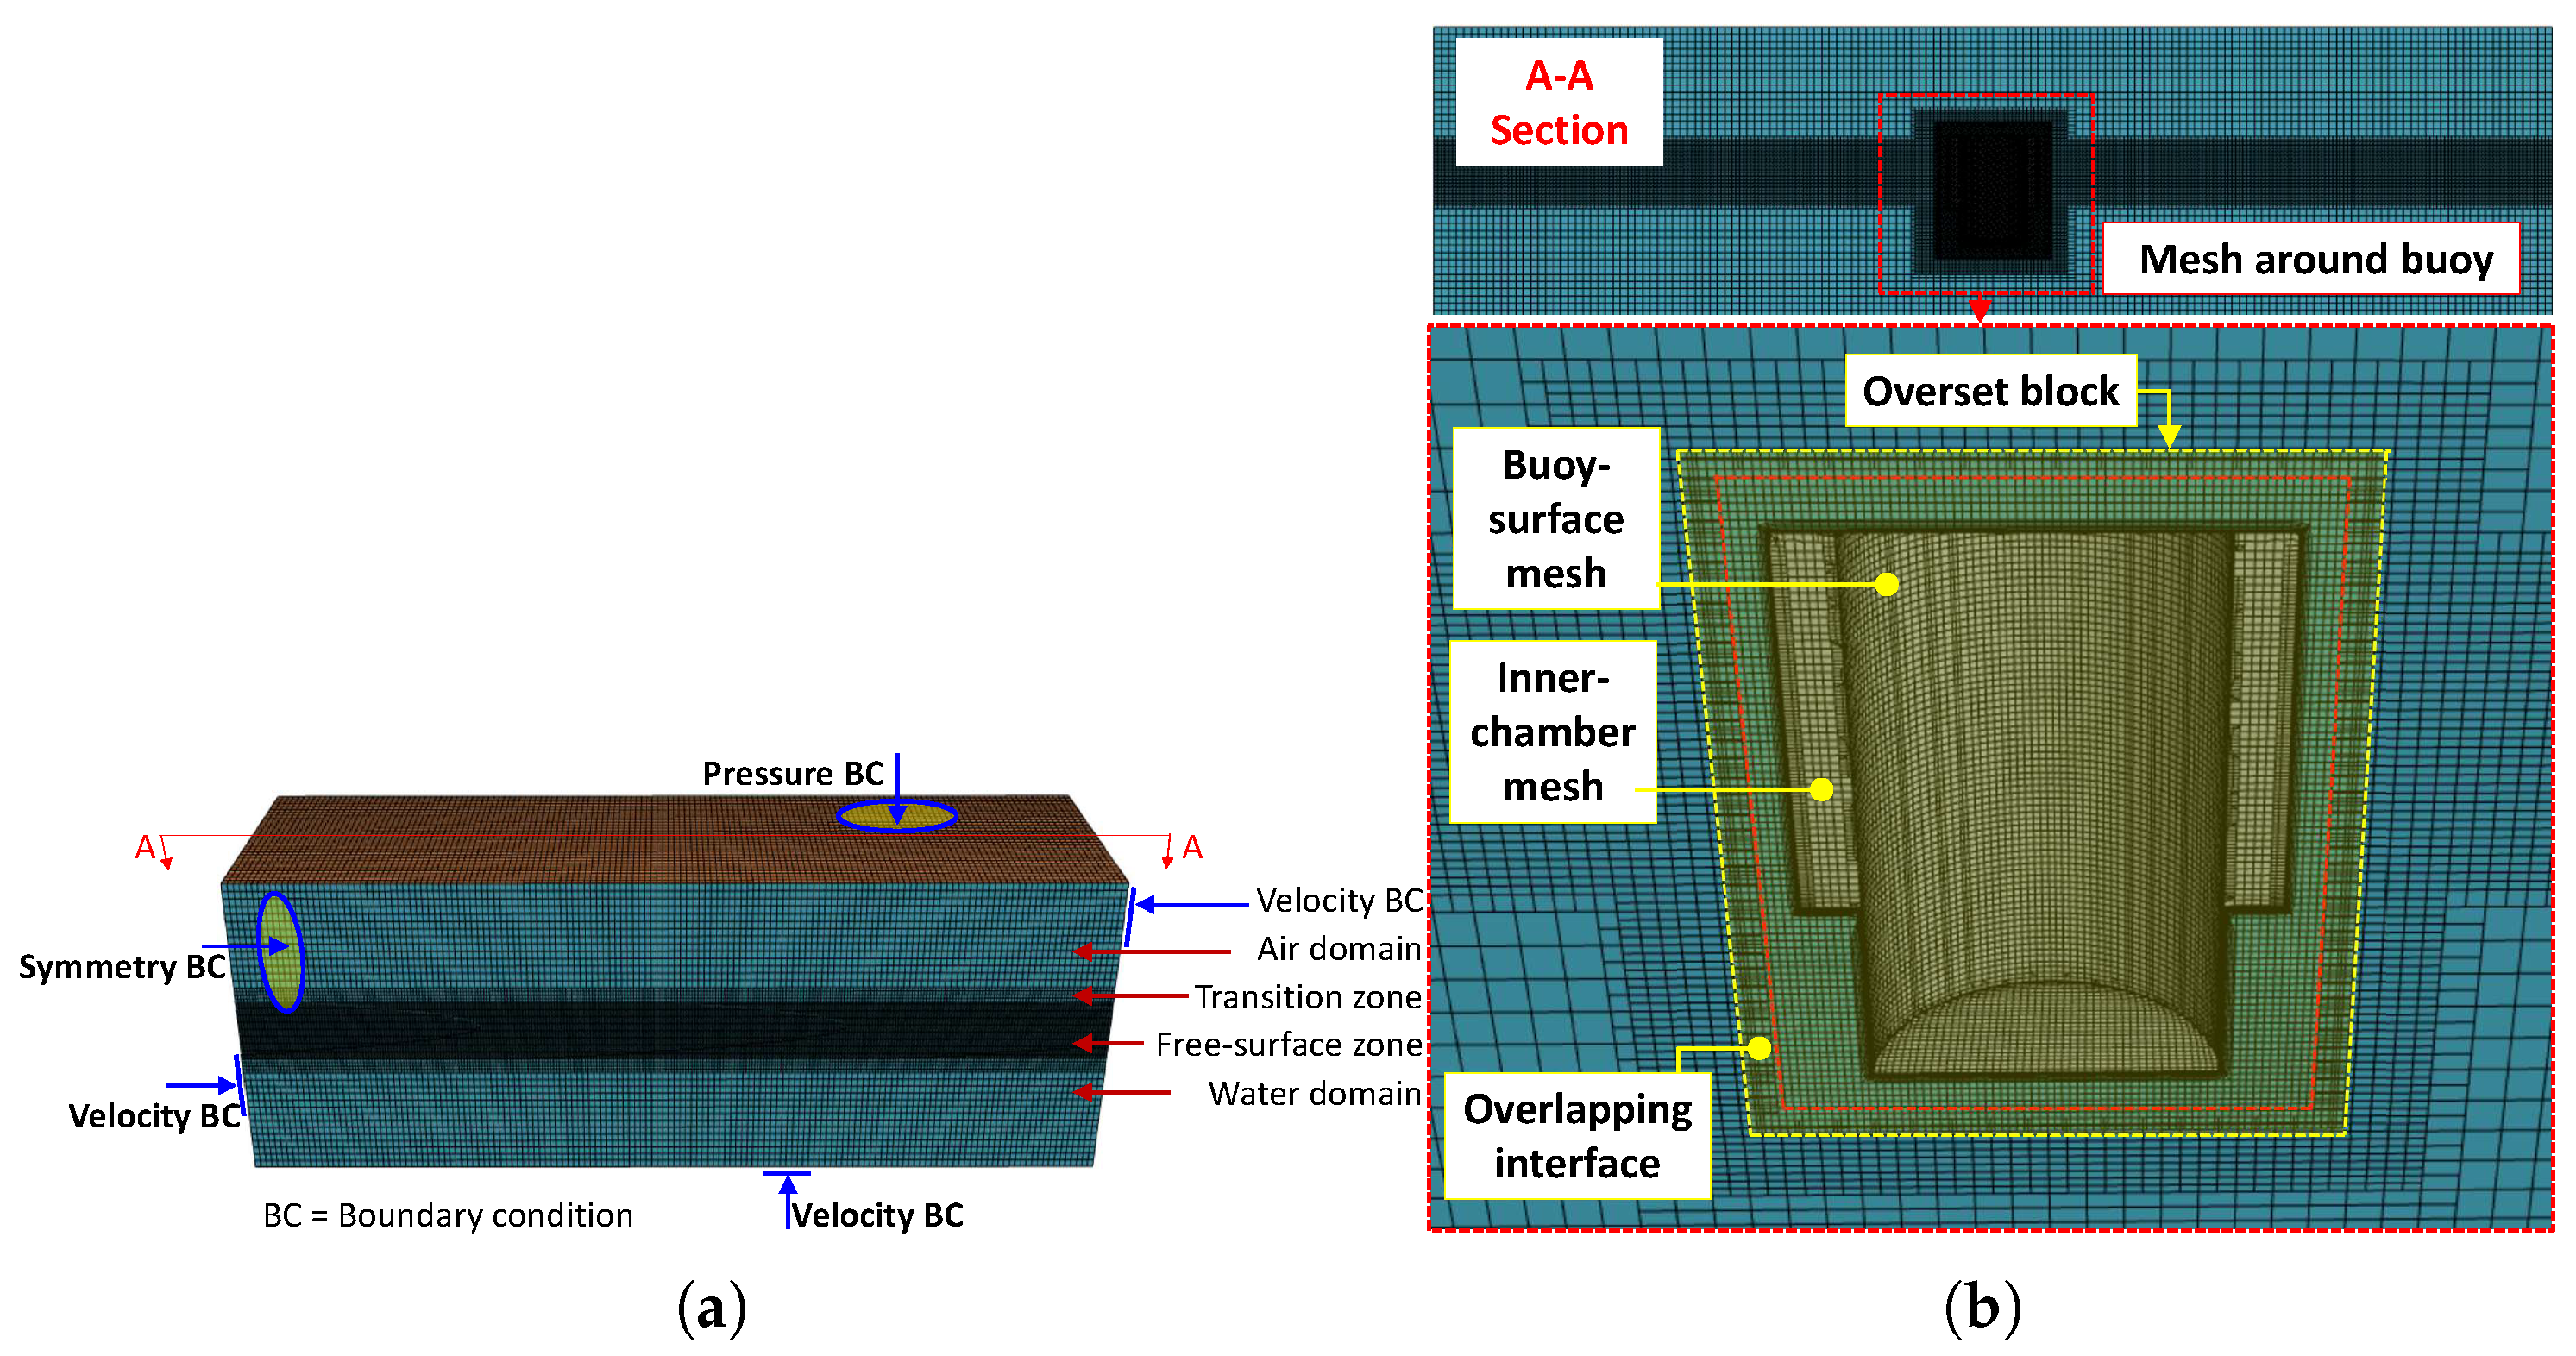
A 3D numerical wave tank is established to predict the hydrodynamic response of the OWC-buoy and the aerodynamic status through turbine duct in different wave conditions, based on Star-CCM+2406. As depicted in
Figure 3, the wave tank has the length
= 30 m, width
= 6 m, height
= 8 m, and water depth
h = 4 m. The OWC-buoy is allowed to heave freely on the free surface in the middle of the tank.
Figure 3b illustrates the subsequent hydrodynamic simulations and the finally selected measuring point positions. A right-handed Cartesian coordinate system
is established, with
O at the intersection of the central symmetrical axis and the mean free surface,
pointing horizontally to the downstream end of the tank, and
pointing upwards. Using a two-phase flow model, incompressible Navier–Stokes equations are satisfied in both the water and air domains as follows:
where
is fluid velocity,
p is fluid pressure,
is fluid density,
is kinematic viscosity, and
t is time. The coupling of fluid pressure and velocity is solved by the Pressure-Implicit with Splitting of Operators (PISO) algorithm [
37].
Incident waves enter the numerical wave tank through the wave inlet boundary. The velocity of the fifth-order Stokes Waves is applied on the wave inlet boundary as the boundary condition. The atmospheric pressure condition is used on the top boundary. Side-walls of the tank are taken as symmetrical planes. Non-sliding wall conditions are satisfied on the bottom and wave outlet boundaries. The free surface is tracked by the volume of fluid (VOF) method [
38]. To be specific, a scalar field
is defined in the computational domain. The value of
represents the volume fraction of the liquid phase, with
and
for the gas and liquid phases, respectively. The free surface is transition zone between the gas and liquid phases, featured with
. The field of
can be obtained by solving the transport equation. In the free-surface zone, the velocity, density, and dynamic viscosity coefficient can be obtained through the following linear approximations:
where the subscripts a and b refer to the liquid and gas phase, respectively. The relaxation zone technique is also adopted to improve wave quality near the inlet boundary and remove spurious reflection at the outlet boundary.
Figure 4a shows the numerical mesh of the computational domain. To accurately capture the wave profile, the mesh of computational domain around the free surface is densed locally. A transition zone connects the endensed free-surface zone and the remaining domain. The height of the free-surface zone is the wave height, and that of the transition zone is half the wave height.
Following the motion of the OWC-buoy, an overlapping grid technology is used. As shown in
Figure 4b, an overset block fixed on the OWC-buoy is established. The overset block is a local computation domain around the OWC-buoy.
This part of the grid can be overlapped and nested with the grid of the fluid domain during the movement, so there is no need to worry about the continuity of the grid and the grid breakage during the movement of the device. The specific operation is to subtract the Block and the floating OWC to generate an overset module, assign this module and the sink to the area, and generate an overlapping grid interface between the sink and the Overset module. In addition, it is necessary to refine the grid around the free water surface and the moving area of the floating OWC.
In this paper, only the heave motion of the floating OWC is considered. In order to control and constrain the motion of the floating OWC device, the DFBI rotation and translation are selected for the motion of the Overset module, and only the Z-axis motion is selected in the DFBI rotation and translation module.
In order to obtain the accurate displacement of the floating OWC device, a Cartesian coordinate system is established at the center of the junction between the static water surface and the floating OWC device, which is located on the floating OWC device. At the same time, in order to monitor the details of the free wave surface motion inside the floating OWC device, the arrangement of the wave height measuring points is shown in
Figure 3. There are 14 wave height measuring points arranged inside the device. The remaining measuring points inside the air chamber are oriented by the coordinate origin, the x-axis is the starting point, and the interval is
. In addition, pressure measuring points were set at the center of the pores above the
and
positions to monitor the pressure and wind velocity changes at the pores.
2.3. Grid Independence Verification
In the numerical simulation of the wave tank, boundary conditions were configured as follows. The front and rear walls were set as velocity inlets. The upper wall was a pressure outlet, and the lower wall was a wall boundary. Both side walls were defined as symmetry planes. After determining the positions of velocity inlets, specific boundary condition settings were implemented.
For physical properties of velocity inlets, velocity was specified as a component. Turbulence was set as intensity + viscosity ratio. The velocity method was defined as a field function, and the selected vector function was “Velocity of Fifth-order VOF Wave”. For volume fraction, the composite method was adopted. “Water” was configured as a field function, with the scalar function selected as “Volume Fraction of Heavy Fluid” for the fifth-order VOF wave. “Air” was set as a field function, and its scalar function was “Volume Fraction of Light Fluid” for the fifth-order VOF wave.
For the pressure outlet, the volume fraction setting adopted the same configuration as velocity inlets. The pressure method was defined as a field function, using “Hydrostatic Pressure of Heavy Fluid” for the fifth-order VOF wave. Symmetry plane boundaries and wall boundaries remained unchanged with default settings.
Initial conditions were configured as follows. The velocity method was set as a field function, and the vector function was “Velocity of Fifth-order VOF Wave”. The volume fraction method was composite. The water method was a field function, with the scalar function selected as “Volume Fraction of Heavy Fluid of Fifth-order VOF Wave”. The air method was a field function, and its scalar function was “Volume Fraction of Light Fluid of Fifth-order VOF Wave”. The turbulent velocity ratio method was a constant (value: 1.0 m/s). The turbulent viscosity ratio method was a constant (value: 10). The turbulence specification method was intensity + viscosity ratio. The pressure method was a field function, with the scalar function selected as “Hydrostatic Pressure of Heavy Fluid of Fifth-order VOF Wave”.
To verify the reliability of the numerical model grid for the floating oscillating water column (OWC) device, fifth-order Stokes waves were generated. The wave parameters were specified as follows: wave height of 0.8 m, wave period of 2.58 s, and water depth of 4.0 m. The floating OWC device’s release time was set to 0.5 s, and the buffer time was set to 1.0 s. Three grid configurations, with element counts of 540,000, 690,000, and 1,120,000, respectively, were selected for verification.
Figure 5 and
Figure 6 present the time-history curves of the floating OWC device’s vertical displacement and the wave height at Measurement Point G4 (located directly below the air vent) under different grid schemes. Both the vertical displacement curves of the floating OWC device and the wave height curves at Measurement Point G4 exhibited nearly identical results across the three grid configurations. This indicates the convergence of the numerical simulation results. Considering computational time and resource efficiency, the grid configuration with 690,000 elements was determined as the most appropriate option.
2.4. Dynamic Model of Turbo-Generator System
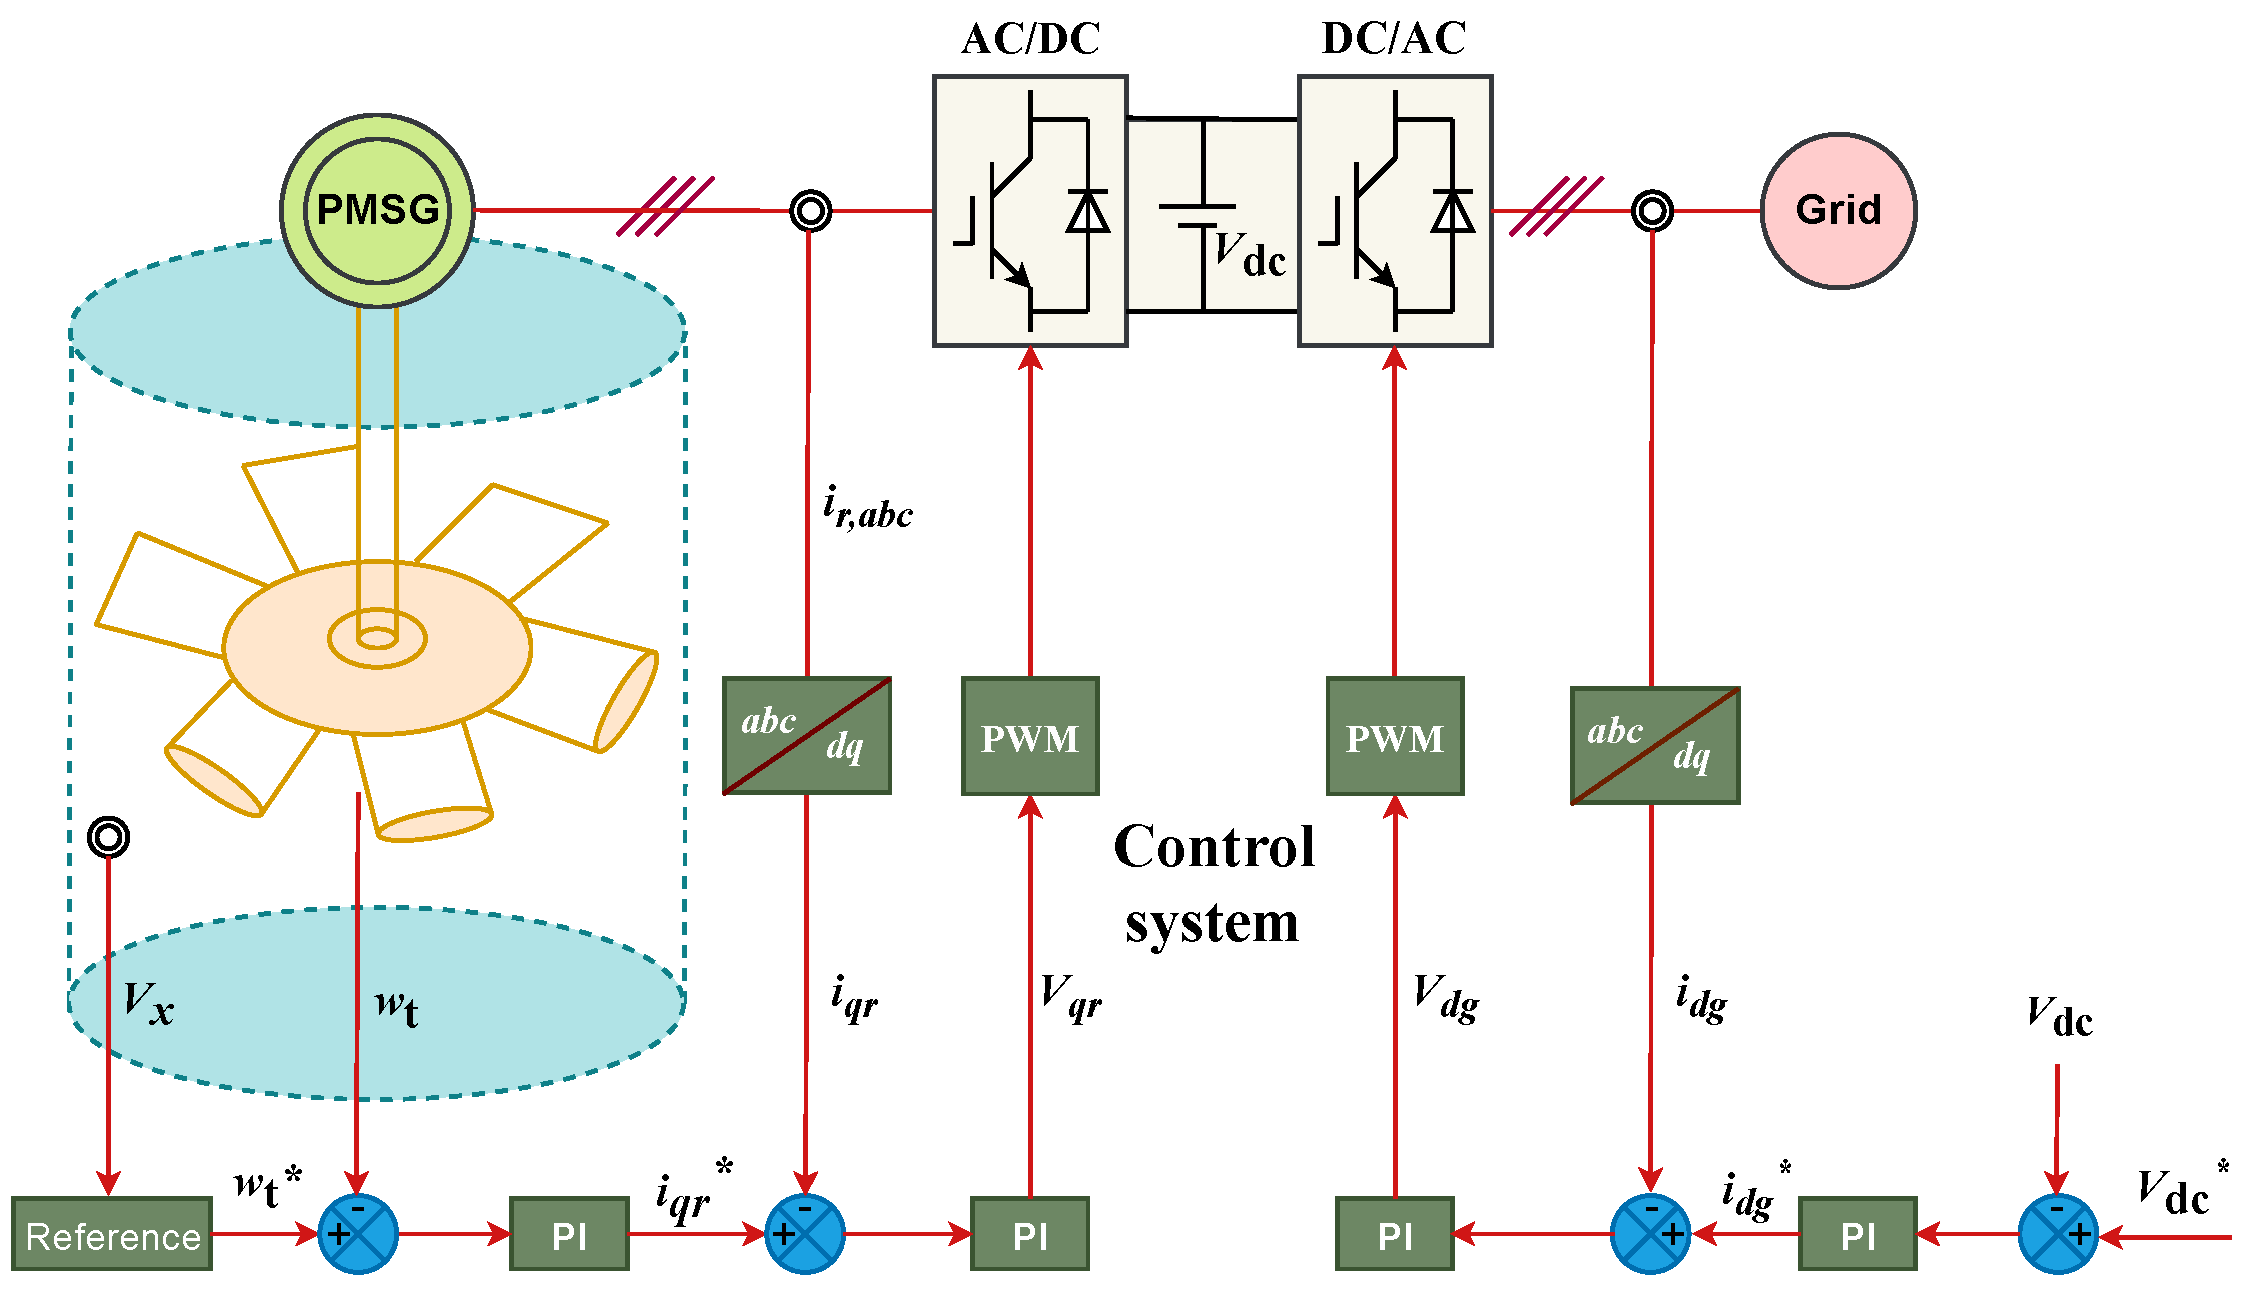
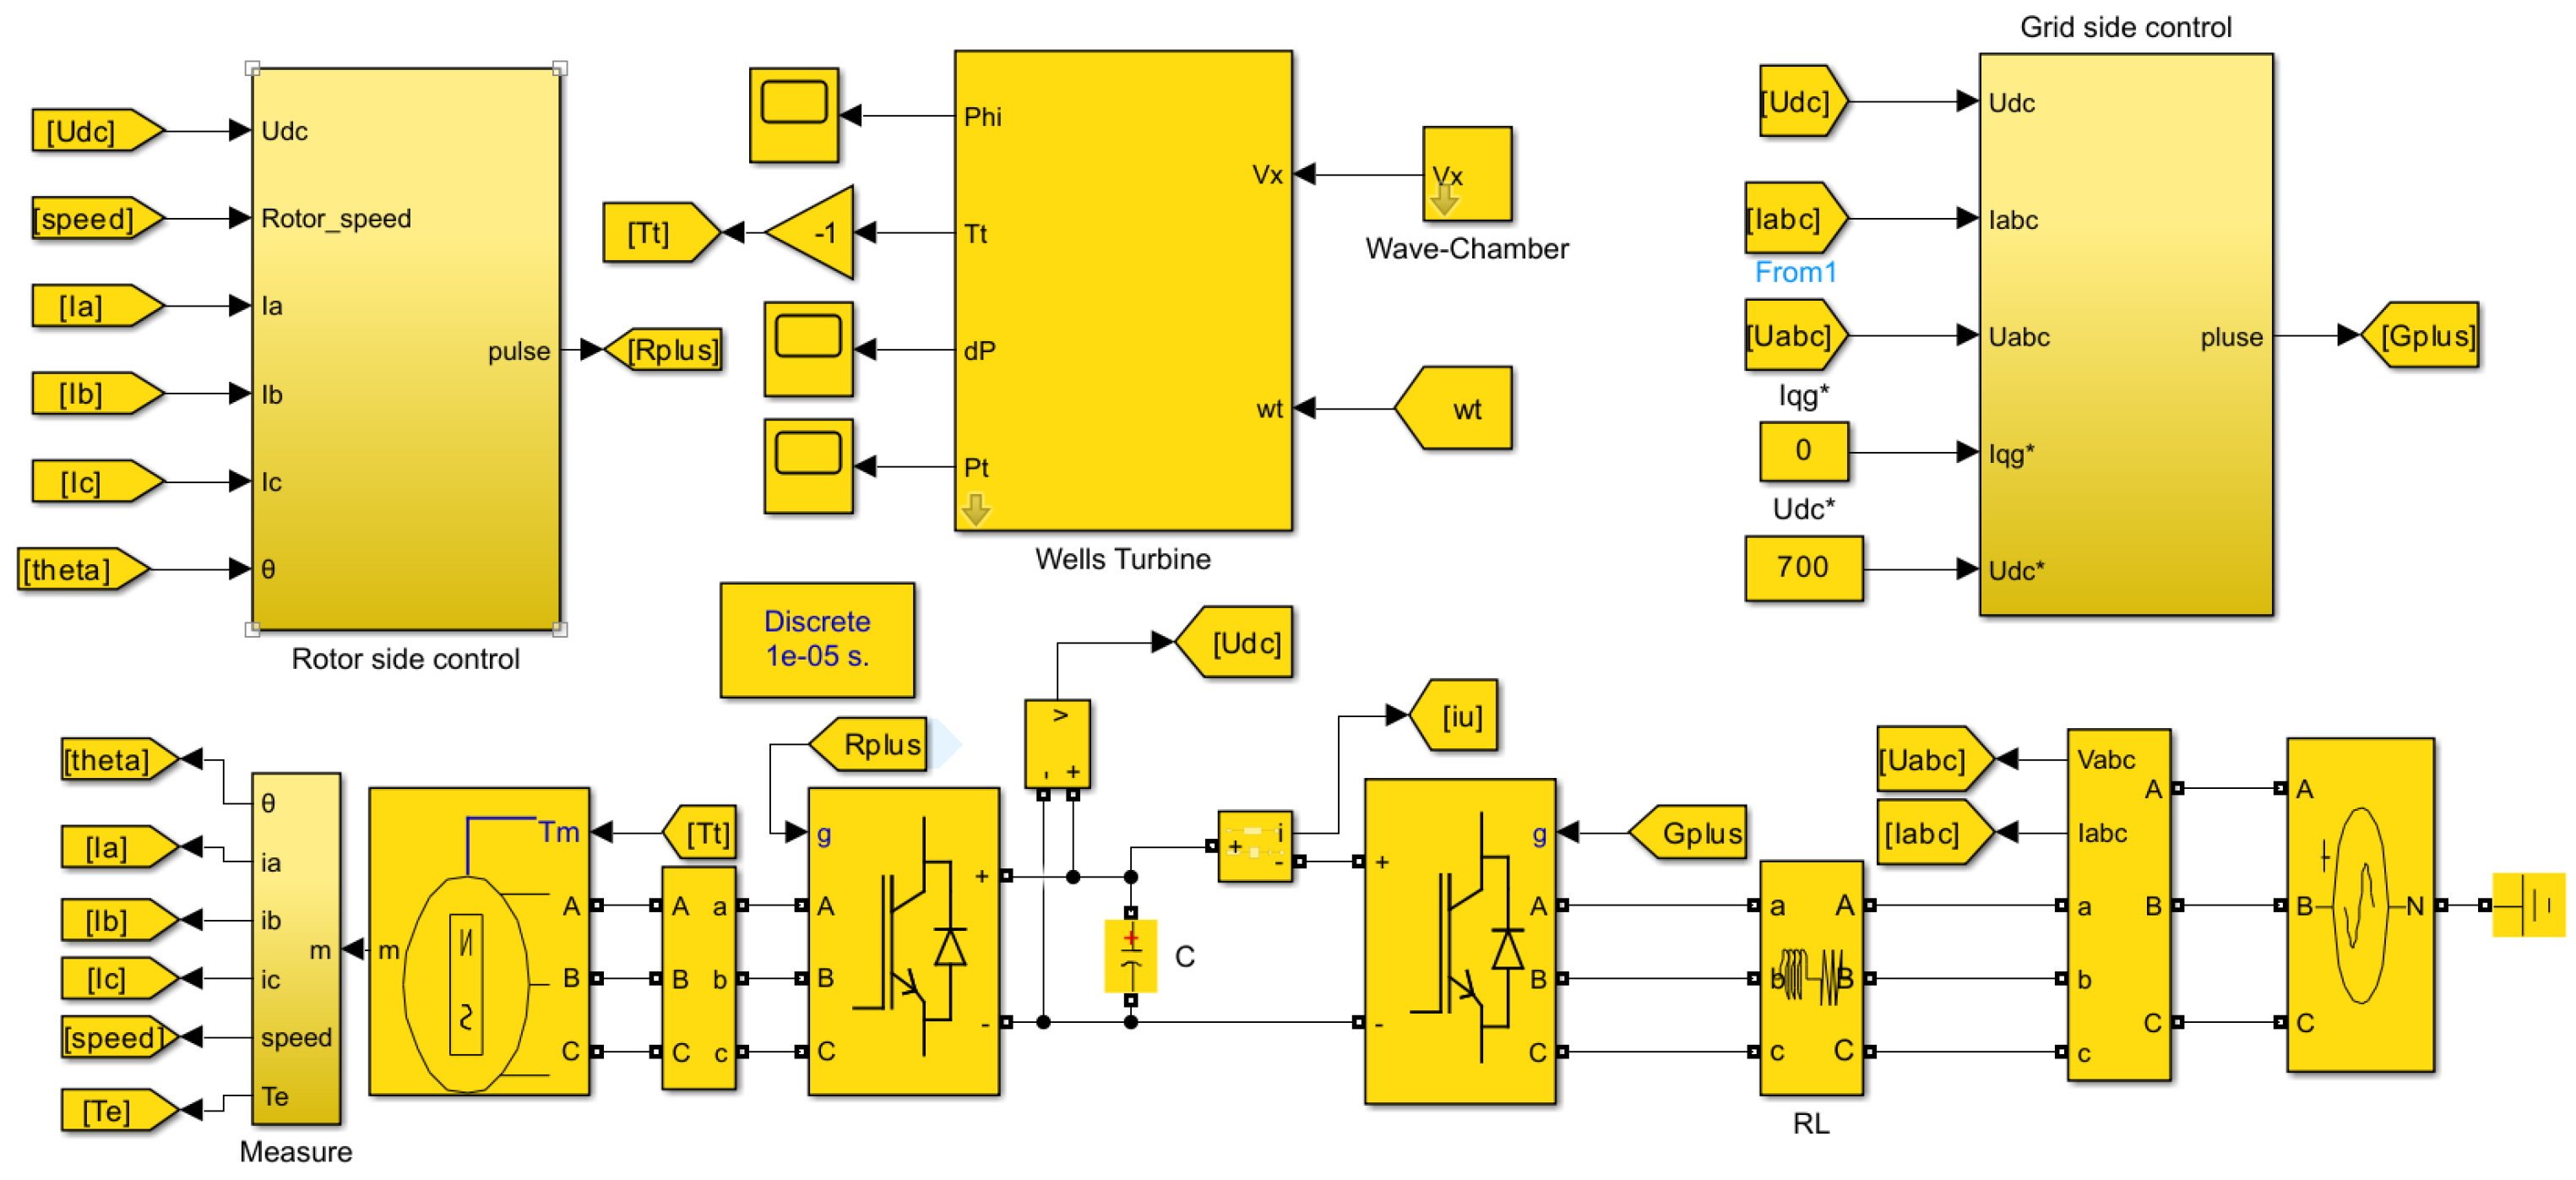
The turbo-generator control system, as depicted in
Figure 7, is composed of three components, i.e., Wells turbine, permanent magnet synchronous generator (PMSG), and control system. The Wells turbine of the turbo-generator control system is located in the turbine duct. Bidirectional airflows through the duct drive the turbine to rotate, so the air kinetic energy in the air chamber is converted into rotating mechanical energy. PMSG converts the rotating mechanical energy into unstable electric energy, and the converter converts the unstable electric energy into AC-DC-AC through the control system. Finally, the unstable electric energy is converted into stable electric energy matched with voltage, frequency, and power grid and transmitted to the power grid.
In a typical working condition, external ocean waves excite the oscillation of water column in the air chamber, which causes reciprocating airflows through the air duct. The instantaneous air volume
in the chamber is calculated by the numerical wave tank. The axial airflow velocity
in the turbine entry duct is represented as [
39]
where
is the cross area of the air duct.
Under the action of bidirectional airflows, the turbine rotates unidirectionally for electricity generation. In this study, the turbo-generator system is primarily composed of a Wells turbine and a permanent magnet synchronous generator (PMSG). The equation of motion can be established for the turbine as
where
J is the moment of inertia of the turbo-generator system,
is the angular velocity of the rotor (mechanical speed),
is the airflow torque acting on the turbine rotor,
is the electromagnetic torque generated by the PMSG,
b is the linear damping coefficient,
is the torque of Coulomb damping, and “sgn” denotes the sign of a variable. The value of
can be either positive or negative to accelerate or decelerate the turbine rotation.
An empirical expression of the airflow torque
is introduced [
39]:
with
where
is defined as the flow coefficient,
is the torque coefficient dependent on
,
is a constant related to turbine parameters, and
is the mean radius of the turbine. The relationship of
and
is predetermined through experimental calibrations. The
can be expressed as
where
is a turbine constant,
n is the number of blades,
is the air density,
is the blade height, and
is the blade chord length.
The pressure drop
cross the turbine can be approximated according to the following relationship [
40]:
where
is the power coefficient dependent on
. The power of the airflow at the turbine duct is given as
Together with the power generated by the turbine
the efficiency of the turbine can be obtained as
The
equivalent dynamic model is introduced to describe the dynamics of the PMSG [
41]. Hereafter, the subscripts
d and
q are used to indicate the
d- and
q-axis component of a physical quantity, respectively. The stator voltages are expressed as
where
u refers to the stator voltage,
i is the stator current,
L is the inductance,
is the stator resistance,
is the permanent magnet flux linkage, and
is the electric angular velocity. The electric angular velocity satisfies
where
p is the number of pole pairs of the PMSG. The electromagnetic torque
of the PMSG can be calculated according to
The control system is based on a pair of back-to-back converters, i.e., machine side control and network side control.
2.5. Machine-Side Control Scheme
The main goal of the machine side control is to control the speed of the generator, that is, the speed of the Wells turbine. In the power generation system of the pneumatic wave energy device, the energy obtained by the Wells turbine from the airflow is limited by the
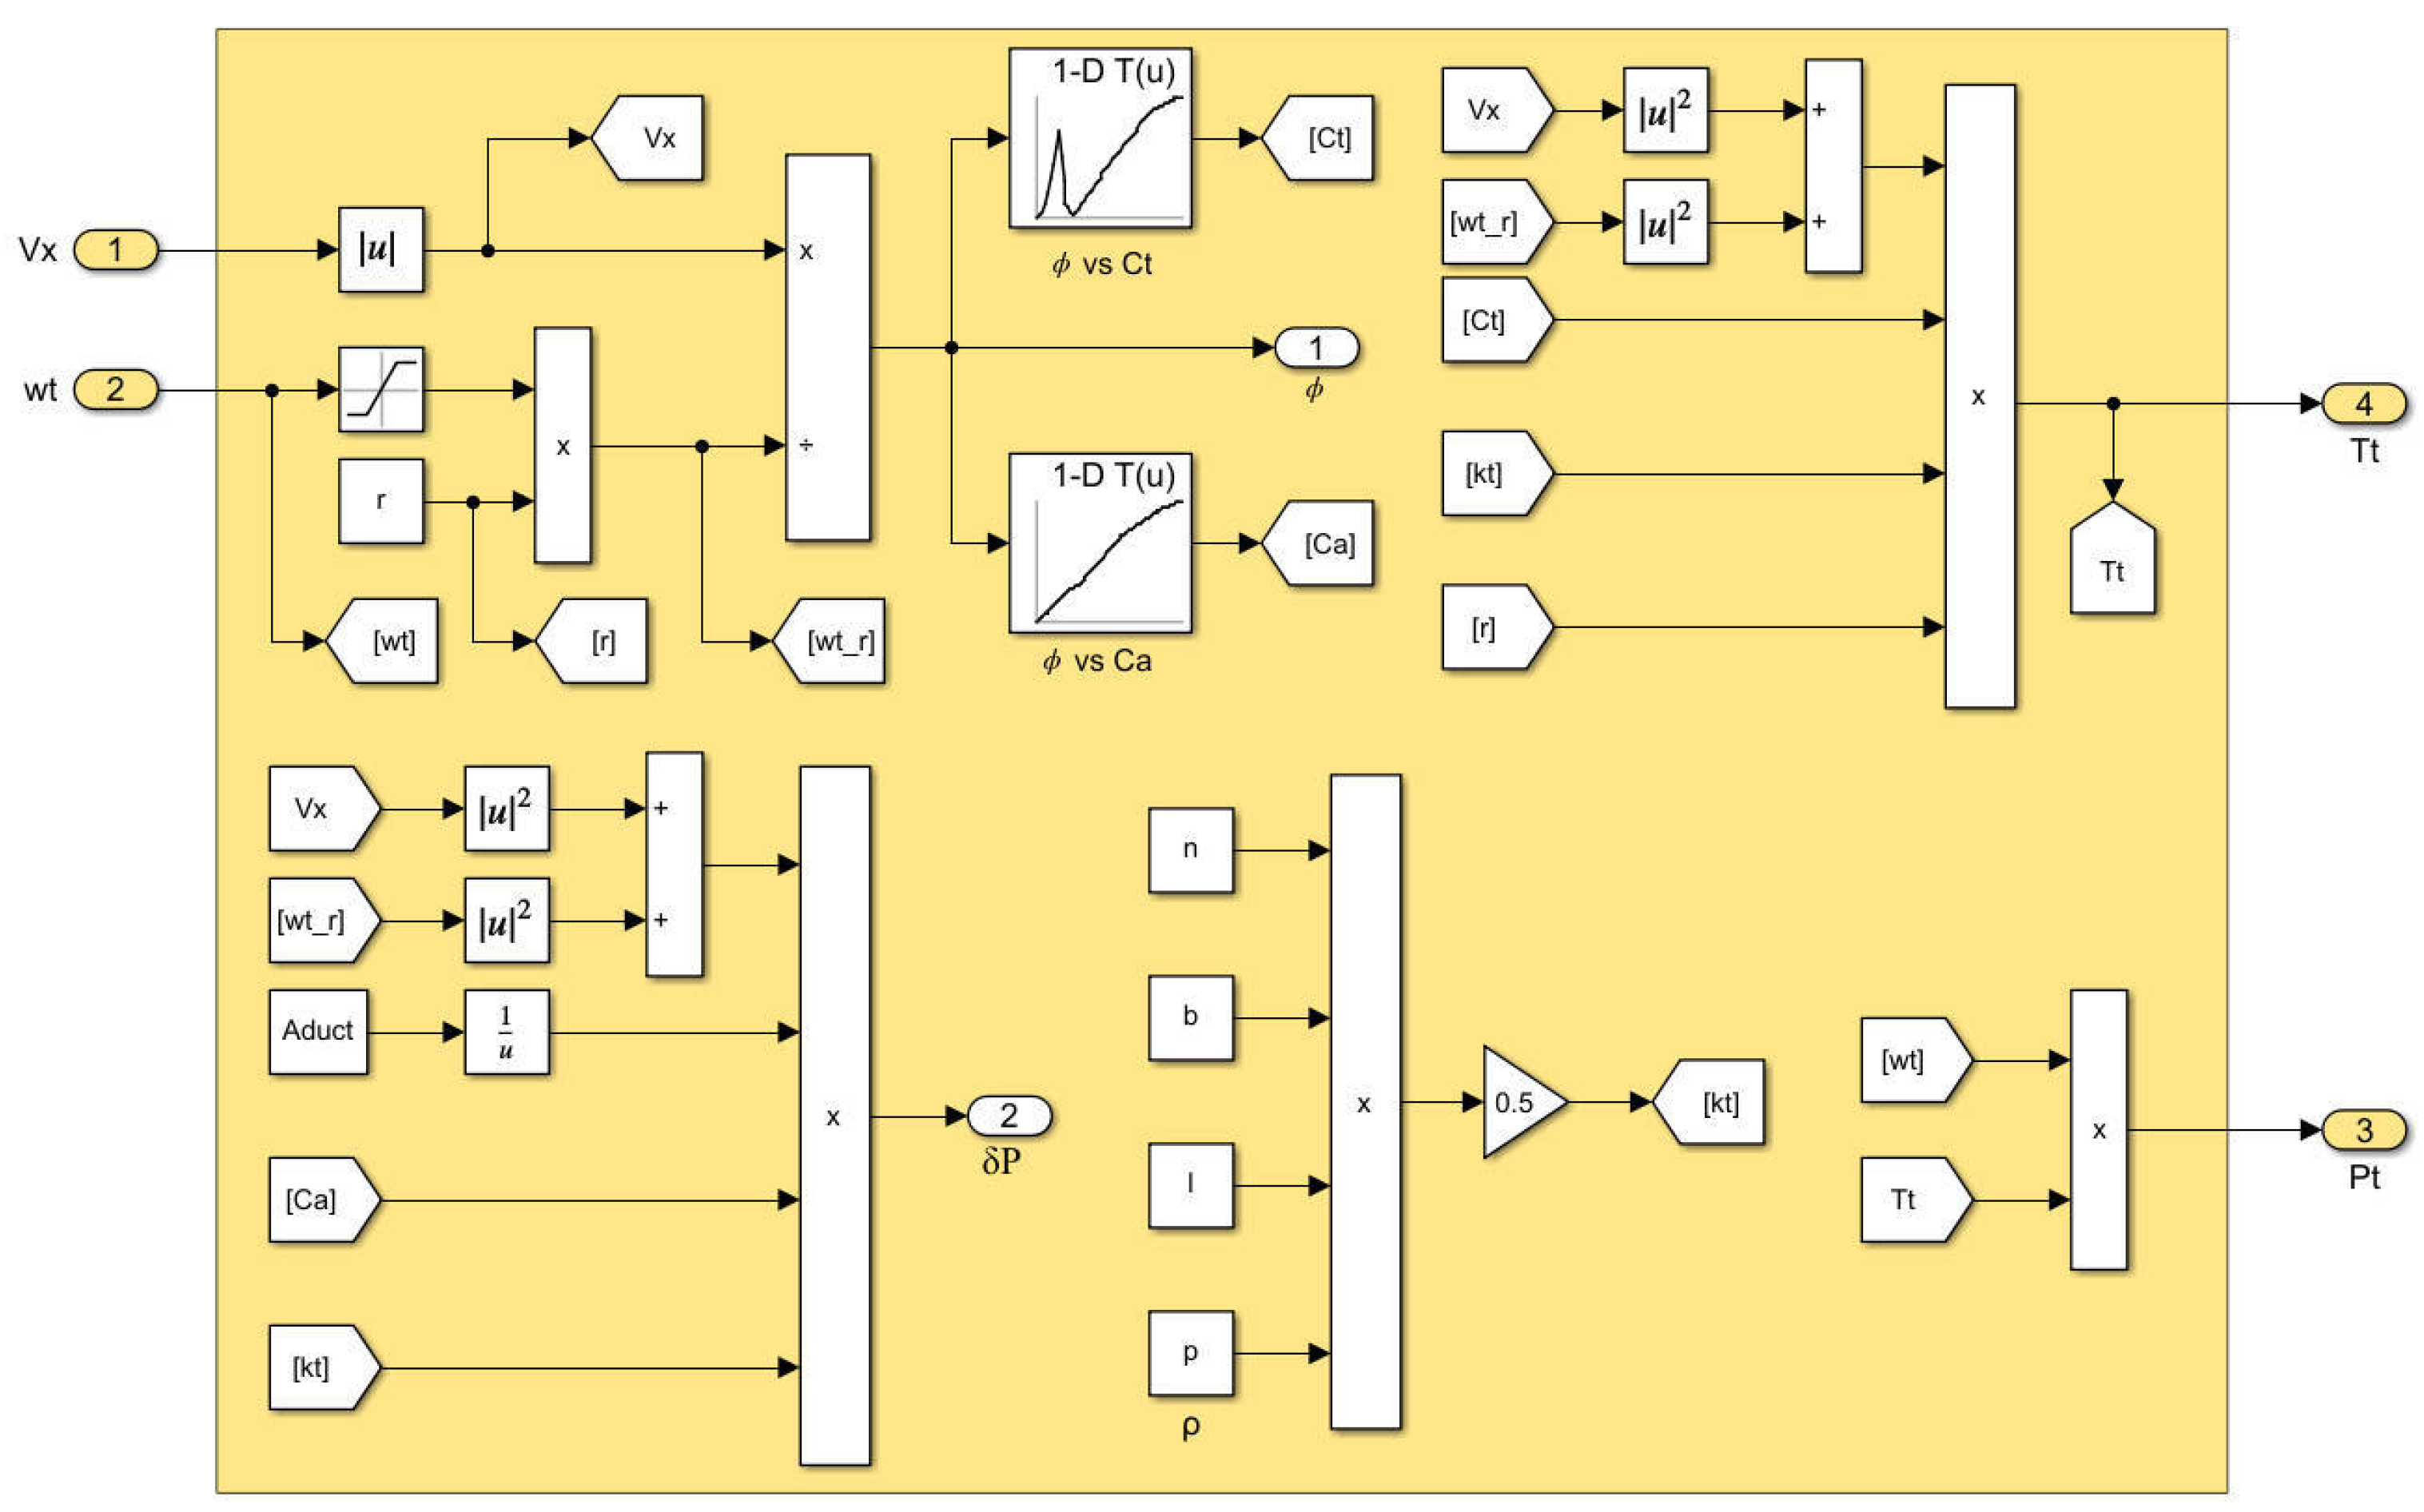
. As shown in
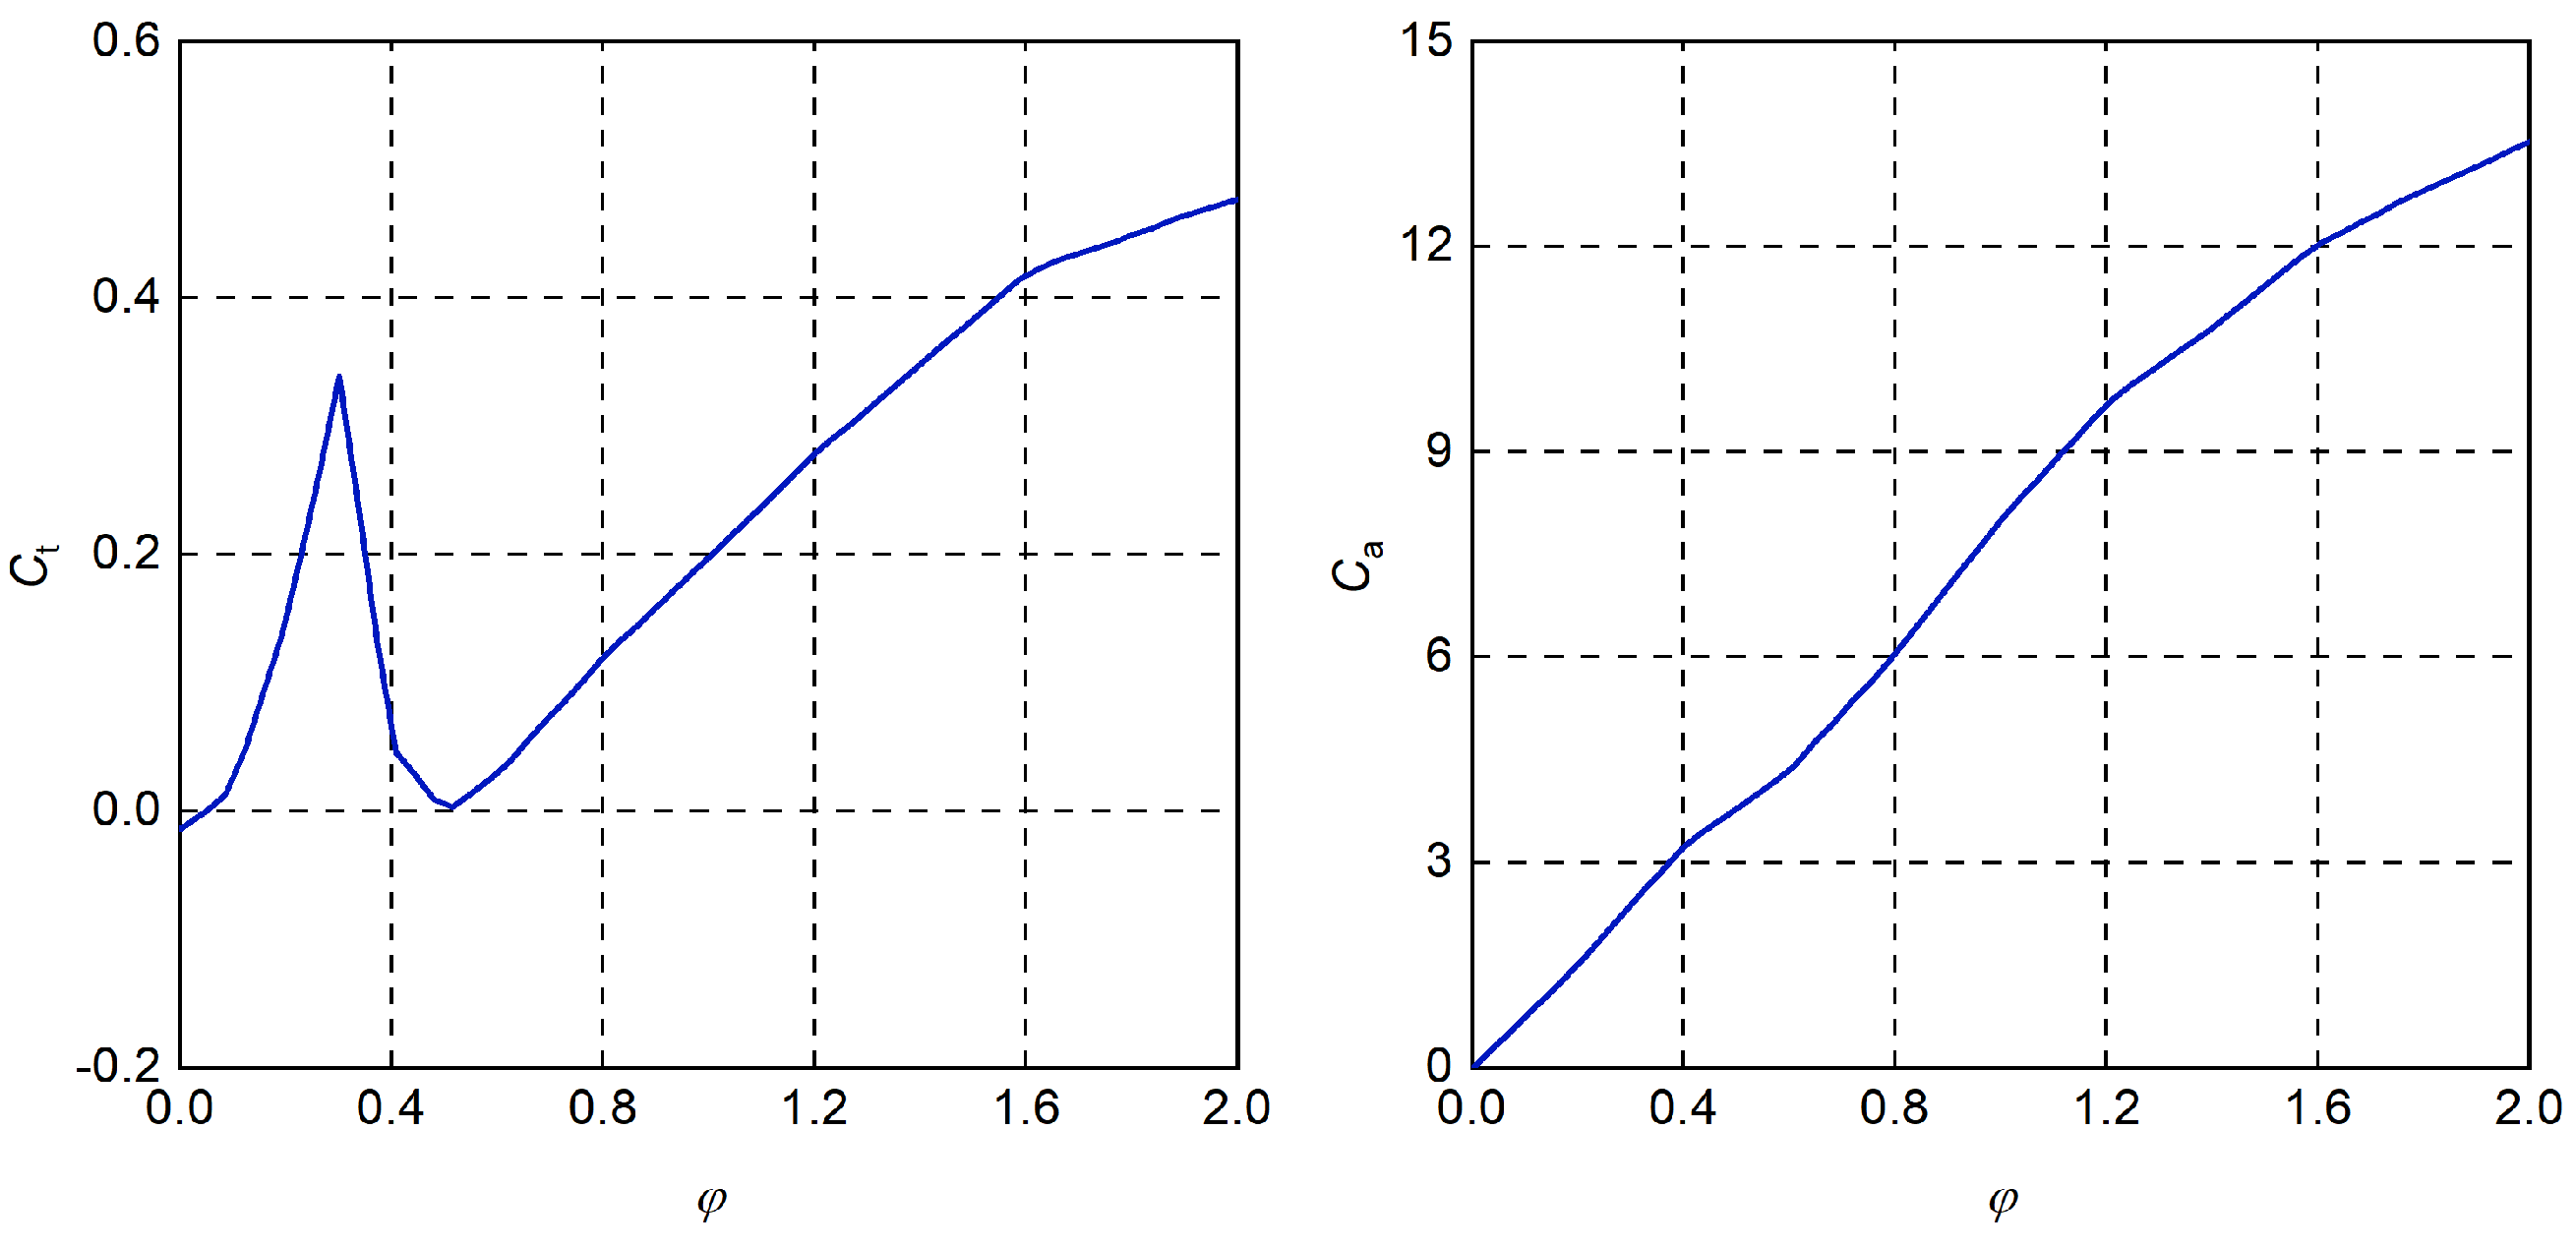
Figure 8, the performance of the Wells turbine depends on the power coefficient, torque coefficient, and
.
denotes the power coefficient,
denotes the torque coefficient, and the x-axis represents
. The torque coefficient will decrease rapidly when the
exceeds 0.3, which will greatly reduce the torque of the turbine, resulting in a significant decrease in the efficiency of the Wells turbine. The phenomenon that the efficiency of the Wells turbine is significantly reduced due to the
exceeding 0.3 is called stall effect. Therefore, in order to increase the power output of Wells turbine, it is best to control the speed of the Wells turbine during operation to avoid stall. In the low-flow rate region, the speed of the Wells turbine is kept unchanged. When the air flow rate exceeds a certain value, the speed of the Wells turbine is adjusted accordingly, so that the
is kept below 0.3, so as to increase the output power of the Wells turbine. This is the essential idea of speed control.
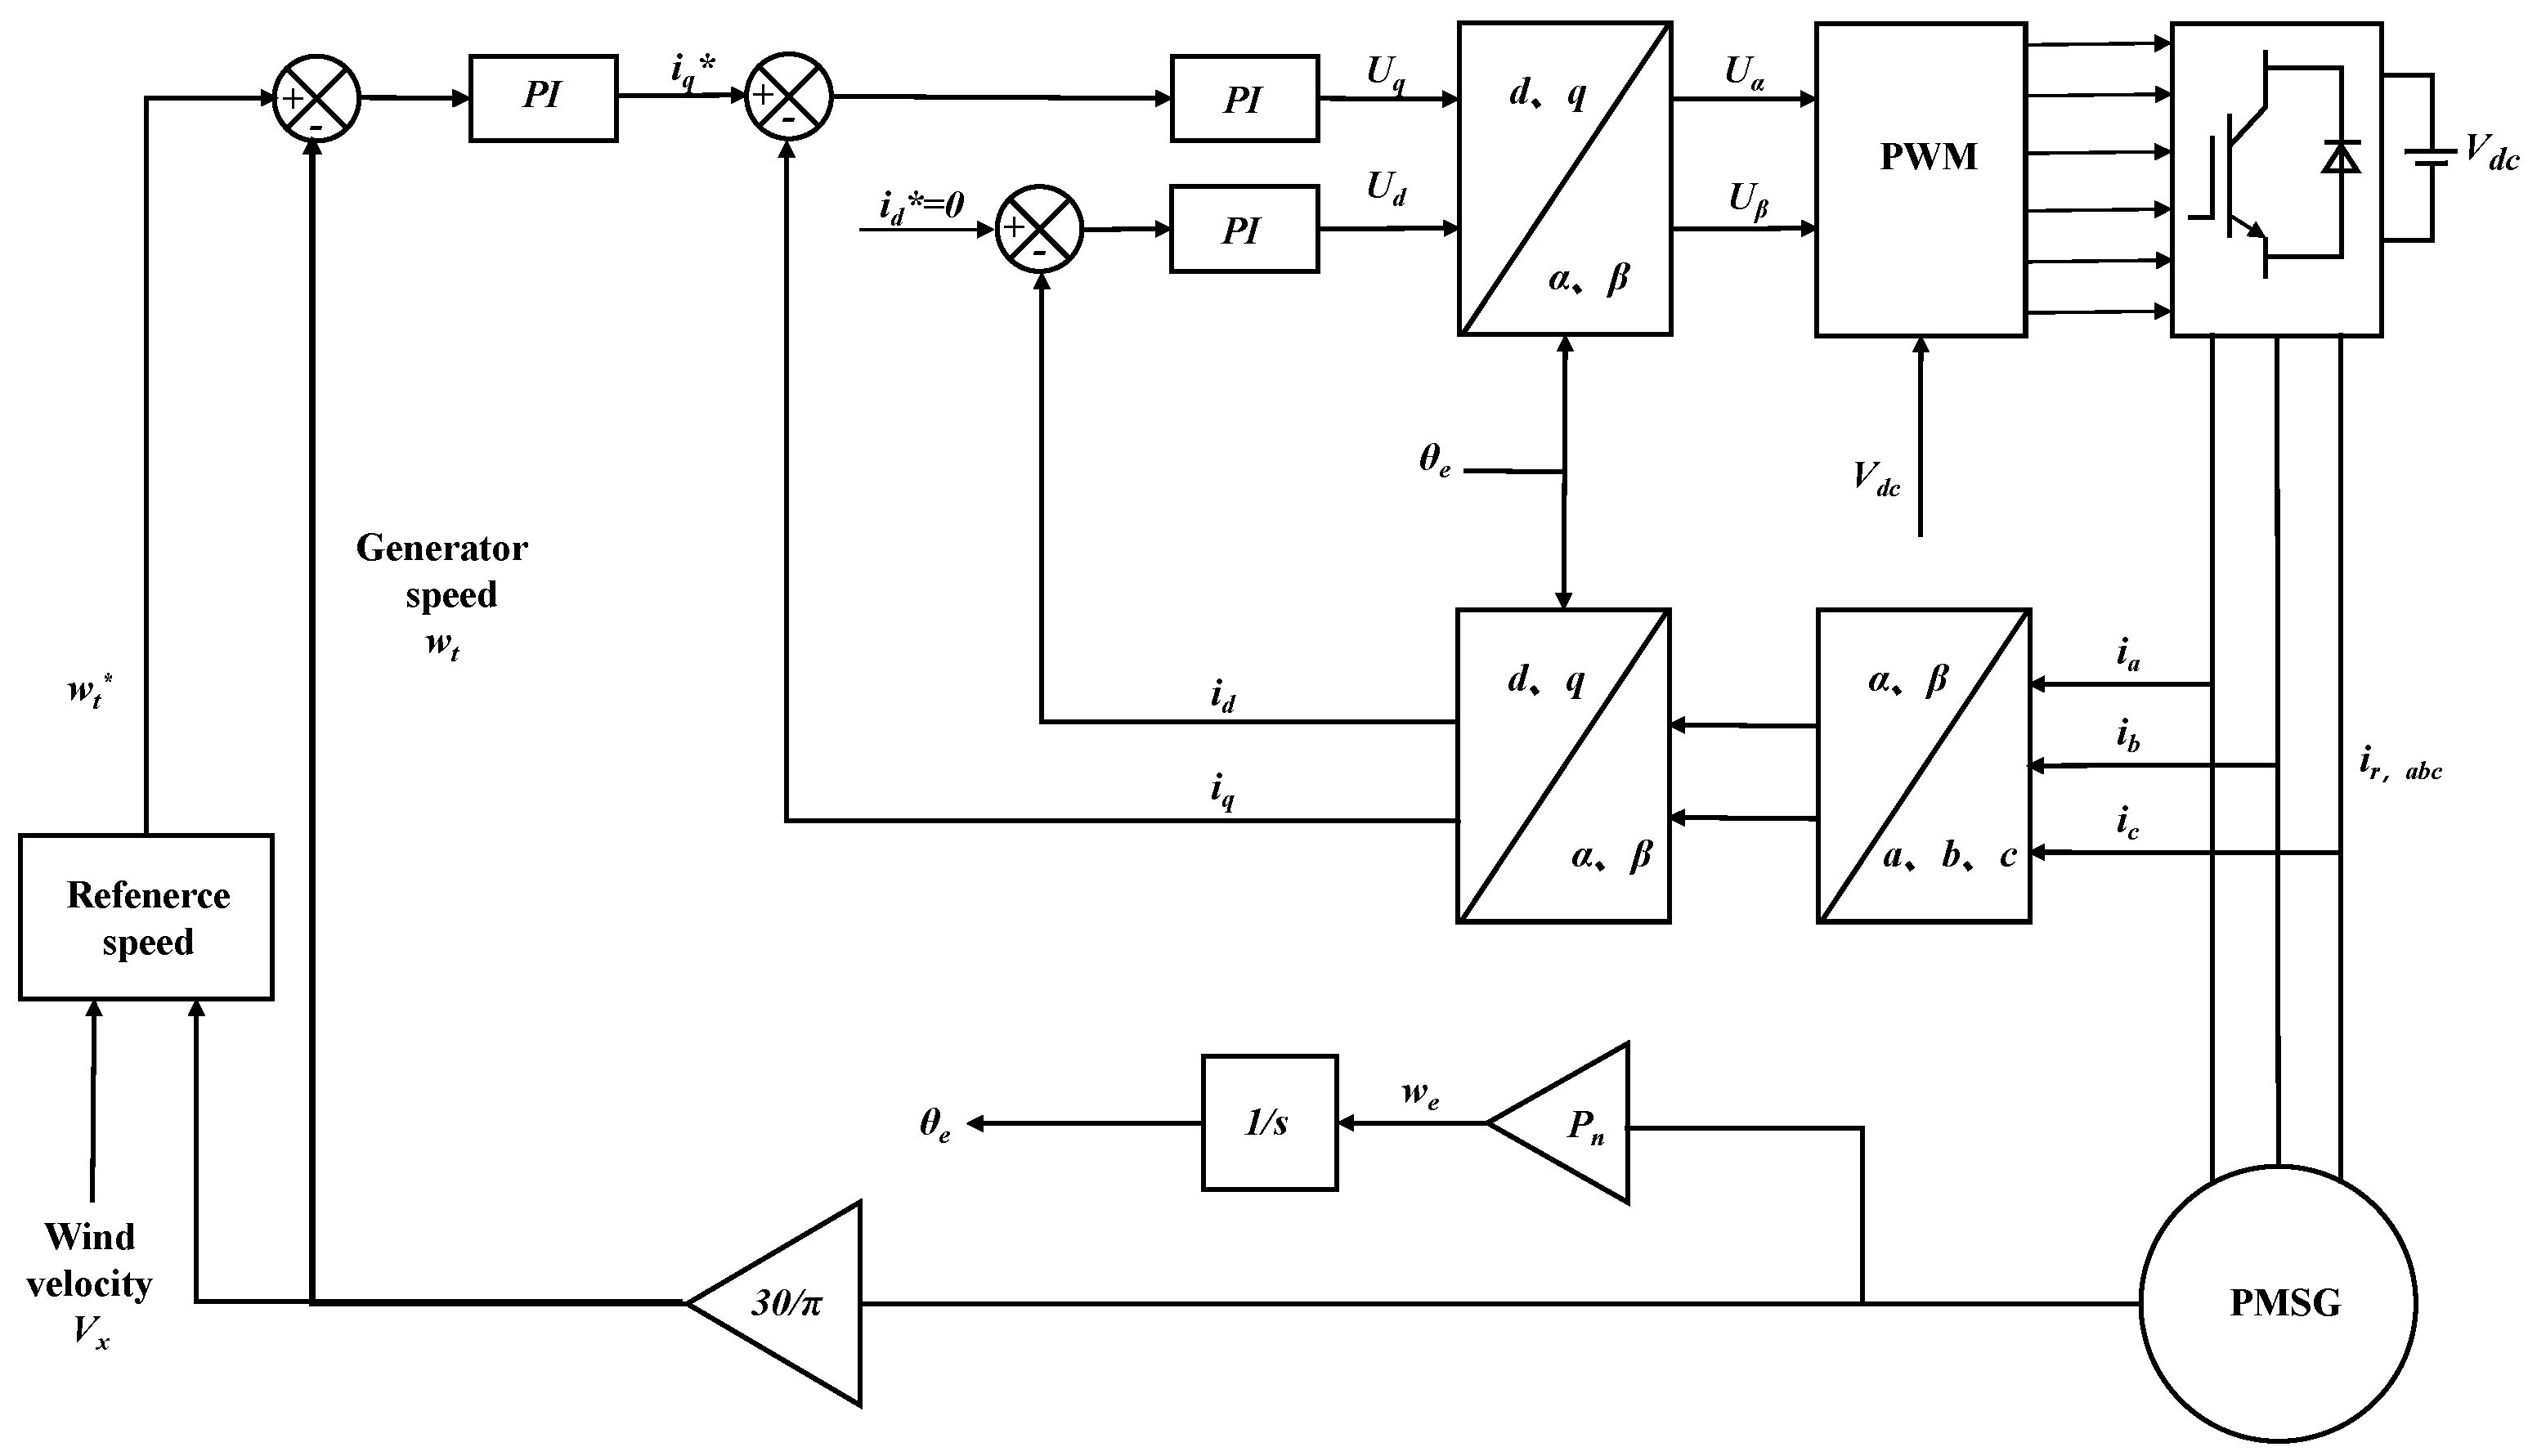
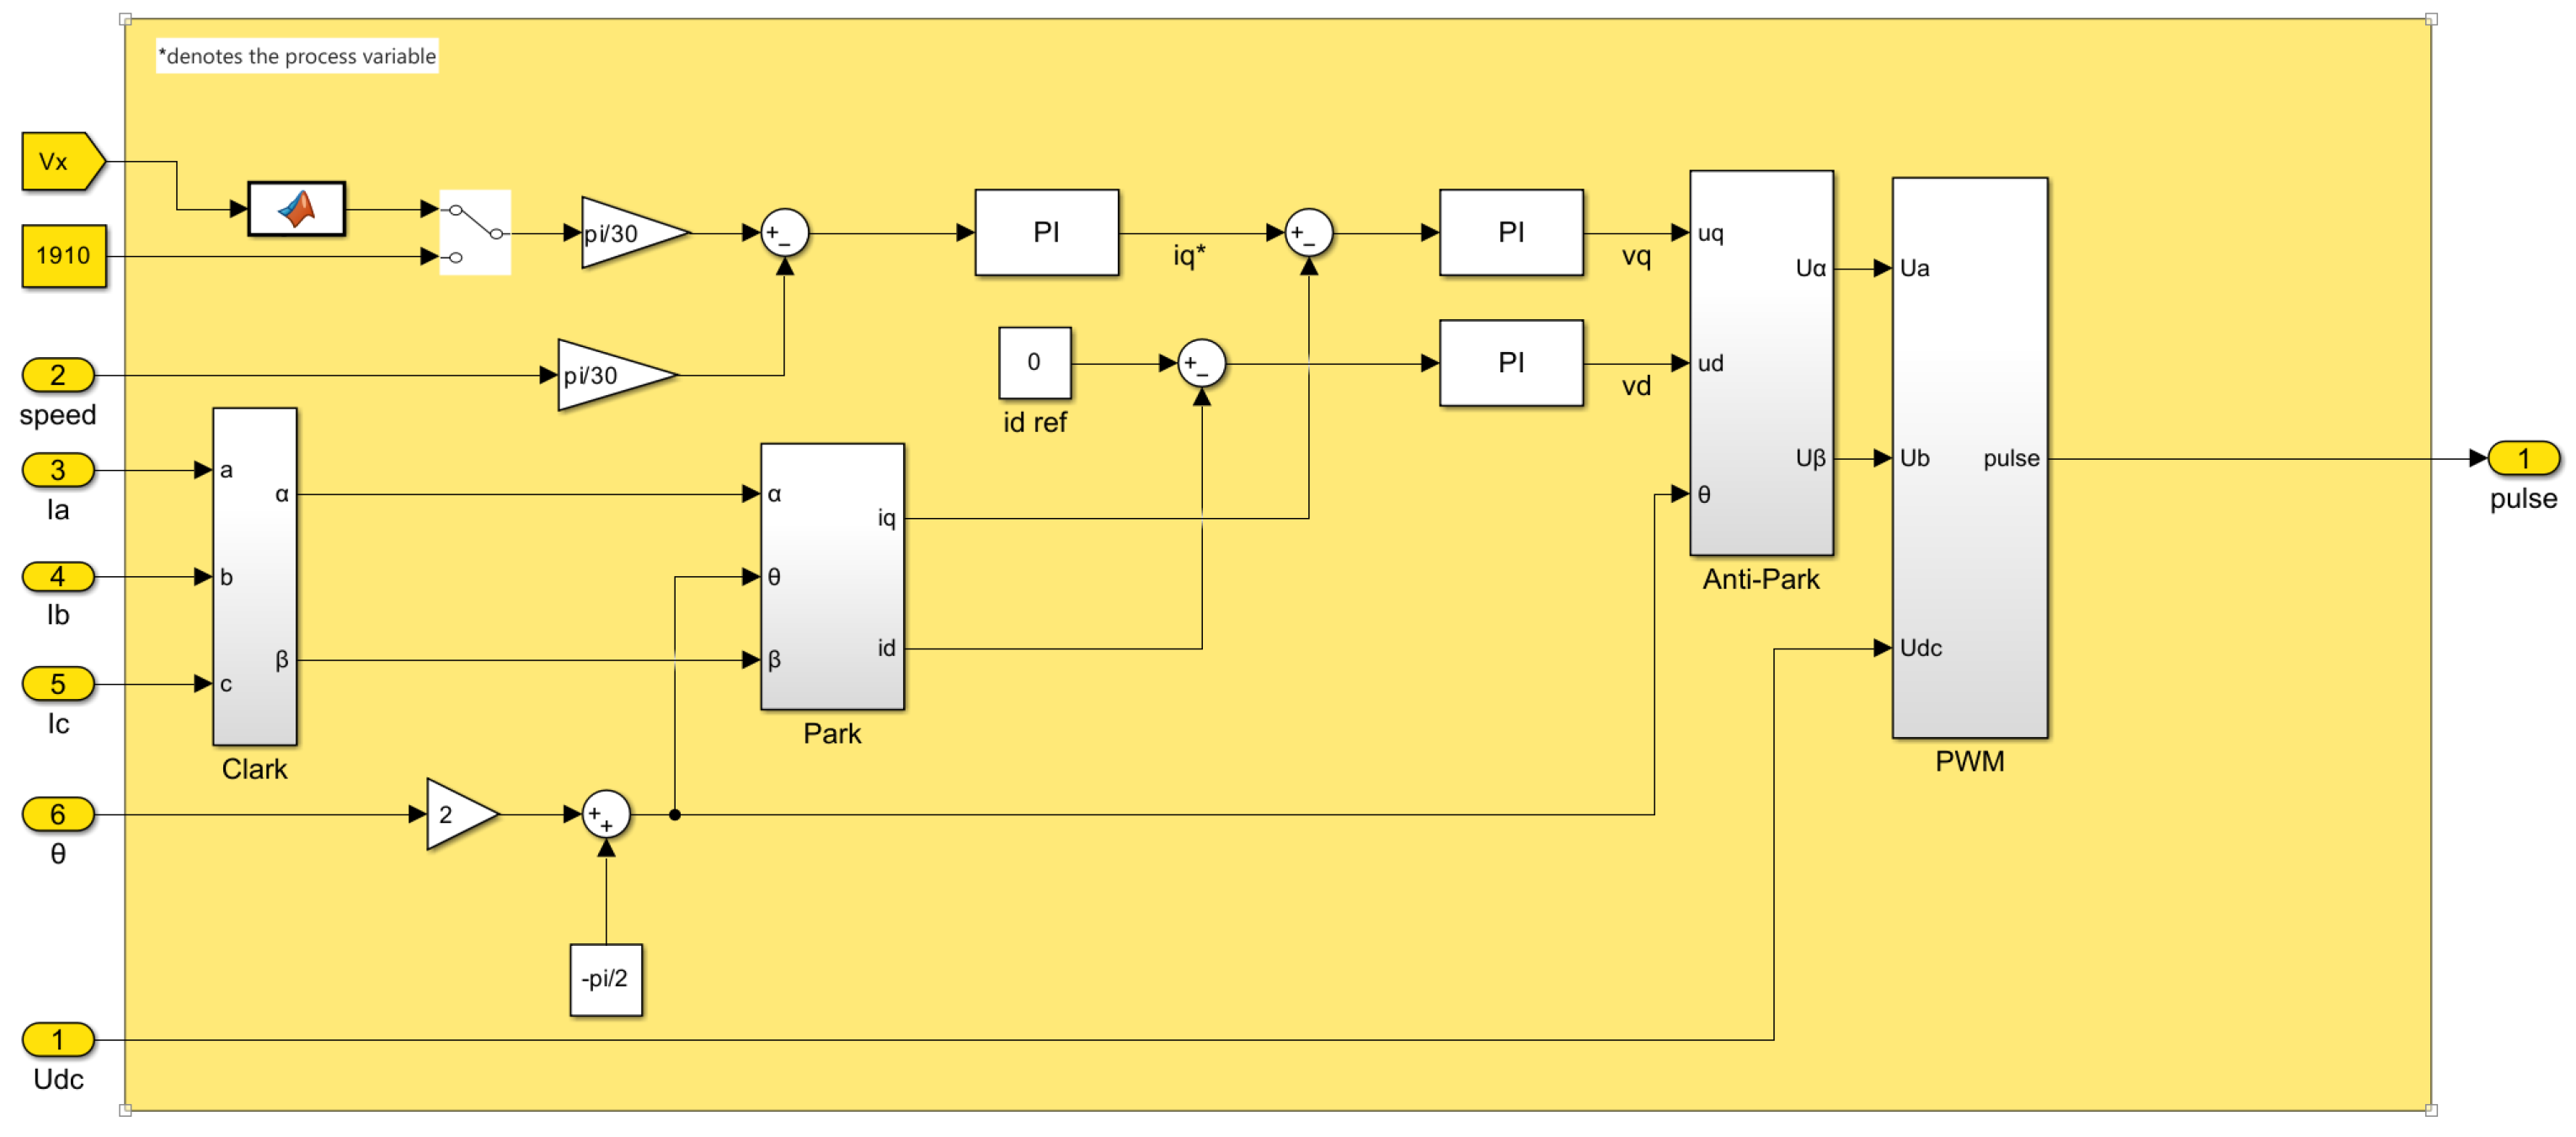
Figure 9 shows the block diagram of the machine side control system. The control structure adopts a double-loop structure of the speed outer loop and the current inner loop. According to the principle of vector control, the purpose of speed regulation can be achieved by controlling the phase and amplitude of the rotor current vector of the permanent magnet synchronous generator.
The vector control is based on the directional control of the rotor flux linkage. The control method of
= 0 is adopted, that is, the d-axis current of the permanent magnet synchronous generator is zero. Bringing
into Equation (18) in
Section 2 yields the following:
It can be seen from Equation (19) that the electromagnetic torque of the generator will be determined by the q-axis current component of the stator. Therefore, the control of the q-axis current can achieve the purpose of controlling the torque of the generator, and then realize the control of the speed of the permanent magnet synchronous generator and the output power of the Wells air turbine.
In the Machine side control, the control system takes action based on the measured axial air velocity in the duct and the instantaneous rotor speed. The turbo-generator system has a full-process coupling with the control system through a closed loop. The rotor side vector control mainly consists of three parts: speed control loop, current control loop, and PWM control algorithm. The purpose of the speed control loop is to regulate and stabilize the speed of the motor. The purpose of the current control loop is to speed up the dynamic regulation process of the system. The purpose of PWM is to adjust the duty cycle to achieve different output voltages and control the speed. The speed control is shown in
Figure 9, the outer loop of the speed control takes the reference speed
as a reference, the reference current
is generated by the PI controller, and the voltage
is generated by the PI controller to the inner loop. The current control outer loop is referenced to the stator d-axis current
, and the voltage
is generated by the PI controller. These two voltages are finally supplied to the PWM module to generate the required pulses.
2.6. Setting of the Voltage Ring PI Parameters
There are many ways to design the generator speed ring PI. The active power damping (see Equation (20)) defined by Lennart Harnefors is used to design the parameters, which is relatively simple to implement.
According to the mechanical equation of motion of the generator and the electromagnetic torque formula, Equation (7) can be obtained when the turbine connection shaft torque is zero, and then the desired speed ring band bandwidth
can be obtained as its pole Equation (21).
Therefore, the proportional coefficient and integration coefficient of the rotation speed ring PI controller can be obtained, as shown in Equation (23).
In the above formula, is the expected frequency band bandwidth of the rotation speed ring. Compared with the traditional method of using a typical type II system for the setting and adjustment of the PI regulator parameters, this parameter setting is simple, and the relationship between the parameter setting and the dynamic quality of the system is clear.
However, there are many variables involved in the actual parameter setting process, and many of them have been equivalent and ideal in detail, so the calculated PI parameters are sometimes not the optimal value. Some debugging can be carried out in the simulation process to achieve a better control effect.
2.7. Grid Side Control Scheme
The main goal of the grid side control is to maintain the stability of the DC link voltage, output the AC sinusoidal current, and control the output power factor to ensure the balance of the active power of the system. The grid side control is oriented based on the grid voltage vector; the active and reactive powers between the grid side control and the grid are defined as [
34]:
where
and
are the d-qaxis component of the grid current, respectively. The
and
are the d-qaxiscomponent of the grid voltage, respectively. When the grid voltage is oriented,
= 0, so there is
assuming that the power grid is a stable power supply,
is fixed value, and it can be seen from Equations (26) and (27) that the instantaneous active power and reactive power of the grid-connected inverter are proportional to the output current d-qaxiscomponent
, and
of the grid-connected inverter. This shows that the active power and reactive power of the grid-connected inverter can be controlled respectively through the control of
and
.
The active power of the grid-connected inverter is equal to the power of the input inverter, so there is
It can be seen that the DC side voltage
of the grid-connected inverter is proportional to the output current id of the grid-connected inverter. Therefore, the control of the DC output voltage
of the grid-connected inverter can be realized by the control of the active power, that is, the control of
.
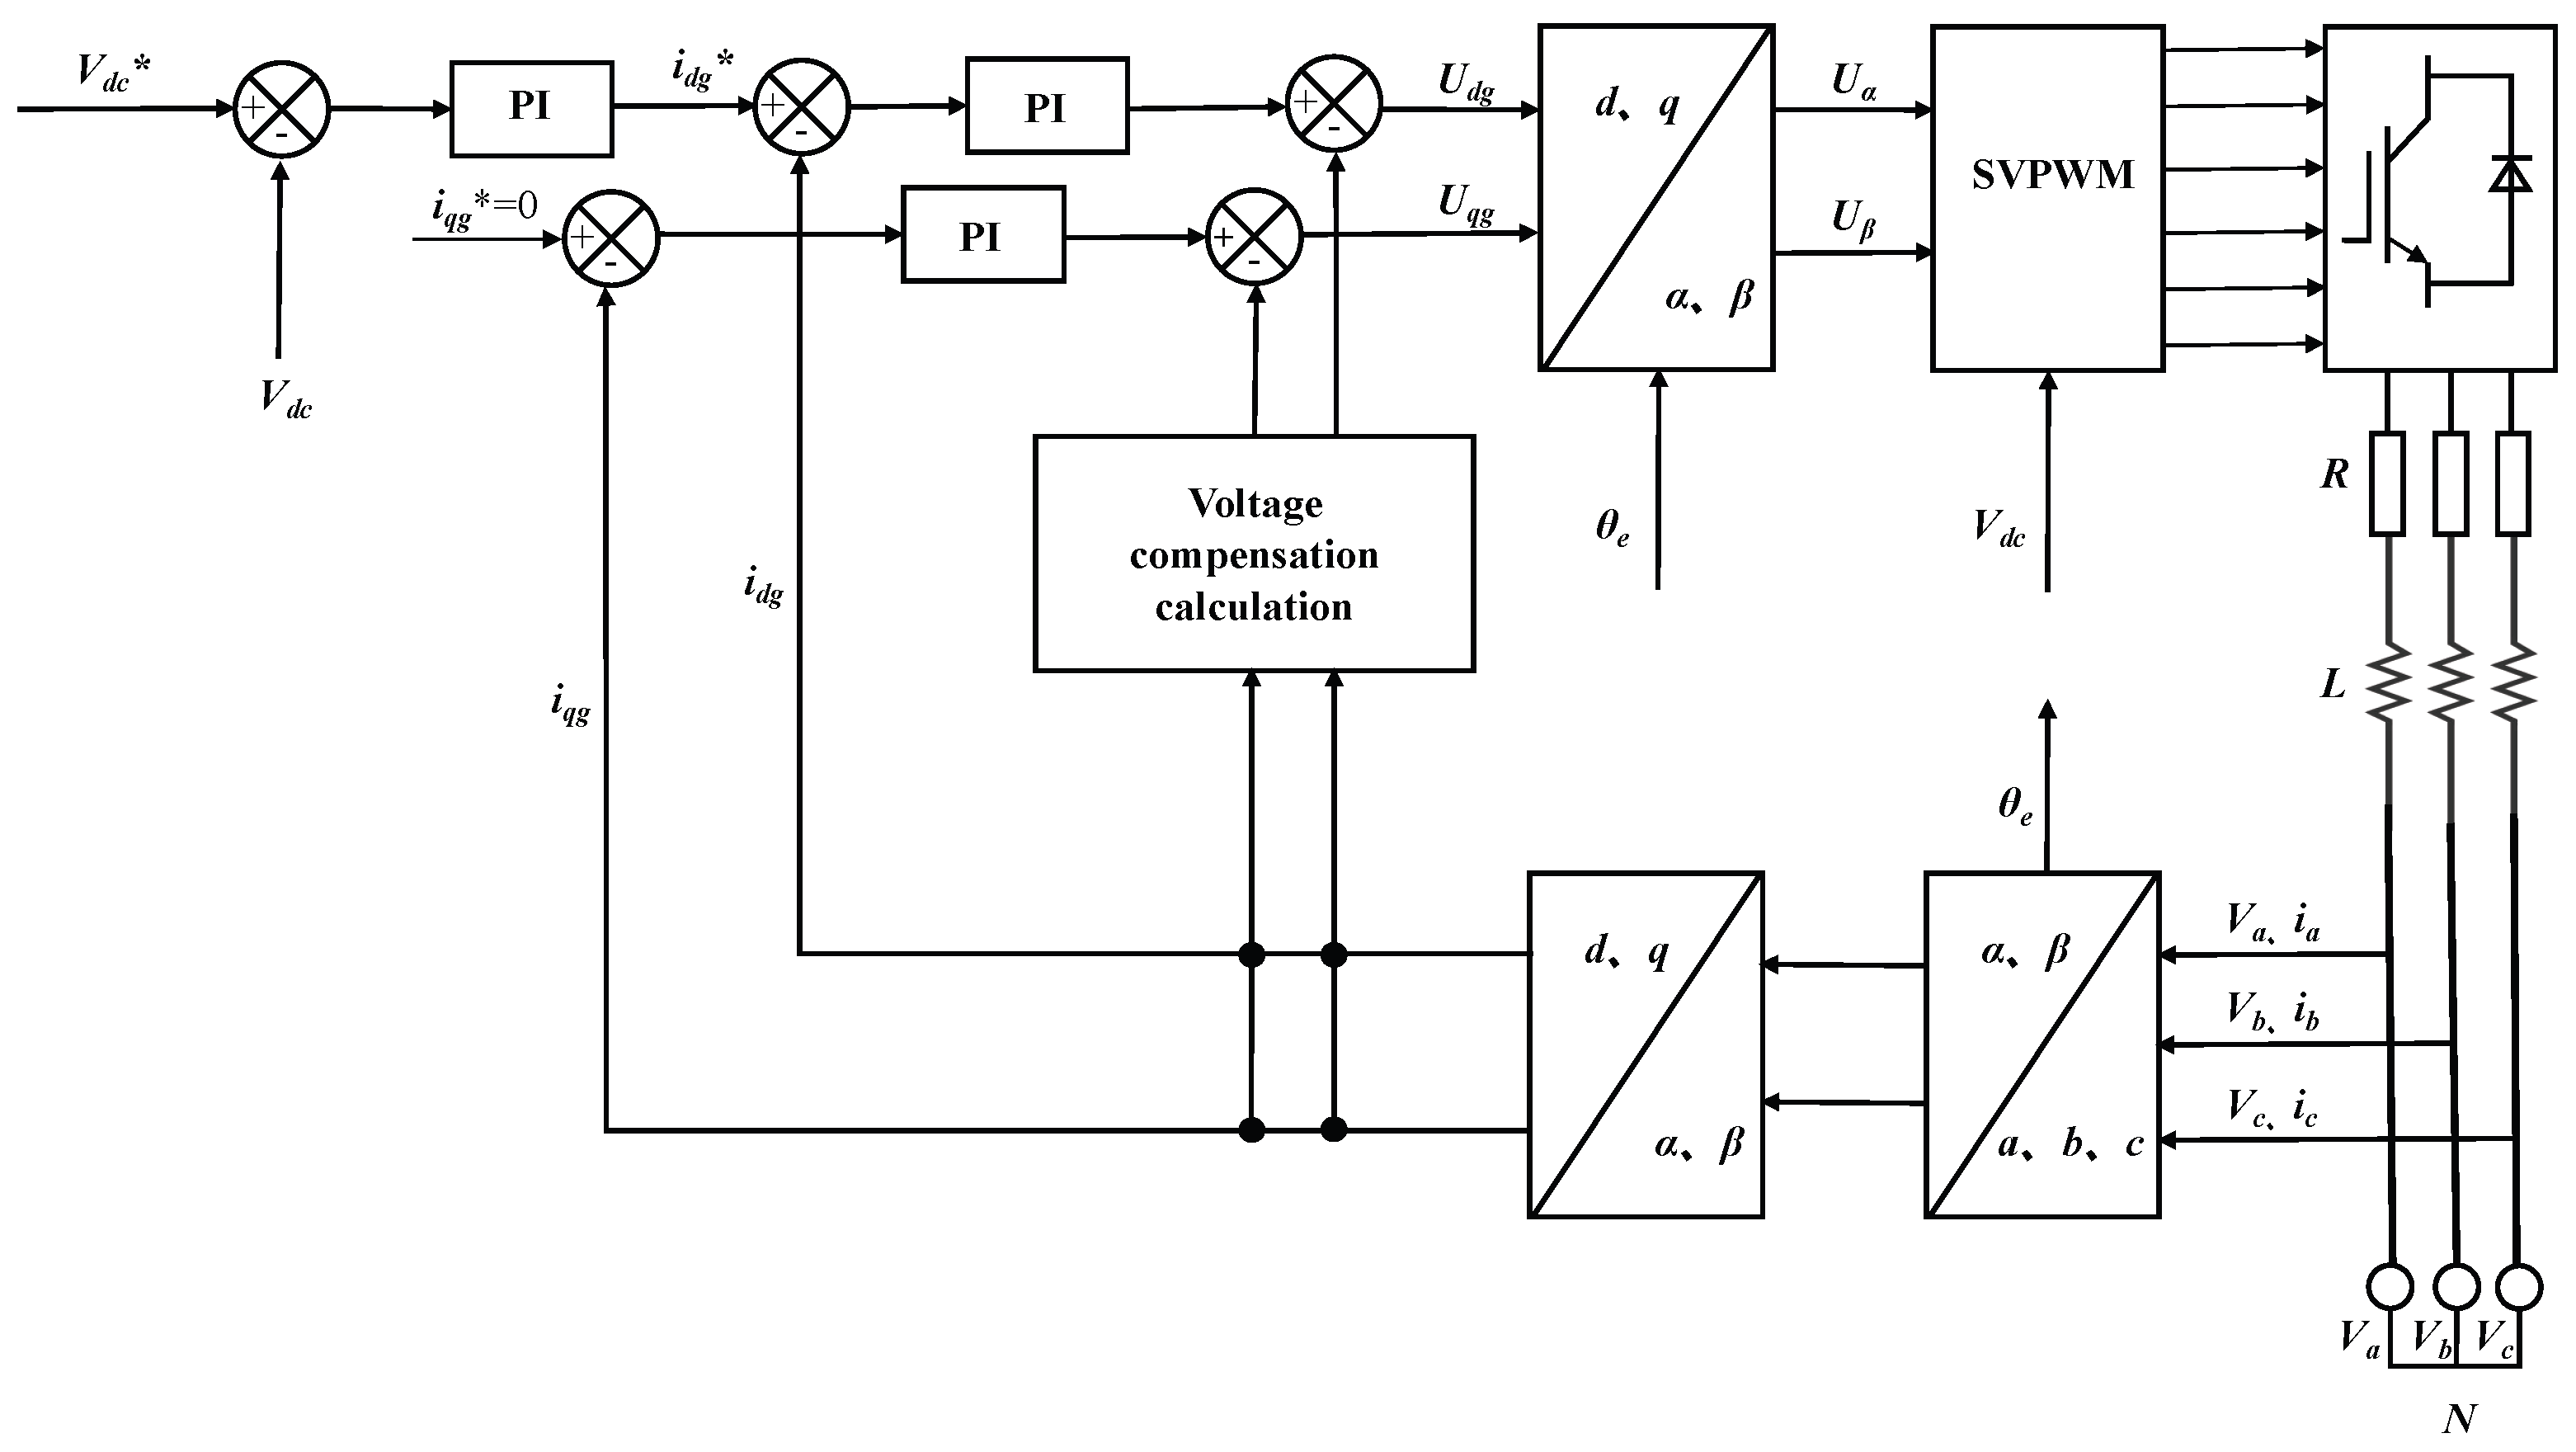
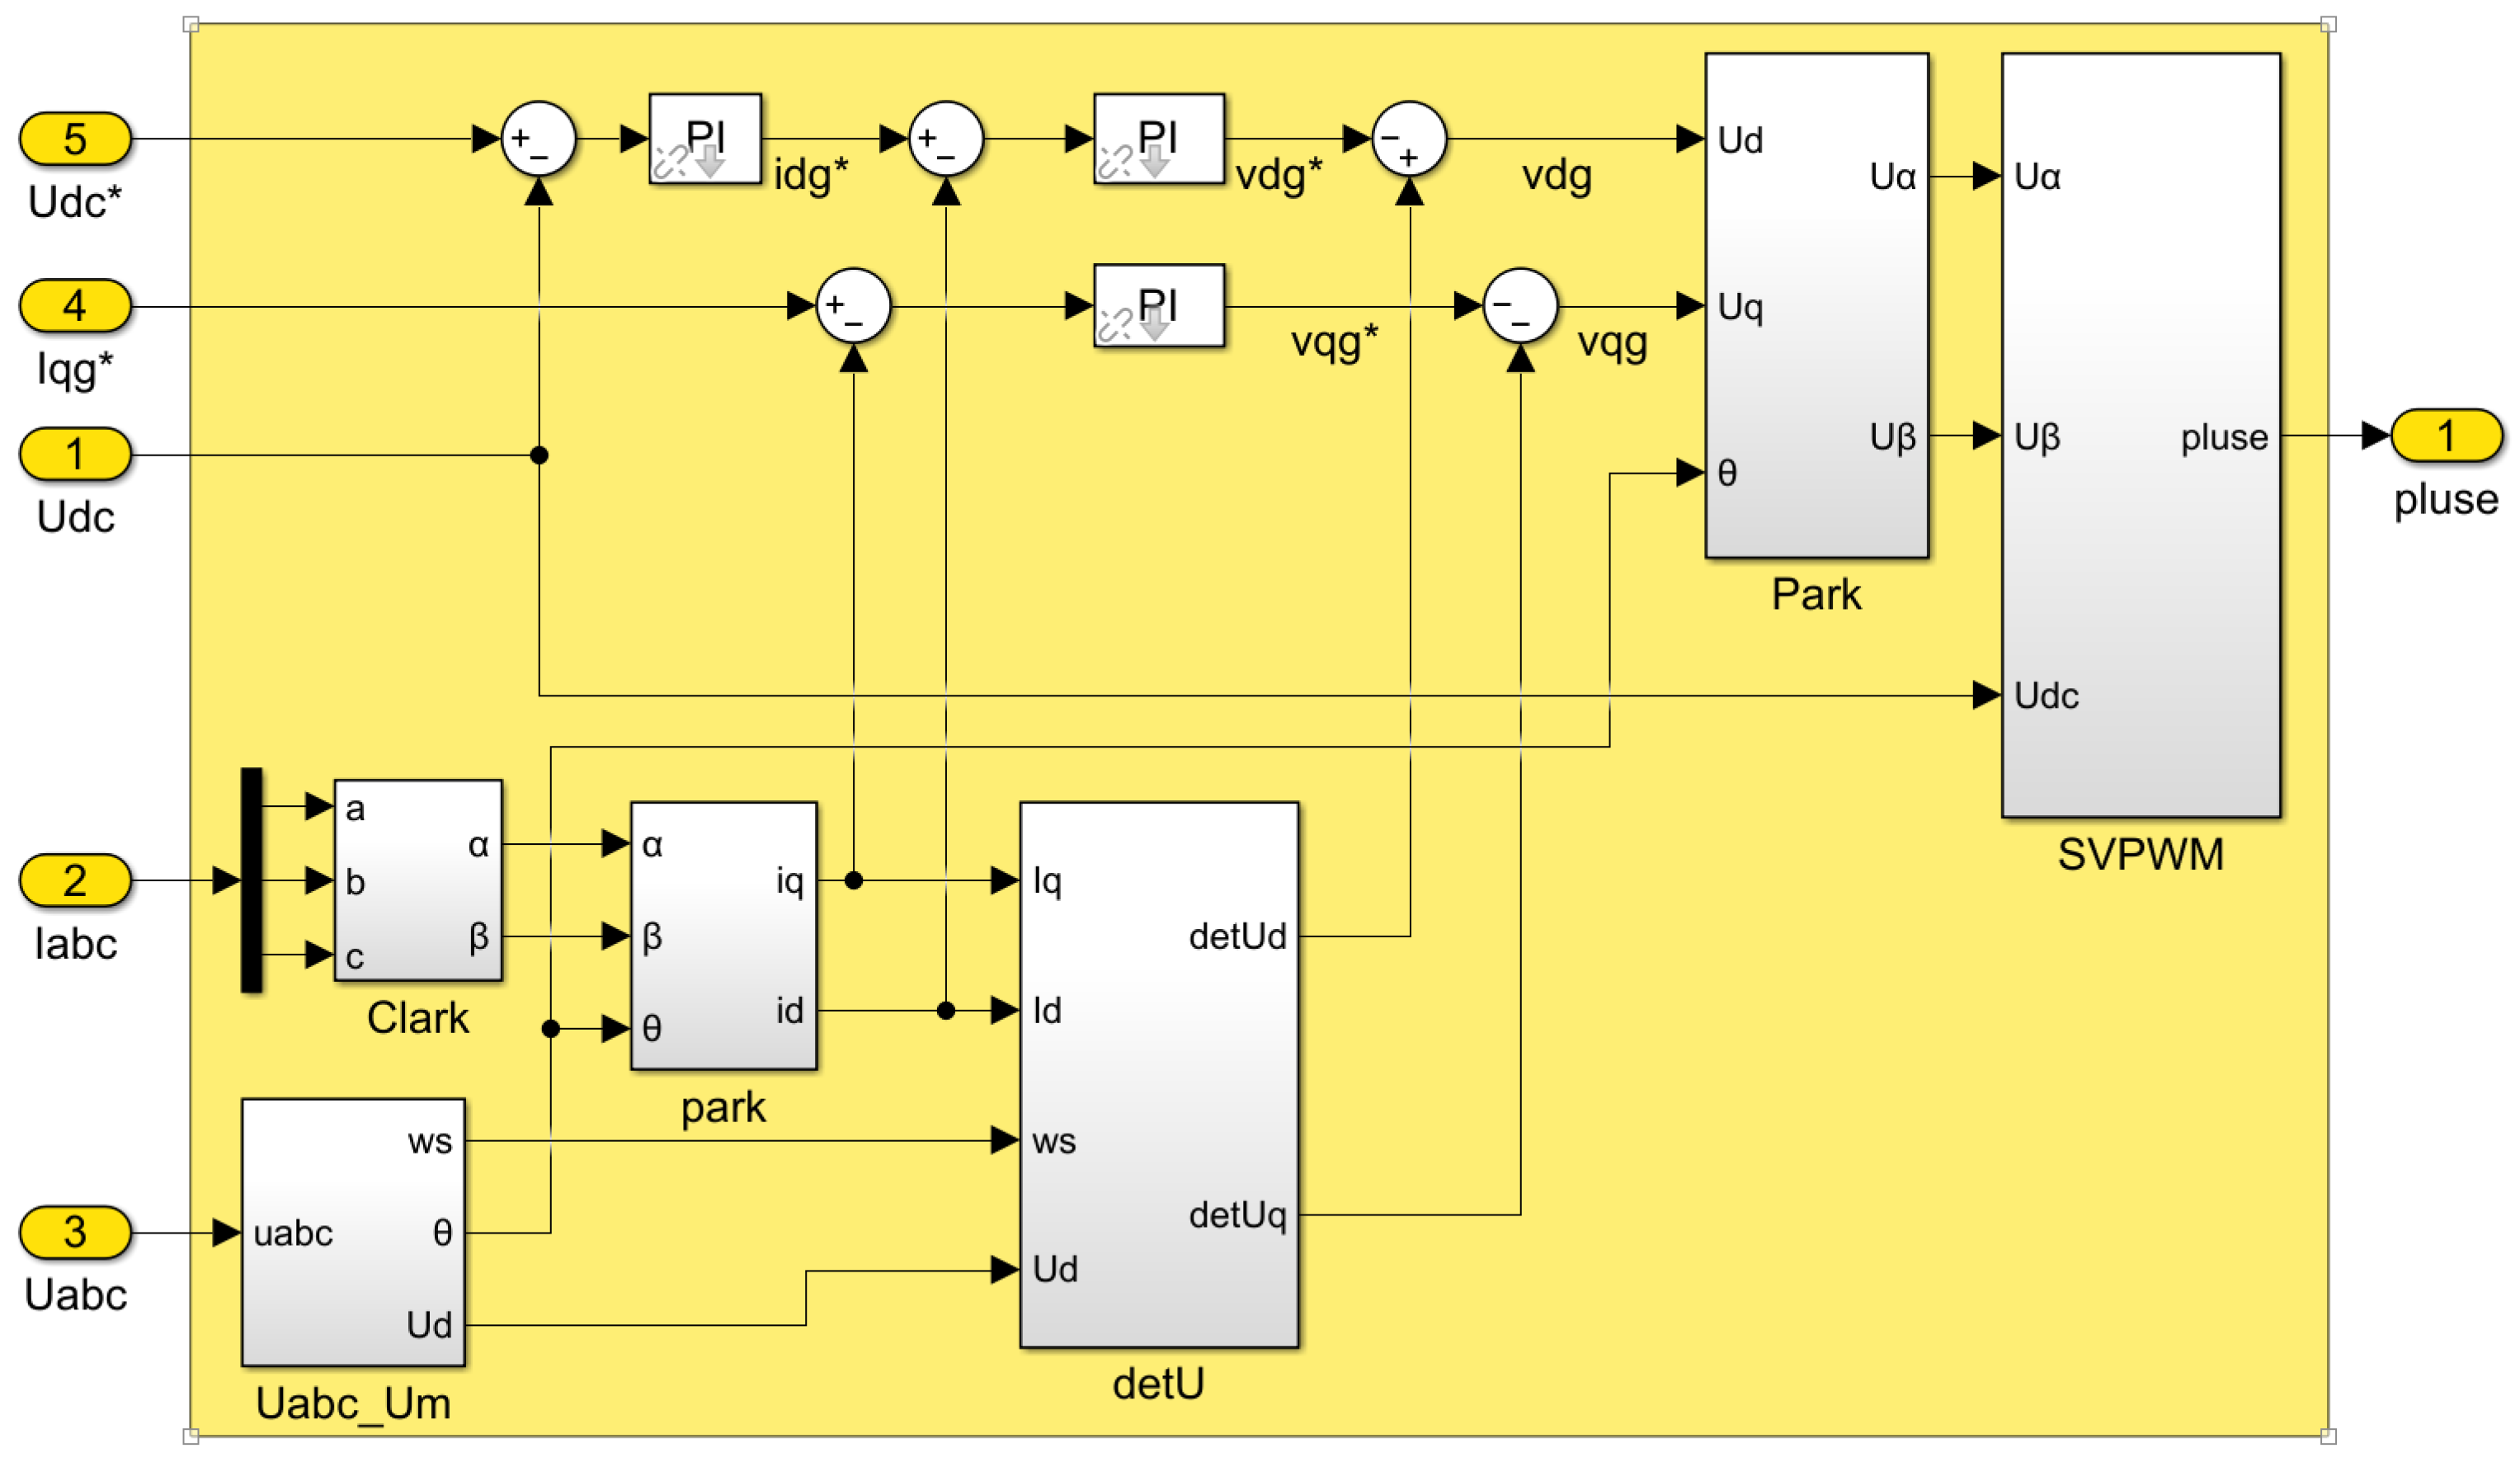
The grid side control mainly consists of three parts: DC link voltage control loop, current control loop, and SVPWM control algorithm.
The grid-connected control is shown in
Figure 10; the given DC voltage
is compared with the actual detected DC bus voltage
. The error signal is adjusted by the proportional integral PI controller to generate the active reference current
. The reference reactive current
= 0 is set, the control parameters of the voltage outer loop control PI controller are
and
respectively, and the control parameters of the two groups of PI controllers in the current inner loop are
. By controlling the voltage loop, the voltage stability of the control DC link can be realized. By controlling the current loop, the control of active power and reactive power can be realized. In this way, the grid-side PWM converter can maintain the stability of the DC bus voltage while stably transmitting power to the grid, and meet the requirements of the grid for reactive power.
3. Floating OWC Hydrodynamic Analysis
In the numerical simulation of the interaction between waves and floating OWC, the incident wave is a fifth-order Stokes wave, and two wave gauges are set, which are
H = 0.6 m and 0.8 m, respectively. Corresponding to each wave gauge, six wavelengths were set, which were
L = 4.8, 6.0, 7.2, 8.4, 9.6, and 10.8 m, respectively. The schematic diagram of wave height measurement points in hydrodynamic simulation is shown in
Figure 3.
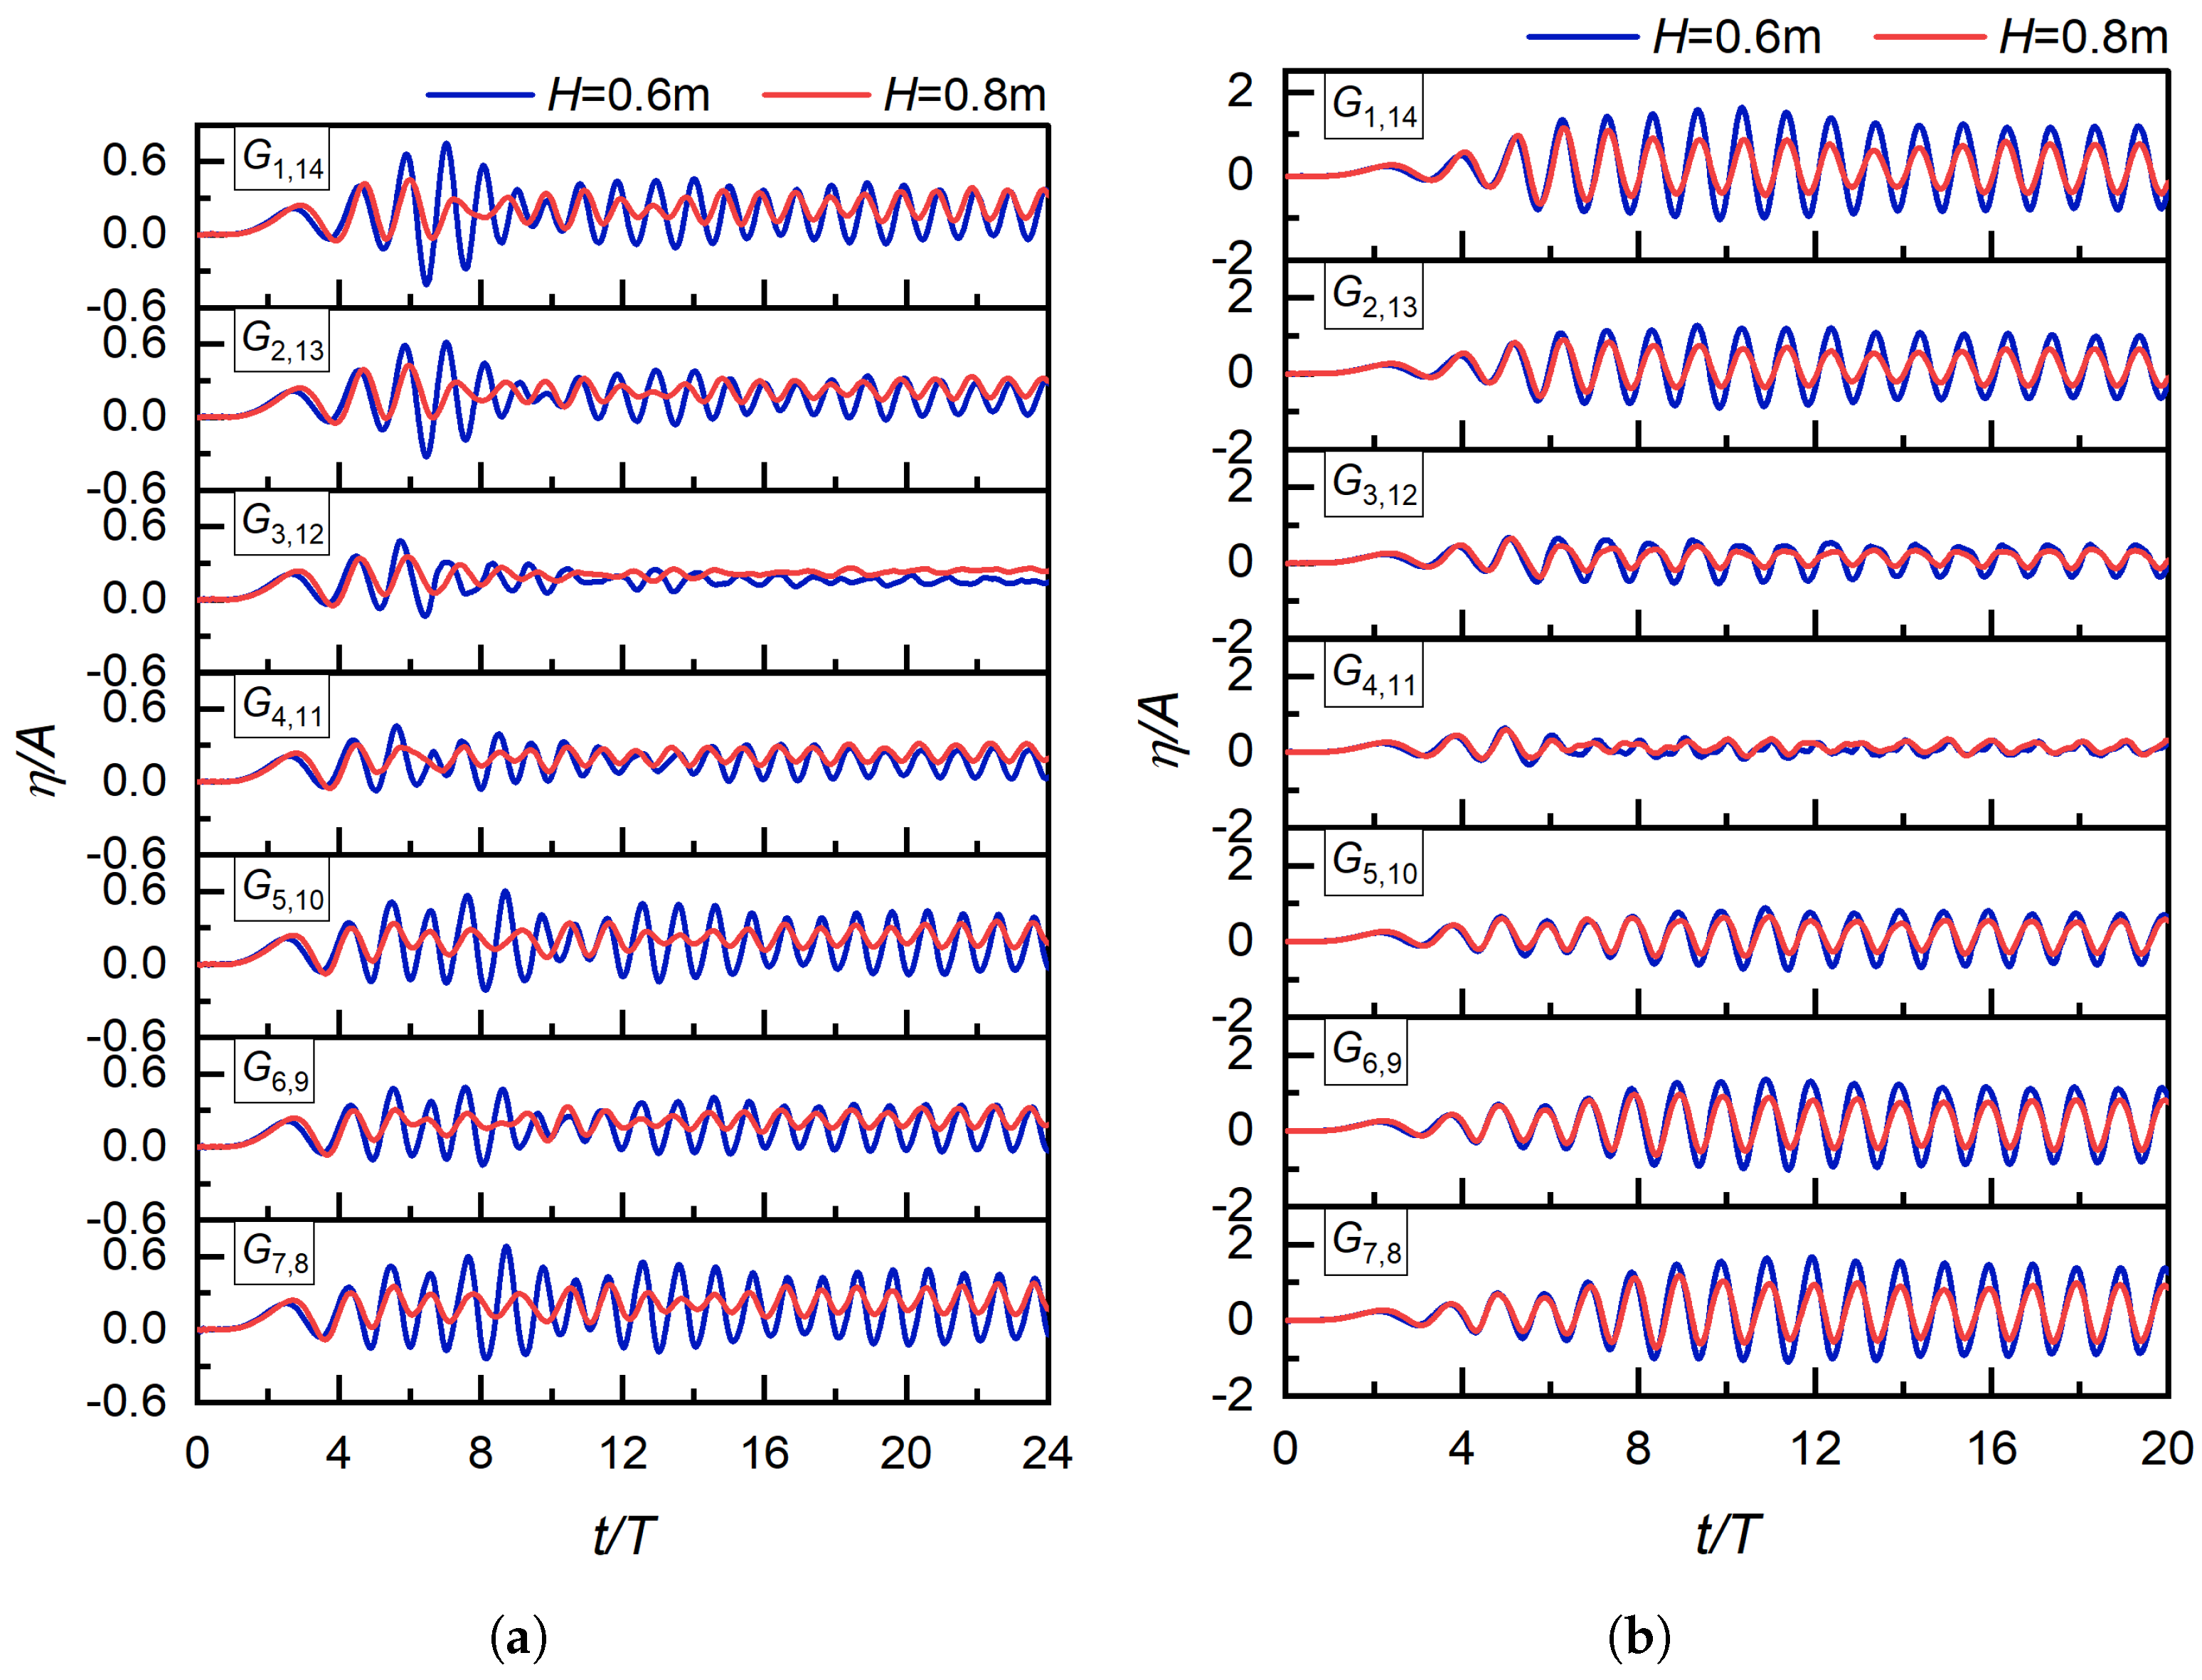
For shorter incident wavelengths (
L = 4.8 m, 6.0 m),
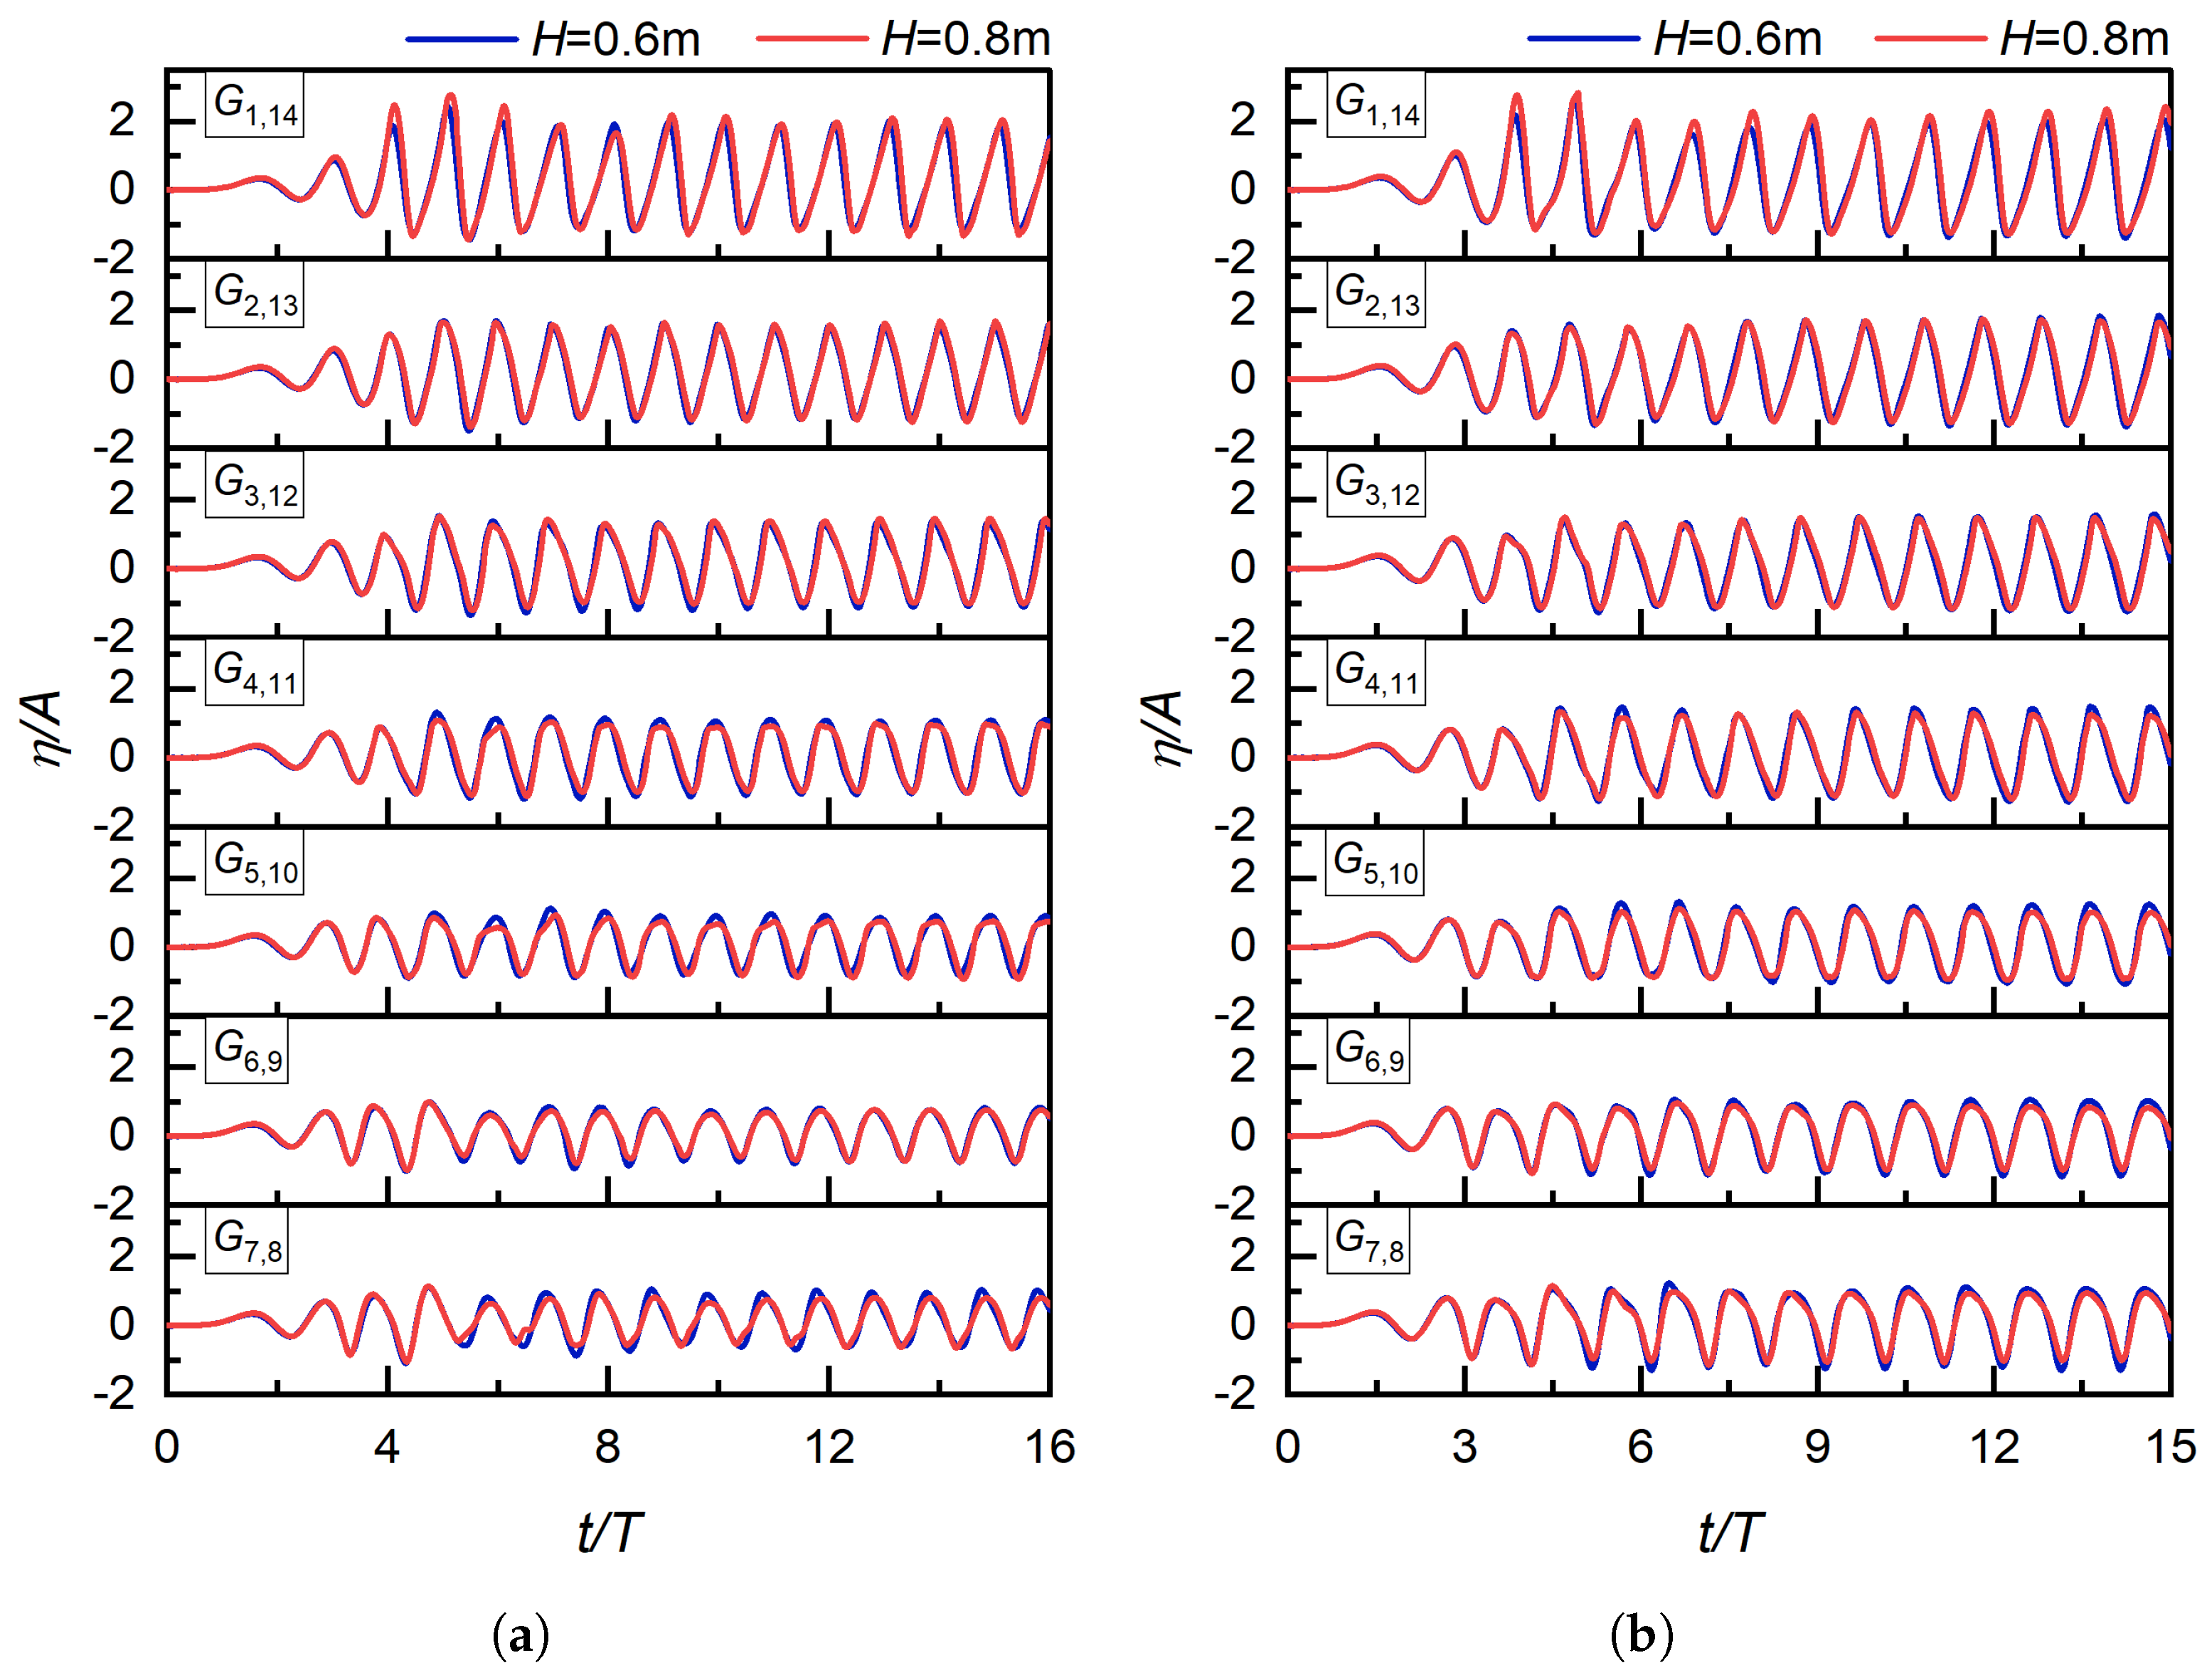
Figure 11 presents the free surface elevation measured at each wave gauge measuring point under incident wave heights
H = 0.6 m and 0.8 m. It can be observed that the free surface elevation at each measuring point inevitably undergoes a transient stage: significant oscillations occur in the first few cycles when transitioning from a static to a dynamic state, followed by a gradual entry into a stable stage with nearly constant amplitude. In this stable stage, the amplitude of the measuring points first decreases and then increases counterclockwise from
to
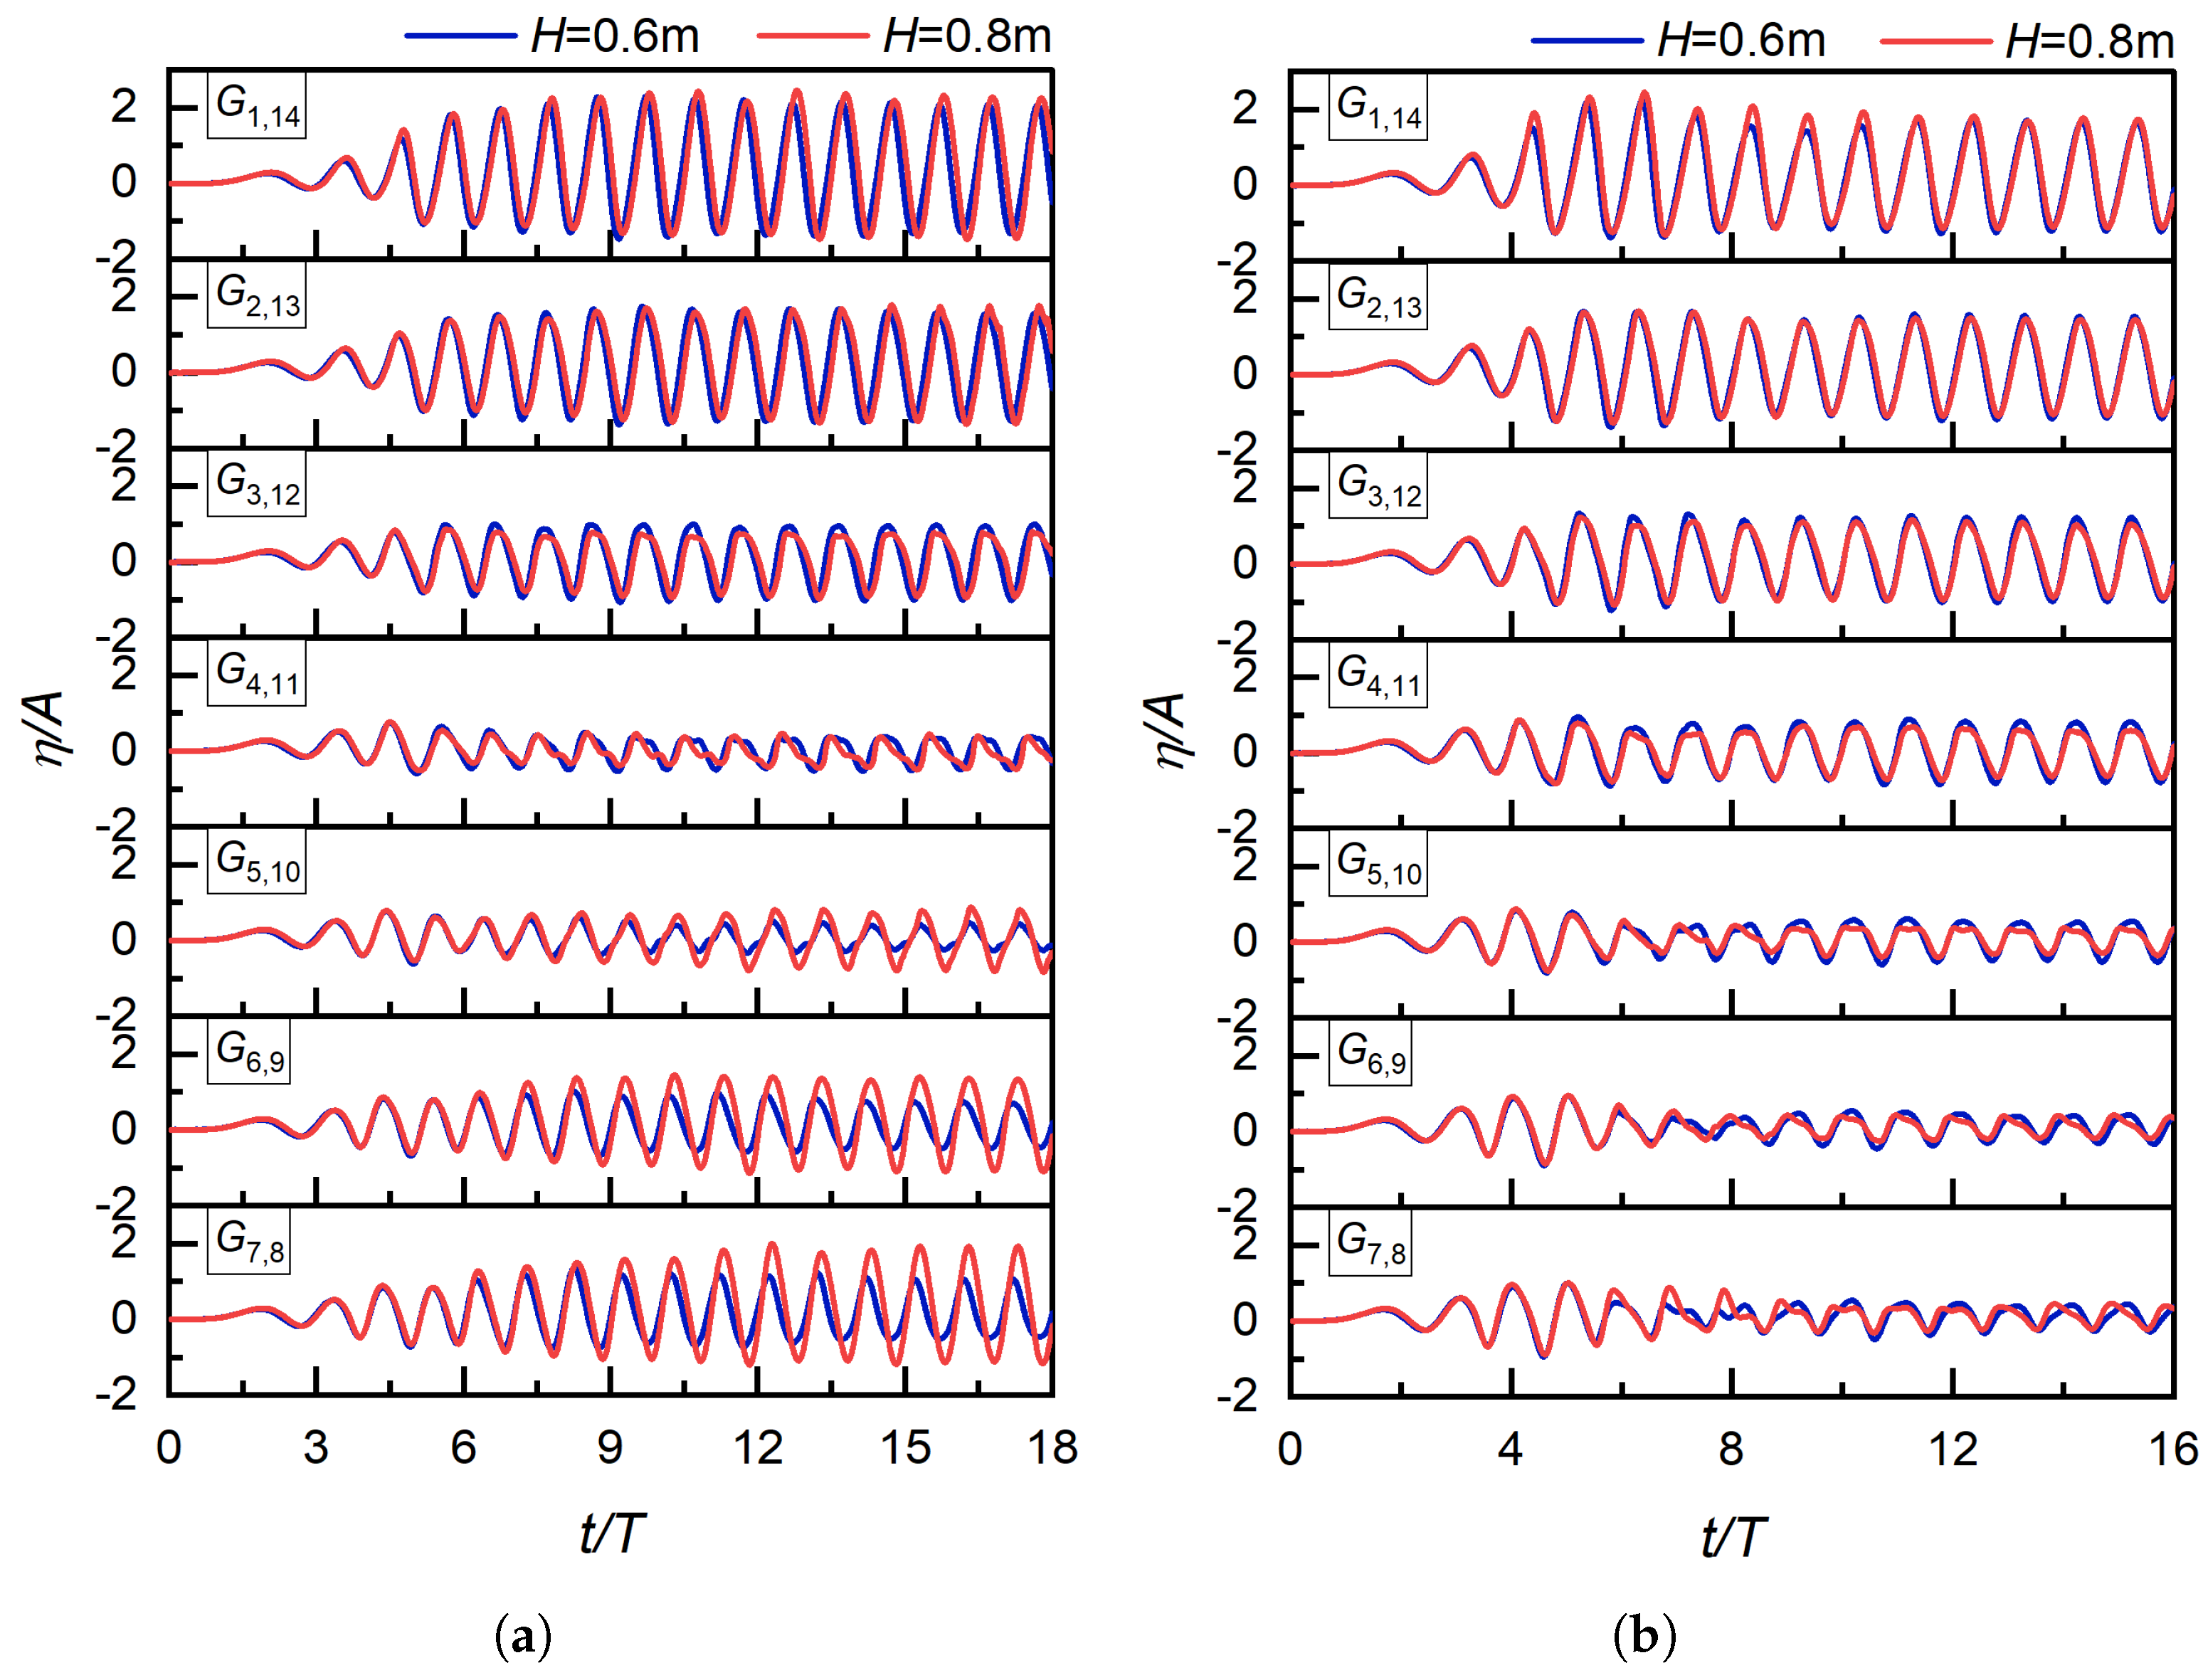
. This is attributed to the free surface of the floating OWC chamber being primarily in a sloshing state, where the free surface exhibits obvious forward and backward sloshing behavior around a sloshing central axis—resulting in smaller amplitudes at wave gauge measuring points near this axis and larger amplitudes at points farther away. When the incident wavelength increases to the medium range (L = 7.2 m, 8.4 m), further observations from
Figure 12 reveal new characteristics of the free surface elevation history at each wave gauge measuring point under the same wave heights (H = 0.6 m, 0.8 m). Specifically, at L = 7.2 m, the amplitude of the measuring points in the stable stage first decreases and then increases counterclockwise from
to
, with the smallest amplitude observed at
—indicating that the sloshing central axis is close to
and near the center of the device. At L = 8.4 m, the amplitude of the wave gauge measuring points in the stable stage decreases continuously counterclockwise from
to
, and the smallest amplitude occurs at
, which suggests the sloshing central axis is adjacent to
and located on the left side outside the device. Notably, while forward and backward sloshing remains the dominant behavior of the free surface in the floating OWC chamber at this wavelength, it is accompanied by piston-like vertical motion. For longer incident wavelengths (L = 9.6 m, 10.8 m), the results shown in
Figure 13 demonstrate distinct commonalities in the free surface uplift measured by each wave gauge under H = 0.6 m and 0.8 m. In the stable stage, the free surface elevations measured by all wave gauge measuring points are basically consistent, and although the amplitude decreases counterclockwise from
to
, the reduction is minimal. The core reason for this phenomenon is that the free surface in the air chamber of the floating OWC device is mainly characterized by the vertical movement of a smooth plane (i.e., piston motion), leading to little difference in amplitudes measured at adjacent wave gauge measuring points.
In summary, there is a significant correlation between the motion state of the free surface in the floating OWC chamber, the amplitude distribution of measuring points, and the incident wavelength. Specifically, sloshing dominates at shorter wavelengths (L = 4.8–6.0 m), with amplitudes showing a “decrease-then-increase” pattern; at medium wavelengths (L = 7.2–8.4 m), the sloshing central axis shifts and is accompanied by piston-like motion; and at longer wavelengths (L = 9.6–10.8 m), piston motion becomes the main behavior, and the amplitude difference between adjacent measuring points is significantly reduced.
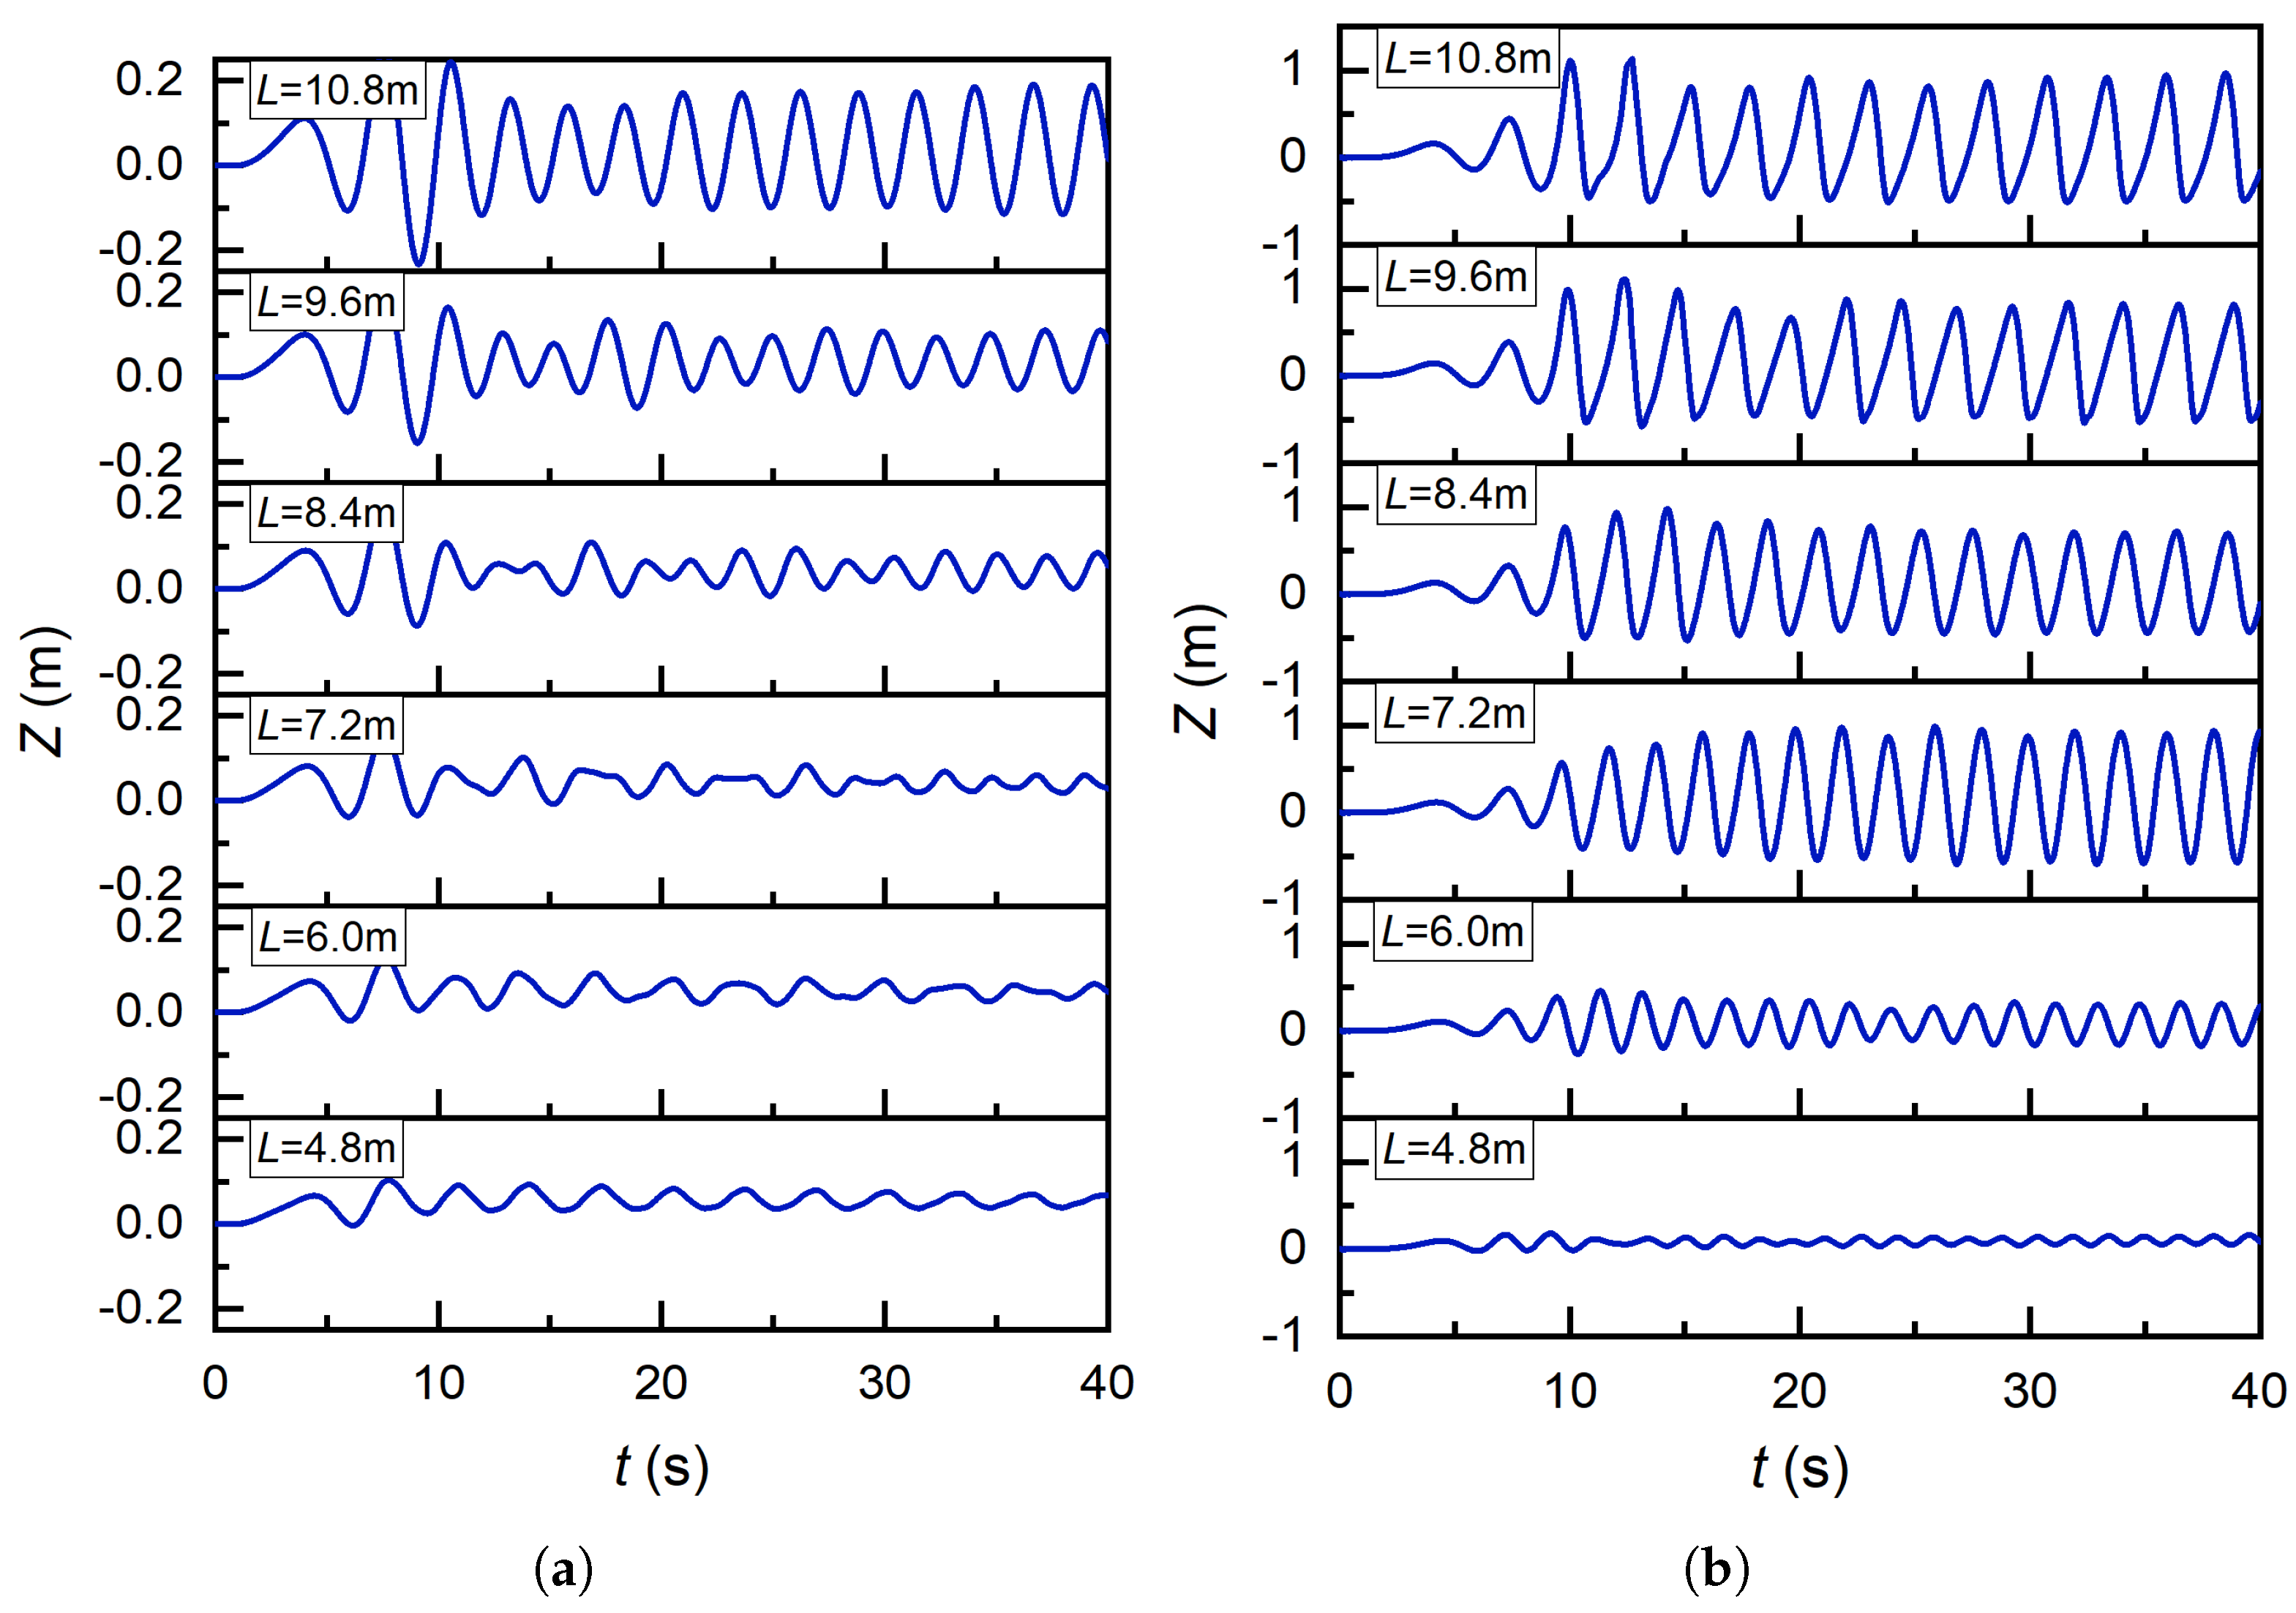
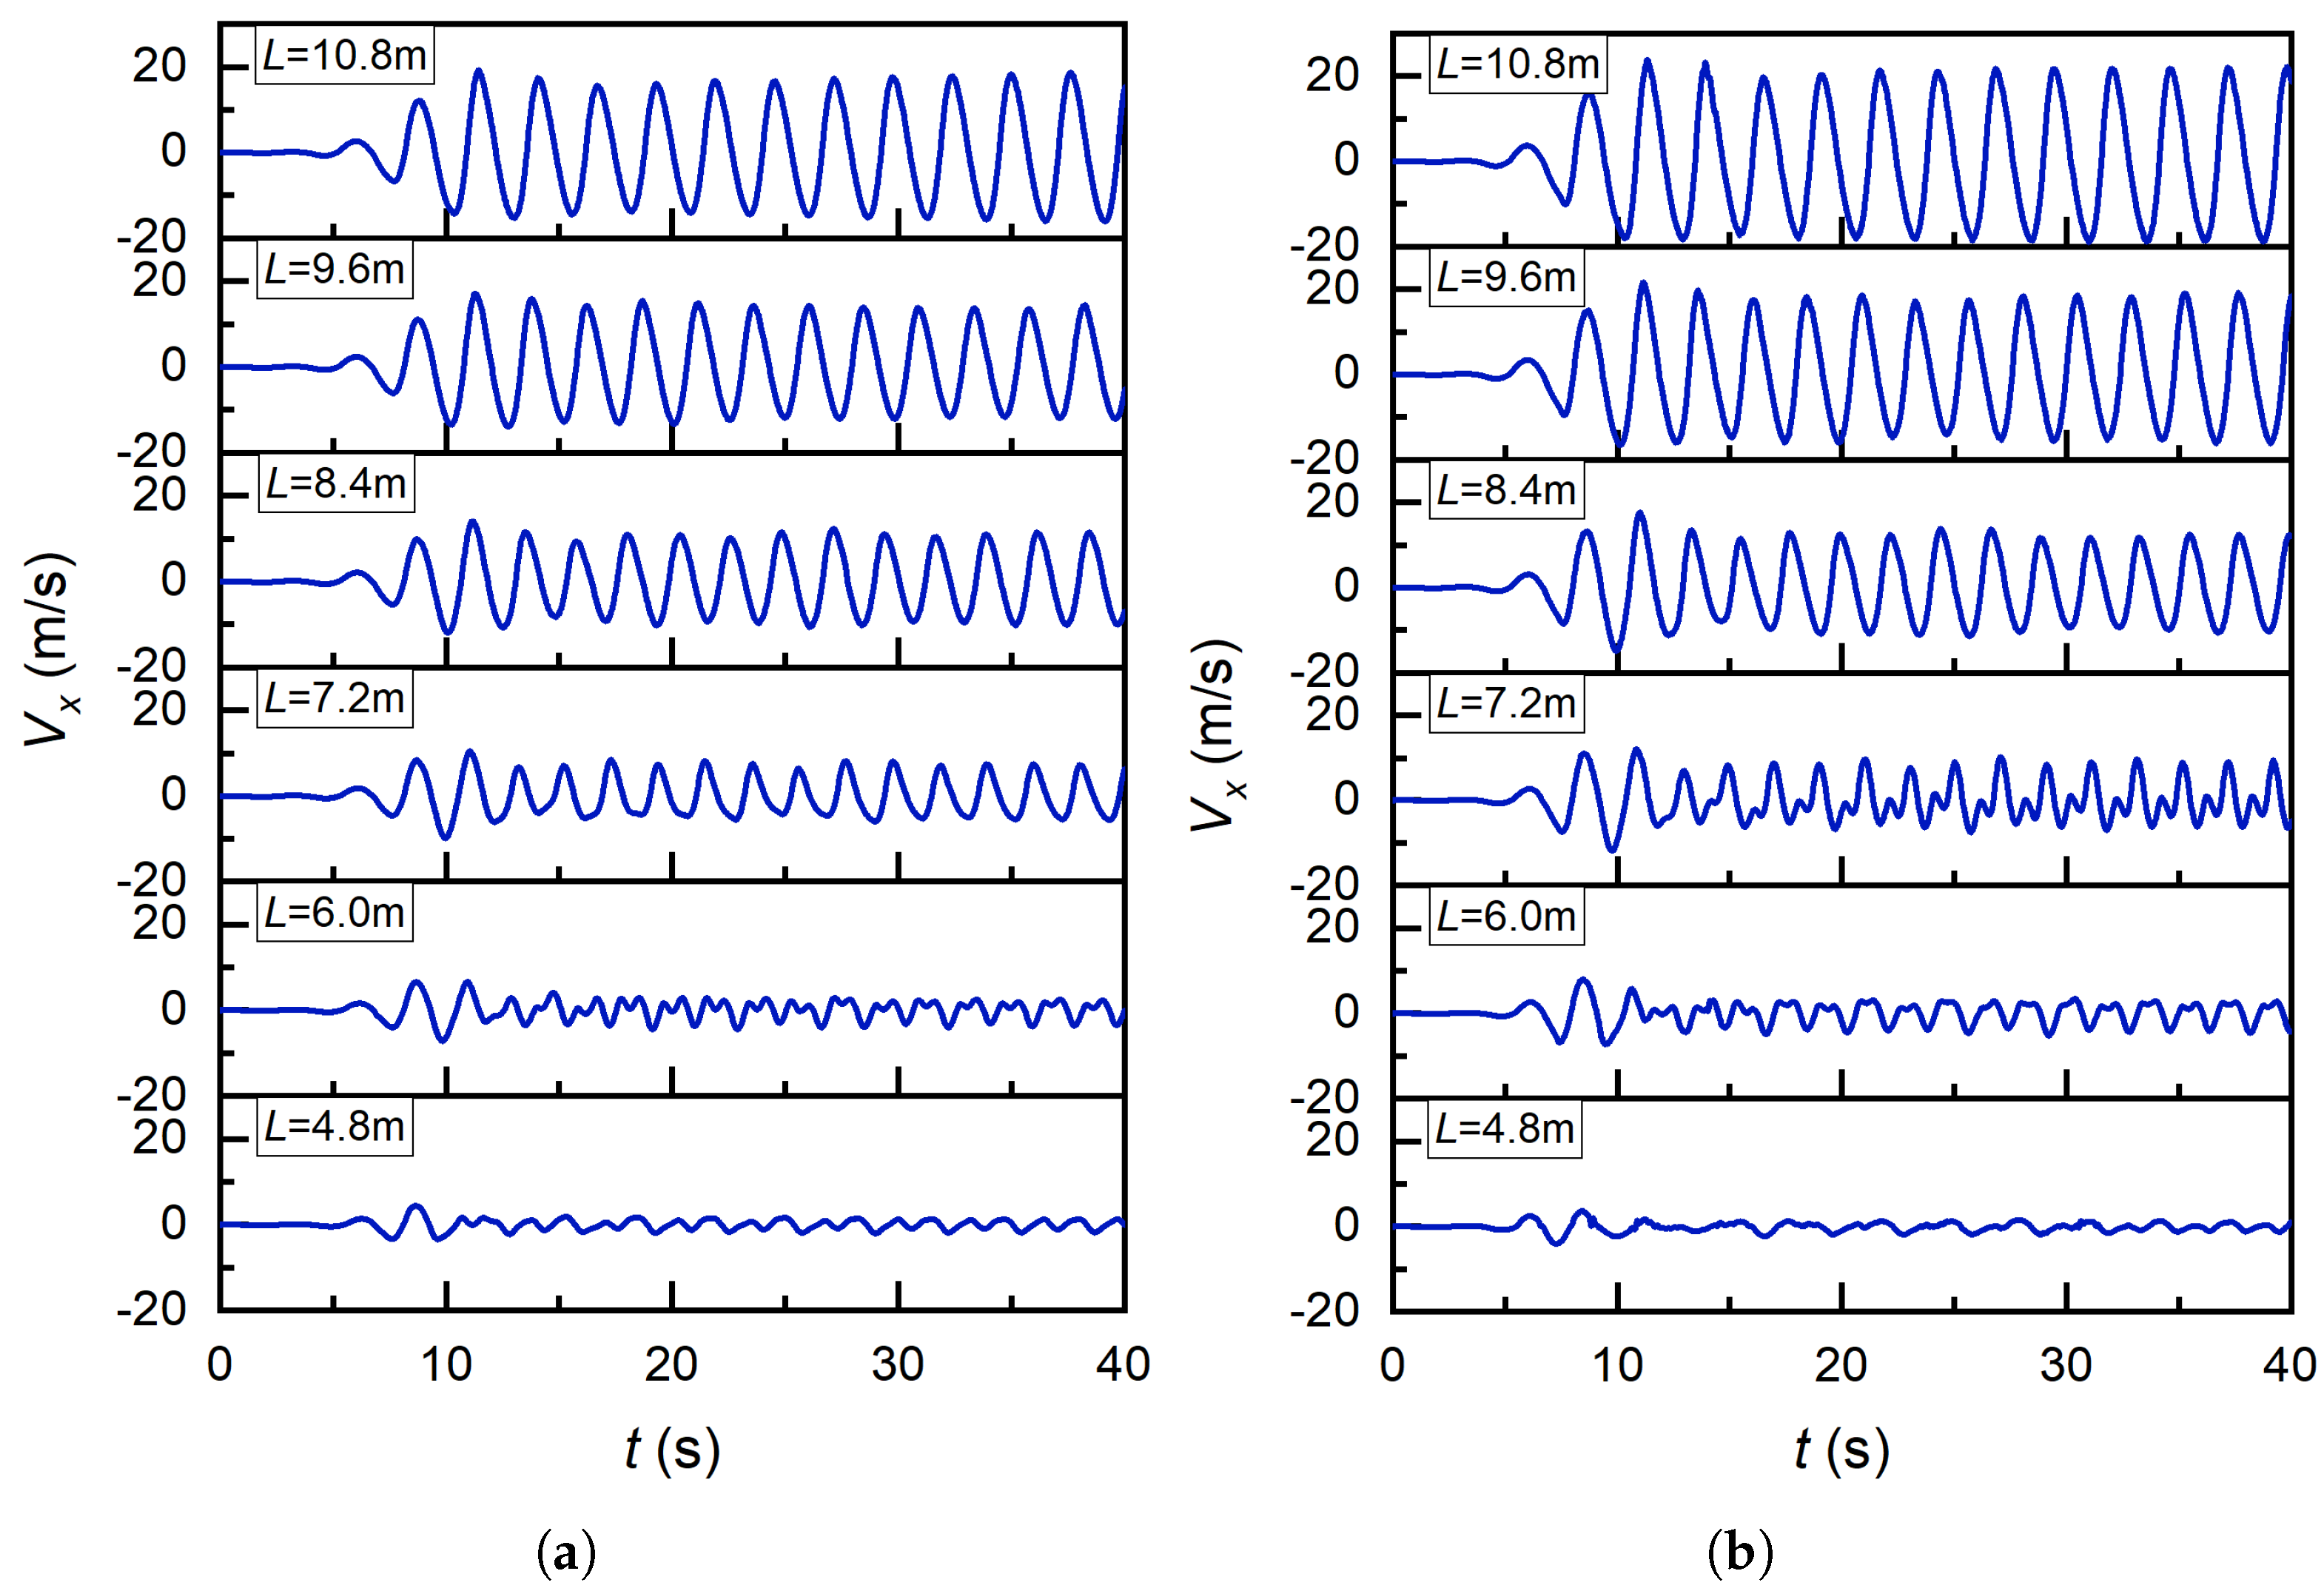
Figure 14,
Figure 15 and
Figure 16 show the vertical displacement of the floating OWC device, as well as the gas pressure and wind speed at the air chamber under the conditions of incident wave gauge
H = 0.6 m and
H = 0.8 m.
At a wavelength of L = 4.8 m with H = 0.6 m and H = 0.8 m, the gas pressure variation maintained steady-state equilibrium with no significant amplitude modulation. Vertical displacement and airflow velocity reached critical initial maxima during transient initiation, followed by damped oscillations stabilizing into low-amplitude regimes.
At L = 6.0 m with H = 0.6 m and H = 0.8 m, the gas pressure fluctuations exhibited subcritical behavior with minimal spectral energy. At H = 0.6 m, vertical displacement displayed non-periodic stochastic oscillations within bounded amplitudes, while airflow velocity showed localized velocity deficits near peak regions. At H = 0.8 m, vertical displacement transitioned to quasi-periodic motion, and airflow velocity demonstrated enhanced concave modulation with higher amplitude coherence.
At L = 7.2 m with H = 0.6 m and H = 0.8 m, pressure spectra revealed heterogeneous turbulence structures. For H = 0.6 m, vertical displacement maintained anisotropic fluctuations, and airflow velocity stabilized into coherent vortex shedding. At H = 0.8 m, vertical displacement evolved to limit-cycle oscillations, while airflow velocity exhibited dual-scale interactions with critical concave bifurcation.
At L = 8.4 m with H = 0.6 m and H = 0.8 m, pressure dynamics displayed resonant amplification with phase-locked periodicity. At H = 0.6 m, vertical displacement showed transient amplitude modulation converging to weakly chaotic attractors, and airflow velocity maintained Kelvin–Helmholtz stability. At H = 0.8 m, vertical displacement and airflow velocity synchronized into nonlinear coupled modes, confirming fluid-structure lock-in.
At L = 9.6 m and L = 10.8 m with H = 0.6 m and H = 0.8 m, pressure spectra exhibited dominant eigenmodes with parametric resonance. Both vertical displacement and airflow velocity achieved asymptotic synchronization in high-Reynolds regimes, demonstrating energy cascade equilibrium.
It can be observed that in the case of wavelengths L = 8.4 m, 9.6 m, and 10.8 m, the vertical displacement of the floating OWC device, the pressure and wind speed at the air chamber pores are large. In the case of wavelengths L = 4.8 m, 6.0 m, and 7.2 m, the vertical displacement of the floating OWC device, the pressure, and wind speed at the air chamber pores are small. It can be seen from the front that when the wavelengths are 8.4 m, 9.6 m, and 10.8 m, the internal wave surface motion is mainly in the piston state, which indicates that this state is beneficial to the floating OWC system.
When the incident wavelength is 4.8 m, 6.0 m, or 7.2 m, the wave surface inside the floating oscillating water column (OWC) device primarily exhibits a rocking motion. In this case, the free surface wavefront oscillates distinctly around the oscillation central axis, with smaller wave amplitudes observed near the axis; the oscillation amplitude, however, deviates significantly from this central axis, which shifts alongside the incident wavelength. This configuration in turn results in relatively low vertical displacement of the floating OWC device and relatively low gas pressure at the orifice of the air chamber. For incident wavelengths of 8.4 m or 9.6 m, the water surface inside the floating OWC chamber exhibits both oscillatory motion and piston-like motion-with the latter defined by vertical movement—and minimal variation in amplitude is detected between adjacent wave height measurement points. By contrast, when the incident wavelength is 10.8 m, the wavefront inside the floating OWC device predominantly adopts a piston configuration, in which the free surface displays prominent vertical motion. Additionally, the amplitude variations of the trajectory curves at each measurement point within the device’s air chambers are relatively consistent; accordingly, both the vertical displacement of the floating OWC device and the gas pressure at the air chamber vent are relatively high.
The discussion around
Figure 14,
Figure 15 and
Figure 16 focuses on analyzing the dynamic changes of three key parameters (air chamber pressure, floating OWC device’s vertical displacement, and turbine duct wind speed) under different wavelengths and wave heights. It aims to link these parameter variations to the free-surface motion state inside the OWC air chamber (sloshing or piston motion) and thereby explore how wavelength affects the energy transfer-related performance of the floating OWC device, laying a foundation for understanding the device’s energy conversion efficiency.
5. Results and Discussion
The inherent property of the Wells turbine is reflected by the variation of the coefficients of power and torque against the
. In this study, the relationship of
and
versus
introduced by Falcao et al. [
28] are adopted, as depicted in
Figure 8. The power coefficient
increases with
, but the torque coefficient
varies with
. The motivation of the airflow control can be understood from
Figure 8 (left). As
increases from zero to 0.3,
increases almost linearly. It should be reminded that
is proportional to the velocity of the airflow, and
is proportional to the torque of the rotor. As the airflow velocity exceeds the condition of
, the
drops sharply, leading to the stalling phenomenon of the turbine. Therefore, the PI controller is used to guarantee the operating conditions of
and below.
In this study, parameters are given in
Table 1 and
Table 2. The table includes parameters related to wave gauge, period, and wavelength, as well as various parameters of the liquid tank, the cross-sectional area of the turbine, air density, parameters related to the turbine blades, and relevant electromagnetic parameters of the backend generator device.
5.1. Wells Turbine Stall Impact
In the control simulation, the fifth-order Stokes wave with
H = 0.6 m and wavelength
L = 8.4 m is selected. The size of the airflow generated by the wave is shown in
Figure 22. When the control system is running, the airflow will cause stall behavior. The PI controller can adjust the generator speed according to the airflow velocity of the air chamber, and control the
at 0.3 to avoid the stall behavior of the Wells turbine.
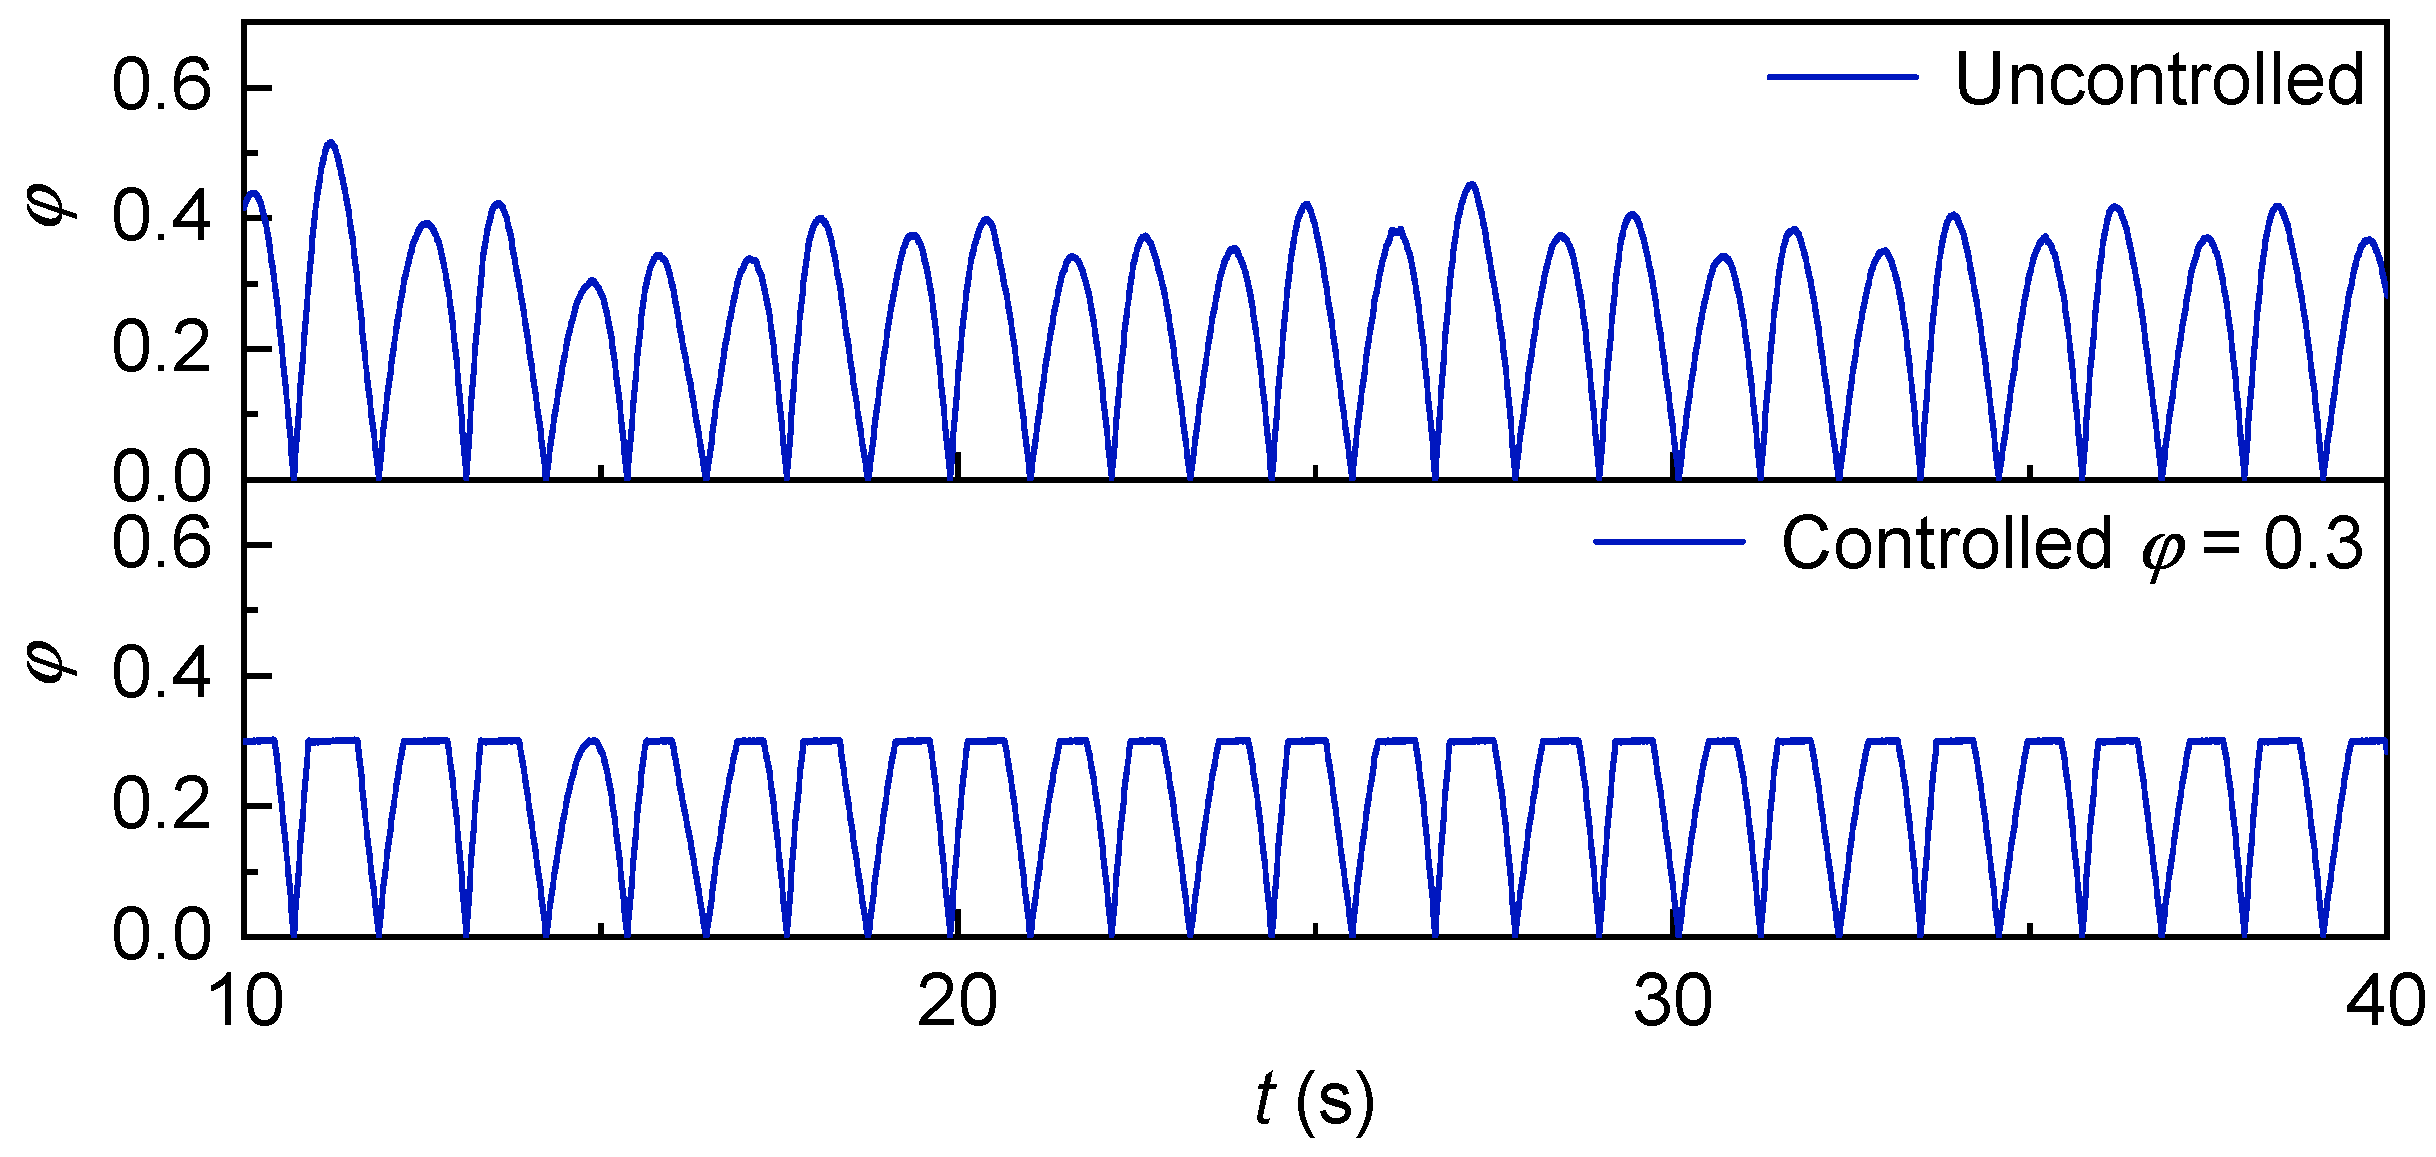
Figure 23 shows the change of
with time under uncontrolled and controlled conditions. It can be observed that under uncontrolled conditions, the
exceeds the critical stall condition 0.3 after the smooth operation of the floating OWC device, and the excess part corresponds to the Wells air turbine stall time. In the case of speed control, the part of the
which is more than 0.3 is adjusted to 0.3, and the system will not be affected by the stall effect.
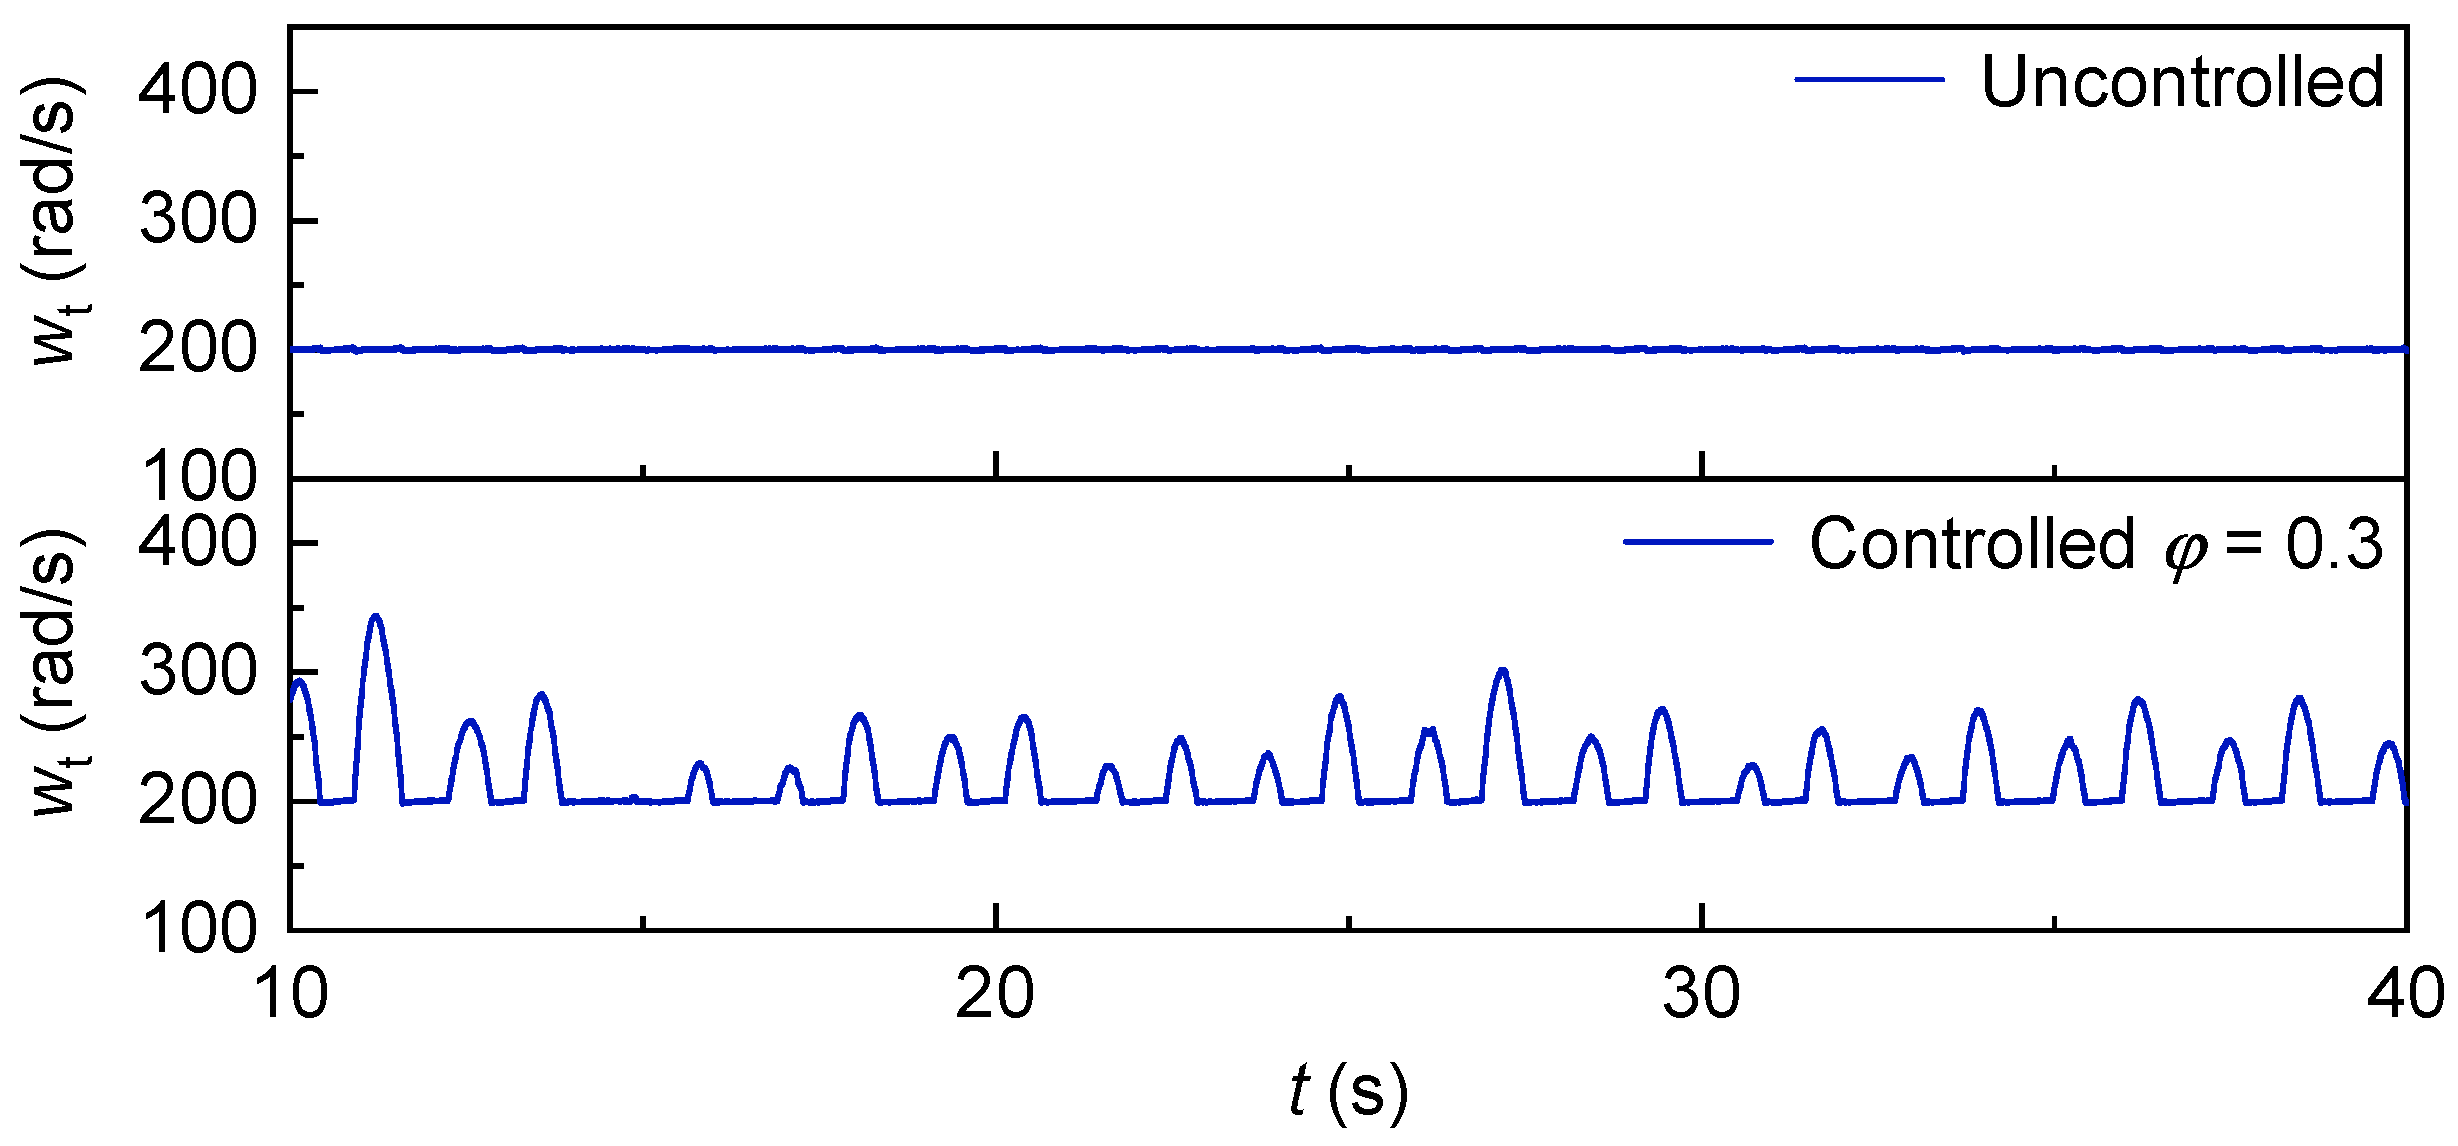
Figure 24 shows the change of generator speed with time under uncontrolled and controlled conditions. Under uncontrolled conditions, the generator speed exhibits stochastic oscillations centered approximately at 200 rpm, asymptotically converging to a stationary equilibrium state. In the case of speed control, the time of the generator speed in the original stall of the Wells air turbine increases, which is the reason why the
does not exceed 0.3 under the speed control of
Figure 23.
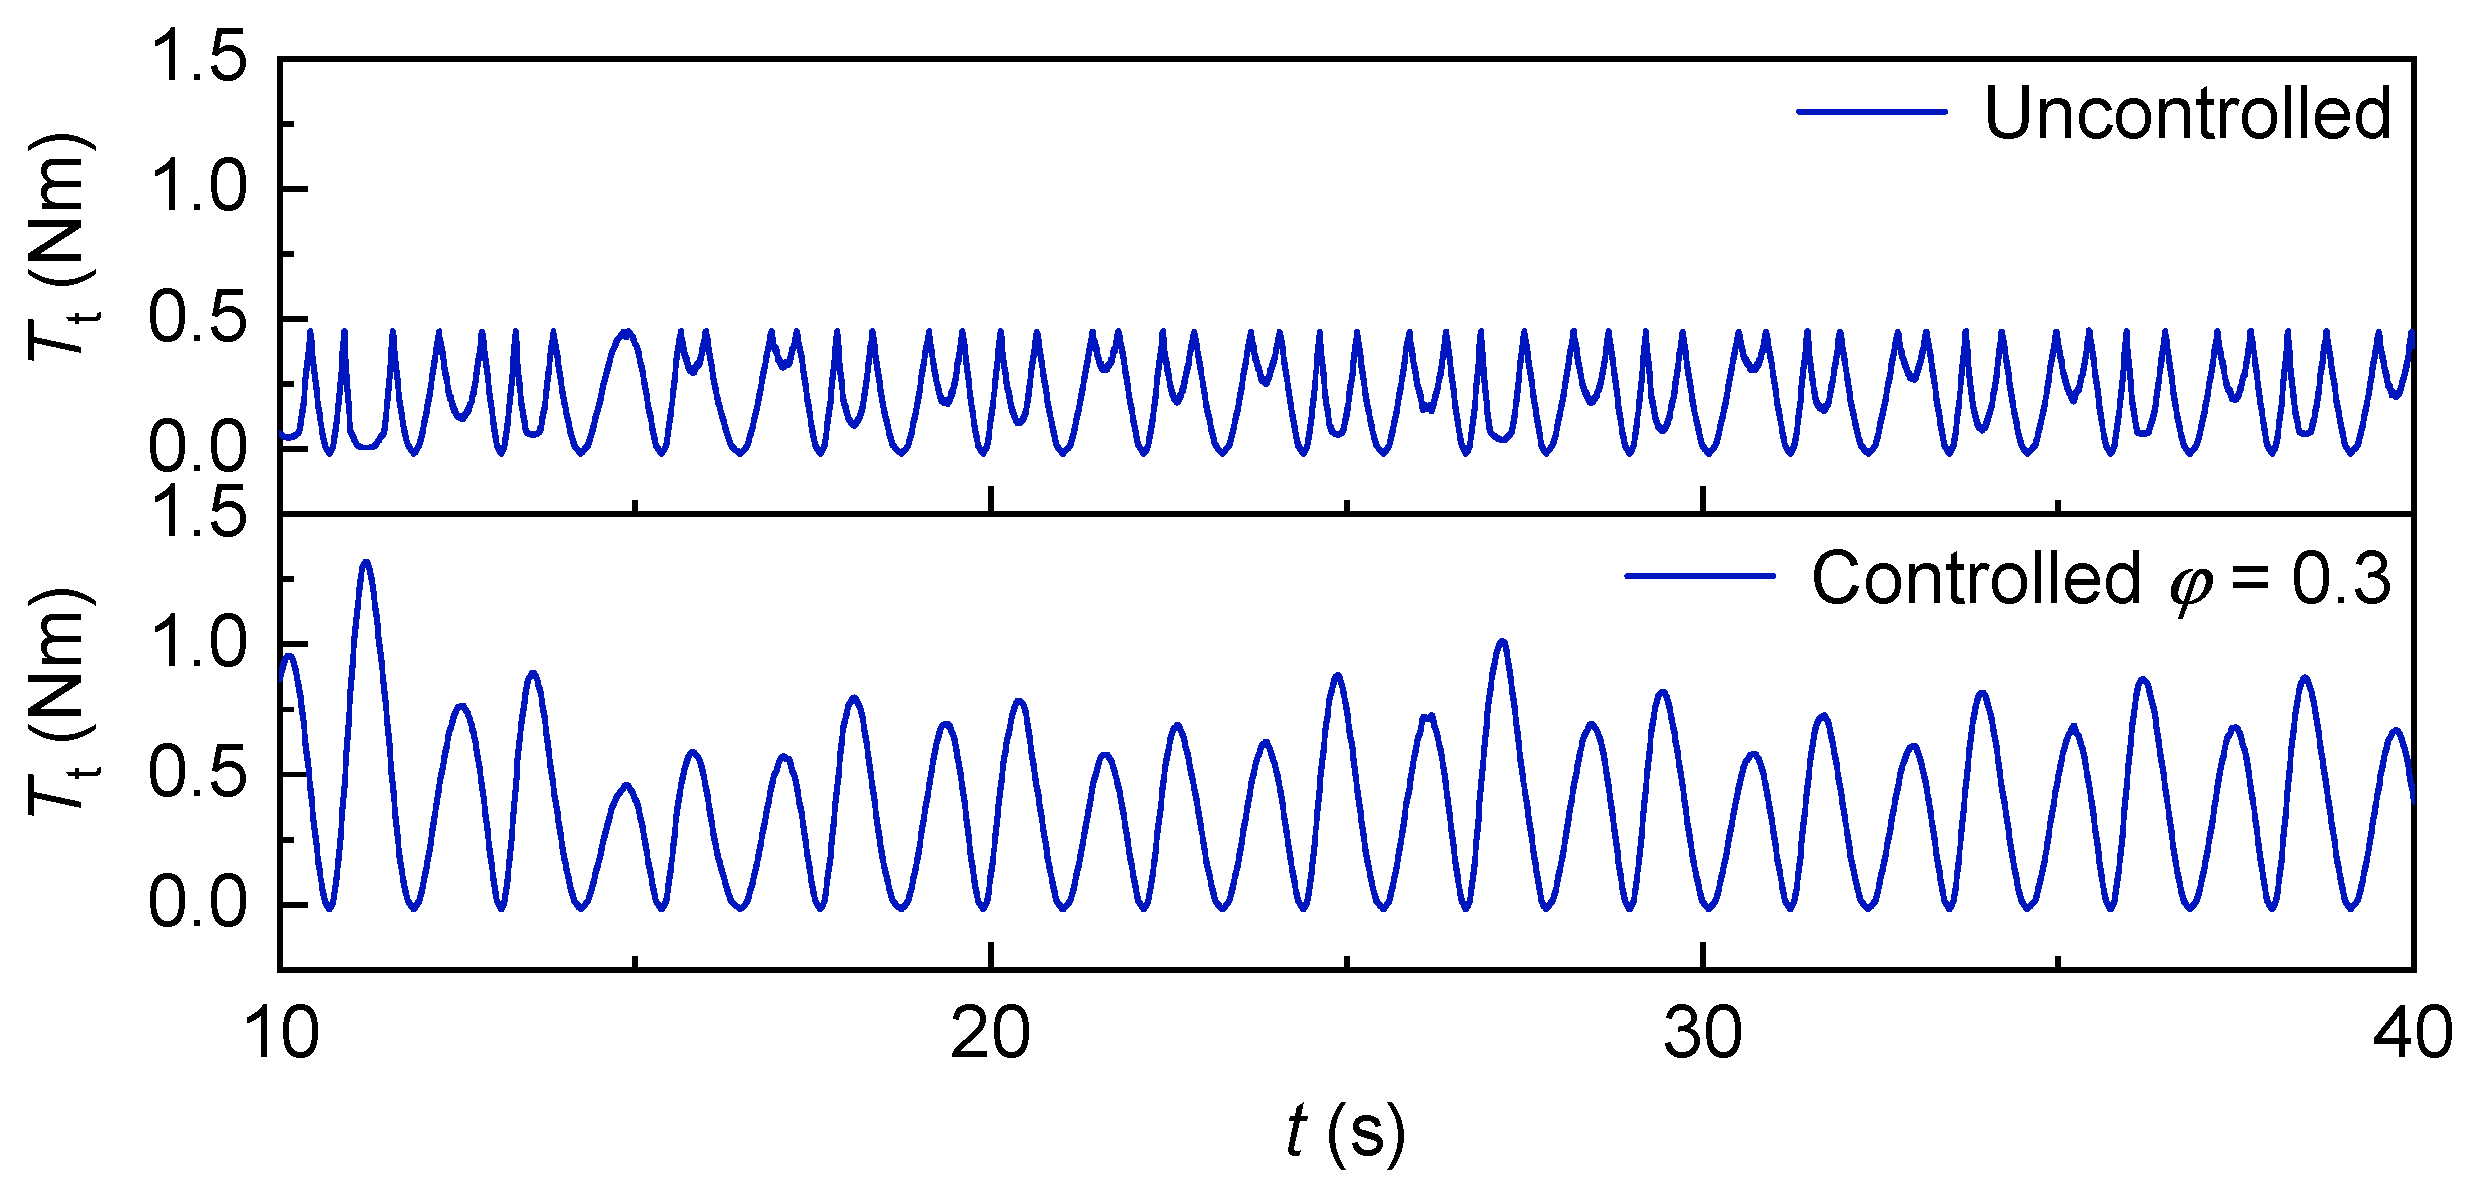
Figure 25 shows the torque of the Wells turbine changes with time under uncontrolled and controlled conditions. The transient torque characteristics of the Wells turbine under uncontrolled and controlled operational conditions are revealed. Observations demonstrate that in uncontrolled scenarios, the turbine torque is dominated by stall hysteresis effects, exhibiting a pronounced concave profile within the stall regime The average torque is 0.157 N·m. In the case of speed control, due to the avoidance of the stall effect of Wells turbine, the torque of Wells turbine is convex in the original stall range, resulting in a higher average torque, and the average torque is 0.298 N·m.
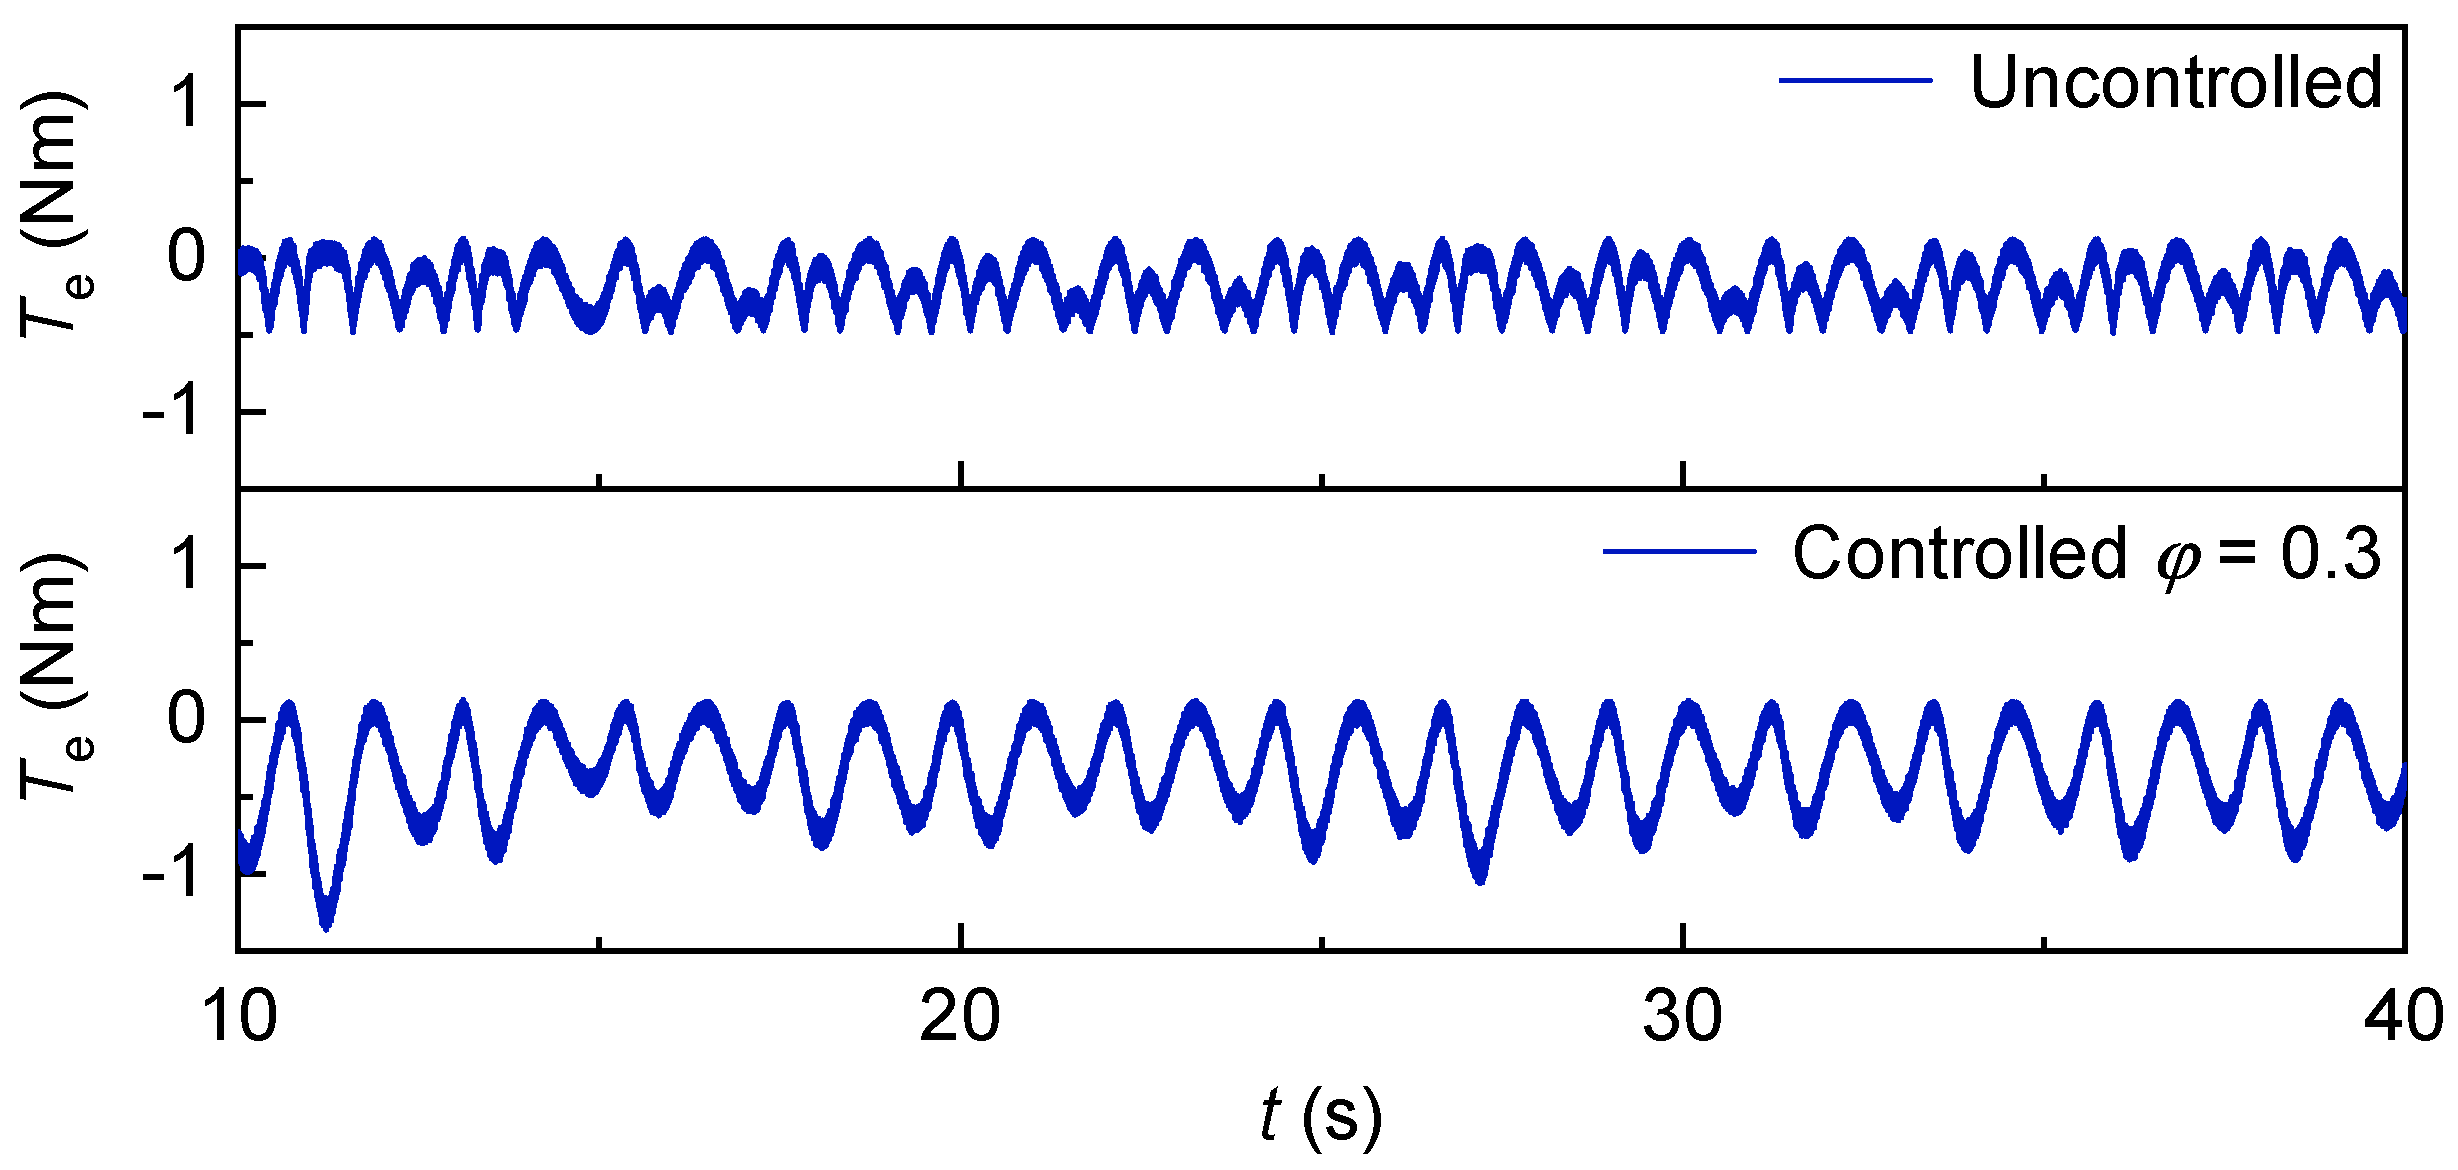
Figure 26 shows that the electromagnetic torque changes with time in the case of no control and control. Observations reveal that the electromagnetic torque predominantly exhibits negative polarity, analogous to the coordinate-inverted Wells turbine torque profile shown in
Figure 25. Under uncontrolled conditions, the electromagnetic torque oscillates with a time-averaged value of
N·m, reflecting inherent generator-load mismatch dynamics. With the implementation of closed-loop speed regulation, the torque profile achieves enhanced negative bias stabilization, yielding a time-averaged electromagnetic torque of
N·m.
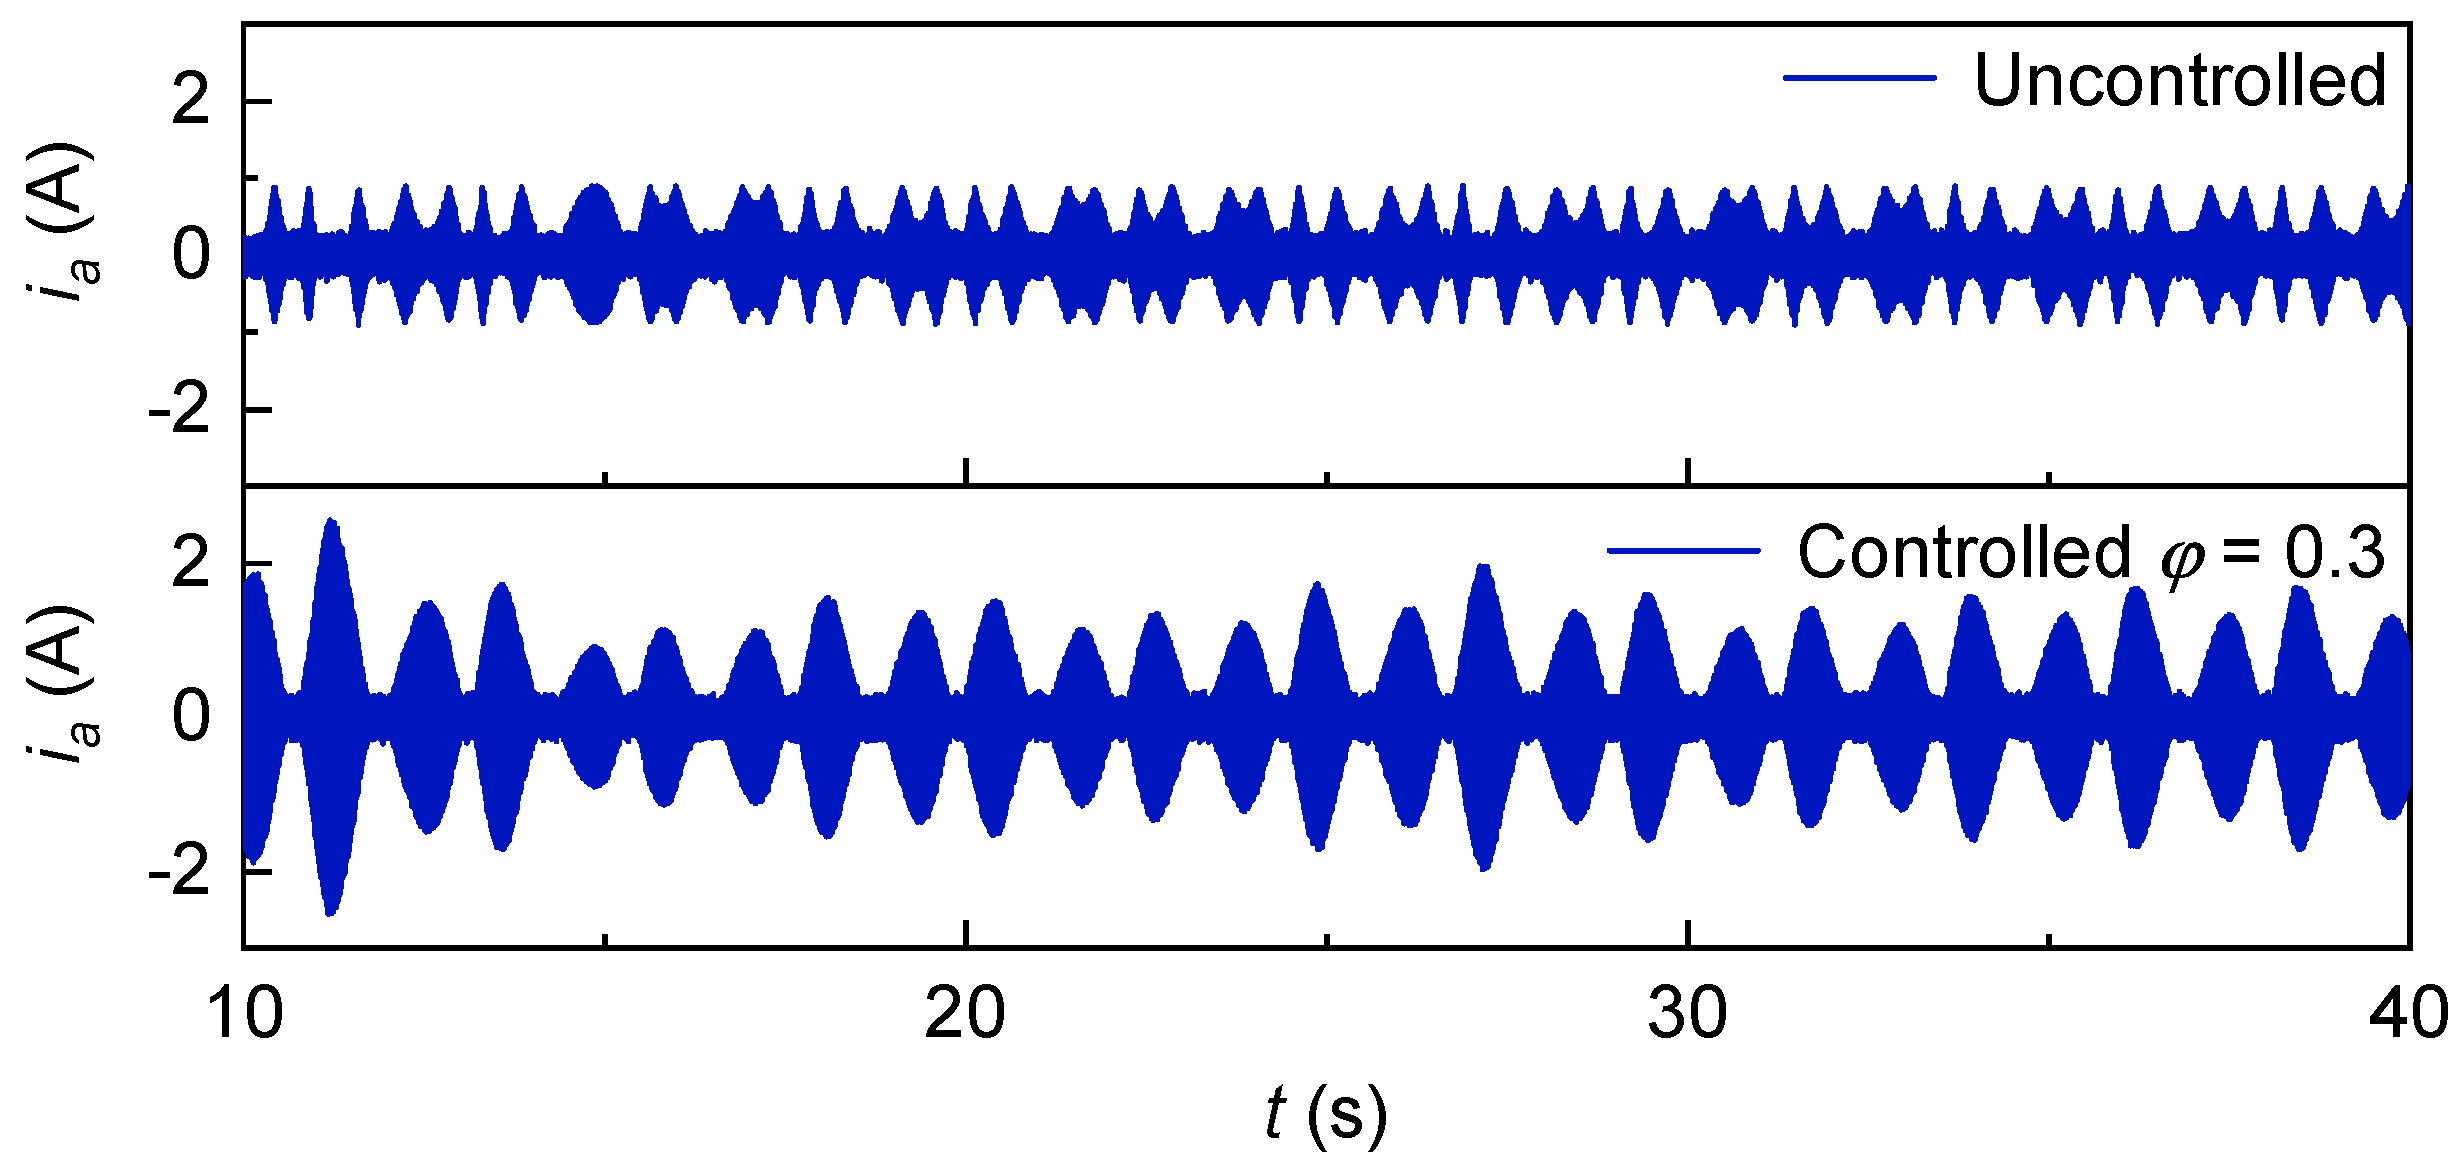
Figure 27 shows the three-phase current of the generator varies with time under both uncontrolled and controlled operating conditions. Specifically, under the uncontrolled condition, the three-phase current of the generator is affected by the stall behavior of the Wells turbine, exhibiting a concave characteristic within the stall range, with a corresponding peak current of 0.88 A. In contrast, under the dynamic speed control condition, the stall effect of the Wells turbine is effectively mitigated; as a result, the three-phase current of the generator demonstrates a convex characteristic within the original stall range, and the peak current in this scenario reaches 1.36 A.
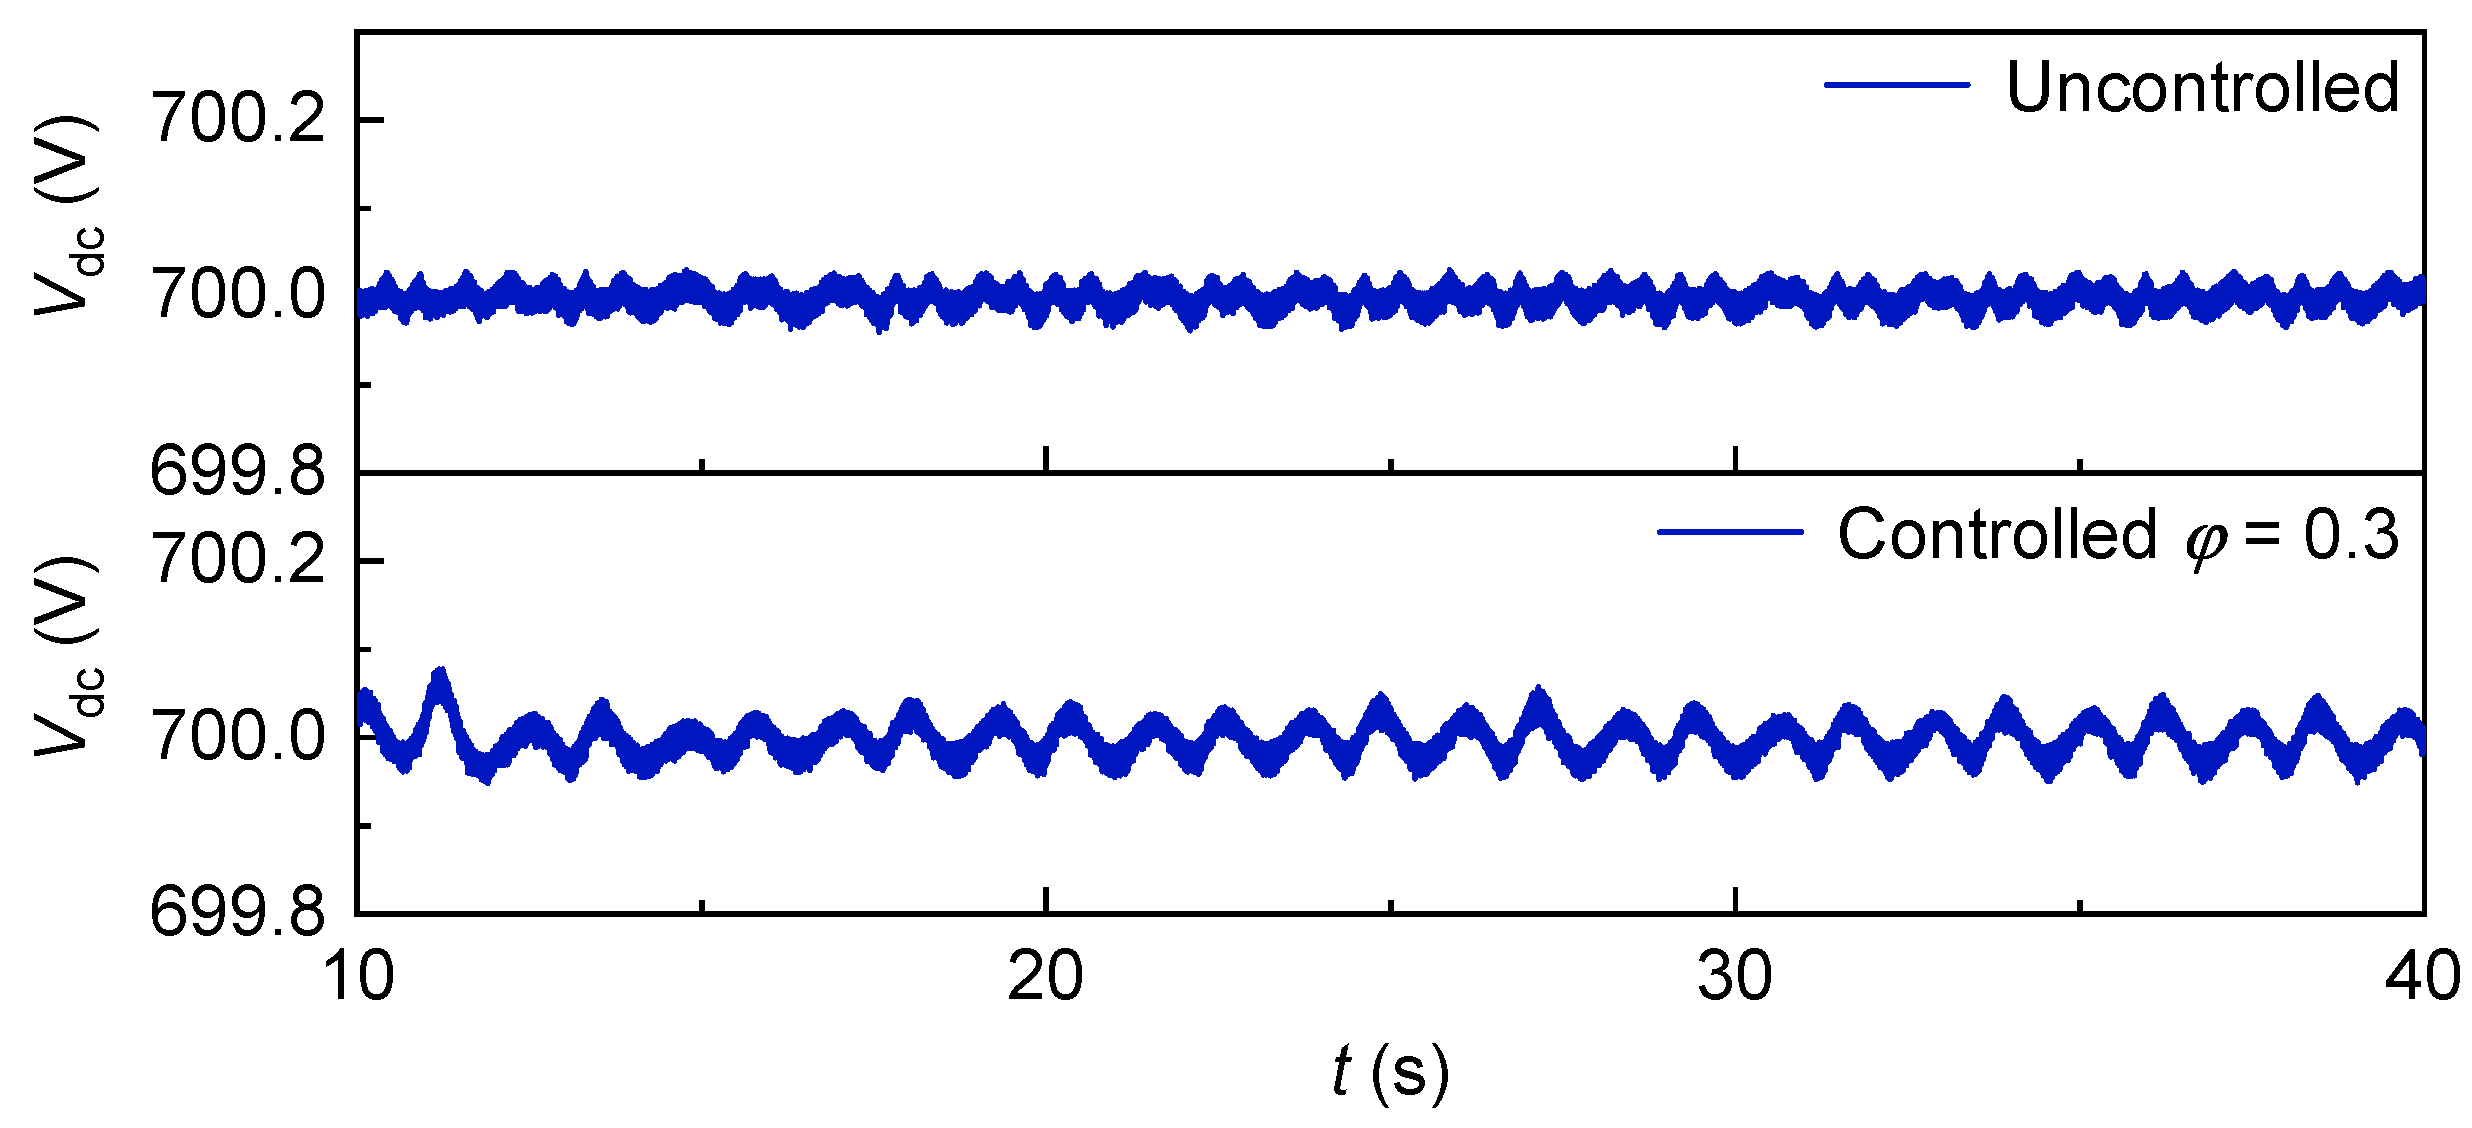
Figure 28 shows the change of DC bus voltage with time under uncontrolled and controlled conditions. It can be observed that, in both cases, the DC bus voltage is stably controlled at around 700 volts. Under uncontrolled conditions, the fluctuation range of the DC bus voltage is significantly smaller and remains largely stable. Speed control increases the fluctuation range of the DC bus voltage, which exhibits more regular fluctuations.
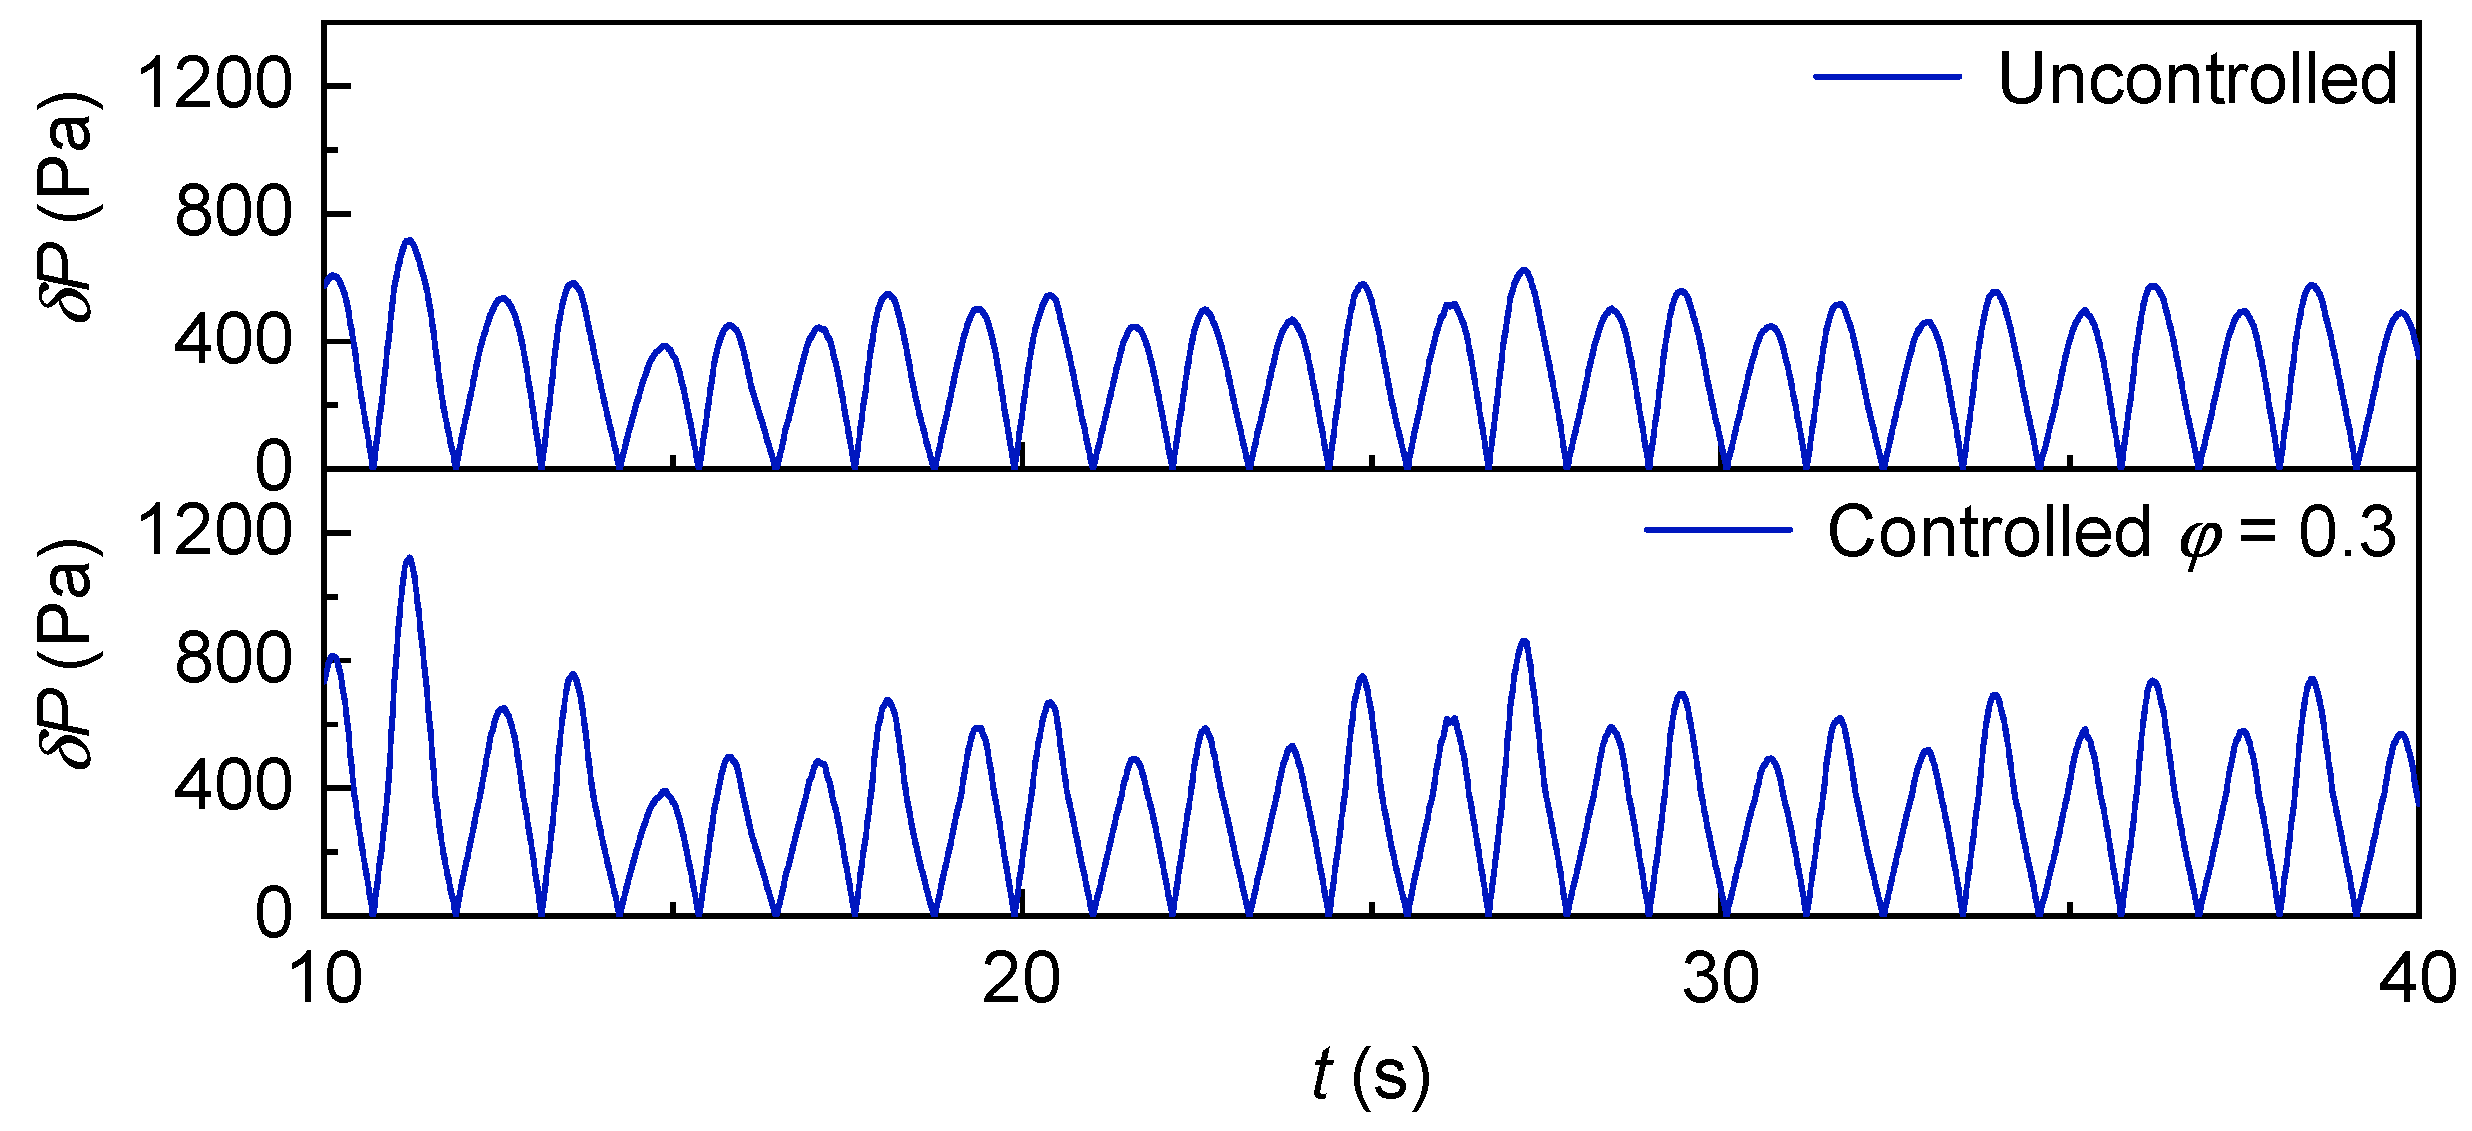
Figure 29 shows the change of pressure drop with time under uncontrolled and controlled conditions. It can be observed that the waveforms of pressure drop in the two cases are compared, but the two are different in size. In the case of no control, the average pressure drop is 284.5 Pa. In the case of speed control, the average pressure drop is 323 Pa. This shows that the stall effect of Wells turbine will reduce the pressure drop.
Figure 30 shows the change of mechanical power of Wells turbine with time under uncontrolled and controlled conditions. Under uncontrolled operational conditions, the Wells turbine exhibits a characteristic stall effect, resulting in a concave peak morphology within the mechanical power waveform during stall regions accompanied by substantial power attenuation, yielding an average mechanical power output of 31.4 W. Conversely, implementation of speed control strategies fundamentally alters the waveform characteristics in formerly stalled regimes, transforming peak concavity to convexity while achieving significant aerodynamic performance enhancement. This active control methodology demonstrates a 124% improvement in energy extraction efficiency, elevating the average mechanical power to 70.3 W through effective mitigation of flow separation and stabilization of turbine operation across the stall boundary.
Table 3 presents the average power values of an oscillating water column (OWC) power generation system under two control conditions—uncontrolled and speed-controlled—subjected to regular waves. Here, Pt denotes the average mechanical power of the Wells turbine (abbreviated as mechanical power), Pc represents the three-phase power output by the generator post-rectification (abbreviated as rectified power), and Pg indicates the power transmitted to the grid post-rectification (abbreviated as grid-connected power). As shown in
Table 3, the average power of these three types in the OWC system exhibits a progressive decrease across all power stages. Notably, under uncontrolled conditions, the average power at each stage is significantly lower than that under speed-controlled conditions; this discrepancy is attributed to the stall effect of the Wells turbine.
5.2. Effect of Flow Coefficient
The serves as a critical dimensionless parameter for evaluating stall susceptibility in Wells turbines and holds substantial relevance for optimizing oscillating water column wave energy conversion systems. Contemporary speed control studies predominantly focus on the critical non-stall condition corresponding to a maximum = 0.3, neglecting operational scenarios where peak fall below this threshold. This oversight introduces a notable limitation in existing methodologies, necessitating systematic investigation of sub-0.3 regimes to ensure comprehensive characterization of turbine dynamics across the full operational envelope.
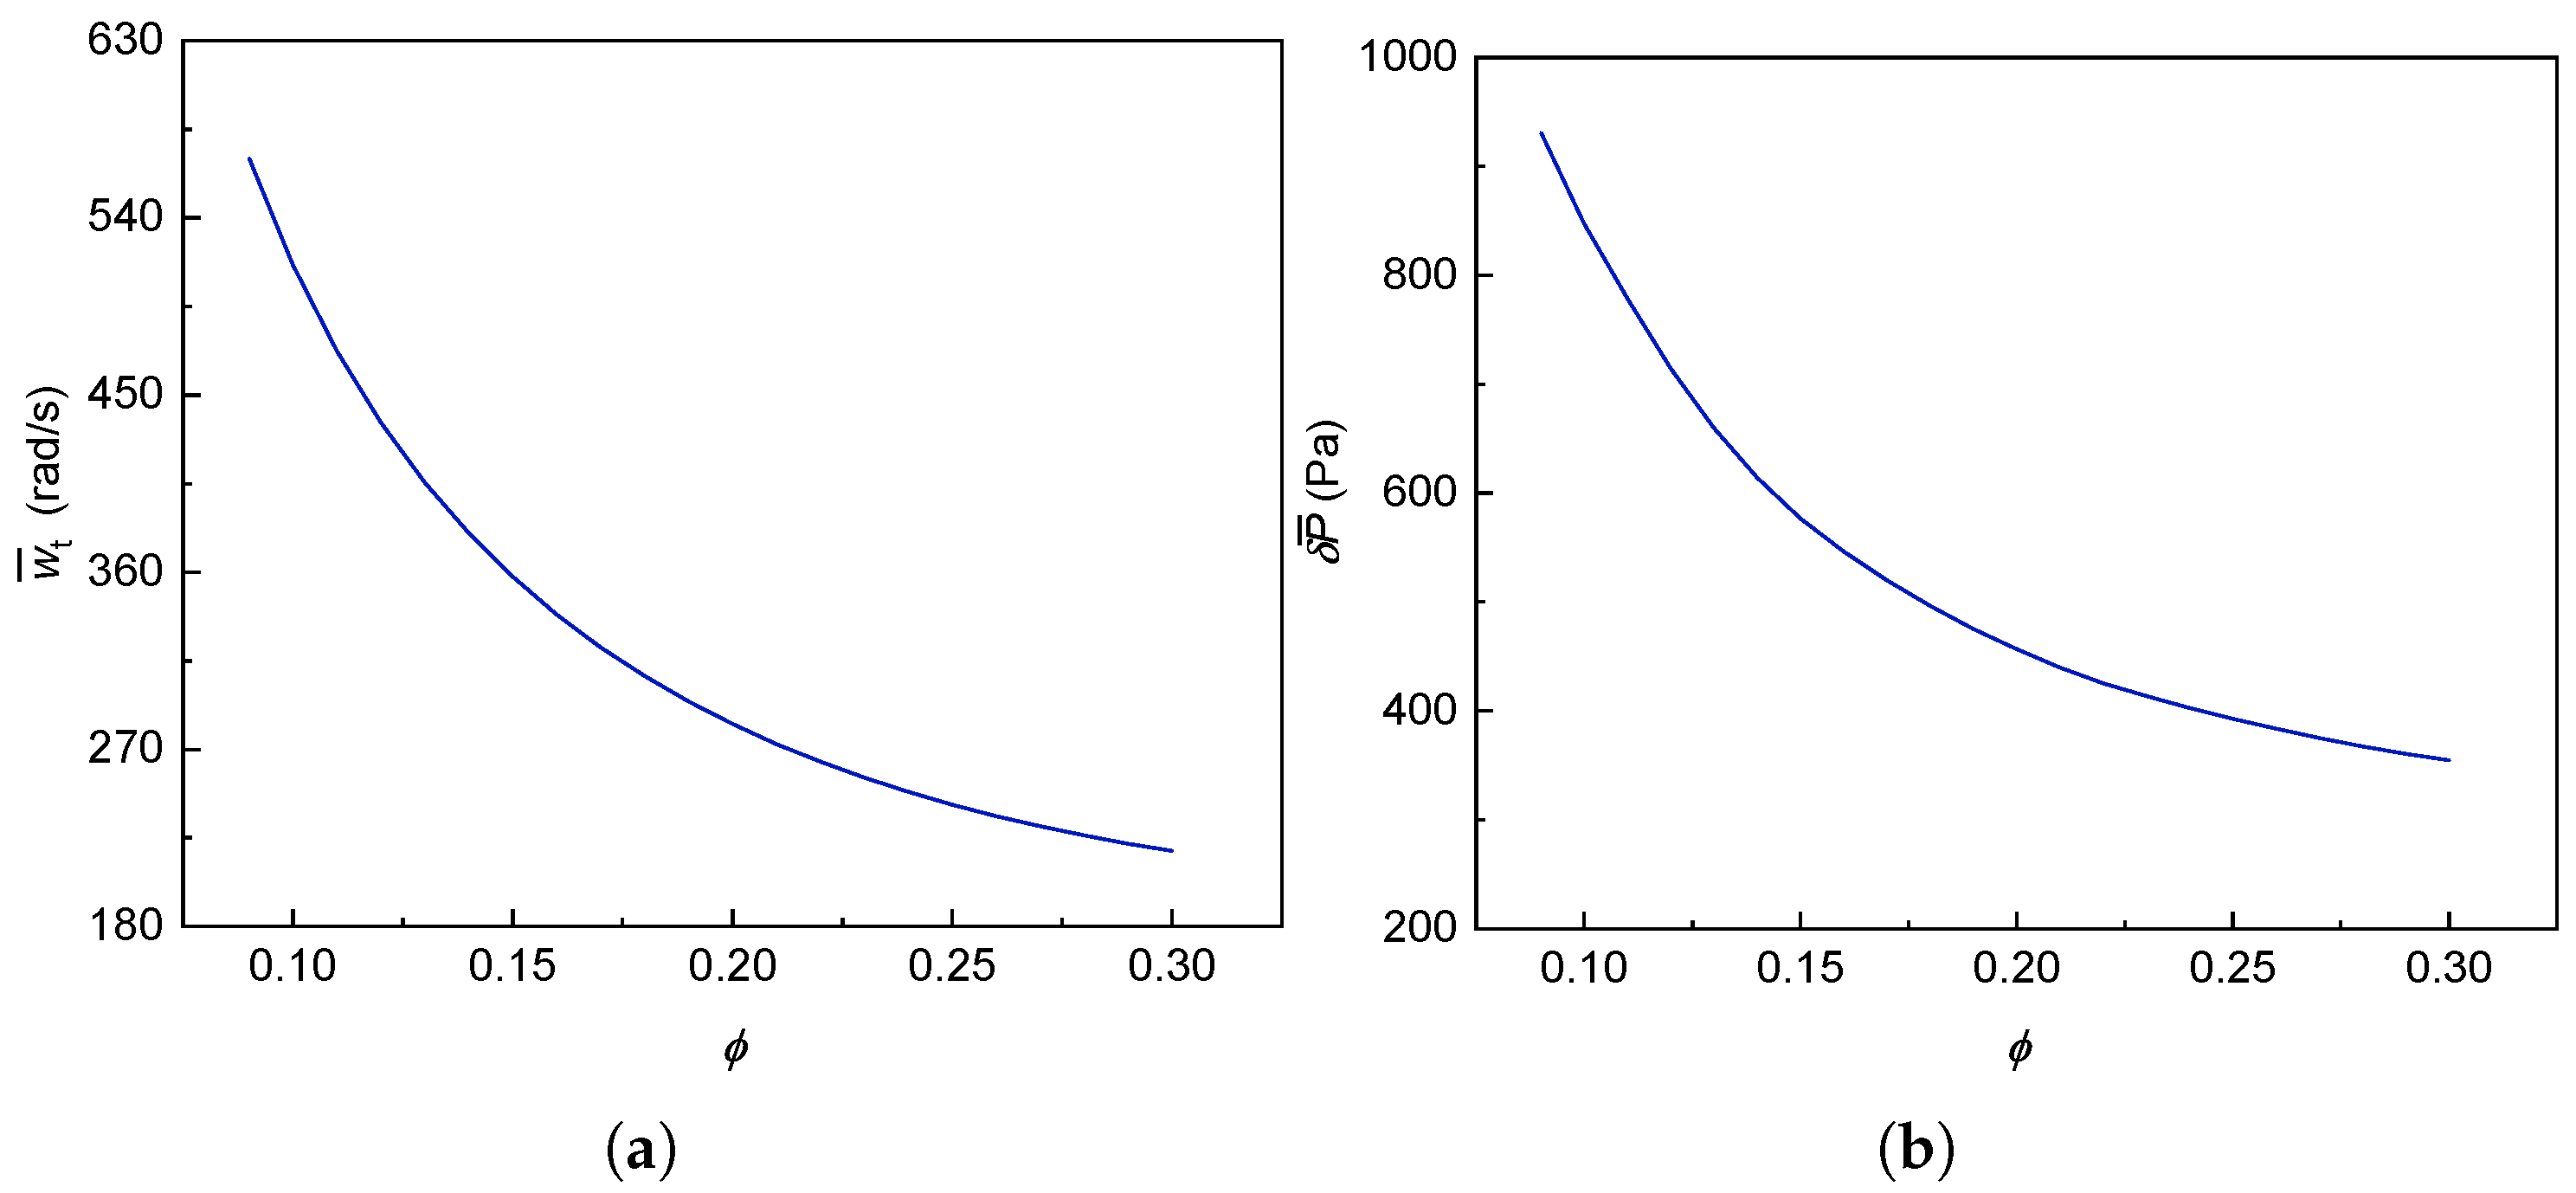
The decrease of the flow coefficient requires the generator speed to gradually increase, as shown in
Figure 31. The average value of the pressure drop gradually increases with the decrease of
, and the essence is to increase with the increase of the rotational speed.
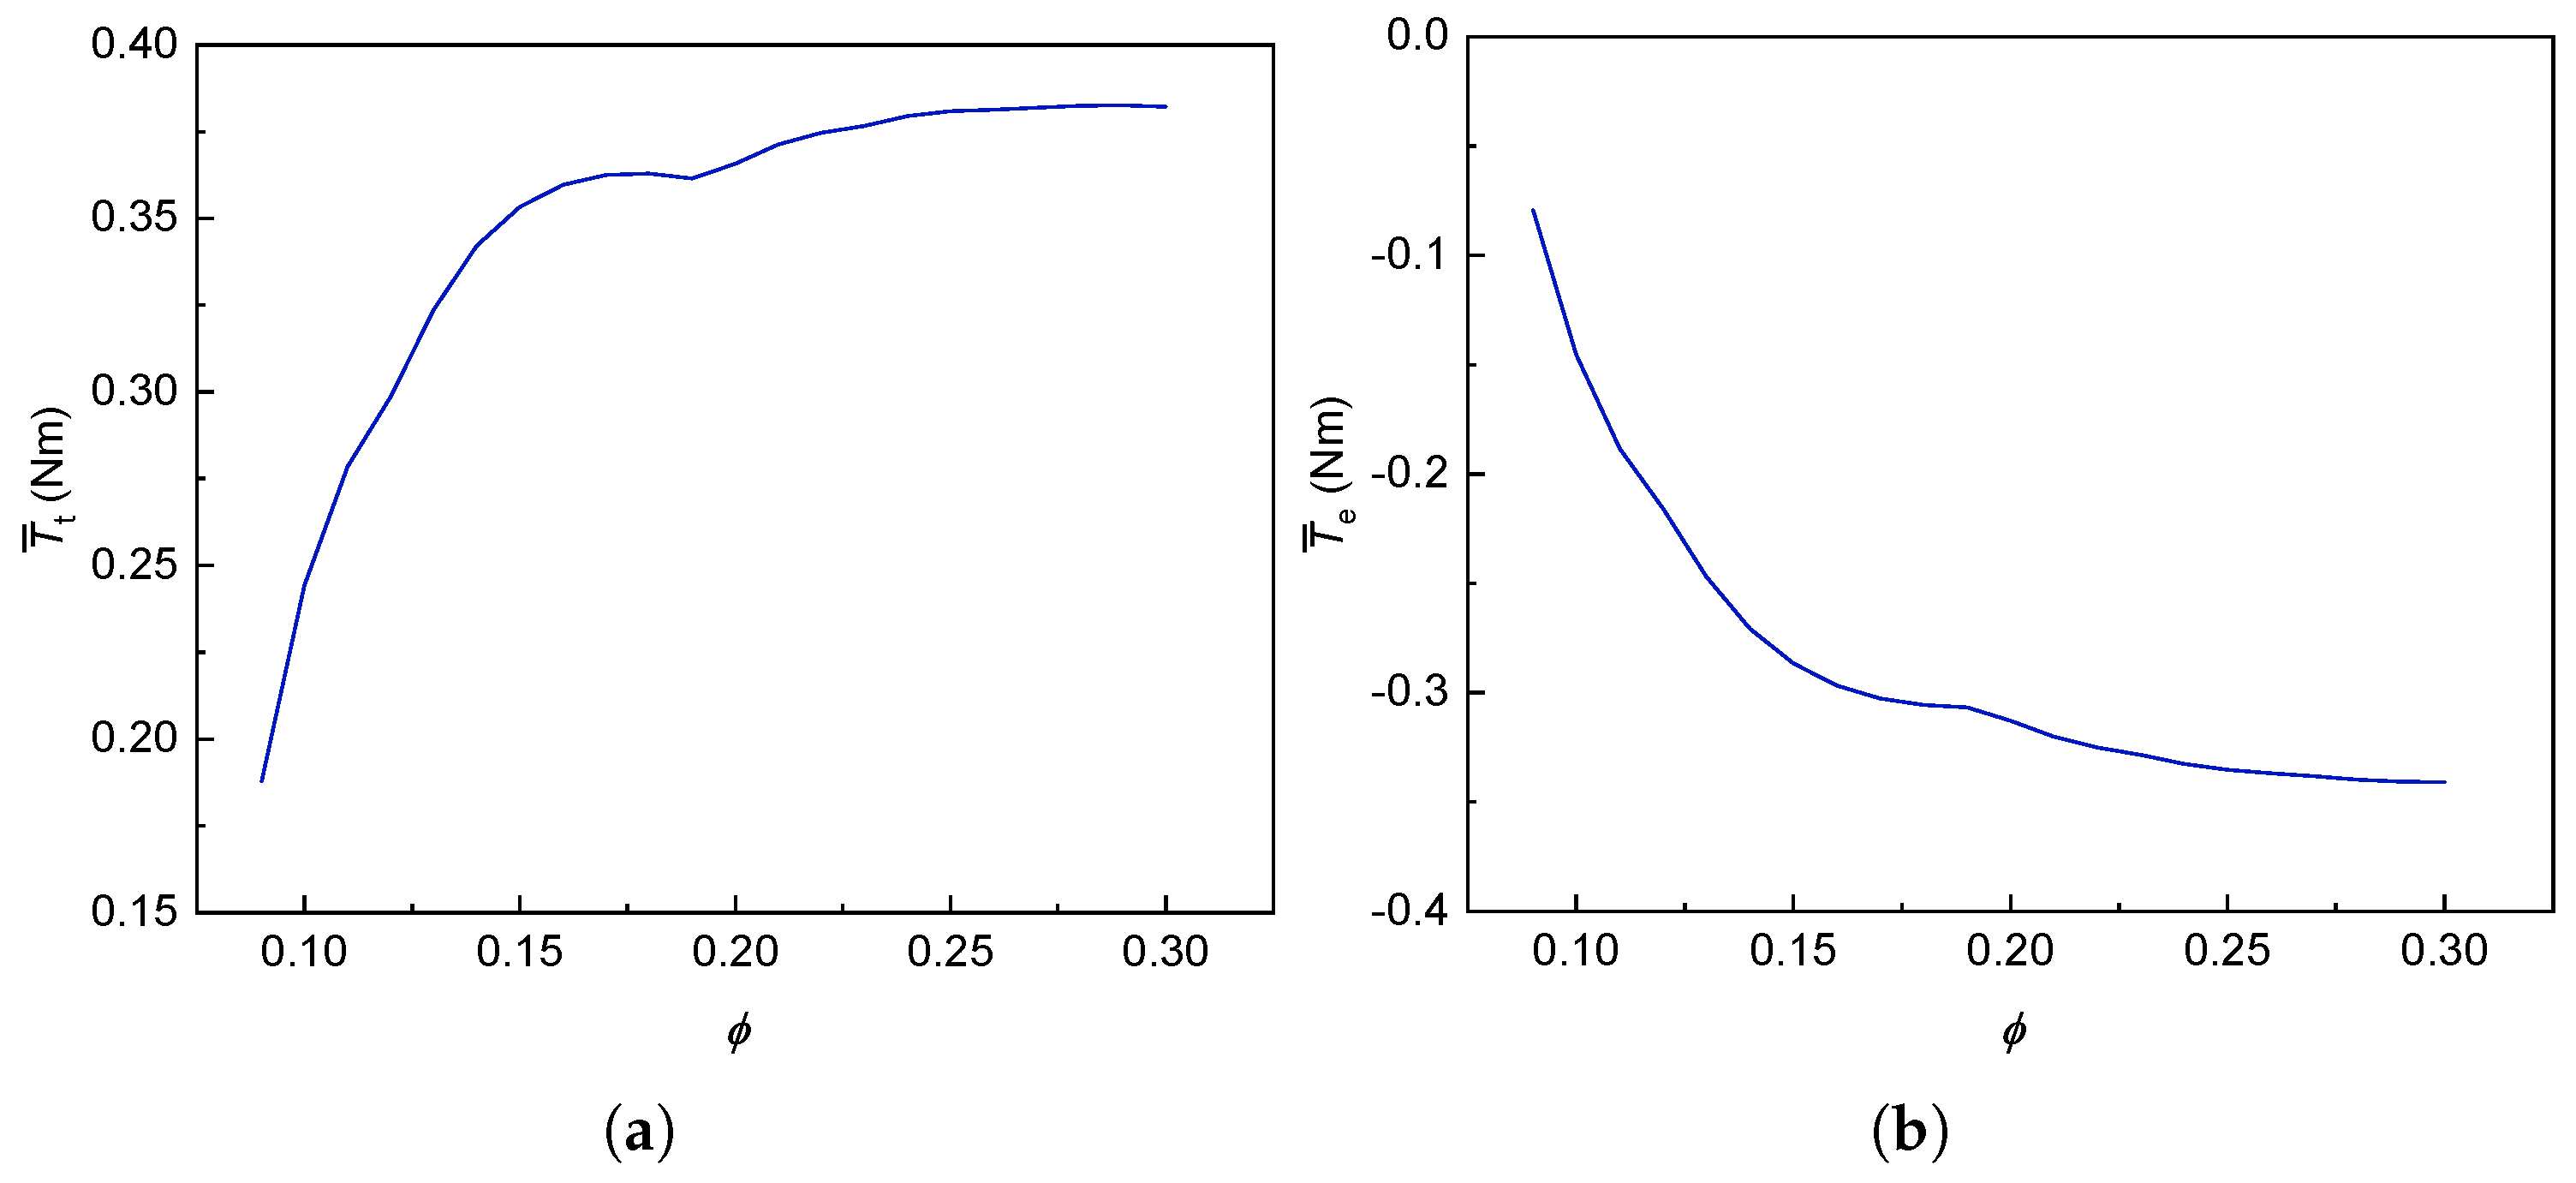
Figure 32 shows the variation in the average torque of Wells turbine and the average electromagnetic torque with
. It can be observed that in the part where
is less than 0.24, the average value of the Wells turbine torque and the average value of the electromagnetic torque change are relatively large between 0.09 and 0.15, and the change is relatively small between 0.15 and 0.24. When
is greater than 0.24, the average value of the Wells turbine torque and the average value of the electromagnetic torque are not sensitive to the change of the
, and changes slowly.
Figure 33 shows the average power at all levels with
.
is the average turbine power,
is the average rectifier power, and
is the average grid-connected power. The analysis demonstrates that stage-specific power output follows a characteristic rise-and-fall pattern with increasing
, peaking at
= 0.11 where maximum mean power generation is achieved across all stages.
Observations show that as the maximum flow coefficient increases, the power output at each stage first increases and then decreases; when the maximum reaches 0.11, the average power output across all stages reaches its peak, and at this point, the average mechanical power is 146.21 W, the average rectified power is 113.63 W, and the average grid-connected power is 98.93 W. This finding indicates that maintaining the maximum at 0.3 does not represent the optimal operating condition, and instead, the optimal maximum depends on actual operating conditions and system parameters.
5.3. Unconditional and Conditional Speed Control
To some extent, higher generator rotational speeds correlate with greater power output at each stage. However, the generator cannot undergo extended continuous operation beyond its maximum rotational speed threshold. Such operation will lead to a rapid degradation in the generator’s reliability and durability, and may even result in severe disruptions to the operation of the entire OWC wave energy generation system. In practical OWC wave energy systems, instances of generator rotational speed exceeding the maximum threshold may still occur. Accordingly, it is necessary to investigate the scenario where the generator’s rotational speed surpasses its maximum threshold, and to compare this scenario with that where the speed remains within the threshold under the same boundary conditions.
As illustrated in the previous section, when the flow coefficient is 0.11, the average power output across all stages of the OWC system reaches its peak value. This peak power output is observed irrespective of whether a rotational speed limit is implemented. Consequently, this specific operating condition (i.e., = 0.11) is selected for the aforementioned comparative analysis.
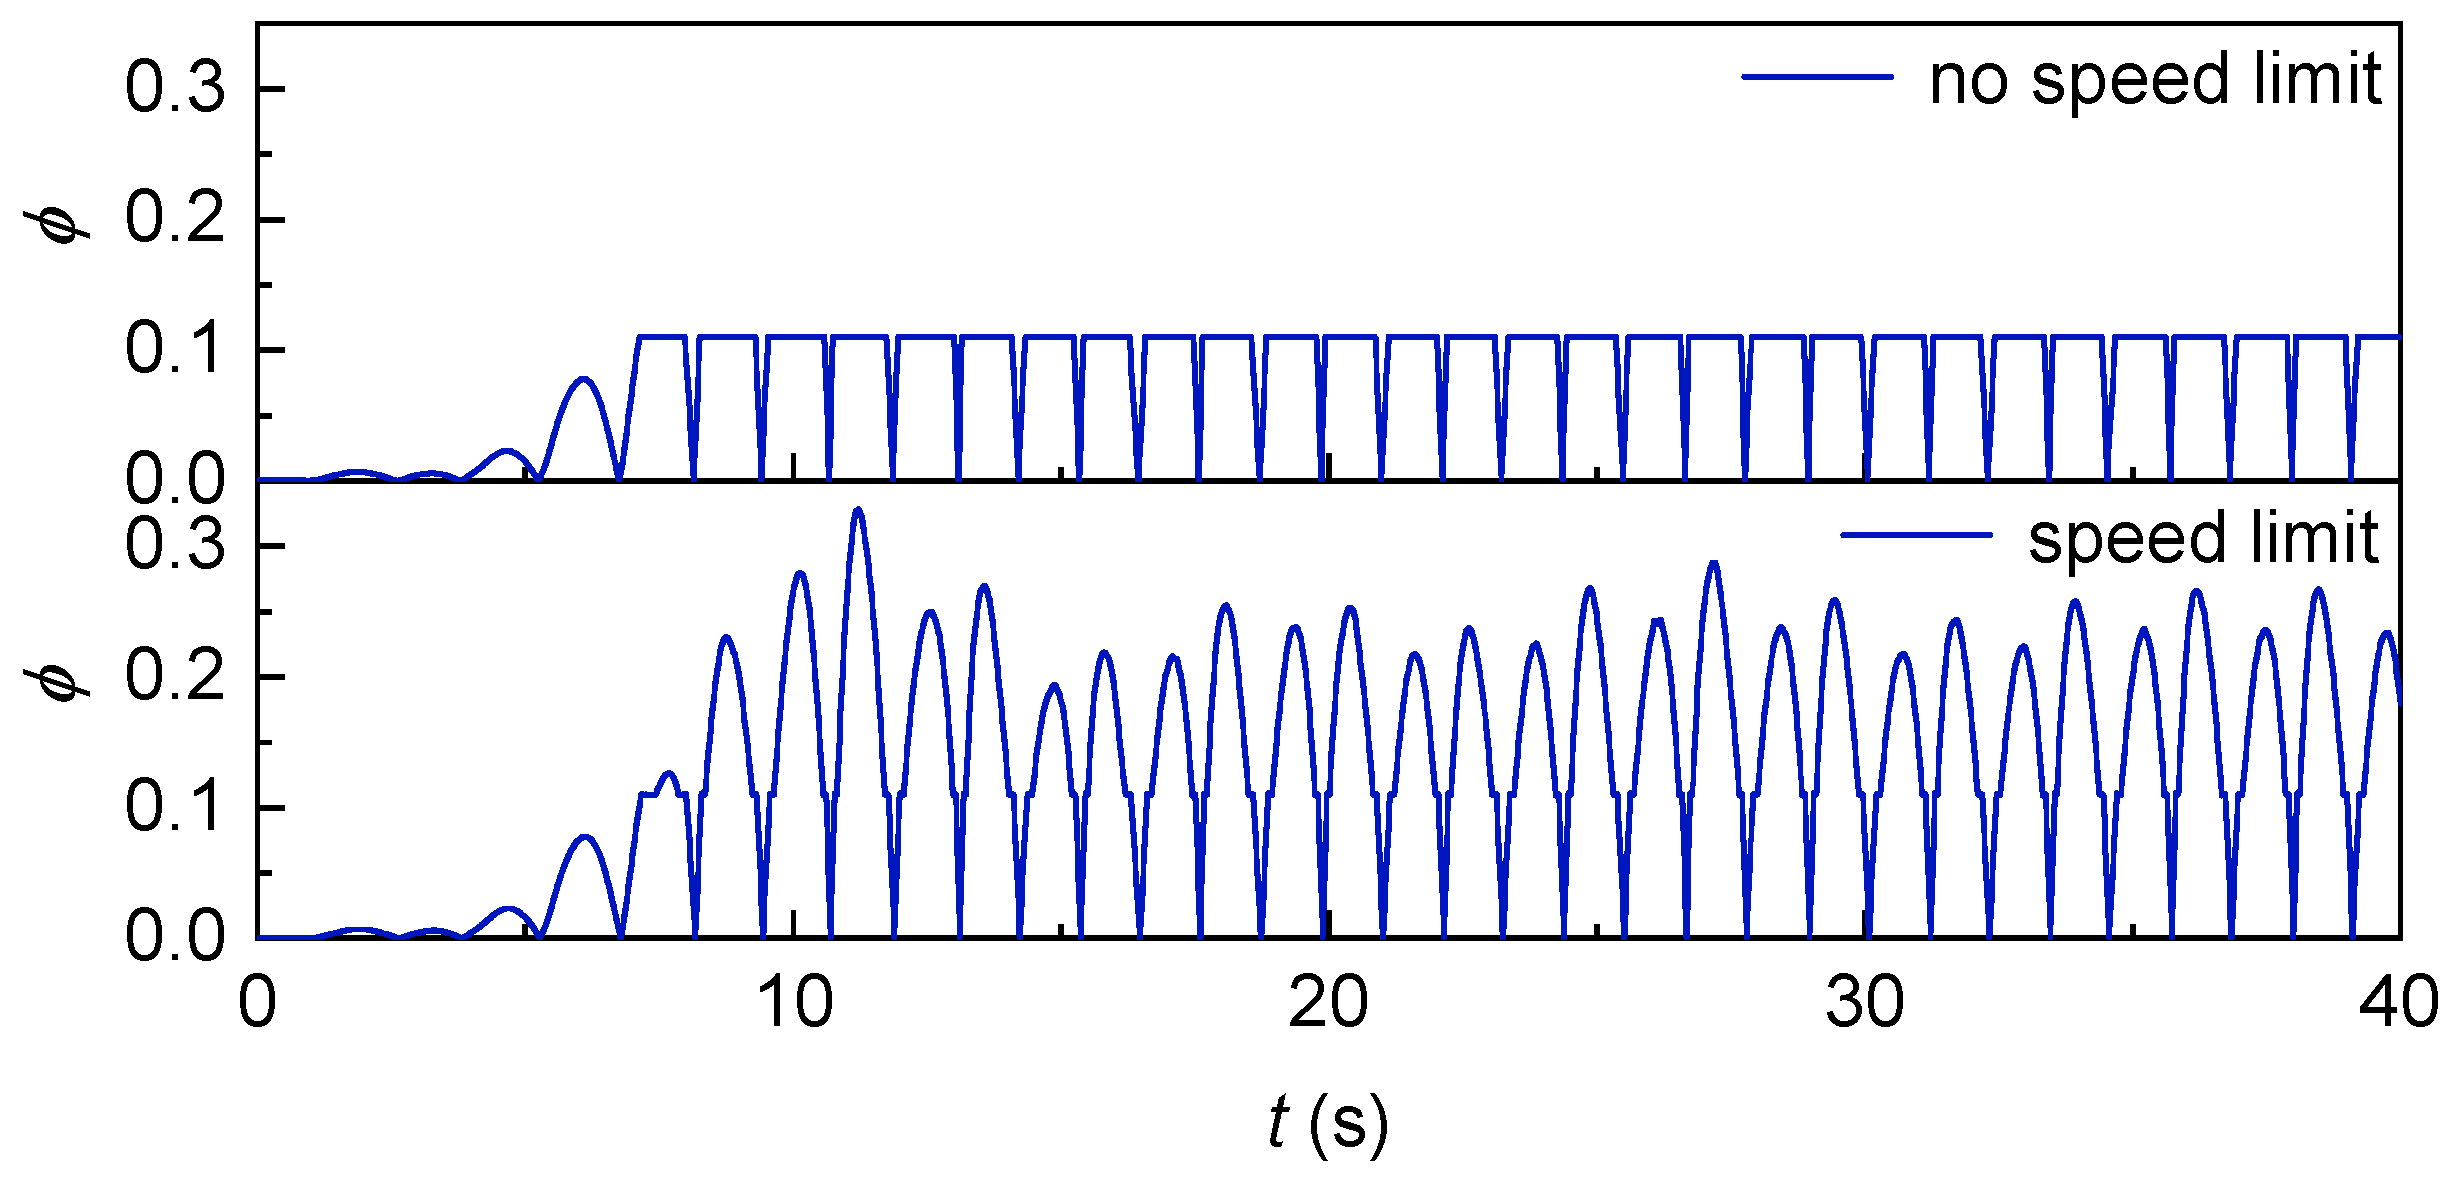
Figure 34 shows the change in
with time in the case of speed control with and without speed limit. It can be observed that in the case of speed control without speed limit, since the speed of the generator does not have an upper limit according to the size of the wind speed,
does not increase when it reaches 0.11. In the case of speed control with speed limit, when the wind speed increases, the speed of the generator first remains unchanged and then increases, but the maximum speed can only reach 3000 rpm, so
will continue to increase after a short period of time at 0.11.
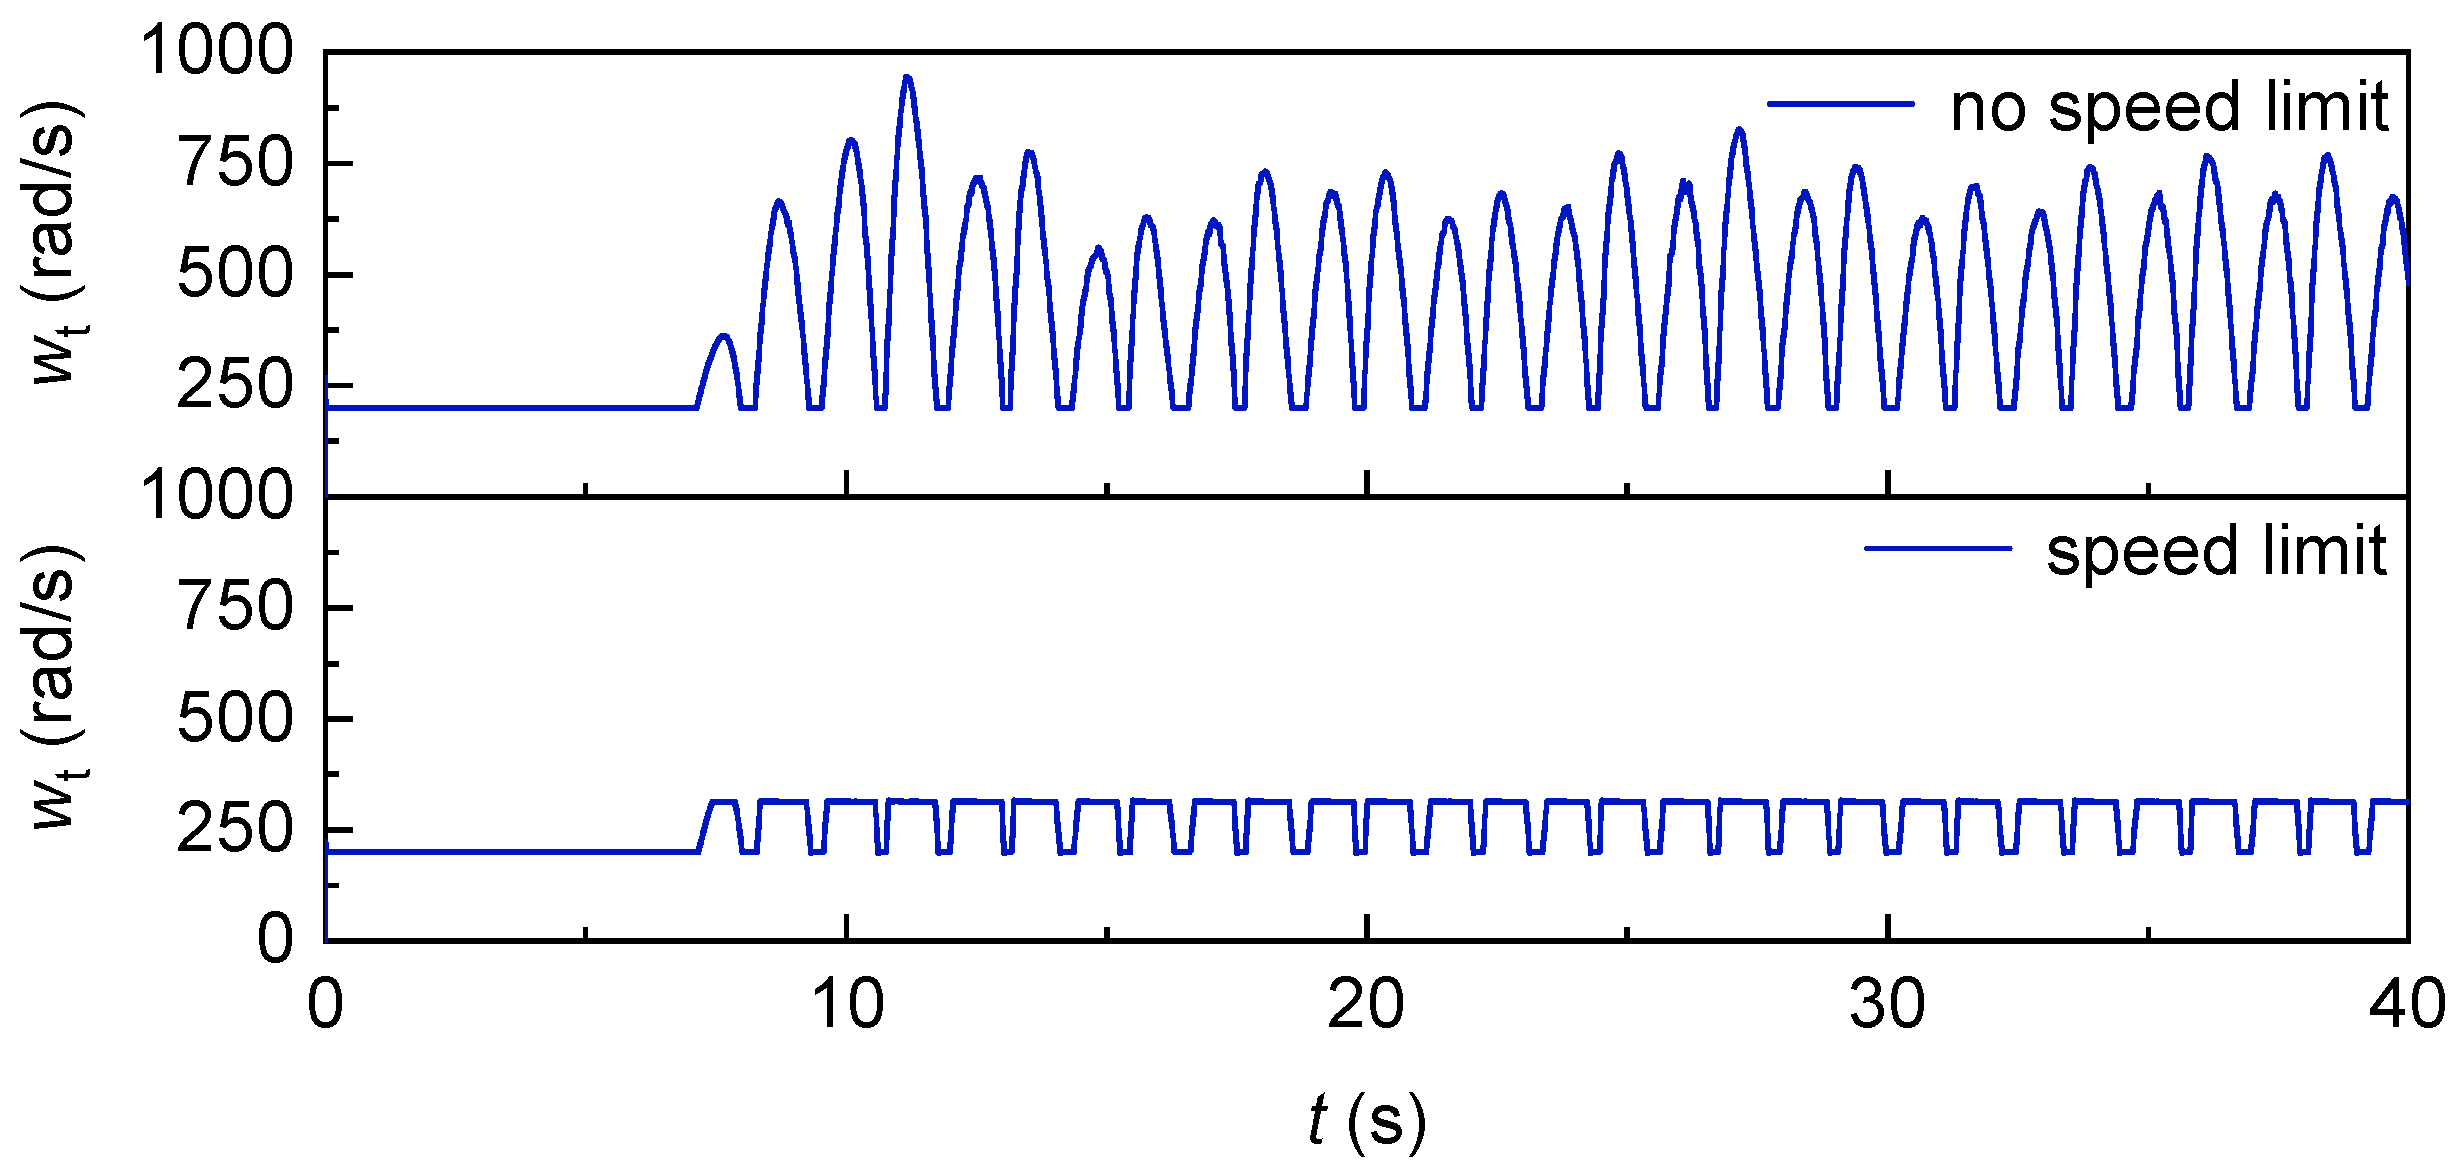
Figure 35 shows the change of generator speed with time under the condition of speed control with and without speed limit. It can be observed that in the case of speed control without speed limit, the speed of the generator is between 200 rpm and 1000 rpm because there is no upper limit on the change of the speed of the generator according to the size of the wind speed. In the case of speed control with speed limit, the speed of the generator does not increase after reaching the upper limit of the speed of 314 rpm, and its size is between 200 rpm and 314 rpm.
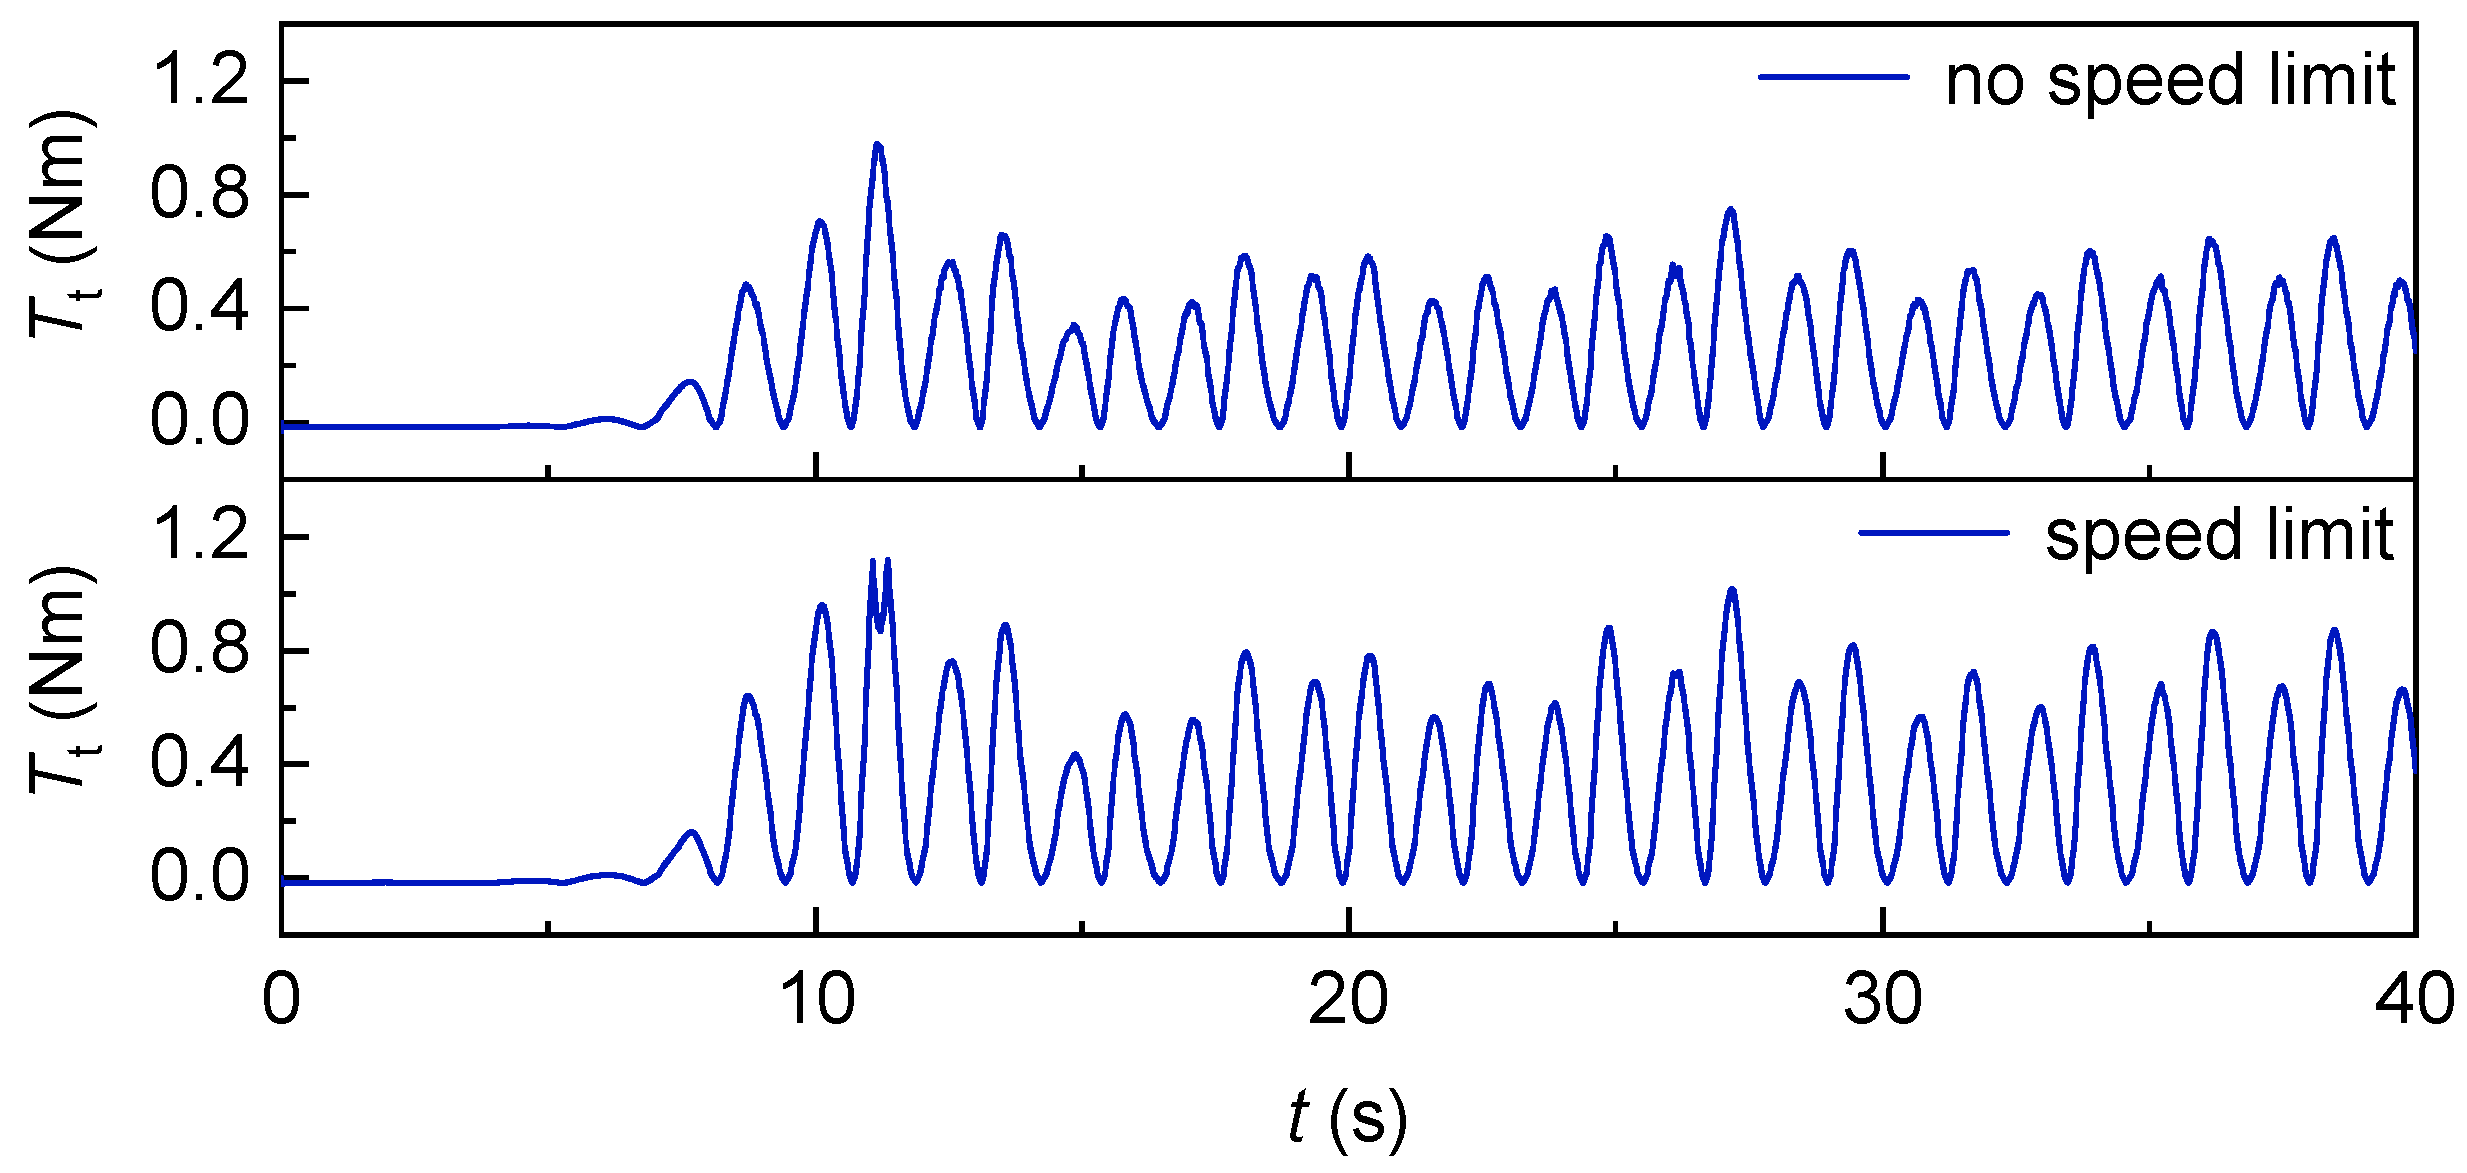
Figure 36 and
Figure 37 show the variation in the torque of the Wells turbine and the electromagnetic torque of the generator with time under the condition of speed control with and without speed limit, respectively. It can be observed that the torque wave of the Wells turbine with speed limit is greater than that of turbine without speed limit. The absolute value of the electromagnetic torque in the case of speed limit is greater than the absolute value of the electromagnetic torque in the case of dynamic speed control without speed limit.
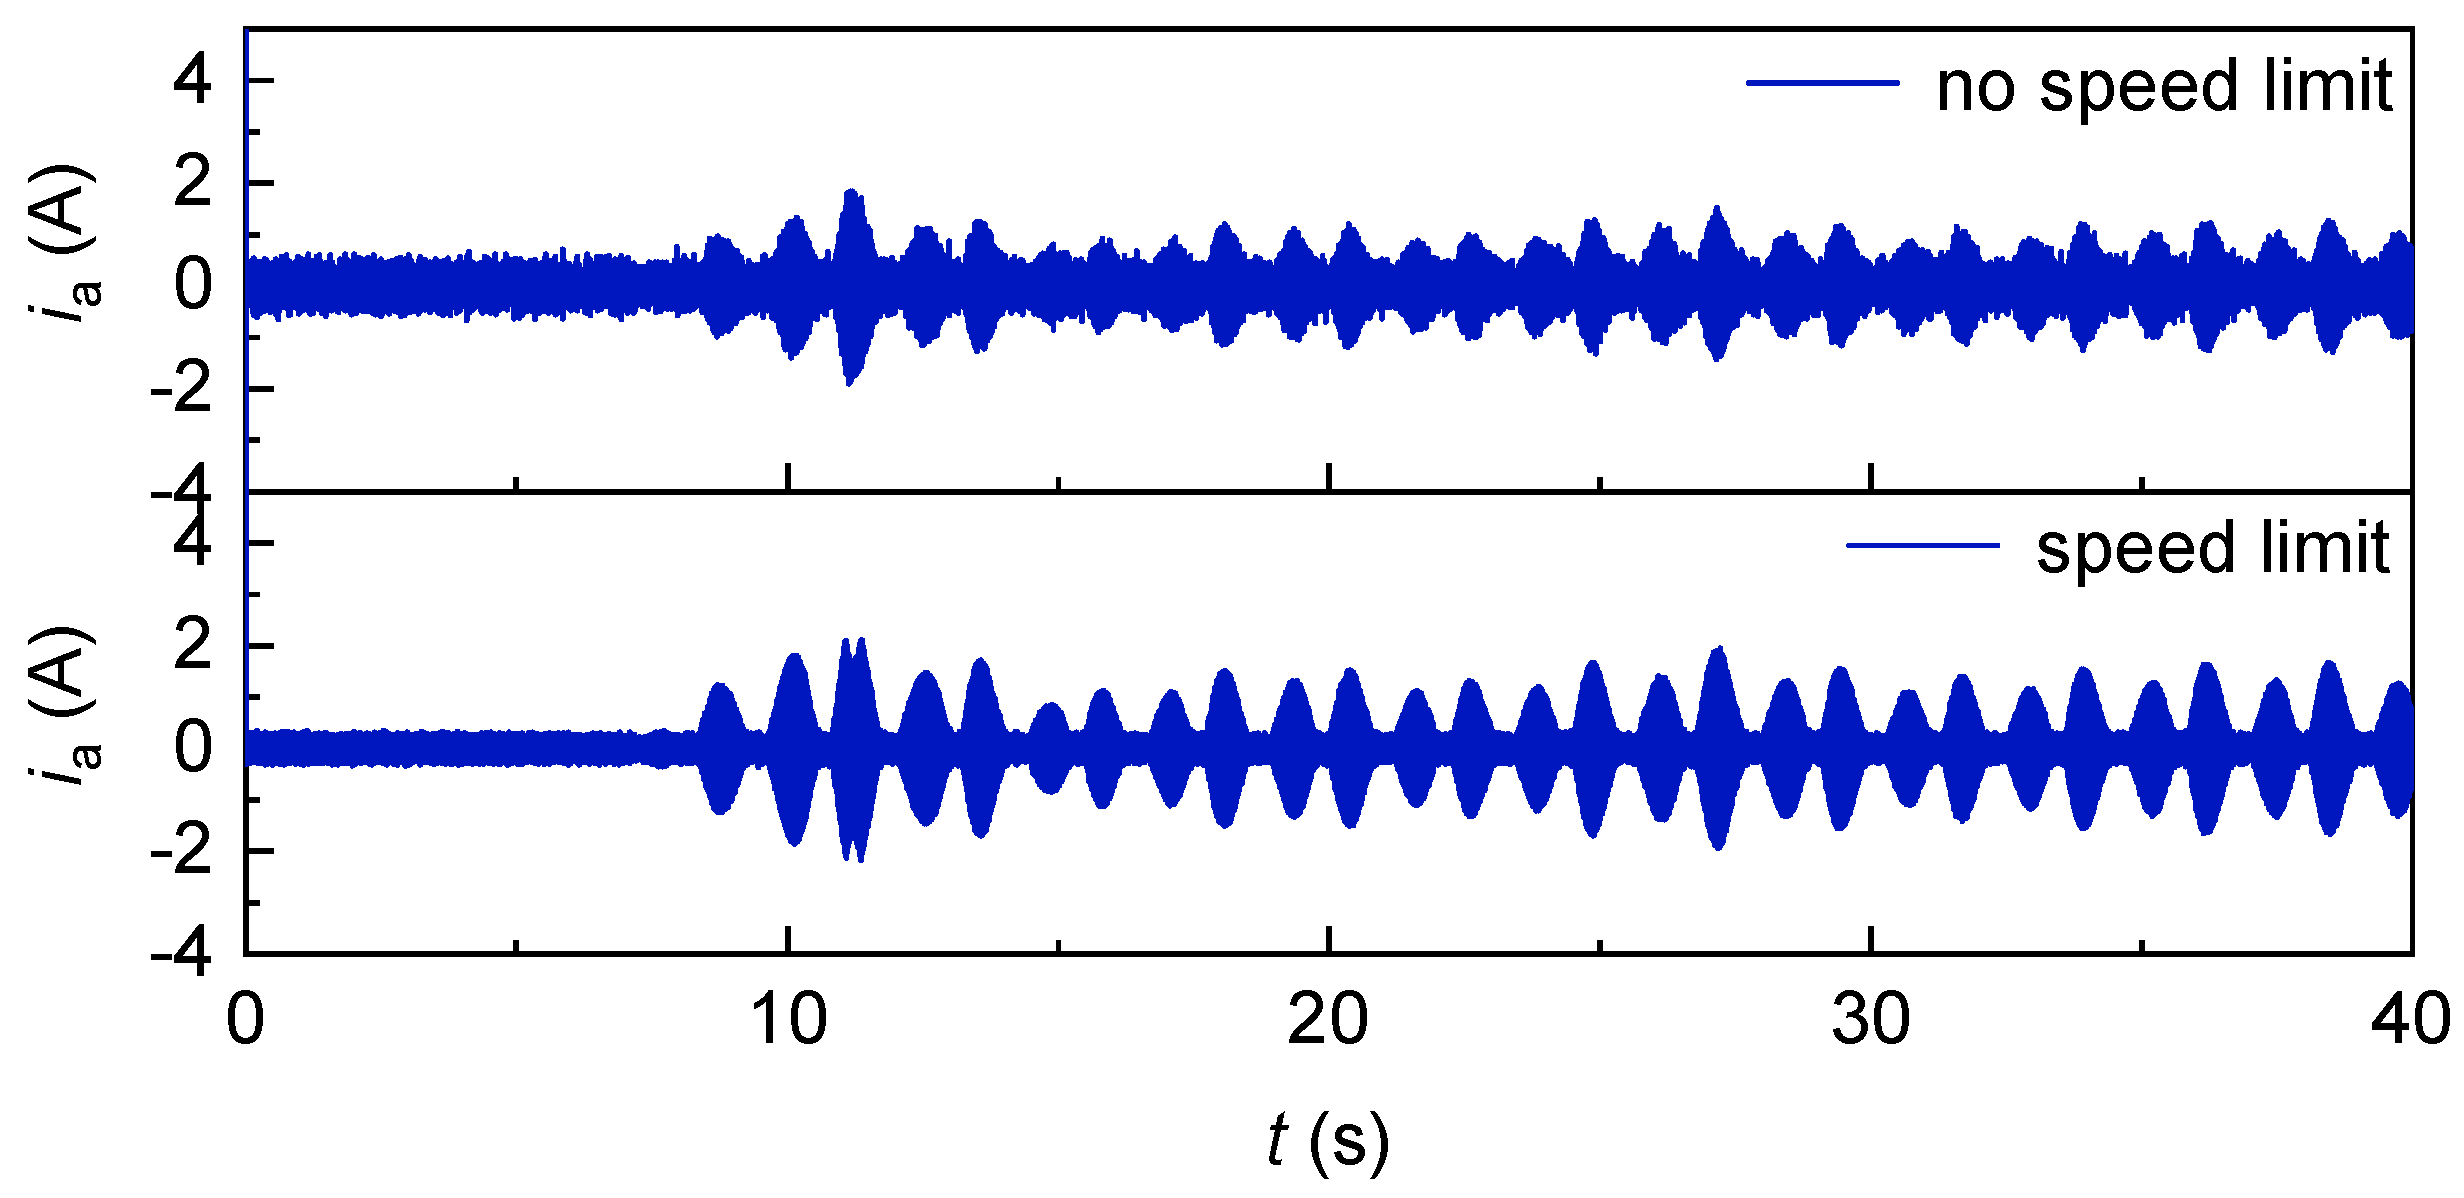
Figure 38 shows the three-phase current of the permanent magnet synchronous generator with and without speed limit. It can be observed that the three-phase current of the generator with speed limit is significantly smaller than that of the generator without speed limit.
Figure 39 shows the change of DC bus voltage with time in the case of speed control with and without speed limit. Whether the speed control has a speed limit or the speed control has no speed limit, the DC bus voltage is stable at about 700 V, but the DC bus voltage fluctuation with speed limit is significantly smaller than that without speed limit.
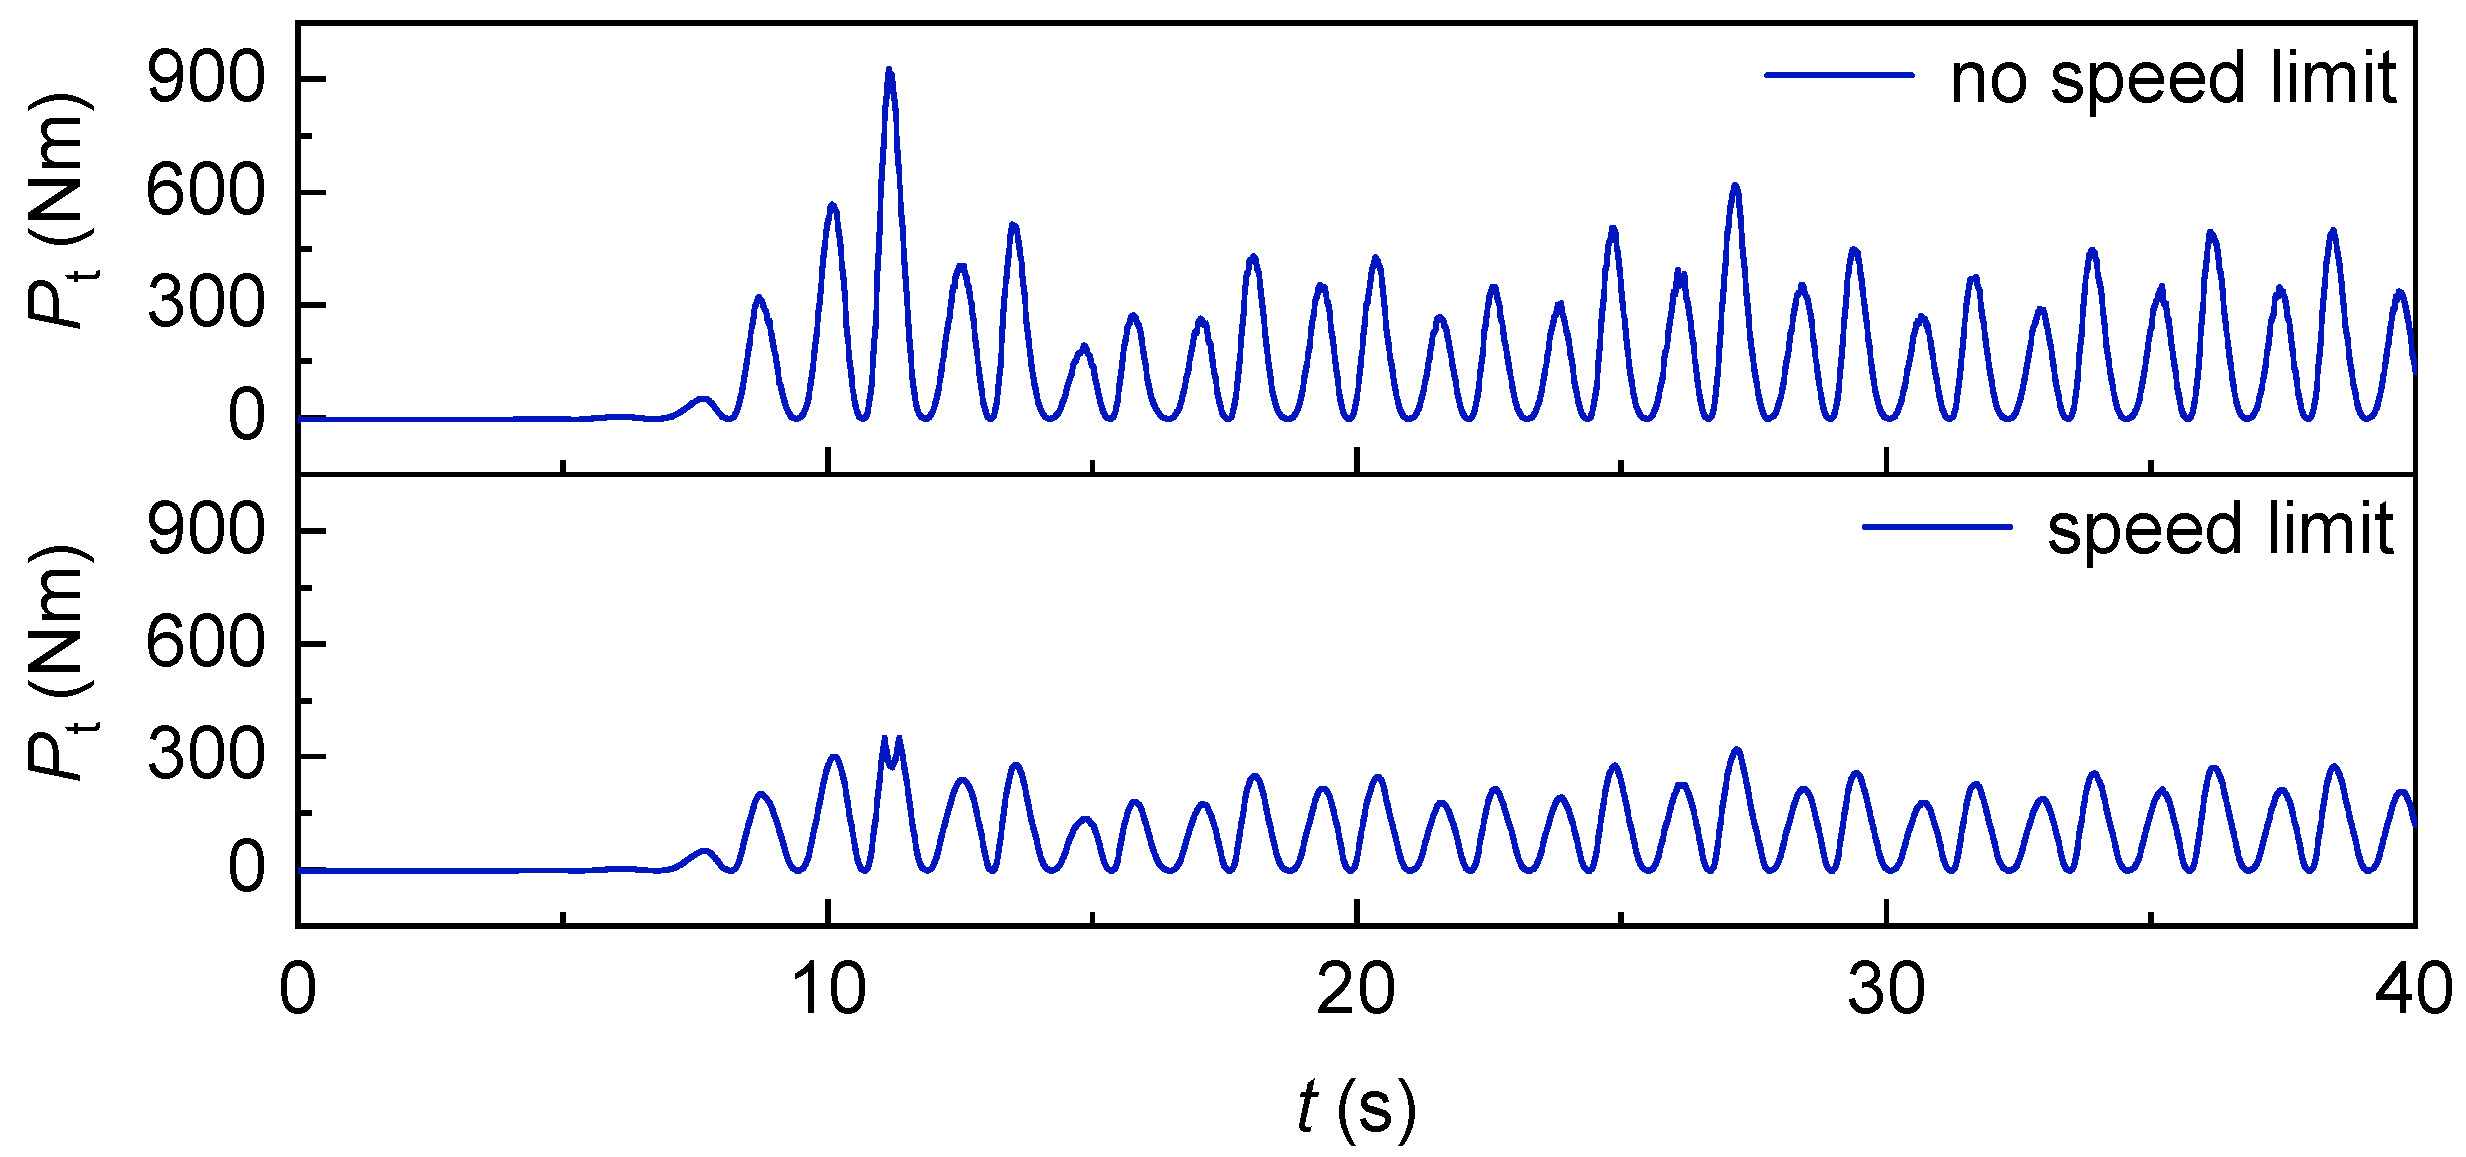
Figure 40 shows the change in pressure drop with time in the case of speed control with and without speed limit. The pressure drop without speed limit is significantly greater than that with speed limit, because the speed is greater without speed limit. The partial pressure peak can reach more than 2000 Pa without speed limit, and the pressure drop peak is basically stable at 1000 Pa under speed control.
Figure 41 shows the change in turbine power with time in the case of speed control with and without speed limit. The turbine power without speed limit is significantly larger than that with speed limit. The average generator power and grid-connected average power are shown in
Figure 42, respectively, and it can be seen that the average generator power is significantly greater than the grid-connected power.
Under sinusoidal wave conditions, the average power across all stages of the oscillating water column (OWC) power generation control system exhibits a sequential decrease under speed-limited conditions compared to speed-unlimited conditions, with the average power at each stage under speed limits being significantly lower than that under unrestricted operation. Quantitatively, relative to speed-unlimited conditions, the speed-limited configuration results in a 29.48% reduction in mechanical power, a 34.91% decrease in rectified power, and a 39.92% reduction in grid-connected power. Efficiency metrics further reflect this trend: under speed-unlimited conditions, the energy conversion efficiency from mechanical to rectified power reaches 77.72%, with the efficiency from rectified to grid-connected power at 87.06%; in contrast, under speed-limited conditions, these efficiencies drop to 71.74% and 80.12%, respectively. These findings confirm that the implementation of speed limits in OWC systems not only reduces average power output across all sequential stages but also diminishes the efficiency of energy conversion between consecutive power transfer stages.
As shown in
Table 4 below, it can be observed from the table that the average power at each stage of the OWC power generation system (i.e., Oscillating Water Column power generation system) also decreases in sequence under the two conditions. Moreover, the average power at each stage with speed limitation is much lower than that without speed limitation.
5.4. Irregular Waves Model and Vertification
The generalized JONSWAP spectrum is used to reproduce the irregular wave environment:
where
S is the wave spectral density,
is the angular wave frequency,
is the angular wave frequency at the peak of the spectrum,
is the significant wave gauge, and
is an extra peak enhancement factor valued between 1 and 5. Time series of irregular waves can be generated using the MATLAB.
The peak
of the control conditions selected in this simulation are controlled at 0.30 and 0.14, respectively. The JONSWAP irregular time series with an effective wave gauge of 1.6 m, a peak spectrum period of 5 s, and a peak enhancement factor of 2.5 is generated by using matlab code as shown in
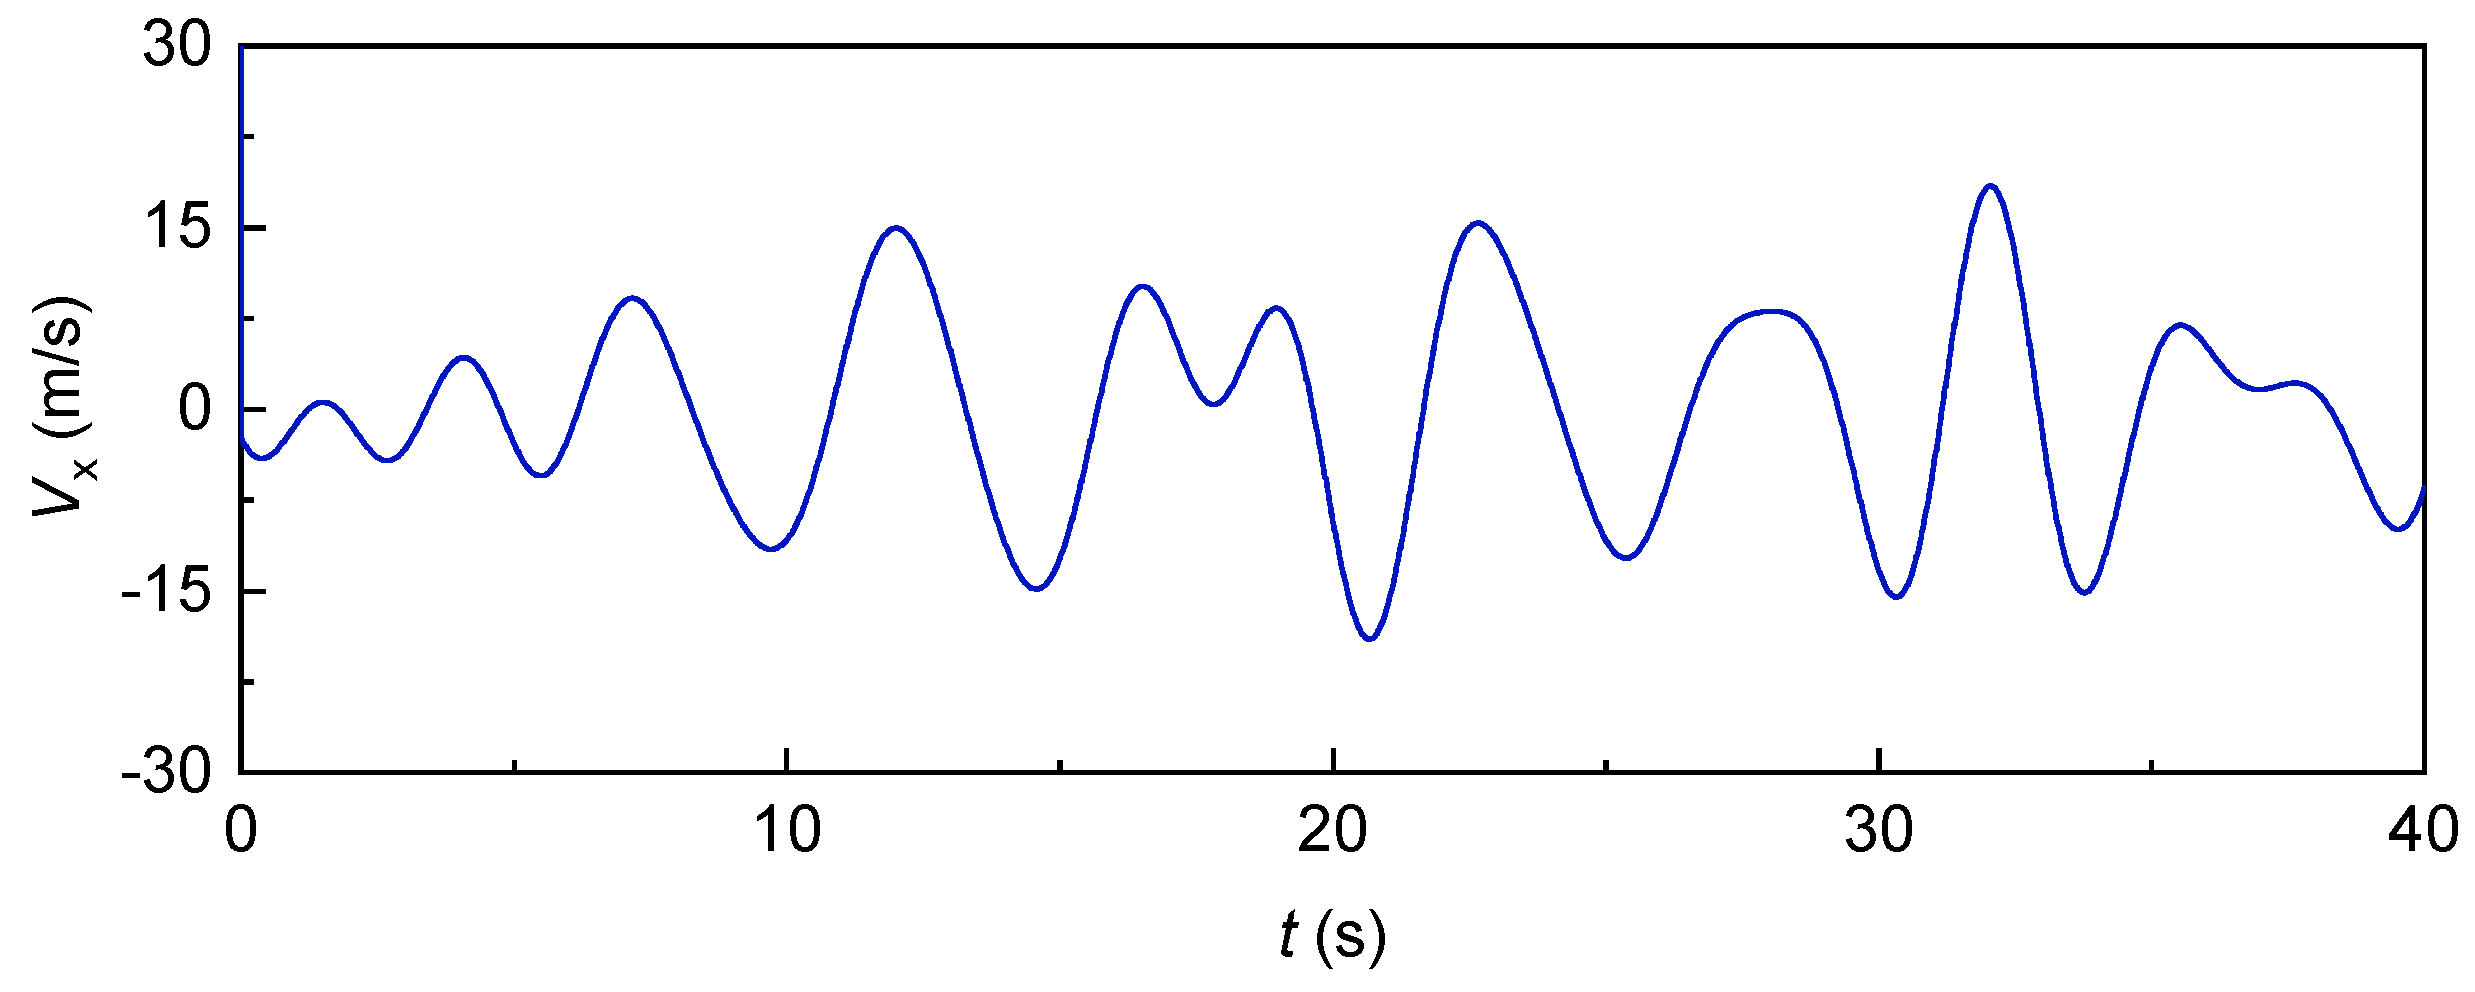
Figure 43. The wind speed generated by the irregular wave time series in the turbine pipe is shown in
Figure 44.
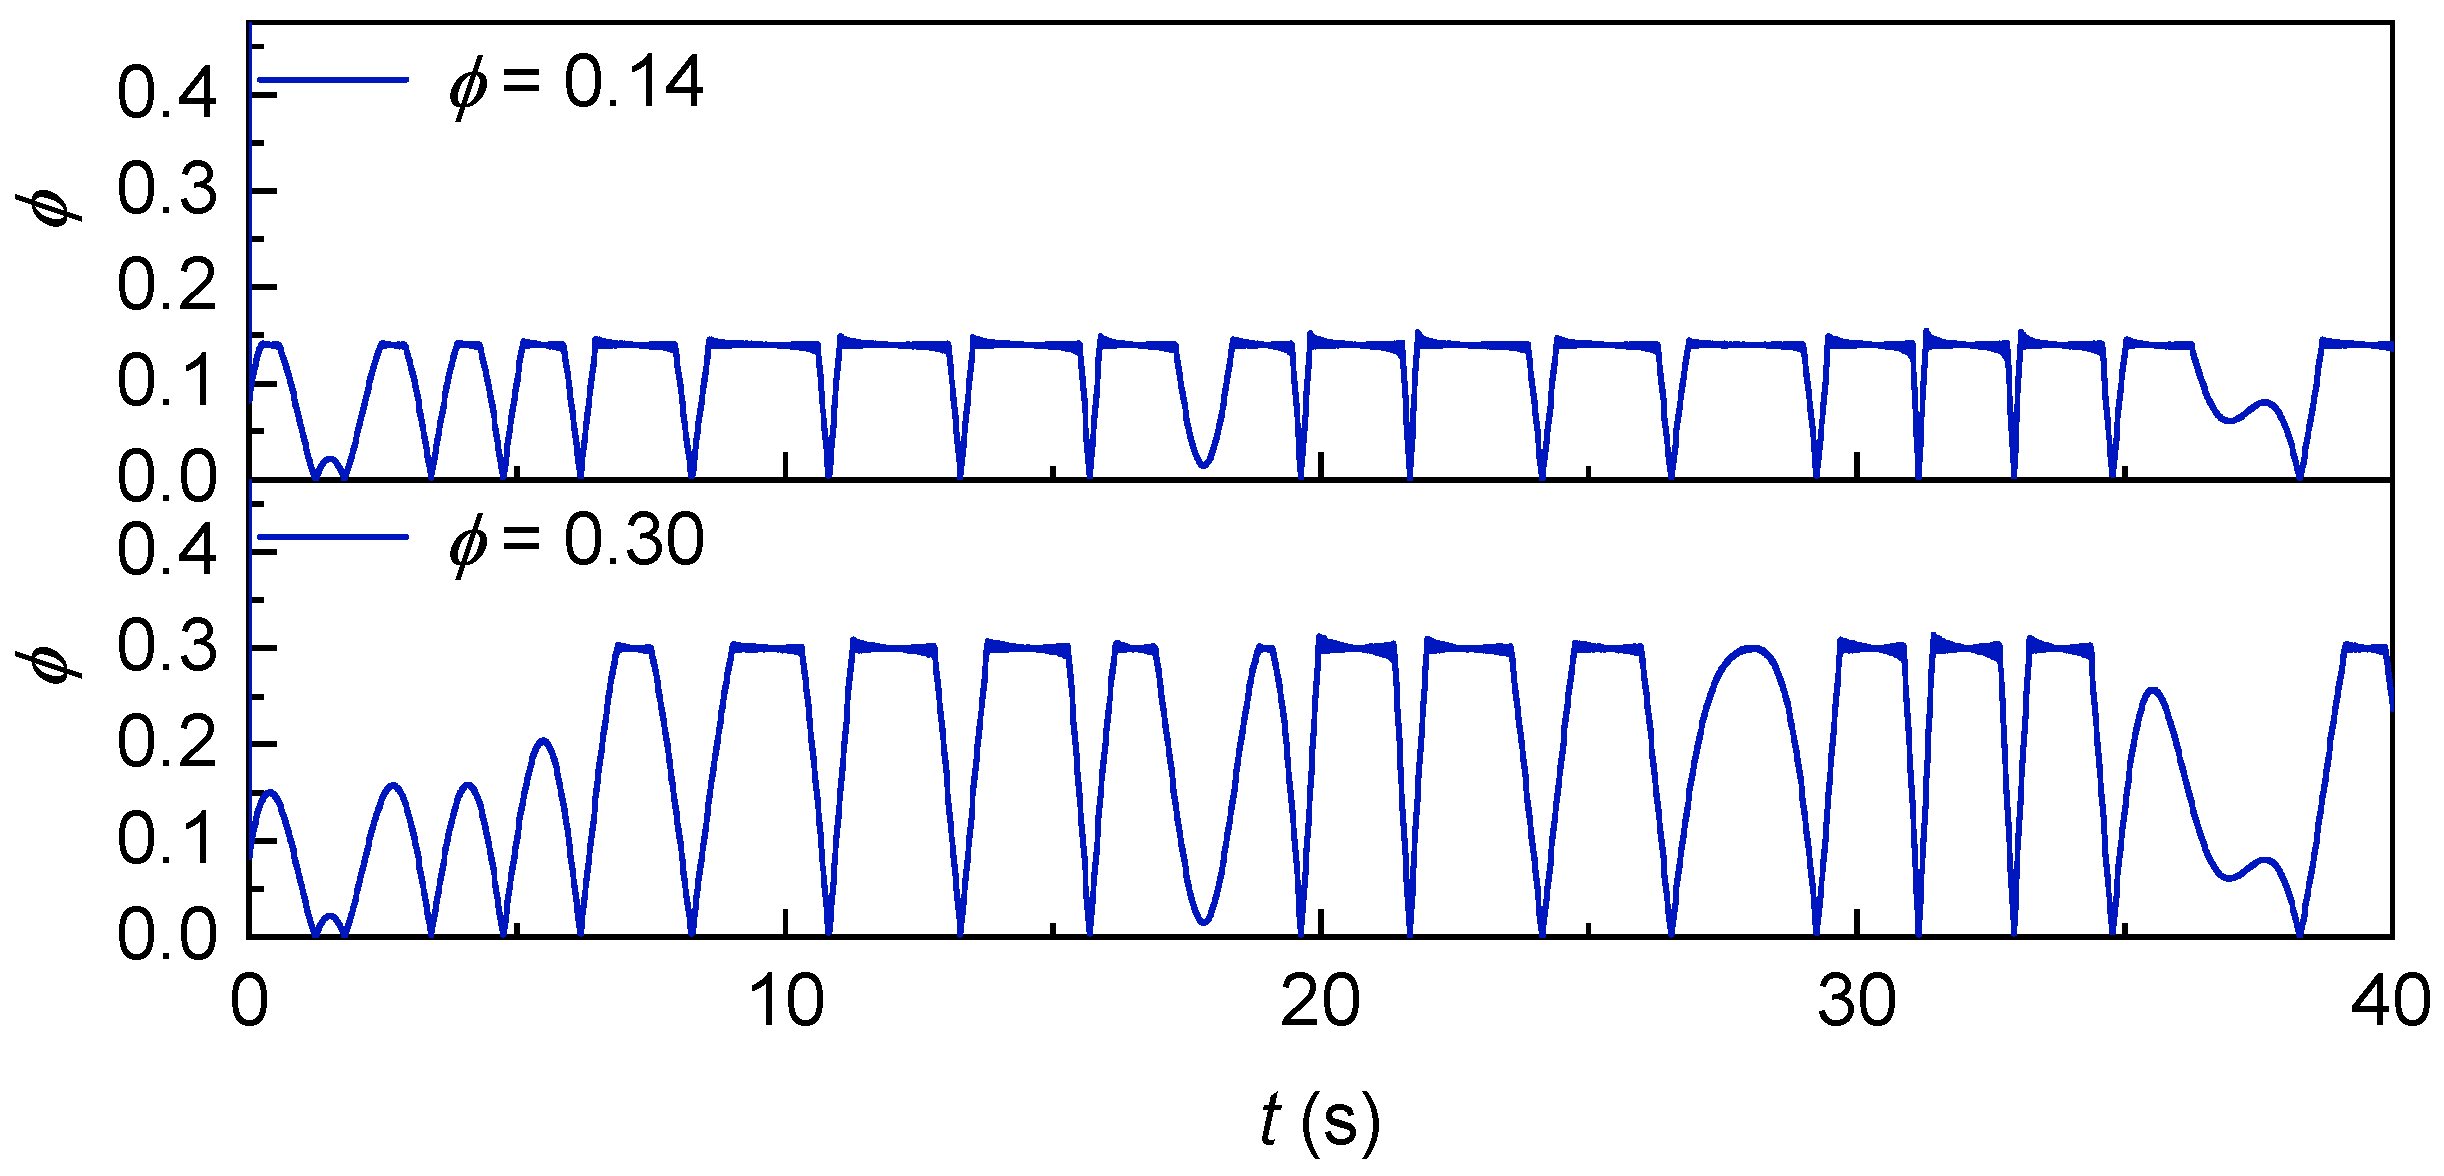
The change of
with JONSWAP irregular wave is shown in
Figure 45. It can be observed that the peak value of
is stably controlled at 0.30 and 0.14, respectively, by the speed control strategy, which means that the proposed control strategy can match the speed according to the wind speed, so that
can be controlled at the value we need.
The change of generator speed with irregular waves is shown in
Figure 46. It can be seen that compared with the speed when
is controlled at 0.30, the speed when
is controlled at 0.14 has been significantly improved.
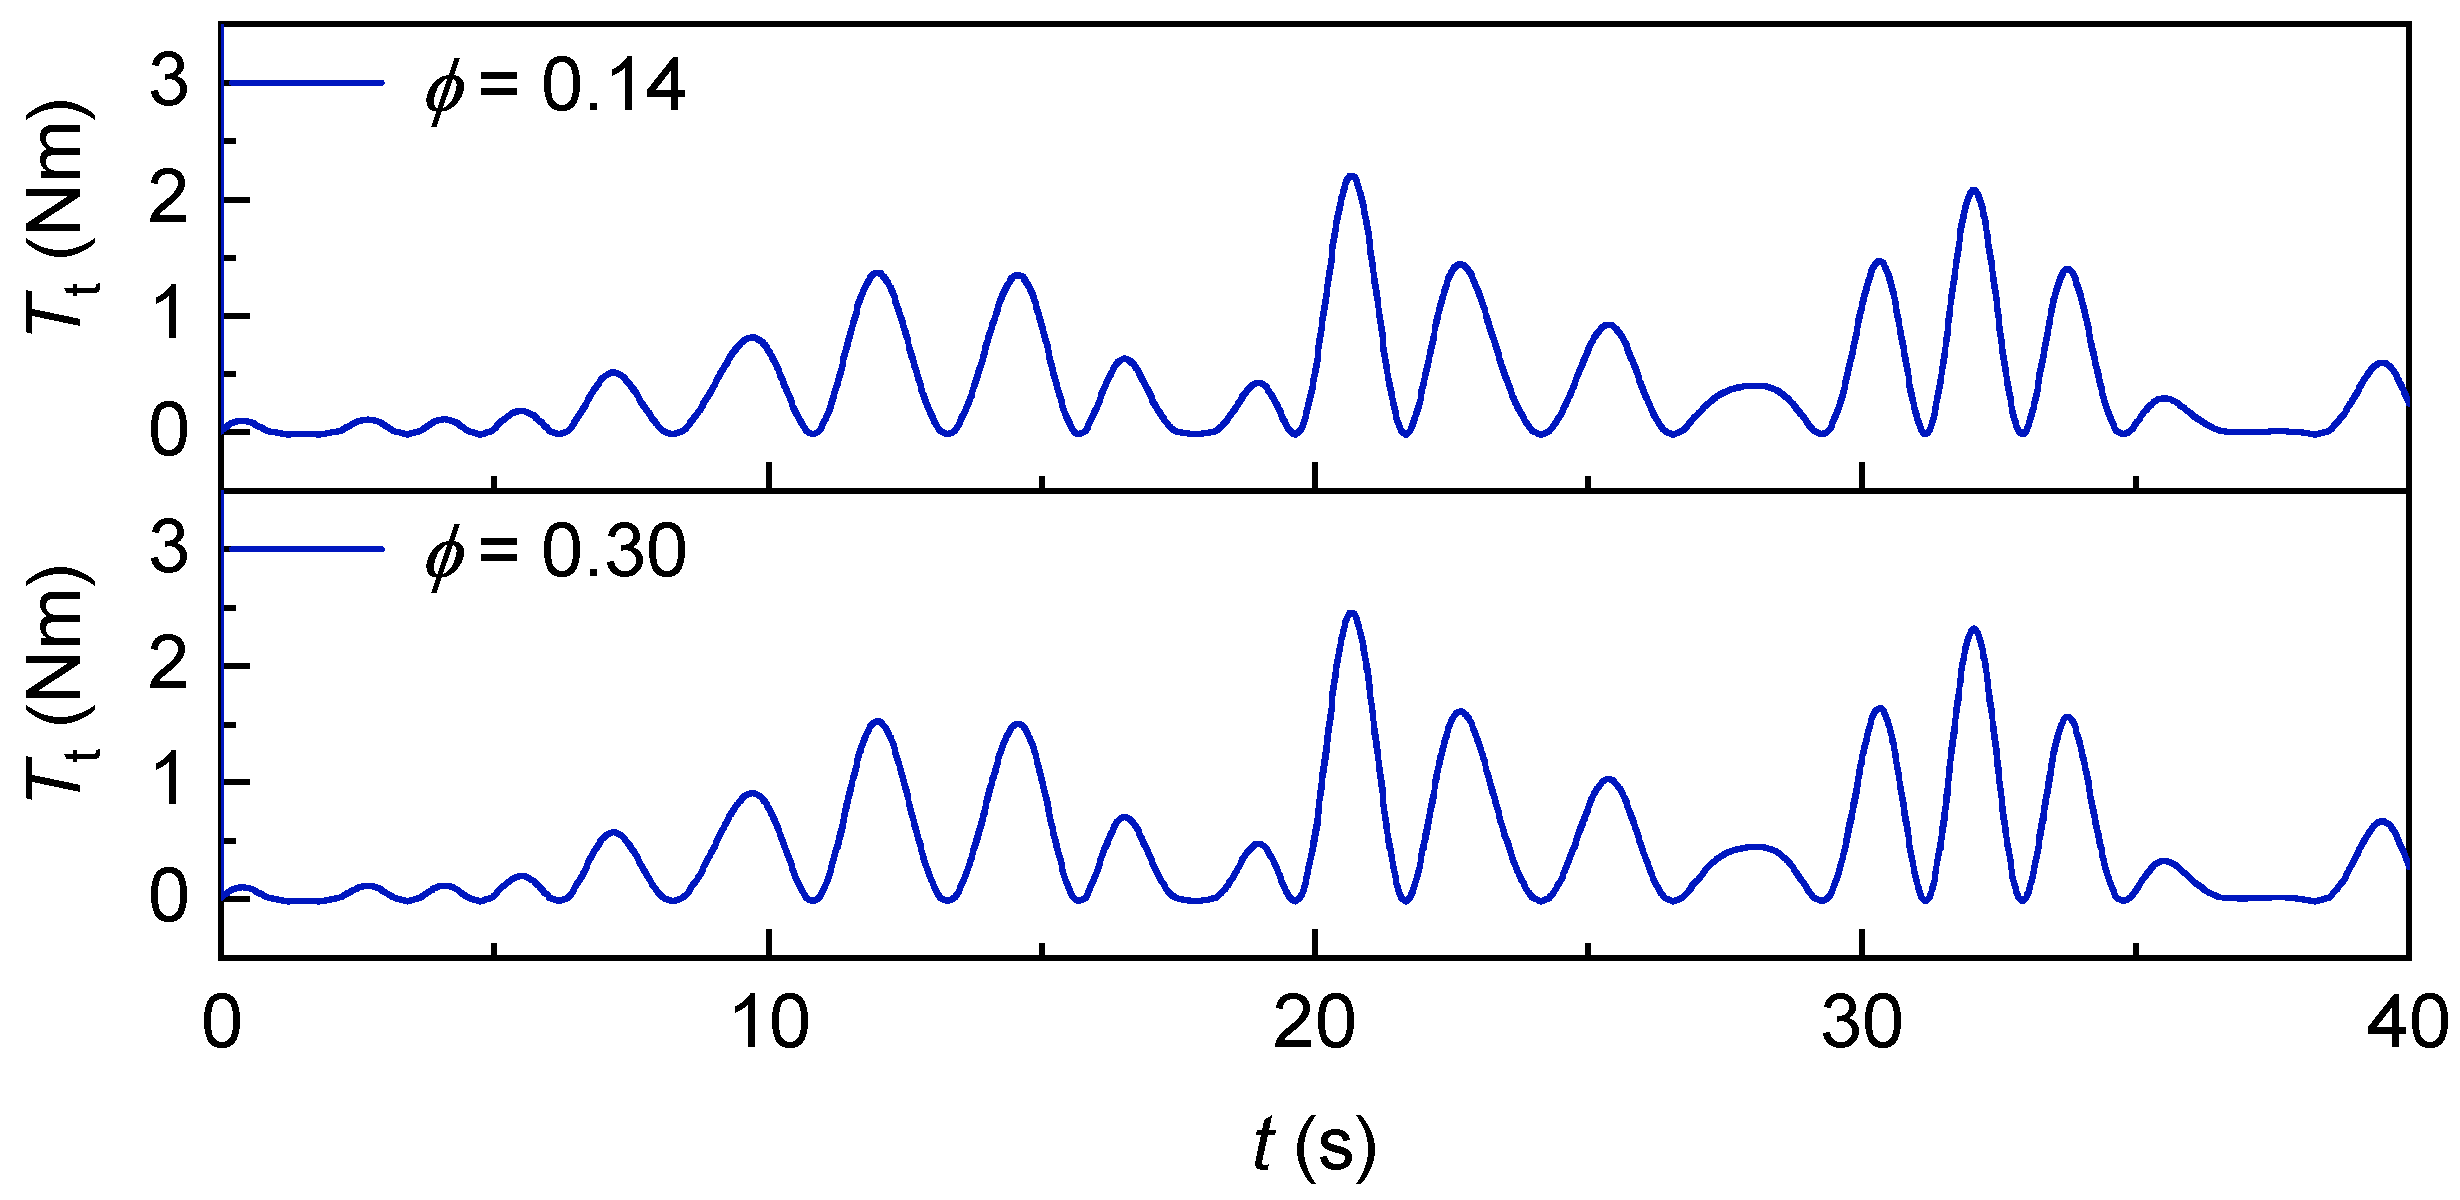
The variation in turbine torque and generator electromagnetic torque with irregular waves is shown in
Figure 47 and
Figure 48. It can be seen that the torque of the turbine and the electromagnetic torque of the generator are similar in waveform, but the torque of the turbine is slightly larger than the electromagnetic torque of the generator.
The variation in the a-phase current of the generator with the irregular wave is shown in
Figure 49. It can be seen that the a-phase current of the generator is smaller when
is 0.14 in both cases.
The variation in pressure drop on the rotor with irregular waves is shown in
Figure 50. It can be seen that the pressure drop on the rotor at
of 0.14 is significantly higher than that at 0.30.
The change in the DC bus voltage with the irregular wave is shown in
Figure 51. It can be seen that the DC bus voltage is basically stable at about 700 V in both cases, but the DC bus voltage fluctuates more when
is 0.14 than when
is 0.30.
The variation in turbine power with irregular waves is shown in
Figure 52. It can be seen that the turbine power is significantly higher than 0.30 when
is 0.14.
The variation in the rectifier power and grid-connected power of the generator with irregular waves is shown in
Figure 53. It can be seen that the average power when
is 0.14 is higher than the average power when
is 0.30, and the rectifier power is slightly larger than the grid-connected power.
This study primarily focuses on analyzing the control results of the oscillating water column (OWC) wave energy system, with no stability research indicators included in its content. Specifically, it centers on comparing and interpreting the performance outcomes of two operating conditions—uncontrolled and speed-controlled—under irregular wave scenarios, with the core analysis revolving around key power indicators such as mechanical power (Pt), rectified power (Pc), and grid-connected power (Pg) to validate the effectiveness of the speed control strategy. For subsequent work, further research will be conducted to investigate the stability of the control method itself. This future research will aim to explore aspects like the control method’s performance under long-term operation and its adaptability to more complex wave conditions, though such stability-related investigations and indicators are not covered in the present paper, which remains dedicated to the analysis of existing control results.
5.5. RMS and CF Calculation Results
For discrete time-series data (consistent with the irregular wave experimental sampling in the article, where the sampling frequency and total duration , leading to sampling points), the RMS value quantifies the overall fluctuation intensity of a parameter. Smaller RMS values indicate better stability.
The RMS formula is defined as
where
is the value of the parameter (e.g., flow coefficient
, rotational speed) at the
i-th sampling point, and
is the total number of samples.
The CF characterizes the relative intensity of extreme peaks versus average fluctuations. A CF closer to 1 indicates flatter peaks and stronger resistance to extreme conditions; a CF > 2.5 typically signifies significant peak impacts.
The CF formula is defined as
where
is the maximum absolute value of the parameter in the time series.
Based on
Section 5.4, the irregular wave environment is constructed using the JONSWAP spectrum with the following parameters: Significant wave height
, Peak period
, Peak enhancement factor
, Controlled
peaks:
ref1 = 0.30 (conventional critical value) and
ref2 = 0.14.
Key stability parameters analyzed include , generator rotational speed, turbine torque, electromagnetic torque, generator A-phase current, turbine pressure drop, turbine power, and DC-link voltage.
5.6. Stability Analysis and Discussion
Follow the
Table 5,
,
; for
,
(a 53.3% reduction). This indicates that the optimized
reduces
fluctuation intensity, avoiding stall risks more effectively (consistent with
Figure 45, where
maintains tighter control without overshoot).
Both cases have a CF , showing similar peak-to-average ratios—proof that the control strategy stably restricts to subcritical values under irregular waves.
Rotational Speed and Torque Stabilit: yIn terms of generator rotational speed characteristics, the Root Mean Square (RMS) value (
) of speed under the
condition is 562.4 rpm, which is higher in comparison to 385.2 rpm under the
condition. However, its Crest Factor (CF) is approximately 1.601, which is close to the 1.558 observed under the
condition. This result indicates that the higher rotational speed under
does not cause excessive peak fluctuations. As observed in
Figure 46, the speed curve under this condition is smoother with no abrupt spikes, verifying the role of the dynamic speed regulation mechanism in ensuring speed stability.
For turbine torque, the RMS value of torque under
is 1.830 N·m, which is higher than the 1.215 N·m under
. The CF values of the two conditions are similar (approximately 1.643 for
), meaning the higher torque under
still maintains a stable state without extreme peak impacts. As shown in
Figure 47, the torque waveform under
is more regular than that under
.
Electrical Parameter Stability: Regarding the stability of electrical parameters, the generator’s A-phase current is first analyzed. The RMS value of current under
is 1.912 A, a 50% reduction compared to 3.825 A under
. Its CF is approximately 1.644, which remains within the stable range. This change demonstrates that the optimized control strategy effectively reduces current fluctuation amplitude and alleviates the electrical stress on the generator. As seen in
Figure 49, the current peaks under
are smaller with lower waveform distortion, further confirming the reduction in electrical stress.
For the DC-link voltage, the RMS values under both conditions are close to 700 V, and the CF values are approximately 1.0003, indicating that the grid-side control loop can achieve ultra-stable voltage control. As stated in the article, the voltage fluctuation amplitude under this condition is only ±0.2%. It can also be visually observed from
Figure 51 that the voltage curves corresponding to the two
values overlap closely with no obvious fluctuations, providing critical support for grid-connection safety. Power and Pressure Drop Stability: Analyzing turbine power characteristics, the RMS value of power under
is 1173.8 W, a 49.9% increase compared to 782.5 W under
. The CF values of the two conditions are similar (approximately 1.640 for
), indicating that the higher power output under
does not come at the cost of stability—peak power is proportional to average power with no excessive spikes.
As shown in
Figure 52, the power curve under this condition has an overall higher level, and its envelope is smoother with no sharp drops, realizing the synergy between power improvement and stability. For turbine pressure drop, the RMS value under
is 1628.4 Pa, a 49.9% increase compared to 1085.6 Pa under
. The CF is approximately 1.642, which falls within the stable range. This shows that the increased pressure drop still maintains a stable state, effectively avoiding structural damage caused by extreme pressure. As presented in
Figure 50, the pressure drop curve under
has no abrupt peaks, further verifying the safety of structural operation.
Figure 45 presents the dynamic variation curve of the flow coefficient (
). It can be seen from the figure that the
values under both
and
maintain constant peaks without exceeding the reference value, directly confirming the robustness of the control strategy in the irregular wave environment. Among them, the fluctuation amplitude of
under
is narrower, which is consistent with the lower RMS value under this condition, reflecting better control precision.
Figure 46 shows the dynamic variation of generator rotational speed. The speed curve under
is generally at a higher level (average of approximately 600 rpm), which is significantly higher than the average 400 rpm under
. However, the speed curves under both conditions have no abrupt jumps. This feature is consistent with the CF results, indicating that higher speed does not lead to unstable peaks, fully verifying the effectiveness of the dynamic speed regulation mechanism.
Figure 49 depicts the dynamic variation curve of the generator’s A-phase current. The current peaks under
are larger (approximately 6 A) with high waveform distortion, while the current peaks under
are significantly smaller (approximately 3 A) and the waveform is closer to a sine wave. This phenomenon is consistent with the variation law of the current RMS value—a 50% reduction in current fluctuation under
, directly reflecting a significant reduction in the stress on the electrical system.
Under irregular wave conditions (JONSWAP spectrum: significant wave height , peak period , peak enhancement factor ), the proposed control strategy—incorporating the optimized flow coefficient reference —demonstrates superior stability across all critical operating parameters. In comparison with the conventional reference , yields a 53.3% reduction in the Root Mean Square (RMS) value of the flow coefficient () and a 50% reduction in the RMS value of the generator A-phase current. Of note, all key parameters—including , generator current, rotational speed, turbine torque, and turbine power—maintain a stable Crest Factor (CF) within the range of 1.60 to 1.64. This ensures that neither the reduced fluctuations (observed for and current) nor the enhanced performance (exhibited by speed, torque, and power) compromises the system’s resistance to extreme peak impacts. Additionally, the DC-link voltage maintains an ultra-stable state under both operational conditions, with an RMS value of approximately 700 V and a CF of roughly 1.0003, thus safeguarding the safety of grid connection amid wave-induced disturbances.
5.7. Vertification
Figure 54 presents the time-series power profile of the proposed model in this study, specifically illustrating the dynamic power evolution during turbine stall events. In contrast,
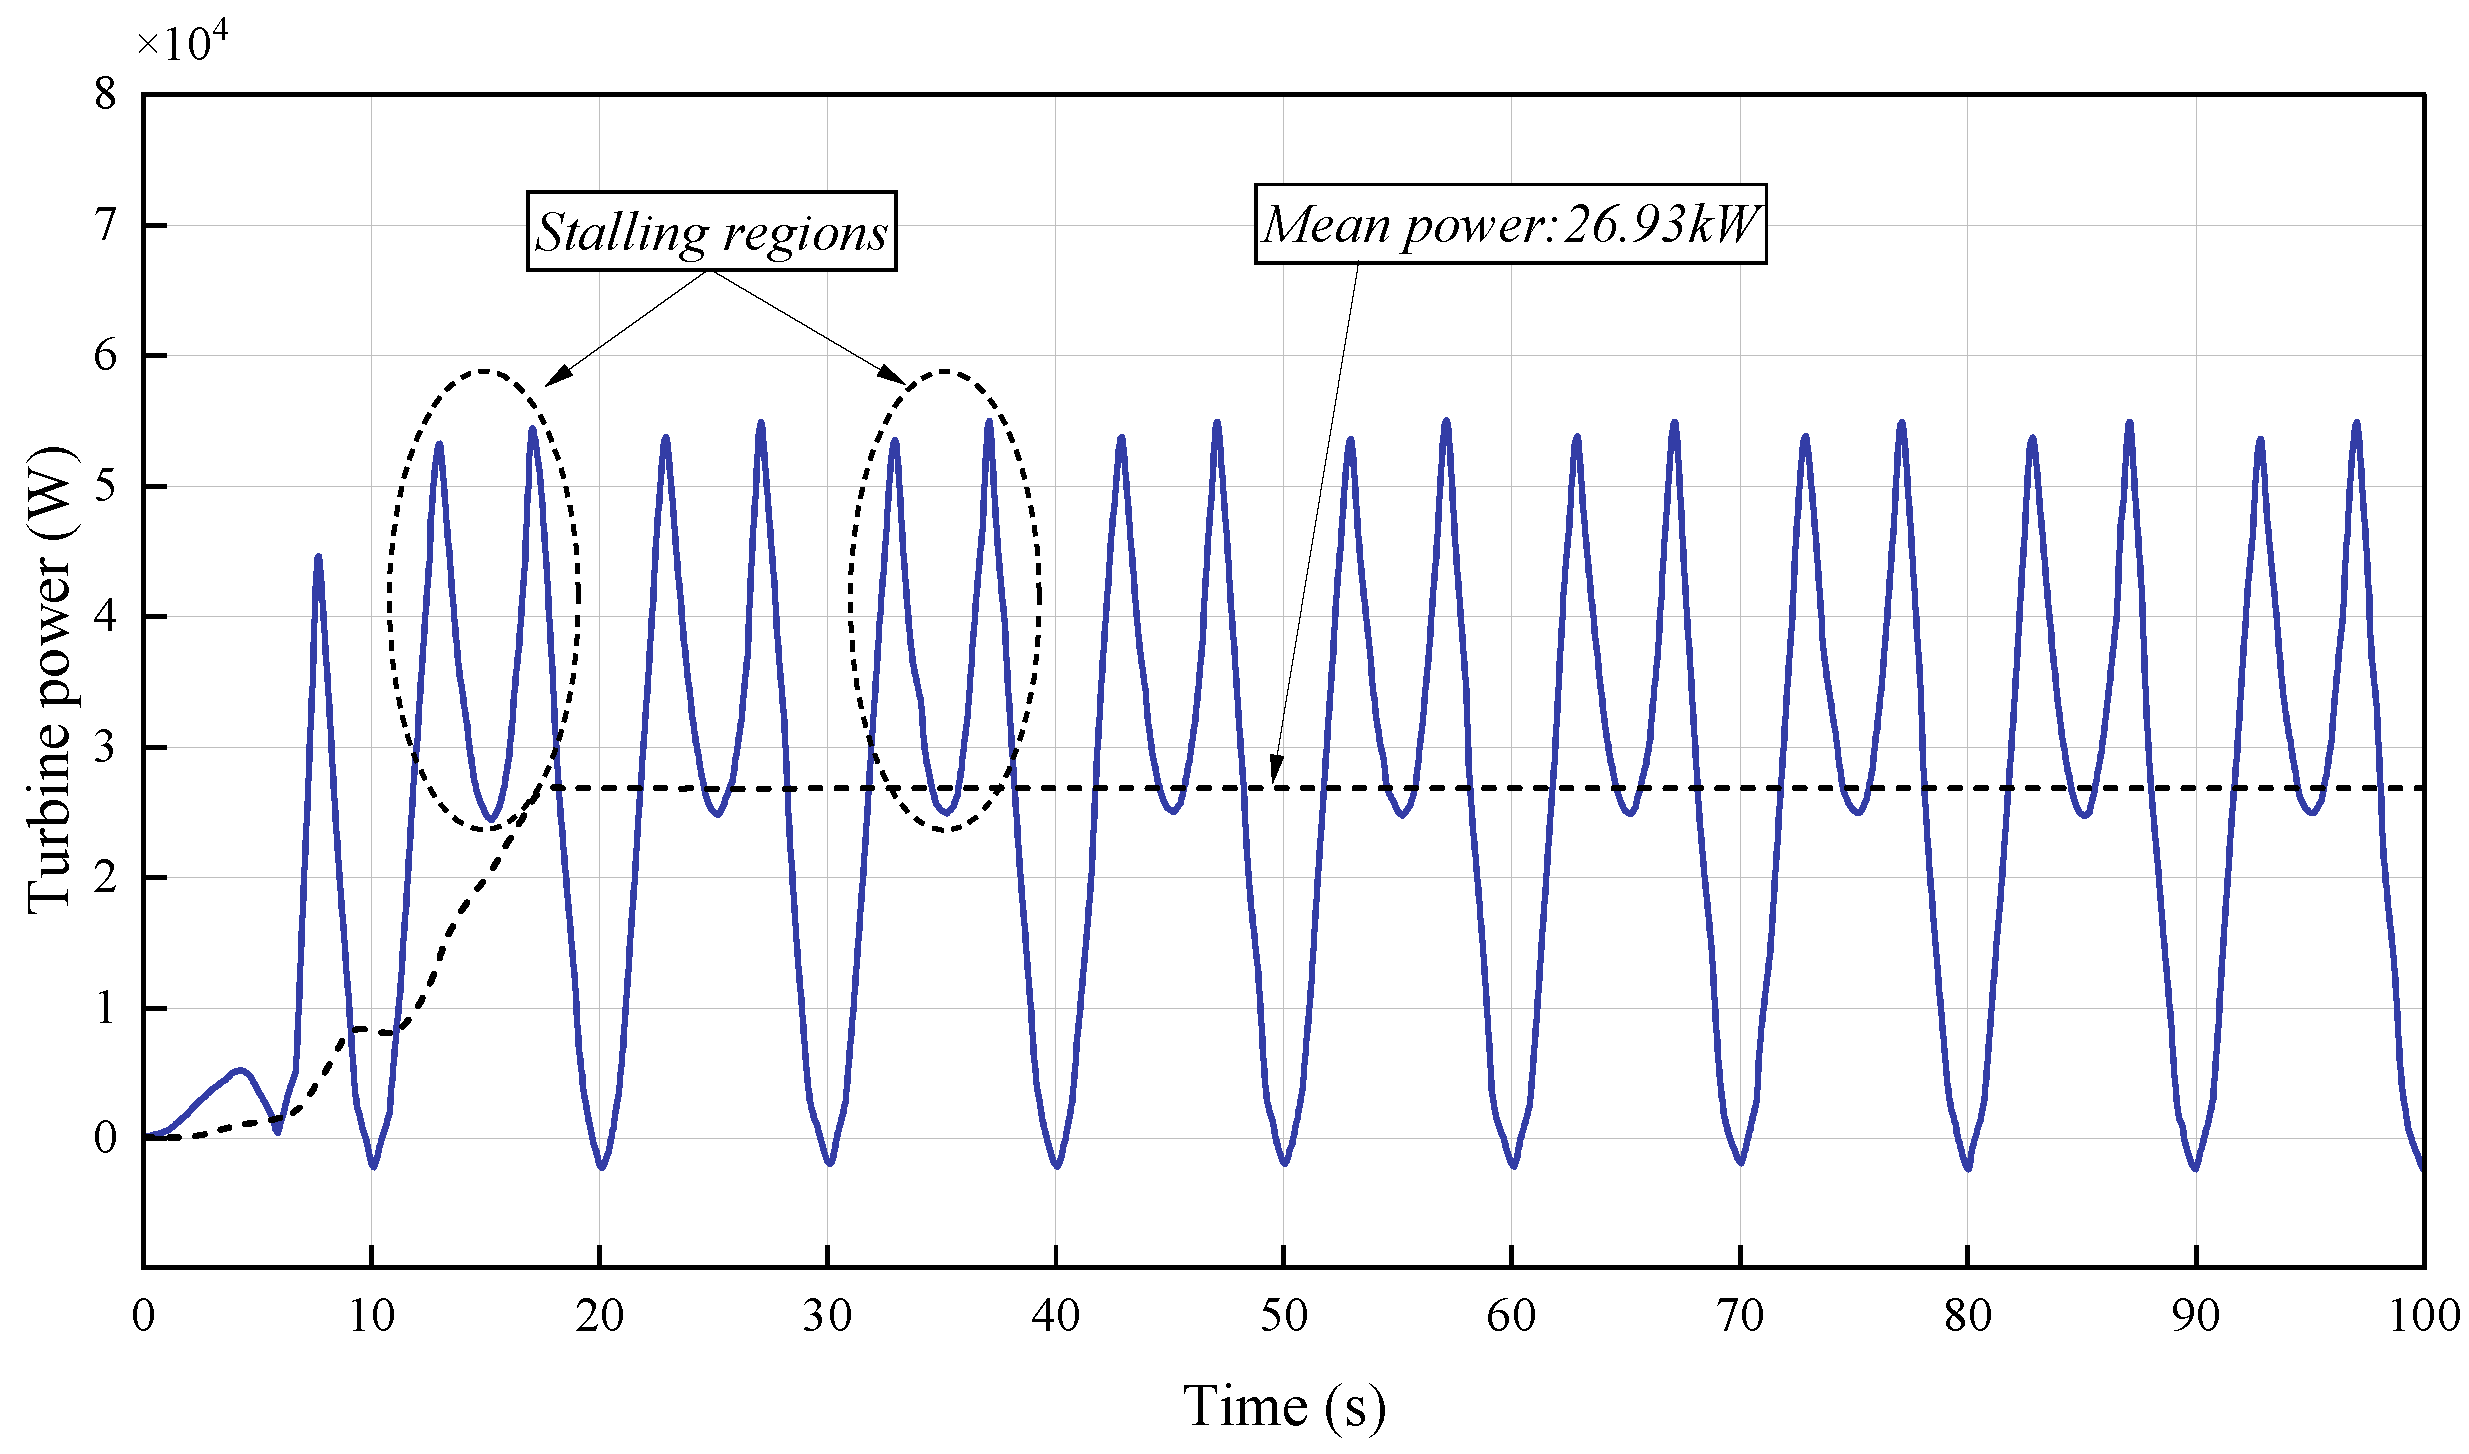
Figure 55 displays the power performance results of a peer reference model, which includes explicit labeling of “stalling regions” and a mean power output of 26.93 kW for quantitative benchmarking. A systematic comparison of these two figures reveals robust consistency in both key physical phenomena and transient power dynamics, thereby validating the proposed model’s fidelity, reliability, and engineering reference value.
First, both models uniformly capture and characterize the core turbine stall phenomena—a fundamental operational feature of turbomachinery systems driven by flow separation effects. In
Figure 54, the proposed model exhibits clear stall-induced power dips (consistent with the “stalling regions” labeled in
Figure 55), where power output transiently deviates from steady-state levels due to reduced turbine aerodynamic efficiency during stall. This alignment confirms that the proposed model accurately replicates the physical mechanism of stall-power coupling, which is consistent with the validated behavior of the reference model.
Quantitatively, although absolute power values are not fully labeled in
Figure 54, the temporal distribution of power fluctuations (e.g., the duration of stall events, the frequency of power cycles, and the magnitude of stall-related power deviations relative to baseline levels) in the proposed model’s curve shows strong dynamic consistency with the reference model. Specifically, the reference model’s reported mean power of 26.93 kW provides a quantitative anchor, and the proposed model’s power variation range (relative to the time axis) aligns with this baseline—indicating no systemic bias in the proposed model’s power prediction.
Furthermore, both models exhibit synchronized stall event timing with respect to power dynamics: stall initiation in both curves correlates with the onset of power reduction, and stall recovery corresponds to power rebound. This synchronization reflects the proposed model’s accurate reproduction of transient turbomachinery responses, a critical indicator of its ability to mimic real-world system behavior as validated by the reference model.
In conclusion, the consistency between the proposed model’s power profile (
Figure 54) and the reference model’s results (
Figure 55)—in terms of capturing stall-induced power characteristics, adhering to turbomachinery physics, and aligning in dynamic response patterns—fully verifies the proposed model’s reliability. This consistency also highlights its reference value for subsequent research on stall control optimization, turbine performance prediction, and practical engineering applications involving similar turbomachinery systems.
6. Conclusions
In this paper, the OWC device under the airflow control scheme is modeled for the stall phenomenon of Wells turbine and verification. The study subsequently explores the effects of different turbine and motor configurations on power generation while maintaining constant air velocity in the turbine duct, evaluating key parameters like rotor speed, , and output power.
Control the dimensionless below the critical stall threshold 0.3 significantly mitigates efficiency degradation. By optimizing the reference to 0.11, the system achieved peak power output, with a 51.2% increase in net electrical power from 2.4 kW to 3.63 kW under optimal three-stage turbine and dual-PMSG configurations. Dynamic speed regulation demonstrates a 124% enhancement in mechanical power extraction compared to uncontrolled scenarios, while maintaining rotor speed within a safe threshold (3000 rpm) to prevent overload.
Dynamic speed regulation analysis shows that reducing the maximum elevates generator speed progressively, and mechanical constraints set a critical speed ceiling. Exceeding this ceiling risks generator overload, higher failure susceptibility, and accelerates component degradation, requiring speed-limiting control. Comparative tests under peak power conditions where = 0.11 and multistage power output is maximum reveal the following: Without speed limits, stabilizes at 0.11, generator speed has no upper bound, turbine and electromagnetic torques are smaller, three-phase current is larger, DC bus voltage fluctuates more, pressure drop is greater, and turbine power is higher. With speed limits, rises after short stabilization at 0.11, generator speed is constrained, torques are larger, current is smaller, voltage is stabler, pressure drop is lower, and turbine power is reduced. Additionally, average generator power is notably higher than grid-connected average power.
Parametric analyses under irregular wave conditions (JONSWAP spectrum) confirm the robustness of the control strategy, stabilizing at subcritical values 0.14–0.30 and improving pressure drop management. The integration of machine-side and grid-side control loops ensure DC-link voltage stability (±0.2% fluctuation) and reduce torque ripple amplitude by 47.6%.
