Article

Diversity and Activity of Bacterioplankton in Shallow Lakes During Cyanobacterial Blooms

Department of Microbiology and Immunobiology, Faculty of Biological Sciences, Kazimierz Wielki University, Powstańców Wielkopolskich 10, 85-090 Bydgoszcz, Poland
*
Author to whom correspondence should be addressed.
Water 2025, 17(23), 3376; https://doi.org/10.3390/w17233376
Submission received: 4 November 2025 / Revised: 18 November 2025 / Accepted: 25 November 2025 / Published: 26 November 2025
(This article belongs to the Section Biodiversity and Functionality of Aquatic Ecosystems)

Abstract

One of the global issues concerning aquatic environments is the increasing frequency of cyanobacterial blooms. These blooms can lead to oxygen depletion and the release of potent toxins, potentially disrupting the bacterial communities responsible for organic matter transformation and mineralization. This study aimed to examine the structural and functional diversity of bacterioplankton in three eutrophic lakes during periods of cyanobacterial bloom. The microbial communities were analyzed using high-throughput sequencing of the 16S rRNA gene, and the abundance and activity of bacterioplankton were assessed with fluorescent markers. The findings revealed that dead bacterial cells predominated in the water samples (61.16%). Taxonomic profiling identified Cyanobacteria (45.38%), Proteobacteria (20.99%), Bacteroidetes (11.37%), Actinobacteria (8.08%), and Verrucomicrobia (4.04%) as the dominant phyla. Additionally, the structure of the bacterial communities (β-diversity) showed significant variation across the lakes, but this variation did not correlate with seasonal changes. No marked effect of abiotic factors on the structural or functional diversity of the bacterioplankton was observed. These results suggest that, despite the presence of cyanobacterial dominance, microbial community structure is more closely tied to the type of lake rather than seasonal or abiotic factors. Further studies are needed to better understand the factors driving these community patterns.

Graphical Abstract

1. Introduction

Surface waters, especially lakes, constitute an important element of the natural environment. However, since the last glacial period the number of lakes has significantly decreased due to several reasons: their shallowing, getting overgrown, or getting filled with material from land. The term ‘shallow lake’ has not yet been clearly defined but it is commonly assumed that these are waterbodies with frequent mixing of suspended sediments and without thermal stratification [1,2,3]. Lake shallowing is a natural process connected with lake aging.
Lakes provide natural habitat for many organisms. Bacteria, whose importance in freshwater environments was first described in the 1940s [4], play a crucial role in the recycling of nutrients, mineralization of organic matter, and regulation of water quality [5,6,7,8]. However, the diversity and abundance of bacterioplankton depend on environmental factors, their access to organic compounds, and water quality [5]. Organic pollutants that penetrate into the bacterial cytoplasmic membrane affect its physiological functions and damage the cell. Therefore, membrane condition is a determinant of the physiological state and metabolic activity of bacterial cells [9,10]. Some bacteria, unable to grow in laboratory (called VBNC, viable but nonculturable), are characterized by a low level of metabolic activity caused by stress and adverse environmental conditions. As part of their adaptive strategy [11], VBNC cells can “hibernate” or remain dormant until environmental conditions become more favorable [12,13]. That is why standard plating techniques, because of their limitations, are being increasingly replaced by fluorescent techniques, which facilitate a comprehensive assessment of the physiological state of bacterial cells. Diversity is an equally important parameter determining the condition of an ecosystem. Bacterioplankton is susceptible to environmental fluctuations. Climate change and lake eutrophication resulting from the accumulation of biogenic elements lead to cyanobacterial blooms. Because of their toxicity, Cyanobacteria may cause the extinction of other groups of organisms and impair the functioning of waterbodies. Changes in the diversity of bacterial communities in lakes disturb the ecological balance of the entire ecosystem. The impact of cyanobacterial blooms on the structural diversity of bacterioplankton is an important topic studied in various parts of the world [14]; however, in Poland, research in this area is still limited.
The study was aimed at assessing the structural diversity of bacterioplankton during cyanobacterial blooms in three shallow lakes located in northern Poland.

2. Materials and Methods

2.1. Description of the Lakes

The research was conducted on three shallow eutrophic lakes located in northern Poland. On sampling days all lakes experienced cyanobacterial blooms. Lake characteristics are provided in Table 1.

2.2. Sampling Methods

Samples were collected from July to September 2021 at monthly intervals. Bacterioplankton samples for microbiological analysis were collected from the littoral zone using a 1 L Patalas sampler. Water samples for the assessment of bacterioplankton abundance were preserved with formaldehyde. Samples for the assessment of bacterioplankton activity and genetic analysis were not preserved. The collected material was immediately transported in isothermal containers to the laboratory. Selected physicochemical parameters of water including temperature, pH, oxygen concentration and electrolytic conductivity were measured with the use of Elmetron multi-parameter probe (Elmetron, Zabrze, Poland). Water transparency in lakes was measured with a Secchi disc. For chlorophyll a concentration water was filtered through a Whatman GF/C glass fiber filter, extracted with ethanol, measured using a BioSens V-5600 UV Spectrophotometer (BioSens, Jeonju-si, Republic of Korea), and calculated according to the Nusch method [15]. In each investigated lake, water quality index was determined as a modified Trophic State Index TSI [16], based on environmental parameters such as water transparency (TSI SD) and chlorophyll a concentration (TSI Chl a). Measurement results can be found in Supplementary Materials (Table S1). The morphometric data of the lakes are taken from the authors’ previous studies [17].

2.3. Physiological Properties of Bacterioplankton Populations

Bacterial abundance was determined using fluorescent staining with DAPI fluorochrome (4.6-diamidino-2-phenyl-indole). The amount of 1 mL of each sample was transferred to sterile black Eppendorf tubes and labeled with DAPI (0.04 mL, the concentration 50 µg DAPI/mL). Samples were incubated for 15 min in the dark at room temperature and filtered through 0.2 μm black membrane filters, which were then rinsed with 80% ethanol and sterile water and placed on glass slides. The slides were promptly examined using the immersion method under a Motic epifluorescence microscope (model BA410E), with an excitation wavelength of 375 nm and emission wavelength of 460 nm.
Fluorescent staining based on LIVE/DEAD® BacLight™ Bacterial Viability Kit (Thermo Fisher Scientific, Waltham, MA, USA) was used to determine the integrity of the cytoplasmic membrane of the bacterial cells. The amount of 1 mL of each sample was transferred to sterile, black Eppendorf tubes and stained with a set of fluorescent dyes: LIVE/DEAD (0.15 mL propidium iodide (PI) and SYTO®9 (Thermo Fisher Scientific (Molecular Probes), Waltham, MA, USA) in a 1:1 ratio. The samples were incubated for 15 min in the dark at room temperature and filtered through 0.2 μm black membrane filters, rinsed with sterile water and placed on glass slides. Using the immersion technique, the slides were analysed immediately under a Motic BA410E epifluorescence microscope. The following excitation filters were used: Ex 540/Em 605 for propidium iodide and Ex 480/Em 535 for SYTO®9 fluorochrome.
A fluorescent staining technique using the fluorochrome CTC (5-Cyano-2.3-di-(p-tolyl)tetrazolium chloride) was applied to determine the activity of intracellular enzymes in bacterioplankton cells. The amount of 1 mL of each water sample was transferred to black sterile Eppendorf tubes and labeled with a fluorescent CTC dye (0.1 mL of CTC solution). Incubation of the samples was carried out in the dark for 4 h at the temperature of the aquatic habitat, with agitation on a rotary shaker set to approximately 10 rpm. After incubation, 37% formalin solution was added, achieving a final concentration of approximately 1.70%. Samples were filtered through 0.2 μm black membrane filters, then washed with sterile water, dried and placed on glass slides. Using the immersion technique, the slides were analysed immediately under a Motic BA410E epifluorescence microscope, filter Ex 450 nm/Em 605 nm.
Cell counting and archiving were performed using Motic Images Advanced 3.2 software after completing the analysis described above.

2.4. Sample Preparation and Bacterial DNA Extraction

In order to isolate bacterial DNA, water samples of 500 mL were filtered through sterile membrane filters with a pore size of 0.2 μm immediately after delivery to the laboratory. In order to avoid DNA contamination from other sources, a blank test was also performed by filtering the water used for DNA isolation [18]. Samples prepared in this way were frozen until further analyses. Bacterial DNA extracted from the filter, as well as from the blank sample, was isolated using the DNeasy® PowerWater® Kit (Qiagen, Hilden, Germany), following established protocols from the literature [19]. The quality of the isolated DNA was checked using TapeSatation 2200 using gDNA gel tapes (Agilent, Santa Clara, CA, USA). Using a NanoVue spectrometer, the concentration of the extracted DNA was measured.

2.5. PCR Amplification and Sequencing

Amplification of the V3-V4 region of the bacterial 16S rRNA gene was performed based on the 16S Metagenomic Sequencing Library Preparation protocol: Preparing 16S Ribosomal RNA Gene Amplicons for the Illumina MiSeq System. For this purpose, 16S Amplicon PCR Forward Primer (5′ TCGTCGGCAGCGTCAGATGTGTATAAGAGACAGCCTACGGGNGGCWGCAG) and 16S Amplicon PCR Reverse Primer (5′ GTCTCGTGGGCTCGGAGATGTGTATAAGAGACAGGACTACHVGGGTATCTAATC) were used. The metagenomic libraries were separated using an Agilent Tape Station 2200 with a D1000 Screen Tape Assay. The concentration of the libraries was assessed using the fluorimetric method with the Qubit 3.0 dsDNA BR Assay Kit (ThermoFisher Scientific, Waltham, MA, USA). NGS sequencing was carried out using the MiSeq paired-end Reagent Kit v2, with 2 × 250 bp reads on an Illumina MiSeq instrument.

2.6. Bioinformatics and Statistical Analysis

The sequencing reads were further analyzed using the QIIME 2 2021.11 bioinformatics platform [20]. The quality of the reads was assessed using the FastQC application. The reads were denoised to remove chimeras and reads containing unidentified nucleotides. Details can be found in the Supplementary Materials (Table S3). The obtained OTUs (Operational Taxonomic Unit) were classified using the SILVA 132 database. Statistical analysis was conducted using Statistica 13.3 software. The Shapiro–Wilk test was applied to verify the normality of the data distribution in the groups analyzed. Differences between the data groups were then assessed using a one-way ANOVA for main effects or the non-parametric Kruskal–Wallis rank test. Post hoc tests were also performed to determine intra-group differences. The relationships between the studied groups of data were determined on the basis of Spearman’s rank correlation coefficient. The rarefaction curves were constructed in the phyloseq package based on calculations made in R ver. 4.03. The graphical results of the analysis can be found in the Supplementary Materials (Figure S1). The same tool was used to estimate biodiversity indices. Using the ImageGP data visualization platform, principal component analysis (PCoA) and non-parametric multivariate analysis of variance (NP MANOVA) were performed [21]. Statistical tests were performed at a significance level of p ≤ 0.05.

3. Results

The lakes studied exhibited low water transparency, physicochemical conditions characteristic of alkaline pH waterbodies, and electrolytic conductivity commonly found in eutrophic waters. The results of the tests of physical, chemical and biological parameters of water can be found in Supplementary Materials (Table S1).
Bacterial abundance is one of the key features of bacterial populations in natural environments. The highest average abundance of planktonic bacteria was found in forest lakes L-I (6.70 cells 105 mL−1) and L-II (6.59 cells 105 mL−1). In contrast, lake L-III, affected by anthropogenic influence, showed lower average numbers, specifically (4.32 cells 105 mL−1) (Figure 1). The abundance of planktonic bacteria in the studied lakes ranged from 2.5 cells 105 mL−1 in August at L-III to 11.27 cells 105 mL−1 at L-II in the same month. Differences in bacterioplankton population dynamics between the studied lakes were recorded in August and September. In July the abundance of planktonic bacteria was similar at all sampling sites.
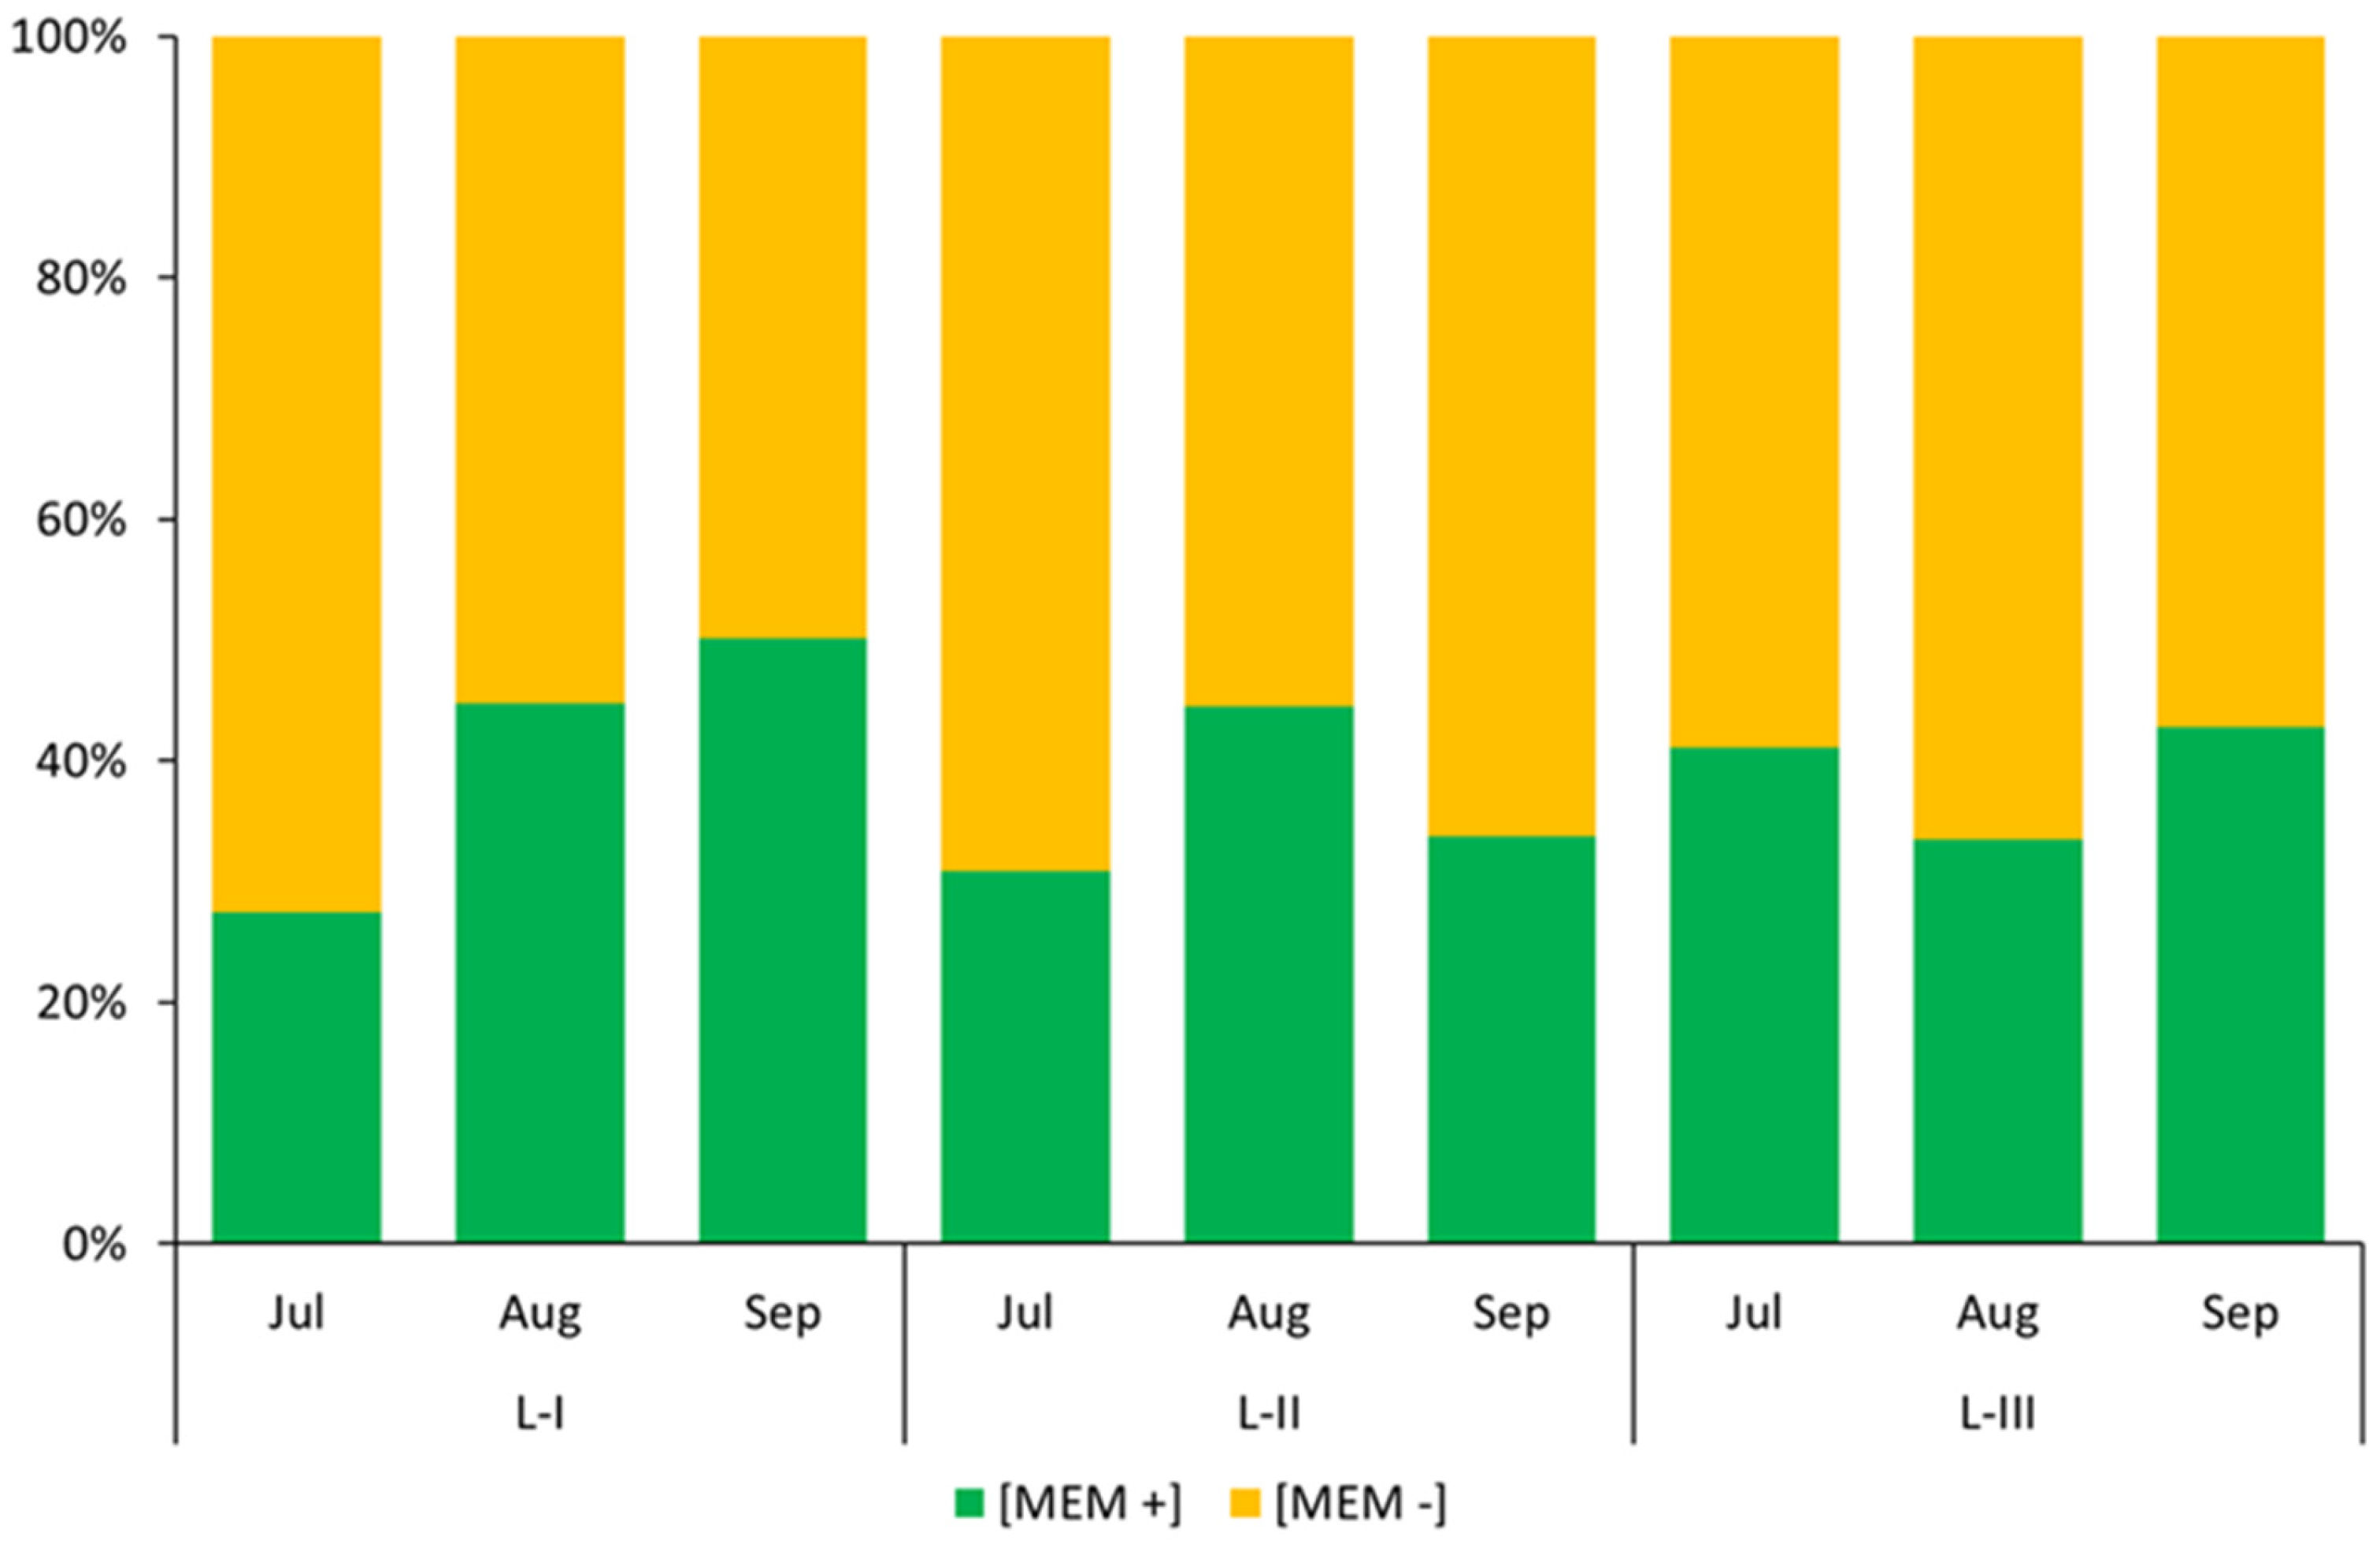
The fraction of dead bacterial cells dominated in the collected water samples. This trend was particularly strong in July, where cells with damaged cytoplasmic membrane constituted on average over 66% of the planktonic bacteria. In subsequent months, an increase in the number of cells with an integral cytoplasmic membrane was recorded at L-I. At the remaining sites this trend was not observed (Figure 2).
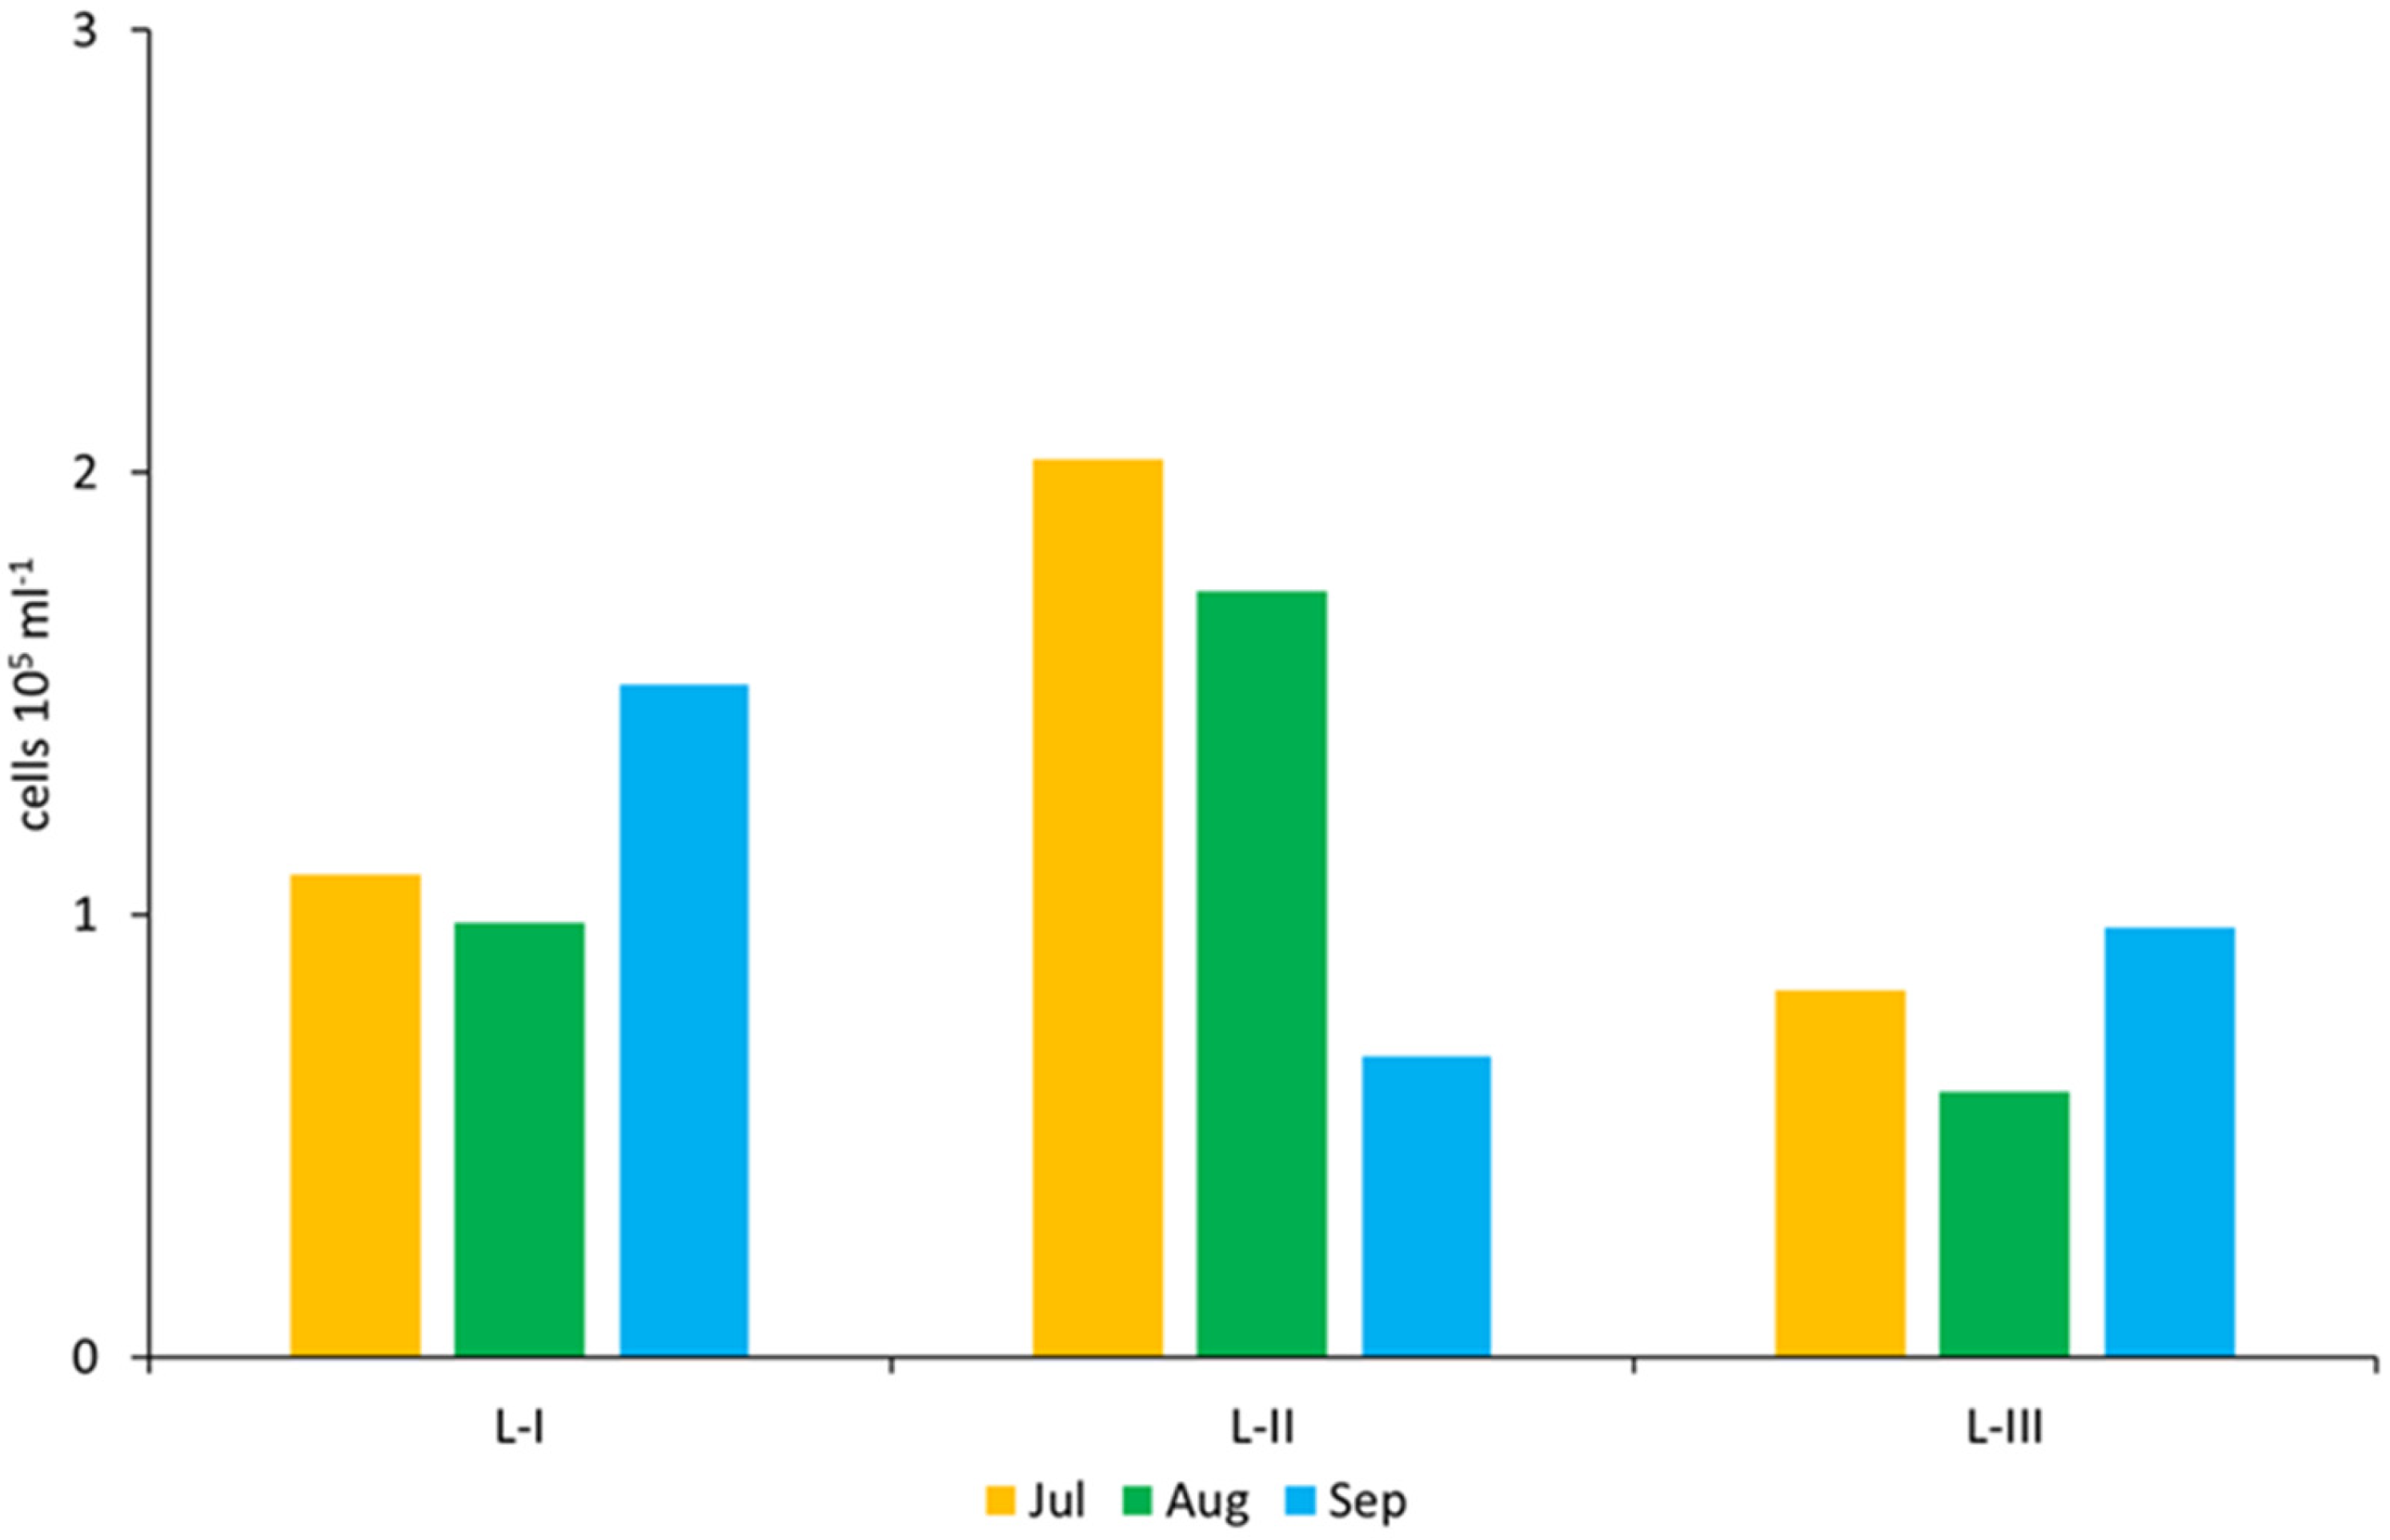
At the same time the abundance of metabolically active cells determined on the basis of CTC reduction ranged from 2.03 cells 105 mL−1 in July at L-II to 0.6 cells 105 mL−1 in August at L-III. A decrease in the number of enzymatically active cells at L-II was noted as the months progressed. No similar relationships were observed for the remaining research sites (Figure 3).
Statistical analysis showed a diverse influence of the location and sampling time on the measured microbiological parameters. The lake type had a significant impact on the differences in the abundance of planktonic bacteria. The largest intra-group differences (p < 0.001) were recorded between L-I and L-III. However, no significant differences were noted between the sampling months. Similarly, the abundance of metabolically active cells was connected with the sampling site. On the other hand, the size of fractions of cells with an integral and damaged cell membrane depended primarily on the sampling month. In both cases, the largest statistically significant differences were noted between July and August and between August and September (p < 0.0001). Statistical differences between the analyzed datasets based on post hoc tests are presented in Supplementary Materials Table S2.
Table 2 presents the indicators of bacterioplankton biodiversity in the studied lakes, derived from the water metagenome analysis. The highest average number of OTUs was recorded in July, the lowest, in August. However, the analysis of variance did not show a statistically significant impact of the location or sampling season on biodiversity expressed in the measured indices (p > 0.05).
The relationships between selected environmental factors and bacterioplankton characteristics are presented in Figure 4. No significant correlation between the measured characteristics of the bacterioplankton population and the physicochemical parameters of water was recorded. Similarly, no significant correlation between biological factors was noted. The diversity of the taxonomic structure (number of OTUs) and the relative abundance of the dominant Cyanobacterial taxa in individual samples did not significantly affect the size and activity of the bacterioplankton population. A statistically significant correlation was noted only for cells with an integral cell membrane and the total abundance of bacteria (r = 0.63).
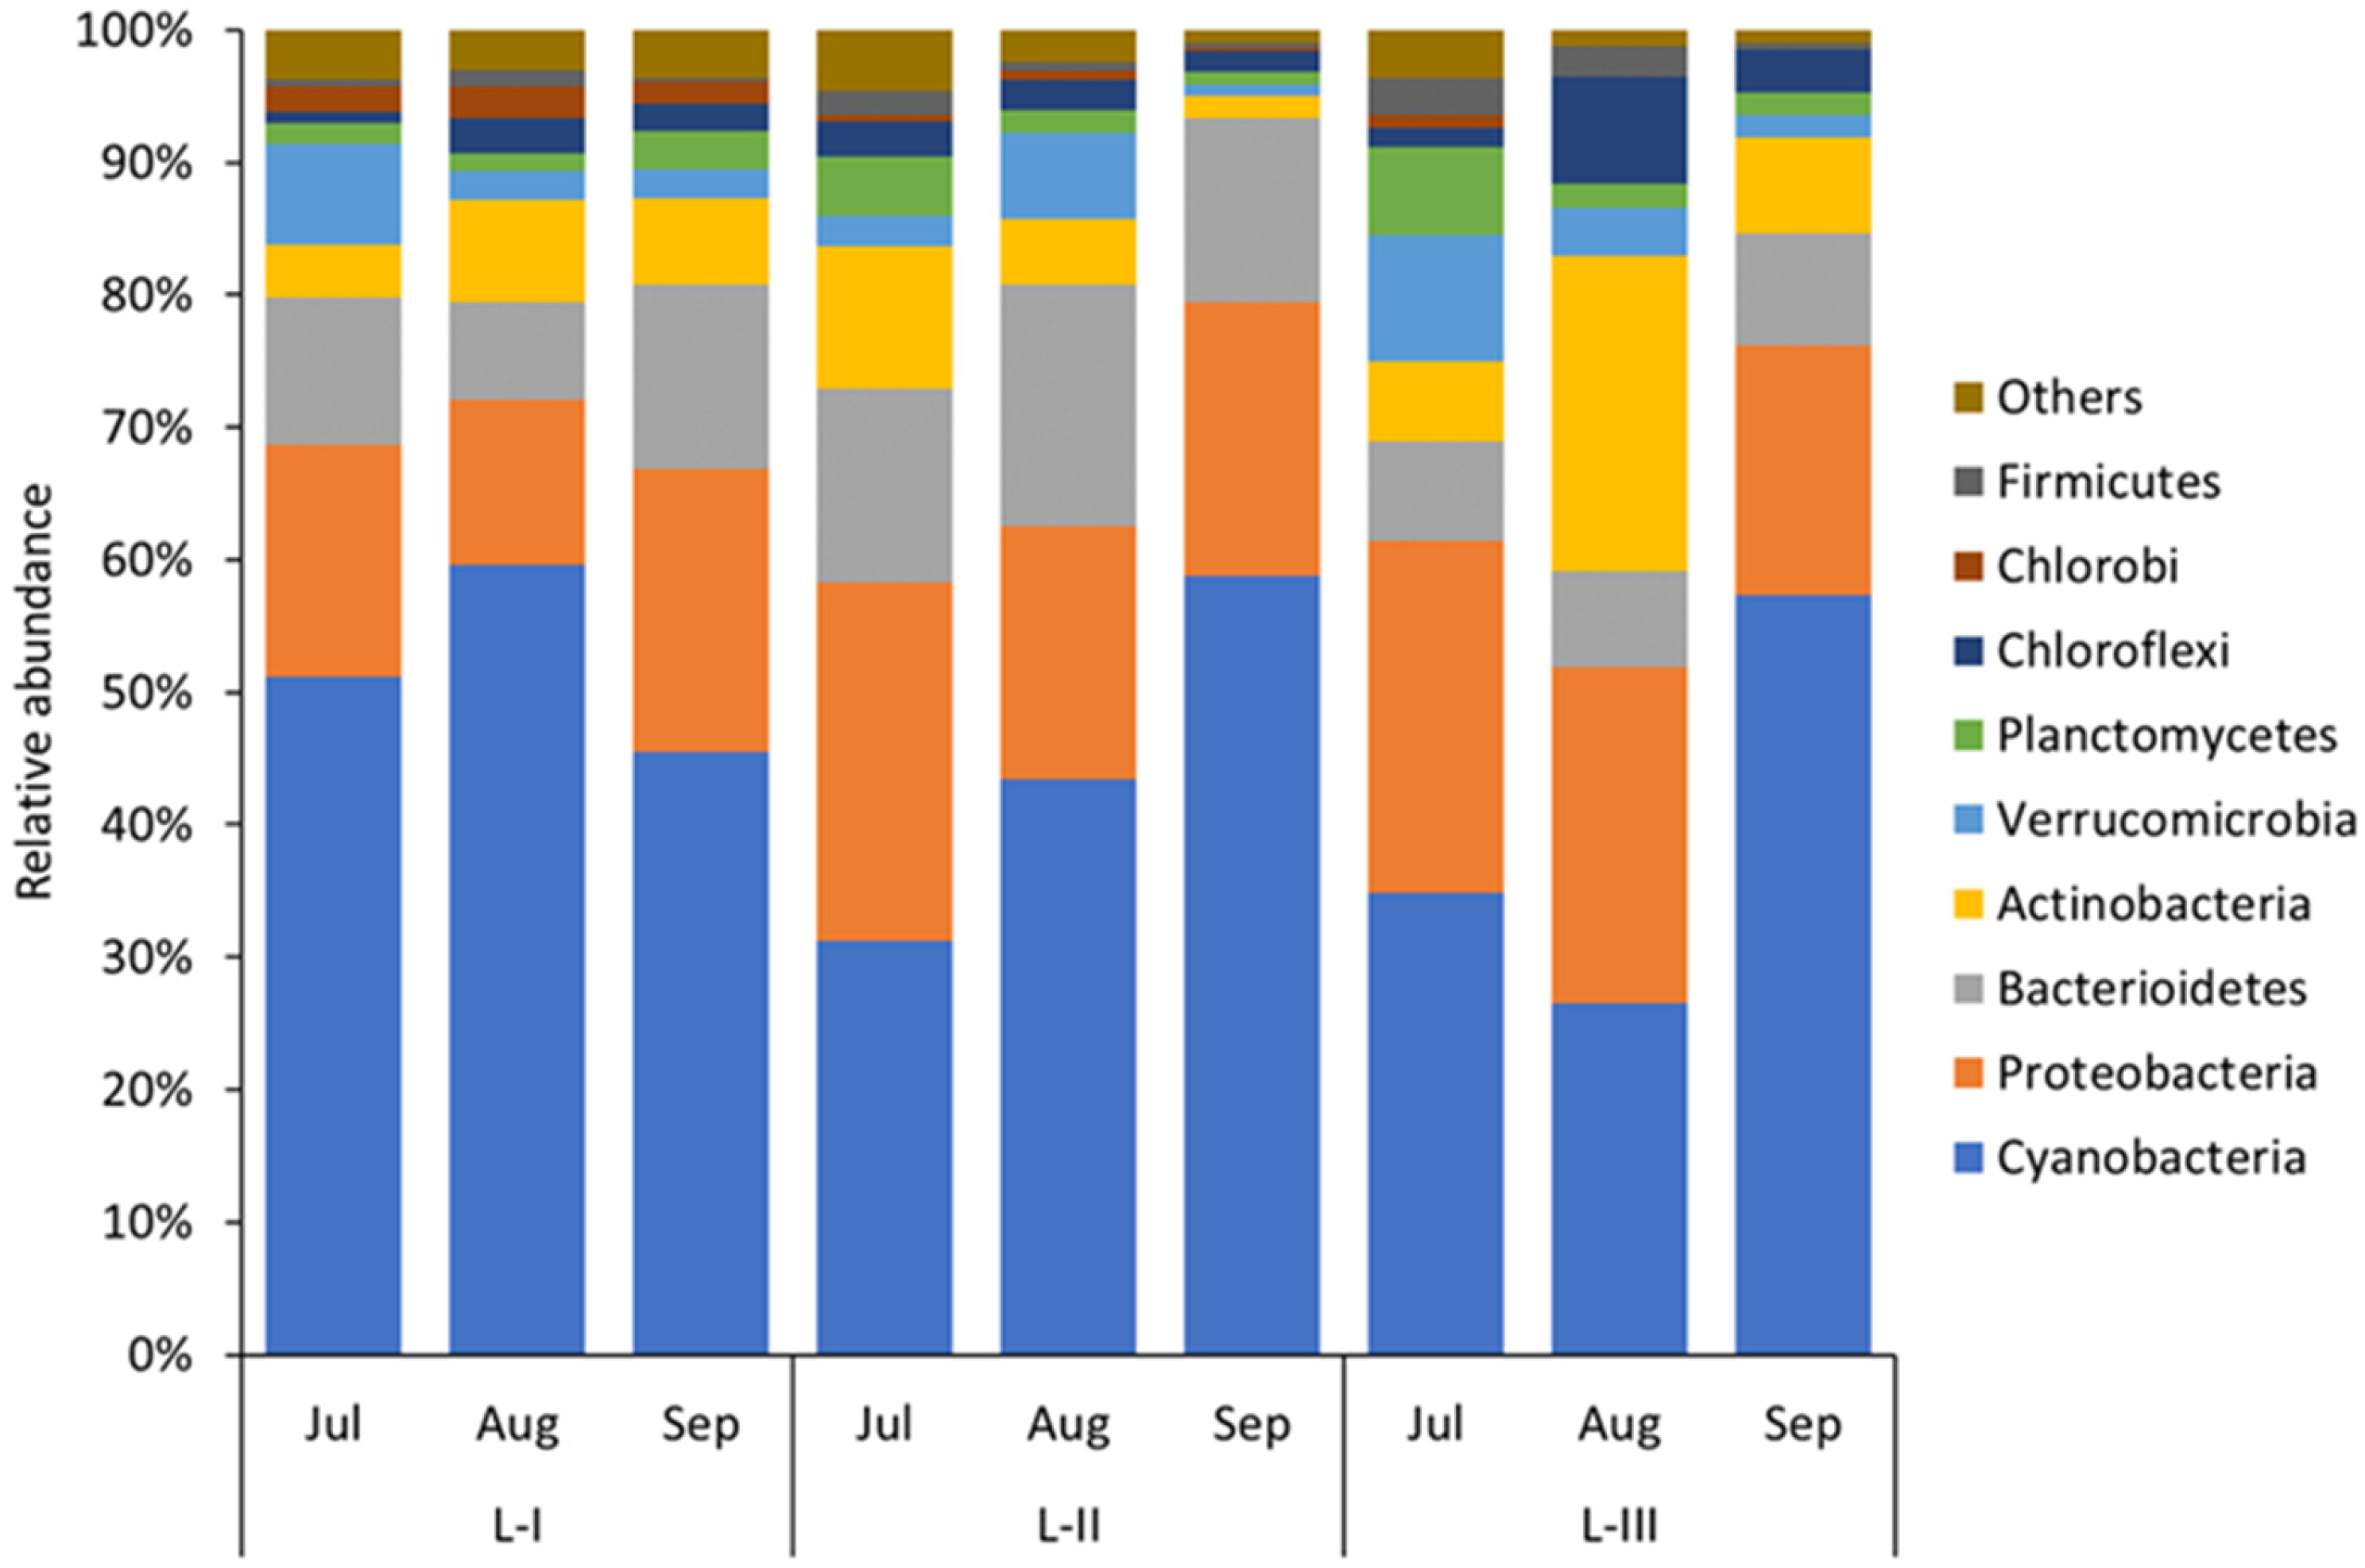
Water metagenomic analysis indicated that Cyanobacteria dominated among the bacterioplankton of the studied lakes, almost the same abundance at L-I in August (60%), followed by 59% at L-II and 57% at L-III in September. The remaining bacteria belonged to Proteobacteria, Bacterioidetes, Actinobacteria and Verrucomicrobia, respectively (Figure 5). The analysis of the dominant phyla contribution showed a significant inverse correlation between Cyanobacteria and Proteobacteria (r = −0.84, p < 0.01), Cyanobacteria and Actinobacteria (r = −0.68, p < 0.05) and Cyanobacteria and Firmicutes (r =−0.72, p < 0.05).
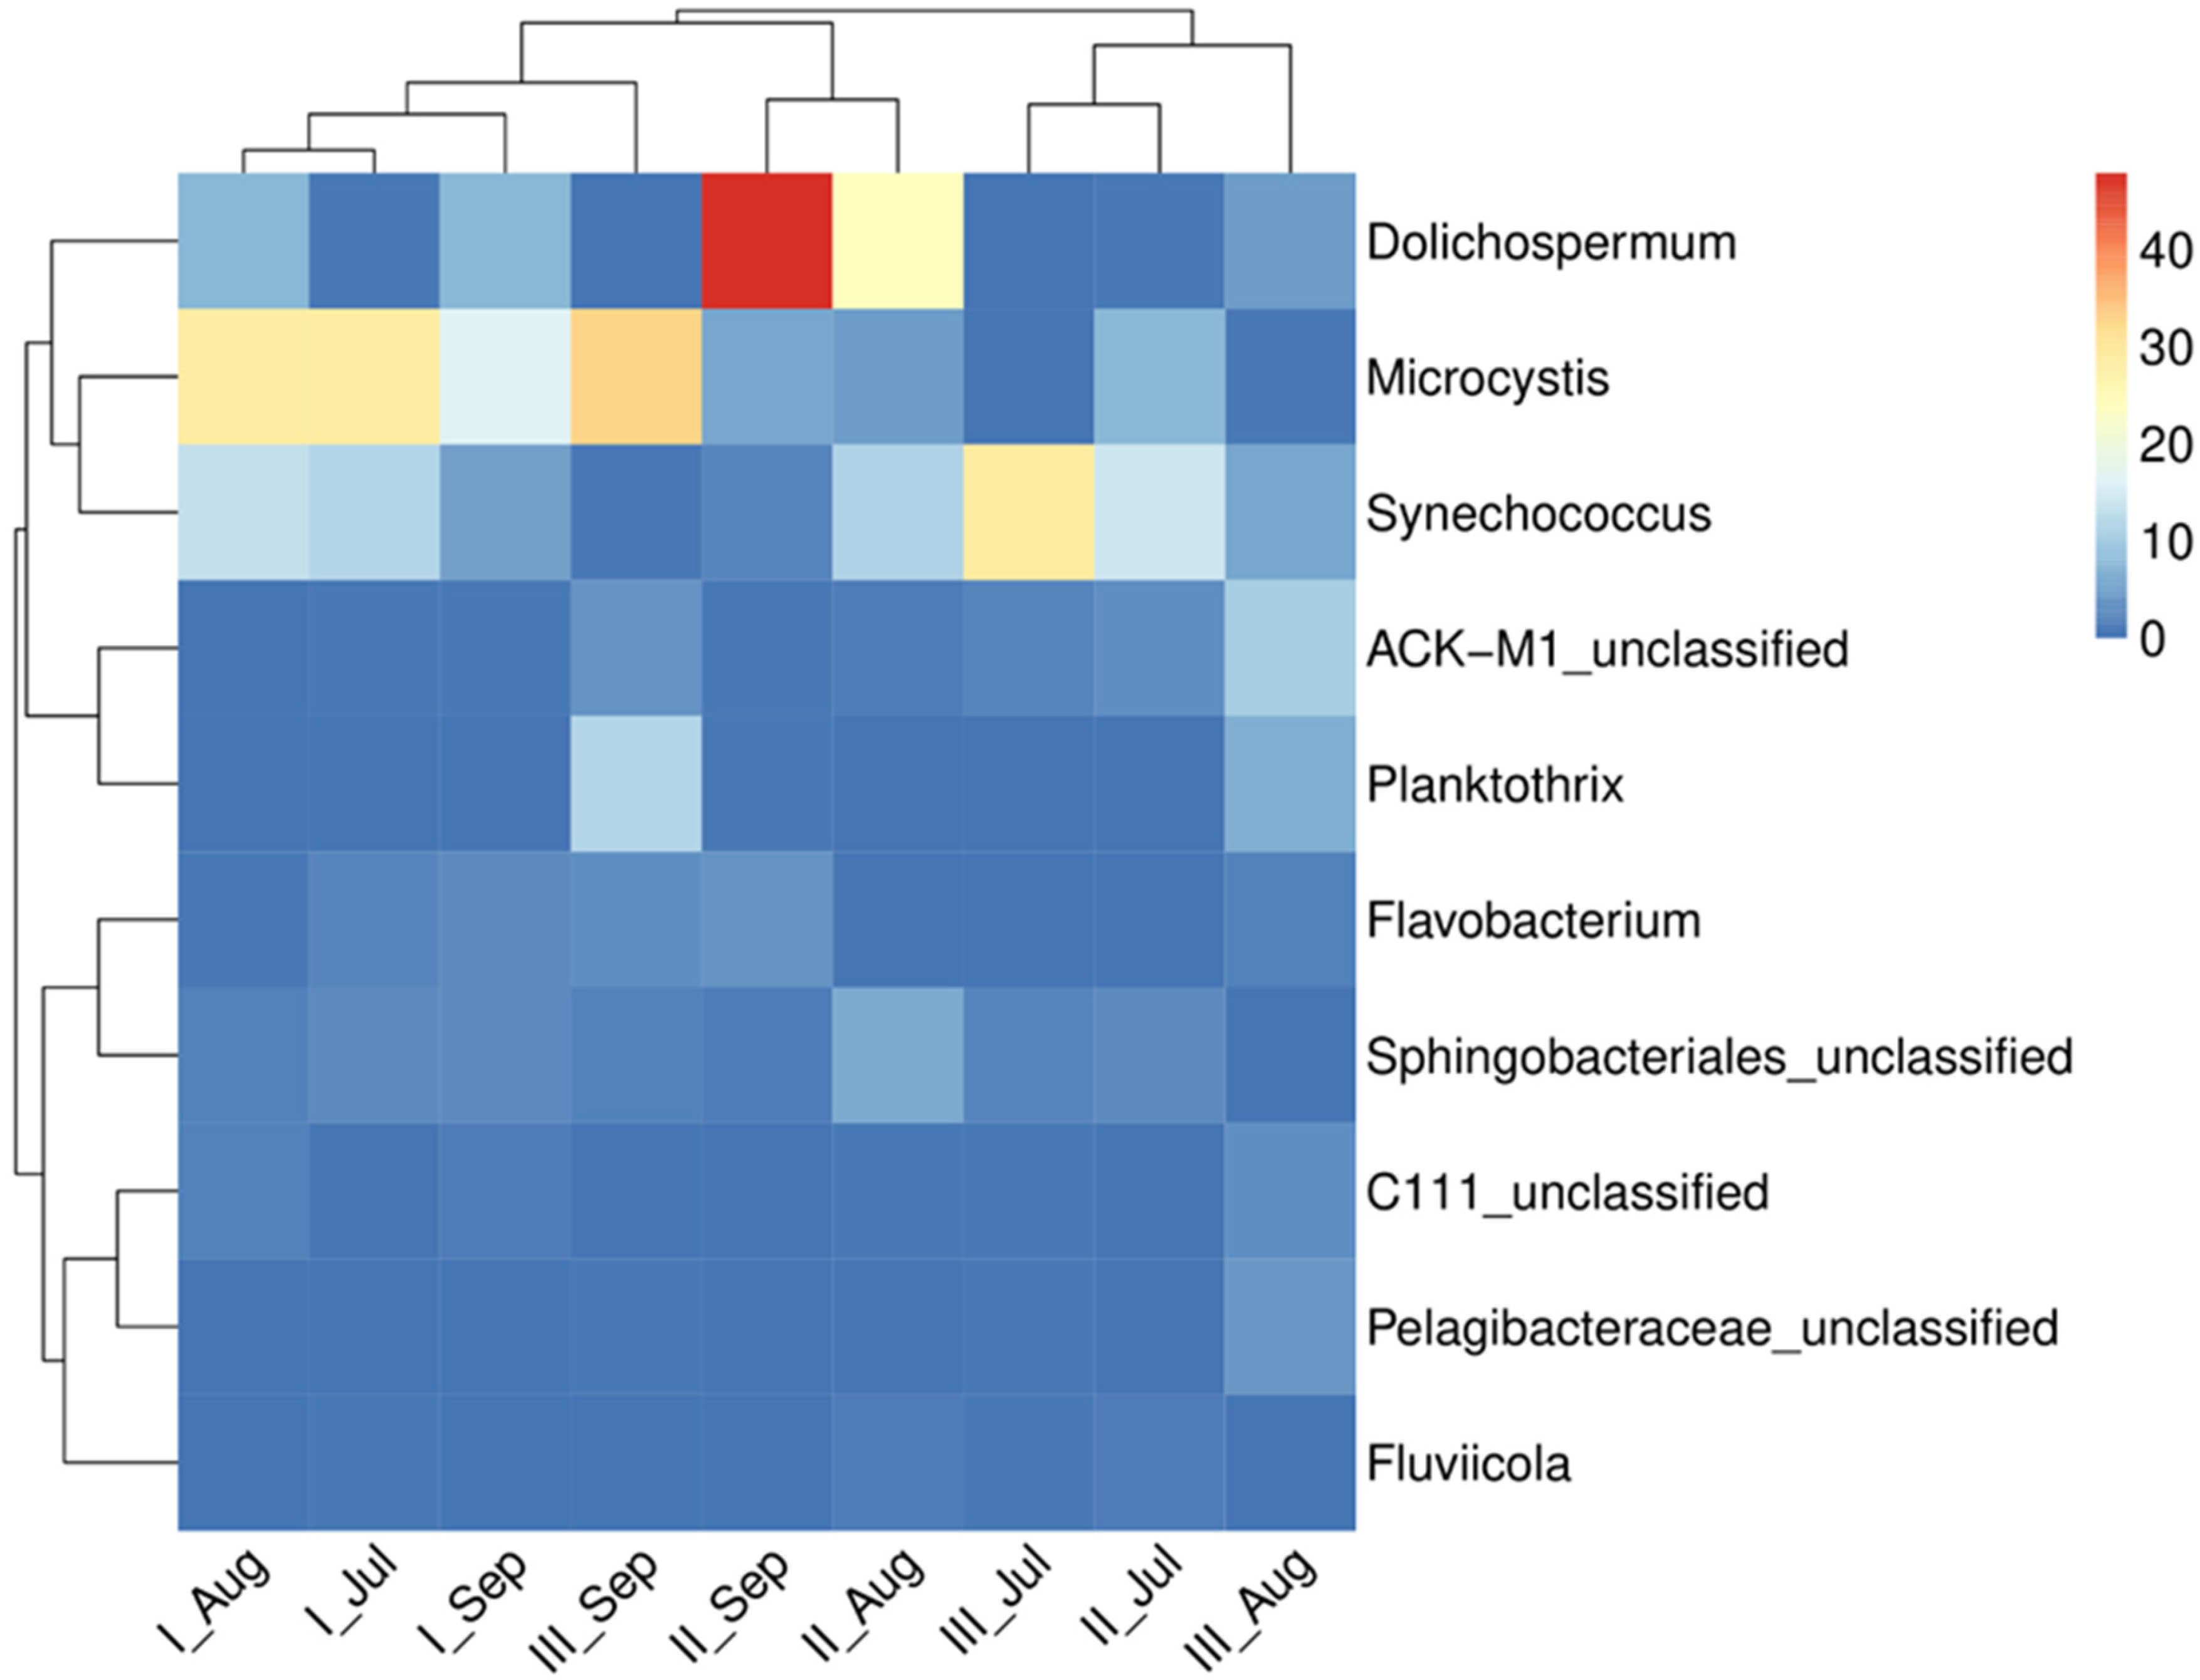
The relative abundance of 10 most common genera of planktonic bacteria based on OTU counts in the studied lakes is shown in Figure 6. Dolichospermum and Microcystis dominated in all studied waterbodies. A rapid growth of Dolichospermum was observed at L-I, where it constituted 24% of the microbial community in August, and 48%, in September. At the same time Microcystis dominated at L-III, constituting 33% of the bacterioplankton in September. At L-III, at the beginning of the research period (July), the predominance of Synechococcus was observed, with 29% share in the planktonic cyanobacterial community. In September Microcystis (33%) was dominant in this lake. The results indicate a considerable share of Synechococcus in July and August, (11–29%), except for L-III, where a decrease in Synechococcus contribution was recorded in August (6%).
The bacterioplankton community of the studied lakes (L-I, L-II, L-III) was dominated by Cyanobacteria, while the share of heterotrophic bacteria was minimal (approx. 1–10%). At site L-I, where a minor increase in Synechococcus abundance in July–August and a major increase in Microcystis abundance from July to September were observed, bacterioplankton development was inhibited, with the share of individual heterotrophic bacteria being only 1–2%. At site L-II, a minor increase in Synechococcus abundance was observed in July, followed by a major increase in Dolichospermum abundance in August–September. The picocyanobacterium Synechococcus was associated with the growth of heterotrophic bacteria Sphingobacteriales, the share of which was 3–6%. At site L-III, with an increase in Synechococcus abundance in July–August followed by an increase in Microcystis abundance in September, the share of heterotrophic bacteria was 2–10%. In August, when Synechococcus abundance decreased, an increased share of heterotrophic bacteria from the ACK-M1 family (10%), Pelagibacteraceae bacteria (4%), and C111 bacteria (3%) was observed.
Principal coordinate analysis (PCoA) revealed a strong correlation between the structure of bacterial communities (β-diversity) and the type of lake. Taxonomically, notable differences were observed between samples from the individual lakes (Figure 7A). Significant differences in the bacterioplankton structure, correlated with the type of aquatic ecosystem, were also confirmed by ADONIS test (p < 0.01). The taxonomic structure of the bacterioplankton population was not significantly dependent on the research season (Figure 7B).

4. Discussion

Heterotrophic bacteria are key microorganisms in aquatic environments, responsible for the functioning of these ecosystems [22,23]. Due to their high adaptability to a range of environmental conditions, they can be used as bioindicators. Another important bacterial community comprises Cyanobacteria, mainly associated with algal blooms. Summer mass occurrences of these microorganisms reduce the quality of water due to the production of toxins that have a negative effect on humans and animals. Cyanobacterial blooms are a serious global problem, caused mainly by anthropogenic activities and an increase in water temperature resulting from global warming [24]. Different microbial communities are associated with algal blooms [25]. The presence of heterotrophic bacteria may lead to the growth, reduction or even termination of the bloom [26,27,28]. Ocassionally, bacterioplankton exhibits algicidal activity [26,29]. However, despite comprehensive analyses, the relationships between heterotrophic bacteria and Cyanobacteria are not yet fully known and require further investigation [30,31,32,33,34]. It is obvious that the disruption of the functional structure of decomposers leads to the disruption of the ecological balance of the entire ecosystem, decreasing its natural and recreational values [35].
Abundance is a key feature of bacterial populations in natural environments. In this study, the greatest differences in the bacterioplankton dynamics between the studied waterbodies were recorded in August and September. Both the maximum and minimum abundances of planktonic heterotrophic bacteria were recorded in August. Higher values were recorded by Liu et al. [36] in Lake Zuohai in China, where the total abundance of heterotrophic bacteria ranged from nearly 5 cells 106 mL−1 to almost 19 cells 106 mL−1. The researchers observed that seasonal differences can have a significant impact on the structure of bacterial communities in the lake. In our studies, the quantitative structure of bacterioplankton depended on the type of the ecosystem, not seasonality, which is confirmed by the results of the analysis of variance.
One of the most reliable methods for determining bacterial viability in environmental water is LIVE/DEAD bacteria count [37]. In our studies, the fraction of dead bacterial cells dominated in the bacterioplankton. The share of live bacterial cells (with an intact cell membrane) increased as the months progressed (from 33% in July to 42% in September). Similar results were obtained by Perliński et al. [38] at Baltic beaches, where the share of live cells ranged from 31 to 53% in the total bacterial population while in the study of lake sediments by Haglund et al. [39] the share of live cells was approximately 60%. On the other hand, our results differed significantly from those obtained by Lew et al. [40]. The researcher indicated that an average share of cells with intact cell membrane did not exceed 16.5%. In the present study, the increase in the number of live heterotrophic bacterial cells resulted from an increase in an average abundance of Cyanobacteria in the subsequent months (from 39% in July to 54% in September). This growth might have been caused by the exchange of nutrients between Cyanobacteria and epigletic or free-living bacteria, as demonstrated by Louati et al. [41].
Microbial activity is an important parameter for understanding the functioning of aquatic environments [40]. The study of the metabolic activity of microorganisms helps determine their roles in a given ecosystem [42]. Bacterial cells metabolize organic compounds, which can subsequently be used by larger organisms [43]. Moreover, Cyanobacteria have the ability to remove organic pollutants from aquatic ecosystems in the process called phytoremediation [44]. In this study, the highest abundance of metabolically active cells was obtained in July (L-II): slightly over 2 cells 105 mL−1, i.e., 42% of the total bacterioplankton abundance. The lowest abundance of metabolically active cells was recorded in August (L-III): only 0.6 cells 105 mL−1, which constituted 24% of the total bacterioplankton abundance. Our results indicate a decrease in the abundance of enzymatically active bacterioplankton cells in L-II as the months progressed (from 2 cells 105 mL−1 in July to 0.7 cells 105 mL−1 in September). It was also observed that a decrease in active bacterioplankton contribution was accompanied by an increase in Cyanobacteria contribution (from 31% to nearly 60% in the subsequent months). Our study does not confirm the results obtained by Søndergaard and Danielsen [45], who indicated that the growth of metabolically active cells occurred simultaneously with an increase in chlorophyll content, a determinant of phytoplankton biomass. Correlation analysis did not show a significant relationship between the abundance of heterotrophic planktonic bacteria and TSI Chl, regardless of physiological condition of bacterial cells. Proctor and Souza [46] discovered that planktonic bacterial communities are less active than benthic bacterial communities. Nonetheless, there is still little information about the factors influencing bacterioplankton activity at the moment.
Our results suggest that sampling location affected the abundance of heterotrophic planktonic bacteria and metabolically active cells more than a sampling month. Le et al. [47], examining Lake Daechung in Korea, found no statistically significant differences in the population of heterotrophic bacteria between the sites in different years in the pre-bloom phase, while the differences were more distinct after the Microcystis bloom. Reversely, a sampling date had a significant impact on the abundance of heterotrophic planktonic bacteria with integral cytoplasmic membrane. Changes in the biomass of heterotrophic bacteria can also be caused by other environmental factors, such as nutrients or weather conditions [48].
Our study did not show statistically significant relationships between the selected characteristics of the bacterioplankton population and the majority of the physicochemical parameters of water and biological factors. However, in July, at an average temperature of 22.6 °C, the highest average abundance of metabolically active cells (1.3 cells 105 mL−1) and the highest average number of OTUs were recorded. It was also observed that as the average lake temperature decreased in the subsequent months, the average number of OTUs diminished. Numerous studies indicate that temperature affects the growth and metabolism of organisms [48,49,50]. According to Rösel et al. [51], temperature is one of the most important seasonal factors responsible for shifts in bacterial community composition. Results from Lefler et al. [52] indicate that Cyanobacteria abundance in Lake Okeechobee (FL, USA) is also influenced by atmospheric precipitation. High temperatures, long periods of severe drought and rare, heavy rainfalls causing the inflow of nutrients from farm fields, may also accelerate the growth of Cyanobacteria [50,53].
In our study the average number of OTUs decreased in subsequent months (from 367 to 265). These results are in line with the observations by Dai et al. [54] that a season has an impact on bacterioplankton richness. We also noted that as the number of OTUs decreased monthly, the average abundance of Cyanobacteria increased, which is confirmed by the correlation analysis of these parameters (r = −0.62). PCoA analysis indicates that the structure of bacterial communities was strongly correlated with the sampling site and bacterial taxa were lake-specific. In our study, in September both Dolichospermum and Microcystis reached their maximum share of 48% and 33%, respectively, which could have influenced the structure of the remaining bacterial communities. Liu et al. [55], examining three lakes in southwestern China, observed an increased dominance of Cyanobacteria in autumn with a simultaneous decrease in diversity and increase in heterogeneity of bacterial communities. Our results indicate that bacterioplankton was dominated by the phylum Cyanobacteria (45%), whose abundance was significantly correlated with the occurrence of other fractions belonging to the phyla Proteobacteria (21%), Bacterioidetes (11%), Actinobacteria (8%) and was closely connected to the type of the ecosystem. Zeng et al. [56] obtained high sequences related to Proteobacteria (58%), Cyanobacteria (17%) and Bacteroidetes (15%) in two brackish lakes. Salmaso [57], recorded that in an alpine lake the abundance of the above clusters predominated in warm months. According to Woodhouse et al. [58], changes in the abundance of Cyanobacteria seriously affect the composition of bacterioplankton. Our study showed the dominance of Microcystis (14%), Dolichospermum (10%) and picocyanobacterium of the genus Synechococcus (10%). Cyanobacterial blooms were accompanied by the presence of heterotrophic bacteria, but their share was insignificant and amounted to 2%. According to Li et al. [59], the abundance of heterotrophic bacteria ACK-M1 and C111 may depend on the abundance of Cyanobacteria Synechococcus. In our research such a relationship was observed only at site L-III.
Numerous Cyanobacteria on the water surface or in the water column in macroscopic colonies, have the ability to form blooms [60]. Microcystis and Dolichospermum are common and dominant genera responsible for producing potentially toxic blooms [61,62]. Ahn et al. [63] identified Microcystis and Dolichospermum as bloom-forming Cyanobacteria in Lake Daechung. Also, Muluye et al. [64] identified these genera as the most common toxin-producing Cyanobacteria in African and Peruvian freshwater waterbodies [65]. In nature, Microcystis forms colonies containing epigletic heterotrophic bacteria, which are dependent upon Microcystis for carbon and energy [66]. These bacteria are suspended in polysaccharide jellies, a kind of a barrier which protects Microcystis against unfavorable environmental conditions [67,68,69]. It has been observed that the isolated strain of M. aeruginosa, maintained in the laboratory without the presence of heterotrophic bacteria, lost the ability to form colonies [69,70]. In addition, the metabolic analysis of Microcystis indicated that heterotrophic bacteria were involved in the formation of endotoxins [64]. According to Le et al. [47], Microcystis blooms may also affect Dolichospermum abundance. According to Fuster et al. [71], a Dolichospermum bloom, which is often omitted in research in favor of a Microcystis bloom, is associated with the bacterial community creating a cyanosphere, and due to the high cell density during the bloom, increases bacterial diversity. Te et al. [72] examining a tropical urban waterbody observed a succession of Microcystis and Synechococcus blooms. Currently, Synechococcus spp. are widespread in both freshwater and marine environments, and, owing to their rapid growth and toxin-producing ability, are becoming increasingly involved in the formation of harmful blooms [73,74].

5. Conclusions

Our study focused on the effect of cyanobacterial blooms on the structural and functional diversity of bacterioplankton in three shallow lakes in northern Poland. As expected, Cyanobacteria dominated in all samples and their abundance was significantly correlated with the occurrence of other fractions of the bacterioplankton community, including Proteobacteria, Actinobacteria and Firmicutes. The analysis of variance showed no differences in the bacterioplankton biodiversity between the investigated lakes. However, cyanobacterial blooms did not lead to biotic homogenization. PCoA analysis indicated that the structure of planktonic bacteria, regardless of the dominance of Cyanobacteria, is very diverse and is closely related to the type of aquatic ecosystem although we failed to determine what environmental factors affected the biodiversity of planktonic bacteria. In addition, we did not observe any significant relationships between the occurrence of Cyanobacteria and the size of the bacterioplankton population or the activity of bacterial cells. Our study expands knowledge of the role of cyanobacterial blooms in aquatic ecosystems and their impact on the functioning of bacterioplankton communities. At the same time, it indicates the need for further research on the ecological role of Cyanobacteria in aquatic ecosystems.

Supplementary Materials

The following supporting information can be downloaded at: https://www.mdpi.com/article/10.3390/w17233376/s1, Table S1: Physical, chemical and biological properties of water in studied lakes. Results are presented as mean ± standard deviation; range is given in parentheses; Table S2: Statistical differences between the analyzed datasets based on post hoc for Kruskal–Wallis test. DAPI–abundance of bacterioplankton population, CTC–metabolically active bacterioplankton cells, MEM (+)–cells with an integral cytoplasmic membranę, MEM (−)–cells with an damaged cytoplasmic. Table S3. The number of obtained paired-end reads and the results of raw read filtering were generated using the q2:dada2 script. Figure S1. The results of the rarefaction curve analysis were constructed using the phyloseq package based on calculations performed in the R environment, version 4.03.

Author Contributions

Conceptualization, E.J.; methodology, E.J. and Ł.K.; software, E.J. and Ł.K.; validation, Ł.K. and E.D.; formal analysis, E.J. and Ł.K.; investigation, E.J., M.M.-A. and Ł.K.; data curation, E.J.; writing—original draft preparation, E.J. and Ł.K.; writing—review and editing, E.J., E.D., M.M.-A. and Ł.K.; visualization, E.J. and Ł.K.; supervision, E.D. and Ł.K. All authors have read and agreed to the published version of the manuscript.

Funding

This study was supported by the Polish Minister of Education and Science under the program “Regional Initiative of Excellence” in 2019–2023 (Grant No. 008/RID/2018/19).

Data Availability Statement

The sequencing reads have been deposited at the NCBI Sequence Read Archive database under the BioProject accession number PRJNA 1032267.

Conflicts of Interest

The authors declare no conflicts of interest.

References

  1. Feresin, E.G.; Arcifa, M.S.; Sampaio da Silva, L.H.; Esguicero, A.L.H. Primary productivity of the phytoplankton in a tropical Brazilian shallow lake: Experiments in the lake and in mesocosms. Acta Limnol. Bras. 2010, 22, 384–396. [Google Scholar] [CrossRef]
  2. Padisák, J.; Reynolds, C.S. Shallow lakes: The absolute, the relative, the functional and the pragmatic. Hydrobiologia 2003, 506, 1–11. [Google Scholar] [CrossRef]
  3. Scheffer, M. Ecology of Shallow Lakes; Springer: Dordrecht, The Netherlands, 2004; pp. 76–121. [Google Scholar]
  4. Lindeman, R.L. The trophic-dynamic aspect of ecology. Ecology 1942, 23, 399–418. [Google Scholar] [CrossRef]
  5. Feng, C.; Jia, J.; Wang, C.; Han, M.; Dong, C.; Huo, B.; Li, D.; Liu, X. Phytoplankton and Bacterial Community Structure in Two Chinese Lakes of Different Trophic Status. Microorganisms 2019, 7, 621. [Google Scholar] [CrossRef] [PubMed]
  6. Newton, R.J.; Jones, S.E.; Eiler, A.; McMahon, K.D.; Bertilsson, S. A Guide to the Natural History of Freshwater Lake Bacteria. Microbiol. Mol. Biol. Rev. 2011, 75, 14–49. [Google Scholar] [CrossRef] [PubMed]
  7. Tandon, K.; Yang, S.H.; Wan, M.T.; Yang, C.C.; Baatar, B.; Chiu, C.Y.; Tsai, J.W.; Liu, W.C.; Tang, S.L. Bacterial Community in Water and Air of Two Sub-Alpine Lakes in Taiwan. Microbes Environ. 2018, 33, 120–126. [Google Scholar] [CrossRef] [PubMed]
  8. Zhang, H.; Huang, T.; Chen, S.; Yang, X.; Lv, K.; Sekar, R. Abundance and diversity of bacteria in oxygen minimum drinking water reservoir sediments studied by quantitative PCR and pyrosequencing. Microb. Ecol. 2015, 69, 618–629. [Google Scholar] [CrossRef]
  9. Miks, M.H.; Warminska-Radyko, I. Selected fluorescent techniques in the research of the physiological state and viability of bacteria cells in food. Med. Weter. 2008, 64, 623–627. [Google Scholar]
  10. Murínová, S.; Dercová, K. Response Mechanisms of Bacterial Degraders to Environmental Contaminants on the Level of Cell Walls and Cytoplasmic Membrane. Int. J. Microbiol. 2014, 2014, 873081. [Google Scholar] [CrossRef]
  11. Ramamurthy, T.; Ghosh, A.; Pazhani, G.P.; Shinoda, S. Current Perspectives on Viable but Non-Culturable (VBNC) Pathogenic Bacteria. Front. Public Health 2014, 2, 103. [Google Scholar] [CrossRef]
  12. Li, L.; Mendis, N.; Trigui, H.; Oliver, J.D.; Faucher, S.P. The importance of the viable but non-culturable state in human bacterial pathogens. Front. Microbiol. 2014, 5, 258. [Google Scholar] [CrossRef]
  13. Wagley, S.; Morcrette, H.; Kovacs-Simon, A.; Yang, Z.R.; Power, A.; Tennant, R.K.; Love, J.; Murray, N.; Titball, R.W.; Butler, C.S. Bacterial dormancy: A subpopulation of viable but non-culturable cells demonstrates better fitness for revival. PLoS Pathog. 2021, 17, e1009194. [Google Scholar] [CrossRef]
  14. Samuel, P.S.; Lopez, J.V. Diversity fluctuations of the microbial community during annual Microcystis blooms within Lake Okeechobee, FL. Front. Water 2025, 7, 1678547. [Google Scholar] [CrossRef]
  15. Nusch, E.A. Comparison of different methods for chlorophyll and phaeopigment. Arch. Hydrobiol. 1980, 14, 14–16. [Google Scholar]
  16. Carlson, R.E.; Simpson, J. Coordinator’s Guide to Volunteer Lake Monitoring Methods. N. Am. Lake Manag. Soc. 1996, 96, 305. [Google Scholar]
  17. Dembowska, E. Phytoplankton of shallow lakes in the Iławskie Lake District. Limnol. Pap. 2008, 3, 19–31. [Google Scholar] [CrossRef]
  18. Eisenhofer, R.; Minich, J.J.; Marotz, C.; Cooper, A.; Knight, R.; Weyrich, L.S. Contamination in Low Microbial Biomass Microbiome Studies: Issues and Recommendations. Trends Microbiol. 2019, 27, 105–117. [Google Scholar] [CrossRef]
  19. Reynoso, G.; Smith, M.R.; Holmes, C.P.; Keelan, C.R.; McGrath, S.E.; Alvarez, G.H.; Coceano, M.A.; Eldridge, K.A.; Fried, H.I.; Gilbert, N.E.; et al. Bacterial community structure and response to nitrogen amendments in Lake Shenandoah (VA, USA). Water Sci. Technol. 2019, 80, 675–684. [Google Scholar] [CrossRef]
  20. Bolyen, E.; Rideout, J.R.; Dillon, M.R.; Bokulich, N.A.; Abnet, C.C.; Al-Ghalith, G.A.; Alexander, H.; Alm, E.J.; Arumugam, M.; Asnicar, F.; et al. Reproducible, interactive, scalable and extensible microbiome data science using QIIME 2. Nat. Biotechnol. 2019, 37, 852–857. [Google Scholar] [CrossRef] [PubMed]
  21. Chen, T.; Liu, Y.X.; Huang, L. ImageGP: An Easy-to-Use Data Visualization Web Server for Scientific Researchers. iMeta 2022, 1, e5. [Google Scholar] [CrossRef]
  22. Cook, K.V.; Li, C.; Cai, H.; Krumholz, L.R.; Hambright, K.D.; Paerl, H.W.; Steffen, M.M.; Wolson, A.E.; Burford, M.A.; Grossart, H.-P.; et al. The global Microcystis interactome. Limnol. Oceanogr. 2020, 66, 194–207. [Google Scholar] [CrossRef]
  23. Kubera, Ł.; Donderski, W. Distribution and activity of benthic bacteria in four lakes in the Bory Tucholskie National Park (Poland). Aquat. Microb. Ecol. 2017, 79, 127–135. [Google Scholar] [CrossRef]
  24. Visser, P.M.; Verspagen, J.M.H.; Sandrini, G.; Stal, L.J.; Matthijs, H.C.P.; Davis, T.W.; Paerl, H.W.; Huisman, J. How rising CO2 and global warming may stimulate harmful cyanobacterial blooms. Harmful Algae 2016, 54, 145–159. [Google Scholar] [CrossRef]
  25. Buchan, A.; LeCleir, G.R.; Gulvik, C.A.; González, J.M. Master recyclers: Features and functions of bacteria associated with phytoplankton blooms. Nat. Rev. Microbiol. 2014, 12, 686–698. [Google Scholar] [CrossRef] [PubMed]
  26. Kodama, M.; Doucette, G.J.; Green, D.H. Relationships Between Bacteria and Harmful Algae. In Ecology of Harmful Algae; Granéli, E., Turner, J.T., Eds.; Ecological Studies 189; Springer: Berlin/Heidelberg, Germany, 2006; pp. 243–255. [Google Scholar] [CrossRef]
  27. Ramanan, R.; Kim, B.H.; Cho, D.H. Algae–bacteria interactions: Evolution, ecology and emerging applications. Biotechnol. Adv. 2016, 34, 14–29. [Google Scholar] [CrossRef] [PubMed]
  28. Skerratt, J.H.; Bowman, J.; Hallegraeff, G.; James, G.; Nichols, P.D. Algicidal bacteria associated with blooms of a toxic dinoflagellate in a temperate Australian estuary. Mar. Ecol. Prog. Ser. 2002, 244, 1–15. [Google Scholar] [CrossRef]
  29. Doucette, G.J.; McGovern, E.R.; Babinchak, J.A. Algicidal bacteria active against Gymnodinium breve (Dinophyceae). I. Bacterial isolation and characterization of killing activity. J. Phycol. 1999, 35, 1447–1454. [Google Scholar] [CrossRef]
  30. Dziallas, C.; Grossart, H.P. Microbial interactions with the cyanobacterium Microcystis aeruginosa and their dependence on temperature. Mar. Biol. 2016, 159, 2389–2398. [Google Scholar] [CrossRef]
  31. Huang, Z.; Jiang, C.; Xu, S.; Zheng, X.; Lv, P.; Wang, C.; Wang, D.; Zhuang, X. Spatiotemporal changes of bacterial communities during a cyanobacterial bloom in a subtropical water source reservoir ecosystem in China. Sci. Rep. 2022, 12, 14573. [Google Scholar] [CrossRef]
  32. Mankiewicz-Boczek, J.; Font-Nájera, A. Temporal and functional interrelationships between bacterioplankton communities and the development of a toxigenic Microcystis bloom in a lowland European reservoir. Sci. Rep. 2022, 12, 19332. [Google Scholar] [CrossRef]
  33. Woodhouse, J.N.; Ziegler, J.; Grossart, H.P.; Neilan, B.A. Cyanobacterial Community Composition and Bacteria–Bacteria Interactions Promote the Stable Occurrence of Particle-Associated Bacteria. Front. Microbiol. 2018, 9, 777. [Google Scholar] [CrossRef]
  34. Yang, C.; Hou, X.; Wu, D.; Chang, W.; Zhang, X.; Dai, X.; Du, H.; Zhang, X.; Igarashi, Y.; Luo, F. The characteristics and algicidal mechanisms of cyanobactericidal bacteria. World J. Microbiol. Biotechnol. 2020, 36, 188. [Google Scholar] [CrossRef] [PubMed]
  35. Menezes, C.; Churro, C.; Dias, E. Risk Levels of Toxic Cyanobacteria in Portuguese Recreational Freshwaters. Toxins 2017, 9, 327. [Google Scholar] [CrossRef]
  36. Liu, L.; Lv, X.; Li, W.; Chen, L.; Li, Y.; Lin, B. Relationship between bacterial community and its environmental in Zuohai Lake, China. Acta Microbiol. Sin. 2015, 55, 1177–1189. [Google Scholar]
  37. Wang, M.; Ateia, M.; Hatano, Y.; Miyanaga, K.; Yoshimura, C. Novel fluorescence-based method for rapid quantification of live bacteria in river water and treated wastewater. Environ. Sci. Adv. 2022, 1, 30–36. [Google Scholar] [CrossRef] [PubMed]
  38. Perliński, P.; Mudryk, Z.J.; Zdanowicz, M.; Kubera, Ł. Abundance of Live and Dead Bacteriopsammon Inhabiting Sandy Ecosystems of Recreational Marine Beaches of the Southern Baltic Sea. Microb. Ecol. 2023, 86, 350–363. [Google Scholar] [CrossRef] [PubMed]
  39. Haglund, A.L.; Lantz, P.; Törnblom, E.; Tranvik, L. Depth distribution of active bacteria and bacterial activity in lake sediment. FEMS Microbiol. Ecol. 2003, 46, 31–38. [Google Scholar] [CrossRef] [PubMed]
  40. Lew, S.; Glińska-Lewczuk, K.G.; Lew, M. The effects of environmental parameters on the microbial activity in peat-bog lakes. PLoS ONE 2019, 14, e0224441. [Google Scholar] [CrossRef]
  41. Louati, I.; Pascault, N.; Debroas, D.; Bernard, C.; Humbert, J.-F.; Leloup, J. Structural Diversity of Bacterial Communities Associated with Bloom-Forming Freshwater Cyanobacteria Differs According to the Cyanobacterial Genus. PLoS ONE 2015, 10, e0146866. [Google Scholar] [CrossRef]
  42. Klein, A.M.; Bohannan, B.J.M.; Jaffe, D.A.; Levin, D.A.; Green, J.L. Molecular Evidence for Metabolically Active Bacteria in the Atmosphere. Front. Microbiol. 2016, 7, 772. [Google Scholar] [CrossRef]
  43. Raina, J.B. The Life Aquatic at the Microscale. mSystems 2018, 3, e00150-17. [Google Scholar] [CrossRef]
  44. Touliabah, H.E.S.; El-Sheekh, M.M.; Ismail, M.M.; El-Kassas, H. A Review of Microalgae- and Cyanobacteria-Based Biodegradation of Organic Pollutants. Molecules 2022, 27, 1141. [Google Scholar] [CrossRef]
  45. Søndergaard, M.; Danielsen, M. Active bacteria (CTC+) in temperate lakes: Temporal and cross-system variations. J. Plankton Res. 2001, 23, 1195–1206. [Google Scholar] [CrossRef]
  46. Proctor, L.M.; Souza, A.C. Method for enumeration of 5-cyano-2,3-ditoyl tetrazolium chloride (CTC)-active cells and cell-specific CTC activity of benthic bacteria in riverine, estuarine and coastal sediments. J. Microbiol. Methods 2001, 43, 213–222. [Google Scholar] [CrossRef]
  47. Le, V.V.; Kang, M.; Ko, S.R.; Jeong, S.; Park, C.-Y.; Lee, J.J.; Choi, I.-C.; Oh, H.-M.; Ahn, C.-Y. Dynamic response of bacterial communities to Microcystis blooms: A three-year study. Sci. Total Environ. 2023, 902, 165888. [Google Scholar] [CrossRef]
  48. Giani, A.; Taranu, Z.E.; von Rückert, G.; Eaves, I.G. Comparing key drivers of cyanobacteria biomass in temperate and tropical systems. Harmful Algae 2020, 97, 101859. [Google Scholar] [CrossRef] [PubMed]
  49. Mousa, I.E.; Emara, I.K.; Farfour, S.A.; Eldourghamy, A.S. Microbial profile and its changing rates of Lake Burullus, Egypt as wastewater receiving body. Water Environ. J. 2018, 32, 67–74. [Google Scholar] [CrossRef]
  50. Reichwaldt, E.S.; Ghadouani, A. Effects of rainfall patterns on toxic cyanobacterial blooms in a changing climate: Between simplistic scenarios and complex dynamics. Water Res. 2012, 46, 1372–1393. [Google Scholar] [CrossRef]
  51. Rösel, S.; Allgaier, M.; Grossart, H.P. Long-Term Characterization of Free-Living and Particle-Associated Bacterial Communities in Lake Tiefwaren Reveals Distinct Seasonal Patterns. Microbiol. Aquat. Syst. 2012, 64, 571–583. [Google Scholar] [CrossRef]
  52. Lefler, F.W.; Barbosa, M.; Zimba, P.V.; Smyth, A.R.; Berthold, D.E.; Laughinghouse, H.D. Spatiotemporal diversity and community structure of cyanobacteria and associated bacteria in the large shallow subtropical Lake Okeechobee (Florida, United States). Front. Microbiol. 2023, 14, 1219261. [Google Scholar] [CrossRef] [PubMed]
  53. Li, H.; Alsanea, A.; Barber, M.; Goel, R. High-throughput DNA sequencing reveals the dominance of pico- and other filamentous cyanobacteria in an urban freshwater Lake. Sci. Total Environ. 2019, 661, 465–480. [Google Scholar] [CrossRef]
  54. Dai, Y.; Yang, Y.; Wu, Z.; Feng, Q.; Xie, S.; Liu, Y. Spatiotemporal variation of planktonic and sediment bacterial assemblages in two plateau freshwater lakes at different trophic status. Appl. Microbiol. Biotechnol. 2015, 100, 4161–4175. [Google Scholar] [CrossRef] [PubMed]
  55. Liu, Q.; Zhang, H.; Zhang, Y.; Li, D.; Gao, Y.; Li, H.; Duan, L.; Zhang, X.; Liu, F.; Xu, J.; et al. Heterogeneous bacterial communities affected by phytoplankton community turnover and microcystins in plateau lakes of Southwestern China. Sci. Total Environ. 2023, 903, 166303. [Google Scholar] [CrossRef] [PubMed]
  56. Zeng, J.; Deng, L.J.; Lou, K.; Zhang, T.; Yang, H.-M.; Shi, Y.-W.; Lin, Q. Molecular characterization of the planktonic microorganisms in water of two mountain brackish lakes. J. Basic Microbiol. 2014, 54, 509–520. [Google Scholar] [CrossRef] [PubMed]
  57. Salmaso, N.; Albanese, D.; Capelli, C.; Boscaini, A.; Pindo, M.; Donati, C. Diversity and Cyclical Seasonal Transitions in the Bacterial Community in a Large and Deep Perialpine Lake. Microb. Ecol. 2018, 76, 125–143. [Google Scholar] [CrossRef]
  58. Woodhouse, J.N.; Kinsela, A.S.; Collins, R.N.; Bowling, L.C.; Honeyman, G.L.; Holliday, J.K.; Neilan, B.A. Microbial communities reflect temporal changes in cyanobacterial composition in a shallow ephemeral freshwater lake. ISME J. 2016, 10, 1337–1351. [Google Scholar] [CrossRef]
  59. Li, J.; Zhang, J.; Liu, L.; Fan, Y.; Li, L.; Yang, Y.; Lu, Z.; Zhang, X. Annual periodicity in planktonic bacterial and archaeal community composition of eutrophic Lake Taihu. Sci. Rep. 2015, 5, 15488. [Google Scholar] [CrossRef]
  60. Ma, J.; Brookes, J.D.; Qin, B.; Paerl, H.W.; Gao, G.; Wu, P.; Zhang, W.; Deng, J.; Zhu, G.; Zhang, Y.; et al. Environmental factors controlling colony formation in blooms of the cyanobacteria Microcystis spp. in Lake Taihu, China. Harmful Algae 2014, 31, 136–142. [Google Scholar] [CrossRef]
  61. Paerl, H.W.; Xu, H.; McCarthy, M.J.; Zhu, G.; Qin, B.; Li, Y.; Gardner, W.S. Controlling harmful cyanobacterial blooms in a hyper-eutrophic lake (Lake Taihu, China): The need for a dual nutrient (N & P) management strategy. Water Res. 2011, 45, 1973–1983. [Google Scholar] [CrossRef]
  62. Wan, L.; Chen, X.; Deng, Q.; Yang, L.; Li, X.; Zhang, J.; Song, C.; Zhou, Y.; Cao, X. Phosphorus strategy in bloom-forming cyanobacteria (Dolichospermum and Microcystis) and its role in their succession. Harmful Algae 2019, 84, 46–55. [Google Scholar] [CrossRef]
  63. Ahn, C.Y.; Chung, A.S.; Oh, H.M. Rainfall, phycocyanin, and N:P ratios related to cyanobacterial blooms in a Korean large reservoir. Hydrobiologia 2002, 474, 117–124. [Google Scholar] [CrossRef]
  64. Muluye, T.; Fetahi, T.; Engdaw, F.; Mohammed, A. Cyanotoxins in African waterbodies: Occurrence, adverse effects, and potential risk to animal and human health. Environ. Geochem. Health 2023, 45, 7519–7542. [Google Scholar] [CrossRef]
  65. Salazara-Torresa, A.; Robles, D.; Reyes, A.; Santa-Maria, M.C.; Venail, P. Evaluation of planktonic cyanobacteria in Peruvian freshwater lentic water bodies: Prevalence and regulatory framework to aid policy making. Environ. Monit. Assess. 2023, 195, 852. [Google Scholar] [CrossRef]
  66. Xie, M.; Ren, M.; Yang, C.; Yi, H.; Li, Z.; Li, T.; Zhao, J. Metagenomic Analysis Reveals Symbiotic Relationship among Bacteria in Microcystis-Dominated Community. Sec. Aquat. Microbiol. 2016, 7, 56. [Google Scholar] [CrossRef]
  67. Brunberg, A.K. Contribution of bacteria in the mucilage of Microcystis spp. (Cyanobacteria) to benthic and pelagic bacterial production in a hypereutrophic lake. FEMS Microbiol. Ecol. 1999, 29, 13–22. [Google Scholar] [CrossRef]
  68. Pereira, S.; Zille, A.; Micheletti, E.; Moradas-Ferreira, P.; De Philippis, R.; Tamagnini, P. Complexity of cyanobacterial exopolysaccharides: Composition, structures, inducing factors and putative genes involved in their biosynthesis and assembly. FEMS Microbiol. Rev. 2009, 33, 917–941. [Google Scholar] [CrossRef] [PubMed]
  69. Wang, W.; Shen, H.; Shi, P.; Chen, J.; Ni, L.; Xie, P. Experimental evidence for the role of heterotrophic bacteria in the formation of Microcystis colonies. J. Appl. Phycol. 2016, 28, 1111–1123. [Google Scholar] [CrossRef]
  70. Shen, H.; Niu, Y.; Xie, P.; Tao, M.; Yang, X. Morphological and physiological changes in Microcystis aeruginosa as a result of interactions with heterotrophic bacteria. Freshw. Biol. 2011, 56, 1065–1080. [Google Scholar] [CrossRef]
  71. Fuster, M.; Ruiz, T.; Lamarque, A.; Coulon, M.; Legrand, B.; Sabart, M.; Latour, D.; Mallet, C. Cyanosphere Dynamic During Dolichospermum Bloom: Potential Roles in Cyanobacterial Proliferation. Microb. Ecol. 2024, 87, 3. [Google Scholar] [CrossRef]
  72. Te, A.H.; Kok, J.W.K.; Luo, R.; You, L.; Sukarji, N.H.; Goh, K.C.; Sim, Z.Y.; Zhang, D.; He, Y.; Gin, K.Y.-H. Coexistence of Synechococcus and Microcystis Blooms in a Tropical Urban Reservoir and Their Links with Microbiomes. Environ. Sci. Technol. 2023, 57, 1613–1624. [Google Scholar] [CrossRef]
  73. Gin, K.Y.H.; Sim, Z.Y.; Goh, K.C.; Kok, J.W.K.; Te, S.H.; Tran, N.H.; Li, W.; He, Y. Novel cyanotoxin-producing Synechococcus in tropical lakes. Water Res. 2021, 192, 116828. [Google Scholar] [CrossRef] [PubMed]
  74. Sim, Z.Y.; Goh, K.C.; He, Y.; Gin, H.Y.H. Present and future potential role of toxin-producing Synechococcus in the tropical region. Sci. Total. Environ. 2023, 896, 165230. [Google Scholar] [CrossRef] [PubMed]
Figure 1. Bacterioplankton abundance in the studied lakes (L-I, L-II, L-III), stained with DAPI fluorescent marker.
Water 17 03376 g001
Figure 2. Percentage of bacterioplankton cells with an integral MEM [+] and damaged MEM [−] cytoplasmic membrane in the studied lakes (L-I, L-II, L-III).
Water 17 03376 g002
Figure 3. Abundance of active bacterioplankton cells labelled with CTC fluorescent marker in the studied lakes (L-I, L-II, L-III).
Water 17 03376 g003
Figure 4. A correlogram illustrating the relationship between physicochemical and microbiological parameters is shown, with positive correlations in blue and negative correlations in red. Color intensity is proportional to the correlation coefficient. DAPI—abundance of bacterioplankton population, CTC—metabolically active bacterioplankton cells, LIVE—cells with an integral cytoplasmic membranę, DEAD—cells with a damaged cytoplasmic membrane, OUT—Operational Taxonomic Unit, Cyano—relative abundance of Cyanobacteria, TSIChl—Trophic State Index based on chlorophyll a, Temp—temperature, OC—oxygen concentration, EC—electrolytic conductivity.
Water 17 03376 g004
Figure 5. Bacterioplankton community composition at the phylum level in the studied lakes (L-I, L-II, L-III).
Water 17 03376 g005
Figure 6. Heatmap showing the relative abundance of the 10 most abundant bacterioplankton genera based on OTU counts in the studied lakes (L-I, L-II, L-III) across different sampling seasons.
Water 17 03376 g006
Figure 7. Principal coordinates analysis (PCoA) of the reads obtained from the NGS sequencing of the 16S rRNA gene in the studied lakes (L-I, L-II, L-III): (A) sampling sites and (B) research seasons.
Water 17 03376 g007
Table 1. Characteristics of sampling sites.
L-I L-II L-III
Location53°40′48″ N53°33′46″ N52°49′41″ N
19°33′44″ E19°36′38″ E18°42′6″ E
Surface [ha]8620.230.7
Volume [103 m3]10202632.4
Max. depth [m]2.12.43.7
Type of catchmentforestforestagricultural
Note: Sampling sites: L-I (Gardzień Lake), L-II (Zielone Lake), L-III (Ostrowąs Lake).
Table 2. Abundance and biodiversity of bacterioplankton in the studied lakes.
OTUs97% Similarity
Shannon–WienerSimpsonInvSimpson
JulyL-I3433.5400.8888.929
L-II4574.4460.96327.520
L-III3003.7390.90110.122
AugustL-I2543.3720.8899.022
L-II3243.3650.91712.078
L-III3214.1520.96630.215
SeptemberL-I2603.8000.94117.078
L-II2642.6930.7493.986
L-III2713.1440.8627.255
Note: Sampling sites: L-I (Gardzień Lake), L-II (Zielone Lake), L-III (Ostrowąs Lake).
Disclaimer/Publisher’s Note: The statements, opinions and data contained in all publications are solely those of the individual author(s) and contributor(s) and not of MDPI and/or the editor(s). MDPI and/or the editor(s) disclaim responsibility for any injury to people or property resulting from any ideas, methods, instructions or products referred to in the content.