Influence of Climate Characteristics on Streamflow in the Murray–Darling Basin
Abstract
1. Introduction
2. Materials and Methods
2.1. Study Region
2.2. Methods
2.2.1. Correlation Analysis
2.2.2. Stochastic Climate Library
2.2.3. Rainfall–Runoff Hydrological Models
2.3. Datasets
3. Results
3.1. Climate Drivers of Observed Annual Streamflow
3.2. Streamflow Sensitivity to Changes in Climate Inputs as Modelled by Hydrological Models
- (1)
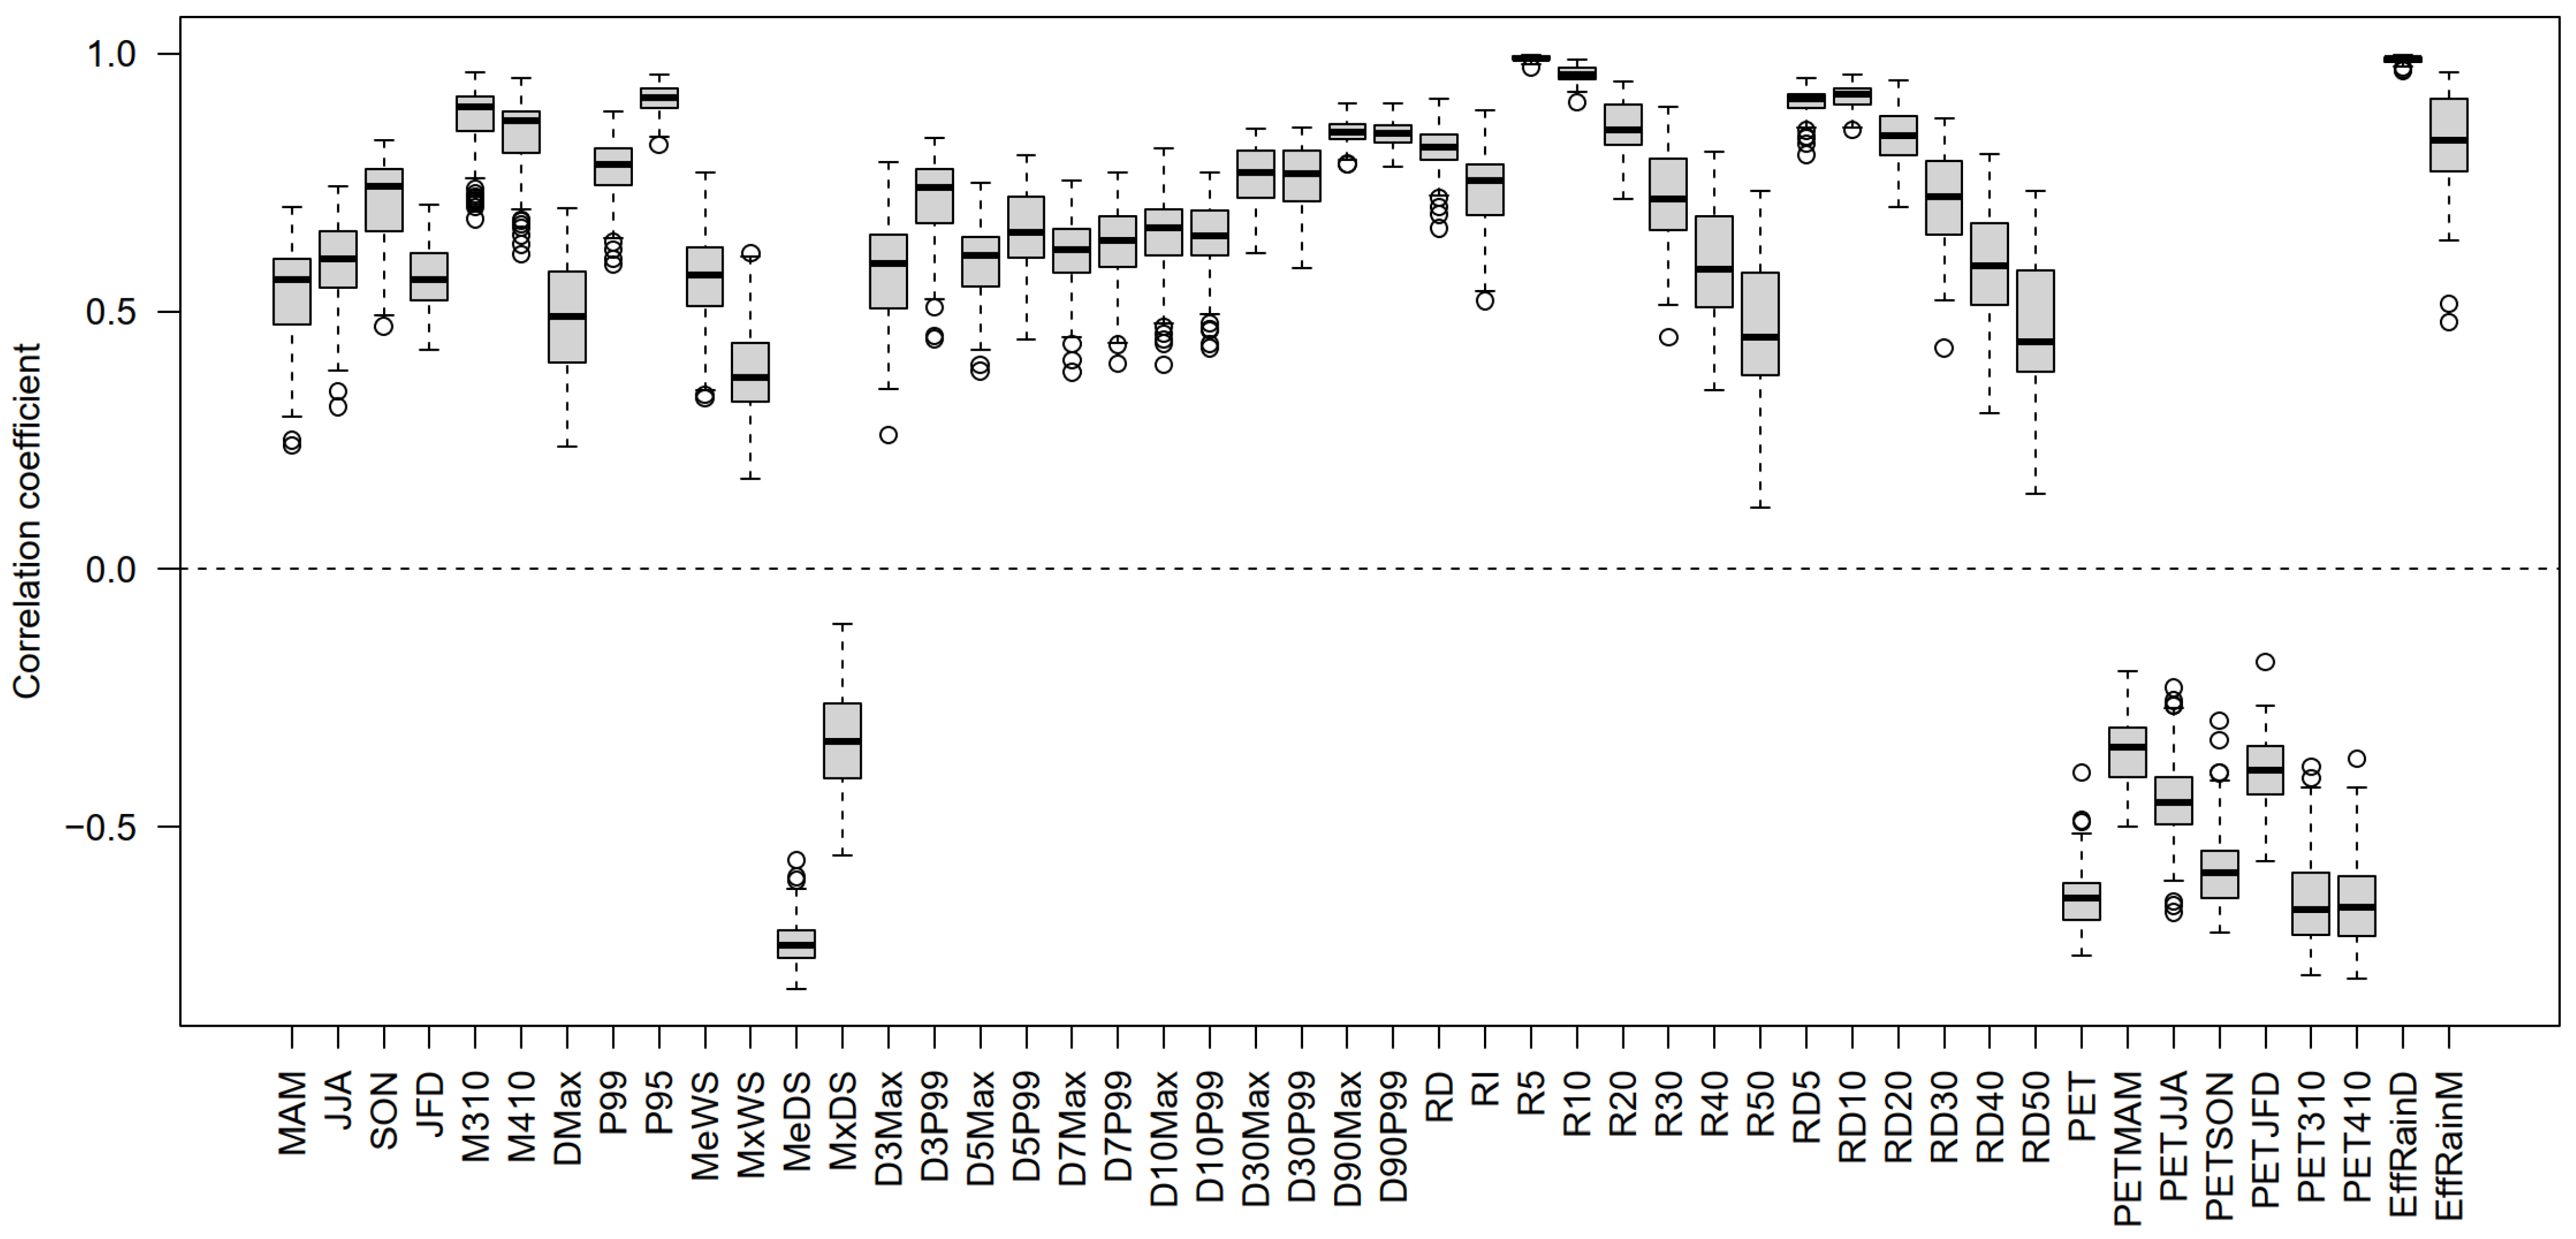
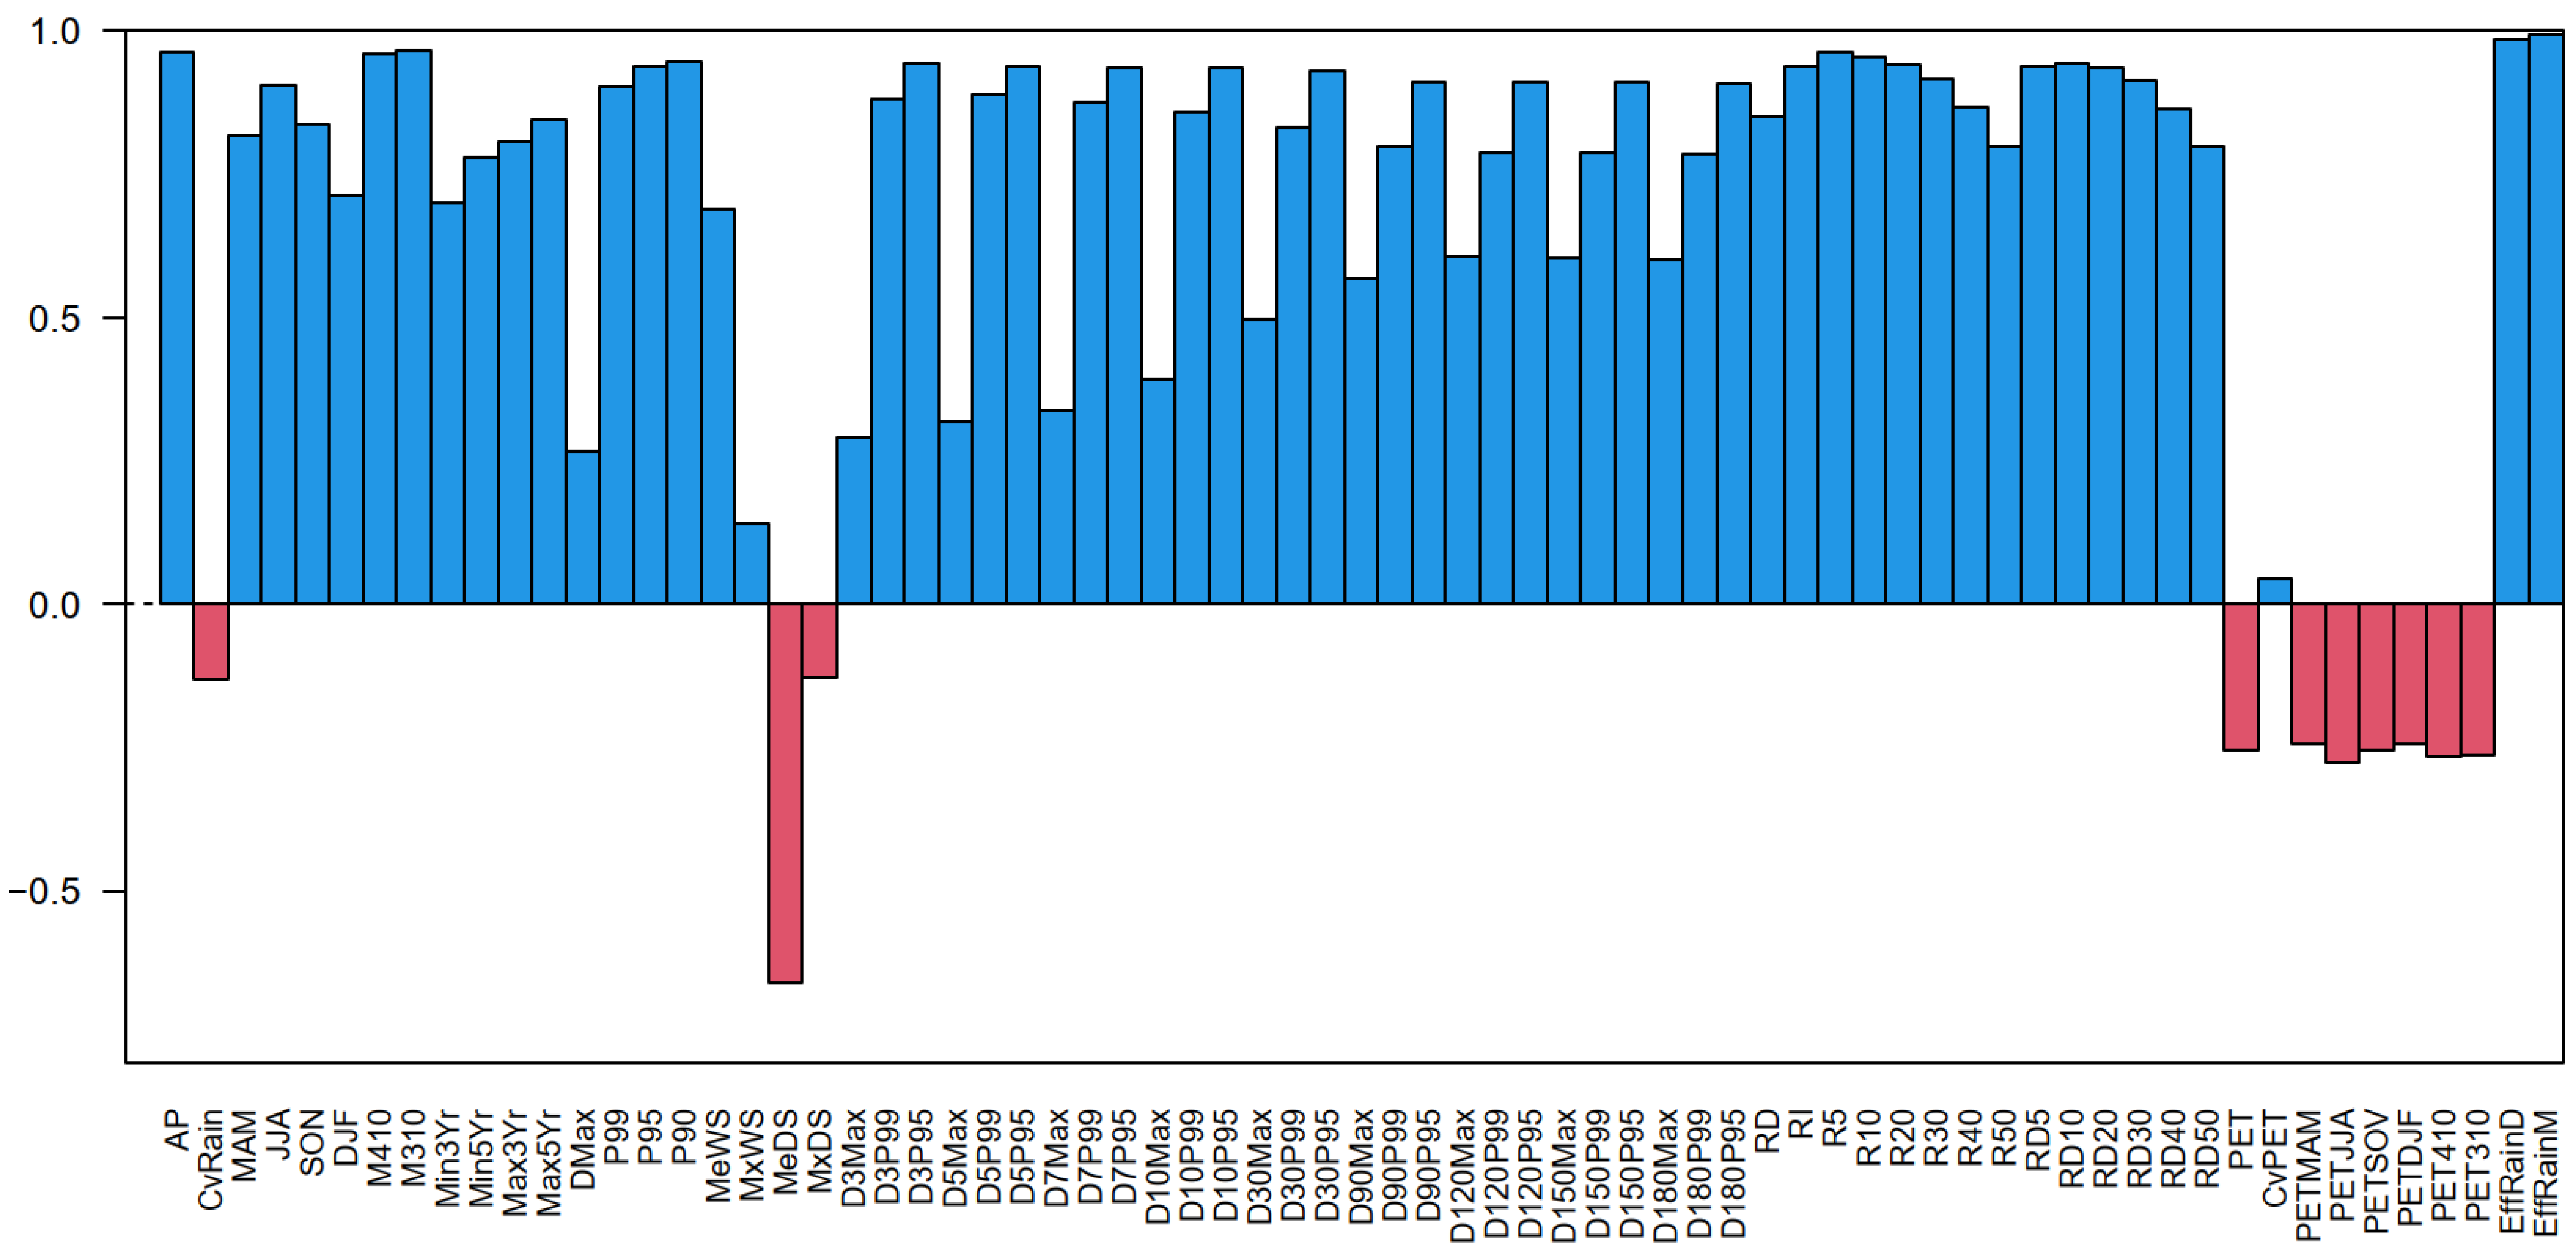
- Mean annual rainfall (AP) is the main driver of catchment mean annual streamflow, with the modelled change in mean annual streamflow having a correlation of 0.96 against the change in mean annual rainfall (Figure 7 and Table 4). This implies that the simple elasticity of mean annual streamflow to mean annual rainfall [27,28] is a reasonable estimate of the impacts of climate change on mean annual streamflow.
- (2)
- The change in mean annual streamflow is almost perfectly related (correlation of 0.99) to the change in effective rainfall (EffRainD and EffRainM), implying the additional importance of PET on streamflow (Figure 7 and Table 4). In addition to runoff elasticity to rainfall in (1), a simple large-scale water and energy framework, like the Budyko equation [29], could be sufficient for estimating the change in mean annual runoff from a change in mean annual rainfall and PET.
- (3)
- The cool-season rainfall (M310 and M410) also shows a very high correlation with mean annual streamflow (0.95–0.98), as most of runoff in this catchment occurs over the cool season (Figure 7 and Table 4). However, it may not stand out for catchments in the northern MDB where most of rainfall occurs in summer months.
- (4)
- (5)
- Streamflow usually results from multiple rainfall events. Therefore, the lengths of wet spell and dry spell are also important for runoff generation. For example, the mean length of dry spell (MeDS) is one of the climate variables strongly relating to mean annual streamflow (Figure 7). However, its magnitude is smaller than these above-mentioned rainfall characteristics and accordingly is not listed in Table 4.
3.3. Streamflow Sensitivity to Changes in Climate Inputs Using Hydrological Models with No Change in Mean Annual Rainfall
4. Discussion
4.1. Implications of This Study
4.2. Uncertainties and Limitations
5. Conclusions
Author Contributions
Funding
Data Availability Statement
Acknowledgments
Conflicts of Interest
Abbreviations
| MDB | Murray–Darling basin |
| HRS | Hydrological reference station |
| PET | Potential evapotranspiration |
| SCL | Stochastic climate library |
References
- Koutsoyiannis, D.; Montanari, A. Negligent killing of scientific concepts: The stationarity case. Hydrol. Sci. J. 2015, 60, 1174–1183. [Google Scholar] [CrossRef]
- Milly, P.C.D. Climate change—Stationarity is dead: Whither water management? Science 2008, 319, 573–574. [Google Scholar] [CrossRef]
- Fowler, K.; Peel, M.; Saft, M.; Peterson, T.J.; Western, A.; Band, L.; Petheram, C.; Dharmadi, S.; Tan, K.S.; Zhang, L.; et al. Explaining changes in rainfall–runoff relationships during and after Australia’s Millennium Drought: A community perspective. Hydrol. Earth Syst. Sci. 2022, 26, 6073–6120. [Google Scholar] [CrossRef]
- Fu, G.; Chiew, F.H.; Zheng, H.; Robertson, D.E.; Potter, N.J.; Teng, J.; Post, D.A.; Charles, S.P.; Zhang, L. Statistical analysis of attributions of climatic characteristics to nonstationary rainfall-streamflow relationship. J. Hydrol. 2021, 603, 127017. [Google Scholar] [CrossRef]
- Australian Bureau of Meteorology. Hydrologic Reference Stations Update 2020. 2020. Available online: http://www.bom.gov.au/water/hrs/update_2020.shtml (accessed on 23 November 2025).
- Zhang, X.S.; Amirthanathan, G.E.; Bari, M.A.; Laugesen, R.M.; Shin, D.; Kent, D.M.; MacDonald, A.M.; Turner, M.E.; Tuteja, N.K. How streamflow has changed across Australia since the 1950s: Evidence from the network of hydrologic reference stations. Hydrol. Earth Syst. Sci. 2016, 20, 3947–3965. [Google Scholar] [CrossRef]
- Twinomuhangi, M.B.; Bamutaze, Y.; Kabenge, I.; Wanyama, J.; Kizza, M.; Gabiri, G.; Egli, P.E. Analysis of stationary and non-stationary hydrological extremes under a changing environment: A systematic review. HydroResearch 2025, 8, 332–350. [Google Scholar] [CrossRef]
- Shrestha, R.R.; Najafi, M.R. Special Issue: Hydrological Extremes in a Warming Climate: Nonstationarity, Uncertainties and Impacts. Water 2022, 14, 1658. [Google Scholar] [CrossRef]
- Department of Environment, Land, Water and Planning (DELWP); Bureau of Meteorology (BoM); Commonwealth Scientific and Industrial Research Organisation (CSIRO); The University of Melbourne. Victoria’s Water in a Changing Climate; DELWP: Melbourne, VIC, Australia; BoM: Melbourne, VIC, Australia; CSIRO: Canberra, ACT, Australia; The University of Melbourne: Parkville, VIC, Australia, 2020; p. 97. [Google Scholar]
- Peterson, T.J.; Saft, M.; Peel, M.C.; John, A. Watersheds may not recover from drought. Science 2021, 372, 745–749. [Google Scholar] [CrossRef]
- Saft, M.; Western, A.W.; Zhang, L.; Peel, M.C.; Potter, N.J. The influence of multiyear drought on the annual rainfall-runoff relationship: An Australian perspective. Water Resour. Res. 2015, 51, 2444–2463. [Google Scholar] [CrossRef]
- Hakala, K.; Addor, N.; Teutschbein, C.; Vis, M.; Dakhlaoui, H.; Seibert, J. Hydrological Modeling of Climate Change Impacts. In Encyclopedia of Water: Science, Technology, and Society; Maurice, P., Ed.; Wiley & Sons: Hoboken, NJ, USA, 2019. [Google Scholar]
- Tian, W.-C.; Wang, W.-C.; Wang, Y.-Y.; Shi, C.-C.; Ma, Q. Accurate runoff prediction in nonlinear and nonstationary environments using a novel hybrid model. J. Hydrol. 2025, 662, 133949. [Google Scholar] [CrossRef]
- Yu, J.; Fu, G.; Cai, W.; Cowan, T. Impacts of precipitation and temperature changes on annual streamflow in the Murray-Darling Basin. Water Int. 2010, 35, 313–323. [Google Scholar] [CrossRef]
- Peel, M.C.; McMahon, T.A.; Finlayson, B.L. Continental differences in the variability of annual runoff-update and reassessment. J. Hydrol. 2004, 295, 185–197. [Google Scholar] [CrossRef]
- Srikanthan, R.; McMahon, T.A. Automatic evaluation of stochastically generated rainfall data. Australas. J. Water Resour. 2015, 8, 195–201. [Google Scholar] [CrossRef]
- Perrin, C.; Michel, C.; Andréassian, V. Improvement of a parsimonious model for streamflow simulation. J. Hydrol. 2003, 279, 275–289. [Google Scholar] [CrossRef]
- Moore, R.J. The PDM rainfall-runoff model. Hydrol. Earth Syst. Sci. 2007, 11, 483–499. [Google Scholar] [CrossRef]
- Burnash, R.J.; Ferral, R.L.; McGuire, R.A. A Generalized Streamflow Simulation System, Conceptual Modeling for Digital Computers; U.S. Department of Commerce, National Weather Service: Silver Spring, MD, USA; State of California, Department of Water Resources: Sacramento, CA, USA, 1973; p. 204. [Google Scholar]
- Chiew, F.; Peel, M.; Western, A. Application and Testing of the Simple Rainfall-Runoff Model SIMHYD. In Mathematical Models of Small Watershed Hydrology and Applications; Singh, V., Frevert, D., Eds.; Water Resources Publication: Denver, CO, USA, 2002; pp. 335–367. [Google Scholar]
- Gan, T.Y.; Burges, S.J. Assessment of soil-based and calibrated parameters of the Sacramento model and parameter transferability. J. Hydrol. 2006, 320, 117–131. [Google Scholar] [CrossRef]
- Oudin, L.; Andréassian, V.; Perrin, C.; Michel, C.; Le Moine, N. Spatial proximity, physical similarity, regression and ungaged catchments: A comparison of regionalization approaches based on 913 French catchments. Water Resour. Res. 2008, 44, W03413. [Google Scholar] [CrossRef]
- Tuteja, N.K.; Vaze, J.; Teng, J.; Mutendeudzi, M. Partitioning the effects of pine plantations and climate variability on runoff from a large catchment in southeastern Australia. Water Resour. Res. 2007, 43, W08415. [Google Scholar] [CrossRef]
- Vaze, J.; Barnett, P.; Beale, G.; Dawes, W.; Evans, R.; Tuteja, N.K.; Murphy, B.; Geeves, G.; Miller, M. Modelling the effects of land-use change on water and salt delivery from a catchment affected by dryland salinity in south-east Australia. Hydrol. Process. 2004, 18, 1613–1637. [Google Scholar] [CrossRef]
- Viney, N.; Vaze, J.; Crosbie, R.; Wang, B.; Dawes, W.; Frost, A. AWRA-L v5.0: Technical Description of Model Algorithms and Inputs; AWRA-L v5.0 technical report; CSIRO: Canberra, ACT, Australia, 2015; p. 78. [Google Scholar]
- Jeffrey, S.J.; Carter, J.O.; Moodie, K.B.; Beswick, A.R. Using spatial interpolation to construct a comprehensive archive of Australian climate data. Environ. Model. Softw. 2001, 16, 309–330. [Google Scholar] [CrossRef]
- Schaake, J.C. From Climate to Flow in Climate Change and U.S. Water Resources; Waggoner, P.E., Ed.; John Wiley: New York, NY, USA, 1990; pp. 177–206. [Google Scholar]
- Sankarasubramanian, A.; Vogel, R.M. Hydroclimatology of the continental United States. Geophys. Res. Lett. 2003, 30, 1363. [Google Scholar] [CrossRef]
- Zhang, X.; Dong, Q.; Cheng, L.; Xia, J. A Budyko-based framework for quantifying the impacts of aridity index and other factors on annual runoff. J. Hydrol. 2019, 579, 124224. [Google Scholar] [CrossRef]
- Deb, P.; Kiem, A.S.; Willgoose, G. Mechanisms influencing non-stationarity in rainfall-runoff relationships in southeast Australia. J. Hydrol. 2019, 571, 749–764. [Google Scholar] [CrossRef]
- Saft, M.; Peel, M.C.; Western, A.W.; Zhang, L. Predicting shifts in rainfall-runoff partitioning during multiyear drought: Roles of dry period and catchment characteristics. Water Resour. Res. 2016, 52, 9290–9305. [Google Scholar] [CrossRef]
- Viney, N.R.; Bates, B.C. It never rains on Sunday: The prevalence and implications of untagged multi-day rainfall accumulations in the Australian high quality data set. Int. J. Climatol. 2004, 24, 1171–1192. [Google Scholar] [CrossRef]
- Fu, G.; Barron, O.; Charles, S.P.; Donn, M.J.; Van Niel, T.G.; Hodgson, G. Uncertainty of Gridded Precipitation at Local and Continent Scales: A Direct Comparison of Rainfall from SILO and AWAP in Australia. Asia-Pac. J. Atmos. Sci. 2022, 58, 471–488. [Google Scholar] [CrossRef]


| Station | 405219 | 422202B | |
|---|---|---|---|
| Station Name | Goulburn River at Dohertys | Dogwood Creek at Gilweir | |
| Longitude | 146.1296 | 150.179 | |
| Latitude | −37.3304 | −26.709 | |
| State | VIC | QLD | |
| Area | 700 | 2882 | |
| Annual Rainfall (mm/yr) | 1293 | 621 | |
| Annual PET (mm/yr) | 1055 | 1630 | |
| Aridity Index | 1.22 | 0.38 | |
| GR4J | NSE | 0.87 | 0.78 |
| Bias | 0.02 | 0.01 | |
| GR4J_Closed | NSE | 0.87 | 0.76 |
| Bias | 0.04 | 0.07 | |
| PMD | NSE | 0.84 | 0.71 |
| Bias | −0.03 | 0.02 | |
| Sacramento | NSE | 0.87 | 0.71 |
| Bias | −0.01 | 0.01 | |
| SIMHYD | NSE | 0.83 | 0.55 |
| Bias | −0.01 | 0.05 | |
| Variables | Parameters/Statistics, Abbreviations and Units |
|---|---|
| Rainfall (40) | Annual rainfall (AP), mm/year |
| Seasonal rainfall: Four seasons (MAM, JJA, SON, DJF), mm/season Extended winter rainfall (M310 and M410), mm/season | |
| Extreme rainfall: Daily max (Dmax) and 99th/95th (P99/P95) daily rainfall, mm/day | |
| Wet/dry spell length: Wet Spell Length: mean (MeWS) and max (MxWS), day Dry Spell Length: mean (MeDS) and max (MxDS), day | |
| Multiple-day rainfall: 3-day max (D3Max) and 99th percentile (D3P99) rainfall totals, mm/3 day 5-day max (D5Max) and 99th percentile (D5P99) rainfall totals, mm/5 day 7-day max (D7Max) and 99th percentile (D7P99) rainfall totals, mm/7 day 10-day max (D10Max) and 99th percentile (D10P99) rainfall totals, mm/10 day 30-day max (D30Max) and 99th percentile (D30P99) rainfall totals, mm/30 day 90-day max (D90Max) and 99th percentile (D90P99) rainfall totals, mm/90 day | |
| Rainfall (>=1.0 mm) Days (RD) at annual scale, day | |
| Rainfall Intensity (RI = AP/RD) at annual scale, mm/day | |
| Annual total rainfall above a daily threshold of 5 mm (R5), 10 mm (R10), 20 mm (R20), 30 mm (R30), 40 mm (R40), and 50 mm (R50), mm/year | |
| Rainfall days above daily a threshold of 5 mm (RD5), 10 mm (RD10), 20 mm (RD20), 30 mm (RD30), 40 mm (RD40), and 50 mm (RD50), day | |
| Evaporation (7) | Annual potential evaporation (PET), mm/year |
| Seasonal PET: Four seasons (PETMAM, PETJJA, PETSON, PETDJF), mm/season Extended winter PET (PET310 and PET410), mm/season | |
| Effective Rainfall (2) | Sum of positive differences between daily or monthly rainfall and PET (EffRainD and EffRainM), mm/year |
| Additional variables for hydrological modelling simulation results (22) | Coefficient of variance of annual evaporation (CvPET) |
| Coefficient of variance of annual rainfall (CvRain) | |
| Extreme rainfall: 90th (P90) percentile daily rainfall, mm/day Multiple-year rainfall: Min and max of 3-year rainfall (Min3Yr and Max3Yr), mm/year Min and max of 5-year rainfall (Min5Yr and Max5Yr), mm/year | |
| Multiple-day rainfall: 3-day 95th percentile (D3P95) rainfall totals, mm/3 day 5-day 95th percentile (D5P95) rainfall totals, mm/5 day 7-day 95th percentile (D7P95) rainfall totals, mm/7 day 10-day 95th percentile (D10P95) rainfall totals, mm/10 day 30-day 95th percentile (D30P95) rainfall totals, mm/30 day 90-day 95th percentile (D90P95) rainfall totals, mm/90 day 120-day max (D120Max) and 99/95th percentile (D120P99/D120P95) rainfall totals, mm/120 day 150-day max (D150Max) and 99/95th percentile (D150P99/D150P95) rainfall totals, mm/150 day 180-day max (D180Max) and 99/95th percentile (D180P99/D180P95) rainfall totals, mm/180 day |
| Climate Variable | Statistics | Number of Catchments | % | Remarks |
|---|---|---|---|---|
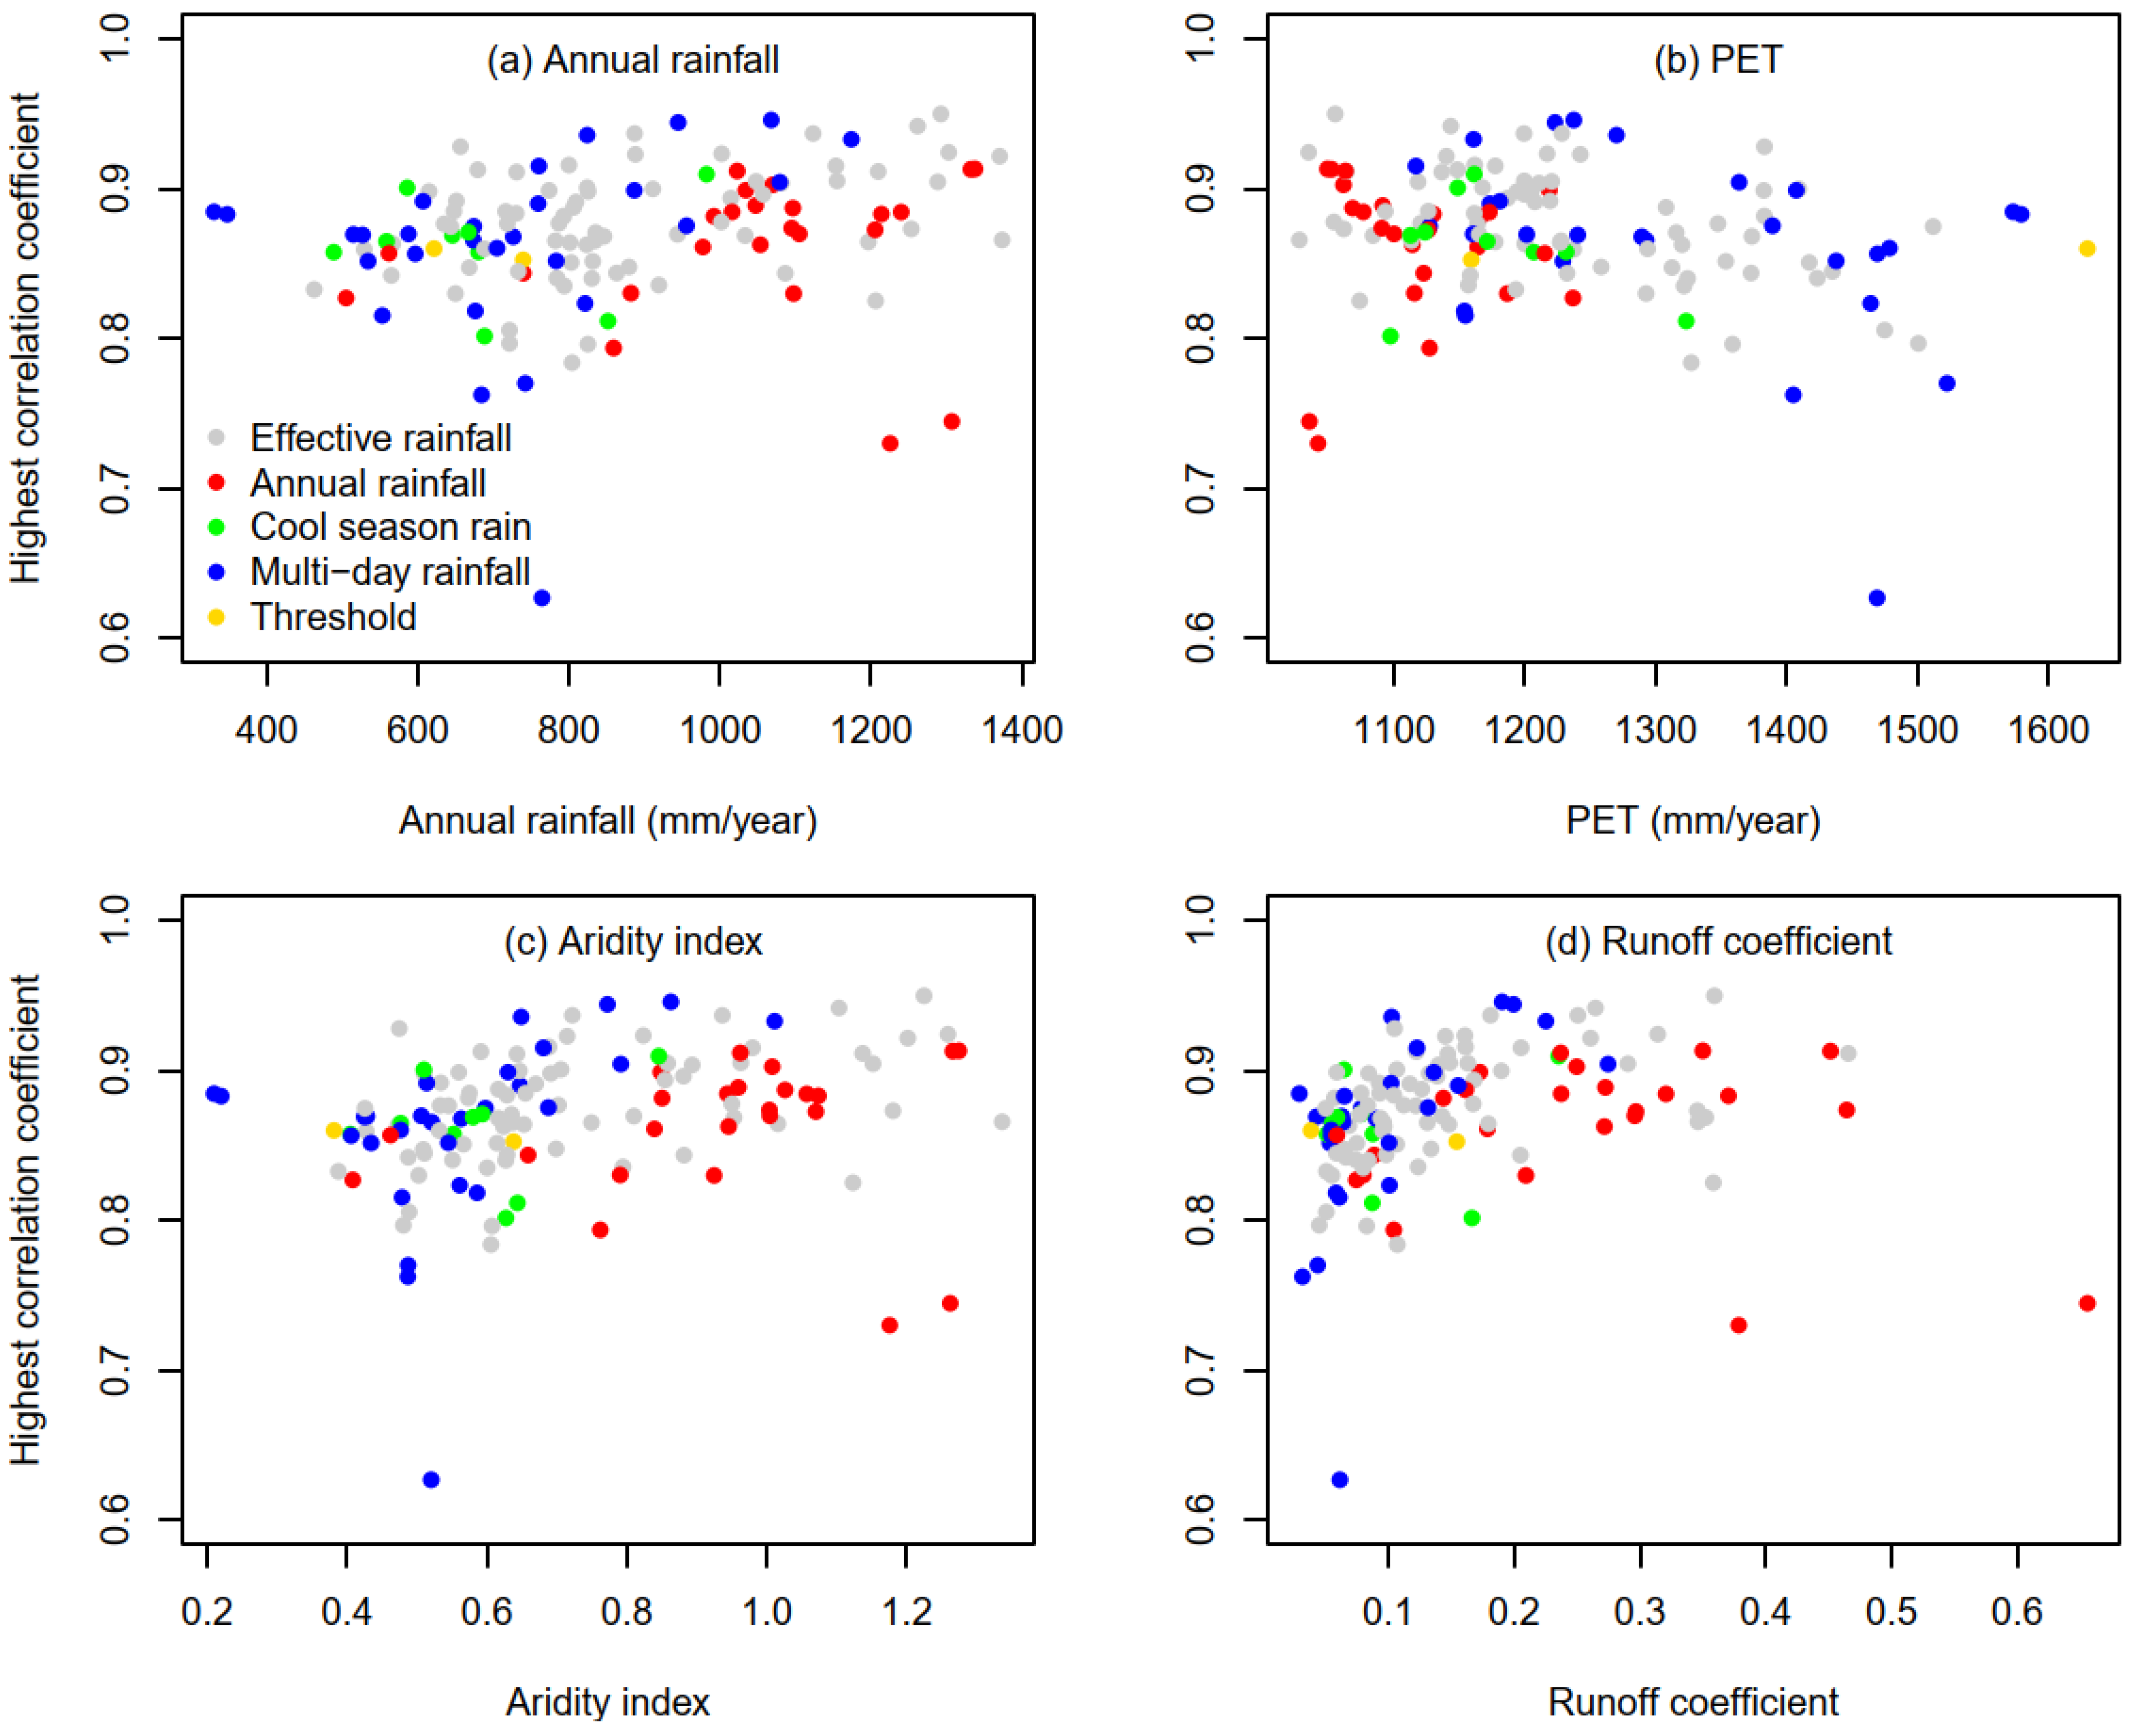
| Effective rainfall | EffRainD | 19 | 52.6 | Rainfall: 462–1374 (879) * mm/year Aridity Index: 0.4–1.3 (0.7) * Runoff/Rain: 0.05–0.47 (0.14) * |
| EffRainM | 51 | |||
| Annual rainfall | AP | 24 | 18.0 | Rainfall: 505–1338 (1042) * mm/year Aridity Index: 0.4–1.3 (0.9) * Runoff/Rain: 0.06–0.66 (0.26) * |
| Multi-day rainfall totals | D90P99 | 13 | 21.1 | Rainfall: 330–1174 (725) * mm/year Aridity Index: 0.2–1.0 (0.6) * Runoff/Rain: 0.03–0.27 (0.10) * |
| D90Max | 11 | |||
| D30Max | 2 | |||
| D10Max | 1 | |||
| D7P99 | 1 | |||
| Total rainfall over the cool season | M310 | 9 | 6.8 | Rainfall: 488–982 (683) * mm/year Aridity Index: 0.4–0.8 (0.6) * Runoff/Rain: 0.05–0.24 (0.10) * |
| Total rainfall above a daily threshold | R20 | 1 | 1.5 | Rainfall: 621–739 (680) * mm/year Aridity Index: 0.4–0.6 (0.5) * Runoff/Rain: 0.04–0.15 (0.10) * |
| R30 | 1 |
| Streamflow | Statistics | GR4J | GR4J_Closed | PDM | SACSMA_NSW | SimHyd |
|---|---|---|---|---|---|---|
| Mean annual streamflow | EffRainM | 0.99 | 0.99 | 0.99 | 0.99 | 0.99 |
| EffRainD | 0.99 | 0.99 | 0.98 | 0.98 | 0.99 | |
| M310 | 0.96 | 0.96 | 0.96 | 0.97 | 0.98 | |
| AP | 0.96 | 0.96 | 0.96 | 0.96 | 0.97 | |
| R5 | 0.96 | 0.96 | 0.96 | 0.96 | 0.97 | |
| M410 | 0.96 | 0.96 | 0.95 | 0.96 | 0.98 | |
| R10 | 0.96 | 0.96 | 0.95 | 0.95 | 0.96 | |
| P90 | 0.95 | 0.95 | 0.94 | 0.94 | 0.95 | |
| RD10 | 0.94 | 0.94 | 0.94 | 0.94 | 0.95 | |
| D3P95 | 0.94 | 0.94 | 0.94 | 0.94 | 0.95 | |
| High-flow days (≥99th) | D90P95 | 0.94 | 0.94 | 0.91 | 0.93 | 0.92 |
| D120P95 | 0.93 | 0.93 | 0.91 | 0.92 | 0.92 | |
| D30P95 | 0.93 | 0.93 | 0.91 | 0.92 | 0.91 | |
| D150P95 | 0.93 | 0.93 | 0.90 | 0.92 | 0.91 | |
| D180P95 | 0.92 | 0.93 | 0.90 | 0.92 | 0.91 | |
| D10P95 | 0.91 | 0.91 | 0.89 | 0.91 | 0.90 | |
| D30P99 | 0.90 | 0.90 | 0.90 | 0.90 | 0.90 | |
| EffRainM | 0.91 | 0.91 | 0.88 | 0.90 | 0.89 | |
| D7P95 | 0.90 | 0.90 | 0.88 | 0.90 | 0.89 | |
| EffRainD | 0.90 | 0.90 | 0.88 | 0.90 | 0.88 | |
| Low-flow days (≤10th) | EffRainD | −0.87 | −0.86 | −0.79 | −0.91 | −0.85 |
| AP | −0.83 | −0.83 | −0.75 | −0.89 | −0.86 | |
| R5 | −0.83 | −0.83 | −0.75 | −0.89 | −0.86 | |
| R10 | −0.83 | −0.83 | −0.74 | −0.89 | −0.85 | |
| RD10 | −0.82 | −0.82 | −0.73 | −0.88 | −0.84 | |
| P90 | −0.82 | −0.82 | −0.73 | −0.88 | −0.84 | |
| R20 | −0.82 | −0.82 | −0.73 | −0.87 | −0.83 | |
| P95 | −0.82 | −0.82 | −0.73 | −0.87 | −0.83 | |
| RD5 | −0.81 | −0.81 | −0.73 | −0.87 | −0.85 | |
| RD20 | −0.82 | −0.82 | −0.73 | −0.87 | −0.83 | |
| 3-year minimum flow | Min3Yr | 0.91 | 0.91 | 0.93 | 0.89 | 0.90 |
| Min5Yr | 0.84 | 0.84 | 0.85 | 0.82 | 0.83 | |
| EffRainM | 0.72 | 0.72 | 0.73 | 0.72 | 0.72 | |
| EffRainD | 0.72 | 0.72 | 0.73 | 0.71 | 0.72 | |
| M310 | 0.70 | 0.70 | 0.71 | 0.70 | 0.71 | |
| M410 | 0.70 | 0.70 | 0.70 | 0.70 | 0.71 | |
| AP | 0.70 | 0.70 | 0.71 | 0.69 | 0.70 | |
| RD5 | 0.70 | 0.70 | 0.70 | 0.69 | 0.70 | |
| JJA | 0.70 | 0.70 | 0.69 | 0.70 | 0.71 | |
| R5 | 0.69 | 0.69 | 0.70 | 0.69 | 0.70 |
| Streamflow | Statistics | GR4J | GR4J_Closed | PDM | SACSMA_NSW | SimHyd |
|---|---|---|---|---|---|---|
| Mean annual streamflow | EffRainM | 0.91 | 0.91 | 0.88 | 0.92 | 0.93 |
| M410 | 0.85 | 0.85 | 0.81 | 0.83 | 0.88 | |
| M310 | 0.84 | 0.83 | 0.82 | 0.80 | 0.84 | |
| DJF | −0.72 | −0.72 | −0.66 | −0.67 | −0.74 | |
| EffRainD | 0.69 | 0.69 | 0.63 | 0.67 | 0.57 | |
| JJA | 0.61 | 0.61 | 0.62 | 0.55 | 0.58 | |
| D90P95 | 0.56 | 0.56 | 0.58 | 0.52 | 0.53 | |
| D120P95 | 0.54 | 0.54 | 0.56 | 0.50 | 0.51 | |
| D150P95 | 0.52 | 0.52 | 0.52 | 0.47 | 0.49 | |
| D30P95 | 0.50 | 0.50 | 0.51 | 0.49 | 0.47 | |
| High-flow days (≥99th) | D90P95 | 0.73 | 0.73 | 0.66 | 0.70 | 0.67 |
| D30P99 | 0.66 | 0.66 | 0.69 | 0.65 | 0.68 | |
| D120P95 | 0.70 | 0.70 | 0.63 | 0.66 | 0.64 | |
| D150P95 | 0.68 | 0.68 | 0.61 | 0.64 | 0.62 | |
| D90P99 | 0.66 | 0.66 | 0.63 | 0.61 | 0.64 | |
| D30P95 | 0.65 | 0.65 | 0.60 | 0.64 | 0.60 | |
| D180P95 | 0.64 | 0.65 | 0.58 | 0.60 | 0.58 | |
| D120P99 | 0.62 | 0.63 | 0.59 | 0.58 | 0.60 | |
| D150P99 | 0.57 | 0.58 | 0.53 | 0.52 | 0.54 | |
| D180P99 | 0.51 | 0.52 | 0.48 | 0.47 | 0.48 | |
| Low-flow days (≤10th) | EffRainM | 0.66 | 0.66 | 0.71 | 0.36 | 0.64 |
| M410 | 0.57 | 0.57 | 0.61 | 0.28 | 0.53 | |
| D90P95 | 0.53 | 0.53 | 0.45 | 0.47 | 0.47 | |
| D120P95 | 0.51 | 0.51 | 0.45 | 0.46 | 0.46 | |
| D150P95 | 0.50 | 0.50 | 0.44 | 0.45 | 0.45 | |
| D30P95 | 0.50 | 0.50 | 0.45 | 0.40 | 0.46 | |
| D180P95 | 0.49 | 0.49 | 0.42 | 0.45 | 0.42 | |
| DJF | −0.48 | −0.49 | −0.55 | −0.18 | −0.46 | |
| JJA | 0.47 | 0.46 | 0.40 | 0.40 | 0.43 | |
| M310 | 0.49 | 0.49 | 0.53 | 0.21 | 0.39 | |
| 3-year minimum flow | Min3Yr | 0.82 | 0.83 | 0.88 | 0.77 | 0.75 |
| Min5Yr | 0.63 | 0.64 | 0.67 | 0.60 | 0.59 | |
| CvRain | −0.41 | −0.42 | −0.43 | −0.39 | −0.38 | |
| D180P95 | −0.26 | −0.26 | −0.27 | −0.25 | −0.25 | |
| Max5Yr | −0.25 | −0.25 | −0.26 | −0.25 | −0.24 | |
| D150P95 | −0.23 | −0.23 | −0.24 | −0.21 | −0.22 | |
| Max3Yr | −0.21 | −0.21 | −0.22 | −0.21 | −0.20 | |
| D180P99 | −0.20 | −0.20 | −0.21 | −0.20 | −0.19 | |
| D120P95 | −0.18 | −0.18 | −0.19 | −0.17 | −0.17 | |
| D150P99 | −0.18 | −0.18 | −0.19 | −0.17 | −0.17 |
| Streamflow | Statistics | GR4J | GR4J_Closed | PDM | SACSMA_NSW | SimHyd |
|---|---|---|---|---|---|---|
| Mean annual streamflow | D30P99 | 0.68 | 0.64 | 0.73 | 0.70 | 0.67 |
| EffRainM | 0.70 | 0.68 | 0.65 | 0.72 | 0.65 | |
| D90P99 | 0.66 | 0.65 | 0.68 | 0.58 | 0.66 | |
| D120P99 | 0.66 | 0.66 | 0.67 | 0.57 | 0.66 | |
| D150P99 | 0.66 | 0.67 | 0.65 | 0.57 | 0.65 | |
| CvRain | 0.67 | 0.70 | 0.68 | 0.54 | 0.59 | |
| D180P99 | 0.63 | 0.65 | 0.61 | 0.54 | 0.63 | |
| D10P99 | 0.55 | 0.52 | 0.60 | 0.63 | 0.51 | |
| D180P95 | 0.55 | 0.56 | 0.64 | 0.45 | 0.51 | |
| D150P95 | 0.53 | 0.54 | 0.63 | 0.43 | 0.51 | |
| High-flow days (≥99th) | D30P99 | 0.63 | 0.63 | 0.75 | 0.71 | 0.78 |
| EffRainM | 0.62 | 0.62 | 0.62 | 0.69 | 0.64 | |
| D10P99 | 0.60 | 0.58 | 0.62 | 0.69 | 0.66 | |
| D90P99 | 0.59 | 0.61 | 0.68 | 0.57 | 0.70 | |
| D120P99 | 0.59 | 0.61 | 0.65 | 0.54 | 0.67 | |
| D150P99 | 0.57 | 0.60 | 0.63 | 0.54 | 0.64 | |
| CvRain | 0.63 | 0.65 | 0.61 | 0.52 | 0.55 | |
| D180P95 | 0.58 | 0.60 | 0.63 | 0.48 | 0.57 | |
| D120P95 | 0.55 | 0.56 | 0.63 | 0.46 | 0.58 | |
| D150P95 | 0.56 | 0.57 | 0.62 | 0.46 | 0.58 | |
| Low-flow days (≤10th) | CvRain | 0.61 | 0.63 | −0.09 | −0.34 | 0.30 |
| D30P95 | 0.48 | 0.47 | −0.21 | −0.35 | 0.43 | |
| D90P95 | 0.48 | 0.48 | −0.21 | −0.23 | 0.41 | |
| D120P95 | 0.47 | 0.47 | −0.17 | −0.21 | 0.40 | |
| D180P95 | 0.48 | 0.48 | −0.11 | −0.23 | 0.38 | |
| D150P95 | 0.46 | 0.47 | −0.13 | −0.20 | 0.40 | |
| D7P99 | 0.35 | 0.34 | −0.17 | −0.38 | 0.33 | |
| D30P99 | 0.39 | 0.38 | −0.17 | −0.31 | 0.31 | |
| D10P99 | 0.36 | 0.36 | −0.20 | −0.34 | 0.30 | |
| D10P95 | 0.29 | 0.28 | −0.07 | −0.56 | 0.37 | |
| 3-year minimum flow | Min3Yr | 0.65 | 0.71 | 0.48 | 0.50 | 0.78 |
| Min5Yr | 0.47 | 0.52 | 0.37 | 0.39 | 0.56 | |
| CvRain | −0.28 | −0.30 | −0.22 | −0.24 | −0.33 | |
| Max5Yr | −0.18 | −0.20 | −0.17 | −0.17 | −0.20 | |
| Max3Yr | −0.17 | −0.19 | −0.18 | −0.15 | −0.17 | |
| D180P95 | −0.18 | −0.19 | −0.14 | −0.14 | −0.19 | |
| D150P95 | −0.18 | −0.19 | −0.14 | −0.14 | −0.19 | |
| D30P99 | −0.17 | −0.17 | −0.14 | −0.14 | −0.17 | |
| D150P99 | −0.16 | −0.16 | −0.16 | −0.12 | −0.16 | |
| D120P99 | −0.16 | −0.16 | −0.16 | −0.11 | −0.16 |
Disclaimer/Publisher’s Note: The statements, opinions and data contained in all publications are solely those of the individual author(s) and contributor(s) and not of MDPI and/or the editor(s). MDPI and/or the editor(s) disclaim responsibility for any injury to people or property resulting from any ideas, methods, instructions or products referred to in the content. |
© 2025 by the authors. Licensee MDPI, Basel, Switzerland. This article is an open access article distributed under the terms and conditions of the Creative Commons Attribution (CC BY) license (https://creativecommons.org/licenses/by/4.0/).
Share and Cite
Fu, G.; Post, D.A.; Chiew, F.H.S.; Khan, Z.; Zheng, H. Influence of Climate Characteristics on Streamflow in the Murray–Darling Basin. Water 2025, 17, 3364. https://doi.org/10.3390/w17233364
Fu G, Post DA, Chiew FHS, Khan Z, Zheng H. Influence of Climate Characteristics on Streamflow in the Murray–Darling Basin. Water. 2025; 17(23):3364. https://doi.org/10.3390/w17233364
Chicago/Turabian StyleFu, Guobin, David A. Post, Francis H. S. Chiew, Zaved Khan, and Hongxing Zheng. 2025. "Influence of Climate Characteristics on Streamflow in the Murray–Darling Basin" Water 17, no. 23: 3364. https://doi.org/10.3390/w17233364
APA StyleFu, G., Post, D. A., Chiew, F. H. S., Khan, Z., & Zheng, H. (2025). Influence of Climate Characteristics on Streamflow in the Murray–Darling Basin. Water, 17(23), 3364. https://doi.org/10.3390/w17233364


