Article

Integrated Geomorphic Mapping and Hydraulic Modeling to Identify Potential Channel Reconnection Sites for Alternatives Analysis on the Clearwater River, Washington, USA

by
Erin G. Connor
*,
Melissa A. Foster
* and
Jennifer A. Bountry
Sedimentation and River Hydraulics Group, Technical Service Center, Bureau of Reclamation, Denver, CO 80022, USA
*
Authors to whom correspondence should be addressed.
Water 2025, 17(23), 3359; https://doi.org/10.3390/w17233359
Submission received: 19 August 2025 / Revised: 15 November 2025 / Accepted: 18 November 2025 / Published: 25 November 2025
(This article belongs to the Section Hydraulics and Hydrodynamics)

Abstract

The Clearwater River, located in western Washington, USA, is a free-flowing river with high precipitation rates impacted by spatially extensive logging throughout the 1900s. Declining salmon productivity within the watershed has been linked to the effects of legacy deforestation, including increased fine sediment loads, a lack of large wood and physical habitat complexity, and potential channel incision coupled with side channel and floodplain disconnection. To test a conceptual model positing that the river’s geomorphic diversity was declining, potentially due to anthropogenic incision, we employed a dual approach, combining historical geomorphic mapping and current-condition hydraulic modeling using SRH-2D. A dual approach allows us to identify mainstem river reaches with the greatest potential for floodplain and side channel reconnection by utilizing increased roughness as a proxy for of large wood effects on the river stage. Based on our geomorphic mapping, the area occupied by the mainstem river and surrounding geomorphic units has remained relatively stable through time. However, there was a marked decrease in the side channel connections within the downstream-most 30 river kilometers, confirmed through the hydraulic modeling results. Between river kilometers 10 and 20, river stages at 2-year recurrence interval peak discharge are located over 2 m below young Holocene terraces and could indicate a recent anthropogenic incision contributing to side channel disconnection. A decrease in unvegetated alluvium through time also indicates that there could be less dynamic lateral channel movement and overbank inundation between 1980 and 2017, despite a similar history of high peak flows. Overall, even though the river is able to balance the loss of the active geomorphic unit area with the incorporation of new geomorphic units through lateral channel changes, this area is likely concentrated in a smaller number of individual channels and floodplains, specifically in the lower 30 river kilometers. This study provides a framework for a site-screening-level analysis in impacted watersheds, using a watershed impacted by legacy logging without flow regulation, where the impacts are often less pronounced than in dammed river systems.

1. Introduction

The Clearwater River, a tributary of the Queets River on the Olympic Peninsula in western Washington, is a culturally significant, unregulated river that provides fish, timber, and wildlife resources for the Quinault Indian Nation (QIN), Washington State, and local stakeholders. The watershed supports several fish species of concern, with approximately 115 river kilometers (r-km) of tributaries and 61 r-km of mainstem channel, which provide habitat for anadromous salmon [1]. The status of Clearwater River coho salmon (Oncorhynchus kisutch) is diminished, in part, due to reduced smolt capacity and productivity (e.g., [2,3]).
The impaired condition of freshwater salmon habitat in the Clearwater River watershed is attributed to the combined legacy impacts of timber harvest, roads management, and large wood removal from streams [1,4,5,6]. By 1980, approximately 40% of the Clearwater basin was logged by high-lead clearcutting systems with a road density of 1.7 km/km2 [5]. The prevalence of fine sediment (<0.85 mm diameter) in spawning gravels is positively correlated with the percent of the basin subjected to logging and the length of roads (km) per square kilometer (km2) of basin area (e.g., [1,7,8]). Extensive logging in many basins is associated with aggradation (e.g., [6]), and past studies in the 1970s and 1980s noted that the Clearwater River experienced significant sediment-related impacts [1,2,5,9]. Fine sediment impacts spawning habitats and their quality (e.g., [8,10]), including habitat and spawning success in the Clearwater River (e.g., [4,5]). Cederholm and Reid [9] concluded the most significant factor influencing the higher mortalities of Coho salmonid embryos and juveniles in the Clearwater River during egg incubation and overwintering life stages was the elevated sediment loads relative to the old-growth forests [9]. Many of the tributary systems in the Clearwater River continue to contribute high sediment loads, which negatively affect the quality of salmon habitat [3]. Although the increased fine sediment load remains problematic, QIN also identified mainstem channel incision and the disconnection of floodplains and off-channel habitats as key issues facing the Clearwater River [4].
Land management and deforestation, including past removal of large log jams from rivers, reduce the available source of large woody debris within a river basin, resulting in major changes to river ecosystems and morphometry (e.g., [11,12]). The post-timber harvest riparian corridor represents less diverse hardwood species, with diminished productivity in terms of food web maintenance for salmonids resulting from reduced relative densities of macroinvertebrates and heterotrophic microorganisms [4]. Heterogeneity in channel geometry and morphology provides critical physical habitat and refugia for fish, and promotes biological diversity (e.g., [13]). Woody debris is critical to promoting a diverse stream planform geomorphology on the nearby Queets River [14]. Due to its steeper slope, the Clearwater River may have contained fewer logjams than Queets and Hoh Rivers (J. Cederholm; personal communication reported by [15]), but the addition of woody debris can improve aquatic habitats [16] and is recommended for the Clearwater River basin [17]. Without aggressive restoration of in-stream, off-channel habitat, floodplains, and riparian habitats, Clearwater River coho and other salmon populations are expected to take decades, or even longer, to recover on their own [2]. Current goals for river and stream habitat within the Clearwater River basin include increasing the presence of woody debris throughout the mainstem river and tributary channels, in addition to increasing access to off-channel habitats [18]. Despite robust analyses of the decline in fisheries and impacts of logging, studies have not been undertaken to quantify the magnitude of Clearwater River floodplain and side channel disconnection, or the feasibility of hydrologic restoration to inform strategic implementation by local entities.
Our study aims to test the viability of utilizing geomorphic and hydraulic drivers as a method to identify suitable reaches for off-channel and floodplain reconnections proposed to be vital mechanisms in increasing accessible habitats for threatened fish. Hydraulic modeling is a common practice in the river restoration industry to test alternatives and document changes to flood inundation [19,20]. Common incorporations of geomorphic mapping with hydraulics in restoration studies use modern topography to detect geomorphic change (e.g., [21,22]), or to delineate modern geomorphic features (e.g., [20,23]). Comprehensive geomorphic mapping using historical maps or imagery over decades (e.g., [24,25,26]) is not commonly implemented in conjunction with hydraulic modeling. The lower 35 r-km of the mainstem Clearwater River offers a unique opportunity to test our methodology since the basin hydrology is unregulated but has significant impairment due to historical logging in a coastal basin setting of northwestern Washington State. We utilize a dual approach, combining historical geomorphic mapping and current-condition hydraulic modeling, to quantify Clearwater River’s historical evolution and existing hydraulic conditions after several decades of logging within the watershed. While we classify river reaches potentially impacted by anthropogenic changes, we also aim to identify target reaches for potential restoration and hydraulic reconnection to increase accessible habitat for threatened fish, regardless of the magnitude of past impacts. These data serve as a baseline to inform QIN efforts to identify habitat impairments and prioritize river corridor segments for site-specific and reach-scale restoration actions for in-stream and floodplain habitat. With this case study, we demonstrate how an approach integrating geomorphic mapping and hydraulic modeling provides a more comprehensive evaluation of restoration potential in a historical context. Motivated by stakeholder input and initial field observations suggesting a conceptual model where anthropogenically driven incision degrades salmon habitat, we employ this dual approach to test this hypothesis, delineate impacted areas, and identify potential candidates for habitat rehabilitation.

2. Study Area

The Clearwater River’s geomorphology and morphometry have been shaped by regional tectonic uplift, fluvial incision, and sediment generated from Quaternary glaciations in an upper basin tributary, Snahapish Creek (e.g., [27]; Figure 1). Basin elevation is between 8 m and 1173 m with mean annual precipitation rates between 250 centimeters per year (cm/yr) and 400 cm/yr [28]. The headwaters are marked by higher-relief, bedrock-dominated channels, whereas the lower Clearwater River valley is a relatively-low-gradient mixed-bedrock channel surrounded by Quaternary deposits. Overall, the longitudinal profile along the lower 35 r-km exhibits a concave-up shape, indicating that the Clearwater River is in equilibrium with the Queets River, and Holocene fluvial incision rates are keeping pace with or exceeding tectonic uplift rates [15]. However, there are several small knickpoints along the profile, including a broad convexity along the mainstem, just upstream from the mouth of Snahapish Creek, likely controlled by local uplift associated with the underlying structural geology [27]. Along the approximately 5 r-km upstream from the Clearwater River’s confluence with the Queets River, the low slope (0.0017) and close location to the Pacific Ocean allow rising and falling tides to affect water surface elevations along the lower river. The slope of the Clearwater from r-km 5 to r-km 35 increases with the distance upstream but has an average bed slope of 0.0024.
Although the Clearwater River’s Quaternary valley is wide, the modern channel bottom is laterally confined in many reaches by bedrock valley walls underlying abandoned Quaternary strath terraces [15]. Strath terraces form as the river laterally cuts across a bedrock surface, leaving behind a thin veil of alluvium [29]. The terraces are abandoned when the river becomes dominated by vertical incision. Vertical and lateral incision rates, which can drive terrace formation, are controlled by variations in watershed hydrology and sediment yield (e.g., [30]). Wegmann mapped a flight of Quaternary strath terraces bounding the mainstem Clearwater River, ranging in age from Pleistocene (Qt1, >200 thousand years (ka)) to younger Holocene (Qt6 (0.3–2 ka) and Qt7, (0.03–0.3 ka)) [31]. Wegmann and Pazzaglia point to fluctuations in the Holocene climate as a potential source of the changing sediment flux from hillslopes, driving strath terrace formation, as well as sediment flux from landslides potentially triggered by earthquakes or fires [15]. The modern valley area readily accessible for geomorphic change predominantly lies within the boundary of the Holocene alluvium and younger Holocene terraces, Qt6 and Qt7.
The geomorphology and sedimentology of Holocene terraces most relevant to this study are similar to that of the modern channel marked by a low-relief bedrock surface overlain by a mostly uniform and continuous mantle of coarse gravel bars and overbank fine silt deposits [15]. Radiocarbon dating indicates that Holocene incision in the Clearwater River valley increases with distance upstream. Incision rates are approximately 0.05–1 mm/yr in the lower 24 r-km of our study area, 1–2 mm/yr in the upper portion of our study area, and increase to approximately 2–3 mm/yr above r-km 40, outside of our study area [15]. The lowest Quaternary terrace, Qt7, developed upon its own distinct bedrock strath in the upper portion of our study area, likely coinciding with regions of higher incision; in lower reaches, the Qt7 strath appears as a fill terraces cut and deposited into the Qt6 [15]. In many locations, the lowest Qt7 terrace is marked by the presence of uniformly aged alders, approximately 30 years old at the time of Wegmann’s mapping in the late 1990s, coincident with intense clearcutting logging practices [31]. Thus, the Qt6 terrace is likely the youngest preserved pre-anthropogenic surface underlain by a distinct strath from the modern channel bottom. In contrast, the Qt7 fill terraces could be associated with land use practices.
Landslides in the Clearwater River basin can be a significant source of sediment to the river and its tributaries. A 1981 landslide inventory in the Clearwater Basin was dominated by debris avalanches and slope failures initiated by stream incision [32]. Slope instability due to stream undercutting is a common and natural form of mass wasting, but stream incision rates can be exacerbated from increased runoff due to logging and landscape management practices [32]. The majority of the 1020 mapped landslides within the Washington Division of Geology and Earth Resources (WDGER) are spatially small, although a handful of larger landslides are located along the mainstem river and tributaries [33]. Wegmann and Pazzaglia also mapped a number of larger Quaternary landslides along the mainstem river [15].
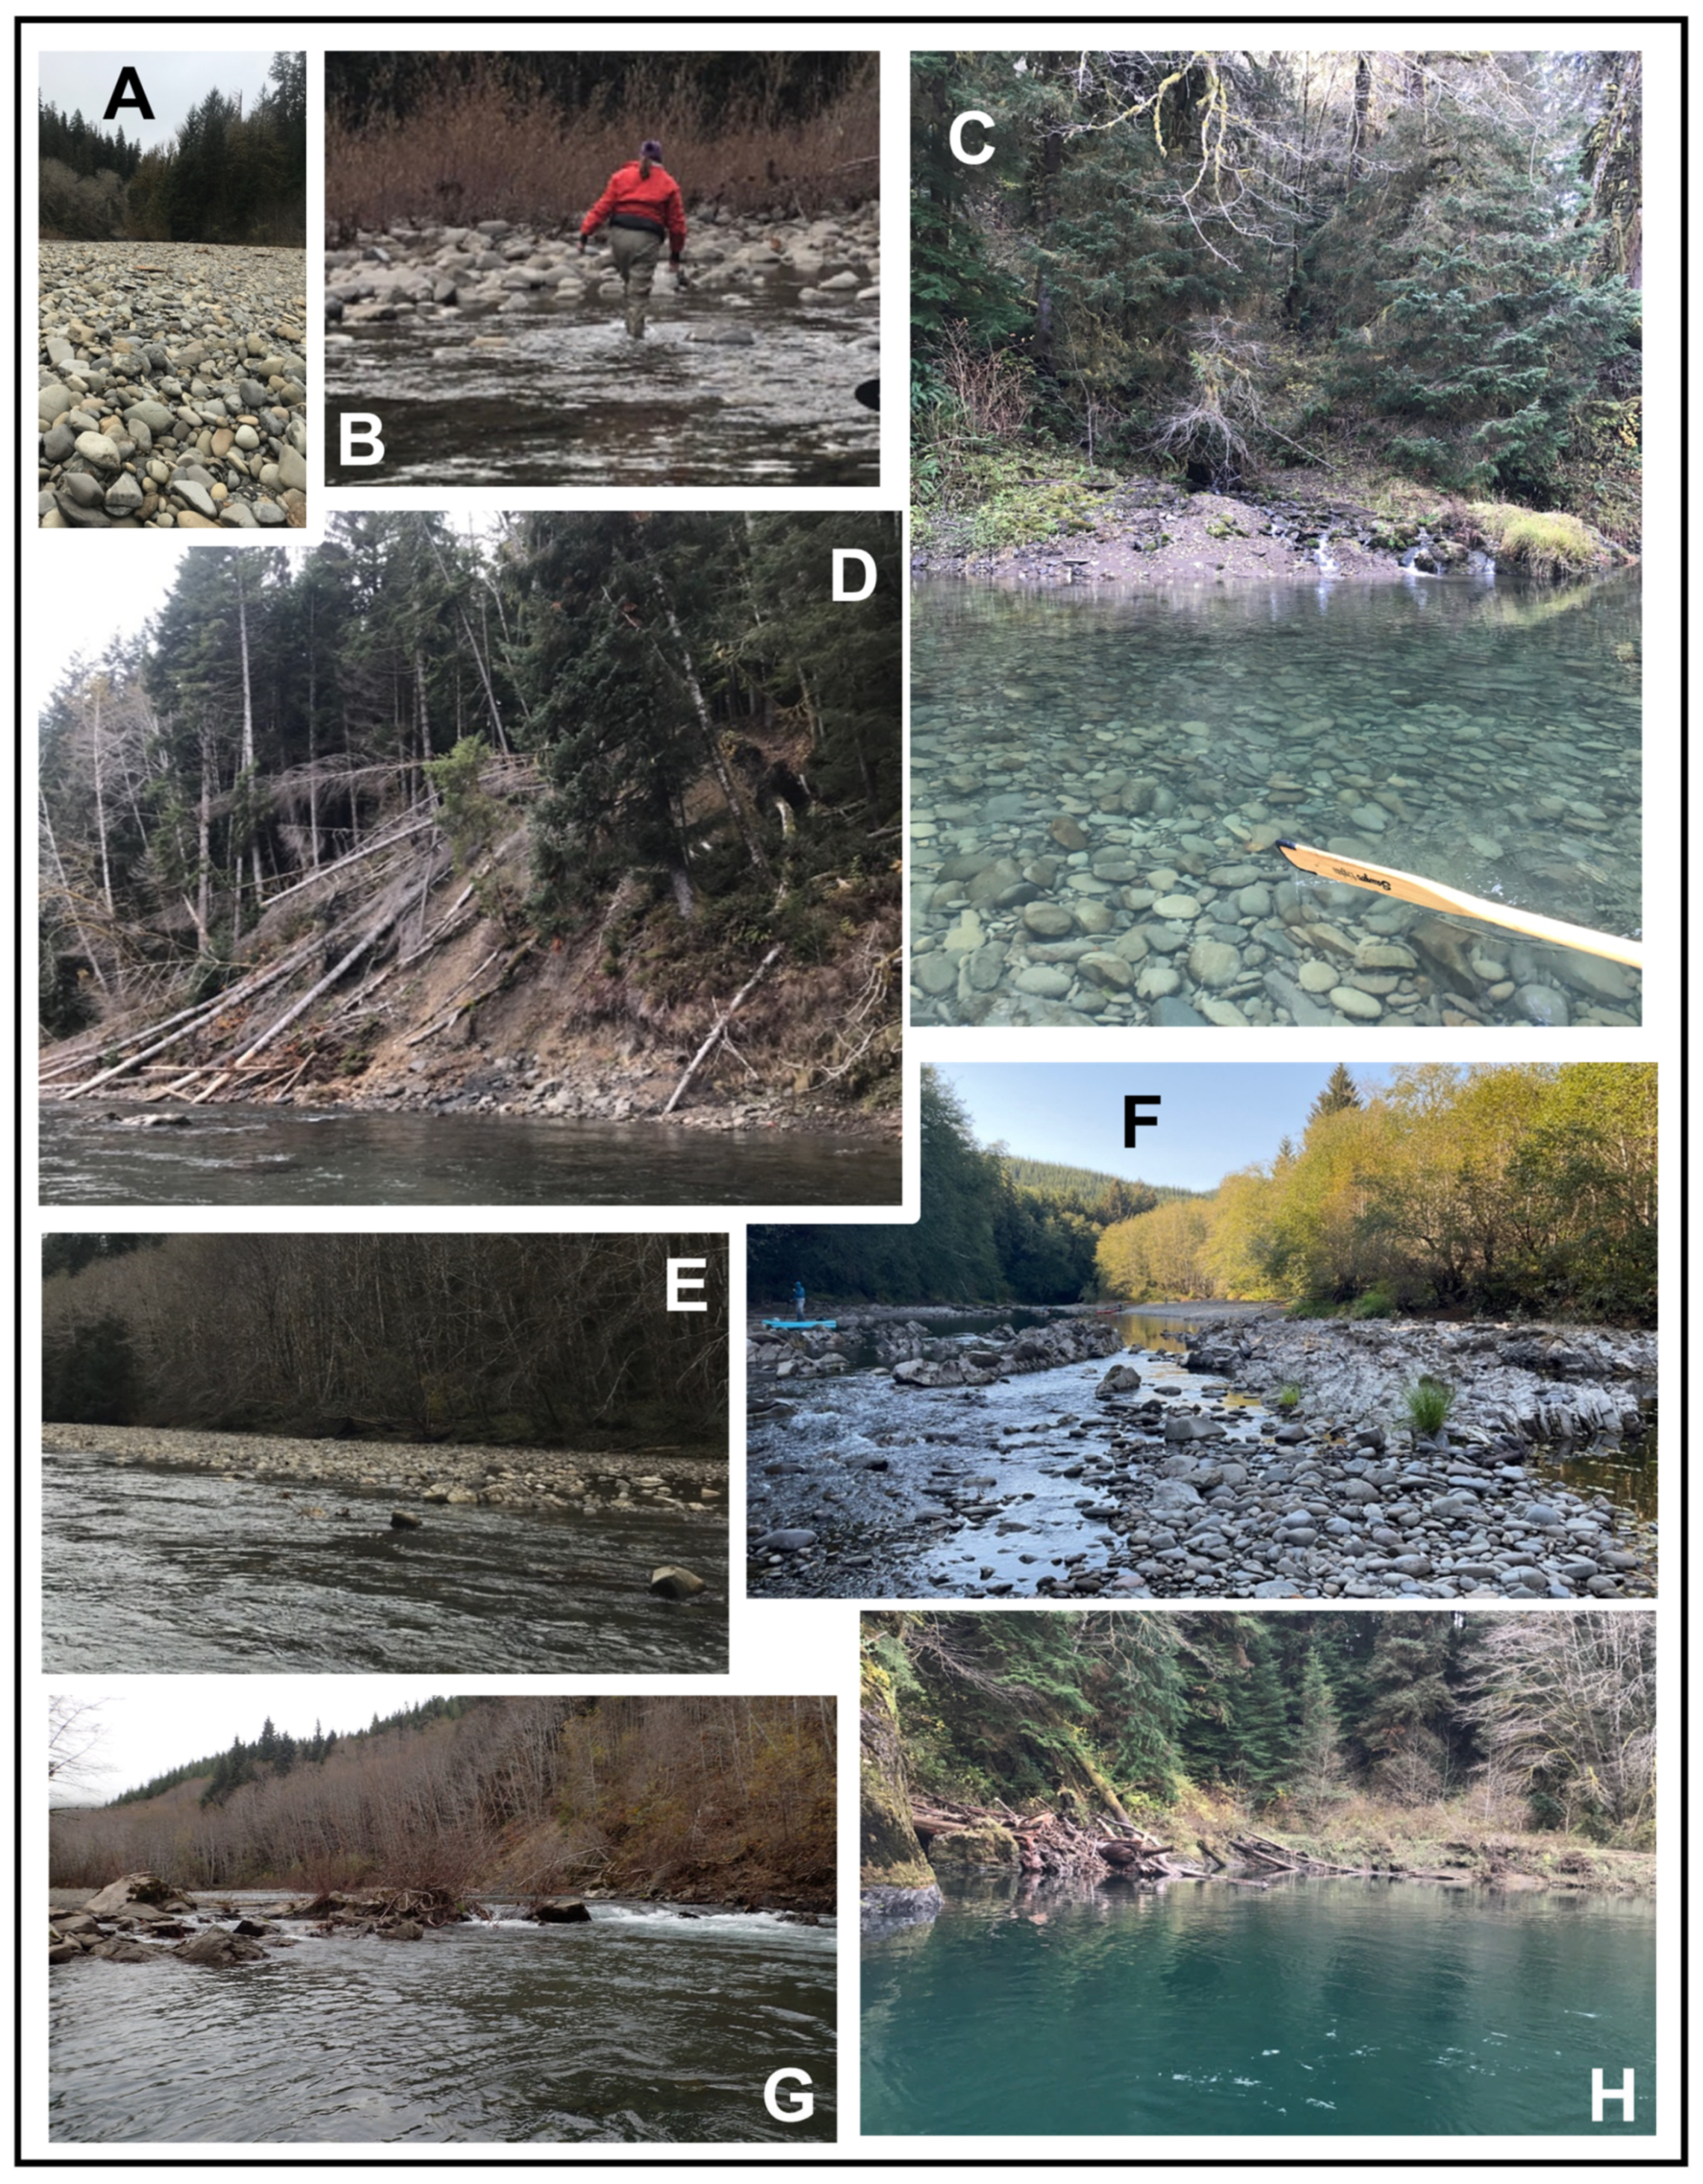
In 2019 and 2022, we completed two field reconnaissance level mapping trips along the Clearwater River between r-km 38 and r-km 2. We also observed bank erosion and numerous shallow landslides along the soil banks of the Clearwater River (Figure 2), often exposing bedrock, consistent with debris avalanches documented in the past [32] and potential stream undercutting at banks. Along the meander bends, we also noted mass wasting from lateral migration into higher strath and fill terraces. Several reaches of the river also exhibited vertical, exposed bedrock on the riverbanks. Many tributary junctions were perched above the main channel, with knickpoints located a short distance up the tributary channels. In some cases, tributary alluvial fans had formed a short distance up the tributary channel, potentially indicating that increased sediment load on tributaries coupled with mainstem channel incision could be impacting hydraulic connectivity.
The mainstem channel is predominantly a cobbled substrate (Figure 2), with sand and gravel bars, lacking the large wood and complexity that is associated with woody debris. During low flow fall conditions, we observed unconsolidated fine sediment covering the patches of the gravel substrate, especially in deeper pools. Gravel bars within the channel often exhibited a flat-top topography, as if frequent scour dominated over deposition. Many floodplains are heavily vegetated and consist of a single tree species of similar age, lacking both species and age diversity.

3. Methods

Given the constraints of limited resources, extensive length of the river corridor, and its location within a landscape shaped by a prolonged history of logging, no single methodological approach was sufficient to address the questions posed by the community or to provide a practical means of screening the large number of river kilometers that were prioritized. The rationale for the integrated methodological framework we adopted is presented in the methodological diagram (Figure 3).
From known and hypothesized issues affecting the river ecosystem, we first developed a conceptual model of fluvial connectivity concerns and hypothesized the influence of anthropogenic impacts. We determined that a dual geomorphic and hydraulic approach was necessary to test the conceptual model. Specifically, historical geomorphic mapping allowed us to detect evidence of changes in floodplain connectivity through time, and hydraulic modeling allowed us to validate modern connectivity. Furthermore, the combination of the two methods allowed us to assess the potential for anthropogenic-drive incision and identify reaches with potential for restoration efforts to increase connectivity. Although this framework is demonstrated using the Clearwater River as a case study, we propose that the approach is broadly applicable and transferable to other river systems with similar characteristics.

3.1. Geomorphic and Landslide Mapping

We obtained aerial and satellite imagery to conduct geomorphic mapping for years 1939, 1950, 1980, 1994, 2006, and 2017 (Table 1), obtained from USGS Earth Explorer. For 1939, 1950, and 1980, we used photo mosaics created from single photos [34]. For the most recent mapping dataset, our final product represents a combination of field observations, mapping on 2017 satellite imagery, mapping on 2022 lidar data and relative elevation maps, and the incorporation of hydraulic modeling results to indicate defined overflow channels.
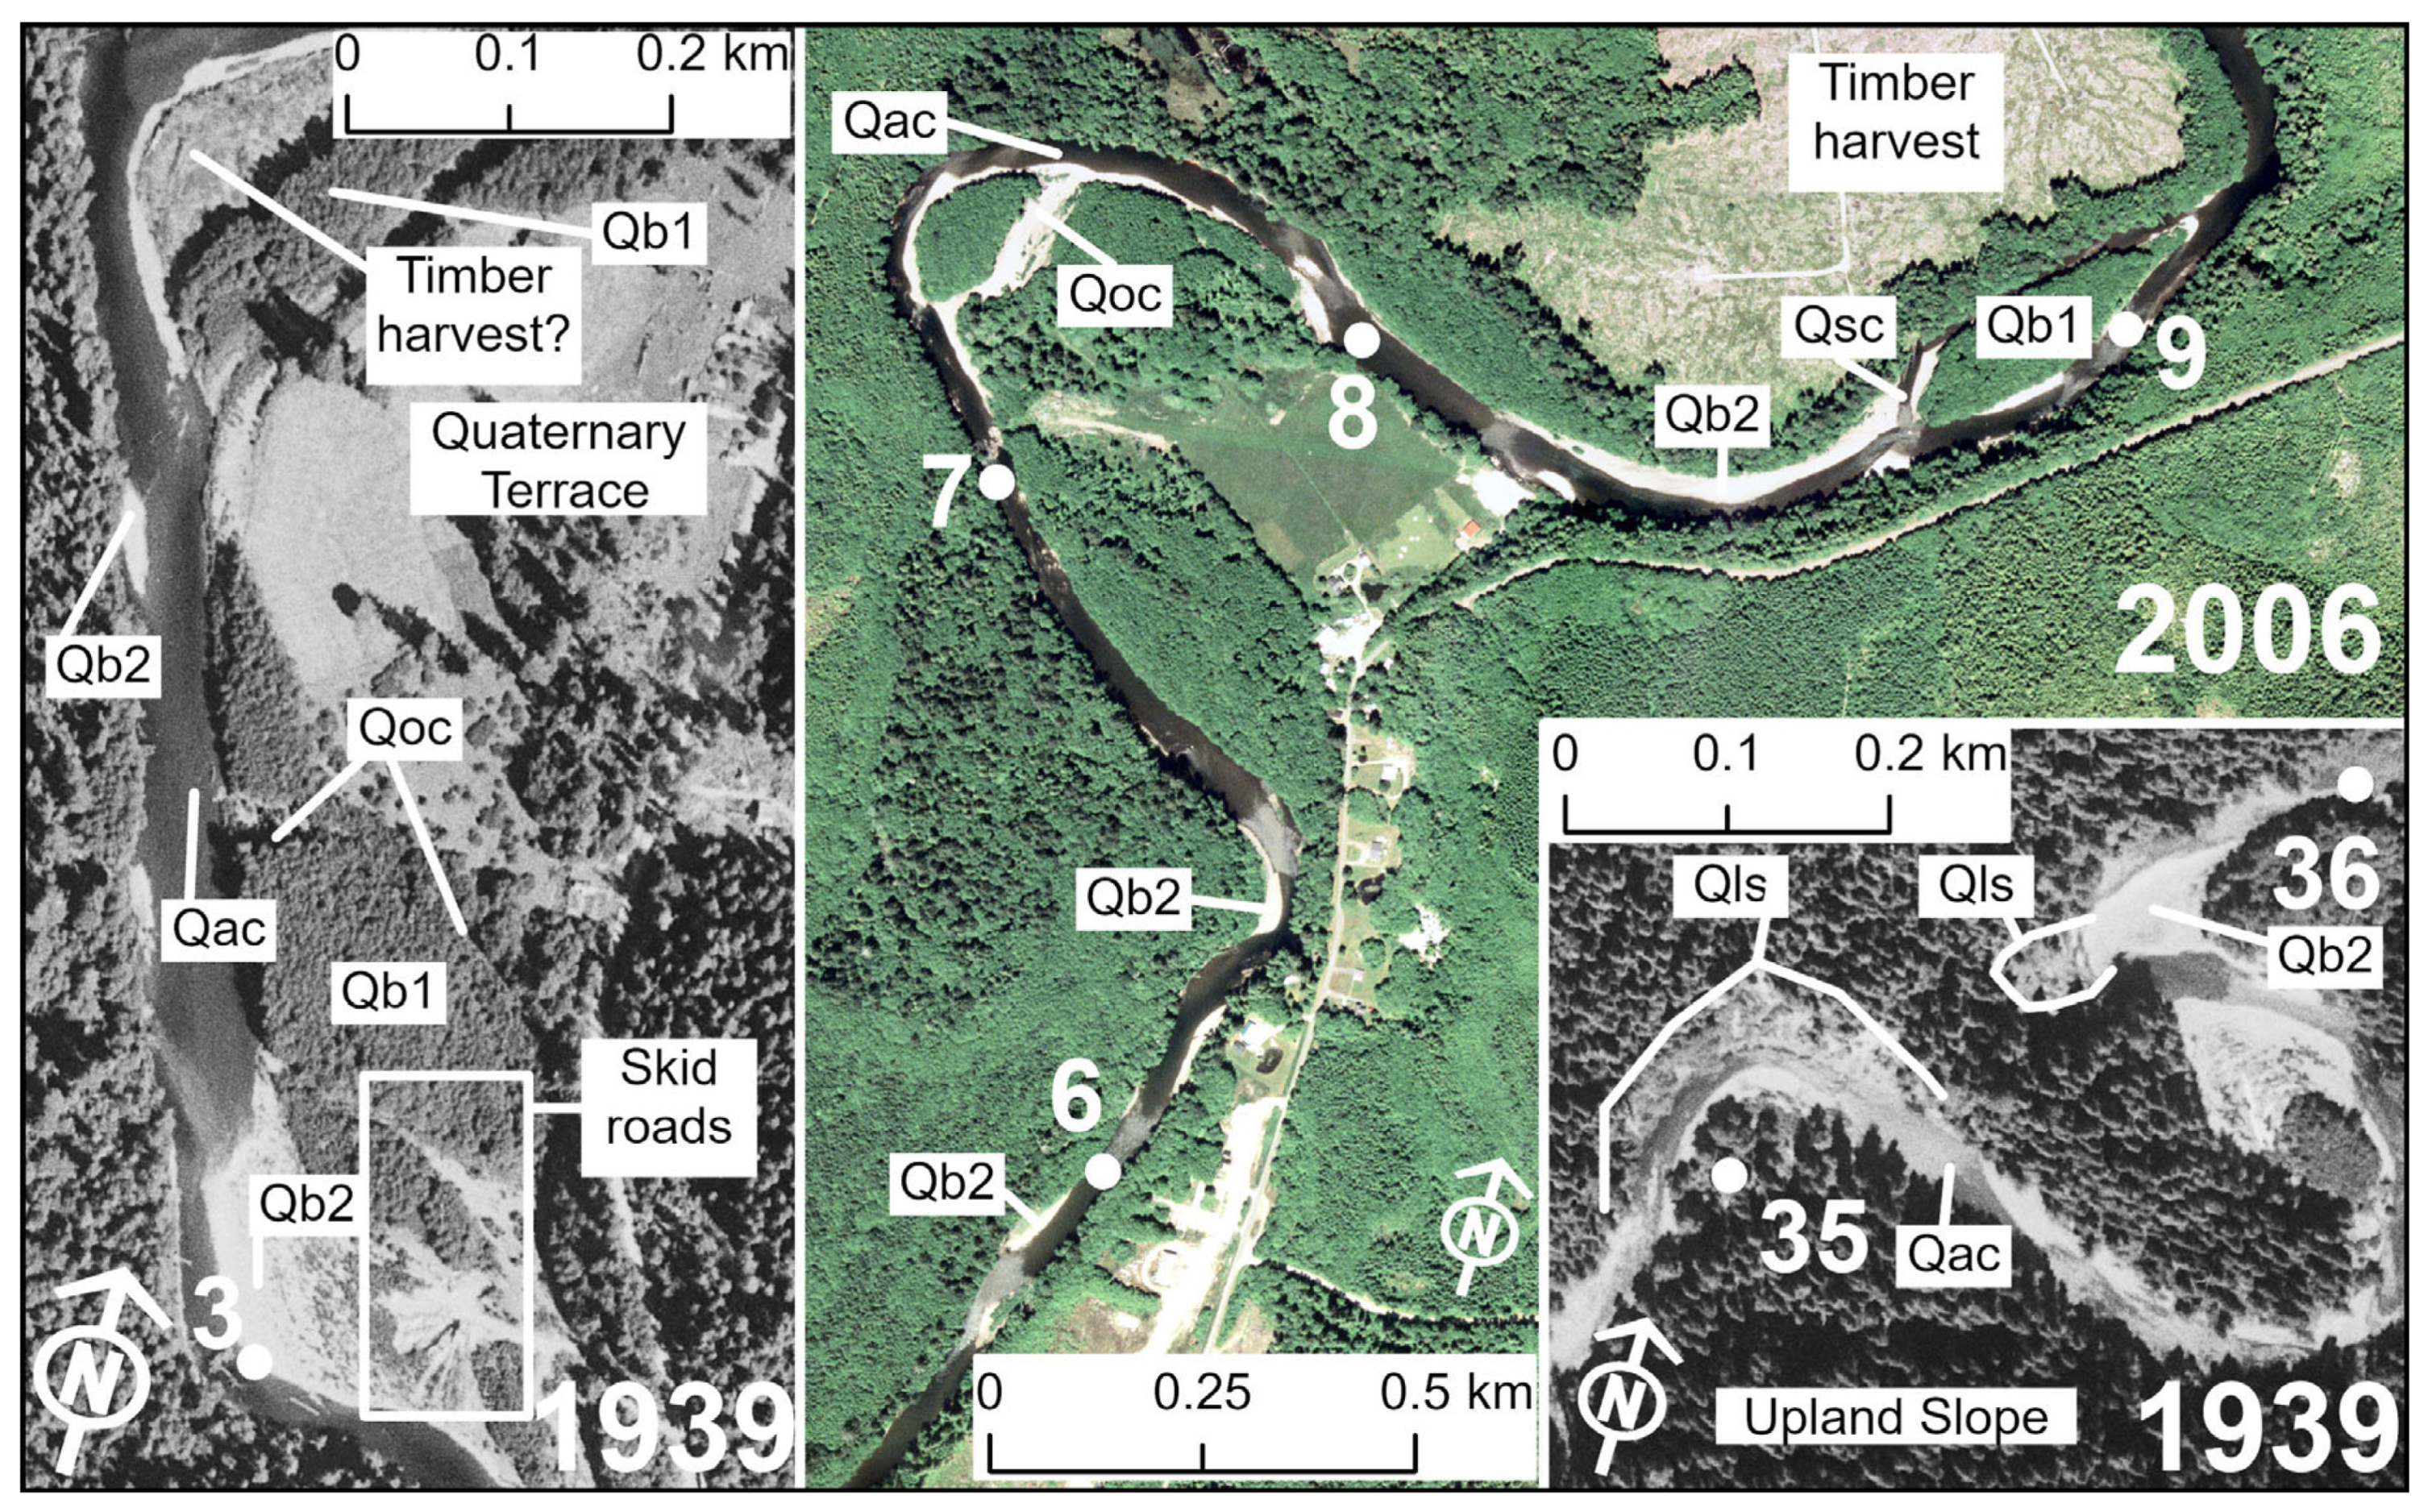
As a starting point for modern geomorphic mapping along the river, we georectified maps with the extent of Holocene and Quaternary terraces bounding the river, as well as general tributary locations (Wegmann, personal communication). Wegmann conducted his mapping in the late 1990s, when the mainstem river had a different configuration through some reaches than it does today and lidar data were not available [31]. Therefore, we used our best judgment to extend mapped polygons of terrace surfaces to match historical and more recent photosets. We identified and mapped nine geomorphic features as polygons on each imagery dataset using ESRI ArcGIS (version 3.3.0) along the lower 37.3 r-km of the mainstem Clearwater River (e.g., Figure 4). We extended the mapping area upstream from r-km 35 to a reach with less geomorphic complexity along the Clearwater River. The mapped geomorphic features include the following:
  • The mainstem channel (Qac) within the wetted perimeter or the defined channel banks of the Clearwater River. Occasionally, the mainstem channel may split around small mid-channel bars.
  • Side channels (Qsc) exhibit a defined bed and banks with water apparent in the channel or large swaths of bare alluvium, indicating the channel receives frequent flow.
  • Overflow channels (Qoc) exhibit a defined bed and banks that only receive flow during larger flood events. Because portions of the Clearwater River are heavily treed, these channels often appear as a dark lineation through the forest cover, and we mapped many with low confidence. These channels may originate from another channel or originate at the transition between unvegetated alluvium and defined channel banks. For mapping year 2017, we confirmed that all overflow channels mapped from satellite imagery were wetted by the 10 yr recurrence interval peak discharge.
  • Modeled overflow channels (Qocmodel) demonstrate defined flow paths, distinct from widespread floodplain inundation, in the hydraulic model for 2 yr, 5 yr, and 10 yr recurrence interval peak discharges. We identified these channels via hydraulic modeling using modern topography and not via imagery mapping.
  • Unvegetated (bare) alluvium (Qalbare) is modern/Holocene alluvium dominated by bare sand or gravel, or only small shrubs and grasses, indicating frequent inundation. This includes lateral bars, point bars, mid-channel bars, and exposed alluvium adjacent to channels. Within the GIS mapping, these bars are identified as ‘Qb2’ to indicate a younger bar than ‘Qb1’ (defined below), but we use the term Qalbare here for clarity.
  • Vegetated alluvium (Qalveg) is defined as modern/Holocene alluvium, vegetated by dense shrubs or trees. This is low-lying alluvium located below the younger Holocene terraces mapped by Wegmann (Qt6 and Qt7) [31]. We started with Wegmann’s Quaternary mapping, and it was difficult to differentiate terraces from low-lying, vegetated alluvium on historical imagery. Thus, Qalveg becomes more expansive in later photosets, as the channel laterally migrates, and we can conclude that vegetated areas have recently interacted with the river channel. Within the Qalveg unit, we also specifically map subunits within the ESRI ArcPro shapefile attributes.
  • Vegetated bars (Qb1), which are surrounded by defined channels (mainstem channel, side channels, or overflow channels) or unvegetated alluvium was mapped. Because these bars are surrounded by channels or bare alluvium, they are more likely to interact with the river channel and are included as part of the active geomorphic corridor.
    • Disconnected alluvium is defined as vegetated alluvium, outside of the active geomorphic corridor, that was previously occupied by channels or was bare alluvium in 1939–2006 imagery. The GIS mapping files provide additional details about when this unit was last occupied by active channels or bare alluvium. We distinguish these units as they could be potential targets for restoration efforts to reconnect former floodplains and channels.
    • Alluvial or colluvial fans (Qfan) are defined by a triangular wedge of material, typically located at tributary junctions (alluvial fans) or in an area of landslide deposition (colluvial fan), including both modern fans we mapped, and separate, generalized Quaternary fans units mapped by Wegmann [31].
  • Landslides (Qls) are areas of modern/Holocene mass-wasting, including generalized Quaternary landslides mapped by others [10,13]. We identified landslides during field work, or as bare scars on photosets, or hummocky topography and arcuate voids on hillshade imagery. We only concentrated on mapping landslides along the mainstem Clearwater River to identify areas of pervasive landsliding that could be problematic for any future in-channel designs.
  • The active geomorphic corridor is defined as the spatial extent of active channels or bare alluvium, including vegetated bars which are surrounded by active channels and bare alluvium. The active geomorphic corridor includes units Qac, Qsc, Qoc, Qocmodel, Qalbare (Qb2), Qb1, and Qfan (i.e., [26]).
The active geomorphic corridor includes channels and bare alluvium, as well as vegetated alluvium that is surrounded by water or bare alluvium, indicating that these vegetated bars may be inundated more frequently. Regularly inundated vegetated floodplains along valley margins are difficult to identify in historical imagery and track through time. We use the active geomorphic corridor because it is identifiable on historical imagery through time and may be used to represent a system’s geomorphic diversity (i.e., [26]). The most dynamic geomorphic units within the active geomorphic corridor are the units that are the most frequently inundated and marked by bare unvegetated alluvium, including the mainstem river, side channels, overflow channels, and fans (Qac, Qsc, Qoc, Qocmodel, Qalbare, and Qfan). If the system is gaining geomorphic diversity through time, it is expanding the portion of the valley occupied by channels through scouring flows. Alternatively, a sharp reduction in the active geomorphic corridor area often indicates increasing confinement and loss of geomorphic diversity through time. In some cases, if the entire valley is laterally migrating, the area covered by the active geomorphic corridor may remain stable as the lateral growth and incorporation of new floodplains and channels counters the loss of disconnected units.

3.2. Hydraulic Modeling

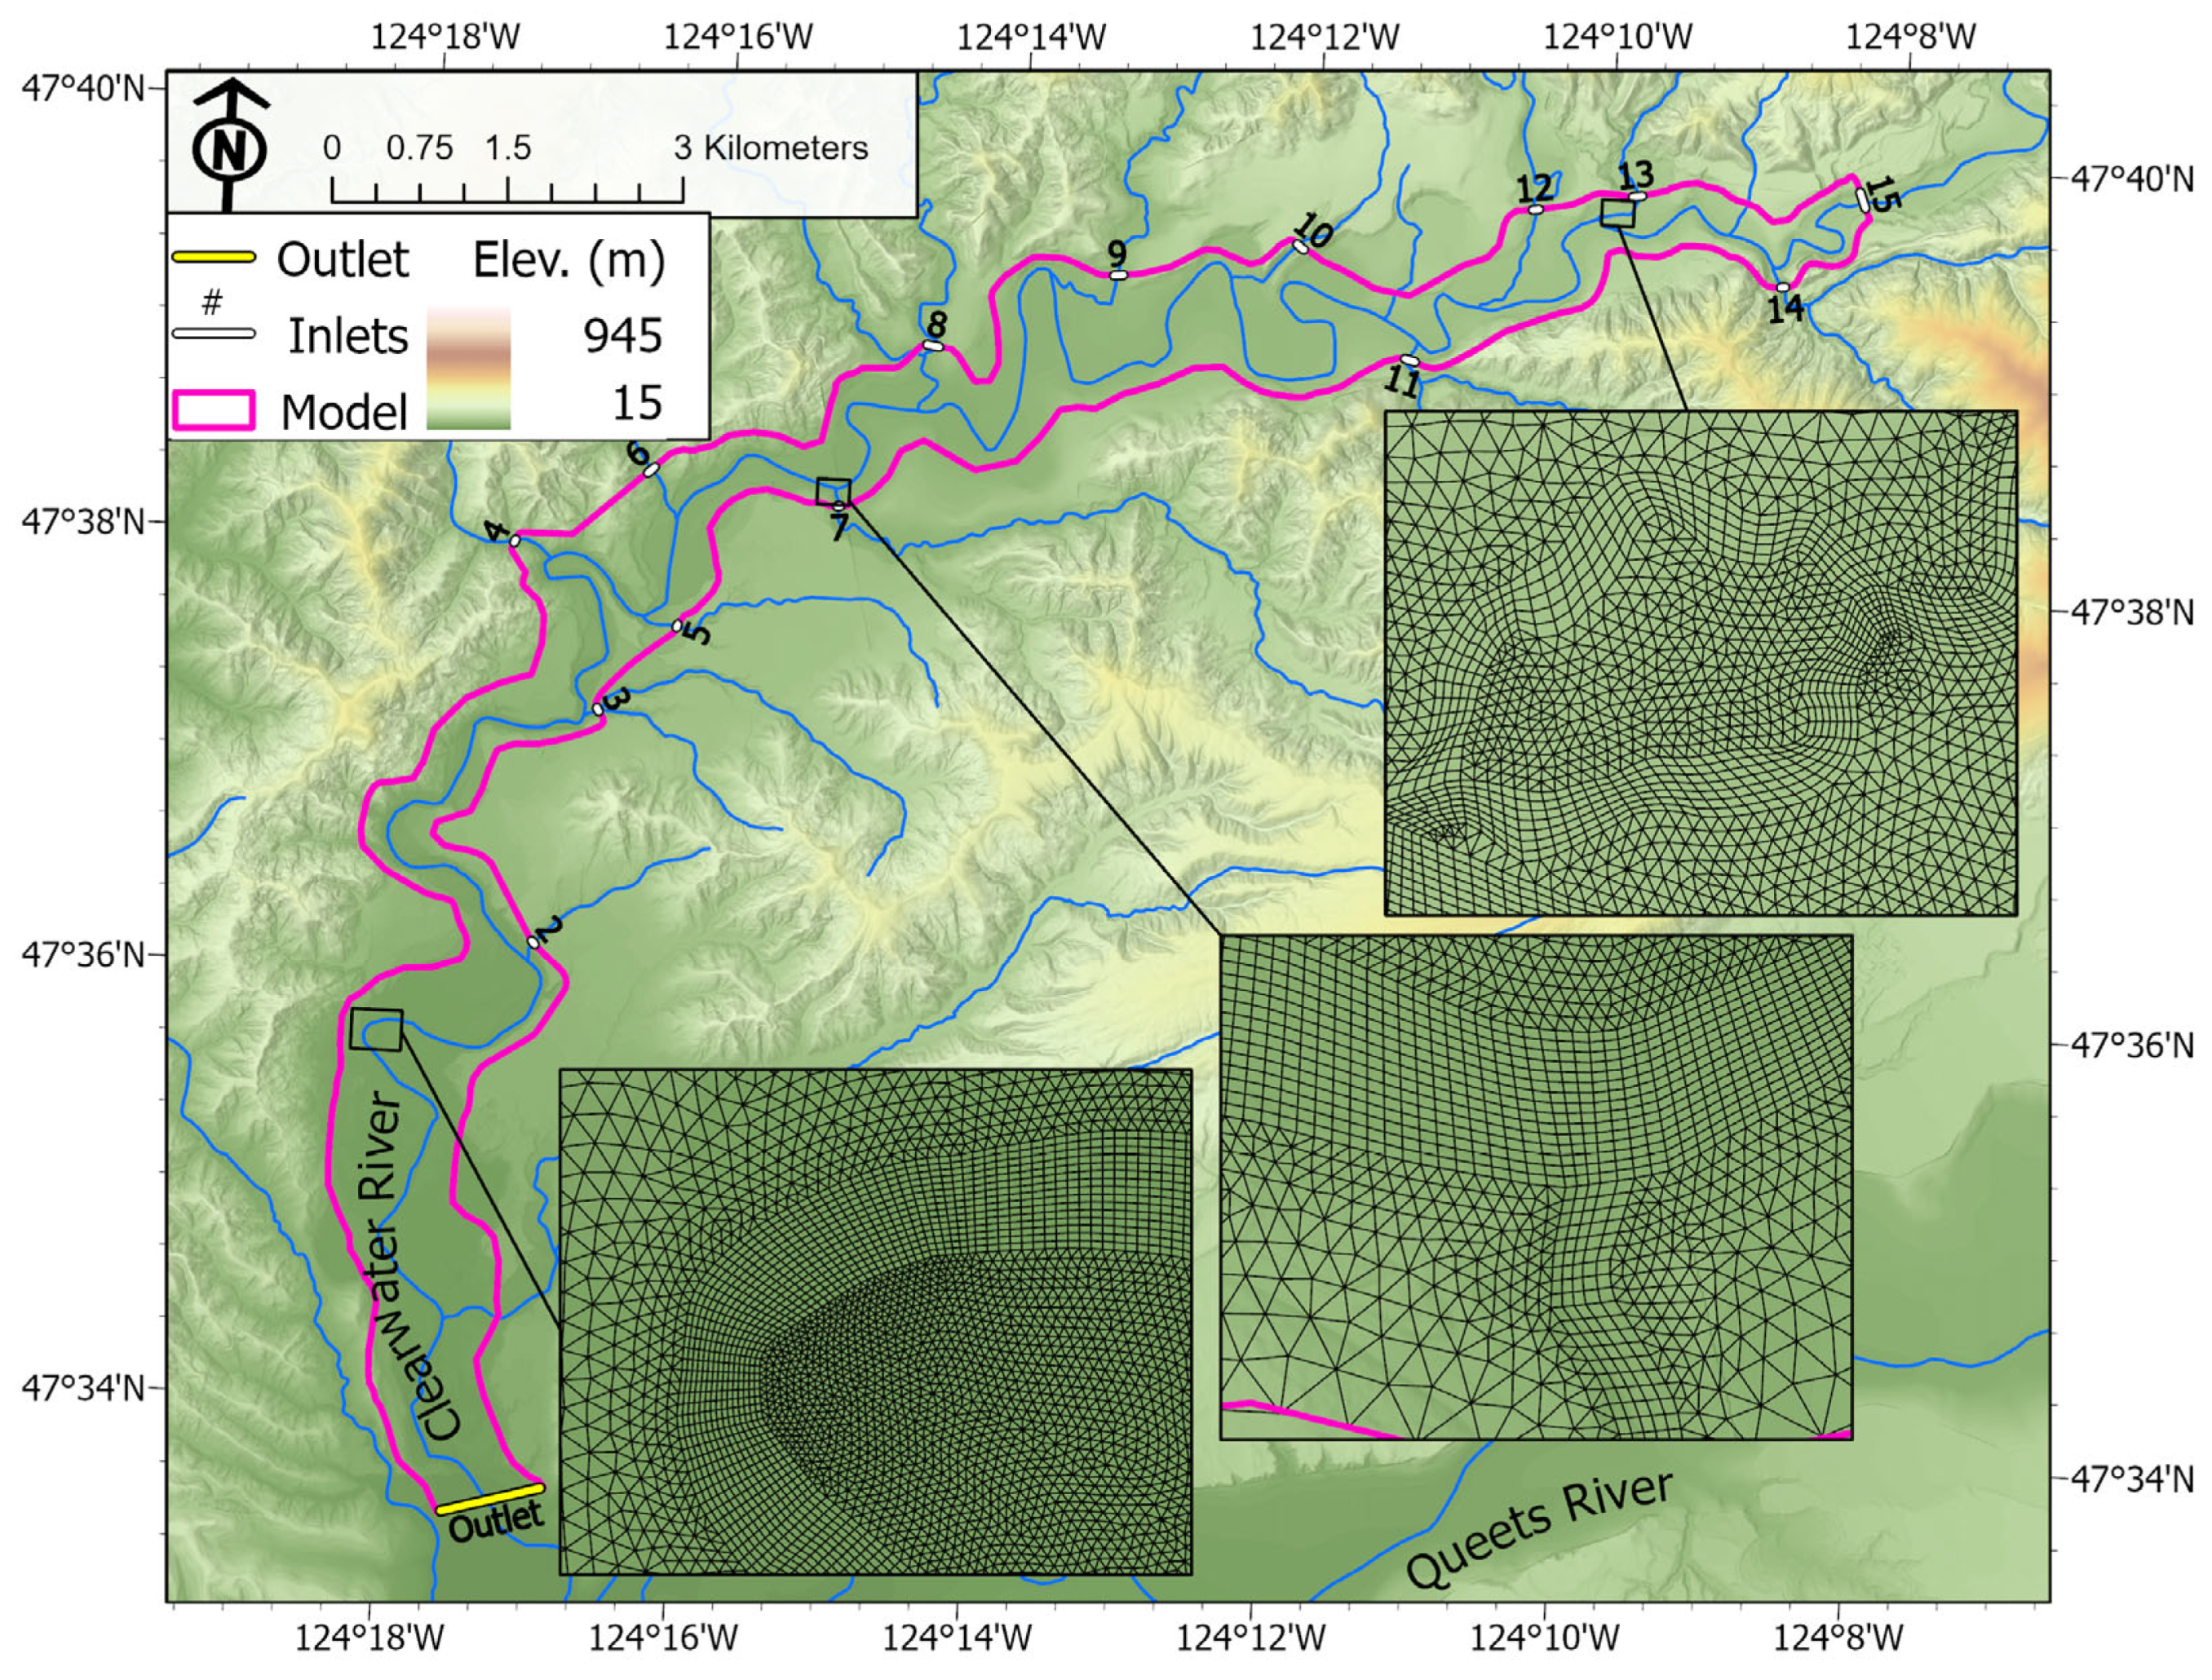
We utilized SRH-2D (version 3.3.0), a two-dimensional hydraulic model which uses a finite volume methodology and an implicit time integration scheme to numerically solve depth-averaged dynamic wave equations (i.e., St Venant equations), applicable to all flow regimes including subcritical, transcritical, and supercritical [35,36]. To meet the needs of a heterogeneous flow environment, SRH-2D allows the use of hybrid mesh containing irregularly shaped elements. Within the model domain, our mesh consisted of quadrilateral mesh elements along the main channel and triangular elements in the floodplain. We created the mesh, model boundaries, roughness zones, and terrain using Aquaveo SMS software (version 13.1). Near the areas of interest, and where the digital elevation model (DEM) had sharper gradients, the mesh was more refined, typically with a 5 m × 8 m cell size. Moving toward the boundaries, where cells were expected to remain dry throughout all simulations, the mesh transitioned to a coarser resolution (Figure 5).
The model domain covered 17 km2 (Figure 5). Available streamflow data, the river’s morphometry, and the area of interest defined by the QIN dictated the spatial extent of the model domain. We selected a relatively straight river reach with confined flow at r-km 35.4 for the upstream boundary and placed the downstream model boundary approximately 2.4 r-km upstream from the confluence between the Clearwater and Queets River, to minimize the effect of backwatering at the confluence.
Model simulations adopted a fixed-bed condition (no sediment transport) and steady inflow conditions (the total flow rate does not change with time). Flow enters the model through 15 defined inlets, including the mainstem Clearwater River and major tributaries (Figure 5). All simulations were initiated from a dry condition and used a 0.5 s time step for a total of 20 hours of simulation time. Throughout each simulation, we monitored the net mass balance, mass error, and number of wetted elements to ensure model quality and stability were achieved. Typically, the model reached a final steady-state solution well before 20 hours of simulation time (Supplemental Figures S1 and S2 illustrate simulation time is sufficient for total outflow and number of wetted cells to reach a steady state). At the downstream model boundary, we imposed a constant WSE. We determined the WSE using at-a-station hydraulics for each total discharge, using the cross-sectional geometry, Manning’s roughness coefficient, and slope. The WSE ranged from 17.51 m to 18.94 m for the range of modeled flows using a slope of 0.002, calculated across the lower 4.8 r-km (three river miles), and a Manning’s roughness coefficient (n) of 0.03 for the entire domain. Using a conservative, uniform n throughout the domain is applicable for a watershed-scale study where the aim is a site screening. Future alternative design analysis on a local scale (less than approximately 500 m) would require further refinement and calibration of the roughness distribution. However, we conducted sensitivity testing on both the downstream WSE and roughness to demonstrate that the majority of the modeling domain is insensitive to small, realistic changes in the roughness and downstream WSE boundary condition. We also computed the critical diameter, D c , for incipient motion using the model-derived τ and Shield’s number, τ c * :
D c = τ τ c * γ s γ ,
where γ s and γ are the specific weight of the sediment and water, respectively [37]. Sediment motion is generally observed between Shield’s numbers of 0.03 and 0.10 [38], and we apply a value 0.04 .

Source Data

We obtained 2022 topobathymetric green lidar data of the Clearwater River corridor from QIN to use in the hydraulic model. We mosaicked these data with previous aerial lidar data from 2011 and 2018 that covered a larger spatial area of floodplains and upland areas. The transition between differing lidar datasets exhibited elevation differences of ≤ 0.3 m, with the coarsest transitions located away from the mainstem channel and modeling area of interest. The mosaicked terrain had a 0.9 m × 0.9 m (3 ft × 3ft) cell size, with elevations between approximately 12 m and 189 m within the model domain.
The hydrology along the Clearwater River is not well constrained. USGS river gage 12040000 was active on the Clearwater River between 1932 and 1966, located between r-km 6 and r-km 7; the nearby USGS gage 12040500 on the Queets River, located downstream from the confluence with Clearwater River, has been active since 1930. We utilized a past flood frequency analysis conducted by Reclamation, which was based on historical data relating flows on the Clearwater River to the Queets River [39]. Modified from Washington state regional regression equations [40], this analysis yielded annual peak discharge estimates from 1931 to 1967, and from 1975 to 2019, with all peak flows exceeding 283 m3/s (10,000 ft3/s) and the highest recorded flow just over 1133 m3/s (40,000 ft3/s) (Table 3). We used Reclamation’s recommended annual peak discharge estimates for 2 yr, 5 yr, 10 yr, 25 yr and 50 yr recurrence intervals, applied to 15 tributary locations along the Clearwater River that represent significant drainage area changes, and thus, the locations of discharge increased ([39], Figure 5, Table 2). To translate the flood frequency analysis to model boundary inputs, we added flow along a model boundary at the closest upstream tributary location relative to the flood frequency location.
Table 2. Clearwater discharge data incorporated into SRH-2D hydraulic model as inflow boundary conditions for the recurrence interval flow cases. Corresponding outlet WSE boundary conditions are listed in the last row for reference (data compiled from [39]).
Location of InterestInflow PointMedian Peak Discharge, Q (m3/s)
2-yr5-yr10-yr25-yr50-yr
Main channel inlet 115257.7339.8393.6458.7509.7
Manor Creek1431.142.548.159.565.1
Bull Creek 21314.217.019.822.725.5
Snahapish Creek1211.38.514.211.311.3
Deception Creek1119.828.331.139.642.5
Peterson Creek 3108.511.314.214.219.8
Christmas Creek951.065.176.593.4101.9
Miller Creek868.096.3110.4130.3147.2
Shale Creek736.851.056.668.073.6
Mink Creek614.217.022.725.528.3
Elkhorn Creek55.78.58.511.314.2
Cougar Creek48.511.311.314.214.2
Hunt Creek314.217.019.822.725.5
Wild Cat Creek231.142.551.059.568.0
Total Q (m3/s)572.0756.1877.81030.71146.8
Outlet WSE (m) 417.5118.2818.6718.8518.94
Notes: 1 The upstream model boundary, located downstream of Stequaleho Creek, accounts for total median peak discharge of all upstream tributaries. 2 Inlet modeled on Bull Creek, but includes Willamud Creek median peak discharge. 3 Inlet modeled on Peterson Creek, but includes Crooks Creek median peak discharge. 4 Main channel outlet located downstream of Hurst Creek.
Table 3. Frequency of peak flows exceeding 566 m3/s (20,000 ft3/s), from measured and modeled data. The time periods are meant to inform the number of high-magnitude flood events preceding each set of historical aerial or satellite imagery used for geomorphic mapping (data compiled from [39]).
Time PeriodNumber of Peak Flows Exceeding Specified Magnitudes for Each Period
>566 m3/s (20,000 ft3/s)850 m3/s (30,000 ft3/s)1133 m3/s (40,000 ft3/s)
1931–1939210
1940–1950300
1951–1967, 1975–1980 11340
1981–20061741
2007–2017610
2018–2019000
Note: 1 There are no available gage data to constrain peak flows between 1968 and 1974.

3.3. Relative Elevation Maps

We created relative elevation maps (REMs) to better visualize low-lying areas with potential for channel reconnection under different hydrologic conditions. These maps demonstrate the relative elevations above and below a reference elevation obtained from (1) the topobathymetric surface along the river’s centerline and (2) the hydraulic model results for 2 yr peak discharge water surface elevation along the river’s centerline (e.g., [41,42]). To generate unique rasters for each of the reference elevation profiles, we calculated the elevation throughout the study domain using an inverse distance-weighted (IDW) interpolation scheme, employing the built-in IDW tool in ArcGIS Pro (following [41]). This process involves extracting reference elevations at points along the channel, creating a detrended DEM from bare earth elevations or water surface elevations, and differencing the raw surface elevation with the detrended DEM.
Geomorphic grade lines (GGL) are another type of REM which detrend the DEMs based upon relic geomorphic features to help discern more recent anthropogenic incisions [37,38]. Powers et al. interpreted modern features significantly below the relic geomorphic grade line as being associated with anthropogenic incisions [22]. Our REMs are not detrended based on relic features so here we look at the inverse, the elevation of a relic feature, and the youngest pre-anthropogenic terrace surface (Qt6) above the modern water surface elevation associated with a 2 yr peak discharge event. Rather than identifying elevations below the geomorphic grade line, we identify reaches with consistently higher Qt6 terraces relative to modeled water surface elevations. Because the mapped terraces can exhibit a range in elevations, likely because lidar was not available when Wegmann [31] conducted mapping, we use the median elevation for terrace surfaces to compare with reference REM elevations.

4. Results

4.1. Geomorphic Mapping

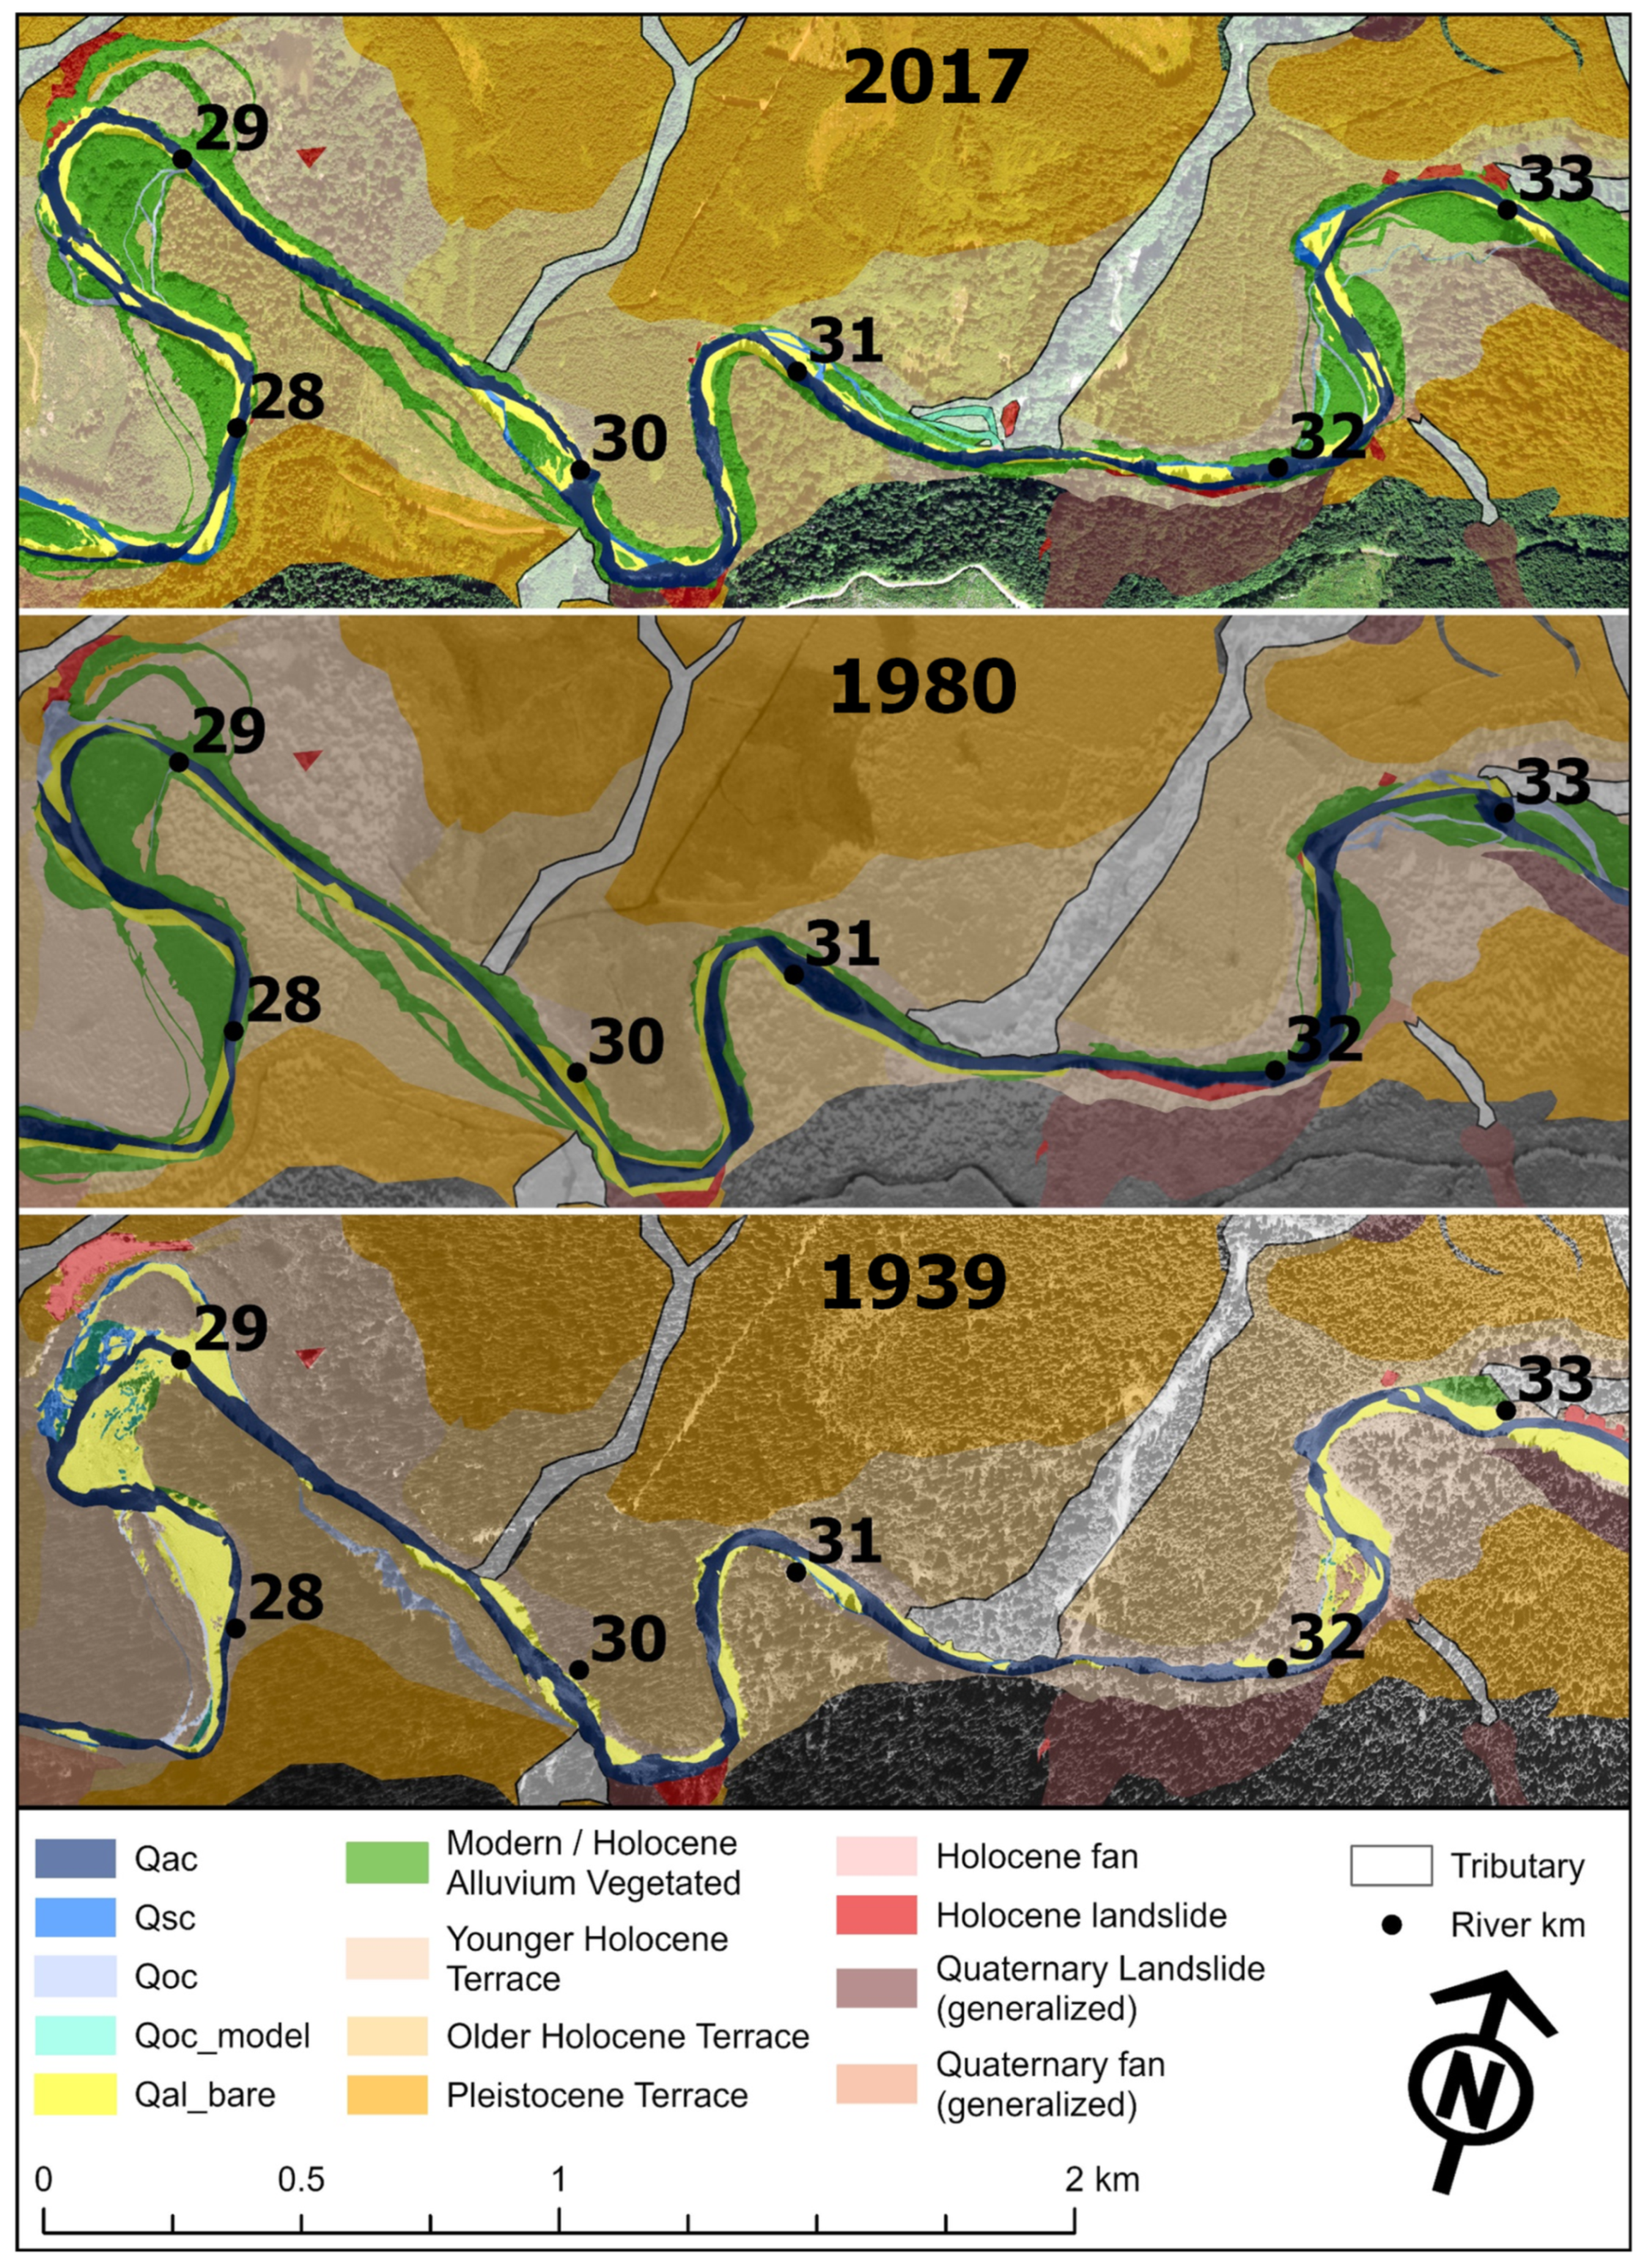
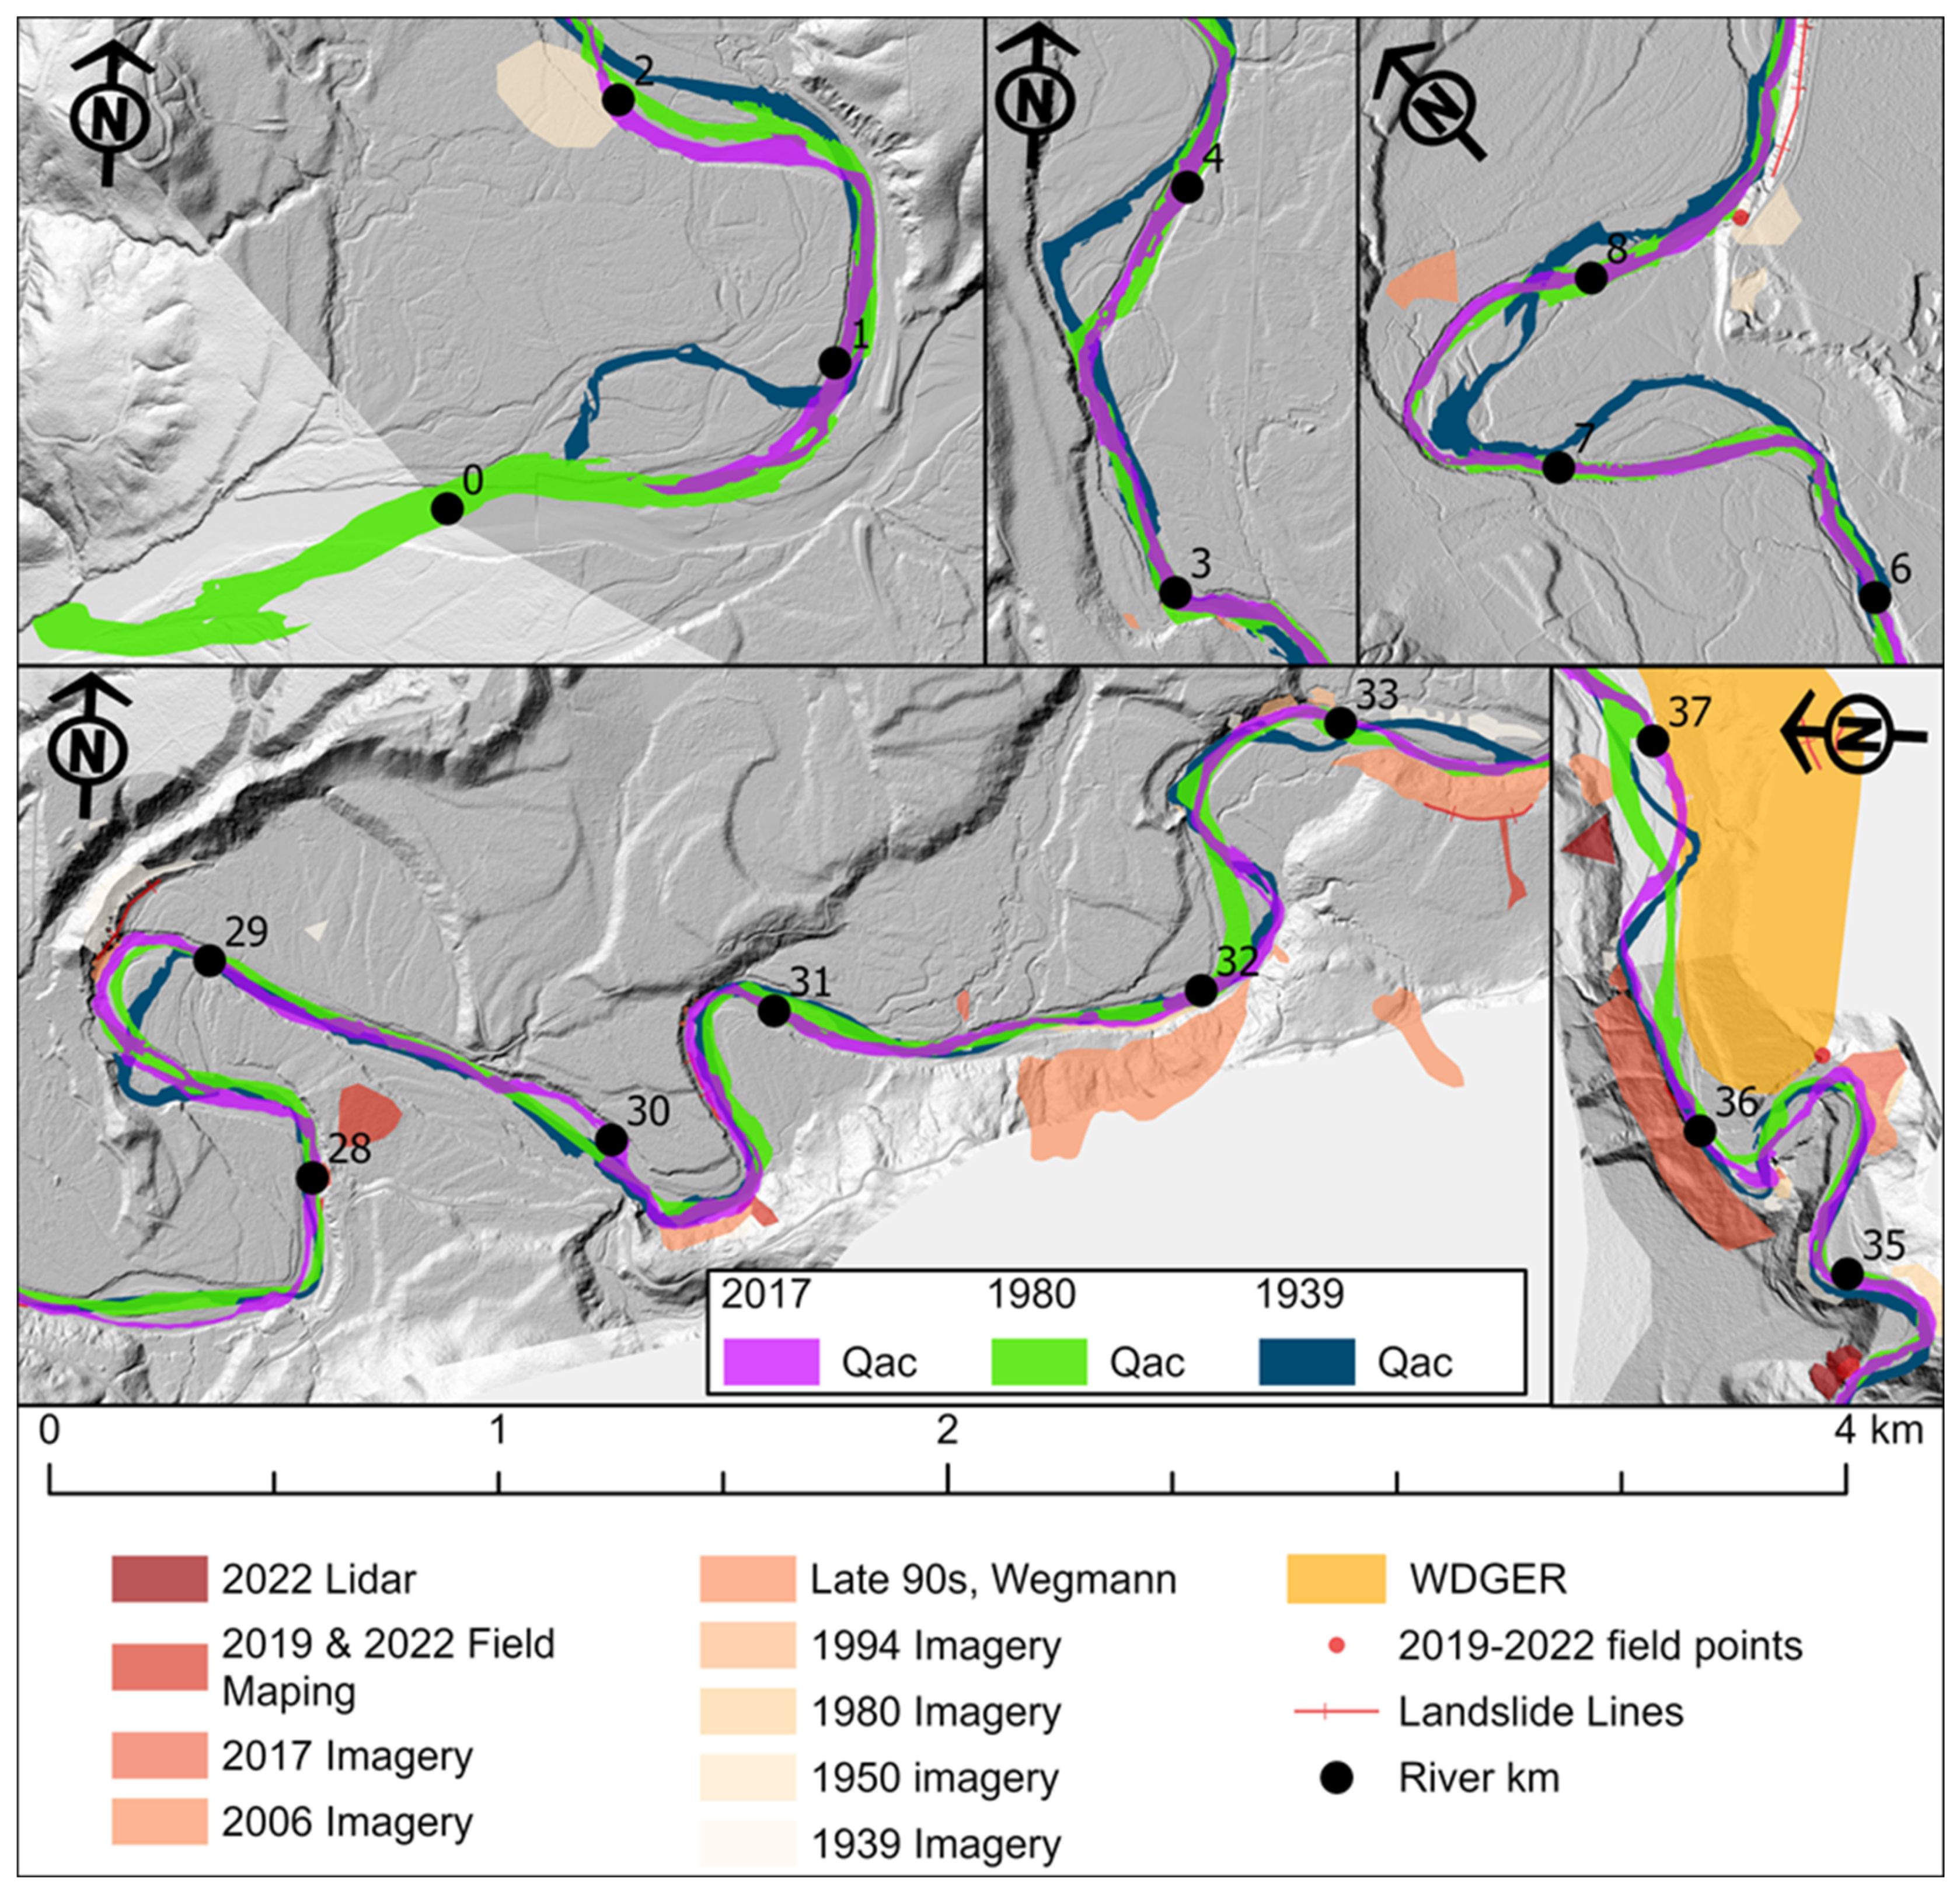
The Clearwater River is predominately a single-thread river. Where side channels exist, they are typically less than 0.5 km in length with significantly less cross-sectional area than the mainstem channel. Bare alluvium is limited in confined, bedrock-dominated reaches and more prevalent in areas with wider valleys with younger Holocene terraces. Lateral migration and the abandonment of historical channels is most prevalent at large meander bends and near the confluence with the Queets River (Figure 6; Figure 7). Overall, the area occupied by channels remained relatively stable through time, especially among side channels (Figure 8; Table 4). Bias introduced by the quality of past imagery could result in a small amount of unit area change. To compare areas across mapping years, we computed the total unit area between r-km 1.8 and r-km 37.4. We removed the area near the confluence with the Queets River from this comparison because side and overflow channels are created and obliterated as the Clearwater River’s mouth migrates (see top left map in Figure 7), leading to large fluctuations in channel areas through time that obscure the overall trend in channel changes for the upstream study reach. The reduction in the mainstem channel area is potentially significant, at 13.7% between 2006 and 2017, and 7.8% between 1939 and 2017. The reduction in area between 2006 and 2017 is compelling because both sets of mapping data are of similar resolution and photo quality. However, we are hesitant to place too much emphasis on a trend from the single 2017 mapping year. Sinuosity, S, measured as river distance divided by straight-line distance, varied little between 1939 (S = 2.05), 1980 (S = 2.00), and 2017 (S = 2.05), indicating the main channel’s ability to meander has likely not reduced through time.
The most significant change in geomorphic units, which likely overcomes any bias introduced by photo quality, is the change in area of unvegetated alluvium, Qalbare (Figure 8, Table 4). The valley area occupied by unvegetated alluvium is significantly greater for mapping years 1939 and 1950 than that observed for years 1980 through 2017. The peak flow data do not indicate a marked change in large magnitude flows capable of geomorphic work. From 1931 to 1950, there was one flow exceeding 850 m3/s (30,000 ft3/s). From 1981 to 2006, there were four flows exceeding 850 m3/s (30,000 ft3/s) and one flow exceeding 1133 m3/s (40,000 ft3/s) in 2000 (Table 3, [39]). Despite the frequent occurrence of high-magnitude flows between 1981 and 2006, the 2006 imagery mapping did not indicate an increase in bare alluvium associated with the high flows. Interestingly, the area of bare alluvium increased slightly between 2006 and 2017, but the area in 2017 remains almost half of what was observed in 1950 (Table 4).
The spatial extent of the active geomorphic corridor has increased and decreased through time (solid black line in Figure 8, Table 4). The initial increase between 1939 and 1950 is in part due to the inability to differentiate between younger Holocene terraces and modern alluvium in the 1939 imagery, leading to a low estimate of Qb1 bars within modern vegetated alluvium. Between 1950 and 2006, the overall area of the active geomorphic corridor decreased, driven in large part by the loss of bare alluvium. Excluding the overflow channels (Qocmodel) and vegetated bars (Qb1) identified through hydraulic modeling, the active geomorphic corridor still increased between 2006 and 2017 but has remained comparatively consistent since 1980.
Over time, the active geomorphic corridor has laterally migrated, leading to the disconnection of units once occupied by active channels or bare alluvium. While these disconnected units may still be inundated during floods or maintain a groundwater connection, they are not regularly scoured, allowing vegetation to become firmly established. The areal decrease in the active geomorphic corridor is less than the areal increase in disconnected units (Figure 8, Table 4), indicating that as historically active units are disconnected, new areas are recruited through lateral migration. Marked channel change and migration along the mainstem Clearwater River predominantly occurs through meander growth and mass wasting. We qualitatively observe that the 1939 and 1980 mainstem channel locations generally differ more than the 1980 channel and 2017 channel (e.g., Figure 7), although similar timespans separate them both. This may indicate that the mainstem channel is becoming less laterally dynamic.
Interestingly, although the area occupied by side channels in 1939 is equivalent to the area occupied in 2017 (Table 4), the actual count of side channels decreased significantly between r-km 1.8 and 30 (Table 5). One area of significant channel loss is located near the meander bend at r-km 29. In 1939, this was a broad area of anabranching side channels surrounding vegetated alluvium, with an extensive area of bare alluvium indicating inundation and scour were likely frequent (Figure 6). By 1980, only a single overflow channel existed along this meander bend. By 2017, there were no overflow channels to the north of the meander bend by r-km 29 and the area was dominated by vegetated alluvium (Figure 6). In contrast, the number of overflow channel connections in 2017 exceeds the number in 1939 (Table 5). In many cases along the lower 30 r-km, this is due to the historically open, flowing side channels transitioning into less-frequently inundated overflow channels. Above r-km 30, side channel connections increased between 1939 and 2017, and overflow channel connections also increased.
Landslides along the mainstem Clearwater River are most heavily concentrated upstream from r-km 32, including the river reach beyond our study area. Debris avalanches are frequently caused by stream undercutting, and the river exhibits a steeper slope and is often more confined in the upper reaches, resulting in greater stream power that may contribute to undercutting. Many landslides are shallow debris avalanches similar to those described by [32], but large deep-seated features are also common above 32 r-km. In addition, larger slumps are collocated with meander bends indicating that lateral erosion is destabilizing the above hillslope or the adjacent, higher Quaternary terraces (e.g., Figure 7); large landslides are adjacent to the active geomorphic corridor at meander bends near r-km 2, r-km 15, r-km 20, r-km 23, r-km 30, and r-km 33–36. Shallow landsliding and debris avalanches tend to revegetate more quickly. We quantify landslide area based on the most recent slide activation (Table 6), but portions of older landslides are frequently remobilized, especially within older, deeper-seated features. Landslide material is also mobilized and incorporated into other geomorphic units as the river laterally migrates. Higher resolution imagery coupled with the frequent reactivation of landslides likely drives at least a portion of the increased landsliding area observed in 2017. Deep-seated landslides deliver both coarse and fine sediment and landslides into older terraces reincorporate older river gravels back into the active channel. In contrast, sediment from logging activities is often dominated by fine sediment (e.g., [6,7]), although logging and road building may lead to an increase in mass wasting which also incorporates fines (e.g., [43,44]).

4.2. Hydraulic Modeling

Hydraulic modeling provides spatially varied maps of water depth and velocity, from which other useful metrics, such as bed shear stress ( τ ) , can be derived. As a large-scale tool for screening potential restoration sites, the hydraulic modeling exhibited robust results for a relative comparison among reaches. Every run had a relative mass conservation error of 0.7% or less. We tested the model sensitivity on a subset of model runs with (1) varying roughness, by implementing n values of 0.025 and 0.035 (+/−17%), and (2) varying downstream boundary water surface elevation, by altering the channel slope in hydraulic calculations to 0.0025 and 0.0015 (+/−20%). From the baseline n value, changing the n values only resulted in a maximum difference of less than 12% in total wetted area in the model domain. This percentage difference was lower for lower flowrates. The model results also show low sensitivity to the outlet boundary condition. Approaching the boundary, the modeled WSE results diverge slightly for the different slope conditions, but these differences are <0.35% upstream from r-km 2.5.
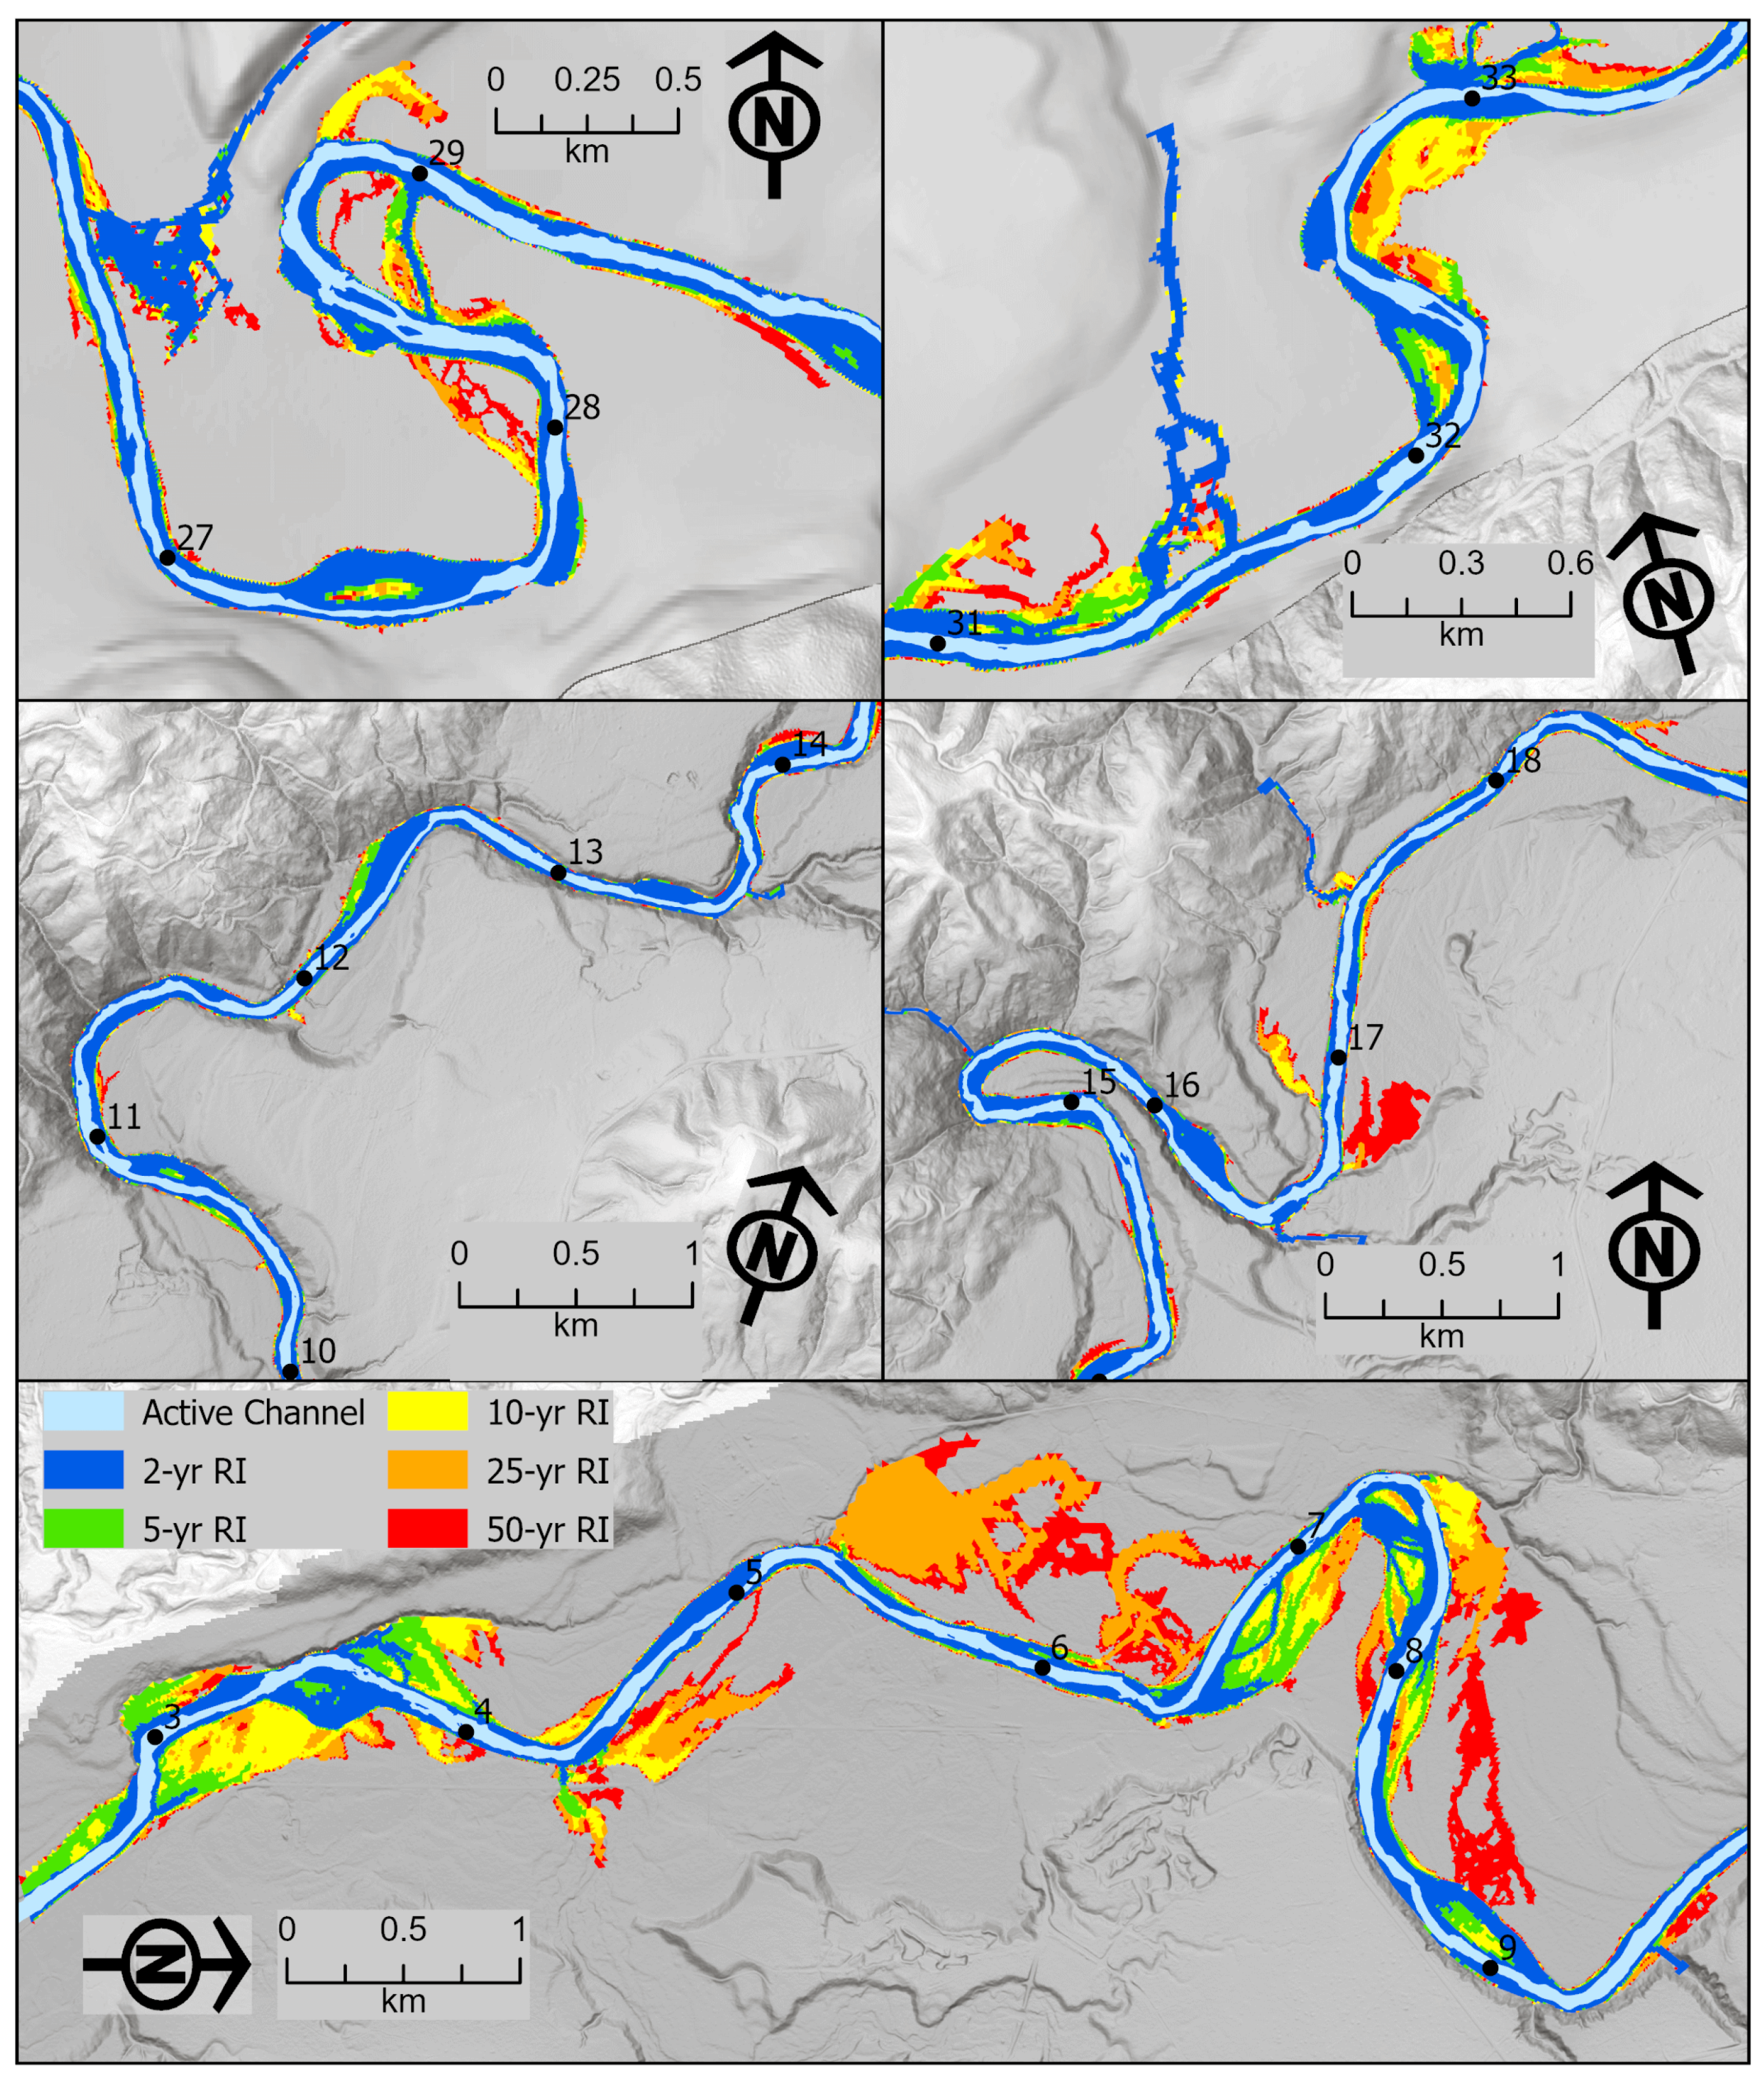
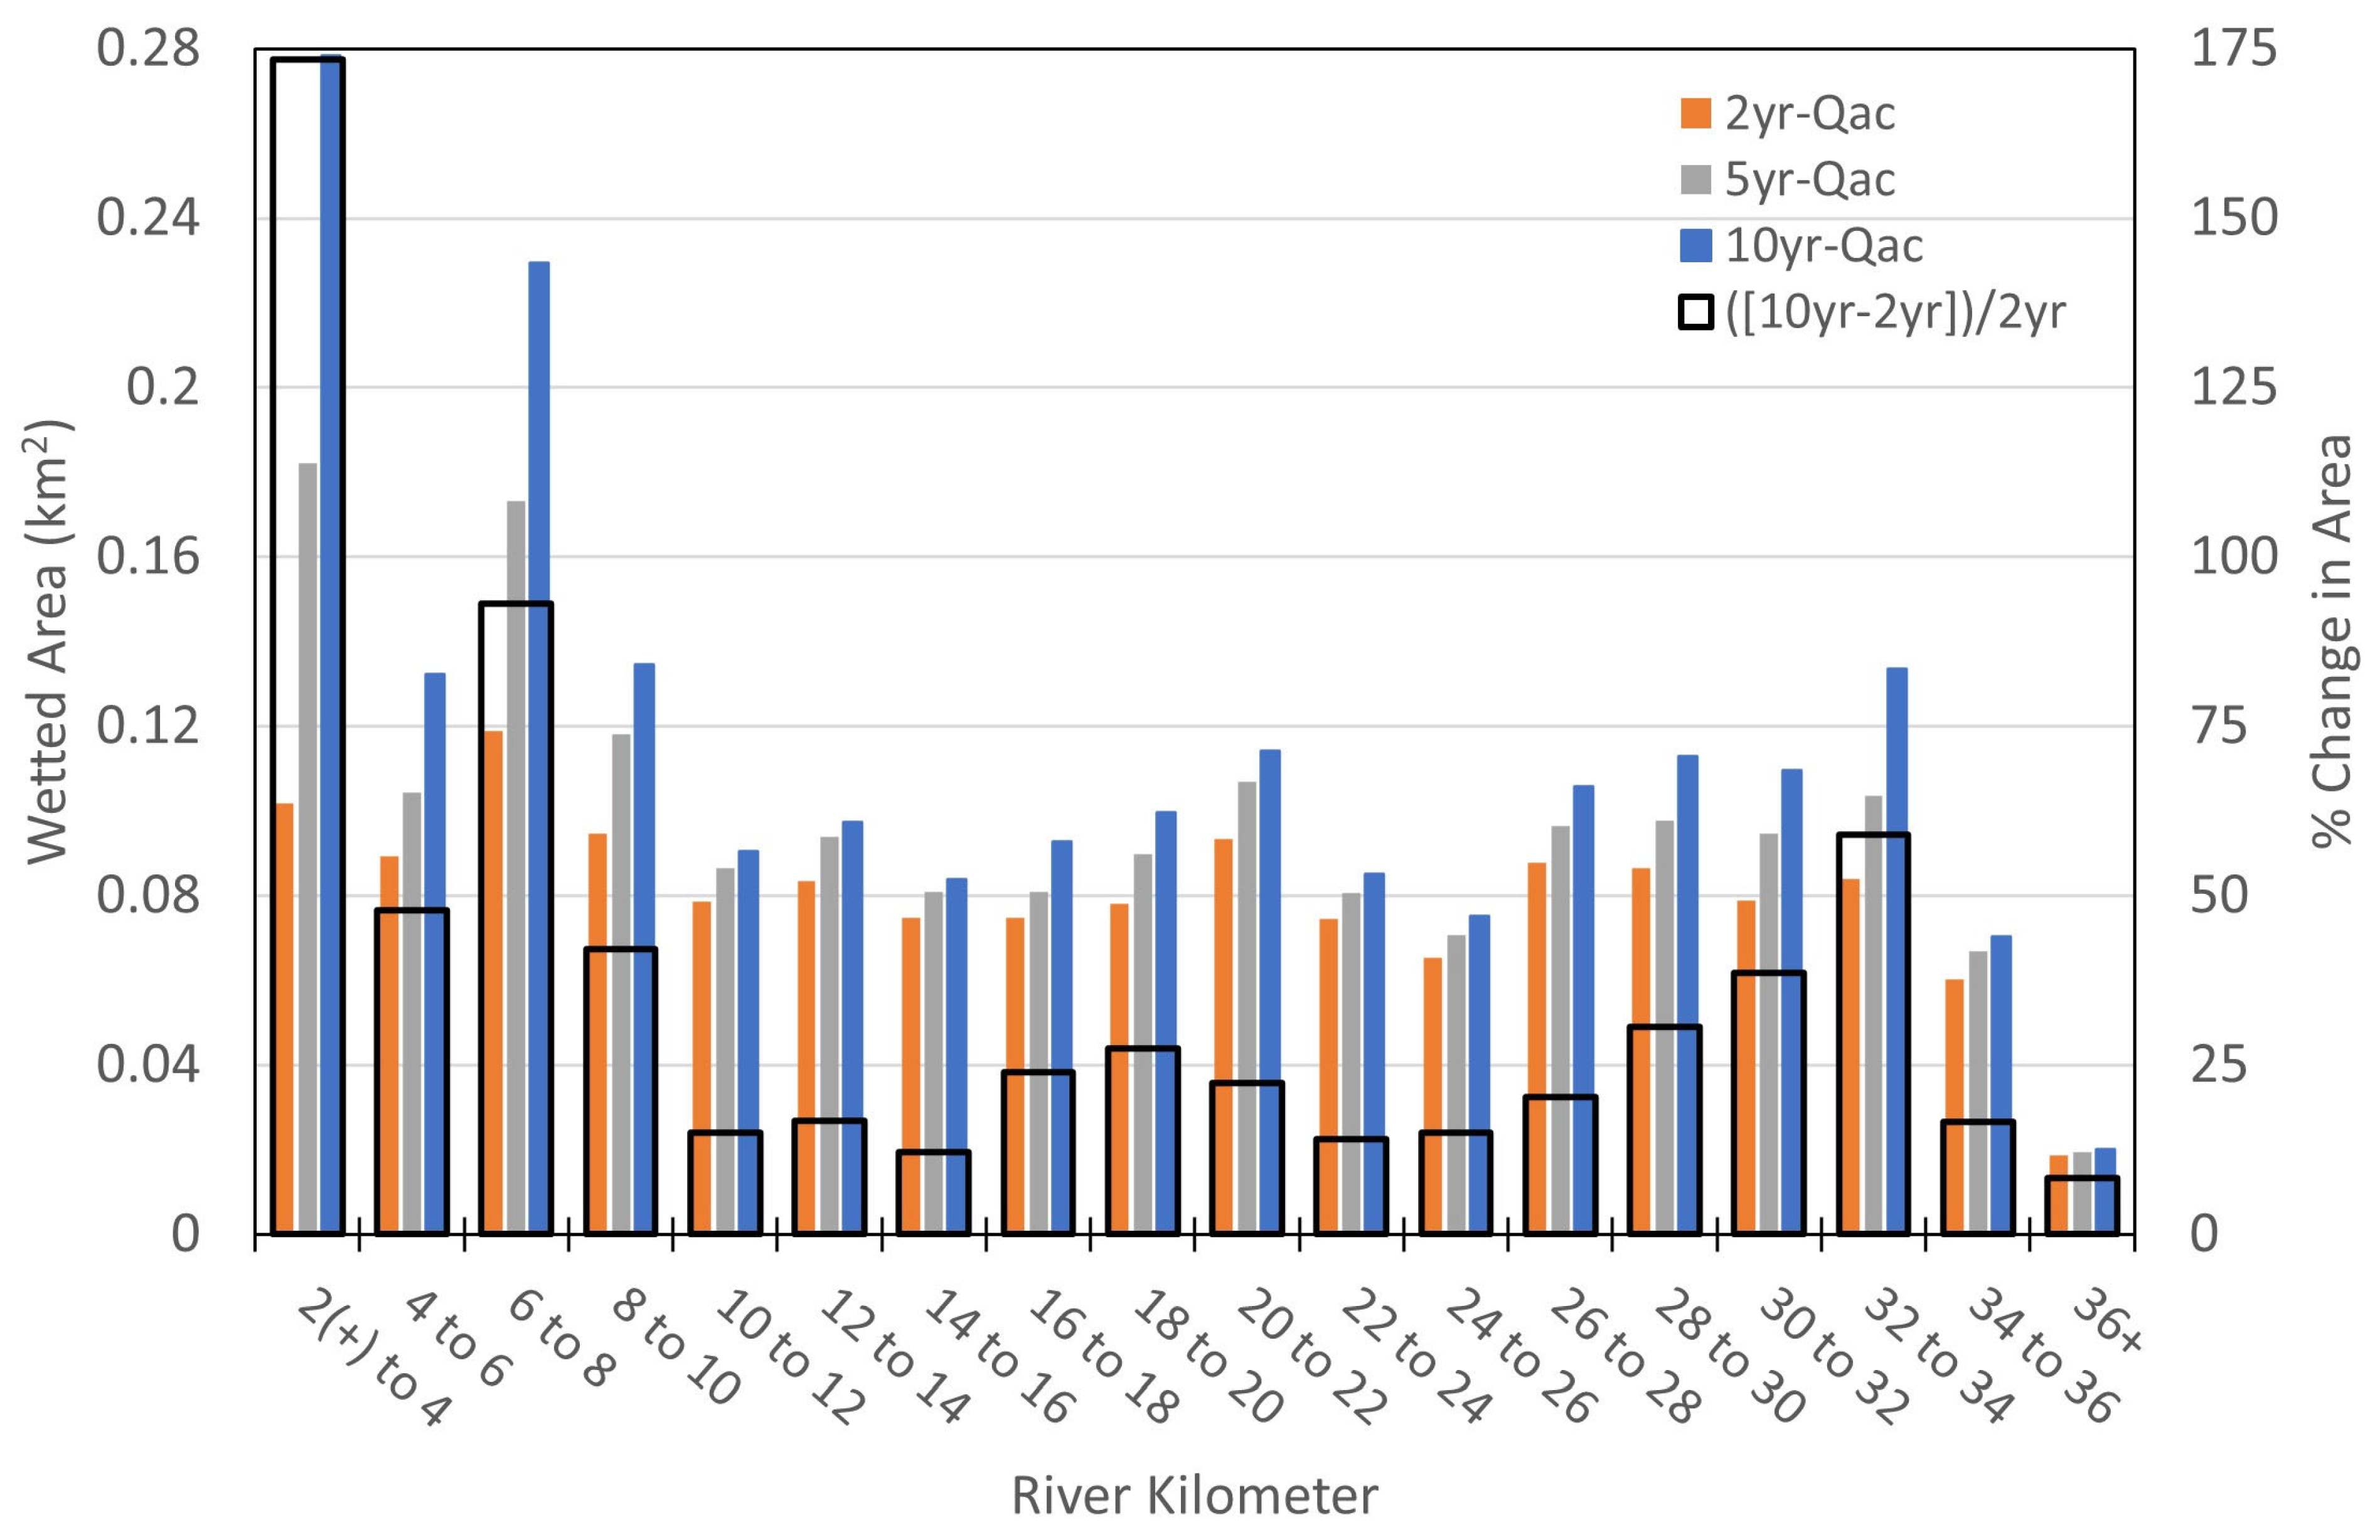
The inundated areas, with water depths ≥ 0.003 m, illustrate the differences in confinement among the reaches (Figure 9). For example, the reaches between 2 and 9 r-km, and 31 and 34 r-km exhibit spatially extensive wetted areas, inundated by 2 to 10 yr peak discharge events. In contrast, the reach between 10 r-km and 14 r-km is extremely confined, showing almost no areal increase in inundation for a 50 yr peak discharge event versus a 2 yr peak discharge event (Figure 9). To identify river reaches with the potential for floodplain reconnection and increased inundation, we computed the percent change in the wetted area between 2 yr and 10 yr peak discharges (black outline bars, Figure 10). Reaches with a large increase in the wetted area between the 2 yr peak discharge and the 10 yr peak discharge have more significant low-lying portions of the valley just outside of the spatial extent of the 2 yr peak discharge inundated area. For example, between 2 r-km and 4 r-km is the largest increase in inundated area (173%, Figure 10), and this additional area occupies the broader floodplain available (Figure 9, bottom panel). In contrast, reaches with very little increase in wetted area at the 10 yr peak discharge likely have very little low-lying portions of the valley outside of what is already inundated by a 2 yr peak discharge. For example, between 14 r-km and 16 r-km there is only a 12% increase in inundated area (Figure 10) and the extent of the wetted area from the 10 yr peak discharge is barely visible beyond the extent of the 2 yr peak discharge (Figure 9, middle right panel). This comparison is based on incoming flows, which generate different water surface elevations, and serve as a potential indicator of reaches that may have more success in implementing projects to raise the WSE reconnect or inundate larger areas. Based on this analysis, the river reaches between 2 r-km and 8 r-km and between 30 r-km and 34 r-km appear to offer the greatest potential for increasing the wetted area and floodplain connectivity through in-stream projects to raise the WSE.
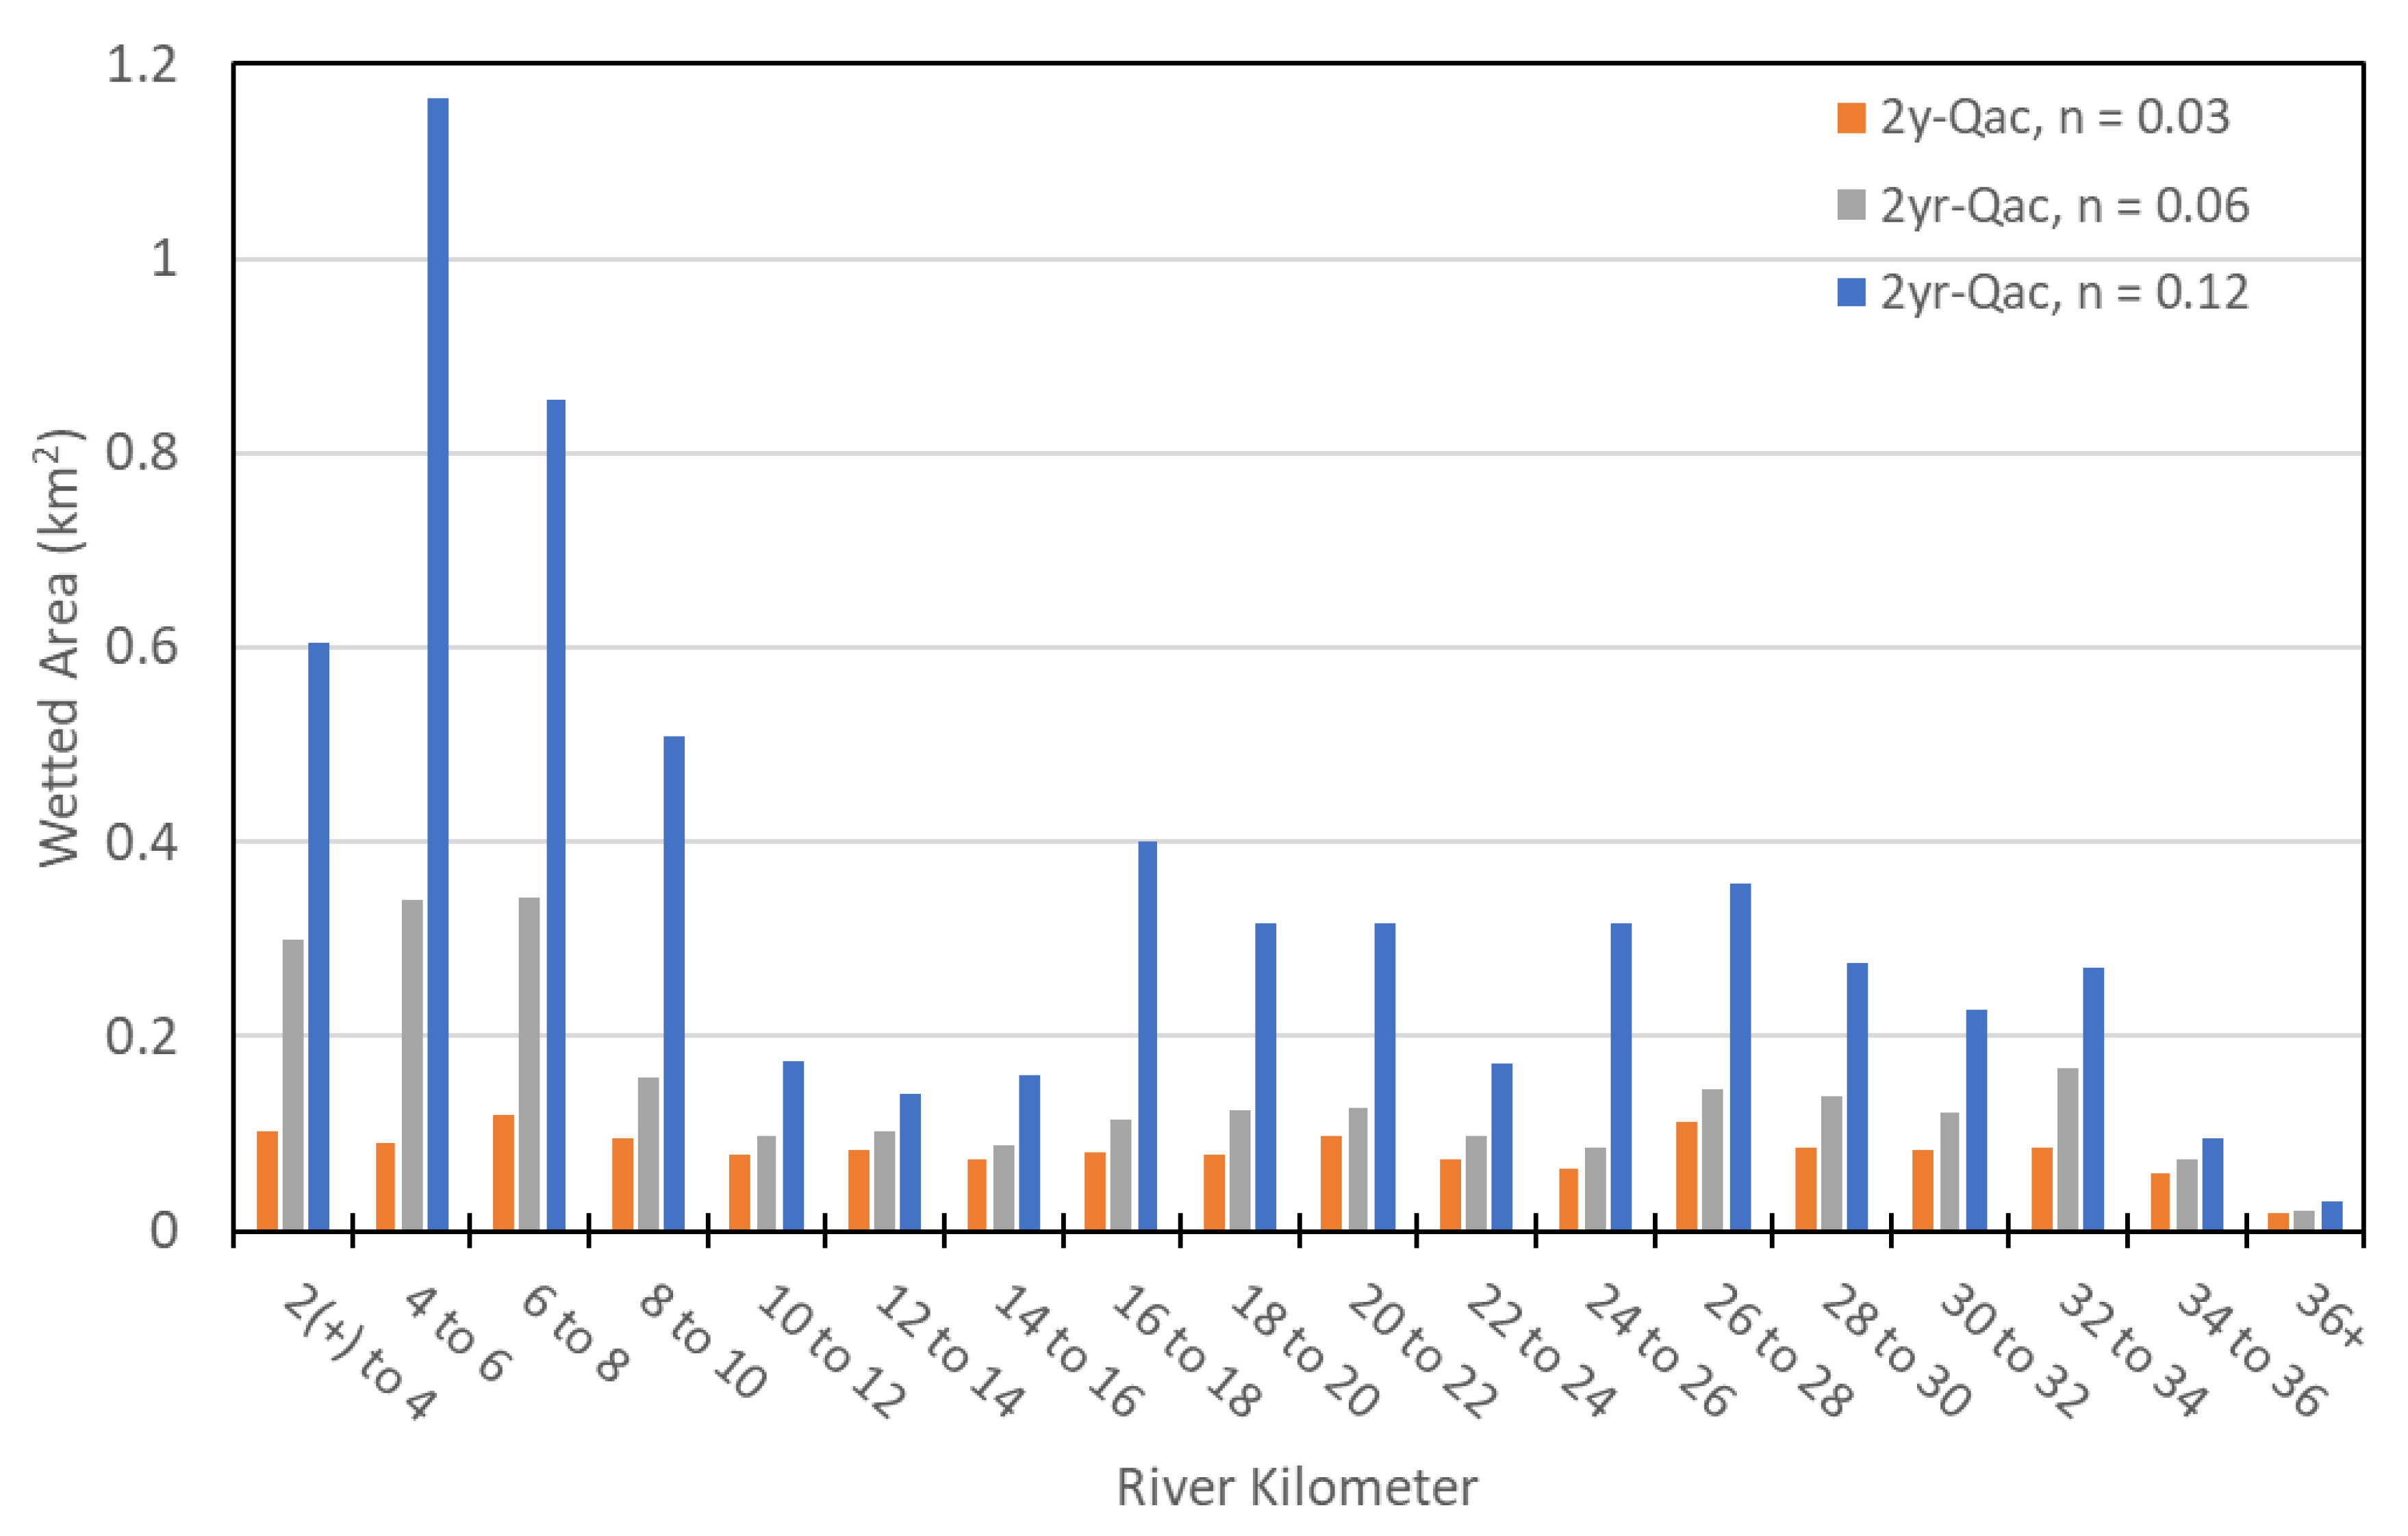
To further verify potential reaches with better potential to increase inundation, we also reran the 2 yr peak discharge with doubled and quadrupled Manning’s roughness values. These elevated roughness values serve as a commonly used surrogate approach in 2D hydraulic models for the presence of large woody debris or in-stream structures to evaluate the potential for increased water stages. Realistically, in-stream structures will not uniformly increase n values across an entire model domain; however, the combination of restoration in riparian corridors and recruitment of litterfall and wood of all sizes would be expected to increase n across the fluvial zone. This test provides another mechanism to validate reaches viable for reconnecting disengaged channels through common interventions. Notably, the same river reaches identified as having restoration potential under higher discharge scenarios exhibited the most substantial increases in the wetted area under the elevated roughness conditions (Figure 11). These results reinforce the interpretation that connectivity can be achieved at lower discharges by effectively slowing the flow and promoting overbanking flow.
The critical diameter indicates that throughout the confined reaches (e.g., r-km 10 to r-km 13) hydraulic conditions favor mobilization of sediment up to the size of small cobbles, with gravel potentially depositing along the banks and bars for 2 yr, 5 yr, and 10 yr flows (Figure 12a–c). Unconfined areas (e.g., r-km 6 to 9) exhibit more spatial variability in the critical diameter as well as variability with flow (Figure 12d–f). Here, the main channel consistently exceeds the threshold for small cobble incipient motion, while the added complexity in the accessible floodplain creates the possibility for the deposition of sediment ranging from silt to cobbles. Having large areas of varied sediment deposition could indicate greater lateral mobility for the river, as changing alluvial cover can encourage dynamic movement. Additional zones of gravel deposition uncaptured by our model likely exist along the main channel, as green lidar has a limited accuracy in characterizing the deepest pools and 2D models do not accurately capture scour and deposition potential in deep pools. Overall, these results indicate that fine sediment is consistently suspended and likely to be flushed out of the main channel during flood conditions (i.e., ≥2 yr flow), but silts could be trapped and deposited on broad floodplain surfaces in unconfined reaches and during hydrograph recession.

4.3. Relative Elevations Maps

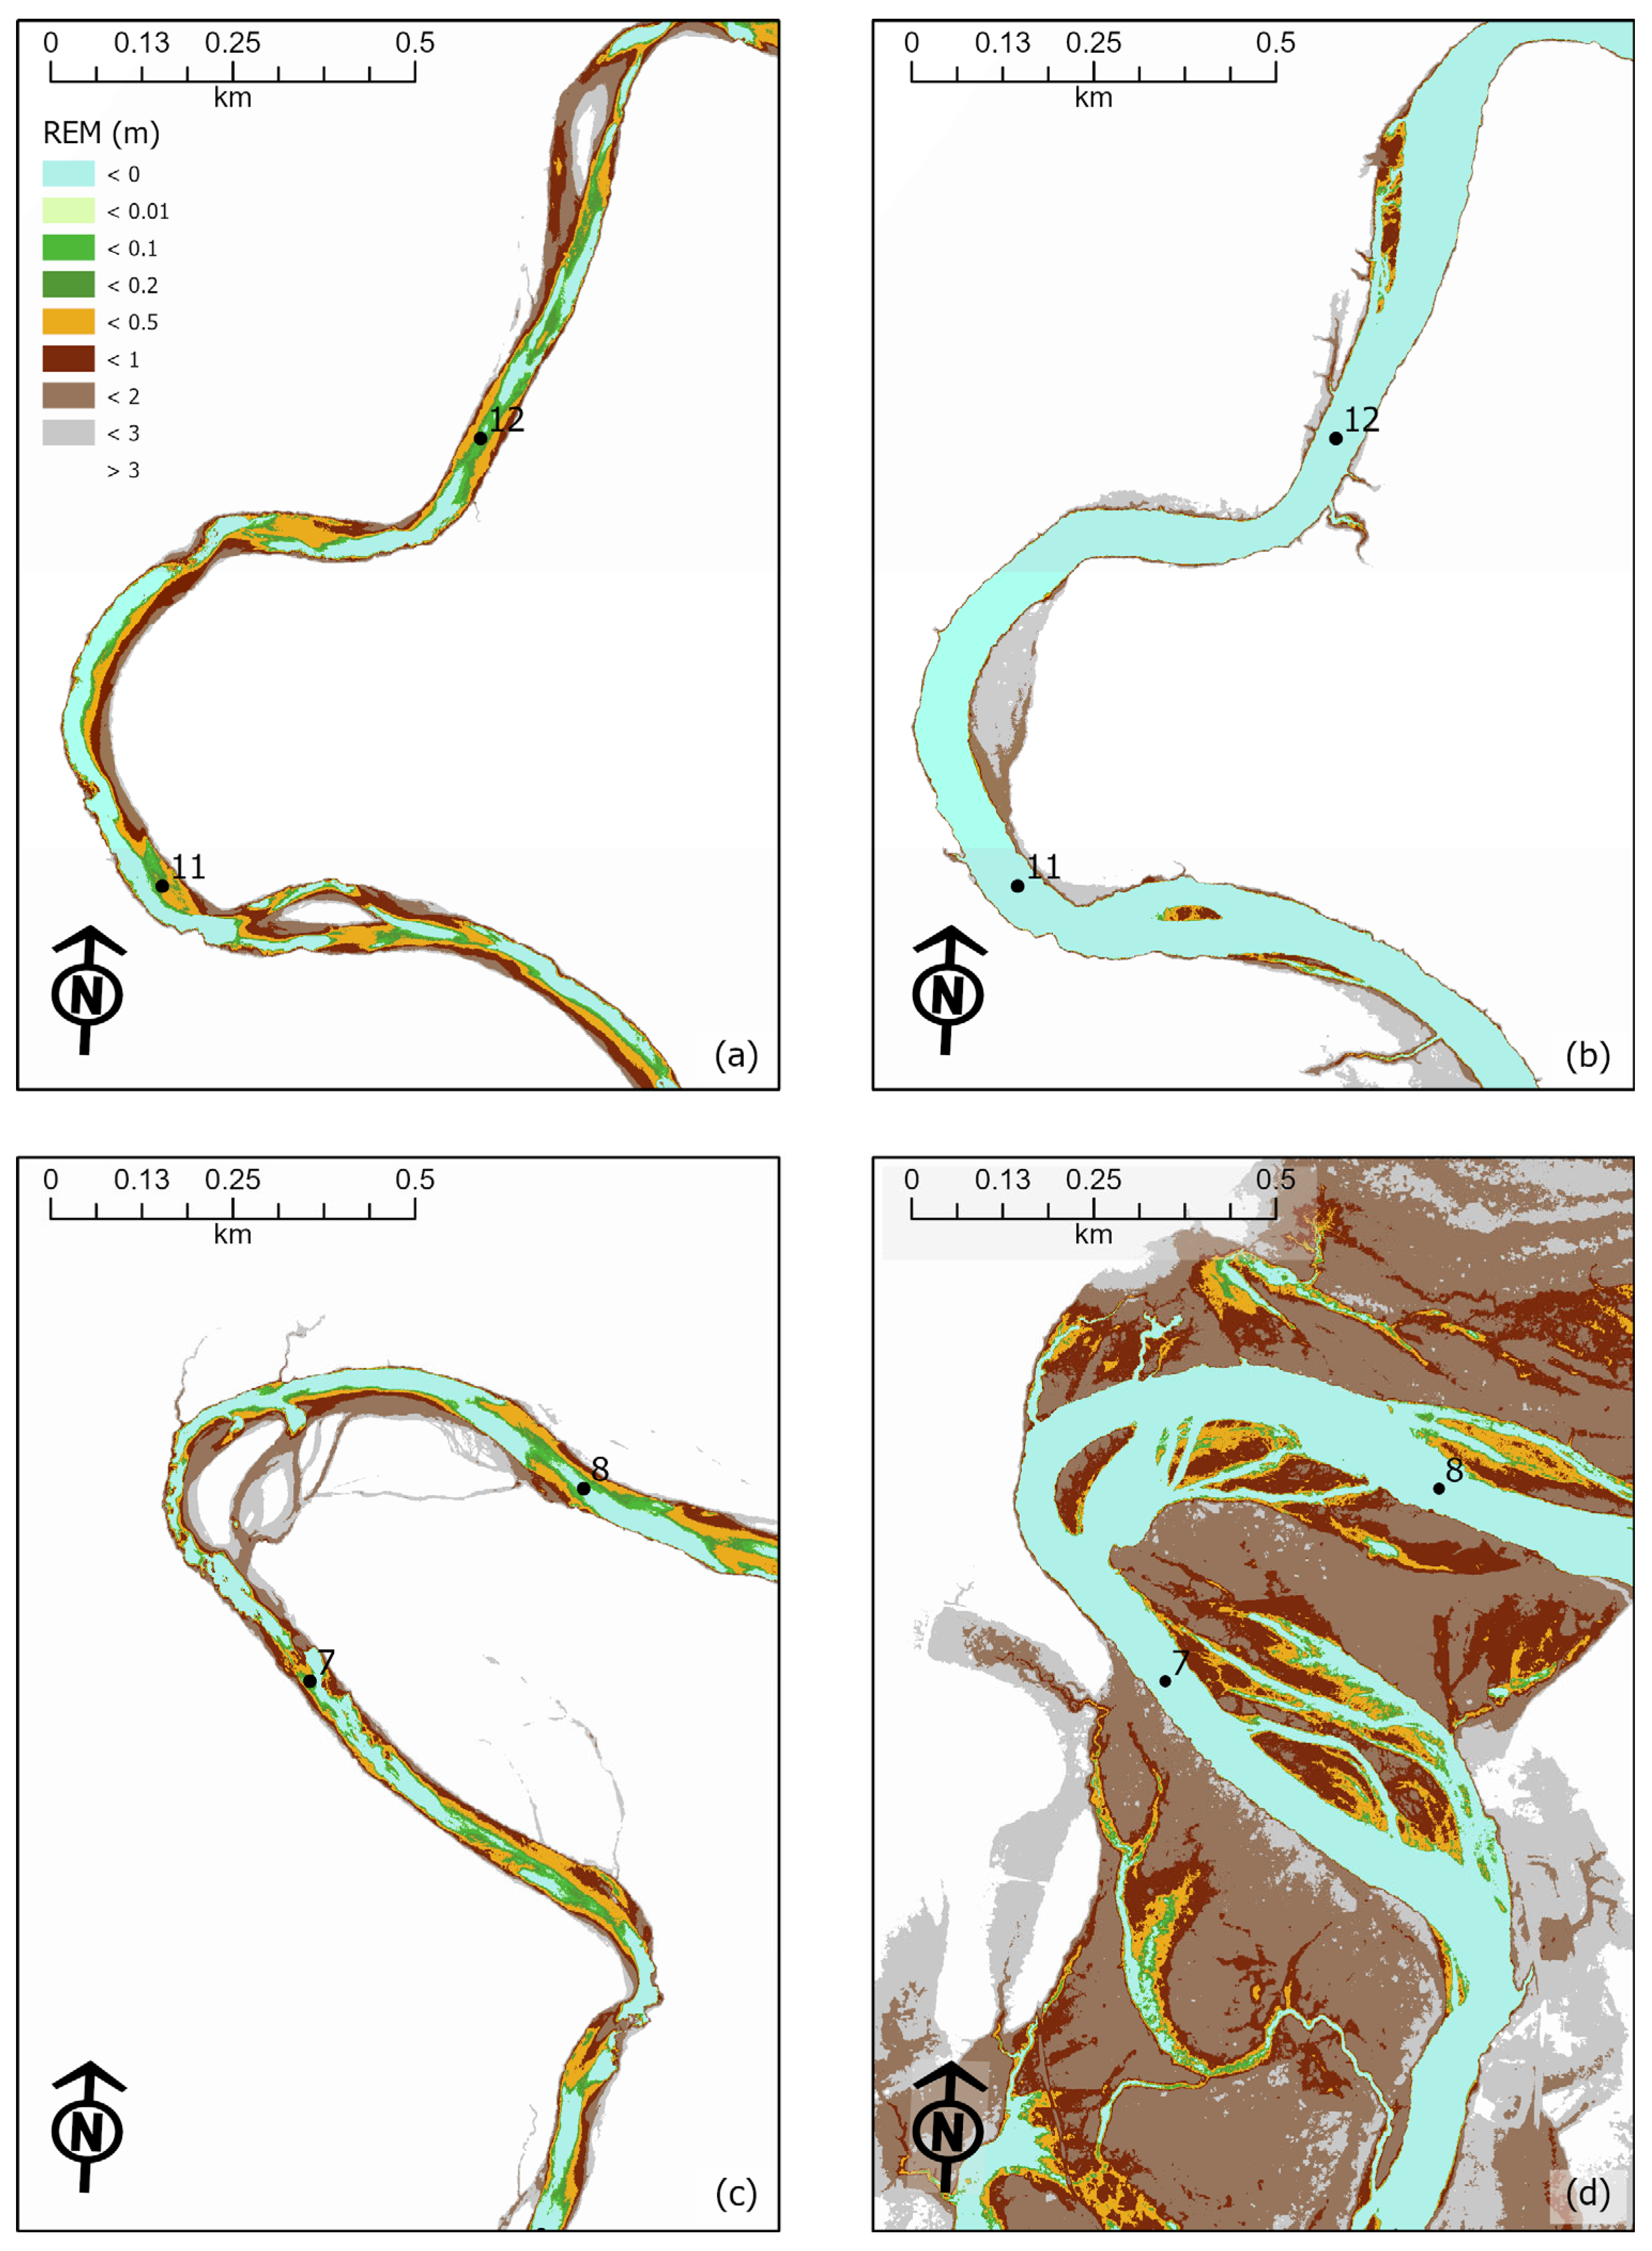
Bare earth relative elevation maps (REMs) demonstrate that elevation increases rapidly with increasing distance from the river’s centerline (a rise of >3 m within 20–40 m lateral distance; Figure 13a,c). While these bare earth REMs offer a visual representation of confined and broader low-relief reaches, the extent of the confinement is better observed using the floodplain elevation relative to the WSE. In particular, because the Clearwater River has significant hydrologic variability, the relative elevation above the channel needs further validation to determine hydraulic connectivity potential. Comparing the surrounding valley elevations to the modeled WSE, rather than the riverbed, is more informative for identifying low-lying areas that could be inundated by restoration projects that slightly increase the water surface elevation for the same modeled discharge (Figure 13b,d). These valley reaches include r-km 2 to r-km 8 and between r-km 30 and r-km 34, also identified through the analysis of wetted area. In addition, the 2 yr peak discharge REM indicates that r-km 25 to r-km 29 also have low relief with the potential for reconnection with intervention. Areas shaded blue and green in Figure 13b,d lie within 0.2 m of the modeled WSE along the river’s centerline profile. These areas have potential for restoration projects that could raise the WSE to inundate them during flood events or create backwater and slower water refugia regions.
Using the REMs to evaluate relic features along a geomorphic gradeline (GGL) indicates that Qt6 terraces in the lower 10 r-km exhibit broad surfaces that are less than 2 m in elevation above the 2 yr peak discharge inundation; modern, 2 yr peak discharge events are closer in elevation to this relic surface than any other reach. The farthest downstream terrace, between r-km 0 and r-km 3, is inundated by the 2 yr peak discharge. Between r-km 10 and r-km 16, all Holocene terraces are spatially limited and the Qt6 surface exhibits narrow surfaces typically between 2 and 4 m above the 2 yr peak discharge inundation. Holocene terraces are more extensive between 16 r-km and 30 r-km. The majority of Qt6 terraces between r-km 25 and r-km 30 are located 2 to 4 m above the 2 yr peak discharge inundation; however, two large Qt6 terraces are within 2 m elevation, which is interesting given the higher Holocene incision rates above r-km 20 [15]. Above r-km 30, Holocene surfaces are confined to a smaller area and the Qt6 surface spans a range of elevations, with several of the surfaces located 4 or more meters above the 2 yr peak discharge inundation (Figure 14).
Qt6 terraces within the lower 10 r-km and between r-km 25 and r-km 30 are closest in elevation to the modern 2 yr peak discharge inundation. Following Powers et al. [22], these two reaches are less likely to have experienced marked anthropogenic-driven incision. Between r-km 10 and r-km 20, the combination of lower long-term Holocene incision rates, relative to upstream reaches, coupled with higher Qt6 terraces elevations relative to the 2 yr peak discharge, could indicate more recent, anthropogenically driven incision along this reach. Above r-km 20, reaches with higher elevation Qt6 terraces could be related to anthropogenic incision or the primary driver could be the overall higher Holocene incision rates.

5. Discussion

The unique combination of geomorphic mapping and hydraulic modeling elucidates the geologic and geomorphic controls that are expressed in modern hydraulics. Some river reaches are characterized by large valleys that the river has migrated across throughout the Quaternary, depositing sequences of terraces, some of which are low-lying and accessible at higher floods. Within these reaches, we can identify past channels and floodplains that hold potential for reconnection. Other reaches are single thread and extremely confined within inner gorges and bedrock canyon walls, lacking any potential to increase the wetted area through restoration projects. Geologic-driven incision increases with distance upstream, but recent anthropogenic incision could also be a factor above r-km 10. Overall, the major issues that the Clearwater River is facing are as follows: (1) perched tributary confluences, likely due to inability of tributary streams to keep pace with long term mainstem incision rates and possibly exacerbated by anthropogenic aggradation due to historical logging practices, (2) seasonal presence of fine sediment on the river bed affecting salmon habitat, (3) a lack of geomorphic diversity, and (4) a decline in bare alluvium, which indicates decreased river dynamism and floodplain rejuvenation. We performed a screening-level study, integrating geomorphology and hydraulics, to identify potential mainstem reaches for future alternative analyses aiming to address these issues around increasing hydraulic connectivity.

5.1. Geomorphic Diversity and Potential Anthropogenic Change

The geologic setting of the Clearwater River basin likely controls much of the river’s spatial valley extent, which has been overprinted by recent land management changes. Wider portions of the valley support accessible floodplains and low terraces while many upstream reaches exhibit steep bedrock, inner gorge hillslopes, and bedrock-controlled rapids and pools with limited off-channel habitat. Tidal backwatering increases inundation in the lowest reach, while inundation in the upper reaches of the river is controlled by the variable hydrology and rapid changes in stream power due to changing slope and confinement.
The active geomorphic corridor, defined as the area containing active channels, unvegetated alluvium, and vegetated islands, has remained relatively stable through time and the mainstem river does not display decreased sinuosity through time. The abandonment of active geomorphic unit area is balanced by the incorporation of new active geomorphic unit area, predominately via lateral migration and mass wasting at prominent meander bends. Away from meander bends, the mainstem river may be less laterally mobile, favoring vertical incision over lateral planation. Since 1939, the geomorphic changes throughout the study area include (1) recent areal reductions in the active channel area (Table 4), (2) greater lateral movement between 1939 and 1980, compared with 1980 and 2017 (Figure 7), (3) the reduction in bare alluvial bars through time (Table 4, Figure 8), (4) field observations of perched tributary channels, and (5) field observations of stable, vegetated bars with similarly aged, older tree stands.
Although the active geomorphic corridor area remained similar, there has been a significant reduction in side channels’ connections within the lower 30 r-km (Table 5). Throughout confined reaches, channel disconnection and decreased bare alluvium are more likely to be associated with vertical incision, especially between r-km 10 and 20, which may be related to anthropogenic incision. One important loss in diversity is the 1939 floodplain near r-km 29 (Figure 6). This floodplain was marked by anastomosing side channels, vegetated islands, and bare alluvium, representing the only significant example, throughout the entire study area across all of the mapping years, of a ‘messy river’. Messy rivers are marked by their physical complexity [45], providing ecological benefits and varied habitat (e.g., [46]). Over time, the complexity and channel diversity near r-km 29 was eliminated and there are currently no side or overflow channels remaining. Across all of the mapping years, the majority of side channels were single-thread channels less than 0.5 km in length.
Our geomorphic mapping begins in 1939, but geomorphology in 1939 may have already been impacted, as logging was already underway. It is possible that the natural river system supported historically diverse and messy floodplains prior to the initiation of logging. Land management and legacy deforestation have likely exacerbated incision into the river’s typically thin alluvial cover, as logging has the potential to increase surface runoff (e.g., [47]) or change the lag time associated with smaller storm hydrographs [48]. Although it is unlikely that these hydrologic changes alone will generate incision [49], long-term incision rates on the Clearwater River have increased in the Holocene [15], setting an antecedent condition that may have been near a threshold more sensitive to anthropogenic impacts. Chapman et al. [49] also note that while counterintuitive to the increase in sediment supply due to logging, many rivers exhibit incision after logging, often attributed to the practice of removing woody debris and the use of splash dams. Even though the Clearwater River may have historically contained less large wood than Queets River, commonly implemented logging practices throughout the 19th century likely reduced the source of woody debris and also removed channel-spanning wood structures from the channel (e.g., [12]). The lack of channel complexity and resulting reduction in lateral dynamism could have provided the tipping point, favoring vertical incision along reaches of the Clearwater River.
In addition to incision, the fine sediment on the gravel bed is an important factor affecting habitat quality. We observed the continued presence of fine sediments on the channel bed in 2019 at low-flow conditions, and others have noted fine sediment impacts to spawning gravel [4,5]. Mass wasting and stream undercutting also provide a source of sediment, but in contrast to the predominately fine sediment associated with logging practices (e.g., [5]), these inputs are more likely to contain a mix of sediment sizes. Hydraulic modeling results indicate that the critical diameter of potential sediment mobilization during flood events is orders of magnitude larger than the fines impacting the spawning habitat. Fines typically drop out during the falling limb of a hydrograph, and better hydrologic data are required to understand the overall sediment dynamics. For example, reinstating the stream gauges on the Clearwater River to determine the magnitude and timing of flow conditions, as well as suspended sediments measurements would greatly benefit future studies.

5.2. Dual-Approach Channel Reconnection Identification

Both the geomorphic analysis and hydraulic analysis indicate restoration projects would likely result in the greatest advantages below r-km 10 and between r-km 25 and r-km 30, while they indicate that restoration projects targeting reaches between r-km 10 and r-km 25 may offer the fewest advantages (Table 7). The lower 10 r-km also has the greatest concentration of historical channels now disconnected from the active geomorphic corridor. Raising the water surface elevation through these reaches may result in increased access to wall-base channels, which initiate from runoff along terraces surfaces and provide refugia habitat for smolts in the Clearwater River basin [50]. The strongest indicators for potential restoration success are low-lying surfaces with most lateral migration between 1939 and 2017 (Figure 7) and the largest increase in wetted area comparing the modeled 2 yr flow to the 10 yr flow (Figure 8). Secondary indicators included favorable comparisons between the 2 yr peak discharge elevation and the Qt6 (Figure 13 and Figure 14). Taken together, these indicators help identify areas with the highest concentration of historical channels that can be reconnected and largest areas available for quality habitat development. Former channels and floodplains within unconfined reaches that were active as recently as 2006 are likely good candidates for reconnection to expand habitat.
However, there are several potential complications to consider when further evaluating river reaches for project implementation. For the area below 10 r-km, lateral migration of both the Clearwater River and the Queets River may lead to river avulsion and abandonment of the current mainstem, particularly in the lower 2 r-km. While habitat can be maintained throughout such migration, additional adaptive management may be required. Moreover, landslides prevalent above 32 r-km and adjacent to the active geomorphic corridor at meander bends (e.g., near r-km 2, r-km 15, 20 r-km, r-km 23, and r-km 30) continue to impact sediment loads, decrease channel planform stability, and could potentially bury or otherwise impact in-stream structures. Additionally, careful consideration should be taken to account for potential future incision which could impact the effectiveness of restoration efforts. The hydraulic modeling employed here allowed for comparison among reach-scale differences, but more detailed hydraulic and sediment modeling is needed to understand site-specific dynamics informing the actual design process.
Furthermore, the perched tributary channels we noted in the field are still hydraulically connected. However, the combination of mainstem vertical incision and sediment fans at tributary outlets may result in limited accessibility for fish passage. Additional geomorphic mapping farther into tributary channels may be beneficial to determine sediment sources and whether any restoration projects to better connect tributary confluences will require adaptive management to remove fan deposits at tributary outlets.

6. Conclusions

This study underscores the efficacy of employing integrated geomorphic analysis with hydraulic modeling to refine a conceptual model of side channel and floodplain disengagement which assesses the viability of potential hydraulic reconnection opportunities for salmonid habitat. Singular methodologies often yield incomplete insights; however, the combination of these approaches provides a framework for understanding both historical and contemporary geomorphic and hydraulic drivers. Through geomorphic mapping, we confirmed that in unconfined reaches the river still exhibits lateral mobility, balancing the abandonment of historical floodplains and channels with the incorporation of new channels. However, the number of open, hydraulically connected side channels in the lower 30 r-km reach has greatly reduced through time and may, in part, be related to more recent anthropogenic induced fluvial incision. Our hydraulic modeling confirmed that modern flood events, up to the 10 yr recurrence interval, do not inundate these abandoned channels. Although the active geomorphic corridor area has remained relatively stable, we view the decrease in side channel connections and decrease in bare alluvium as a validation of the conceptual model that the modern river has less access to important side channel habitat and experiences fewer scour events, at least within the lower 30 r-km reach.
The integrative methodology employed in this study enables the evaluation of large river segments where restoration is desired but optimal river reaches for a more detailed analysis and project implementation are not immediately apparent. The level of effort required for hydraulic modeling, as demonstrated here, is both appropriate and practical for screening numerous potential sites across broad areas and identifying those with the highest potential. Once the priority areas are identified, additional resources can be strategically allocated for detailed data collection and alternative analysis.
These tools and insights are particularly valuable when evaluating restoration strategies proposed by local stakeholders. The Quinault Indian Nation hypothesized that adding significant amounts of large wood to the Clearwater River could increase geomorphic diversity and re-engage disconnected channels. We found that adding complexity to the mainstem river channel will help improve the areas of incision we identified, as well as increase in-stream habitat quality and access to habitat off the main channel. Anthropogenically impacted areas are obvious targets for restoration, but the potential success of restoration efforts should be primarily considered given the impacts’ pervasiveness and geomorphic context (e.g., [51,52]). Sometimes, habitat quality and access can be easily improved along less impacted reaches and provide a more cost-effective return on investment. For example, the lower 10 r-km of the Clearwater River channel has likely not experienced anthropogenic vertical incision, and the mouth remains laterally dynamic, but this reach is also likely the best candidate to increase the WSE and access to habitat.
We illustrate the complementary use of modern hydraulic and geomorphic assessments, using the Clearwater River in Washington State as a unique case study of an unregulated river impacted by legacy deforestation. Our methodology is able to identify (1) reaches with geomorphic impacts and (2) river reaches most responsive to channel restoration. Our investigation concludes that limited pre-logging data and significant background geomorphic drivers obscure a direct cause and effect relationship between logging activities and incision in the Clearwater River, although the loss of side channels in the lower 30 r-km may be influenced by anthropogenic impacts. While we cannot definitively validate the causality of hypothesized incision, we have demonstrated an effective approach to identifying likely areas where opportunities exist for reconnection and rehabilitation.

Supplementary Materials

The following supporting information can be downloaded at: https://www.mdpi.com/article/10.3390/w17233359/s1. Figure S1: Total model outflow relative to the total model inflow as a function of simulation time demonstrating that 20 h of simulation time is sufficient to reach a steady-state at the downstream boundary and to satisfy the overall model mass balance; Figure S2: Total number of wetted model cells as a function of simulation time demonstrating that the inundation area is stable well before the end of a 20 h simulation of steady inflows.

Author Contributions

Conceptualization, J.A.B. and M.A.F.; methodology, M.A.F. and E.G.C.; formal analysis, E.G.C. and M.A.F. investigation, E.G.C. and M.A.F.; data curation, E.G.C. and M.A.F.; writing—original draft preparation, E.G.C. and M.A.F.; writing—review and editing, J.A.B.; and project administration and funding acquisition, J.A.B. All authors have read and agreed to the published version of the manuscript.

Funding

This research was funded by the United States Department of Interior, Bureau of Reclamation, Columbia-Pacific Northwest Region Native American Affairs program.

Data Availability Statement

GIS shapefiles of geomorphic mapping and hydraulic model output files are available on Reclamation’s RISE database (https://data.usbr.gov/catalog/8042).

Acknowledgments

We wish to thank the Quinault Indian Nation Fisheries Department, Bill Armstrong (formerly with Quinault Indian Nation) and Tony Hartrich (currently with Quinault Indian Nation), and Natural Systems Design for their assistance with LiDAR data assessment and field research coordination. We are grateful to Karl Wegmann and Frank Pazzaglia for sharing GIS files of their Quaternary mapping, Steve Hollenback (formerly Reclamation) for GIS processing and data management, Jonathan Pomeroy for GIS processing and aerial photos (Reclamation), Joseph Wright (Reclamation) for valuable hydrologic analysis utilized for modeling, and Brianna Benjamin (Reclamation) for assistance in supporting file publication and data availability. We thank the Bureau of Reclamation Columbia-Pacific Northwest Native American Affairs Program for funding support. Any use of trade, firm, or product names is for descriptive purposes only and does not imply endorsement by the U.S. Government.

Conflicts of Interest

The authors declare no conflicts of interest.

References

  1. Cederholm, C.J.; Salo, E.O. The Effects of Logging Road Landslide Siltation on the Salmon and Trout Spawning Gravels of Stequaleho Creek and the Clearwater River Basin, Jefferson County, Washington, 1972–1978; Final Report—Part III; University of Washington: Seattle, WA, USA, 1979. [Google Scholar]
  2. Lestelle, L. Strategic Priorities for Habitat Management to Improve the Freshwater Performance of Queets Coho Salmon; Report delivered to the Quinault Indian Nation: Taholah, WA, USA, 2009. [Google Scholar]
  3. Dominguez, L. Predictions of Coho Salmon (Orcorhynchus kisutch) Population Abundance in the Clearwater River, Washington Using Various Habitat-Rating Scenarios of the Ecoysystem Diagnosis and Treatment Method. Ph.D. Thesis, Evergreen State College, Olympia, WA, USA, 2006. [Google Scholar]
  4. Quinault Indian Nation. WRIA 21 Queets/Quinault Salmon Habitat Recovery Strategy; Quinault Indian Nation Lead Entity: Taholah, WA, USA, 2011. [Google Scholar]
  5. Cederholm, C.J.; Reid, L.M.; Salo, E.O. Cumulative Effects of Logging Road Sediment on Salmonid Populations in the Clearwater River, Jefferson Country, Washington. In Proceedings of the Conference: “Salmon-Spawning Gravel: A Renewable Resource in the Pacific Northwest?”, Contribution No. 543, Seattle, WA, USA, 6–7 October 1980; p. 35. [Google Scholar]
  6. Reid, L.M.; Dunne, T. Sediment Production from Forest Road Surfaces. Water Resour. Res. 1984, 20, 1753–1761. [Google Scholar] [CrossRef]
  7. Brown, G.W.; Krygier, J.T. Clear-Cut Logging and Sediment Production in the Oregon Coast Range. Water Resour. Res. 1971, 7, 1189–1198. [Google Scholar] [CrossRef]
  8. Platts, W.S.; Torquemada, R.J.; McHenry, M.L.; Graham, C.K. Changes in Salmon Spawning and Rearing Habitat from Increased Delivery of Fine Sediment to the South Fork Salmon River, Idaho. Trans. Am. Fish. Soc. 1989, 118, 274–283. [Google Scholar] [CrossRef]
  9. Cederholm, C.J.; Reid, L.M. Impact of Forest Management on Coho Salmon (Oncorhynchus kisutch) Populations of the Clearwater River, Washington: A Project Summary. In Streamside Management Forestry and Fishery Interactions; Salo, E.O., Cundy, T.W., Eds.; University of Washington, Institute of Forest Resources: Seattle, WA, USA, 1987; pp. 373–397. [Google Scholar]
  10. Kreutzweiser, D.P.; Capell, S.S.; Good, K.P. Effects of Fine Sediment Inputs from a Logging Road on Stream Insect Communities: A Large-Scale Experimental Approach in a Canadian Headwater Stream. Aquat. Ecol. 2005, 39, 55–66. [Google Scholar] [CrossRef]
  11. Murphy, M.L.; Koski, K.V. Input and Depletion of Woody Debris in Alaska Streams and Implications for Streamside Management. North Am. J. Fish. Manag. 1989, 9, 427–436. [Google Scholar] [CrossRef]
  12. Wohl, E. A Legacy of Absence. Prog. Phys. Geogr. Earth Environ. 2014, 38, 637–663. [Google Scholar] [CrossRef]
  13. Cianfrani, C.M.; Sullivan, S.M.P.; Hession, W.C.; Watzin, M.C. Mixed Stream Channel Morphologies: Implications for Fish Community Diversity. Aquat. Conserv. Mar. Freshw. Ecosyst. 2009, 19, 147–156. [Google Scholar] [CrossRef]
  14. Abbe, T.B.; Montgomery, D.R. Patterns and Processes of Wood Debris Accumulation in the Queets River Basin, Washington. Geomorphology 2003, 51, 81–107. [Google Scholar] [CrossRef]
  15. Wegmann, K.W.; Pazzaglia, F.J. Holocene Strath Terraces, Climate Change, and Active Tectonics: The Clearwater River Basin, Olympic Peninsula, Washington State. Bull. Geol. Soc. Am. 2002, 114, 731–744. [Google Scholar] [CrossRef]
  16. Wing, M.G.; Skaugset, A. Relationships of Channel Characteristics, Land Ownership, and Land Use Patterns to Large Woody Debris in Western Oregon Streams. Can. J. Fish. Aquat. Sci. 2002, 59, 796–807. [Google Scholar] [CrossRef]
  17. Peters, R.J.; Knudsen, E.E.; Pauley, G.B.; Cederholm, C.J. Influence of Wood and Other Habitat Characteristics on the Distribution and Abundance of Coho Salmon in a Relatively Large River. Northwest Sci. 2015, 89, 336–354. [Google Scholar] [CrossRef]
  18. Smith, K.; Hanson, K.; Malone, L. Clearwater Forest Stewardship Plan, (Completed 2013; Revised 2015); Report produced by the Nature Conservancy (TNC) and Northwest Natural Resource Group; Nature Conservancy (TNC): Jefferson County, WA, USA, 2015. [Google Scholar]
  19. Remo, J.W.F.; Giri, T.L. Assessing Geomorphic and Hydraulic Changes Related to an Unplanned Reconnection of the Middle Mississippi River and Its Floodplain near Miller City, Illinois, USA. Geomorphology 2024, 449, 109062. [Google Scholar] [CrossRef]
  20. Pavesi, L.; D’Angelo, C.; Volpi, E.; Fiori, A. RESCUE: A Geomorphology-Based, Hydrologic-Hydraulic Model for Large-Scale Inundation Mapping. J. Flood Risk Manag. 2022, 15, e12841. [Google Scholar] [CrossRef]
  21. Wheaton, J.M.; Brasington, J.; Darby, S.E.; Merz, J.; Pasternack, G.B.; Sear, D.; Vericat, D. Linking Geomorphic Changes to Salmonid Habitat at a Scale Relevant to Fish. River Res. Appl. 2010, 26, 469–486. [Google Scholar] [CrossRef]
  22. Powers, P.; Staab, B.; Cluer, B.; Thorne, C. Rediscovering, Reevaluating, and Restoring Entiatqua: Identifying Pre-Anthropocene Valleys in North Cascadia, USA. River Res. Appl. 2022, 38, 1527–1543. [Google Scholar] [CrossRef]
  23. Annis, A.; Nardi, F. GFPLAIN and Multi-Source Data Assimilation Modeling: Conceptualization of a Flood Forecasting Framework Supported by Hydrogeomorphic Floodplain Rapid Mapping. Hydrology 2021, 8, 143. [Google Scholar] [CrossRef]
  24. James, L.A.; Hodgson, M.E.; Ghoshal, S.; Latiolais, M.M. Geomorphic Change Detection Using Historic Maps and DEM Differencing: The Temporal Dimension of Geospatial Analysis. Geomorphology 2012, 137, 181–198. [Google Scholar] [CrossRef]
  25. Grabowski, R.C.; Gurnell, A.M. Using Historical Data in Fluvial Geomorphology. In Tools in Fluvial Geomorphology; Wiley: Hoboken, NJ, USA, 2016; pp. 56–75. [Google Scholar]
  26. Foster, M.A.; Godaire, J.E.; Hilldale, R.C.; Bradley, D.N.; Boyd, K. Declining Geomorphic Diversity and Potential Adaptive Management Opportunities on a Highly Regulated Reach of the Bighorn River, Montana. Int. J. River Basin Manag. 2024, 23, 555–570. [Google Scholar] [CrossRef]
  27. Pazzaglia, F.J.; Brandon, M.T. A Fluvial Record of Long-Term Steady-State Uplift and Erosion across the Cascadia Forearc High, Western Washington State. Am. J. Sci. 2001, 301, 385–431. [Google Scholar] [CrossRef]
  28. PRISM, 2012 Is the Listed Citation for the 1981–2010 30 Yr Normals. Oregon State University. Available online: https://prism.oregonstate.edu (accessed on 1 July 2023).
  29. Bull, W.B. Stream-Terrace Genesis: Implications for Soil Development. Geomorphology 1990, 3, 351–367. [Google Scholar] [CrossRef]
  30. Meyer, G.A.; Wells, S.G.; Jull, A.J.T. Fire and Alluvial Chronology in Yellowstone National Park: Climatic and Intrinsic Controls on Holocene Geomorphic Processes. Geol. Soc. Am. Bull. 1995, 107, 1211–1230. [Google Scholar] [CrossRef]
  31. Wegmann, K.W. Late Quaternary Fluvial and Tectonic Evolution of the Clearwater River Basin, Western Olympic Mountains, Washington State. Ph.D. Thesis, University of New Mexico, Albuquerque, NM, USA, 1999. [Google Scholar]
  32. Fiksdal, A.J.; Brunengo, M.J. Forest Slope Stability Project-Phase II, WDOE 81-14; Washington State Department of Natural Resources (DNR): Olympia, WA, USA, 1981. [Google Scholar]
  33. Washington State Landslide Inventory Database. WDGER (Washington Division of Geology and Earth Resources). Available online: https://geologyportal.dnr.wa.gov/2d-view#wigm?-14056695,-12882622,5745536,6302609 (accessed on 22 June 2023).
  34. Pomeroy, J. Clearwater River Historical Aerial Photography Processing Documentation for the Quinault Department of Fisheries. Technical Memorandum; U.S. Department of the Interior, Bureau of Reclamation: Denver, CO, USA, 2020. Available online: https://data.usbr.gov/catalog/8042 (accessed on 22 June 2023).
  35. Lai, Y.G. SRH-2D Version 2: Theory and User’s Manual; US Department of the Interior, Bureau of Reclamation: Denver, CO, USA, 2008. [Google Scholar]
  36. Lai, Y.G. Two-Dimensional Depth-Averaged Flow Modeling with an Unstructured Hybrid Mesh. J. Hydraul. Eng. 2010, 136, 12–23. [Google Scholar] [CrossRef]
  37. Shields, A. Application of Similarity Principles and Turbulence Research to Bedload Movement; Translated from German; California Institute of Technology: Pasadena, CA, USA, 1936. [Google Scholar]
  38. Vanoni, V.A. Sedimentation Engineering; ASCE Manual 54; ASCE: New York, NY, USA, 1975. [Google Scholar]
  39. Wright, J. Clearwater River Watershed Flood Frequency Analysis, Report No. ENV-2021-048; US Department of the Interior, Bureau of Reclamation: Denver, CO, USA, 2020. Available online: https://data.usbr.gov/catalog/8042 (accessed on 22 June 2023).
  40. Mastin, M.C.; Konrad, C.P.; Veilleux, A.G.; Tecca, A.E. Magnitude, Frequency, and Trends of Floods at Gaged and Ungaged Sites in Washington, Based on Data Through Water Year 2014; Scientific Investigations Report No. 2016-5118; US Geological Survey: Reston, VA, USA, 2016. [Google Scholar]
  41. Olson, P.L.; Legg, N.T.; Abbe, T.B.; Reinhart, M.A.; Radloff, J.K. A Methodology for Delineating Planning-Level Channel Migration Zones; No. 14-06-025; Washington State Department of Ecology: Olympia, WA, USA, 2014. [Google Scholar]
  42. Greco, S.E.; Girvetz, E.H.; Larsen, E.W.; Mann, J.P.; Tuil, J.L.; Lowney, C. Relative Elevation Topographic Surface Modelling of a Large Alluvial River Floodplain and Applications for the Study and Management of Riparian Landscapes. Landsc. Res. 2008, 33, 461–486. [Google Scholar] [CrossRef]
  43. Hagans, D.K.; Weaver, W.E.; Madej, M.A. Long-Term on-Site and off-Site Effects of Logging Sand Erosion in the Redwood Creek Basin, Northern California; Technical Bulletin; National Council of the Paper Industry for Air and Stream Improvement: New York, NY, USA, 1986; Volume 490, pp. 38–66. Available online: https://pubs.usgs.gov/publication/70006754 (accessed on 14 November 2025).
  44. Swanson, F.J.; Benda, L.E.; Duncan, S.H.; Grant, G.E.; Megahan, W.F.; Reid, L.M.; Ziemer, R.R. Mass Failures and Other Processes of Sediment Production in Pacific Northwest Forest Landscapes. In Streamside Management: Forestry and Fishery Interactions, Proceedings of the Symposium Held at University of Washington, Seattle, WA, USA, 12–14 February 1986; Salo, E.O., Cundy, T.W., Eds.; Institute of Forest Resources: Seattle, WA, USA, 1987; pp. 9–38. [Google Scholar]
  45. Wohl, E.E. Messy Rivers Are Healthy Rivers: The Role of Physical Complexity in Sustaining Ecosystem Processes. In Proceedings of the River Flow—Proceedings of the International Conference on Fluvial Hydraulics, RIVER FLOW 2016, Saint-Louis, MO, USA, 10–15 July 2016; Taylor & Francis: Iowa City, IA, USA, 2016; pp. 24–29. [Google Scholar]
  46. Everall, N.C.; Farmer, A.; Heath, A.F.; Jacklin, T.E.; Wilby, R.L. Ecological Benefits of Creating Messy Rivers. Area 2012, 44, 470–478. [Google Scholar] [CrossRef]
  47. Brooks, S.M.; Richards, K.S.; Nussbaum, R. Simulator Experiments of the Varied Consequences of Rain Forest Logging for Runoff and Erosion. Geogr. Ann. Ser. A Phys. Geogr. 1994, 76, 143–152. [Google Scholar] [CrossRef]
  48. Wright, K.A.; Sendek, K.H.; Rice, R.M.; Thomas, R.B. Logging Effects on Streamflow: Storm Runoff at Caspar Creek in Northwestern California. Water Resour. Res. 1990, 26, 1657–1667. [Google Scholar] [CrossRef]
  49. Chapman, W.A.L.; Finnegan, N.J. The Signature of Climate in Fluvial Suspended Sediment Records. J. Geophys. Res. Earth Surf. 2024, 129, e2023JF007429. [Google Scholar] [CrossRef]
  50. Peterson, N.P.; Reid, L.M. Wall-Base Channels: Their Evolution, Distribution and Use by Juvenile Coho Salmon in the Clearwater River, Washington. In Proceedings of the Olympic Wild Fish Conference, Peninsula College Fisheries Technology Program, Port Angeles, WA, USA, 23–25 March 1983; Walton, J.M., Houston, D.B., Eds.; Olympic National Park and Peninsula College: Port Angeles, WA, USA, 1983; pp. 215–225. [Google Scholar]
  51. Wohl, E. Rivers in the Anthropocene: The U.S. Perspective. Geomorphology 2020, 366, 106600. [Google Scholar] [CrossRef]
  52. Wohl, E.; Rathburn, S.; Dunn, S.; Iskin, E.; Katz, A.; Marshall, A.; Means-Brous, M.; Scamardo, J.; Triantafillou, S.; Uno, H. Geomorphic Context in Process-based River Restoration. River Res. Appl. 2024, 40, 322–340. [Google Scholar] [CrossRef]
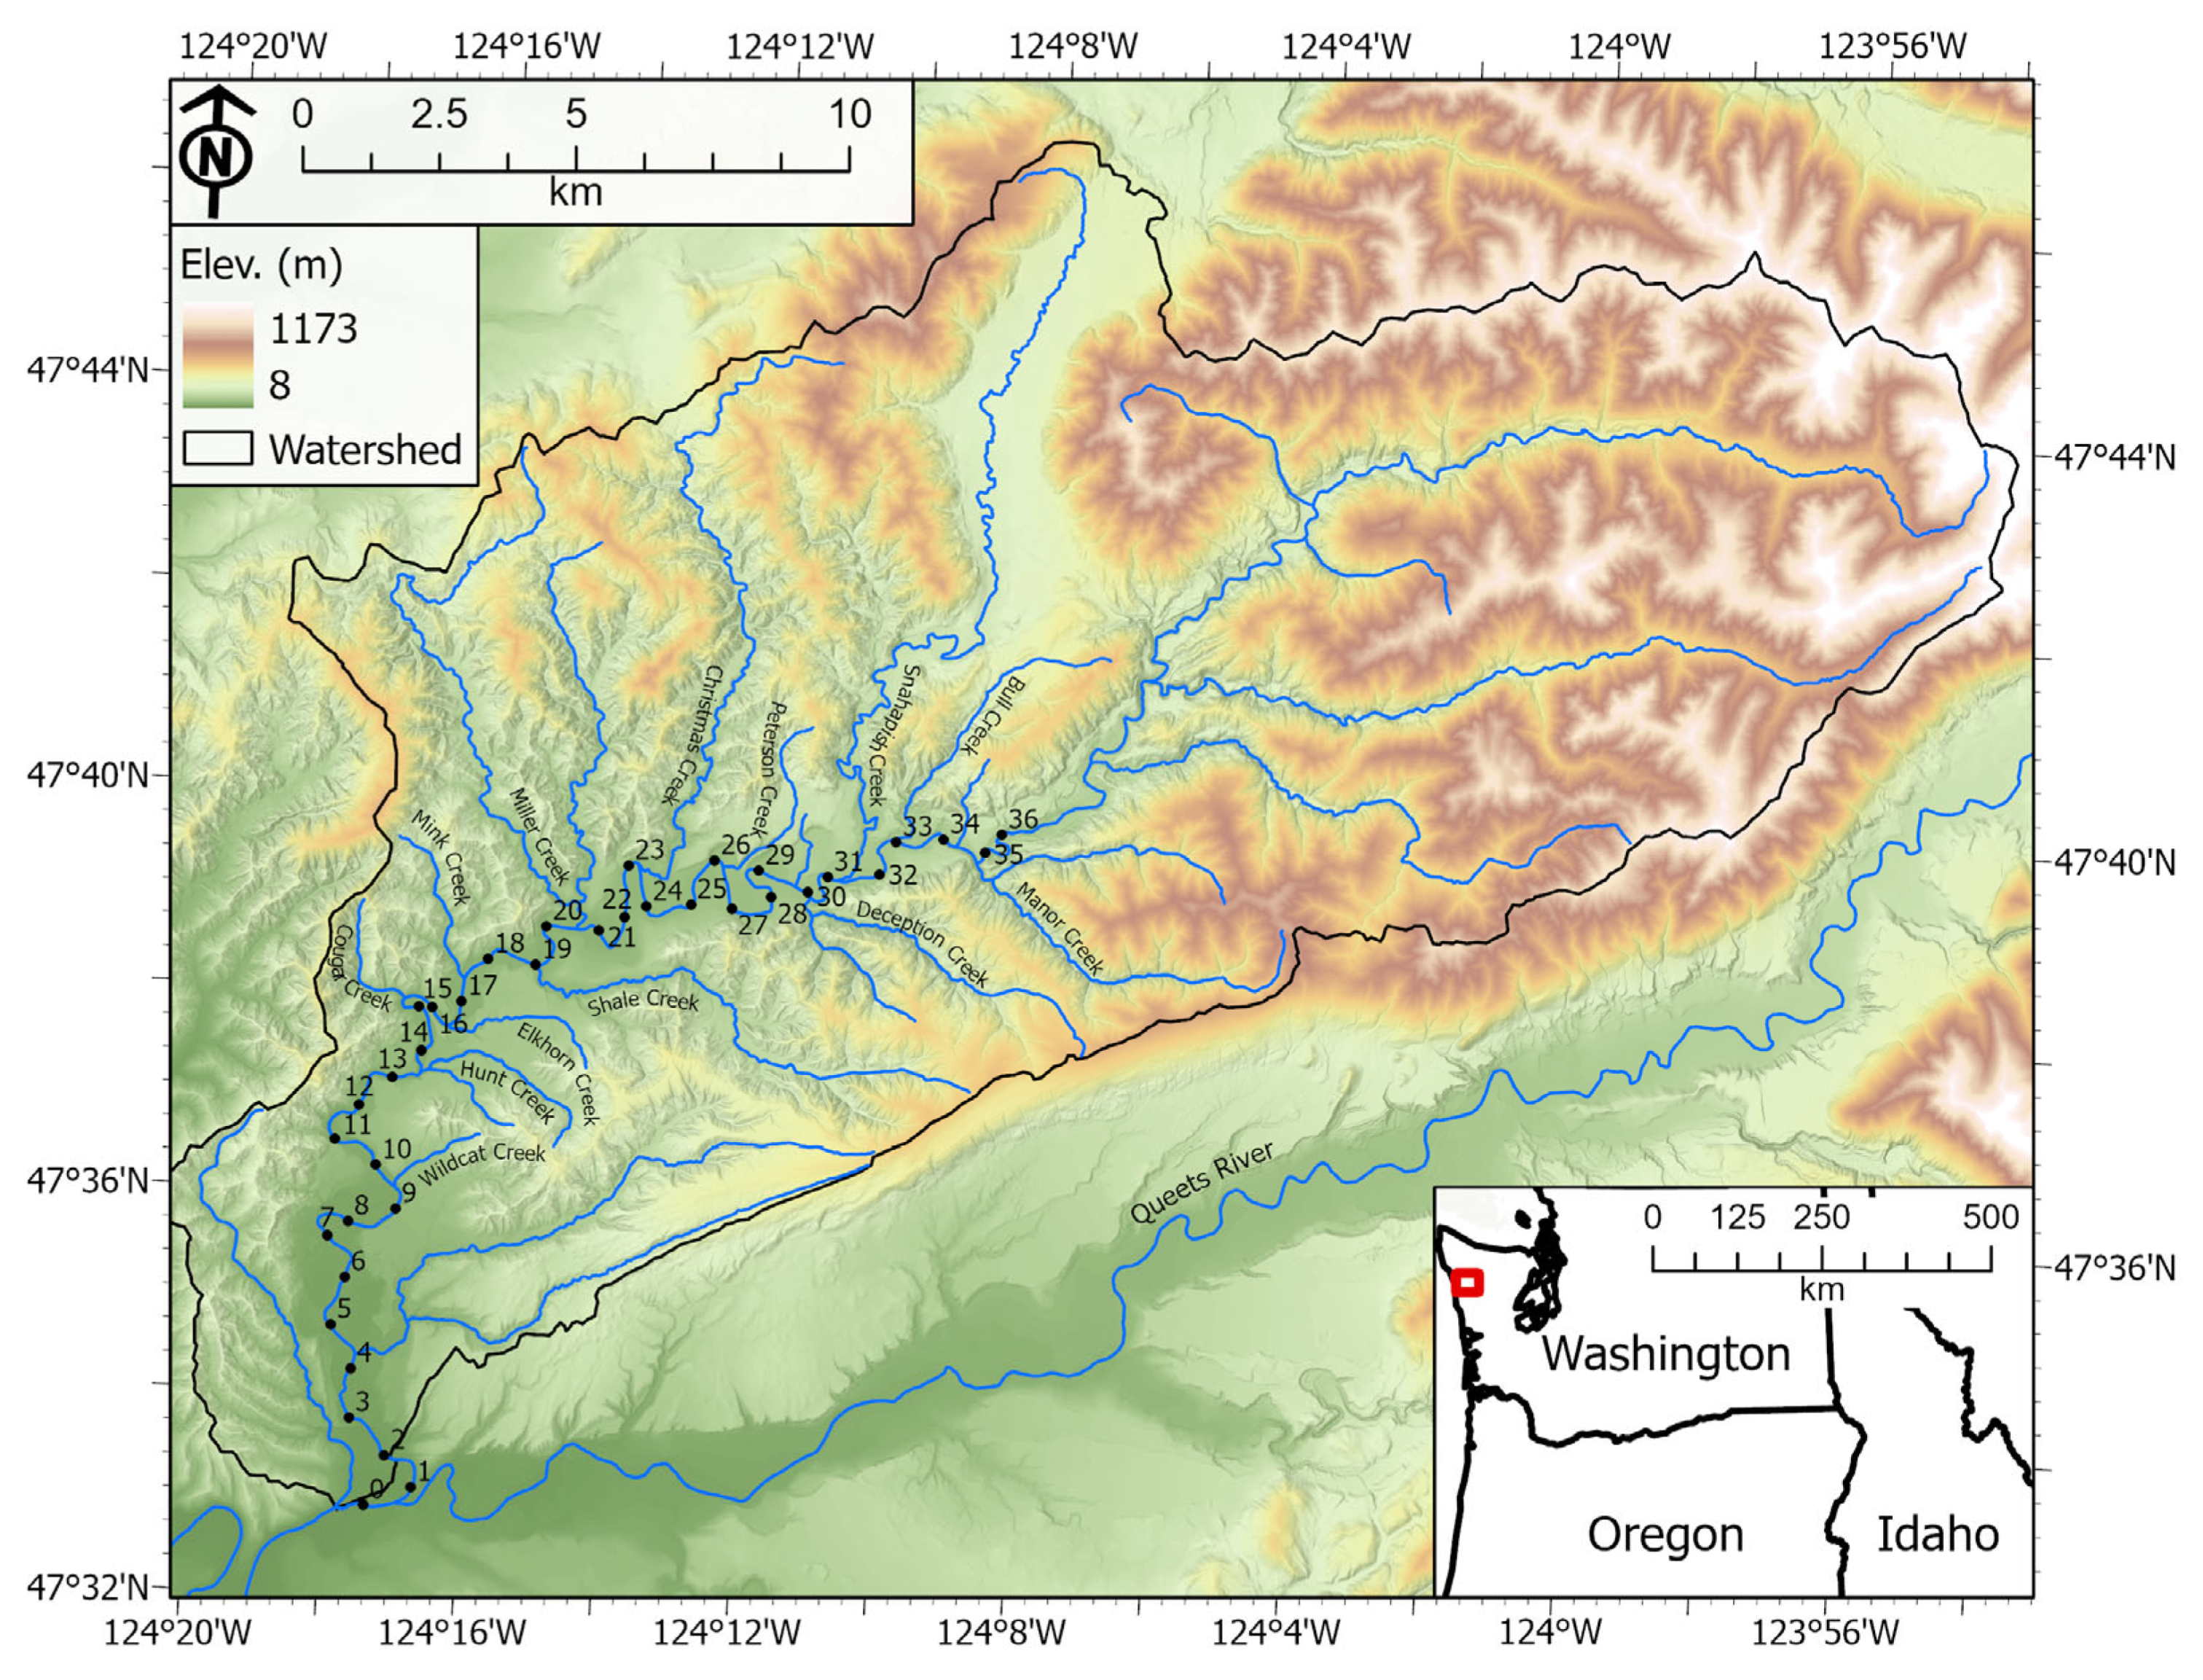
Figure 1. Clearwater River watershed in western Washington, United States of America; red box on inset represents spatial extent in regional context. Major tributary inputs are labeled, and river kilometer (r-km) locations are numbered and labeled as black dots with r-km 0 located near the modern confluence between the Clearwater and Queets Rivers. Flow direction is from high to low r-km.
Water 17 03359 g001
Figure 2. Field photos of the Clearwater River. (A) Bare cobble bar, with diameters of approximately 100 mm, upstream from r-km 37. (B) Larger stones and boulders, lining the bank, near r-km 30. (C) Unnamed tributary, cutting through small fine sediment delta, near r-km 11. (D) Landslide, between r-km 36 and 37. (E) Flat-topped eroded bare gravel bar, just upstream from r-km 37. (F) Bedrock outcropping across the channel near r-km 7. (G) Bedrock dominated riffle, upstream from r-km 37. (H) Bedrock-dominated pool, between r-km 35 and 36.
Water 17 03359 g002
Figure 3. Methodological framework overview and list of products.
Water 17 03359 g003
Figure 4. Examples of geomorphic and anthropogenic features observed on aerial and satellite imagery (not every feature is labeled). River kilometers (r-km) are labeled with dots and numbers along the mainstem Clearwater River.
Water 17 03359 g004
Figure 5. Hydraulic modeling domain and example portions of modeling mesh. Numbered inlets shown here correspond to inflow points listed in Table 2.
Water 17 03359 g005
Figure 6. Geomorphic mapping example for mapping years 2017, 1980, and 1939 between r-km 28 and r-km 34. River kilometers (r-km) are labeled with dots and numbers along the mainstem Clearwater River. Shapefiles are available at data.usbr.gov (see Data Availability Statement).
Water 17 03359 g006
Figure 7. Reaches with significant channel change along the mainstem Clearwater River (Qac) and landslide mapping from this study (described by the year mapped or source), Wegmann [31], and WDGER [33]. River kilometers (r-km) are labeled with dots and numbers along the mainstem Clearwater River. The underlying hillshade is derived from lidar datasets.
Water 17 03359 g007
Figure 8. Stacked area plot of geomorphic units, showing change in individual areas and the active geomorphic corridor through time, between r-km 1.8 and r-km 37.3. (A) Mainstem Clearwater River, (B) side channels, (C) overflow channels, (D) modeled overflow channels, (E) Holocene fans, (F) bare alluvium, (G) Qb1, modern/Holocene vegetated alluvium, surrounded by the channels or bare alluvium, (H) modern/Holocene vegetated alluvium, previously occupied by active channels or bare alluvium but lies outside of the active geomorphic corridor (disconnected), (I) modern/Holocene vegetated alluvium, not occupied by channels or bare alluvium in historical imagery, and (J) Qt7, the lowest and youngest terrace mapped within the younger Holocene terraces.
Water 17 03359 g008
Figure 9. Inundated areas (i.e., where water depth ≥ 0.003 m) from SRH-2D simulations of different return interval (RI) peak discharge cases. The spatial distributions are layered with the largest flow (50 yr RI, red) on the bottom, and the active channel from 2017 mapping (Qac, light blue) on the top to show the increasing areal extent. River kilometers (r-km) are labeled with dots and numbers along the mainstem Clearwater River. Model output files are available at data.usbr.gov (see Data Availability Statement).
Water 17 03359 g009
Figure 10. Total inundated area less the active channel area (Qac, 2017 mapping), binned by r-km for the 2 yr, 5 yr, and 10 yr flows (solid bars, left axis), and the change in wetted area between 2 yr and 10 yr flows (right axis).
Water 17 03359 g010
Figure 11. Total inundated area less the active channel area (Qac, 2017 mapping) binned by r-km for the 2 yr flow with the baseline, doubled, and quadrupled roughness values (n = 0.03, 0.06 and 0.12, respectively).
Water 17 03359 g011
Figure 12. Critical diameter computed from hydraulic modeling shear stress comparing a confined reach (top row) to an unconfined reach (bottom row) for the 2 yr (left column), 5 yr (center column), and 10 yr (right column) flows. River kilometers (r-km) are labeled with dots and numbers along the mainstem Clearwater River.
Water 17 03359 g012
Figure 13. REM with elevations relative to (a) bare earth surface elevation, r-km 11–12, (b) 2 yr peak discharge WSE, r-km 11–12, (c) bare earth surface elevation, r-km 7–8, and (d) 2 yr peak discharge WSE, r-km 7–8. River kilometers (r-km) are labeled with dots and numbers along the mainstem Clearwater River.
Water 17 03359 g013
Figure 14. Median elevation on Qt6 terrace surface above the 2 yr peak discharge water surface elevation. River kilometers (r-km) are labeled with dots and numbers along the mainstem Clearwater River. River reaches were grouped by general trends in terrace elevation and terrace size for sub-figure plots.
Water 17 03359 g014
Table 1. Aerial and satellite imagery.
YearResolution
19391:30,000, 25-micron digital scan of single photos
19501:37,400, 25-micron digital scan of single photos
19801:20,000, 25-micron digital scan of single photos, from the Clearwater River Mouth (r-km 0) to Miller Creek tributary confluence (near r-km 20.5)
1:24,000, 40-micron digital scan of single photos, upstream from Miller Creek
1994Digital Orthophoto Quadrangles (DOQ), typically 1 m resolution
2006High Resolution Orthophoto, typically 1 m or finer resolution
2017National Agriculture Imagery Program (NAIP), typically 1 m resolution
Table 4. Total area occupied by geomorphic units for each mapping year between r-km 1.8 and r-km 37.3.
Year193919501980199420062017
Unit area within Active Geomorphic Corridor (106 m2)
Qac1.021.001.121.031.090.94
Qsc0.060.040.060.060.070.06
Qoc0.070.060.100.050.050.17
Qocmodeln/an/an/an/an/a0.11
Qalbare (Qb2)0.590.780.330.320.310.38
Qfan<0.01<0.01<0.01<0.01<0.01<0.01
Qalveg (Qb1)0.070.190.330.410.330.52 (0.38) 1
All Units1.832.081.941.861.862.17 (1.92) 1
Unit Area of modern, vegetated alluvium outside of Active Geomorphic Corridor (106 m2)
Qalveg (Disconnected)n/a0.420.640.950.960.89
Qalveg (Other) 20.020.110.300.170.240.17
Unit area of all modern, vegetated alluvium, within and outside of geomorphic corridor (106 m2)
0.090.721.281.541.521.57
Unit area of Qt7, youngest Holocene terrace, within and outside of geomorphic corridor (106 m2) 3
0.770.440.320.300.280.27
Notes: 1 The area of Qb1 and the active geomorphic corridor shown in parentheses excludes vegetated bars surrounded by modeled overflow channels (Qocmodel), for the purpose of comparing with preceding datasets. 2 Other Qalveg is vegetated alluvium not included in Qb1 or disconnected subunits. 3 The Qt7 unit was mapped by Wegmann [31] and is not considered one of the geomorphic units but is shown here because it was difficult to discern the Qt7 terrace from modern, vegetated alluvium, especially in earlier sets of historical imagery.
Table 5. Number of side and overflow channel inlets in river reaches in 2017 and 1939.
Reach,
(r-km Range)
Side Channels,
Qsc 1
Overflow Channels,
Qoc (Qoc + Qocmodel) 1,2
1939201719392017
1.8–10841212 (25)
10–169323 (4)
16–212036 (6)
21–3010666 (10)
30–353624 (10)
35–37.30133 (3)
Notes: 1 Gray shading indicates the mapping year with the greater number of channels. 2 In 2017, the number of overflow channels outside of parentheses reflects those identified by mapping only (Qoc) and the number inside parentheses reflects those identified by both mapping and hydraulic modeling (Qoc + Qocmodel).
Table 6. Landslide area mapped from each data source in thousands of square meters, between r-km 1.8 and 37.3.
Landslides 11939195019801994200620172022
Lidar
Wegmann
(Late 90s)
Field
Mapping
WDGER 2
Area
(103 m2)
837730433173123321264924
Notes: 1 In addition to mapped landslide polygons, there were point locations and lines representing scarps or areas of frequent landsliding, which are not included here. Landslides identified from lidar, field mapping (Wegmann and this study), and WDGER include generalized Quaternary landslides initiated at unknown times. 2 The WDGER mapping includes landslides along the mainstem and tributary channels between r-km 1.8 and r-km 37.3. We removed the footprint of landslides mapped in this study from the WDGER areas. All the other mapped landslide units are predominately located along the mainstem Clearwater River.
Table 7. Advantages and disadvantages of implementing restoration efforts by location.
Prioritization for Further AnalysisReach,
r-km
Considerations for Success
1Below 10
-
Highest concentration of historical channels available for reconnection
-
Largest increase in wetted area possible with raise in WSE
-
Broad Qt6 surfaces less than 2 m above flood
-
Any channel modifications within the lower 2 r-km may require adaptive management to maintain due to dynamic lateral movement of the Clearwater River in this reach.
225 to 30
-
Higher concentration of disconnected units for reconnection
-
Moderate increase in wetted area possible with raise in WSE
-
Several Qt6 terraces within 1 to 3 m above flood
-
Overall steeper reach
330 to 36
-
Larger increase in wetted area possible with raise in WSE
-
Some low-lying terraces
-
Higher-relief and bedrock dominated
-
Lower concentration of disconnected units for reconnection
415 to 25
-
Moderate increase in wetted area possible with raise in WSE
-
Lower concentration of disconnected units for reconnection
-
Higher Qt6 terraces elevations relative to the 2 yr peak discharge WSE
510 to 15
-
Most likely heavily impacted by anthropogenic incision
-
Higher Qt6 terraces elevations relative to the 2 yr peak discharge WSE
-
Smallest increase in wetted area
-
Most geomorphically confined
Disclaimer/Publisher’s Note: The statements, opinions and data contained in all publications are solely those of the individual author(s) and contributor(s) and not of MDPI and/or the editor(s). MDPI and/or the editor(s) disclaim responsibility for any injury to people or property resulting from any ideas, methods, instructions or products referred to in the content.