Abstract
In cold regions, solar radiation triggers the spring ablation of river ice layers, thereby changing their physical traits and mechanical behavior. This study uses the Heilongjiang River section near Mohe Arctic Village as the research prototype area. It analyzes the impact of solar radiation on ice density and uniaxial compressive strength through indoor simulation tests and multiple regression analysis, aiming to reveal the influence mechanism on uniaxial compressive strength. The results show that after applying a cumulative amount of simulated solar radiation of 84 MJ/m2, the ice density decreases by 3.88%, and the loss rate of uniaxial compressive strength can exceed 50%. Solar radiation promotes the transformation of the uniaxial compressive failure mode from ductile to brittle. The established multiple regression model attains a coefficient of determination of 0.891. In the spring ice-melting period in cold regions, the impact of solar radiation on ice strength should be fully considered in the design of ice condition early warnings and water conservancy projects for ice flood prevention.
1. Introduction
When the temperature of rivers, lakes, and streams drops below the freezing point in winter, icing occurs [1]. In spring, as solar radiation continues to intensify, the ice layer begins to melt, and ice jams often occur [2,3]. During the ice jam period, drifting ice and ice dams not only cause serious damage to hydraulic structures in these areas but also often pose a serious threat to the safety of ice flood prevention and flood control [4]. Therefore, a comprehensive investigation into the effects of solar radiation on the physico-mechanical characteristics of ice provides critical data for preventing frost damage to water infrastructures and mitigating ice-jam floods, thereby informing better risk assessment and management strategies.
The main physico-mechanical parameters of ice encompass properties such as density change and compressive behavior under uniaxial loading [5,6]. According to Zhang et al. [7], the density characteristics of freshwater ice are primarily influenced by internal impurities; specifically, variations in sediment and air cavity content constitute key factors leading to differences in ice density. Li et al. [8] conducted on-site observations at Hongqipao Reservoir in Heilongjiang and found that the density of surface ice during the spring ablation period still decreases even when the internal impurities remain unchanged. However, solar radiation is the main factor that exerts a dramatic impact on the ice layer during the spring ablation period [9]. Shen et al. [10] discovered that the ability of natural freshwater ice to resist compression rises with decreasing temperature, and the maximum uniaxial compressive strength occurs at a loading rate resulting in 10−4 s−1 strain. Zhang et al. [11] found that the compressive behavior of lab-made freshwater ice under uniaxial stress changes significantly with the rate of strain application, with a ductile region, a brittle region, and an intermediate ductile–brittle transition zone. In the ductile regime, the compressive behavior under uniaxial stress increases as the strain rate is raised; in the brittle zone, it decreases sharply as the strain rate rises; in the intermediate zone (1 × 10⁻⁵ s−1 to 3 × 10⁻³ s−1), there is a ductile–brittle transition where the compressive strength under uniaxial loading reaches its maximum value. Deng et al. [12] characterized the mechanical response of ice under compression at low strain rates and found that over a strain rate spectrum from 10−4 s−1 to 10−2 s−1, the specimen failure mode in ice gradually transforms from ductile failure to brittle failure. A large number of studies have indicated that temperature and strain rate are important influencing factors on the mechanical strength of ice in uniaxial compression, and thus, they must be taken into account when conducting uniaxial compression tests [13,14,15].
Currently, research on the impact of solar radiation on river ice layers is extensive. Penetration of solar radiation into the ice layer occurs, providing the heat required for melting [16]. This causes the water temperature under the ice cover to rise [17], thereby accelerating ice melting [18]. Therefore, solar radiation is positively correlated with the ice melting rate [19]. Hence, solar radiation is the fundamental cause of ice thickness ablation [20]. Studies have shown that solar radiation has a substantial effect on the thermal ablation process of both the superficial and the internal layers of the ice cover [21]. However, most current studies are limited to the role of solar radiation in the ice melting rate. In fact, solar radiation contributes to the warming of ice, and when the ice reaches its phase transition temperature, it begins to melt, and internal melting and metamorphism will occur [22,23]; additionally, the internal pores of the ice will increase [24], which in turn affects the physical characteristics and mechanical response of ice [25].
Research on the direct impact of solar radiation on the physical characteristics and mechanical response of ice is very scarce. Therefore, conducting in-depth research on this aspect can fill the gap in this field and has important academic significance.
The estimation of compressive strength under uniaxial loading using multiple regression equations is widely applied to various materials. Aladejare et al. [26] selected indirect tensile strength, point load measurements, and ultrasonic pulse velocities as input variables and used multiple regression equations to predict uniaxial compressive strength (UCS); Liu et al. [27] prepared a new type of similar material considering water characteristics and predicted its uniaxial compressive strength through multiple regression equations; Janani et al. [28] predicted the mechanical properties of concrete with steel fibers added by means of multiple regression equations, and a favorable comparison was observed between the predicted and experimental values.
Because ice has low mechanical strength during the ice-melting period, it is relatively dangerous to carry out ice mechanics test sampling in the field, and it is also difficult to conduct quantitative analysis on the solar radiation to which ice samples have been exposed. For this reason, this research employs a cryogenic laboratory and a custom-built solar radiation simulation device to measure and analyze the influence of solar radiation on the density, uniaxial compressive failure mode, maximum compressive resistance in single-axis loading, and loss rate of artificial freshwater ice through indoor simulation. A prediction equation for ice mechanical strength during the ice-melting period is established using multiple linear regression. This study aims to reveal the mechanism by which solar radiation affects the physical characteristics and mechanical response of ice, expand the research content of ice mechanics, and provide scientific and technological support for preventing ice jam disasters.
2. Materials and Methods
2.1. Research Prototype Area
The Heilongjiang River, ranking among the globe’s top ten longest rivers, is an essential international watercourse in the Northeast Asian region. It flows through China, Russia, and Mongolia. The river’s overall length measures about 4440 km (taking the Ergun River as its source). The section of the Heilongjiang River within China’s territory is about 3474 km long, with multiple tributaries including the Songhua River, the Ussuri River, and the Nen River. Due to its long ice period, thick ice layers, and high risk of ice jams, the Heilongjiang River is one of the rivers in China most prone to ice disasters, making it a suitable prototype area for studying ice mechanics. Arctic Village is located in Mohe City, Daxing’anling Region, Heilongjiang Province, on the south bank of the Mohe section of the Heilongjiang River. The region has a longitudinal extent of 122°21′05″–122°21′30″ E and a latitudinal extent of 53°27′00″–53°33′30″ N, with an average annual temperature of about −5 °C and the lowest winter temperature dropping below −50 °C. This study selects the section of the Heilongjiang River near this area (with geographical coordinates of 122.3° east longitude and 53.6° north latitude) as the experimental prototype area. The geographical environment of this area is shown in Figure 1.
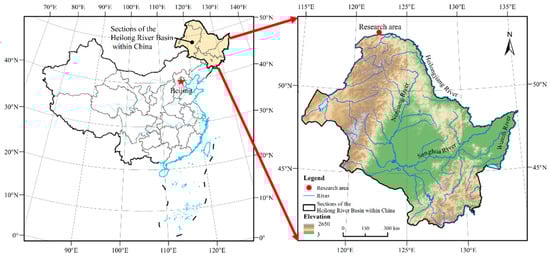
Figure 1.
The geography of the study area.
2.2. Source of Research Prototype Data
This study selects the date when the maximum spring temperature starts to continuously exceed 0 °C in the Heilongjiang River section near Mohe Arctic Village (with geographical coordinates of 122.3° E and 53.6° N) from 2013 to 2022 as the research start date, and the river ice breakup date as the research end date. The source of the research prototype data is the ERA5-Land dataset (https://cds.climate.copernicus.eu/ (accessed on 9 October 2024)), which has an hourly resolution and a spatial resolution of 0.1 × 0.1 grid cells. This dataset is widely used in Northeast China [29], and the difference between the measured values and this dataset is small [30]. The start date is determined by extracting ERA5 reanalysis data, and the end date is derived from the statistical data provided by the Heilongjiang Provincial Hydrology and Water Resources Center. The results are shown in Figure 2. In this study, the average value of daily cumulative net solar radiation during the research prototype period, as shown in Figure 2, was selected as the reference in the laboratory. The results are shown in Figure 3.
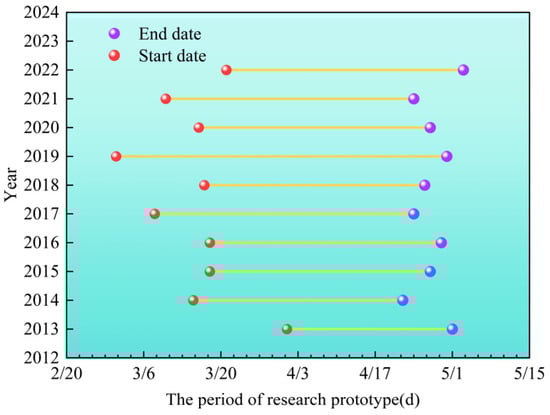
Figure 2.
Research prototype period.
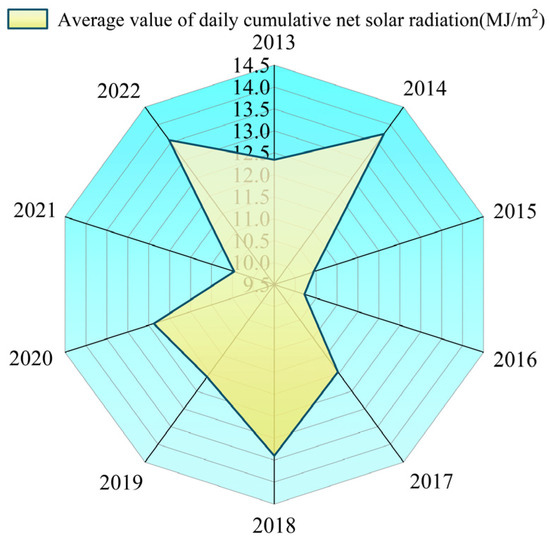
Figure 3.
Cumulative amount of net solar radiation in the research prototype period.
During the ice melting period, the thermal state inside the ice mass is approximately 0 °C [31]. In this study, the ambient temperature is controlled at −1 °C to make the ice sample close to the state before melting, and at the same time, it is ensured that the changes in the physical characteristics and mechanical response of the ice are exclusively determined by the single variable of solar radiation so as to avoid the impact of environmental temperature fluctuations on the physical and mechanical properties of ice.
2.3. Test Method
2.3.1. Test Equipment
The test equipment for the uniaxial compression test comprises a computer-controlled electromechanical testing system and a cryogenic climate chamber. The test equipment is shown in Figure 4. The microcomputer-controlled electronic universal testing machine, model CMT5305D, can provide a test force ranging from 0 to 300 kN. The moving speed of its compression device can be adjusted within supported speeds ranging from as low as 0.001 to as high as 500 mm/min, and it has high-precision dynamic control capability. With a temperature control precision of ±0.1 °C, the chamber can provide a stable low-temperature environment, thereby preventing the test results from being affected by temperature fluctuations.
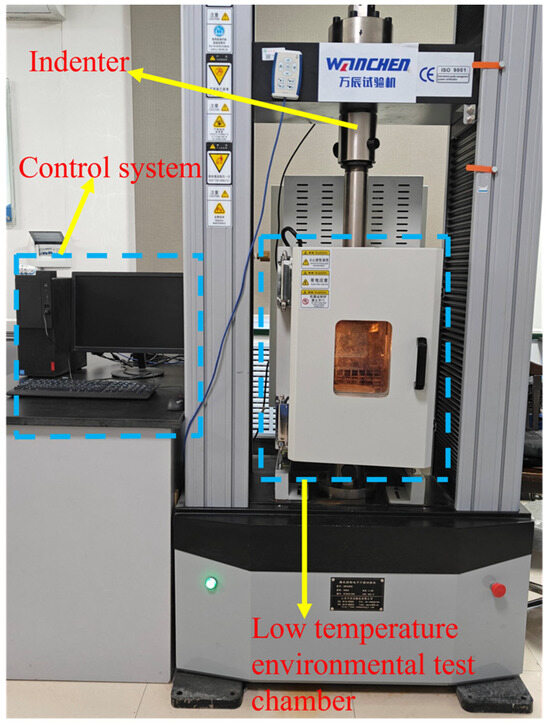
Figure 4.
CMT5305D electronic universal testing machine.
Selecting a light source that most closely resembles actual sunlight is the most important part of simulating real solar radiation. Wang et al. compared four types of light sources—iodine-tungsten lamps, incandescent lamps, metal halide lamps, and long-arc xenon lamps—regarding their color temperature, spectral matching degree, and energy proportion in each wavelength band relative to actual sunlight. They ultimately determined that long-arc xenon lamps are the closest to actual sunlight [32]. The solar radiation simulator used in this study consists of 9 long-arc xenon lamps, each with a power of 400 W. They are arranged in a 3 × 3 square structure. Figure 5 shows the plan layout and section layout of the solar radiation simulator. To ensure uniform heat absorption by the artificial freshwater ice during simulated solar irradiation and to prevent large heat differences affecting the test results, a heat flux sensor was used to measure the heat flux absorbed by the ice. The measurement results are shown in Figure 6. The heat distribution in the 80 cm × 80 cm area is relatively uniform, with an average heat flux of 278.23 W/m2 in this region, and the calibration uncertainty is 3%.
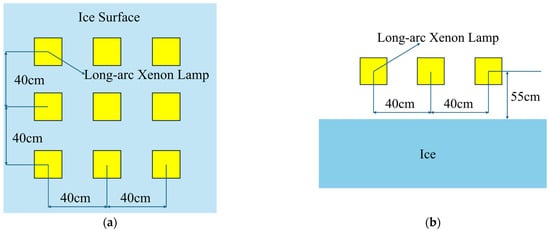
Figure 5.
Layout of solar radiation simulator. (a) Floor plan; (b) Section view.
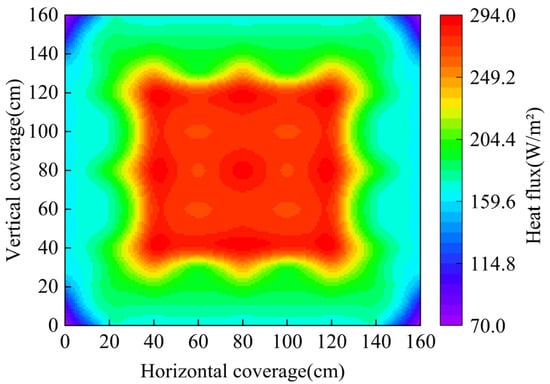
Figure 6.
Heat flux distribution plot.
2.3.2. Sample Preparation
The artificial freshwater ice samples were fabricated in a refrigerated environmental simulation laboratory. The internal dimensions of the laboratory are 4 m × 5 m × 2.5 m (length × width × height), and a stainless steel water tank, measuring 4 m × 4 m × 1.2 m (length × width × height), is installed inside. The internal temperature of the laboratory is adjustable between −40 °C and 40 °C, providing high-precision temperature control within ±0.5 °C.
First, inject tap water to a depth of 60 cm into the stainless steel water tank and filter out impurities from the water. Then, set the laboratory temperature to 2 °C and maintain it for 48 h to cool the water temperature to near 0 °C, simulating the water temperature of a river before it freezes over. Next, set the temperature to −5 °C and enter the laboratory every hour to stir the water, allowing air bubbles to be released. Stop stirring once the water’s surface is frozen. After that, set the temperature control mode to decrease by 1 °C every 2 h until it drops to −30 °C, and then maintain a constant temperature of −30 °C to allow the water to gradually freeze into ice. Measure the ice thickness by artificial drilling. When the ice thickness reaches 40 cm, change the temperature control mode to increase by 2 °C per hour until it reaches −1 °C, and then shut down the system.
The average value of the cumulative daily solar radiation of the test prototype over ten years is 12.06 MJ/m2, and it is calculated that 12.04 h is needed to reach this value. For the convenience of control during the test, the irradiation time is set to 12 h. Considering that solar radiation is not constant due to changes in solar altitude and the alternation of day and night, the ice absorbs heat and melts during the day and releases heat and freezes at night as a result of these changes. Repeated freeze–thaw cycles will produce cracks, thereby changing the physical characteristics and mechanical response of ice. To simulate this phenomenon, with reference to the research results of Tian et al. [33] and Wang et al. [34], an intermittent illumination method is adopted, that is, the solar radiation simulator is turned on for 1 h and then turned off for 1 h until the required cumulative amount of simulated solar irradiation is reached. In this study, ice samples with simulated cumulative solar radiation amounts of 0, 12, 24, 36, 48, 60, 72, and 84 MJ/m2 are selected as the research objects. The cumulative amount of simulated solar radiation is calculated by multiplying the average heat flux of 278.23 W/m2, as determined in the previous section, by the duration of solar radiation exposure. The expanded uncertainty of the cumulative amount of simulated solar radiation is 3%. Test specimens shall be prismatic or cylindrical, with a nominal cross-sectional dimension of 7–10 cm and a length that gives an aspect ratio of 2.5:1 [35]. The specimen size is determined as 70 mm × 70 mm × 175 mm (length × width × height). A desktop electric saw is used to cut the specimen into a standard rectangular prism, and a geotechnical plane is employed to trim the side surfaces to ensure they are flat.
2.3.3. Test Principles and Procedures
Material strength is theoretically the maximum stress a material can sustain before failure occurs. However, as the load on ice increases, internal damage within the ice also begins to develop until it is eventually crushed. Therefore, there is no distinct starting point of failure, and measuring the force experimentally at the onset of failure remains a challenge. In engineering practice, the strength of ice is often used to determine its maximum resistance. Thus, the microstructural damage inside the ice is generally not considered, and instead, the ultimate stress obtained from experiments is taken as the uniaxial compressive strength of ice. The formula for calculating the uniaxial compressive strength is as follows:
where is the maximum load during the loading process (N), represents the cross-sectional area of the specimen (mm2).
The strain rate in the test can be calculated by the displacement rate of the testing apparatus, which can be calculated with the following equation:
where is the loading rate of the testing machine (mm/s), is defined as the specimen’s starting length (mm).
Considering that the temperature of the ice samples selected in this study is relatively high, an excessively long test duration may affect the results. Therefore, three strain rates were chosen for this investigation: 10−2 s−1, 10−3 s−1, and 10−4 s−1. All strains in this study were obtained by measuring the crosshead displacement of the testing machine. The test procedures are as follows: (1) After applying different cumulative simulated solar radiation doses to the ice specimens, quickly cut them into dimensions of 70 mm × 70 mm × 175 mm (length × width × height), use a vernier caliper to measure the size of the sample multiple times, and take the average value to calculate the volume of the sample. (2) Use an electronic balance to weigh the sample. (3) Compute the sample’s density. Prepare three samples under each test condition, measure each sample repeatedly three times, and take the average of all results as the density of the sample under that test condition. (4) Adjust the temperature of the refrigerated test chamber to −1 °C. Wait until the temperature stabilizes. (5) Quickly put the ice sample that has undergone the density measurement into the refrigerated test chamber and place it at the center of the lower base plate of the compression tester. A polytetrafluoroethylene (PTFE) gasket is placed between the specimen and the pressure plate to reduce the impact of end-face friction on the test results. (6) Power on the testing machine’s controls, then carefully manipulate the lower base plate to bring it into contact with the top of the specimen. Carefully check to ensure that the specimen is positioned at the center of the pressure plate to avoid the impact of eccentric loading on the test results. (7) After the internal temperature of the low-temperature test chamber stabilizes at −1 °C and there is no melting phenomenon on the surface of the specimen, input the corresponding test parameters and then start loading. (8) Loading must be terminated the instant the sample fails, with photographs taken to record the failure mode. (9) Dispose of the ice debris and reconfigure the test setup for the following experiment.
It should be noted that due to the inherent variability in ice mechanical characteristics, to ensure that the test results are not interfered with by accidental situations, this study ensures that there are three groups of samples under each test condition. Moreover, it is required that the data from the triplicate samples are tightly clustered around the median, with both the minimum and maximum values being within a 15% margin of the median [36]. If a sample does not meet the requirement, it will be discarded, and the test will be repeated until all sample results meet the requirement. This study utilized a total of 79 samples, of which 72 were valid.
3. Results and Analysis
3.1. Effects from Solar Radiation upon the Internal Structure of Artificial Freshwater Ice: Processes and Mechanisms
Figure 7 shows the morphologies of artificial freshwater ice samples subjected to simulated cumulative solar radiation doses of 0, 12, 24, 36, 48, 60, 72, and 84 MJ/m2. It can be observed from Figure 7 that there are no obvious cracks in the ice sample when solar radiation is not applied. After applying a simulated cumulative solar radiation dose of 12 MJ/m2, a few cracks become visible inside the ice sample, with relatively thin crack widths. When the simulated cumulative solar radiation dose reaches 24 MJ/m2, the population of internal cracks grows, and the crack width is greater than that of the ice sample subjected to 12 MJ/m2 of simulated cumulative solar radiation. With the application of simulated cumulative solar radiation doses of 36 MJ/m2, 48 MJ/m2, and 60 MJ/m2, the number of cracks continues to increase. The originally thin cracks gradually merge to form thicker “flow-line” cracks, and the internal transparency of the ice sample decreases simultaneously. After applying simulated cumulative solar radiation doses of 72 MJ/m2 and 84 MJ/m2, cracks are distributed throughout the upper and middle parts of the ice sample, crisscrossing each other. The ice sample presents a “fog-like turbidity” with a significant decrease in transparency.
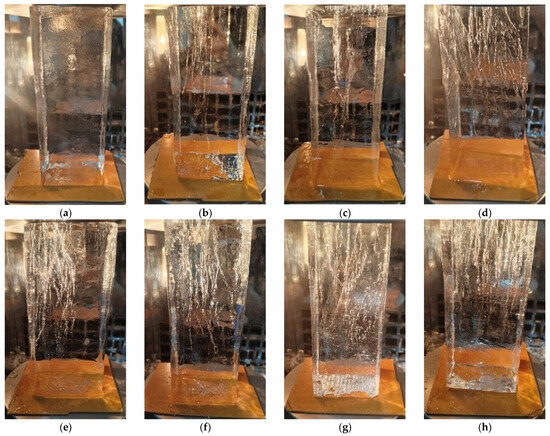
Figure 7.
Photographs of artificial freshwater ice specimens subjected to different cumulative simulated solar radiation doses: (a) 0 MJ/m2; (b) 12 MJ/m2; (c) 24 MJ/m2; (d) 36 MJ/m2; (e) 48 MJ/m2; (f) 60 MJ/m2; (g) 72 MJ/m2; (h) 84 MJ/m2.
According to the research findings by Niu et al. [37] and Huo et al. [38], the surface ice temperature exhibits rapid fluctuations in response to changes in solar radiation, while the variation in deep ice temperature shows a lag effect. Therefore, the mechanism behind the phenomena shown in Figure 7 is as follows: In this experiment, an intermittent illumination method was adopted. When the solar radiation simulator was turned on, the ice surface captured incident solar radiation and rapidly warmed up. Based on the heat flux and exposure duration obtained in the previous text, the upper part of the ice may approach 0 °C. The water molecules in the surface ice crystals vibrated more intensely after being heated, and the molecular spacing increased, leading to the volume expansion of the surface ice. However, due to ice’s limited ability to conduct heat, the deep ice remained in a low-temperature state with little or no volume expansion. The uneven temperature changes between the surface ice and deep ice caused constraints between regions with larger volume expansion and those with smaller volume expansion, as the former could not expand freely, thus generating mutual stress. The surface ice was subjected to compressive stress, while the deep ice was under tensile stress. When the internal stress of the ice exceeded its tensile strength, cracks formed inside the ice. When the solar radiation simulator was turned off, the surface ice released heat and cooled down rapidly, resulting in volume contraction. Since the deep ice cooled later than the surface ice, the deep ice expanded in volume at this time while the surface ice contracted. Under the repeated action of such stress, the ice’s internal crystalline makeup gradually developed cracks. The mechanism of action shares certain similarities with the findings of Roustaei et al. [39] on freeze–thaw cycles in fiber-reinforced clay. The research results of Yu [40] on the microstructure of artificially frozen ice after indoor simulated solar radiation and Wan [41] on the microstructure of melting river ice in the Songhua River show that solar radiation will increase the porosity inside the ice, which further proves the reliability of the research results shown in Figure 7.
3.2. The Effect of Solar Radiation on Ice Density
Figure 8 is a box plot of the density of artificial freshwater ice after being subjected to different cumulative amounts of simulated solar radiation. As shown in Figure 8, the density ranges of artificial freshwater ice after being subjected to cumulative simulated solar radiation amounts of 0 MJ/m2, 12 MJ/m2, 24 MJ/m2, 36 MJ/m2, 48 MJ/m2, 60 MJ/m2, 72 MJ/m2, and 84 MJ/m2 are 908.6–914.9 kg/m3, 903.5–911.6 kg/m3, 897.9–909.4 kg/m3, 892.6–902.7 kg/m3, 887.2–894.7 kg/m3, 881.6–888.3 kg/m3, 877.6–882.9 kg/m3, and 873.2–878.3 kg/m3, respectively, with the average ice densities being 911.6 kg/m3, 906.9 kg/m3, 902.3 kg/m3, 897.8 kg/m3, 891.1 kg/m3, 885.1 kg/m3, 880.4 kg/m3, and 876.2 kg/m3, respectively. The above test results indicate that the density of artificial freshwater ice is inversely related to the solar irradiation level. A linear fitting was performed on it, and the fitting formula is as follows:
where is the artificial freshwater ice’s density (kg/m3), and is the simulated cumulative solar radiation dose (MJ/m2).
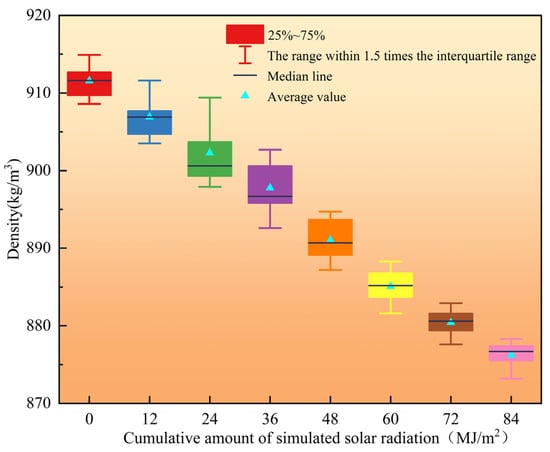
Figure 8.
Box plot of artificial freshwater ice density.
It can be found from the Formula that for every 1 MJ/m2 increase in solar radiation, the density of artificial freshwater ice decreases by approximately 0.45 kg/m3. The phenomenon shown in Figure 8 occurs because, as the cumulative amount of simulated solar radiation applied to the artificial freshwater ice samples increases, the internal cracks in the ice samples also increase, and these cracks are filled with air. Since the mass of air with the same volume is much smaller than that of artificial freshwater ice, the density of artificial freshwater ice gradually decreases as the number of internal cracks increases.
Table 1 presents the descriptive statistical data on the density of artificial freshwater ice following the application of different simulated solar radiation doses.

Table 1.
Descriptive statistical data of artificial freshwater ice density.
3.3. Effect of Solar Radiation on Failure Modes During Uniaxial Compression
In this experiment, the failure modes of ice specimens subjected to uniaxial compression can be classified into ductile failure, transitional failure mode from ductile to brittle, and brittle failure, based on differences in their stress–strain curves and the state of the specimens after failure. Figure 9 shows typical photographs of these three failure modes. Figure 9a displays the breakage morphology of an ice sample that was tested at a strain rate of 10−4 s−1 without the application of simulated solar radiation. Numerous cracks develop within the specimen, and the overall color is white, but the specimen as a whole does not undergo obvious damage. This failure mode is a typical ductile failure. Figure 9b shows an ice sample’s breakage morphology that was tested at a strain rate of 10−4 s−1 and a cumulative simulated solar radiation dose of 12 MJ/m2. The specimen fractures into multiple pieces along the vertical direction, and the degree of damage is more severe than that of the specimen shown in Figure 9a. However, compared with the specimen shown in Figure 9c, it does not fracture completely. This failure mode exhibits both ductile and brittle characteristics, belonging to the transitional failure mode from ductile to brittle. Figure 9c presents the failure morphology of an ice sample with a strain rate of 10−4 s−1 and a cumulative simulated solar radiation dose of 48 MJ/m2. The specimen fractures into multiple irregular ice pieces, with fewer cracks inside the pieces and a stepped fracture appearance. The degree of damage to this specimen is more severe than that of the specimens shown in Figure 9a,b, and this failure is a typical brittle failure. It was found from the research results of Wang et al. [42] and Liu et al. [43] on Arctic sea ice and Bohai Sea ice that the uniaxial compression failure mode of ice transitions from ductile to brittle as porosity increases. In this study, the fractures generated by solar radiation may increase the porosity of artificial freshwater ice, thereby causing the transition of its uniaxial compression failure mode from ductile to brittle.
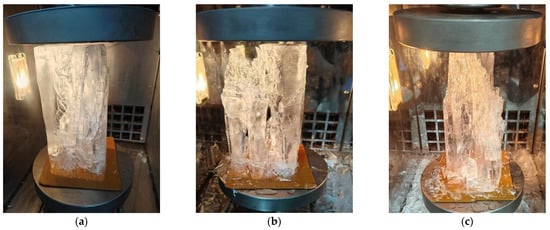
Figure 9.
Different failure morphologies of ice samples: (a) Ductile failure morphology; (b) Failure morphology in the transition state from ductility to brittleness; (c) Brittle failure morphology.
3.4. Impact of Solar Radiation on Stress–Strain Curve Behavior During Uniaxial Compression
Figure 10a–c shows the force–displacement curves of each sample in Figure 9a–c. The stress–strain curves presented in Figure 11 are calculated from the force–displacement curves of each sample in Figure 10, and the peak stress is obtained by calculating the maximum force value on the force–displacement curves. From a stage-division perspective, all three types of stress–strain curves can be split into the following three stages.
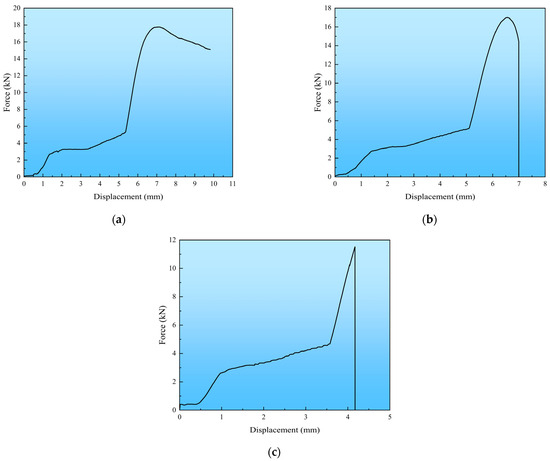
Figure 10.
Force–displacement curves of ice specimens: (a) Force–displacement curve of ductile failure; (b) Force–displacement curve of ductile–brittle transition failure; (c) Force–displacement curve of brittle failure.
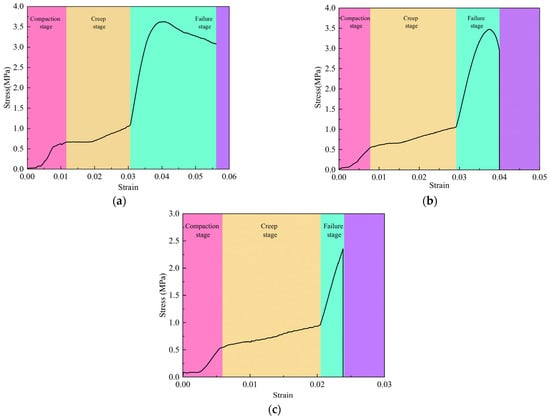
Figure 11.
Ice samples’ stress–strain curves: (a) Stress–strain curve of ductile failure; (b) Stress–strain curve of transition from ductile failure to brittle failure; (c) Stress–strain curve of brittle failure.
The first stage is the compaction stage. During this stage, all three stress–strain curves undergo a period of nonlinear growth. The reason for this phenomenon is that the contact between the indenter and the sample cannot be absolutely tight at the beginning of the test, and the contact surface between the sample and the indenter cannot be made completely horizontal. During this stage, as the strain increases, the stress grows slowly until the indenter completely compacts the sample.
The second stage is the creep stage. During this stage, all three stress–strain curves exhibit a plateau period, followed by a phase of slow serrated growth. The reasons for the above phenomena are mainly twofold: first, the ice samples used in this test have a relatively high temperature, which causes local melting when they are subjected to pressure; second, the internal cracks of the samples are compressed under pressure [44,45].
The third stage is the failure stage, in which there are some differences among the three stress–strain curves. The stress–strain curve shown in Figure 11a first undergoes a period of linear growth, then the stress rises nonlinearly until it reaches the peak, and finally, the stress decreases slowly as the strain increases, which is a typical ductile failure. The underlying cause of this phenomenon is that the sample is not exposed to solar radiation at this time, coupled with the dominance of the plastic deformation mechanism under the test conditions. The stress variation process of the stress–strain curve in Figure 11b before reaching the peak is the same as that in Figure 11a. After reaching the peak, as strain rises, the stress exhibits a nonlinear decrease before dropping to zero suddenly, which is a failure mode with both ductile and brittle properties. From a causal perspective, this phenomenon occurs because solar radiation causes cracks inside the ice sample, reducing the dislocation movement ability of the ice sample, thereby leading to a decrease in plastic deformation capacity and an increase in brittle deformation capacity, resulting in the failure mode of the ice sample showing both brittleness and ductility. The stress–strain curve in Figure 11c shows that the stress reaches a peak after a period of linear growth and then drops directly to zero, which is a typical brittle failure. From a causal perspective, this phenomenon occurs because, as the ice sample is exposed to increasing solar radiation, the number of internal cracks also increases. The plastic deformation capacity is gradually lost, allowing the cracks to propagate rapidly without plastic deformation. In terms of results, this study aligns with the work of Zhang et al. [46].
3.5. Effects of Solar Radiation on the Compressive Strength and Its Loss Rate in Artificial Freshwater Ice
To analyze the specific impact of solar radiation on the ice’s uniaxial compressive strength, this study conducts a detailed analysis by calculating the loss rate of artificial freshwater ice’s uniaxial compressive strength after applying different amounts of solar radiation. The equation is
where is the uniaxial compressive strength loss rate (%), is the specimen’s average uniaxial compressive strength without solar radiation (MPa), is the specimen’s average uniaxial compressive strength applied with n MJ/m2 of simulated solar radiation (MPa).
Figure 12 illustrates the relationship between the average uniaxial compressive strength, loss rate calculation results of artificial freshwater ice samples, and different cumulative amounts of simulated solar radiation at strain rates of 10−4 s−1, 10−3 s−1, and 10−2 s−1.
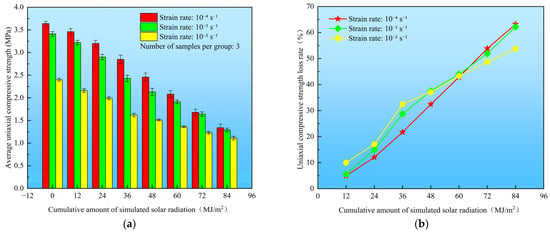
Figure 12.
(a) Relationship between cumulative simulated solar radiation and average artificial freshwater ice’s uniaxial compressive strength; (b) Relationship between cumulative simulated solar radiation and freshwater ice’s uniaxial compressive strength loss rate.
After applying cumulative simulated solar radiation amounts of 0 MJ/m2, 12 MJ/m2, 24 MJ/m2, 36 MJ/m2, 48 MJ/m2, 60 MJ/m2, 72 MJ/m2, and 84 MJ/m2 to the artificial freshwater ice samples, respectively, at a 10−4 s−1 strain rate, the artificial freshwater ice samples’ average uniaxial compressive strengths are 3.64 MPa, 3.46 MPa, 3.20 MPa, 2.85 MPa, 2.46 MPa, 2.08 MPa, 1.68 MPa, and 1.34 MPa, respectively. Compared with the ice samples without simulated solar radiation, the uniaxial compressive strength loss rate after applying cumulative simulated solar radiation amounts of 12 MJ/m2, 24 MJ/m2, 36 MJ/m2, 48 MJ/m2, 60 MJ/m2, 72 MJ/m2, and 84 MJ/m2 reaches 4.95%, 12.09%, 21.70%, 32.42%, 42.86%, 53.85%, and 63.19%, respectively. At a 10−3 s−1 strain rate, the artificial freshwater ice samples’ average uniaxial compressive strengths are 3.41 MPa, 3.22 MPa, 2.90 MPa, 2.43 MPa, 2.13 MPa, 1.91 MPa, 1.64 MPa, and 1.29 MPa, respectively. Compared with the ice samples without simulated solar radiation, the uniaxial compressive strength loss rate after applying cumulative simulated solar radiation amounts of 12 MJ/m2, 24 MJ/m2, 36 MJ/m2, 48 MJ/m2, 60 MJ/m2, 72 MJ/m2, and 84 MJ/m2 reaches 5.57%, 14.96%, 28.74%, 37.54%, 43.99%, 51.91%, and 62.17%, respectively. At a 10−2 s−1 strain rate, the artificial freshwater ice samples’ average uniaxial compressive strengths are 2.40 MPa, 2.16 MPa, 1.99 MPa, 1.62 MPa, 1.51 MPa, 1.36 MPa, 1.23 MPa, and 1.11 MPa, respectively. Compared with the ice samples without simulated solar radiation, the uniaxial compressive strength loss rate after applying cumulative simulated solar radiation amounts of 12 MJ/m2, 24 MJ/m2, 36 MJ/m2, 48 MJ/m2, 60 MJ/m2, 72 MJ/m2, and 84 MJ/m2 reaches 10.00%, 17.08%, 32.50%, 37.08%, 43.33%, 48.75%, and 53.75%, respectively. The descriptive statistics of the uniaxial compressive strength of artificial freshwater ice are shown in Table 2.
Table 2.
Descriptive statistical data of uniaxial compressive strength of artificial freshwater ice.
It can be seen from the data shown in Figure 12 that at 10−4 s−1, 10−3 s−1, and 10−2 s−1 strain rates, as the cumulative amount of simulated solar radiation applied to the artificial freshwater ice samples increases, the corresponding uniaxial compressive strength decreases continuously, and the loss rate increases accordingly. The reason is that solar radiation causes crack formation inside the ice. The continuous accumulation of these cracks reduces the samples’ load-bearing capacity, resulting in a steady decrease in their uniaxial compressive strength.
To further determine whether solar radiation has a significant effect on the uniaxial compressive strength of artificial freshwater ice, this study conducted Kruskal–Wallis tests and post hoc tests on the uniaxial compressive strength of artificial freshwater ice under different simulated solar radiation doses at strain rates of 10−4 s−1, 10−3 s−1, and 10−2 s−1. If the adjusted p-value was less than 0.05, the difference was considered significant. The results revealed the following:
At a strain rate of 10−4 s−1, significant differences were observed between the uniaxial compressive strength of artificial freshwater ice without solar radiation and those with simulated solar radiation doses of 36 MJ/m2, 48 MJ/m2, 60 MJ/m2, 72 MJ/m2, and 84 MJ/m2. Significant differences were also found between the strength with a simulated solar radiation dose of 12 MJ/m2 and those with doses of 60 MJ/m2, 72 MJ/m2, and 84 MJ/m2, as well as between the strength with a dose of 24 MJ/m2 and those with doses of 72 MJ/m2 and 84 MJ/m2.
At a strain rate of 10−3 s−1, significant differences were observed in the uniaxial compressive strength between conditions without solar radiation and those with simulated solar radiation doses of 60 MJ/m2, 72 MJ/m2, and 84 MJ/m2. Significant differences were also found between the strength with a dose of 12 MJ/m2 and those with doses of 60 MJ/m2, 72 MJ/m2, and 84 MJ/m2, as well as between the strength with a dose of 24 MJ/m2 and that with a dose of 84 MJ/m2.
At a strain rate of 10−2 s−1, significant differences were observed in the uniaxial compressive strength between conditions without solar radiation and those with simulated solar radiation doses of 48 MJ/m2, 60 MJ/m2, 72 MJ/m2, and 84 MJ/m2. Significant differences were also found between the strength with a dose of 12 MJ/m2 and those with doses of 60 MJ/m2, 72 MJ/m2, and 84 MJ/m2, as well as between the strength with a dose of 24 MJ/m2 and those with doses of 72 MJ/m2 and 84 MJ/m2.
These results indicate that solar radiation, when accumulated to a certain level, significantly reduces ice strength. Therefore, extra caution is advised for safety during work on ice in the spring melting period.
3.6. Multiple Linear Regression Equation for Artificial Freshwater Ice’s Uniaxial Compressive Strength
To comprehensively consider the link between the compressive strength of artificial ice under uniaxial loading and various influencing factors, this study employs the method of multiple linear regression. Its purpose is to establish an inherent connection between the influencing indicators of the compressive strength under uniaxial loading of artificial freshwater ice, and further to construct a forecasting model for the mechanical strength of ice over the course of the spring melt season, with the aim of providing a framework for the ice flood prevention design of water conservancy projects in cold regions.
The multiple linear regression equation has the following form:
where is the uniaxial compressive strength of artificial freshwater ice, , , are the respective influencing factors, , , are the regression coefficients corresponding to each influencing factor, and is the random variable of the error term.
The multiple linear regression equation obtained from Equation (5) is as follows:
where is artificial freshwater ice’s uniaxial compressive strength, is the unstandardized value of cumulative simulated solar radiation, is the unstandardized value of strain rate. To evaluate the forecasting capability of Equation (6), this study uses the root mean square error (), coefficient of determination (), and mean absolute error () for evaluation. The formulas for calculation are provided below:
where is the coefficient of determination, is the root-mean-square error, is the mean absolute error, is the sum of squared errors, is the total sum of squares, is the actual value, is the predicted value corresponding to each actual value, is the mean of the actual values, and is the number of samples.
The coefficient of determination of the multiple linear regression equation obtained in this study is 0.891, with a root mean square error of 0.268 MPa and a mean absolute error of 0.189 MPa. For the training set derived from 5-fold cross-validation, the coefficient of determination is 0.888, the root mean square error is 0.268 MPa, and the mean absolute error is 0.194 MPa. As for the test set, the coefficient of determination is 0.867, the root mean square error is 0.265 MPa, and the mean absolute error is 0.193 MPa. Comprehensive analysis of the residual plot of the multiple linear regression equation and the Cook’s distance of all data points reveals that there are no observations with strong influence. Meanwhile, the Variance Inflation Factors (VIF) corresponding to the simulated cumulative solar radiation and strain rate are both 1, indicating no multicollinearity. The above analysis indicates that the prediction model established in this study performs well. To evaluate the importance of the impact of each independent variable in Equation (6), this study uses standardized regression coefficients for comparison. The formulas for calculation are provided below:
where is the unstandardized regression coefficient of the independent variable , is the standard deviation of the independent variable , is the standard deviation of the dependent variable .
From Equations (6) and (10), it can be derived that the standardized regression coefficient for the cumulative amount of simulated solar radiation is −0.863, and the standardized regression coefficient for the strain rate is −0.382. It can thus be concluded that the influence of solar radiation on the uniaxial compressive strength of artificial freshwater ice is 2.26 times that of the strain rate, indicating that solar radiation is a primary factor in the loss of ice mechanical strength during the spring ice melting period. Table 3 presents the results of the multiple linear regression analysis derived from this study.
Table 3.
Multiple linear regression results.
According to the research findings of Zhang [47] and Xu [48], artificial freshwater ice and natural river ice share the same crystal structure, both being columnar ice, with their average grain size ranges falling within comparable levels. The bubble content in artificial freshwater ice is slightly lower than that in natural river ice, though the values are relatively close. These three points indicate that the physical characteristics of artificial freshwater ice and natural river ice are quite similar. Although the predictive model developed in this study is only applicable to artificial freshwater ice, the close physical properties between artificial freshwater ice and natural river ice suggest that using artificial freshwater ice to simulate natural river ice holds certain reference value; it cannot be denied that when the relationships and conclusions obtained in this study are applied to field scenarios, they should be regarded as fundamental laws under ideal conditions. In the future, systematic research should be conducted on the influence of solar radiation on ice with varying impurity contents to develop predictive models with greater practical application value in real-world settings.
4. Conclusions
In this study, the research team applied varying amounts of simulated solar radiation to artificial freshwater ice samples to measure and analyze their effects on two properties: density and uniaxial compressive strength. A multiple linear regression equation for the uniaxial compressive strength of artificial freshwater ice, concerning the cumulative amount of simulated solar radiation and strain rate, was obtained. The principal conclusions are given below:
- Intermittent solar radiation can cause repeated heating and cooling of the ice body, which in turn leads to a temperature difference between the surface ice and the deep ice. This temperature difference induces repeated expansion and contraction of the surface ice and deep ice, eventually resulting in cracks. The continuous accumulation of cracks will significantly reduce the ice density. The density of the ice sample subjected to 84 MJ/m2 of simulated solar radiation decreases by 3.88% compared with that of the ice sample without solar radiation.
- The stages of alteration in the uniaxial compressive stress–strain curves of ice in this study can be divided into the compaction stage, creep stage, and failure stage based on the morphology of these curves. Solar radiation will promote the melting of ice crystal interfaces to form liquid water films. Simultaneously, the continuous increase in cracks will inhibit dislocation movement, leading to a loss of plastic deformation capacity. Consequently, the uniaxial compression failure mode gradually transforms from ductile to brittle failure.
- Under the conditions of this experiment, when the strain rates are 10−4 s−1, 10−3 s−1, and 10−2 s−1, after applying a cumulative simulated solar radiation of 84 MJ/m2, the loss rates of the artificial freshwater ice’s uniaxial compressive strength all reach more than 50%. This indicates that solar radiation significantly weakens the uniaxial compressive strength of artificial freshwater ice, so safety should be prioritized when working on ice in the spring.
- Solar radiation is the main driving force behind the loss of ice mechanical strength during the ice ablation period in spring. The multiple linear regression equation established in this study can accurately predict changes in ice strength under different radiation conditions. This prediction can provide valuable references for early ice condition warnings in rivers of cold regions and for designing water conservancy projects to prevent ice disasters.
Due to the limitations of experimental conditions, there are still some differences between the simulated solar radiation used in this study and the actual solar radiation. Additionally, there are differences in the internal structure between artificial freshwater ice and natural river ice. Meanwhile, only the influence of solar radiation on the physical characteristics and mechanical response of artificial freshwater ice under specific ambient temperatures was studied; the next step of the research can focus on the influence of solar radiation on the internal temperature and microstructure of ice. Future research should focus on establishing a bridge between the laboratory scale and the field scale, and on extending laboratory research results to practical on-site applications.
Author Contributions
Conceptualization, C.S. and E.W.; methodology, C.S.; formal analysis, C.S.; investigation, C.S. and E.W.; resources, E.W. and X.L.; data curation, C.S. and E.W.; writing—original draft preparation, C.S.; writing—review and editing, H.H., E.W. and X.L.; funding acquisition, E.W. and H.H. All authors have read and agreed to the published version of the manuscript.
Funding
This research was supported by the Major Scientific and Technological Projects of the Ministry of Water Resources of China (No. SKS-2022017) and Heilongjiang Provincial Emergency Management Department Science and Technology Project (20250101).
Data Availability Statement
The original contributions presented in this study are included in the article. Further inquiries can be directed to the corresponding author.
Conflicts of Interest
The authors declare no conflicts of interest.
References
- Saadé, R.G.; Sarraf, S. Simulation of ice cover melting in turbulent flow. Int. J. Numer. Methods Heat Fluid Flow 1995, 5, 647–663. [Google Scholar] [CrossRef]
- Yang, F.; Feng, W.; Matti, L.; Yang, Y.; Merkouriadi, I.; Cen, R.; Bai, Y.; Li, C.; Liao, H. Simulation and seasonal characteristics of the intra-annual heat exchange process in a shallow ice-covered lake. Sustainability 2020, 12, 7832. [Google Scholar] [CrossRef]
- Kapsch, M.L.; Graversen, R.G.; Tjernström, M. Springtime atmospheric energy transport and the control of Arctic summer sea-ice extent. Nat. Clim. Change 2013, 3, 744–748. [Google Scholar] [CrossRef]
- Beaton, A.; Whaley, R.; Corston, K.; Kenny, F. Identifying historic river ice breakup timing using MODIS and Google Earth Engine in support of operational flood monitoring in Northern Ontario. Remote Sens. Environ. 2019, 224, 352–364. [Google Scholar] [CrossRef]
- Palanque, V.; Villeneuve, É.; Budinger, M.; Pommier-Budinger, V.; Momen, G. Experimental measurement and expression of atmospheric ice Young’s modulus according to its density. Cold Reg. Sci. Technol. 2023, 212, 103890. [Google Scholar] [CrossRef]
- Wang, C.; Han, D.; Wang, Q.; Wang, Y.; Zhang, Y.; Jing, C. Study of elastoplastic deformation and crack evolution mechanism of single-crystal ice during uniaxial compression using 3D digital image correlation. Eng. Fract. Mech. 2023, 293, 109712. [Google Scholar] [CrossRef]
- Zhang, Y.; Li, Z.; Li, C.; Zhang, B.; Deng, Y. Analysis of microstructural characteristics and influencing factors of river ice in the Inner Mongolia reach of the Yellow River. J. Hydraul. Eng. 2021, 52, 1418–1429. (In Chinese) [Google Scholar]
- Li, Z.; Jia, Q.; Huang, W.; Li, C. Analysis of crystal, bubble and density characteristics of reservoir freshwater ice. J. Hydraul. Eng. 2009, 40, 1333–1338. (In Chinese) [Google Scholar]
- Kirillin, G.B.; Shatwell, T.; Wen, L. Ice-covered lakes of the Tibetan Plateau as solar heat collectors. Geophys. Res. Lett. 2021, 48, e2021GL093429. [Google Scholar] [CrossRef]
- Shen, L.; Zhao, S.; Lu, X.; Shi, Y.; Chen, S. Uniaxial compressive strength of natural freshwater ice and its temperature and strain rate effects. J. Glaciol. Geocryol. 1990, 4, 141–146. (In Chinese) [Google Scholar]
- Zhang, L.; Li, Z.; Jia, Q.; Li, G. Experimental study on uniaxial compressive strength of artificial freshwater ice. J. Hydraul. Eng. 2009, 40, 1392–1396. (In Chinese) [Google Scholar]
- Deng, K.; Feng, X.; Tan, X.; Hu, Y. Experimental research on compressive mechanical properties of ice under low strain rates. Mater. Today Commun. 2020, 24, 101029. [Google Scholar] [CrossRef]
- Wang, Q.; Zhang, B.; Deng, Y.; Li, Z. Experimental study on uniaxial compressive strength of Yellow River ice and its influencing factors. Water Resour. Hydropower Eng. 2016, 47, 90–94. (In Chinese) [Google Scholar]
- Potter, R.S.; Cammack, J.M.; Braithwaite, C.H.; Church, P.D.; Walley, S.M. A study of the compressive mechanical properties of defect-free, porous and sintered water-ice at low and high strain rates. Icarus 2020, 351, 113940. [Google Scholar] [CrossRef]
- Böhm, A.M.; Herrnring, H.; Polach, F.V.B. Data from uniaxial compressive testing of laboratory-made granular ice. Data Brief 2022, 42, 108236. [Google Scholar] [CrossRef]
- Zdorovennov, R.; Palshin, N.; Zdorovennova, G.; Efremova, T.; Terzhevik, A. Interannual variability of ice and snow cover of a small shallow lake. Eston. J. Earth Sci. 2013, 62, 26. [Google Scholar] [CrossRef]
- Ding, F.; Mao, Z. Analysis of ice cover growth and ablation in ponds in cold regions. J. Hydraul. Eng. 2021, 52, 349–358. (In Chinese) [Google Scholar]
- Itoh, M.; Inoue, J.; Shimada, K.; Zimmermann, S.; Kikuchi, T.; Hutchings, J.; Carmack, E. Acceleration of sea-ice melting due to transmission of solar radiation through ponded ice area in the Arctic Ocean: Results of in situ observations from icebreakers in 2006 and 2007. Ann. Glaciol. 2011, 52, 249–260. [Google Scholar] [CrossRef][Green Version]
- Wang, Q.; Fang, H.; Li, Z.; Zu, Y.; Li, G. Field investigations on lateral and bottom melting of lake ice and thermodynamic analysis. J. Hydraul. Eng. 2018, 49, 1207–1215. (In Chinese) [Google Scholar]
- Lian, J.; Zhao, X. Radiation degree-day method for predicting the development of ice cover thickness under the hydrostatic and non-hydrostatic conditions. J. Hydraul. Eng. 2011, 42, 1261–1267. (In Chinese) [Google Scholar]
- Yang, K.; Guo, X.; Wang, T.; Deng, X.; Fu, H.; Guo, Y. Thermal thickening and ablation of ice cover under snow cover. J. Hydraul. Eng. 2023, 54, 279–290. (In Chinese) [Google Scholar]
- Leppäranta, M. Modelling the formation and decay of lake ice. In The Impact of Climate Change on European Lakes; George, G., Ed.; Springer: Dordrecht, The Netherlands, 2009; pp. 63–83. [Google Scholar]
- Leppäranta, M.; Terzhevik, A.; Shirasawa, K. Solar radiation and ice melting in Lake Vendyurskoe, Russian Karelia. Hydrol. Res. 2010, 41, 50–62. [Google Scholar] [CrossRef]
- Xie, F.; Lu, P.; Leppäranta, M.; Cheng, B.; Li, Z.; Zhang, Y.; Zhang, H.; Zhou, J. Heat budget of lake ice during a complete seasonal cycle in lake Hanzhang, northeast China. J. Hydrol. 2023, 620, 129461. [Google Scholar] [CrossRef]
- Wang, Q.; Liu, Y.; Lu, P.; Li, Z. The porosity effect on the mechanical properties of summer sea ice in the Arctic. Cryosphere Disc. 2023, 2023, 1–21. [Google Scholar]
- Aladejare, A.E.; Idowu, K.A.; Ozoji, T. Reliability of Monte Carlo simulation approach for estimating uniaxial compressive strength of intact rock. Earth Sci. Inform. 2024, 17, 2043–2053. [Google Scholar] [CrossRef]
- Liu, Q.; Chen, S.; Wang, S.; Chai, J.; Zhang, D. Experimental development process of a new cement and gypsum-cemented similar material considering the effect of moisture. Geofluids 2020, 2020, 8831801. [Google Scholar] [CrossRef]
- Janani, S.; Santhi, A.S. Multiple linear regression model to predict mechanical properties and impact resistance of hooked-end steel fibre-reinforced blended concrete. Rev. Rom. Mater. 2019, 49, 207–216. [Google Scholar]
- Yue, S.; Yan, Y.; Zhang, S.; Yang, J.; Wang, W. Spatio-temporal characteristics of near-surface soil freeze-thaw status in Northeast China based on ERA5-LAND. Acta Geogr. Sin. 2021, 76, 2765–2779. (In Chinese) [Google Scholar]
- Pelosi, A.; Chirico, G.B. Regional assessment of daily reference evapotranspiration: Can ground observations be replaced by blending ERA5-Land meteorological reanalysis and CM-SAF satellite-based radiation data? Agric. Water Manag. 2021, 258, 107169. [Google Scholar] [CrossRef]
- Hao, Y. Study on Thermal Parameter Detection and Ice Thickness Model Optimization in the Mohe River Section of Heilongjiang. Master’s Thesis, Taiyuan University of Technology, Taiyuan, China, 2018. (In Chinese). [Google Scholar]
- Wang, E.; Yu, J.; Han, H.; Xu, C.; Hu, S. Design of solar simulator for indoor simulated solar irradiation experiments. J. Northeast Agric. Univ. 2020, 51, 90–98. (In Chinese) [Google Scholar]
- Tian, Y.; Wang, E.L.; Xie, C.B.; Ren, Z.F.; Yu, J. Experimental study on prediction model of frost depth for dams in cold regions under the influence of radiation. J. Hydraul. Eng. 2023, 54, 1111–1121. (In Chinese) [Google Scholar]
- Wang, E.L.; Xie, F.; Han, H.W.; Fu, X.; Xue, Z.H. Experimental study and determination of key parameters for indoor simulation of static ice growth and ablation. J. Northeast Agric. Univ. 2019, 50, 77–85. (In Chinese) [Google Scholar]
- Schwarz, J.; Frederking, R.; Gavrillo, V.; Petrov, I.G.; Hirayama, K.I.; Mellor, M.; Tryde, P.; Vaudrey, K.D. Standardized testing methods for measuring mechanical properties of ice. Cold Reg. Sci. Technol. 1981, 4, 245–253. [Google Scholar] [CrossRef]
- Liu, J.; Wang, P.; Liu, G.; Zhang, M.; Xiao, J.; Liu, H. Uniaxial compression characteristics of railway ballast combined with ice. Constr. Build. Mater. 2020, 263, 120554. [Google Scholar] [CrossRef]
- Niu, R.; Wen, L.; Wang, C.; Tang, H.; Leppäranta, M. Air–Ice–Water Temperature and Radiation Transfer via Different Surface Coverings in Ice-Covered Qinghai Lake of the Tibetan Plateau. Water 2025, 17, 142. [Google Scholar] [CrossRef]
- Huo, J.; Shi, X.; Zhao, S.; Sun, B.; Li, G.; Yu, H.; Wang, S. Dynamics of water temperature and interfacial heat flux in lake ice and under-ice layers. Hydrol. Res. 2023, 54, 855–868. [Google Scholar] [CrossRef]
- Roustaei, M.; Pumple, J.; Hendry, M.T.; Harvey, J.; Froese, D. Effect of freeze–thaw cycles on the macrostructure and failure mechanisms of fiber-reinforced clay using industrial computed tomography. Can. Geotech. J. 2024, 61, 2007–2021. [Google Scholar] [CrossRef]
- Yu, J. Experimental Study on the Physical and Mechanical Properties of Artificially Frozen Ice Considering the Influence of Irradiation. Master’s Thesis, Northeast Agricultural University, Harbin, China, 2021. (In Chinese). [Google Scholar]
- Wan, Y. Experimental Study on Mechanical Properties and Numerical Simulation of Melting River Ice in the Songhua River. Master’s Thesis, Northeast Forestry University, Harbin, China, 2025. (In Chinese). [Google Scholar]
- Wang, Q.; Liu, Y.; Lu, P.; Li, Z. The mechanical properties of gas-enriched sea ice. Cold Reg. Sci. Technol. 2025, 239, 104576. [Google Scholar] [CrossRef]
- Liu, Y.; Wang, Q.; Lu, P.; Li, Z.; Li, Z.; Zong, Z.; Zhang, L. Mechanical Properties of Granular Sea Ice Under Uniaxial Compression: A Comparison of Piled and Level Ice. J. Mar. Sci. Eng. 2025, 13, 1302. [Google Scholar] [CrossRef]
- Zhang, Y. Study on the Internal Fabric Characteristics and Compressive Mechanical Properties of Ice Flower Ice. Ph.D. Thesis, Dalian University of Technology, Dalian, China, 2024. (In Chinese). [Google Scholar]
- Schohn, C.M.; Iverson, N.R.; Zoet, L.K.; Fowler, J.R.; Morgan-Witts, N. Linear-viscous flow of temperate ice. Science 2025, 387, 182–185. [Google Scholar] [CrossRef]
- Zhang, Y.; Qian, Z.; Huang, W.; Chen, X.; Zhang, Z.; Ren, J. Effect of grain size on the uniaxial compressive strength of ice forming with different wind speeds in a cold laboratory. Water 2024, 16, 2049. [Google Scholar] [CrossRef]
- Zhang, L. Experimental Study on Uniaxial Compressive Strength of Ice and Its Influencing Factors. Ph.D. Thesis, Dalian University of Technology, Dalian, China, 2012. (In Chinese). [Google Scholar]
- Xu, Z. Experimental Study on Uniaxial Compressive Strength of Wuliangsuhai Lake Ice. Master’s Thesis, Dalian University of Technology, Dalian, China, 2018. (In Chinese). [Google Scholar]


Disclaimer/Publisher’s Note: The statements, opinions and data contained in all publications are solely those of the individual author(s) and contributor(s) and not of MDPI and/or the editor(s). MDPI and/or the editor(s) disclaim responsibility for any injury to people or property resulting from any ideas, methods, instructions or products referred to in the content. |
© 2025 by the authors. Licensee MDPI, Basel, Switzerland. This article is an open access article distributed under the terms and conditions of the Creative Commons Attribution (CC BY) license (https://creativecommons.org/licenses/by/4.0/).