Article

Gross Ecosystem Product (GEP) Accounting and Sustainable Management Pathways for Wild Duck Lake National Wetland Park, Beijing, China

1
School of Land Science and Technology, China University of Geosciences, 29, Xueyuan Road, Haidian District, Beijing 100083, China
2
Chinese Academy of Natural Resources Economics, No. 689, Jingyu Street, Yanjiao Technology Development Zone, Sanhe 101149, China
3
Key Laboratory of Land Consolidation and Rehabilitation, Ministry of Natural Resources, Beijing 100083, China
*
Author to whom correspondence should be addressed.
Water 2025, 17(22), 3321; https://doi.org/10.3390/w17223321
Submission received: 14 October 2025 / Revised: 16 November 2025 / Accepted: 17 November 2025 / Published: 20 November 2025
(This article belongs to the Section Biodiversity and Functionality of Aquatic Ecosystems)

Abstract

The Gross Ecosystem Product (GEP) represents the total value of goods and services supplied by ecosystems, serving as a key indicator that connects ecological well-being with economic development and supports the achievement of sustainable development goals. This study selected Beijing’s Wild Duck Lake National Wetland Park as its research subject, establishing a GEP assessment system for two major services: regulating services and cultural services. By integrating market-based valuation approaches with social media data to support the assessment of cultural services, this study calculated the 2023 GEP of the wetland park. Finally, based on the social media data and the GEP accounting results, value enhancement strategies for Wild Duck Lake National Wetland Park were proposed. Key findings include: (1) The total GEP of Wild Duck Lake National Wetland Park reached 155.01 million CNY in 2023, with a per-unit-area value of 35.47 million CNY/km2. (2) Among regulating services, climate regulation and water purification were the primary contributors, accounting for 66.10% and 11.76% of the total value, respectively. Cultural service value primarily derived from tourism and health preservation services. (3) Social media analysis showed that visitors valued the park’s natural landscapes while noting service and facility shortcomings, indicating a balanced assessment combining both positive and negative perceptions. (4) Based on GEP assessment and social perception analysis, this study provides pathways for realizing the ecosystem service value of Wild Duck Lake National Wetland Park from three aspects. The main contribution of this study lies in developing an integrated framework for GEP accounting and enhancement in national wetland parks, providing a scientific foundation for their sustainable development.

1. Introduction

Since the Industrial Revolution, industrial civilization has greatly intensified the exploitation of natural resources, placing excessive pressure on ecosystems and their services [1,2,3]. This ecological crisis not only threatens the supply of critical ecosystem services but has also become a major challenge to global sustainable development [4]. As one of the world’s three major ecosystems, wetlands play an irreplaceable role in resource supply, climate regulation, and ecological balance maintenance [5]. However, driven by land conversion, overexploitation of water resources, pollution, and climate change, the ecological carrying capacity of wetlands has been continuously declining [6].
Over the past three decades, the international community has increasingly attached importance to incorporating ecological values into decision-making systems. This has been fully reflected in global initiatives such as the Millennium Ecosystem Assessment (MEA) [7], The Economics of Ecosystems and Biodiversity (TEEB) [8], Natural Capital Accounting [9,10], Ecosystem Service Value (ESV) [11], the System of Environmental-Economic Accounting: Ecosystem Accounting (SEEA EA) [12], and the Intergovernmental Science-Policy Platform on Biodiversity and Ecosystem Services (IPBES) [13]. It is highly consistent with the sustainable development widely advocated by the international community [14,15,16,17,18,19], highlighting the key role of ecosystem service assessment in addressing issues such as biodiversity loss, climate change, and sustainable social and economic development.
Against this background, the concept of Gross Ecosystem Product (GEP) has emerged as a policy-oriented extension of ecosystem service valuation [20,21,22,23,24]. While GDP represents the economic output of human activities, it does not reflect ecological degradation or improvements in well-being derived from ecosystem services [2,25,26]. Therefore, GEP offers a complementary perspective that integrates ecological contributions into economic evaluation. Compared with traditional ESV approaches, GEP places greater emphasis on final benefits and the potential integration of ecological value into national accounting systems, providing a more practical tool for policy formulation and ecosystem management [27]. In recent years, GEP accounting has been widely applied in China and has gradually evolved into an important instrument for measuring human well-being and the progress of ecological civilization [28]. Provincial-scale and regional-scale studies [29,30] have demonstrated its significance in guiding sustainable land use, developing ecological compensation mechanisms, and supporting high-quality regional development. However, the application of GEP in wetland ecosystems remains limited.
Although considerable progress has been made in wetland ecosystem value assessment research [11,31,32], key issues such as method standardization, data acquisition (especially cultural service data) [33], and value transfer reliability [34] remain to be resolved. Existing GEP accounting methods (such as the integrated model method [35], biophysical methods [36], the equivalent factor method [34], and the functional value assessment method [37]) each have their own characteristics and limitations [22], and a unified standard system has not yet been formed. Cultural Ecosystem Services (CES), a critical component of wetland ecosystem functions, are commonly evaluated using approaches such as the Travel Cost Method (TCM) and the Contingent Valuation Method (CVM) [26]. These methods often rely on field surveys or questionnaires [38], which are time-consuming, costly, and limited in spatial and temporal representativeness. Recent advances in digital technologies and social media analytics have opened new opportunities for cultural ecosystem service assessment. User-generated online content can reflect public perceptions and recreational behaviors in real time and at large scales. Existing studies have begun to explore the use of text mining techniques—such as sentiment analysis and topic modeling—to qualitatively reveal visitors’ perceptions and attitudes toward natural attractions, providing insights into value enhancement pathways. However, most of these efforts remain at the qualitative level [33]. A significant research gap persists in how to transform unstructured social media data into quantifiable economic indicators that enable the monetary valuation of cultural services.
To address the lack of standardization in wetland GEP accounting frameworks and the limitations in cultural service accounting, this study takes Beijing Wild Duck Lake National Wetland Park as a case study. Guided by the theories of sustainable development, ecological balance [39], and green development, and drawing on the eight principles of ecological product value assessment [40], the study integrates 2023 wetland resource data with social media data to construct a comprehensive GEP accounting system suitable for inland wetlands, with a particular focus on developing a quantitative approach for cultural service valuation based on public perception data. The specific objectives of this study are to: (1) systematically account for the ecological and cultural ecosystem services of Wild Duck Lake National Wetland Park; (2) provide a case-based reference for inland wetlands in the Beijing–Tianjin–Hebei region; (3) verify the applicability and innovative value of social media data in monetary accounting of wetland cultural services; (4) propose targeted strategies for ecological protection and sustainable management based on the accounting results. Through these efforts, this study aims to contribute to the standardization of GEP accounting, expand methodological approaches for cultural service valuation, and provide theoretical and practical references for promoting wetland ecological product value realization.

2. Materials and Methods

2.1. Overview of the Study Area

Wild Duck Lake National Wetland Park (40°23′58″–40°25′25″ N, 115°49′41″–115°51′23″ E) is located in the southwestern Yanqing District, Beijing (Figure 1), at the foot of the Badaling Great Wall and on the shores of the Guanting Reservoir. It boasts the largest and most biodiverse near-natural wetland ecosystem in North China. Officially opened to the public in 2013, the park covers approximately 418.9 ha and has a warm temperate semi-arid, semi-humid continental monsoon climate with distinct four seasons: dry, cold, and windy winters and rainy, hot, and humid summers. The average annual temperature is 8.7 °C, the frost-free period averages 182.2 days, and the average annual sunshine hours are 2727.3 h. The average annual precipitation is 441.8 mm, with an average of 68 rainy days. The park has 392 recorded species of higher plants, and bird species increased to 361 in 2022, representing 24.3% of the national bird species count. It serves as a crucial stopover for migratory birds along the East Asian-Australasian Flyway [41]. Wild Duck Lake National Wetland Park welcomes over 200,000 visitors annually, balancing its value as a research and educational institution with ecotourism. Furthermore, in 2023, on the 27th World Wetlands Day, Wild Duck Lake Wetland was successfully listed on the List of Wetlands of International Importance, becoming the first and only wetland in Beijing to receive this distinction, confirming its importance as a wetland of international importance.

2.2. Research Methodology

2.2.1. Research Framework

Based on data collection and preprocessing, this study explored five key research components: defining ecosystem types, compiling a GEP inventory, conducting biophysical and economic value accounting, and exploring value enhancement strategies (Figure 2). The first component involves a site survey of land use in the study area to identify wetland ecosystem types, structure, and ecological processes. The second focuses on developing an assessment index system for GEP accounting, selecting representative accounting indicators to ensure they capture the key ecological and socio-economic benefits generated by the park’s ecosystem. The third and fourth sections focus on biophysical and economic value accounting, integrating the latest advancements in global wetland ecosystem service valuation and referring to both national and local standards. The biophysical accounting is conducted using methods such as the water balance approach, while the economic value accounting is carried out using methods such as the market value method. The fifth component compares and validates the valuation results with representative wetland valuation cases. This analysis, combined with high-frequency words and semantic network diagrams from social media data, provides recommendations and guidance for enhancing the value of Wild Duck Lake National Wetland Park.

2.2.2. Accounting Index System

Based on the actual conditions of Wild Duck Lake National Wetland Park, the provisioning services dimension was excluded from valuation, as the park’s flora and fauna lack marketable profit value, the area has a large proportion of water bodies with no agricultural cultivation, and no centralized drinking water source is located within 2 km of the park boundary. Consequently, its provisioning services do not hold significance for GEP accounting. Accordingly, two accounting categories and eight accounting indicators are selected to construct the wetland ecosystem service value assessment index system of Wild Duck Lake National Wetland Park (Table 1). The specific calculation formula refers to the technical specification for gross ecosystem product accounting [42].

2.2.3. Calculation Method and Data Description

The calculation method shown in Table 1 is described in detail. The data required for this study are multi-source data consisting of spatial data (vector and raster data), statistical data (government statistical yearbooks, statistical bulletins, corporate transaction data, etc.), social media network data, and text data (planning documents, research literature, etc.). These data are the basis for conducting GEP accounting and formulating value enhancement strategies.
(1) Water Conservation
Biophysical Quantity:
Q w r = A × ( P R E T ) × 10 3
where
Q w r = Wetland ecosystem water conservation volume (m3/a);
A = Wetland ecosystem area (km2);
P = Precipitation (mm/a);
R = Surface runoff (mm/a);
E T = Total evapotranspiration (mm/a).
Economic Value:
V w r = Q w r × ( C w e + P w e × D r )
where
V w r = Wetland ecosystem water conservation value (CNY/a);
Q w r = Wetland ecosystem water conservation volume (m3/a);
C w e = Engineering cost per unit of reservoir volume (CNY/m3);
P w e = Annual operating cost per unit of reservoir volume (CNY/(m3·a));
D r = Annual depreciation rate of the reservoir;
Table 2 shows the specific parameter values and data sources.
(2) Flood Regulation
Biophysical Quantity:
C f m = C l f m
where
C f m = Wetland ecosystem flood regulation volume (m3/a);
C l f m = Lake flood regulation volume (m3/a).
C l f m = e 4.924 × A 1.128 × 3.19 × 10 4
where
C l f m = Lake flood regulation volume (m3/a);
A = Lake area (km2).
Economic Value:
V f m = C f m × ( C w e + P w e × D r )
where
V f m = Wetland ecosystem flood regulation value (CNY/a);
C f m = Wetland ecosystem flood regulation volume (m3/a);
P w e = Engineering cost per unit of reservoir volume (CNY/m3);
C w e = Annual operating cost per unit of reservoir volume (CNY/(m3·a));
D r = Annual depreciation rate of the reservoir.
Table 3 shows the specific parameter values and data sources.
(3) Carbon Sequestration
Biophysical Quantity:
Q t C O 2 = M C O 2 / M C × N E P
where
Q t C O 2 = Wetland ecosystem carbon sequestration volume (t·CO2/a);
N E P = Net primary productivity of the ecosystem (t·C/a);
M C O 2 / M C = Conversion factor from carbon (C) to carbon dioxide (CO2).
The calculation is based on the difference between the net primary productivity of plants and the carbon consumed by soil heterotrophic respiration. The calculation formula is:
N E P = N P P R S
where
N E P = Net primary productivity of the ecosystem (t·C/a);
N P P = Net primary productivity (t·C/a);
R S = Carbon consumed by soil heterotrophic respiration (t·C/a).
R S = 0.22 × [ e 0.0913 × T + ln ( 0.3145 × P + 1 ) ] × 30 × 46.5 %
where
R S = Monthly total soil anaerobic respiration consumption (g·m−2);
T = Monthly mean temperature (°C);
P = Monthly mean precipitation (mm).
Economic Value:
V C f = Q t C O 2 × C C O 2
where
V C f = Wetland ecosystem carbon sequestration value (CNY/a);
Q t C O 2 = Wetland ecosystem carbon sequestration volume (t·CO2/a);
C C O 2 = China’s carbon market price (CNY/t·CO2).
Table 4 shows the specific parameter values and data sources.
(4) Water purification
V = 1 + r × P × A × C P I
where
V = Wetland ecosystem water quality purification value (CNY);
A = Wetland ecosystem area (m2);
P = Water quality purification unit area equivalent (CNY/m2);
r = 2023 annual interest rate;
C P I = Consumer price index for the evaluation year compared to the reference year.
Table 5 shows the specific parameter values and data sources.
(5) Climate Regulation
Biophysical Quantity:
E w e = E w t × ρ w × q × 10 3 / ( 3600 × r ) + E w h × y
where
E w e = Energy consumed by evapotranspiration in the wetland ecosystem (kW·h/a);
E w t = Evapotranspiration volume during air conditioning cooling (m3/a);
E w h = Evapotranspiration volume during humidifier operation (m3/a);
ρ w = Density of water (g/cm3);
q = Latent heat of vaporization, the heat required to evaporate 1 g of water (J/g);
r = Coefficient of performance for air conditioning (dimensionless);
y = Power consumption of the humidifier per 1 m3 of water converted into steam (kW·h/m3).
Economic Value:
V t t = E w e × P e
where
V t t = Wetland ecosystem climate regulation value (CNY/a);
E w e = Total energy consumed for temperature and humidity regulation (kW·h/a);
P e = Local residential electricity price (CNY/kW·h).
Table 6 shows the specific parameter values and data sources.
(6) Soil Conservation
Biophysical Quantity:
Q s r = R × K × L × S × ( 1 C × P ) × A × 10 2
where
Q s r = Wetland ecosystem soil conservation volume (t/a);
A = Area of accounting unit (km2);
R = Rainfall erosion factor for accounting unit (MJ·mm/(hm2·h·a));
K = Soil erodibility factor for accounting unit (t·hm2·h/(hm2·MJ·mm));
L = Slope length factor for accounting unit (dimensionless);
S = Slope factor for accounting unit (dimensionless);
C = Vegetation cover factor for accounting unit (dimensionless);
P = Soil conservation factor (dimensionless).
Economic Value:
Reduced Sedimentation Value:
V s d = λ × Q s r / ρ × c
where
V s d = Ecosystem reduced sedimentation value (CNY/a);
Q s r = Soil conservation volume (t/a);
c = Engineering cost per unit of sedimentation removal (CNY/m3);
λ = Sedimentation coefficient (dimensionless).
Reduced Non-Point Source Pollution Value:
V d p d = i = 1 2 Q s r × c i × p
where
V d p d = Reduced non-point source pollution value (CNY/a);
Q s r = Soil conservation volume (t/a);
i = The types and quantities of nitrogen, phosphorus and other substances in the soil, i = 1,2;
c i = The pure content of nitrogen, phosphorus and other substances in soil is expressed as percentage (%);
p = Treatment cost per unit of non-point source pollutant (CNY/t).
Table 7 shows the specific parameter values and data sources.
(7) Ecotourism And Health Preservation
Biophysical quantity:
Total annual number of visitors to Wild Duck Lake National Wetland Park (persons/year).
Economic Value:
V t = N × T C × N C
where
V t = Ecotourism and health preservation value (CNY/a);
N = Total number of visitors (person-times/a);
T C = Average travel cost per visitor (CNY/person-time) (Including direct expenses such as transportation tickets and opportunity costs of travel time);
N C = Tendency of visitors’ average travel cost towards natural landscapes (percentage).
T C is calculated using the following formula:
T C = ( T O × S + T I ) × W + C
where
T C = Average travel cost per visitor (CNY/person-time);
T O = Average travel time per visitor to reach the accounting location, in days per trip (d/trip);
T I = Average time per visitor spent visiting the accounting location, in days per trip (d/trip);
W = Average wage for per visitor, in CNY per person-day (CNY/person-day);
S = Average time-sharing rate of tourists’ trip in social media reviews (%), with a value range of [0, 100];
C = Average direct travel cost incurred by tourists, including travel transportation costs from the tourist group to the accounting area, food and accommodation costs within the scenic area, entrance fees and transportation costs, and related expenses such as shopping and entertainment driven by tourism. All units are CNY per person (CNY/person-time).
Table 8 shows the specific parameter values and data sources.
(8) Landscape Value Enhancement
Biophysical quantity:
Number of hotel rooms (nights) that benefit from the ecological landscape (nights/year).
Economic Value:
V H P = H l × P H × R H
where
V H P = Hotel landscape value enhancement (CNY/a);
P H = Number of hotel rooms benefiting from landscape appreciation (nights/a);
R H = Average hotel room price (CNY/night);
H l = Landscape premium coefficient for rooms (percentage).
Table 9 shows the specific parameter values and data sources.

2.2.4. Processing of Social Media Data

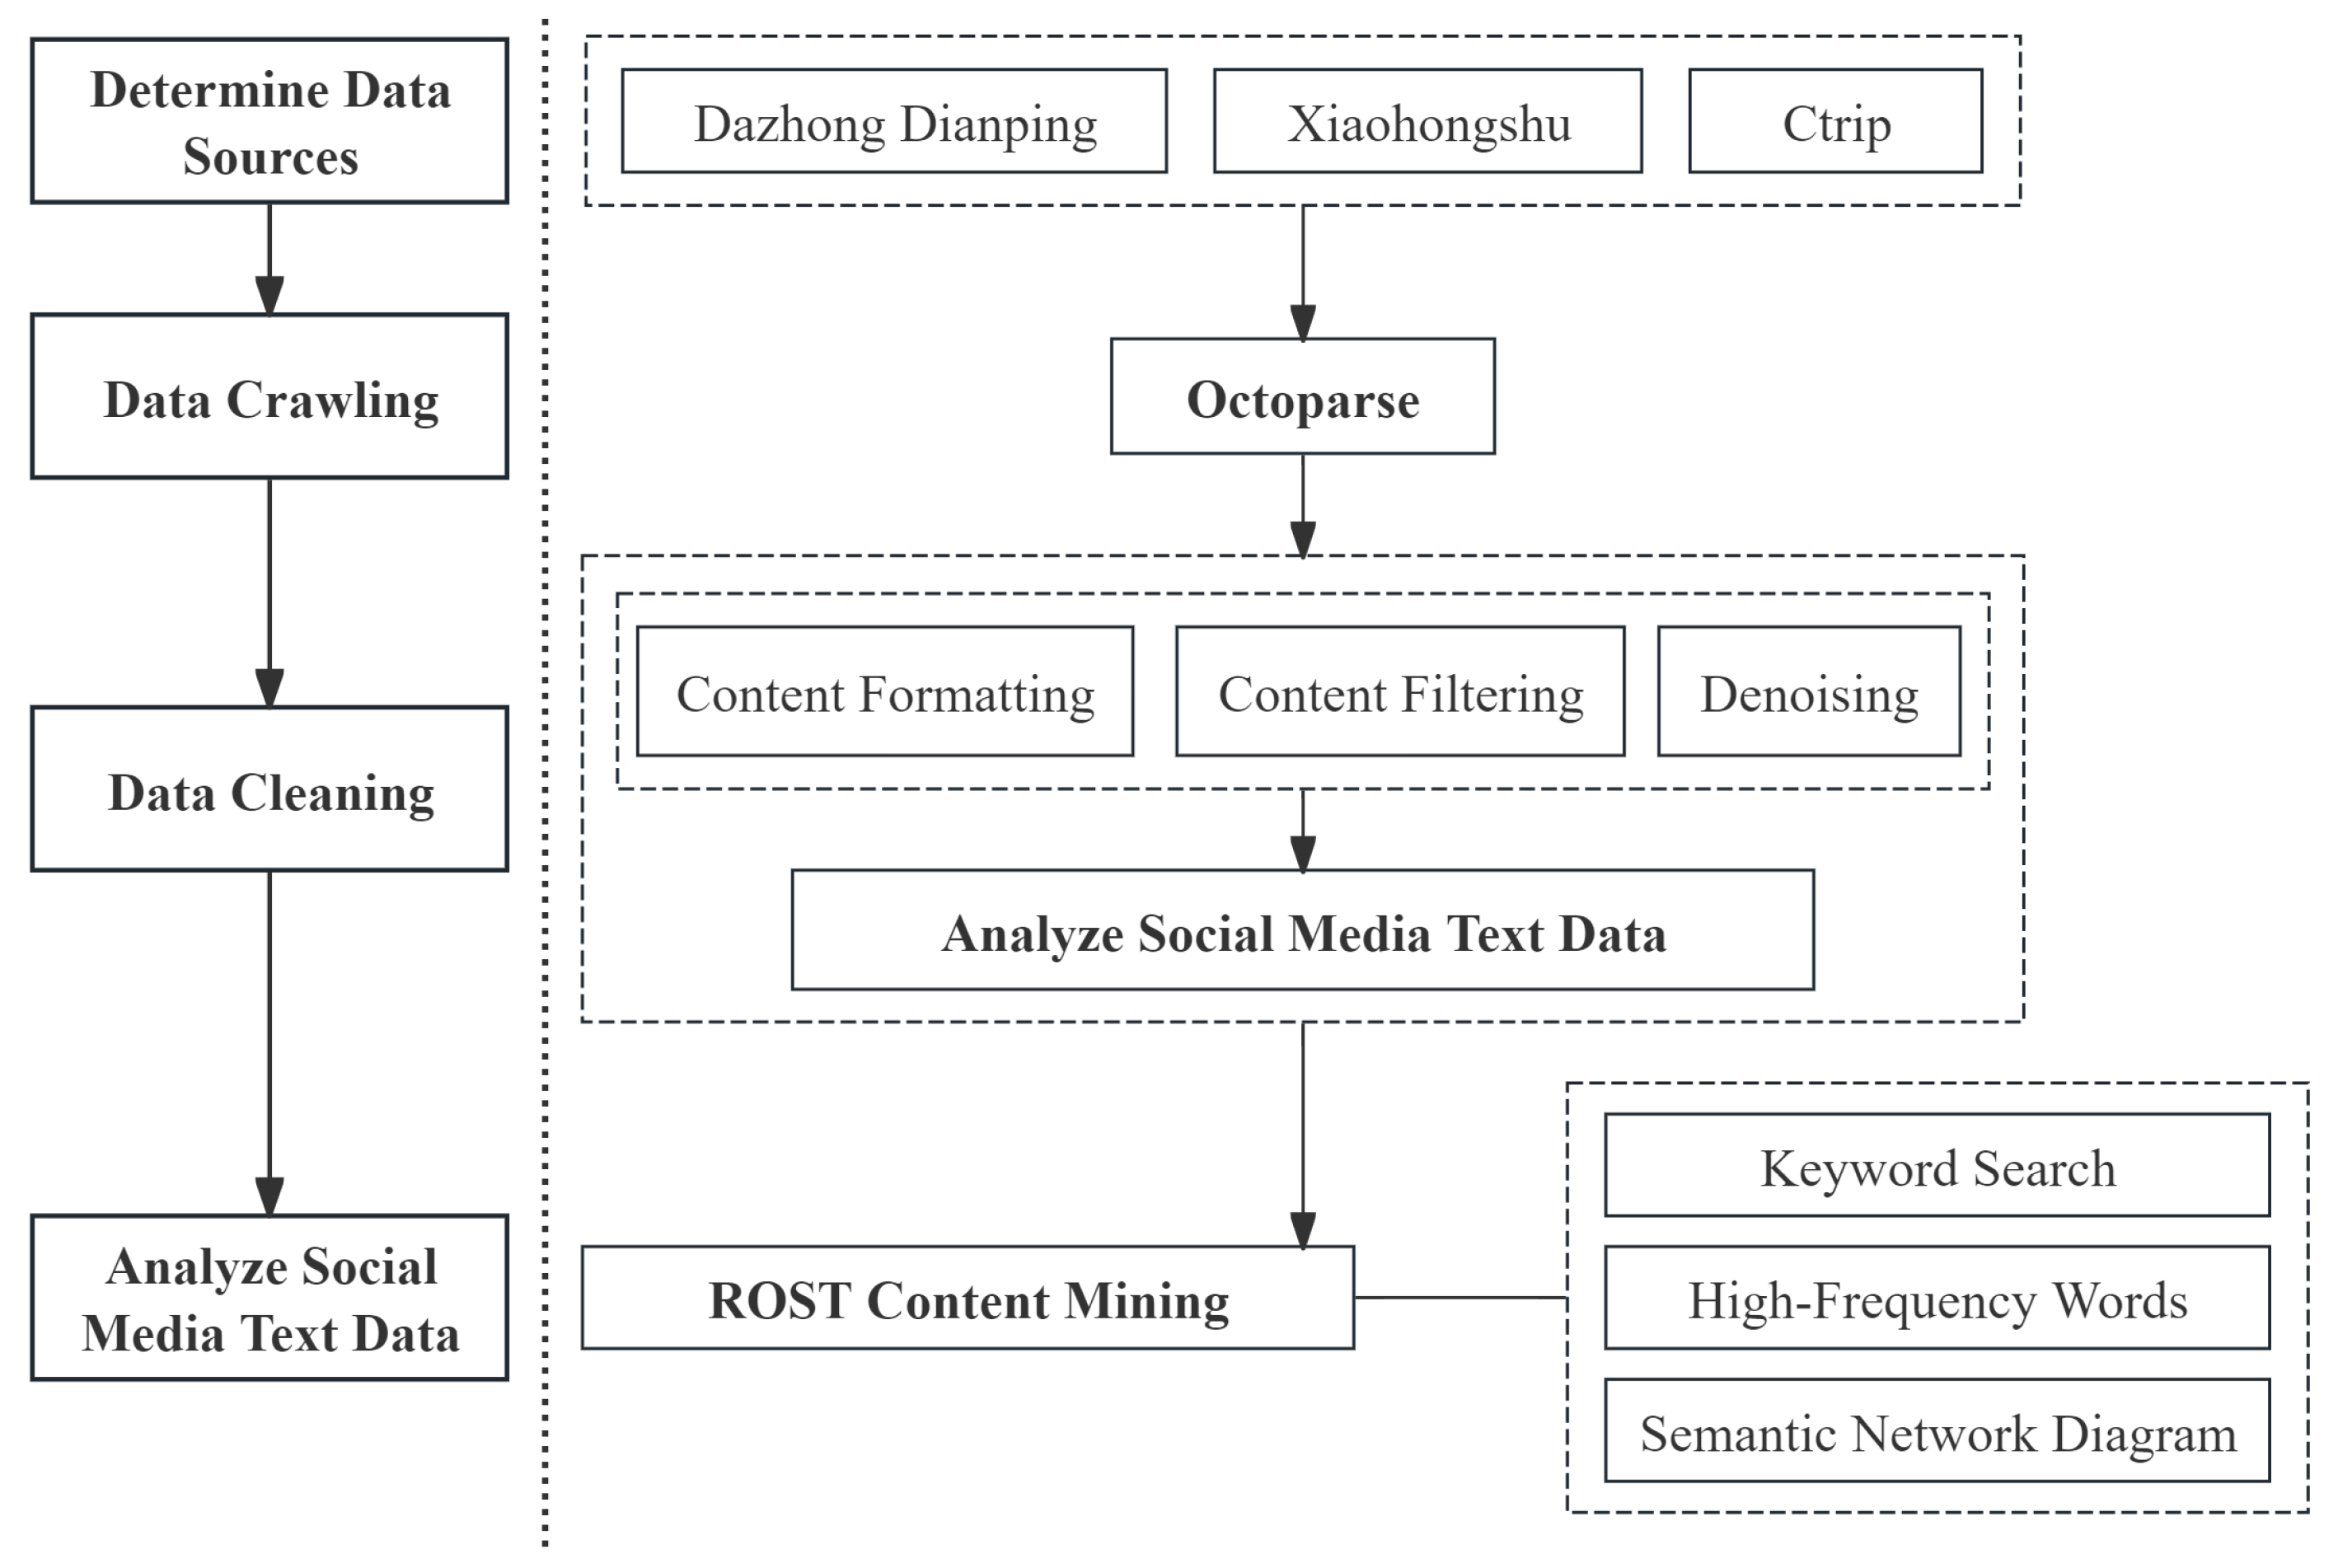
The 2025 China Social Media Platform Guide [48] points out that China has a large internet user base (1.14 billion) and a balanced age structure, which provides an ideal sampling environment for this study. Therefore, this study uses tourist reviews and travel notes from the three major platforms of Ctrip (https://www.ctrip.com/, accessed on 10 February 2025), Dianping (https://www.dianping.com/, accessed on 10 February 2025) and Xiaohongshu (https://www.xiaohongshu.com/, accessed on 11 February 2025) as data sources. 5385 pieces of data related to Wild Duck Lake National Wetland Park (including 1463 pieces of data from 2023) were crawled using Octopus software (Version 8.7.4). After cleaning and removing invalid information, 4927 pieces of valid data were retained (1447 pieces from 2023). Text analysis was conducted using the ROST Content Mining tool, combined with keyword retrieval and IP statistics. The weighted average method was used to calculate the parameters of the travel cost method (Table 10). This provided data support for quantifying the value of GEP (tourism and health preservation). At the same time, high-frequency word statistics and semantic network diagrams were used to explore tourist perception characteristics, supporting strategies for enhancing the value of ecotourism & health preservation. The technical roadmap is shown in Figure 3.

3. Results

3.1. Analysis of Land Use Status

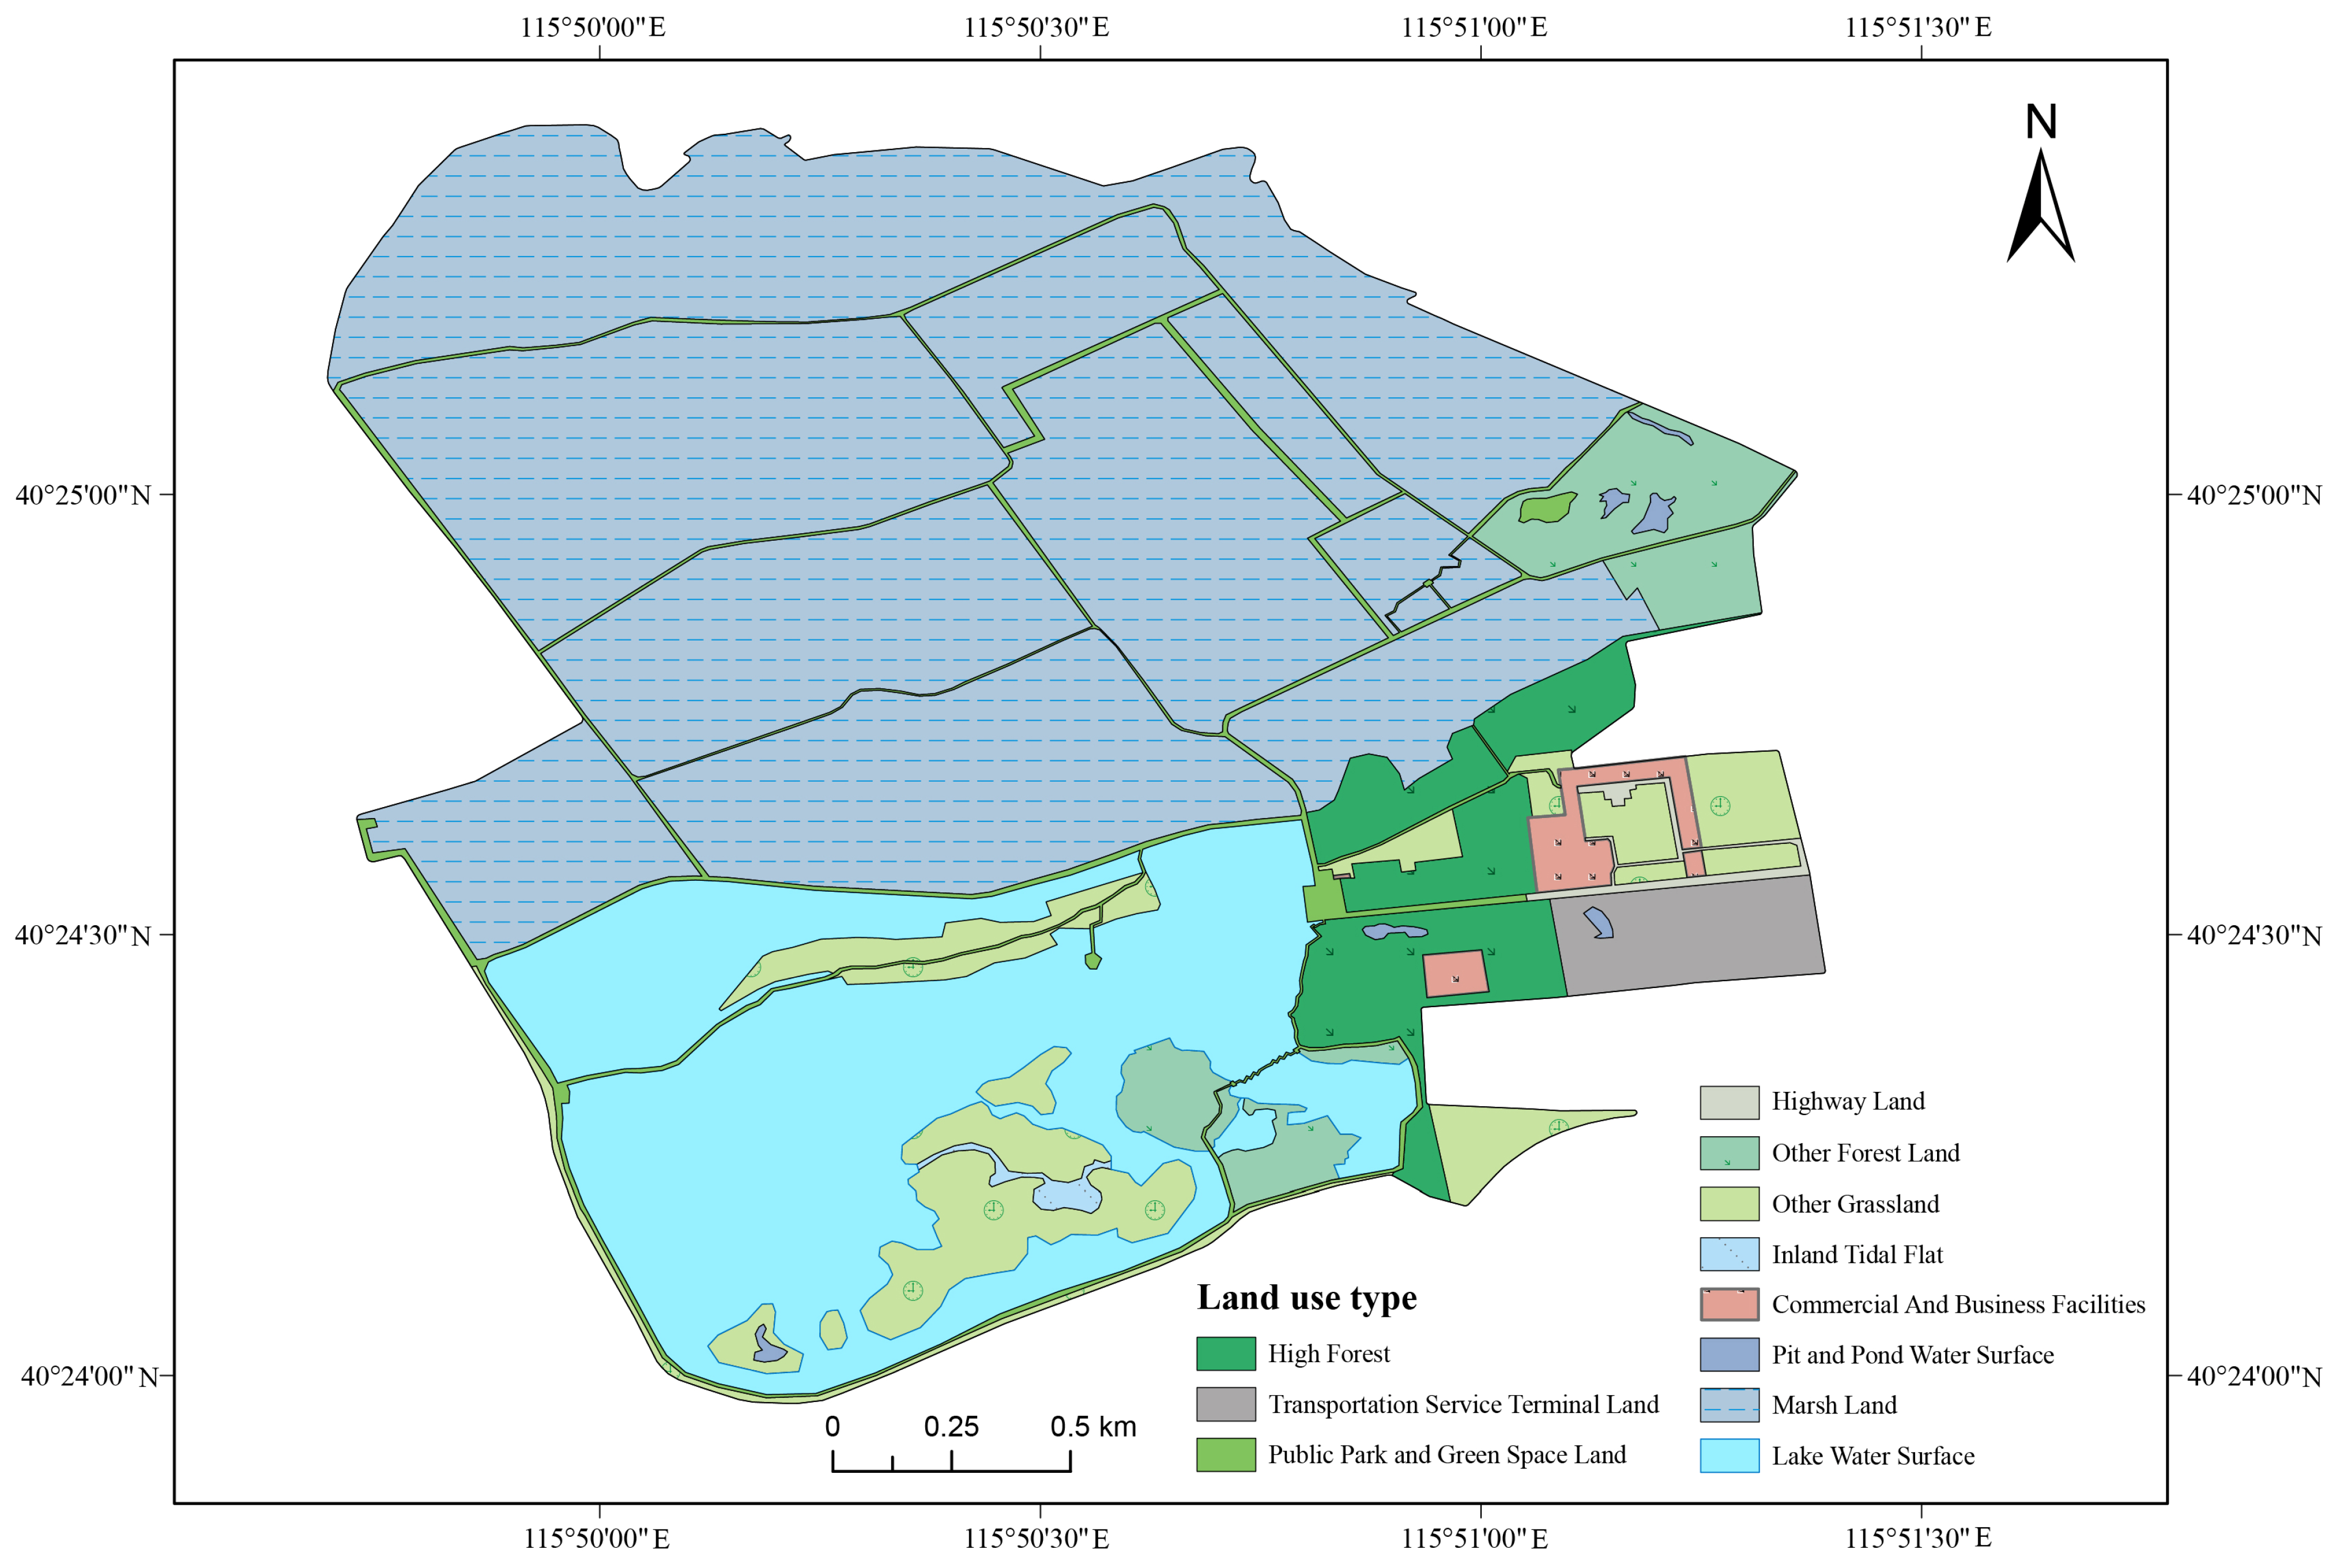
An analysis of the 2023 land use map of Wild Duck Lake National Wetland Park (Figure 4, Table 11) reveals that wetlands and lakes constitute the majority of the area. Specifically, marshes dominate, covering 247.5 ha; lakes, covering 87.1 ha, primarily serve as hydrological regulators and habitats. This structural characteristic indicates that the wetland’s regulating services are primarily supported and manifested by the marsh ecosystem. Compared to lakes, marshes feature more complex vegetation structures and a mosaic of aquatic and terrestrial environments, typically exhibiting higher primary productivity and enhanced pollutant interception and transformation capabilities [49]. Ponds, covering 1.1 ha, are primarily used for ornamental purposes, and inland mudflats, covering only 1.0 ha, are seasonally inundated. Within natural ecological land, other grasslands, covering 43.3 ha, serve as ecological buffer zones. Land used for human activities accounts for a relatively small proportion, primarily consisting of 9.99 ha of transportation land (including parking lots and roads), 6.04 ha of parkland, and 4.27 ha of commercial facilities at the entrance. Therefore, this study excludes human land use and uses the remaining land as the assessment scope for the wetland ecosystem, thereby accounting the GEP.

3.2. GEP Accounting Results

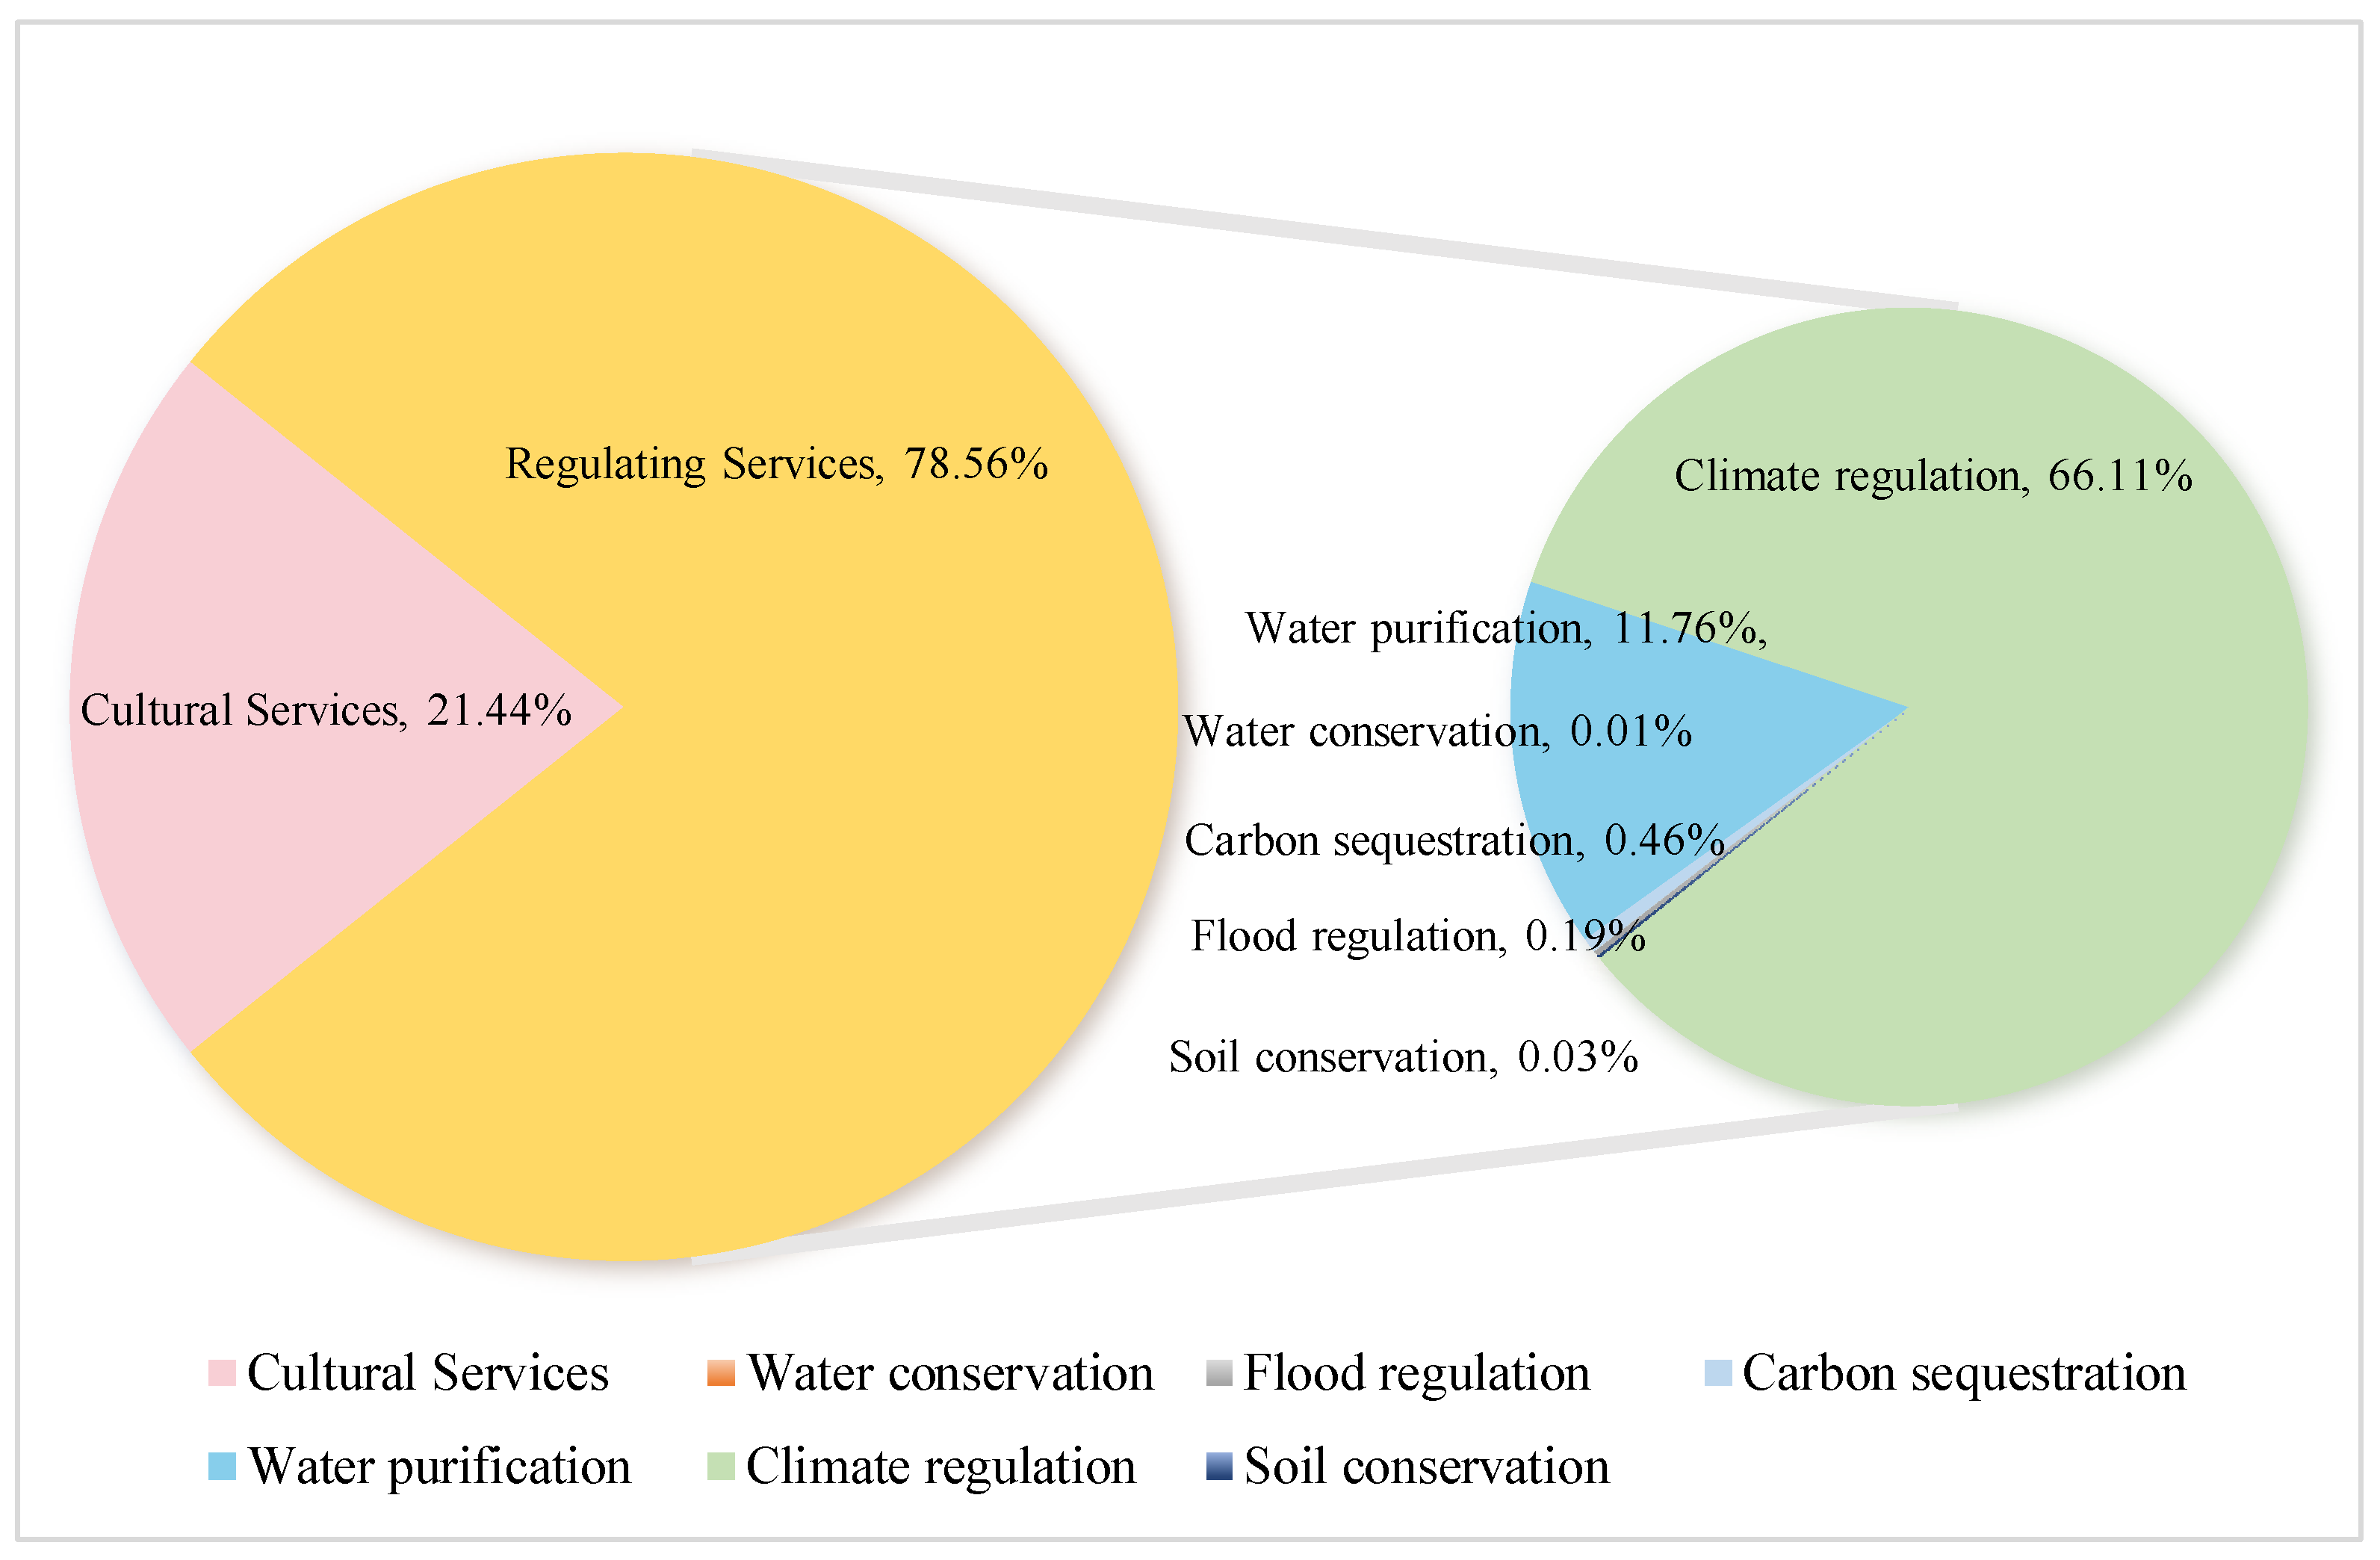
The total GEP in 2023 was estimated at 155.01 million CNY (USD 21.76 million), corresponding to 35.47 million CNY per square kilometer. Within this structure, regulating services contributed 78.56% of the total value, while cultural services accounted for 21.44% (Figure 5, Table 12).
The regulating services of the ecosystem products in Wild Duck Lake National Wetland Park generated an economic value of 121.77 million CNY (USD 17.11 million). For climate regulation, the wetland absorbed 193.97 million kW·h of heat through evaporation, with the highest single value calculated at 102.47 million CNY using the replacement cost method. For water purification, the value per unit area was estimated at 18.23 million CNY. For flood storage capacity, a lake storage model indicated a capacity of 3.53 million m3, valued at 297,600 CNY under the replacement cost method. For carbon sequestration, a value of 713,800 CNY was generated based on NPP data, soil microbial respiration models, and the 2023 average carbon market price in China. For soil conservation, the USLE model calculated a soil conservation capacity of 624.23 tons. Combined with the sedimentation coefficient and the non-point source pollution control costs calculated using the cost–benefit approach (total nitrogen: 4.8 × 10⁴ CNY/t, total phosphorus: 3.18 × 10⁵ CNY/t), the total value was 51,900 CNY. For water conservation, the water balance method, combined with the reservoir construction and operating costs derived from the flood storage and regulation section, resulted in a calculated value of 7700 CNY. Among the regulating services, climate regulation and water purification were the two most significant components, contributing 66.11% and 11.76% of the total value, respectively. The remaining regulating services—carbon sequestration, flood regulation, water conservation, and soil conservation—together represented less than 1% of the total value.
The cultural service functions of Wild Duck Lake National Wetland Park were mainly reflected in tourism and health preservation, and landscape value enhancement, with a total value of 33.23 million CNY. In terms of tourism and health preservation services, based on online statistical data and combined with per capita travel costs, the value of this service was assessed using the travel cost method to be 32.93 million CNY, meeting diverse needs such as sightseeing and nature education. Regarding the landscape value enhancement function, this study focused on the positive impact of ecological aesthetics on the surrounding accommodation industry. Based on our analysis of the 2023 hotel price data from Ctrip (https://www.ctrip.com/, accessed on 7 February 2025), we have calculated the number of hotel rooms and the price per night that are attributable to enhanced landscape value. Using the market value method, the value of the landscape value enhancement component was assessed to be 303,300 CNY. Combining the two cultural services, the total value is 33.23 million CNY. For cultural services, the value derived from ecotourism and health preservation was estimated at 32.93 million CNY, representing approximately 99.1% of all cultural service value. The landscape value enhancement contributed 0.303 million CNY, accounting for 0.9% of the cultural service total.

3.3. Social Media Semantic Analysis Results

To assess public perception of Wild Duck Lake National Wetland Park, 4927 valid social media posts were collected from Ctrip, Dianping, and Xiaohongshu platforms, of which 1447 were published in 2023. Text mining and semantic network analysis were performed using the ROST Content Mining 6.0 software. High-frequency keyword extraction revealed 60 representative words, which were classified into three categories: nouns (representing objects and activities), adjectives (reflecting evaluation and emotional tone), and verbs (indicating actions and behaviors).
Table 13 presents the top 60 keywords and their frequencies. Among them, words such as “Wild Duck” (2600), “Scenery” (1227), “Reeds” (1124), “Wetland” (902), and “Bicycle” (794) ranked highest, highlighting the dominant topics mentioned by visitors. Other frequently appearing words included “Tickets” (668), “Bird species” (558), “Parking lot” (473), and “Photo” (450).
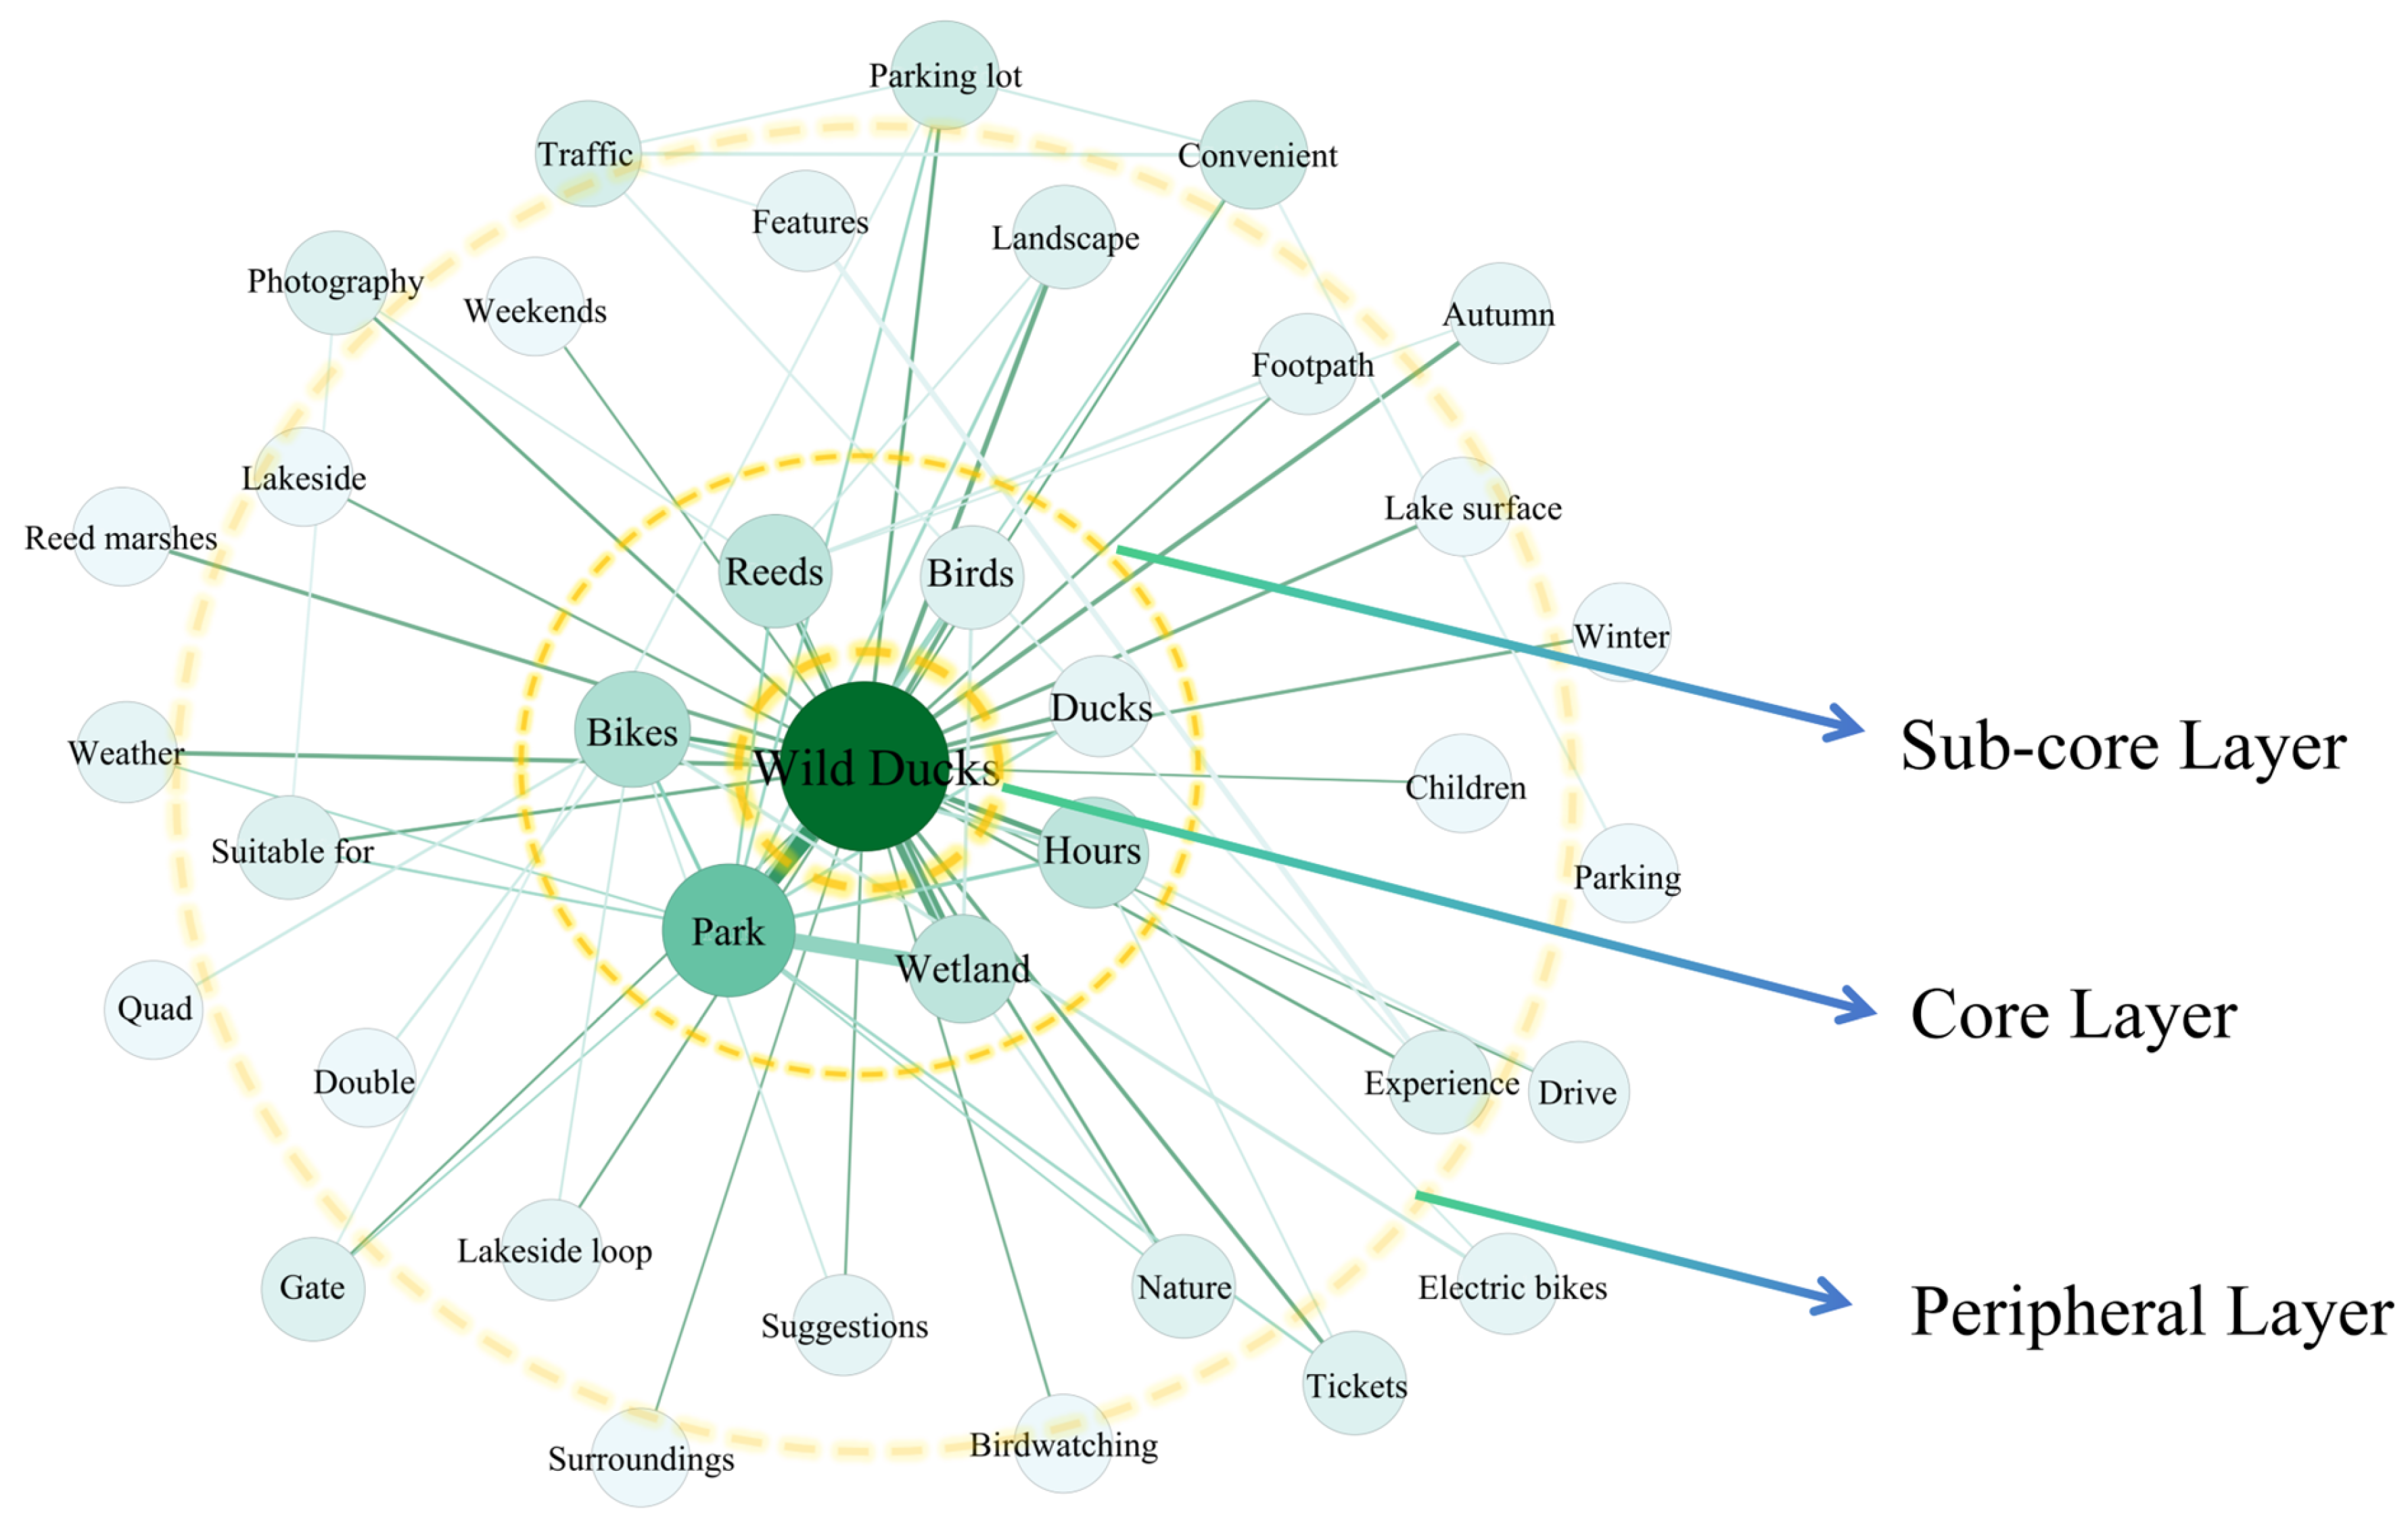
The semantic network diagram (Figure 6) constructed based on word co-occurrence relationships shows a multi-core structure. Core nodes include “Wild Duck,” “Wetland,” and “Park,” forming the central cluster of visitor discussions. Surrounding clusters feature words related to photography (“photo,” “scenery,” “beautiful”), recreation (“cycling,” “birdwatching,” “lakeside”), and family leisure (“weekend,” “children,” “friends”). Peripheral nodes, such as “parking,” “tickets,” and “convenient,” are associated with accessibility and service facilities.

4. Discussion

4.1. Comparison of GEP Unit Values with Previous Studies

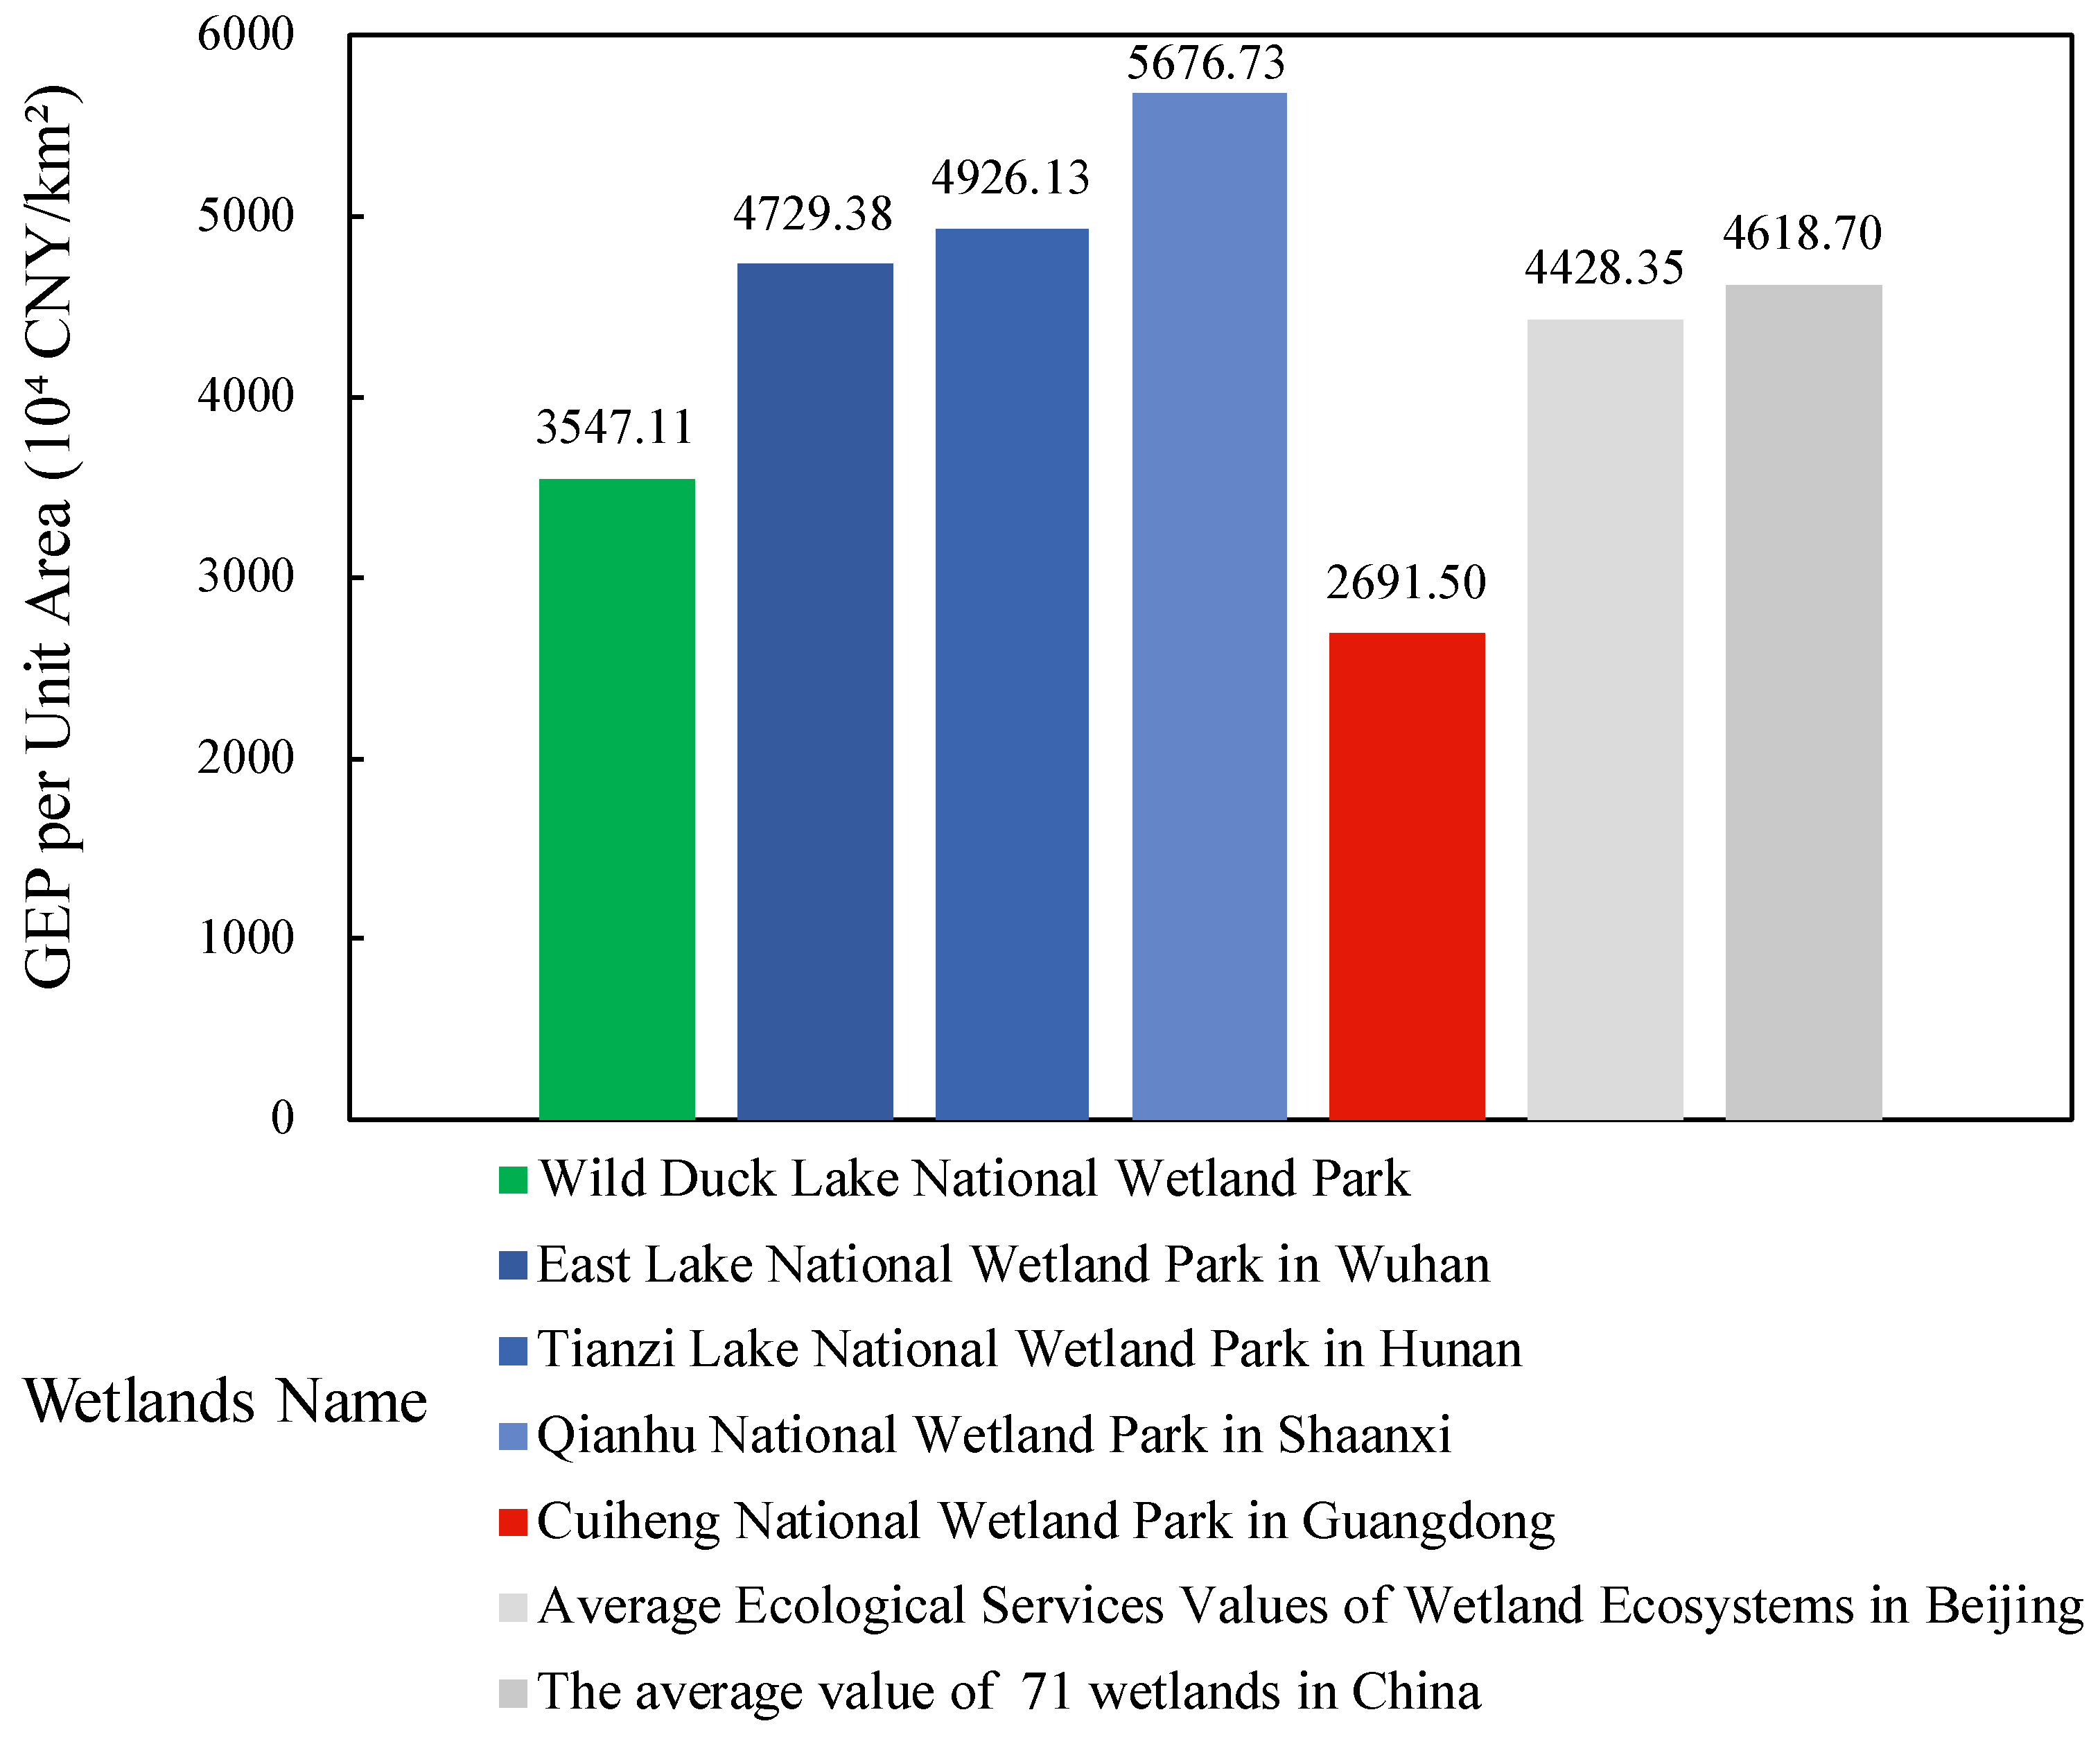
With the improvement of data resolution and multi-source data quality, the current calculation of GEP has gradually expanded from national, provincial and municipal scales to smaller units, covering some wetland parks, national parks, and protected areas [50,51,52]. To verify the rationality of the results, four representative small-scale wetland cases were selected for comparative analysis: Wuhan East Lake [53], Hunan Tianzi Lake [54], Shaanxi Qianhu [55] and Zhongshan Cuiheng [56]. These cases cover different wetland types and geographical regions, each showing unique ecological characteristics and functions. Since the focus of this study does not include provisioning services (such as food, raw materials, etc.), we have explicitly excluded the provisioning services value involved in the case study during the value assessment process. The valuation of ecosystem services in all cases was completed around 2023. In order to provide a more comprehensive comparison benchmark and background reference, this study also introduced the national average value per unit area of wetland ecosystems [57] and the average value per unit area of Beijing wetland ecosystems [58]. These reference data provide important quantitative basis and multi-dimensional perspective for in-depth comparison of the differences in ecosystem service value of different regions and different types of wetlands. A horizontal comparison of the GEP per unit area of Wild Duck Lake with similar ecosystems (Figure 7) effectively confirms the rationality and scientific nature of the calculation results.
Due to the differences in the selected index system, only the proportion of regulating and cultural services is compared to conduct the difference analysis (Table 14). The significant variation in the proportion of regulating services among the five national wetland parks primarily reflects differences in wetland types, geographic settings, and human disturbance intensity. Natural wetlands such as Tianzi Lake and Qianhu Wetland Parks exhibit much higher proportions of regulating services (95.04% and 97.56%, respectively) because of their well-preserved ecological structures, high vegetation coverage, and strong self-regulation capacity [59]. Their hydrological and biogeochemical processes remain largely natural, resulting in outstanding performance.
In contrast, Wild Duck Lake and East Lake Wetland Parks, as urban or semi-artificial wetlands, are more affected by anthropogenic management and infrastructure. Their hydrological cycles and ecological functions depend heavily on artificial regulation, which weakens their natural regulating capacity [60]. Meanwhile, these wetlands provide considerable cultural and recreational benefits to nearby residents, leading to a higher proportion of provisioning and cultural services in their total GEP value. Regional climate and hydrological conditions further reinforce these differences [61]. Southern wetlands such as those in Hunan and Shaanxi benefit from abundant precipitation and stable water connectivity, while northern wetlands like Wild Duck Lake are situated in semi-arid zones where water replenishment and ecological stability rely on artificial intervention [62]. Moreover, differences in management goals also contribute to this divergence: protection-oriented parks prioritize ecological restoration and conservation, while tourism-oriented parks emphasize cultural and recreational values [63].

4.2. GEP Accounting Results Analysis

An accounting of the GEP of Wild Duck Lake National Wetland Park shows that its GEP structure exhibits dual characteristics of ecological dominance and cultural tourism synergy, highlighting the role wetlands play as a bridge between environmental regulation and human well-being. Analyzing the regulating services, climate regulation and water purification are the wetland’s most significant products, accounting for 66.11% and 11.76% of the total product value, respectively. As the core of these regulating services, wetland vegetation creates a long-term ecological barrier through mechanisms such as transpiration [64]. This also demonstrates the wetland’s efficient ability to intercept and degrade water pollutants. The park’s water conservation, flood regulation, and soil conservation functions are relatively low. This is primarily due to the fact that the artificial wetland, constructed for ecological restoration, is still in the successional recovery phase. Compared to natural wetlands, its water conservation capacity is limited by factors such as vegetation cover, soil structure, and hydrological conditions [65]. Its flood regulation function is also underdeveloped due to the artificially controlled nature of the wetland’s morphology. Its soil conservation capacity is also weak due to the temporary lack of surface vegetation cover, resulting in weak erosion resistance. The value of cultural services is primarily reflected in tourism and health preservation, reflecting the park’s success in transforming ecological resources into a cultural tourism economy. However, this also reveals the current development model’s reliance on a single economic monetization path. The fact that landscape value enhancement functions account for less than 1% of cultural services is somewhat reasonable. The lack of a prosperous urban area hinders housing value-added, and the prevalence of nearby homestays limits its potential for generating additional revenue.

4.3. Social Media Analysis

The 60 high-frequency words primarily fall into three categories: nouns, adjectives, and verbs. Nouns describe activities and attraction names, adjectives reveal visitors’ emotional experiences and evaluation criteria, and verbs describe specific activities and behaviors. The results show that words such as “ Duck (鸭子) (not the park name “Wild Duck (野鸭)”),” “Reed,” and “ Water Surface “ highlight the richness of biological resources in wetland ecosystems and their unique landscape characteristics. This finding confirms that wetlands successfully provide immersive natural experiences through biodiversity and original landscapes, which are closely related to the concepts of “tourism and health preservation” and “landscape value enhancement”. However, the analysis also exposes two critical issues requiring resolution: First, at the service support level, the frequent use of terms like “parking” and “free”; directly reflects inadequate infrastructure and service support. Second, regarding experience enhancement, the prominence of the word “suggestion”; and the prevalence of social activities like birdwatching collectively indicate that the existing cultural services and leisure product system still falls short of fully meeting tourists’ needs, with significant room for improvement in depth and quality.
The social semantic network analysis results show that tourists’ perception presents a “multi-core-edge” structure. By constructing a three-tiered structure, visitors’ perceptions of the Wild Duck Lake Wetland Ecosystem’s cultural services are comprehensively presented [66]. Among the core words identified in the social semantic network, “wild duck,” “wetland,” and “park” appear most frequently. The three keywords in the name of Wild Duck Lake National Wetland Park are all core words, indicating that tourists’ forward gaze is guided by this social construction, thus forming an induced image. After entering the park, tourists will unconsciously look for one or several focus points and ignore unattractive elements. In the middle circle, there are many words about photography, scenery, and internal play methods, indicating that tourists focus on their own play experience. In the outermost circle, words such as “weekend”, “children” and “driving” reflect tourists’ travel motivation and travel methods. “Transportation” is linked with “convenience”, indicating that the park has good accessibility. Visitors are highly satisfied with the park environment but are also aware of the conflict between ecological protection and tourism development. Our field visit and the negative comments from tourists about the winter scenery of Wild Duck Lake also confirm this view.

4.4. Management Implications and Strategies

Based on the comprehensive GEP accounting results, the social media perception analysis and the Beijing Wetland Protection and Development Plan (2021–2035), this study proposes the following three strategies to enhance the value of Wild Duck Lake National Wetland Park.
(1) To address the relatively low contribution of regulating services such as water conservation, flood regulation, and soil conservation, this study recommends strengthening wetland vegetation restoration and protection strategies. Priority should be given to the restoration of native vegetation, optimization of hydrological connectivity, and the establishment of routine ecological monitoring to systematically enhance biodiversity conservation, water regulation, and ecosystem resilience. By planting native aquatic species and replanting deep-rooted wetland vegetation (e.g., Salix matsudana and Tamarix chinensis) along slopes and shorelines, vegetation coverage and biodiversity can be increased, thereby improving the wetland’s water conservation capacity. Meanwhile, optimizing wetland terrain design through measures such as dredging water channels, implementing ecological water replenishment, and utilizing reclaimed water circulation can help build an interconnected and multi-layered wetland network, which will enhance water storage and flood regulation capacities and further improve hydrological functions.
(2) Given the polarization between tourism and wellness services and landscape enhancement within the cultural ecosystem service category, this study suggests expanding cultural value dimensions through diversified project development and the creation of eco-cultural products to achieve a balanced distribution of cultural service values. A Wetland Education and Interpretation Center should be established by upgrading and renovating the existing “Wild Duck Lake Wetland Museum” into a premier wetland science education center in Beijing. This center will serve as a key platform for the public to learn about and engage with wetland ecosystems. In addition, developing eco-cultural products—such as artworks and handicrafts—can create new income sources while strengthening the park’s cultural identity, thereby forming a virtuous cycle between conservation and sustainable use. Regarding landscape value enhancement, emphasis should be placed on improving quality and efficiency rather than pursuing high-end real estate development. Local homestays should be encouraged to upgrade their facilities and services, offering distinctive catering and guided nature experiences to extend visitor stays and increase per capita spending.
(3) Social media data analysis reveals that although visitors highly appreciate the quality of the natural landscape, there are evident shortcomings in supporting infrastructure and management services. Therefore, it is necessary to improve the service facility system, develop a smart tour guide platform, and implement seasonal dynamic management strategies to comprehensively enhance recreational comfort, spatial accessibility, and overall visitor satisfaction. Priority should be given to upgrading essential infrastructure such as visitor centers and observation platforms, while introducing intelligent navigation systems. Seasonal adjustments in pricing and management are recommended, accompanied by visitor guidance on temperature and appropriate clothing. In terms of ecotourism development, it is crucial to maintain a balance between conservation and utilization by designing eco-friendly sightseeing routes and developing specialized programs such as birdwatching and ecological photography to extend visitor stays and increase revisit rates. Meanwhile, a systematic plan for service quality improvement should be established, including regular staff training and supervision to ensure high management standards and sustained enhancement of visitor experiences.

4.5. Limitations and Future Directions

This study, building on existing accounting methods and further considering data availability, conducted an in-depth accounting of the GEP of the wetland ecosystem in Wild Duck Lake National Wetland Park. However, due to limitations in the accounting index system, methodology, and data used, the accounting results may be subject to some degree of bias. The rationality verification section reveals that the GEP per unit area varies among ecosystems of the same type. The limitations are analyzed as follows: (1) Given the lack of a unified, standardized, and comprehensive wetland ecosystem service value assessment system, the GEP per unit area varies among similar ecosystems. (2) Due to a lack of data, the unit value equivalent method used for water purification has not been customized for Wild Duck Lake National Wetland Park, potentially impacting the valuation results.
Future research should further promote the establishment of a more unified, standardized, and regionally adaptable wetland GEP accounting index system, clarifying core accounting categories, accounting indicators, quantification methods, and parameter selection principles, while fully considering the differences in ecological characteristics among different wetland types to enhance the comparability and scientific validity of the results. Strengthen the cross-validation and integration of different assessment methods (such as the equivalent factor method, functional value method, market value method, etc.), develop a multi-model coupling framework that is more consistent with the complexity of wetlands, and focus on deepening the precise quantification of non-market values such as regulating services and cultural services. In addition, deepening the application of wetland GEP accounting results in the fields of GEP value realization, national land space planning, and protection and restoration effectiveness assessment. Explore the effective transformation of assessment results into economic policy tools to incentivize wetland protection and sustainable use, and promote the transformation of ecological value into economic and social value.

5. Conclusions

This study established a GEP accounting framework for the Wild Duck Lake National Wetland Park ecosystem, focusing on two accounting categories—regulating services and cultural services—and eight accounting indicators. Social media data were incorporated into the quantitative accounting of cultural service values to enhance the accuracy and relevance of the assessment.
In 2023, the total GEP value of the park’s wetland ecosystem was estimated at 155.01 million CNY, equivalent to 35.47 million CNY per square kilometer. Among accounting indicators, climate regulation, tourism and health preservation, water purification, carbon sequestration, landscape value enhancement, flood regulation and storage, soil conservation, and water conservation ranked in descending order of contribution.
In 2023, the total GEP value of the park’s wetland ecosystem was estimated at 155.01 million CNY, equivalent to 35.47 million CNY per square kilometer. Among the various ecosystem service categories, climate regulation contributed the most to the total value, followed by tourism and health preservation, water purification, carbon sequestration, landscape value enhancement, flood regulation and storage, soil conservation, and water conservation. These findings highlight the substantial ecological and cultural economic value of the park, particularly its regulatory functions that play a vital role in maintaining regional water quality and environmental security.
Based on GEP accounting and social media data analysis, this study addresses three significant issues: the relatively low proportion of some regulating services, the polarization of tourism and health care and landscape value-added services within cultural service value, and the obvious shortcomings in supporting facilities and management services. It proposes several suggestions, including planting native plants and expanding diversified projects to optimize infrastructure, providing important reference for constructing a comprehensive framework for the protection, sustainable utilization, and enhancement of the ecosystem value of national wetland parks.

Supplementary Materials

The following supporting information can be downloaded at: https://www.mdpi.com/article/10.3390/w17223321/s1, Figure S1: Analysis of Hotel Buffer Zones around Wild Duck Lake National Wetland Park; Table S1: Statistics on the Number of Hotel Rooms and Prices near Wild Duck Lake National Wetland Park; Table S2: Keywords used in social media data retrieval.

Author Contributions

Conceptualization, Y.C. and K.W.; methodology, Y.C. and Q.Z.; investigation, Y.C. and Z.Y.; resources, J.Z.; data curation, M.Y.; writing—original draft preparation, Y.C. and Q.Z.; writing—review and editing, K.W., S.L. and M.Y.; visualization, Z.Y.; supervision, K.W.; project administration, K.W.; funding acquisition, K.W. All authors have read and agreed to the published version of the manuscript.

Funding

This research was funded by the National Natural Science Foundation of China (Grant Number: 42301340) and the Fundamental Research Funds for the Central Universities (Grant Number: 590125071).

Data Availability Statement

The original contributions presented in this study are included in the article. Further inquiries can be directed to the corresponding author.

Acknowledgments

Special thanks to the companions who supported the site surveys and social media data processing.

Conflicts of Interest

The authors declare no conflicts of interest.

References

  1. Li, Y.; Xie, H. Spatial–temporal variation and correlation analysis of ecosystem service values and ecological risks in winter city Shenyang, China. Sci. Rep. 2024, 14, 18182. [Google Scholar] [CrossRef] [PubMed]
  2. Crutzen, P.J. Geology of mankind. Nature 2002, 415, 23. [Google Scholar] [CrossRef] [PubMed]
  3. Rockström, J.; Steffen, W.; Noone, K.; Persson, S.; Chapin, F.S.; Lambin, E.F.; Lenton, T.M.; Scheffer, M.; Folke, C.; Schellnhuber, H.J. A safe operating space for humanity. Nature 2009, 461, 472–475. [Google Scholar] [CrossRef]
  4. Polasky, S.; Kling, C.L.; Levin, S.A.; Carpenter, S.R.; Daily, G.C.; Ehrlich, P.R.; Heal, G.M.; Lubchenco, J. Role of economics in analyzing the environment and sustainable development. Proc. Natl. Acad. Sci. USA 2019, 116, 5233–5238. [Google Scholar] [CrossRef]
  5. Moomaw, W.R.; Chmura, G.L.; Davies, G.T.; Finlayson, C.M.; Middleton, B.A.; Natali, S.M.; Perry, J.E.; Roulet, N.; Sutton-Grier, A.E. Wetlands In a Changing Climate: Science, Policy and Management. Wetlands 2018, 38, 1–23. [Google Scholar] [CrossRef]
  6. Bartzen, B.A.; Dufour, K.W.; Clark, R.G.; Caswell, F.D. Trends in agricultural impact and recovery of wetlands in prairie Canada. Ecol. Appl. 2010, 20, 525–538. [Google Scholar] [CrossRef]
  7. Millennium Ecosystem Assessment. Ecosystems and Human Wellbeing: A Framework for Assessment. 2003. Available online: http://pdf.wri.org/ecosystems_human_wellbeing.pdf (accessed on 16 November 2025).
  8. Kumar, P. The Economics of Ecosystems and Biodiversity: Ecological and Economic Foundations; Routledge: London, UK, 2011. [Google Scholar]
  9. Wackernagel, M.; Onisto, L.; Bello, P.; Linares, A.C.; Falfán, I.S.L.; Garca, J.M.; Guerrero, A.I.S.; Guerrero, M.G.S. National natural capital accounting with the ecological footprint concept. Ecol. Econ. 1999, 29, 375–390. [Google Scholar] [CrossRef]
  10. Hein, L.; Bagstad, K.J.; Obst, C.; Edens, B.; Caparrós, A. Progress in natural capital accounting for ecosystems. Science 2020, 367, 514–515. [Google Scholar] [CrossRef]
  11. Costanza, R.; d’Arge, R.; De Groot, R.; Farber, S.; Grasso, M.; Hannon, B.; Limburg, K.; Naeem, S.; O’Neill, R.V.; Paruelo, J. The Value of the World’s Ecosystem Services and Natural Capital. Nature 1997, 387, 253–260. [Google Scholar] [CrossRef]
  12. United Nations; European Commission; Food and Agriculture Organization of the United Nations; Organisation for Economic Co-Operation and Development; International Monetary Fund, and World Bank Group. System of Environmental-Economic Accounting: Ecosystem Accounting (SEEA EA); United Nations: New York, NY, USA, 2021. [Google Scholar]
  13. IPBES. Global Assessment Report on Biodiversity and Ecosystem Services of the Intergovernmental Science-Policy Platform on Biodiversity and Ecosystem Services; IPBES Secretariat: Bonn, Germany, 2019. [Google Scholar]
  14. While, A.; Jonas, A.E.G.; Gibbs, D. From sustainable development to carbon control: Eco-state restructuring and the politics of urban and regional development. Trans. Inst. Br. Geogr. 2010, 35, 76–93. [Google Scholar] [CrossRef]
  15. The State Council of the People’s Republic of China. China’s National Plan on Implementation of the 2030 Agenda for Sustainable Development; The State Council of the People’s Republic of China: Beijing, China, 2021.
  16. European Commission. The European Green Deal; European Commission: Brussels, Belgium, 2019. [Google Scholar]
  17. SDGs Promotion Headquarters, Government of Japan. SDGs Implementation Guiding Principles (Revised Edition); Ministry of Foreign Affairs of Japan: Tokyo, Japan, 2019.
  18. National Research Council. Sustainability and the U.S. EPA; National Academies Press: Washington, DC, USA, 2011. [Google Scholar]
  19. United Nations General Assembly. Transforming Our World: The 2030 Agenda for Sustainable Development; United Nations: New York, NY, USA, 2015. [Google Scholar]
  20. Zhao, Z.; Xiong, K.; Ying, B.; Zhao, R.; Yan, J.; Huang, H. A Review of Eco-Product Value Realization and Eco-Industry with Enlightenment toward Village Ecosystem Service in the Karst Desertification Control. Sustainability 2024, 16, 4671. [Google Scholar] [CrossRef]
  21. Ruan, H. A Review of Value Realization and Rural Revitalization of Eco-Products: Insights for Agroforestry Ecosystem in Karst Desertification Control. Land 2024, 13, 1888. [Google Scholar] [CrossRef]
  22. Liu, J.; Su, X.; Liu, Y.; Shui, W. A Review of Research on Progress in the Theory and Practice of Eco-Product Value Realization. Land 2024, 13, 316. [Google Scholar] [CrossRef]
  23. Pacetti, T.; Lompi, M.; Panza, G.; Bosso, A.; Monaci, M.; Pasini, G.; Santolini, R. Gross Ecosystem Product as a Measure of Natural Capital Value: An Italian Experience. Earth Syst. Environ. 2025, 9, 2417–2435. [Google Scholar] [CrossRef]
  24. Rokicki, B.; M’barek, R.; Grammatikopoulou, I.; La Notte, A.; Van Alphen, M.; Van Zeist, W.; Bartelings, H.; Polman, N. Gross Ecosystem Product in Macroeconomic Modelling; Publications Office of the European Union: Luxembourg, 2024. [Google Scholar] [CrossRef]
  25. Costanza, R.; Kubiszewski, I.; Giovannini, E.; Lovins, H.; Mcglade, J.; Pickett, K.E.; Ragnarsdóttir, K.V.; Roberts, D.; De Vogli, R.; Wilkinson, R. Development: Time to leave GDP behind. Nature 2014, 505, 283–285. [Google Scholar] [CrossRef]
  26. Bronzes, A.; Hein, L.; Groeneveld, R.; Pulatov, A. A comparison of valuation methods for cultural ecosystem services in support of ecosystem accounting. One Ecosyst. 2024, 10, e108556. [Google Scholar] [CrossRef]
  27. Ouyang, Z.; Song, C.; Zheng, H.; Polasky, S.; Xiao, Y.; Bateman, I.J.; Liu, J.; Ruckelshaus, M.; Shi, F.; Xiao, Y.; et al. Using gross ecosystem product (GEP) to value nature in decision making. Proc. Natl. Acad. Sci. USA 2020, 117, 14593–14601. [Google Scholar] [CrossRef]
  28. Hao, C.; Wu, S.; Zhang, W.; Chen, Y.; Ren, Y.; Chen, X.; Wang, H.; Zhang, L. A critical review of Gross ecosystem product accounting in China: Status quo, problems and future directions. J. Environ. Manag. 2022, 322, 115995. [Google Scholar] [CrossRef]
  29. Hu, Q.; Lu, C.; Chen, T.; Chen, W.; Yuan, H.; Zhou, M.; Qiu, Z.; Bao, L. Evaluation and Analysis of the Gross Ecosystem Product towards the Sustainable Development Goals: A Case Study of Fujian Province, China. Sustainability 2023, 15, 3925. [Google Scholar] [CrossRef]
  30. Fan, Y.; Zheng, Y.; Jia, C.; Song, Y. The impact of China’s urbanization on ecosystem service value from the perspective of gross ecosystem product: A case study of Beijing-Tianjin-Hebei region. Sci. Rep. 2024, 14, 15954. [Google Scholar] [CrossRef]
  31. Ya-Jun, L.; Novo, P. Ecosystem service value of artificial reef area in Qingdao Luhaifeng sea ranching: A meta-analysis and benefit transfer valuation. Ecol. Econ. 2022, 38, 27–33. [Google Scholar]
  32. Ma, Z.; Guo, X. Ecological environment value assessment and ecological civilization in the Changjiang River basin. Water Environ. J. 2024, 38, 178–188. [Google Scholar] [CrossRef]
  33. Wang, W.; Wu, C.; Fang, Q.; Harrison, O.I. Cultural ecosystem services evaluation in a coastal city of China using social media data. Ocean Coast. Manag. 2023, 242, 106693. [Google Scholar] [CrossRef]
  34. Xie, G.D.; Zhang, C.X.; Zhang, L.M.; Chen, W.H.; Li, S.M. Improvement of the Evaluation Method for Ecosystem Service Value Based on Per Unit Area. J. Nat. Resour. 2015, 30, 1243–1254. [Google Scholar]
  35. Pei, Z.Y.; Ouyang, H.; Zhou, C.P.; Xu, X.L. Carbon Balance in an Alpine Steppe in the Qinghai-Tibet Plateau. J. Integr. Plant Biol. 2009, 51, 521–526. [Google Scholar] [CrossRef]
  36. Zhang, Y.; Liu, J.; Zhang, J.; Wang, R. Emergy-based evaluation of system sustainability and ecosystem value of a large-scale constructed wetland in North China. Environ. Monit. Assess. 2013, 185, 5595–5609. [Google Scholar] [CrossRef]
  37. Zhu, Z.; Wu, K.; Zhou, S.; Wang, Z.; Chen, W. Multi-Scale Gross Ecosystem Product (GEP) Valuation for Wetland Ecosystems: A Case Study of Lishui City. Water 2024, 16, 3554. [Google Scholar] [CrossRef]
  38. Deng, H.; Li, C.; Chen, T.; Song, Y.; Cao, J. Valuing the Ecological Products of Wetlands and Strategies for Implementation: A Case Study of Weishui Wetland in Songzi City, Hubei Province. Pol. J. Environ. Stud. 2024, 34, 2627–2645. [Google Scholar] [CrossRef]
  39. Wu, C.; Ma, G.; Yang, W.; Zhou, Y.; Peng, F.; Wang, J.; Yu, F. Assessment of Ecosystem Service Value and Its Differences in the Yellow River Basin and Yangtze River Basin. Sustainability 2021, 13, 3822. [Google Scholar] [CrossRef]
  40. Linbo, Z.; Chaozhi, H.; Yang, S.; Yiyao, W.; Wentao, Z.; Yuhua, H.; Tian, L. Basic Principles of Gross Ecosystem Product (GEP) Accounting. J. Resour. Ecol. 2022, 13, 501–510. [Google Scholar] [CrossRef]
  41. The People’s Government of Beijing Municipality. Wild Duck Lake Becomes Beijing’s First Internationally Important Wetland. Available online: https://www.beijing.gov.cn/renwen/sy/whkb/202302/t20230203_2911284.html (accessed on 6 July 2025).
  42. DB11/T 2059-2022; Technical Specification for Gross Ecosystem Product Accounting. Beijing Municipal Administration for Market Regulation: Beijing, China, 2022.
  43. GB/T 38582-2020; Specifications for Assessment of Forest Ecosystem Services. State Administration for Market Regulation, Standardization Administration of the People’ s Republic of China: Beijing, China, 2020.
  44. SL72-2013; Regulation for Economic Evaluation of Water Conservancy Construction Projects. Ministry of Water Resources, the People’ s Republic of China: Beijing, China, 2013.
  45. SL-654-2014; Code for Rational Service Life and Durability Design of Water Resources and Hydropower Projects. Ministry of Water Resources, the People’ s Republic of China: Beijing, China, 2013.
  46. Wang, J.; Wei, Z. Research of Ecological Effects of Various Land Use in the Western Dump of the West Fushun Strip Mine. China Land. Sci. 2012, 26, 74–79. [Google Scholar] [CrossRef]
  47. Shi, G.; Sun, W.; Shangguan, W.; Wei, Z.; Yuan, H.; Li, L.; Sun, X.; Zhang, Y.; Liang, H.; Li, D.; et al. A China dataset of soil properties for land surface modelling (version 2, CSDLv2). Earth Syst. Sci. Data 2025, 17, 517–543. [Google Scholar] [CrossRef]
  48. KAWO. 2025 China Social Media Platform Guide; KAWO: Shanghai, China, 2025. [Google Scholar]
  49. Craft, C. Creating and Restoring Wetlands: From Theory to Practice; Elsevier: Amsterdam, The Netherlands, 2016. [Google Scholar]
  50. Yu, H.; Shao, C.; Wang, X.; Hao, C. Transformation Path of Ecological Product Value and Efficiency Evaluation: The Case of the Qilihai Wetland in Tianjin. Int. J. Environ. Res. Public Health 2022, 19, 14575. [Google Scholar] [CrossRef] [PubMed]
  51. Yang, L.; Zhang, Z.; Zhang, W.; Zhang, T.; Meng, H.; Yan, H.; Shen, Y.; Li, Z.; Ma, X. Wetland park planning and management based on the valuation of ecosystem services: A case study of the Tieling lotus lake national wetland park (LLNWP), China. Int. J. Environ. Res. Public Health 2023, 20, 2939. [Google Scholar] [CrossRef]
  52. Xu, D.; Wang, Y.; Wu, L.; Zhang, W. Evaluation of the Degree of the Value Realization of Ecological Products of the Forest Ecological Bank in Shunchang County. Forests 2023, 14, 2269. [Google Scholar] [CrossRef]
  53. Sun, Z.; Xue, W.; Kang, D.; Peng, Z. Assessment of Ecosystem Service Values of Urban Wetland: Taking East Lake Scenic Area in Wuhan as an Example. Land 2024, 13, 1013. [Google Scholar] [CrossRef]
  54. Chen, L.; Yuan, S.; Zhao, S.; Shi, W. Evaluation of ecosystem service value of Tianzi Lake National Wetland Park. Hunan For. Sci. Technol. 2020, 47, 69–74. [Google Scholar]
  55. Chen, W.; Zhang, Y.; Wen, C.; Li, H. Evaluation on Ecosystem Service Values of Wetland in Loess Plateau—A Case Study at Qianhu National Wetland Park, Shaanxi Province. Bull. Soil Water Conserv. 2019, 39, 6. [Google Scholar]
  56. Li, M.; Liao, B.W.; Chen, Y.J.; Jiang, Z.M. Wetland ecosystem services valuation of Cuiheng National Wetland Park in Zhongshan, Guangdong Province. Ecol. Sci. 2022, 41, 196–202. [Google Scholar] [CrossRef]
  57. Zhang, Y.R.; Zhou, D.M.; Liu, M. Ecosystem service valuation research of Chinese inland wetlands based on case study. Acta Ecol. Sin. 2015, 35, 4279–4286. [Google Scholar] [CrossRef]
  58. Zhang, B.; Shi, Y.T.; Li, Q.X.; Xie, G.D. The Key Ecological Services and Their Values of Wetland Ecosystems in Beijing. J. Nat. Resour. 2017, 32, 1311–1324. [Google Scholar]
  59. Costanza, R.; de Groot, R.; Sutton, P.; van der Ploeg, S.; Anderson, S.J.; Kubiszewski, I.; Farber, S.; Turner, R.K. Changes in the global value of ecosystem services. Glob. Environ. Change 2014, 26, 152–158. [Google Scholar] [CrossRef]
  60. Jamal, S.; Atahar, M.; Ahmad, W.S. Resilience in urban ecosystems: Interdisciplinary perspective, strategic blueprint, and innovative pathways for the cities of tomorrow. GeoJournal 2025, 90, 18. [Google Scholar] [CrossRef]
  61. Hein, L.; Obst, C.; Edens, B.; Remme, R.P.; Runguo, Z. Defining Ecosystem Assets for Natural Capital Accounting. PLoS ONE 2016, 11, e0164460. [Google Scholar] [CrossRef]
  62. Wang, G.; Hu, N.; Hautier, Y.; Middleton, B.; Wang, M.; Zhao, M.; Meng, J.; Ma, Z.; Liu, B.; Liu, Y. Biotic and Abiotic Drivers of Ecosystem Temporal Stability in Herbaceous Wetlands in China. Global Change Biology 2025, 31, e70056. [Google Scholar] [CrossRef]
  63. Xu, L.; Ao, C.; Mao, B.; Cheng, Y.; Ma, J. Which is more Important, Ecological Conservation or Recreational Service? Evidence from a Choice Experiment in Wetland Nature Reserve Management. Wetlands 2020, 40, 1–16. [Google Scholar] [CrossRef]
  64. Mitsch, W.J.; Gosselink, J.G. Wetlands, 5th ed.; Wiley: Hoboken, NJ, USA, 2015. [Google Scholar]
  65. Shah, A.M.; Liu, G.; Chen, Y.; Yang, Q.; Yan, N.; Agostinho, F.; Mvbalmeida, C.; Fgiannetti, B. Urban constructed wetlands: Assessing ecosystem services and disservices for safe, resilient, and sustainable cities. Front. Eng. Manag. 2023, 10, 582–596. [Google Scholar] [CrossRef]
  66. Larsen, J. Tourists’ gaze and the “performing tourist.”. Scand. J. Hosp. Tour. 2005, 5, 80–101. [Google Scholar]
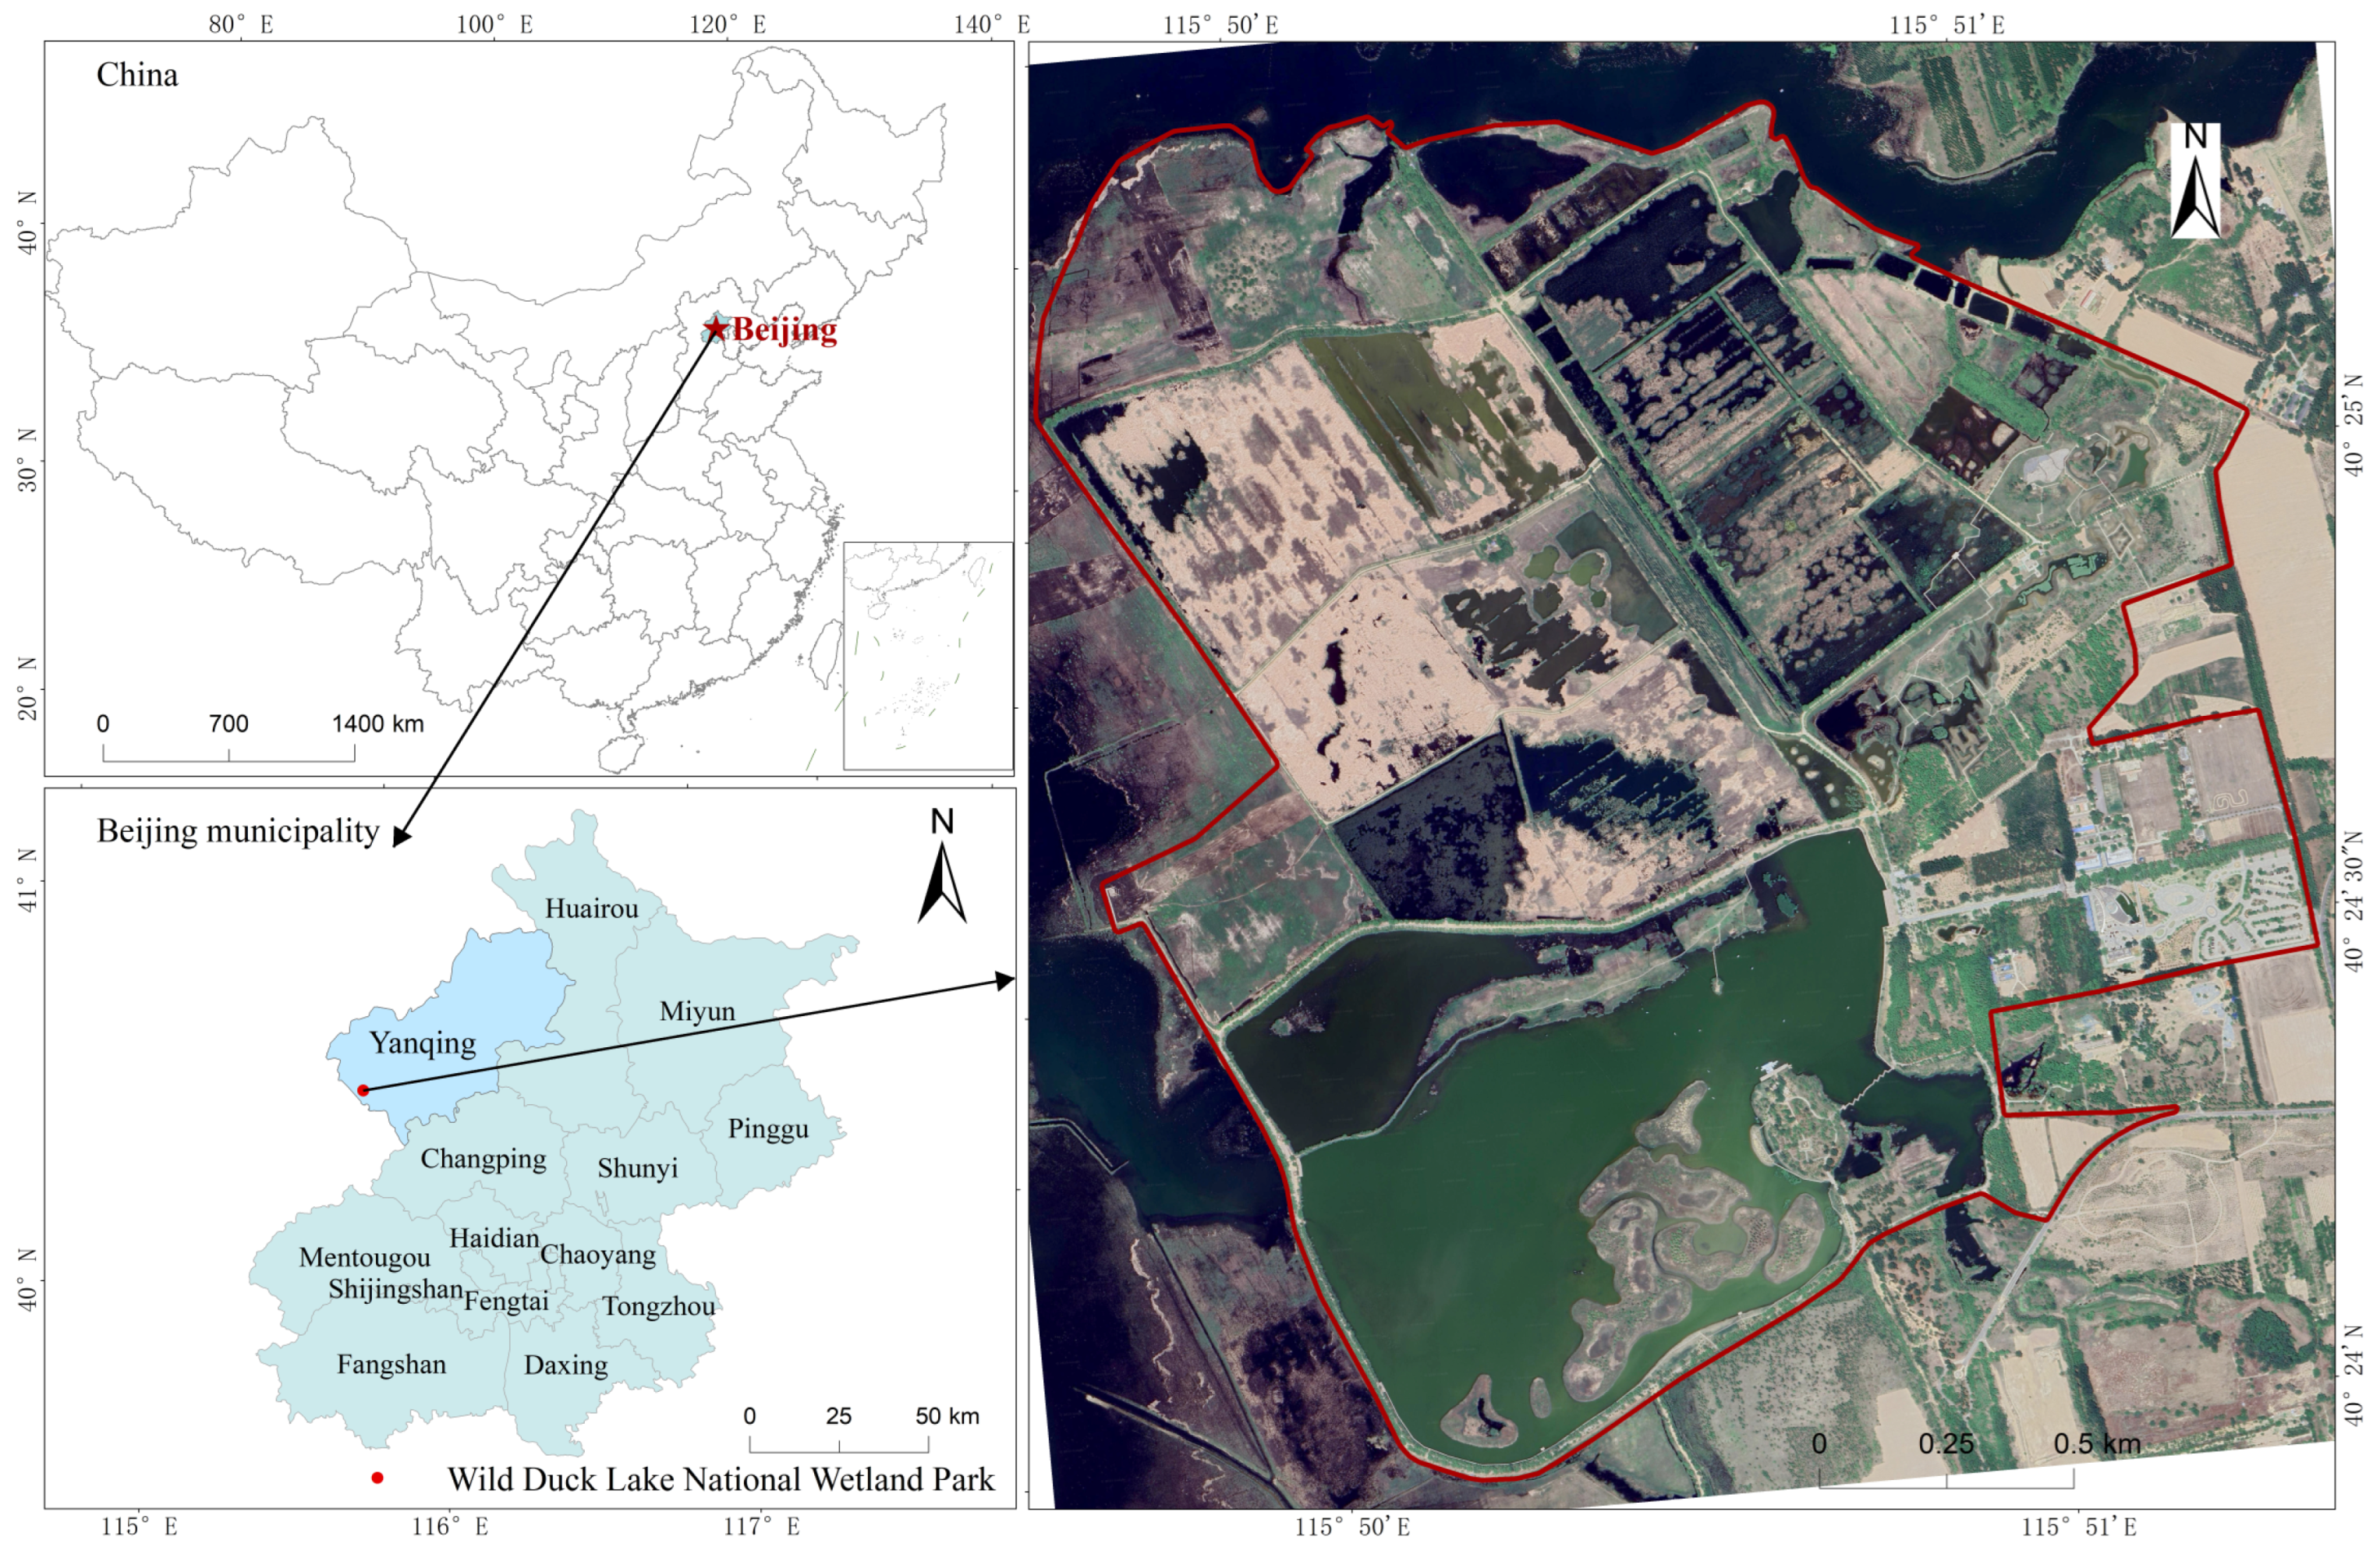
Figure 1. Location of the study area. (Remote sensing imagery obtained from Google Maps (2023)).
Water 17 03321 g001
Figure 2. Technical framework of the study.
Water 17 03321 g002
Figure 3. Workflow for processing social media data.
Water 17 03321 g003
Figure 4. Land use status of the Wild Duck Lake National Wetland Park in 2023. This figure adopts the land classification system of China’s Third National Land Survey and is based on Google Earth Engine (GEE) analysis combined with field investigation. Areas with tree canopy cover ≥ 0.2 are classified as arbor forest land, while open woodland is categorized as other forest land. Non-grazed grasslands with canopy cover < 0.1 are classified as other grassland. Narrow internal roads lined with tall trees are classified as park green space.
Water 17 03321 g004
Figure 5. Comparison of GEP structure of Wild Duck Lake National Wetland Park.
Water 17 03321 g005
Figure 6. Social semantic network analysis diagram.
Water 17 03321 g006
Figure 7. Comparative analysis of GEP of multiple wetland parks.
Water 17 03321 g007
Table 1. Accounting index system and corresponding methods for assessing the GEP of the Wild Duck Lake National Wetland Park.
Accounting CategoryAccounting IndicatorBiophysical Quantity Accounting MethodEconomic Valuation Accounting Method
Regulating ServicesWater conservationWater balance methodReplacement cost method
Flood regulationFlood regulation modelReplacement cost method
Carbon sequestrationCarbon sequestration modelMarket value method
Water purification/Unit area value equivalence method
Climate regulationHeat absorption modelReplacement cost method
Soil conservationUniversal Soil Loss Equation (USLE)Replacement cost method
Cultural ServicesEcotourism And Health PreservationSocial media analysisTravel cost method
Landscape Value EnhancementSite survey and web crawlingMarket value method
Table 2. Specific parameter values and data sources for water conservation calculations.
Accounting StageParameter NameParameter ValueData Description and Source
Biophysical QuantityWetland ecosystem area3.75 km2Vector data, current land use map of Wild Duck Lake National Wetland Park
Precipitation440.72 mm/aRaster data, 30 m × 30 m, Nationwide rainfall distribution data, https://www.gisreal.cn/, accessed on 26 February 2025
Surface runoff30.7 mm/aRaster data, 30 m × 30 m, National surface runoff data, https://www.gisreal.cn/, accessed on 26 February 2025
Total evapotranspiration385.64 mm/aRaster data, 30 m × 30 m, National multi-year spatial distribution data of actual evapotranspiration (transpiration), https://www.gisreal.cn/, accessed on 26 February 2025
Economic ValueEngineering cost per unit of reservoir volume8.88 CNY/m3Specifications for assessment of forest ecosystem services [43]
Annual operating cost per unit reservoir capacity0.02 CNY/(m3·a)Regulation for economic evaluation of water conservancy construction projects [44]
Annual depreciation rate of reservoir0.95%Code for rational service life and durability design of water resources and hydropower projects [45]
Table 3. Specific parameter values and data sources for flood regulation calculations.
Accounting StageParameter NameParameter ValueData Description and Source
Biophysical QuantityLake area0.82 km2Vector data, current land use status map of Wild Duck Lake in 2023
Economic ValueEngineering cost per unit of reservoir volume8.88 CNY/m3Specifications for assessment of forest ecosystem services [43]
Annual operating cost per unit reservoir capacity0.02 CNY/(m3·a)Regulation for economic evaluation of water conservancy construction projects [44]
Annual depreciation rate of reservoir0.95%Code for rational service life and durability design of water resources and hydropower projects [45]
Table 4. Specific parameter values and data sources for carbon sequestration calculations.
Accounting StageParameter NameParameter ValueData Description and Source
Biophysical QuantityConversion factor from carbon (C) to carbon dioxide (CO2)44/12Technical specification for gross ecosystem product accounting [42]
The net primary productivity3857.77 tRaster data, 30 m × 30 m, China’s net primary productivity (NPP) data, https://www.gisrs.cn/, accessed on 26 February 2025
The carbon consumed by soil heterotrophic respiration1000.43 tSoil microbial respiration model * [35]
Economic ValueChina’s carbon market price in 202368.13 CNY/tShanghai Environment and Energy Exchange
Note: * Soil microbial respiration model: estimates soil microbial activity by quantifying CO2 release from organic matter decomposition, reflecting soil carbon cycling and microbial dynamics under varying environmental conditions.
Table 5. Specific parameter values and data sources for water quality purification.
Accounting StageParameter NameParameter ValueData Description and Source
Economic Value2023 annual interest rate1.50%People’s Bank of China
Water purification unit area equivalent3.6 CNY/m2Xie et al. [34]
Wetland ecosystem area3,759,664.39 m2Vector data, current land use status map of Wild Duck Lake in 2023
Consumer price index of the evaluation year compared with the reference year132.7Beijing Statistical Yearbook 2024
Table 6. Specific parameter values and data sources for climate regulation calculations.
Accounting StageParameter NameParameter ValueData Description and Source
Biophysical QuantityEvapotranspiration volume during air conditioning cooling918,324.42 m3Raster data, 30 m × 30 m, National multi-year spatial distribution data of actual evapotranspiration (transpiration), https://www.gisreal.cn/, accessed on 26 February 2025
Density of water1 g/cm3/
Latent heat of vaporization, the heat required to evaporate 1 g of water 2257 J/gCalculated
Coefficient of performance for air conditioning3.302019 Residential Energy Saving Behavior Survey Report
Evapotranspiration volume during humidifier operation130,003.55 m3/aRaster data, 30 m × 30 m, National multi-year spatial distribution data of actual evapotranspiration (transpiration), https://www.gisreal.cn/, accessed on 26 February 2025
Power consumption of the humidifier per 1 m3 of water converted into steam150 kW·h/m3Calculated
Economic ValueLocal electricity prices for daily consumption0.53 CNY/kW·hBeijing Municipal Development and Reform Commission
Table 7. Specific parameter values and data sources for soil conservation calculations.
Accounting StageParameter NameParameter ValueData Description and Source
Biophysical QuantityArea of wetland ecosystem3.75 km2Vector data, current land use status map of Wild Duck Lake in 2023
Rainfall erosion factor for accounting unit1027.08 MJ·mm/(hm2·h·a)Calculation based on empirical formulas derived from monthly rainfall
Soil erodibility factor for accounting unit0.042 t·hm2·h/(hm2·MJ·mm)Raster data, 30 m × 30 m, National high-precision soil erodibility factor K data, https://www.gisrs.cn/, accessed on 26 February 2025
Slope length factor for accounting unit0.677Calculated based on slope length
Slope factor for accounting unit0.057Calculated based on slope
Vegetation cover factor for accounting unit0.708Calculated based on NDVI (Normalized Difference Vegetation Index) and FVC (Fractional Vegetation Cover)
Soil conservation factor0Wetlands take the value 0
Economic Value (Reduced Sedimentation Value)Engineering cost per unit of sedimentation removal121.89 CNY/m3Guanting Reservoir Dredging Pilot Project (Construction) Tender Announcement
Sedimentation coefficient0.24Wang et al. [46]
Economic Value (Reduced Non-Point) Source Pollution Value)Pure nitrogen content in soil0.10%Raster data, 90 m × 90 m, Shi et al. [47]
Pure phosphorus content in soil0.04%Raster data, 90 m × 90 m, Shi et al. [47]
Unit treatment cost of comprehensive non-point source pollutants47,552 CNY/tCalculated based on cost-effectiveness approach
Table 8. Specific parameter values and data sources for ecotourism & health reservation.
Accounting StageParameter NameParameter ValueData Description and Source
Biophysical QuantityTotal number of visitors300,000 persons/yearhttps://www.bjyouth.com.cn/, accessed on 5 February 2025
Economic ValueAverage travel cost per visitor140.73 CNY/person-timeSocial Media Data (Section 2.2.4) and the Wild Duck Lake National Wetland Park Conceptual Master Plan
Tendency of visitors’ average travel cost towards natural landscapes78%Social Media Data
Table 9. Specific parameter values and data sources for landscape value enhancement.
Accounting StageParameter NameParameter ValueData Description and Source
Biophysical QuantityNumber of hotels benefiting from landscape appreciation159 hotelsPOI data of Beijing in 2023 (using ArcMap (Version 10.6) spatial analysis, a hotel buffer zone within 5 km of the wetland park was identified (Figure S1))
Number of hotel rooms benefiting from landscape appreciation647 nights/ahttps://www.ctrip.com/, accessed on 7 February 2025 (Table S1)
Economic Value Average hotel room price337.27 CNY/nighthttps://www.ctrip.com/, accessed on 7 February 2025 (Table S1)
Landscape premium coefficient for rooms139%https://www.ctrip.com/, accessed on 7 February 2025
Table 10. Parameter values and data sources used in the Travel Cost Method (TCM).
ParameterValueData Source (For Specific Keywords, See the Supplementary Instructions)
Preference for natural landscape78%Keyword search (Table S2)
Average one-way travel time to the core site2.25 hKeyword search (Table S2)
Average one-way travel cost to the core site89.74 CNYKeyword search (Table S2)
Average time spent at the core tourism site2.93 hKeyword search (Table S2)
Average daily wage of tourists213.31 CNY/dayTourist IP-based statistics
Table 11. Land use types and area of Wild Duck Lake National Wetland Park in 2023.
First-Level ClassificationSecond-Level ClassificationArea (ha)
GrasslandOther Grassland43.34
Public Management and Public ServicePublic Park and Green Space Land6.04
Land for Transportation PurposesTransportation Services Terminal Land8.42
Highway Land1.57
Forest LandOther Forest Land8.67
High Forest9.84
Commercial service landCommercial and Business Facilities Land4.27
WetlandMarsh Land247.50
Inland Tidal Flat1.01
Water Areas and Water Conservancy Facilities LandPit and Pond Surface1.12
Lake Water Surface87.12
Table 12. Accounting results of the GEP in the Wild Duck Lake National Wetland Park.
Accounting CategoryAccounting IndicatorValue (104 CNY)ProportionTotal (104 CNY)Unit Value (104 CNY/km2)
Regulating ServicesWater conservation0.770.01%15,500.893547.11
Flood regulation29.760.19%
Carbon sequestration71.380.46%
Water purification1823.0111.76%
Climate regulation10,247.2666.10%
Soil conservation5.190.03%
Cultural ServicesEcotourism And Health Preservation3293.1921.25%
Landscape Value Enhancement30.330.20%
Table 13. High-frequency keywords extracted from social media data.
RankKeywordFrequencyRankKeywordFrequency
1Wild Duck260031Free228
2Scenery122732Playing227
3Reeds112433Tourist218
4E-scooter92034Distance218
5Wetland90235Urban Area215
6Bicycle79436Air210
7Duck71937Nice View203
8Tickets66838Couples201
9Bird Species55839Foursome195
10Weather49440Lake Water183
11Parking Lot47341Friends177
12Convenient46242Walk177
13Photo45043Binoculars177
14Suggestion44444Boating173
15Plank Road44345Beautiful171
16Water Surface42346Comfortable165
17Traffic38947Elderly162
18Bird watching37548Cycling160
19Lakeside35949Reservoir159
20Kids35950View158
21Entrance35751Worth It158
22Lakeside Path33252Afternoon156
23Season33053Downhill152
24Environment31854Surprised146
25Nature31155Migratory Birds140
26Park Area28556Relaxing143
27Driving27557Animals138
28Parking27558Fee138
29Rental Car23959Blue Sky137
30Weekend23160Sightseeing137
Table 14. Analysis of value proportion structure of wetland parks.
Wetlands NameGEP per Unit Area (104 CNY/km2)Proportion of Regulating ServicesProportion of Cultural Services
Wild Duck Lake National Wetland Park3547.1174.12%25.88%
East Lake National Wetland Park in Wuhan4729.3828.41%71.59%
Tianzi Lake National Wetland Park in Hunan4926.1395.04%4.96%
Qianhu National Wetland Park in Shaanxi5676.7397.56%2.44%
Cuiheng National Wetland Park in Guangdong2691.5086.51%13.49%
Disclaimer/Publisher’s Note: The statements, opinions and data contained in all publications are solely those of the individual author(s) and contributor(s) and not of MDPI and/or the editor(s). MDPI and/or the editor(s) disclaim responsibility for any injury to people or property resulting from any ideas, methods, instructions or products referred to in the content.