Article

Ensemble Integration of Pedestrian Safety Indicators for Robust Pedestrian Flood Risk Assessment in Urban Inundation Conditions

1
Department of Civil Engineering, Seoul National University of Science and Technology, Seoul 01811, Republic of Korea
2
Department of Civil and Environmental Engineering, Gachon University, 1342, Seongnam Daero, Sujeong-gu, Seongnam-si 13120, Republic of Korea
3
Korea Institute of Civil Engineering and Building Technology, 283, Goyangdae-ro, Ilsanseo-gu, Goyang-si 10223, Republic of Korea
*
Author to whom correspondence should be addressed.
Water 2025, 17(22), 3322; https://doi.org/10.3390/w17223322
Submission received: 30 September 2025 / Revised: 11 November 2025 / Accepted: 18 November 2025 / Published: 20 November 2025
(This article belongs to the Special Issue Analysis and Simulation of Urban Floods)

Abstract

Increasing rainfall intensity and altered temporal patterns due to climate change pose significant threats to pedestrian safety in highly urbanized areas. Reliable pedestrian safety assessment is therefore essential for evacuation planning and flood risk management. This study evaluated pedestrian stability under various rainfall patterns and return periods using four instability indicators derived from hydraulic and empirical formulations. To mitigate indicator-dependent variability, the normalized indicators were combined into an integrated instability index through an ensemble-averaging approach. The flood-intensity-based indicator systematically underestimated non-walkable areas compared with force-balance-based indicators, whereas the integrated index produced more consistent spatial patterns of pedestrian risk across rainfall scenarios. The most hazardous conditions occurred under the 1 h, Huff fourth-quartile storm, highlighting the influence of late-peaking rainfall on short-duration urban flooding. These findings demonstrate that the proposed ensemble-averaged framework enhances the robustness of pedestrian flood risk evaluation and provides a quantitative basis for prioritizing mitigation measures and evacuation planning in urban areas.

1. Introduction

Flood damage in urban areas has been increasing due to the combined effects of climate change-induced extreme rainfall and rapid urbanization. According to the United Nations Office for Disaster Risk Reduction (UNDRR), between 1970 and 2019, water-related disasters accounted for 50% of all disasters and 45% of fatalities, with Asia experiencing the largest share of deaths and economic losses [1]. Furthermore, under climate change scenarios, global annual average losses of infrastructure caused by flooding are projected to increase by 5–13% by 2050. Flood flow poses a direct threat to pedestrians, often leading to casualties when the flow force is underestimated and human instability occurs. Pedestrian instability under flood conditions is primarily governed by two key hydrodynamic mechanisms—sliding and toppling [2]. These mechanisms have been identified as major causes of pedestrian injuries and fatalities during movement through floodwaters [3]. Furthermore, limited visibility in turbid floodwaters increases instability by concealing unexpected submerged obstacles encountered while moving through inundated areas [4]. In this context, densely populated urban areas face elevated risks of pluvial flooding due to their high population density and heavy traffic volume. In particular, in highly developed cities, where the installation of large-scale flood defense facilities requiring substantial land area is constrained, the vulnerability to flood damage is further amplified. Therefore, it is necessary to analyze flood damage with a focus on human safety under extreme rainfall, so that mitigation measures and financial resources can be targeted to the areas most affected.
Pedestrian safety under urban flooding has generally been analyzed using the flow velocity ( U ) and water depth ( h ). To determine the critical thresholds for human stability, human stability experiments were carried out, and empirical formulas for pedestrian instability were proposed from the results [5,6,7]. Due to safety concerns and standardization limitations in full-scale human experiments, subsequent studies have employed dummy or human body model experiments to propose theoretical and empirical formulas for pedestrian instability thresholds. Xia et al. [8] analyzed external hydrodynamic forces and conducted dummy experiments to propose critical velocity formulas for sliding and toppling. Postacchini et al. [9] conducted instability experiments with simplified human body models and presented empirical U h relationships, while Zhu et al. [10] and Kim et al. [11] applied 3D-printed human body models to propose similar formulas. Since such attempts using human body models have generally been based on a standing posture, they are limited in accounting for actual human responses. To address this, Guo et al. [4] evaluated human instability under different postures based on simulation results and proposed posture-dependent U h relationships. Building upon these experimental studies, several indicators for evaluating human stability have been developed. Arrighi et al. [12] proposed a mobility parameter through hydrodynamic force analysis and derived its relationship with the Froude number from pedestrian instability experiments. Lazzarin et al. [13] introduced an impact parameter derived from flow momentum and pedestrian instability test results, and they proposed its use as a threshold for human instability. However, the use of instability thresholds generally allows only a binary classification (possible vs. impossible walking), making it difficult to subdivide the degree of flood hazard. Consequently, studies have proposed grading systems for flood hazard. DEFRA and EA [14] and Cox et al. [15] suggested flood intensity, defined as the product of velocity and depth, as a criterion to classify hazard levels. Kvočka et al. [16] proposed a hazard rating (HR) based on the ratio between flow velocity and the critical velocity proposed by Xia et al. [8], and they suggested four hazard categories. Tingsanchali and Promping [17] evaluated flood hazard by applying a weighted sum of hazard assessment results for velocity, depth, and rainfall duration. Both pedestrian instability thresholds and hazard grading criteria provide a basis for evaluating pedestrian risk from floods; however, the question of which hazard indicator should be selected to ensure reliable assessment results remains challenging to answer.
Using developed pedestrian instability thresholds, several studies have conducted flood hazard assessments based on inundation simulations. Specifically, hazard levels have been defined from flow velocity and depth simulated by 2D inundation models, and hazard classifications have been attempted using critical values of pedestrian instability. Arrighi et al. [12] developed an empirical formula for relative submergence, defined as the ratio of inundation depth to human height, based on pedestrian instability thresholds and classified the hazard into three levels (low, medium, and high). Dong et al. [18] and Li et al. [19] defined hazard degree grading using the ratio of flow velocity to the critical velocity proposed by Xia et al. [8] and analyzed overall flood hazards. Li et al. [20] directly applied the hazard rating proposed by Kvočka et al. [16] to evaluate flood risks for adults and children. In addition, some studies have used flood intensity as an empirical hazard criterion. Lee et al. [21] evaluated flood hazard using flood intensity ( U h ) and considered topographic conditions and rainfall return periods to assess overall risk. Coroz Perez et al. [22] also applied flood intensity, combined with depth and velocity thresholds, to classify hazard levels. Evans et al. [23] similarly used flood intensity but incorporated human height and weight in setting hazard thresholds to evaluate pedestrian safety. Most of these studies relied on a single hazard assessment index and thus were limited in examining uncertainties associated with the choice of indicator. Shin et al. [24], for instance, assessed pedestrian safety under subway flooding using four hazard indices and demonstrated that differences in indicator selection led to variations in the assessment results. They argued that a weighted sum of multiple indices is necessary to improve the robustness of pedestrian flood hazard assessment. Therefore, reliance on a single hazard index constrains the reliability of assessment results, and uncertainty due to indicator choice should be reduced by comprehensively considering multiple indices.
The uncertainty in simulation-based pedestrian safety assessment during flood events arises from both the reliability of flood simulation results and the selection of safety indicators. Addressing these two sources of uncertainty requires validated flooding simulation results and robust evaluation metrics grounded in experimental evidence. This study quantitatively analyzes the impact of urban flooding caused by extreme rainfall on pedestrian safety. Design rainfalls were generated using the Huff quartile method while considering variations in rainfall duration, and urban inundation was simulated based on these events. From the simulation outputs, various pedestrian hazard indices were applied to evaluate risk levels, and differences in the results depending on the selected indices were compared and analyzed. Finally, this study proposes an integrated ensemble-based framework combining multiple hazard indices to overcome the limitations of relying on a single indicator.

2. Materials and Methods

2.1. Model Setup and Validation

In this study, rainfall–runoff and inundation simulations were conducted using the Personal Computer Surface Water Management Model (PCSWMM, version 7.6.3695). PCSWMM couples the rainfall–runoff results from EPA-SWMM with a quasi-2D inundation model and has been widely applied for flood risk assessment in urban areas and floodplains [25,26,27]. Figure 1a shows the study area, located in Gwangju City, in the southwest of Korea. The area experienced severe flooding in both 2020 and 2025 due to storm events equivalent to a 500-year return period, resulting in significant road and vehicle inundation. The southern boundary of the study area is defined by the Gwangju Stream, and most of the catchment consists of residential and commercial zones. The total simulation area is 97.9 ha, of which 94.6% is impervious, indicating a highly urbanized environment. The existing storm sewer system was designed for a 30–50-year return period and thus has limited capacity to cope with recent extreme rainfall events. For the rainfall–runoff simulation, a storm sewer network model was constructed, as shown in Figure 1b. To simulate urban inundation linked with the sewer system, a 2D computational mesh was developed (Figure 1a). Each manhole was connected to a corresponding 2D computational cell to calculate surcharge-induced overflow. To improve computational efficiency, the 2D domain was represented by block-scale road networks, while internal road networks within buildings were excluded from the inundation simulation.
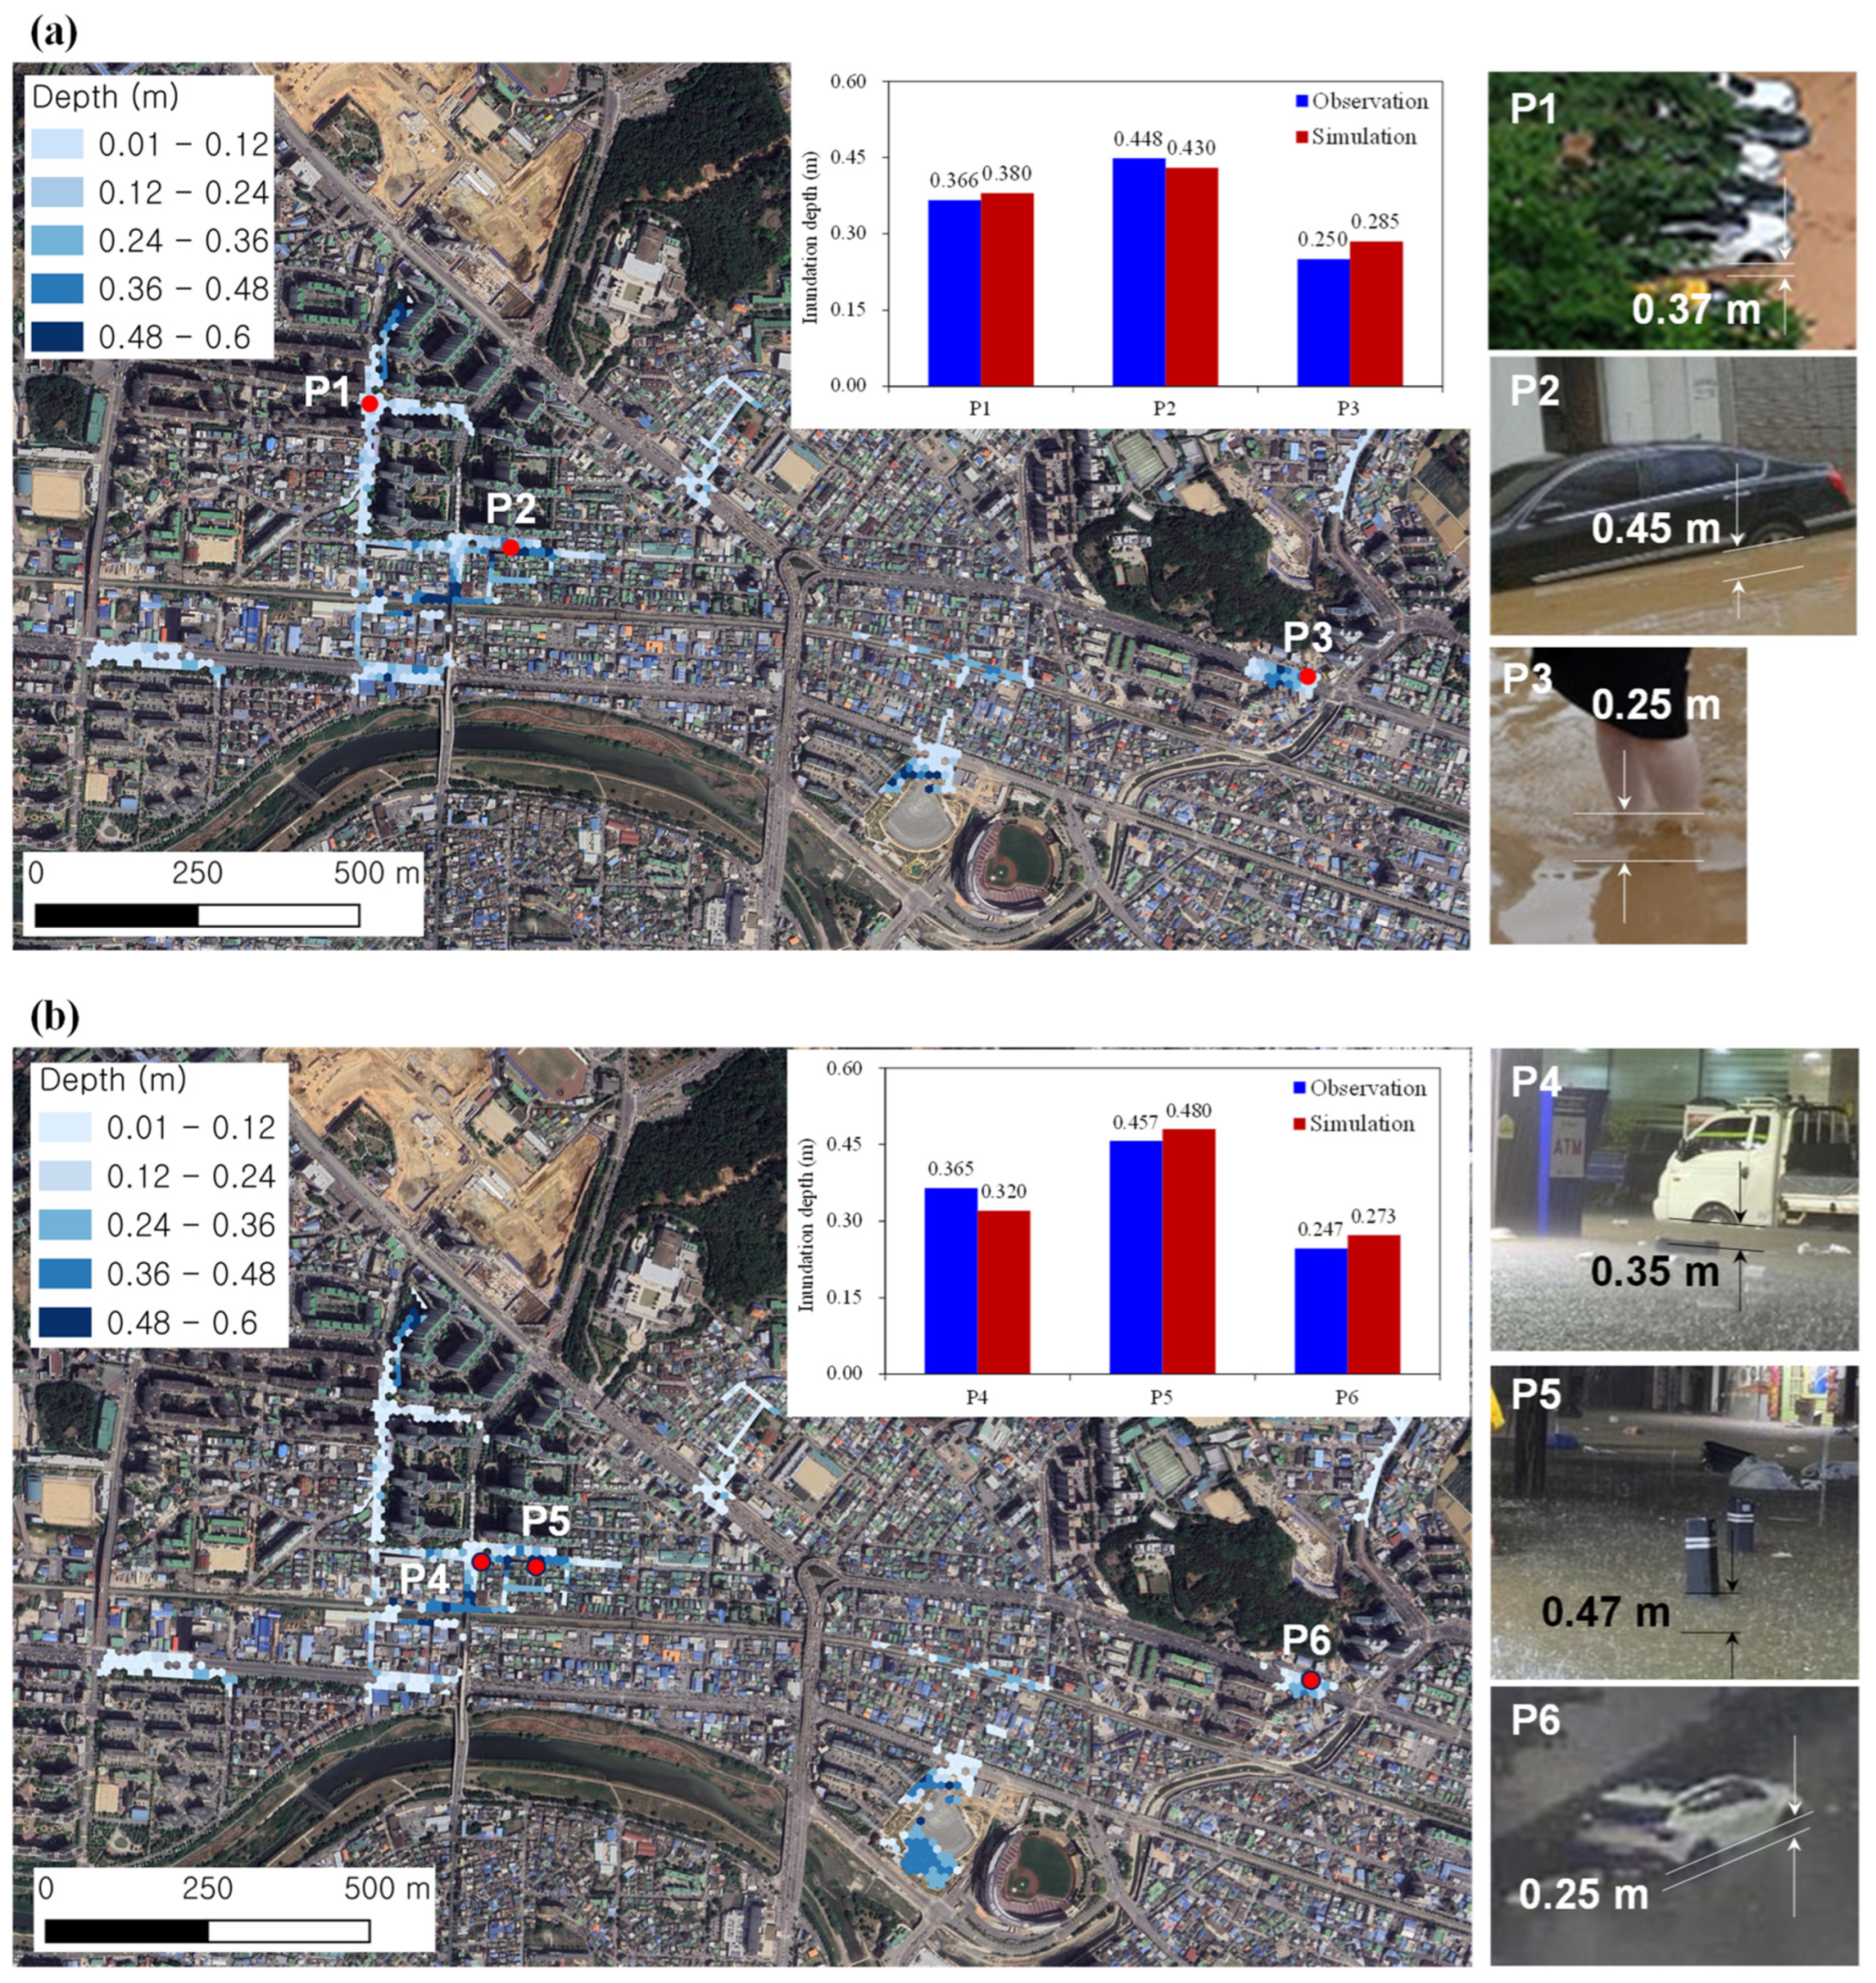
To validate the constructed model, inundation simulations were performed for two storm events that occurred on 7–9 August 2020 and 3–4 August 2025. The dynamic wave model was applied for both rainfall–runoff and inundation simulations, with a free outfall boundary condition at the outlet. The simulation was performed using an adaptive time step, with the Courant number constrained to below 1.0 and the minimum time step set to 0.5 s. Figure 2 presents the simulated inundation depths and their comparison with observed flood conditions from photographs. Water depths were estimated from reference objects of known dimensions: at points P1, P2, P4, and P6 using the diameter of car tires (0.67 m); at P3 using the shin height of pedestrians (0.25 m); and at P5 using the width (0.12 m) and height (0.85 m) of roadside bollards. The differences between the simulated and observed depths were 3.9%, 4.1%, and 14% at P1, P2, and P3, respectively (average 7.3%), and 12.2%, 5.0%, and 10.5% at P4, P5, and P6 (average 9.5%). Considering the uncertainties associated with estimating water depths from photographs, these results indicate that the inundation simulation provides reliable performance for the study area.

2.2. Pedestrian Safety Assessment Indices

Pedestrian safety under flood conditions can be assessed using two main approaches: empirical analysis and mechanistic balance. A representative empirical method is the flood intensity ( F I ) approach proposed by DEFRA and EA [14]:
F I = h U + 0.5
Based on pedestrian safety experiments and UK population statistics, DEFRA and EA [14] classified risk levels as F I < 0.75 (Low), 0.75 F I < 1.25 (Moderate), 1.25 F I < 2.5 (Significant), and 2.5 F I (Extreme). Since the “Significant” level implies that most people are at risk, the present study adopted this threshold to define hazardous pedestrian zones.
The mechanistic balance approach evaluates the balance of forces acting on the human body, including hydrodynamic force, drag, buoyancy, friction, and body weight. Xia et al. [8], using physical experiments with human surrogates, proposed the following critical velocity expressions for toppling and sliding:
U c s = α h h p β m p ρ h p h a 1 h h p + b 1 a 2 m p + b 2 h p 2
U c t = α h h p β m p ρ h 2 a 1 + h p h b 1 a 2 m p + b 2 h p 2
where U c s and U c t are the critical velocities for sliding and toppling (m/s); h p (m) and m p (kg) are a person’s height and weight, respectively; ρ is the density of water (kg/m3); α , β , a 1 , and b 1 are coefficients corresponding to relative depth between the human body and the inundation depth; and a 2 and b 2 are the coefficients explaining the linear relation between human weight and volume. These equations (Equations (2) and (3)) have been widely applied in subsequent pedestrian risk studies. Liu et al. [28] provided specific values for these coefficients for adults (see Table 1).
Building upon this, Kvočka et al. [16] proposed a hazard rating ( H R ) combining the relative magnitudes of Equations (2) and (3):
H R = m i n 1 ,   U m i n ( U c s ,   U c t )
They defined H R thresholds of 0.3 (Low), 0.6 (Moderate), and 1.0 (Extreme), consistent with those from DEFRA and EA [14].
More recently, instability formulas have been developed on the basis of force balance under inundated flows. Building on the work of Arrighi et al. [12], Arrighi et al. [29] introduced the concept of relative submergence derived from the force balance and proposed an empirical relationship from pedestrian safety assessment experimental results:
h c r = h p 0.29 0.24 + F r
where h c r is the critical depth (m) and F r = U / g h is the Froude number. From Equation (4), Arrighi et al. [29] defined the critical depth associated with pedestrian instability zones. In addition, Lazzarin et al. [13] proposed an instability assessment model based on formulas describing flow energy and momentum:
W = h h W α 1 + β F r 2
where h W is the reference depth (m), proposed as 1.25 m for an adult; α and β are parameters calibrated against experimental instability data and set to 2 and 4, respectively. Lazzarin et al. [13] suggested an upper limit for instability of W = 1 .
In this study, pedestrian risk in the study area was evaluated through the four indicators defined in Equations (1) and (3)–(5), assuming a reference adult male with a height of 1.7 m and a weight of 70 kg. Although the four indicators were derived from different formulations, they were all calibrated against pedestrian stability experiments, and each has a defined non-walkable limit at the onset of instability. However, an assessment based solely on a single indicator can introduce uncertainty into the evaluation of pedestrian safety under extreme flooding conditions. To reduce the uncertainty associated with relying on a single criterion, the outcomes from the four indicators were combined through an ensemble-based average of their normalized hazard intensities, reflecting the level of agreement among the indicators in identifying pedestrian instability. This approach aims not to propose a new composite index but rather to provide a balanced interpretation that mitigates the bias arising from reliance on a single metric. Future studies could further refine this framework by applying weighted combinations or probabilistic methods to account for the varying reliability of different indices.

2.3. Flood Risk Score Estimation

Based on the pedestrian safety assessment results, the flood risk scores of inundated areas were calculated using Equations (1) and (4)–(6). Since the four indicators have different numerical ranges, each was converted into a dimensionless risk scale within 0–1 for comparability across indicators, except for H R , which already ranges between 0 and 1. For Equation (1), F I values above the Significant hazard level (≥1.25) were considered the non-walkable limit, and the normalized score of F I ( F I s ) was defined as
F I s = F I / 1.25
For Equation (4), the ratio of water depth to the critical depth ( h c r ) was applied, and depths greater than h c r were assigned a value of 1:
h c r s = m i n ( 1 , h / h c r )
where h c r s is the normalized score of h c r . In Equation (5), values of W greater than 1 are considered the non-walkable limit, and the score was defined as
W s = m i n ( 1 , W )
where W s is the normalized score of W . Each indicator was converted into an identical dimensionless risk scale, allowing direct comparison across indicators in terms of whether each region is walkable or not. To address uncertainty arising from the selection of individual indicators, an ensemble-based averaging approach was adopted, which aggregates the four normalized instability scores and evaluates each inundated cell according to the degree of consensus among the indicators regarding non-walkability. The integrated instability index for the ith computational cell ( w i ) was defined as
w i = 1 4 ( F I s + H R s + h c r s + W s ) i
where w i denotes the ensemble-averaged relative pedestrian instability, obtained by averaging the normalized values of the four indicators. This ensemble-based averaging does not assume linear proportionality among indicators but provides a non-parametric integration of dimensionless instability metrics sharing the same physical meaning. Based on these values, the overall pedestrian flood risk across the study domain was quantified as the area-weighted average risk score:
R i s k   S c o r e   ( % ) = i = 1 n w i A i / A f
where A i and A f denote the area of cell i and the total flooded area (m2), respectively, and n is the number of flooded cells. This area-weighted risk score provides a robust indicator of pedestrian safety by reducing sensitivity to the choice of individual indicators.

2.4. Design Rainfall

In this study, the impact of rainfall pattern changes on inundation extent and pedestrian safety was analyzed by generating design rainfall using the Huff quartile method [30]. The Korean Ministry of Land, Transport, and Maritime Affairs (MLTM) [31] provides rainfall intensity equations for the Gwangju region, expressed as
I = a T + 54 b
where I is the rainfall intensity (mm/h), T is the rainfall duration (min), and a and b are empirical parameters. Table 2 presents values for empirical parameters for the rainfall intensity. Rainfall distributions were generated as time series using the design rainfall generator implemented in PCSWMM, which applies Huff’s quartile method. The rainfall distributions considered return periods ranging from the 50-year design criterion commonly used for disaster prevention planning to the extreme case of the 500-year rainfall event. To capture variations in inundation under different rainfall patterns, design storms with durations of 1, 2, 3, 6, and 12 h were generated. Among these generated rainfall scenarios, Figure 3 presents the 6 h design storms with varying Huff quartiles and return periods, with the total cumulative rainfall for each return period shown in the legend.

3. Results

3.1. Inundation Simulation Results

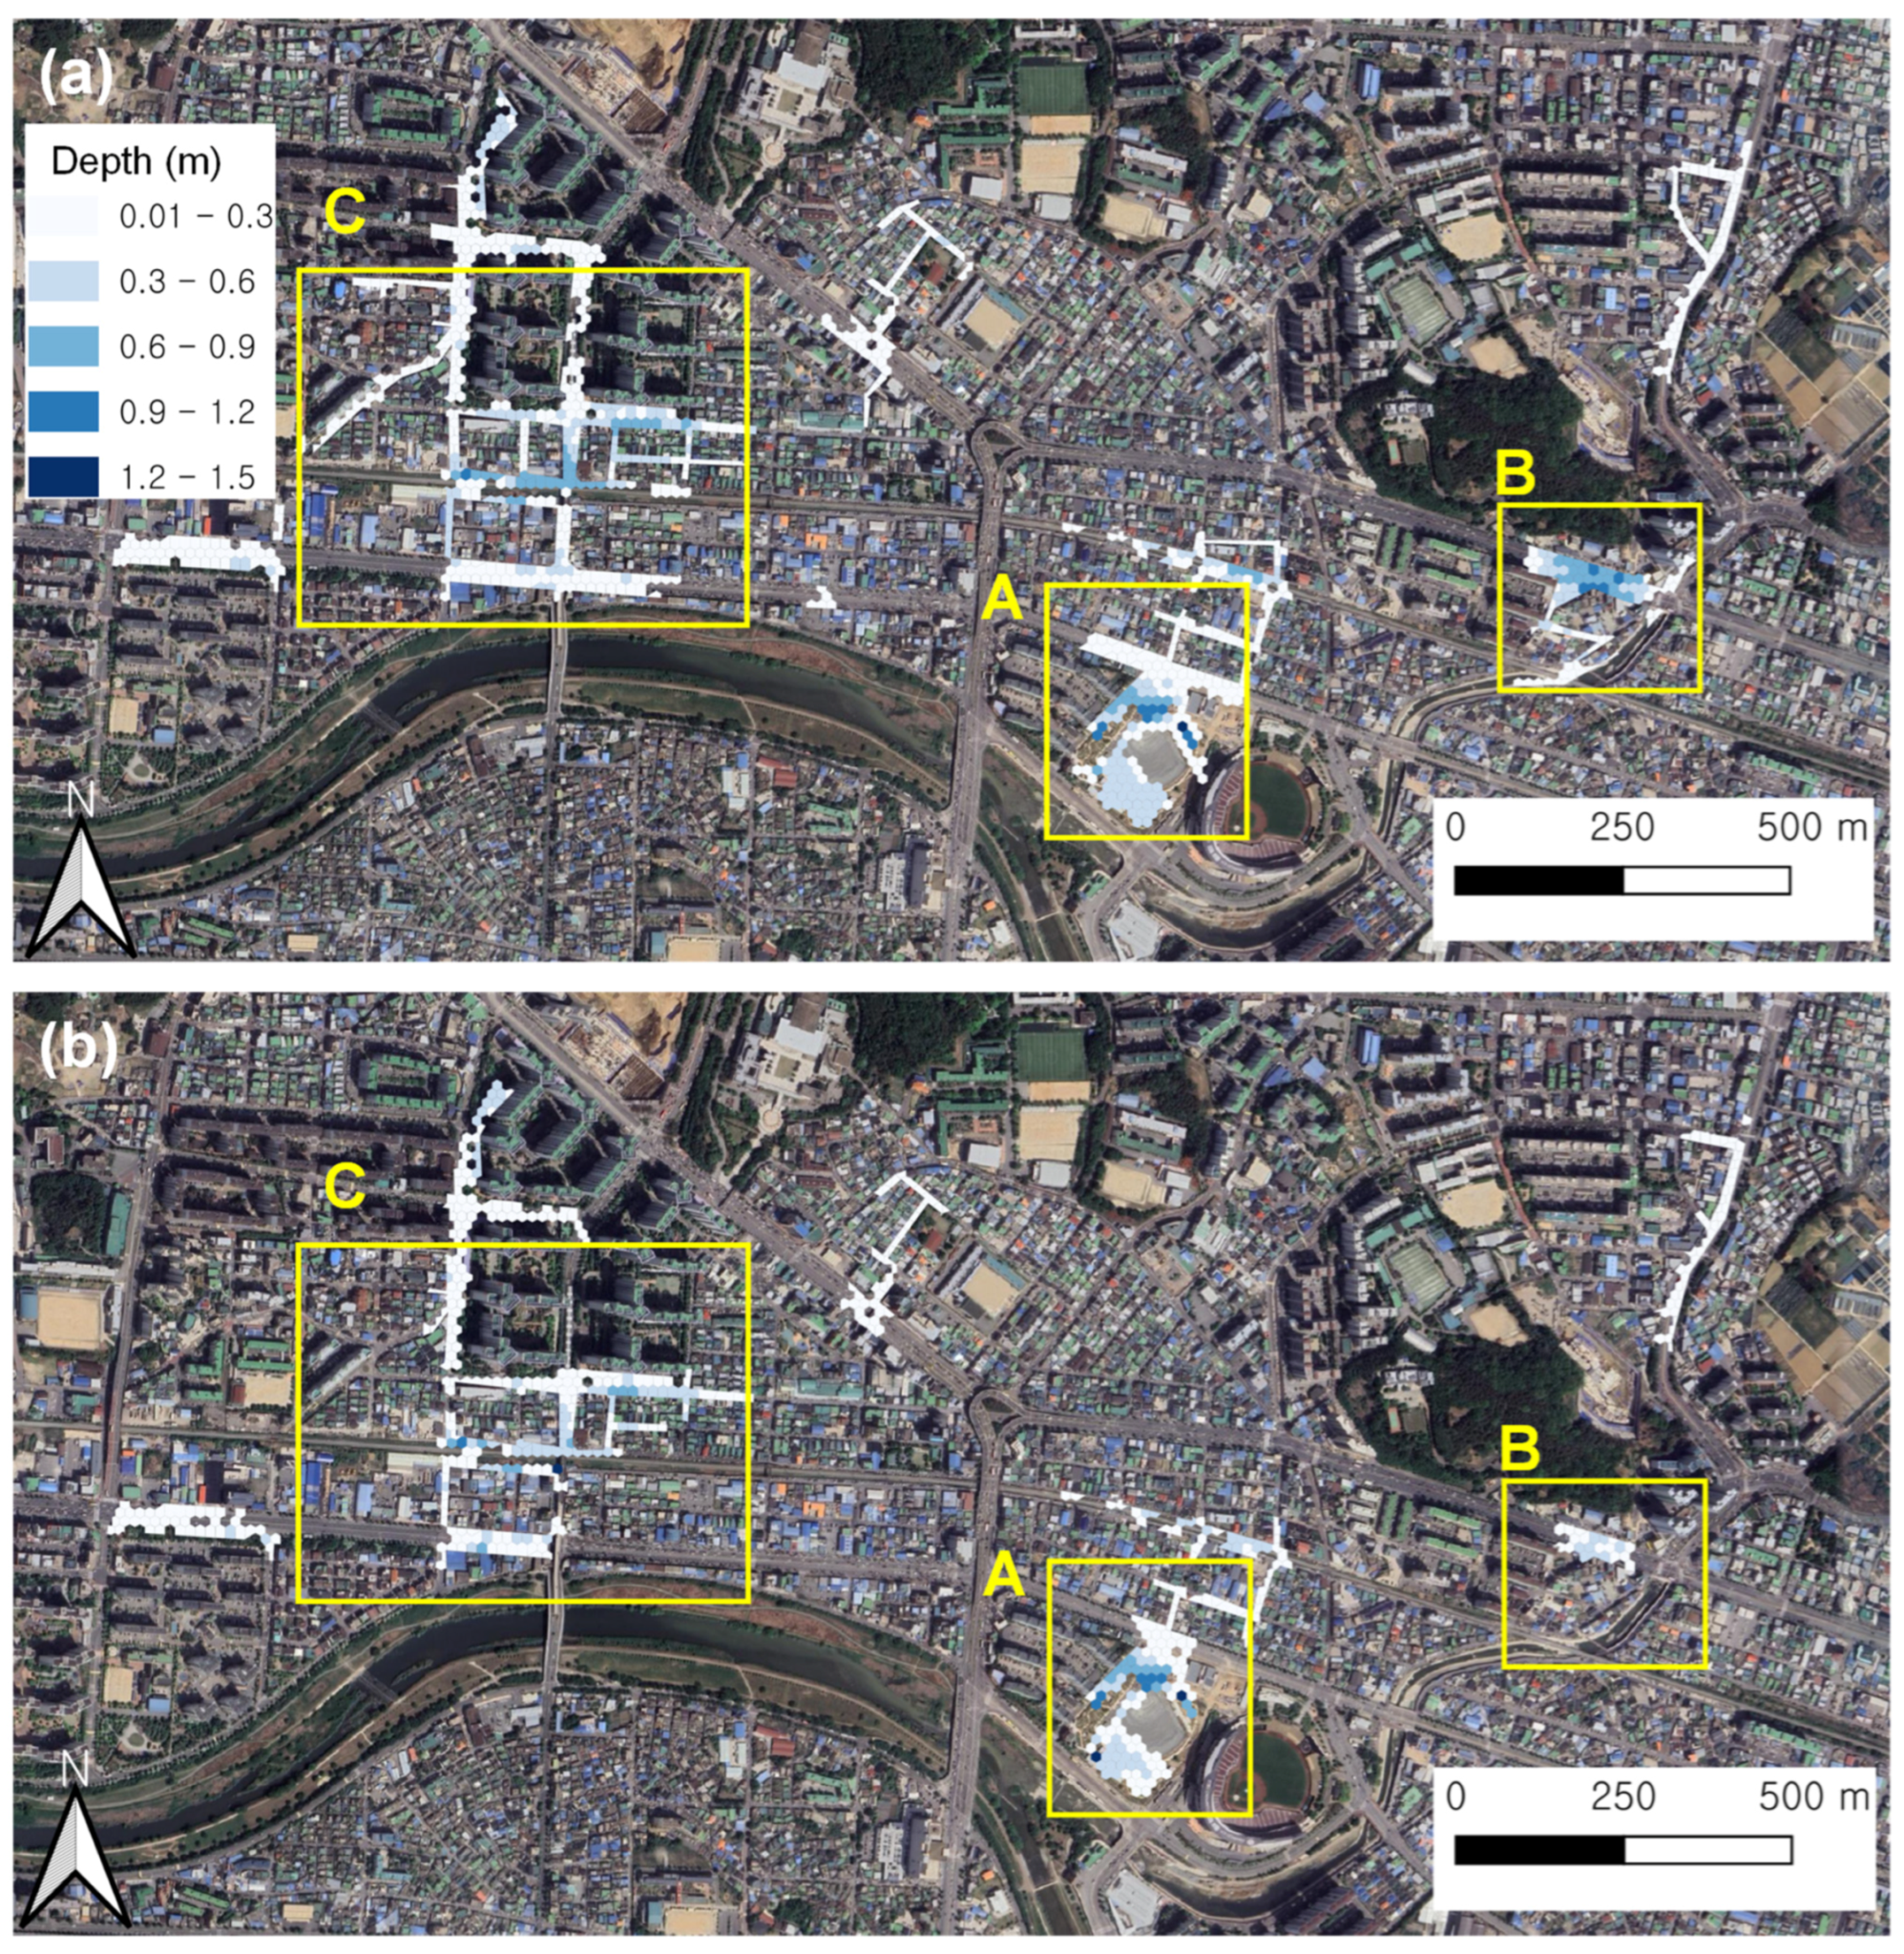
Inundation maps were analyzed to investigate the variations in flooded areas with rainfall intensity and duration. Figure 4 presents the results for the 500-year, third-quartile rainfall distribution with durations of 1 h and 12 h. Major inundation zones were consistently identified at the sports stadium (A), the intersection (B), and the residential complex (C), similar to those in the 2020 rainfall event (see Figure 2). The intense 1 h rainfall caused sewer system overloading, resulting in an expansion of the inundated area. In contrast, under the 12 h rainfall duration, the extended rainfall duration spread the rainfall intensity over time and alleviated peak overloading of the sewer system, leading to a reduction in the inundated area.
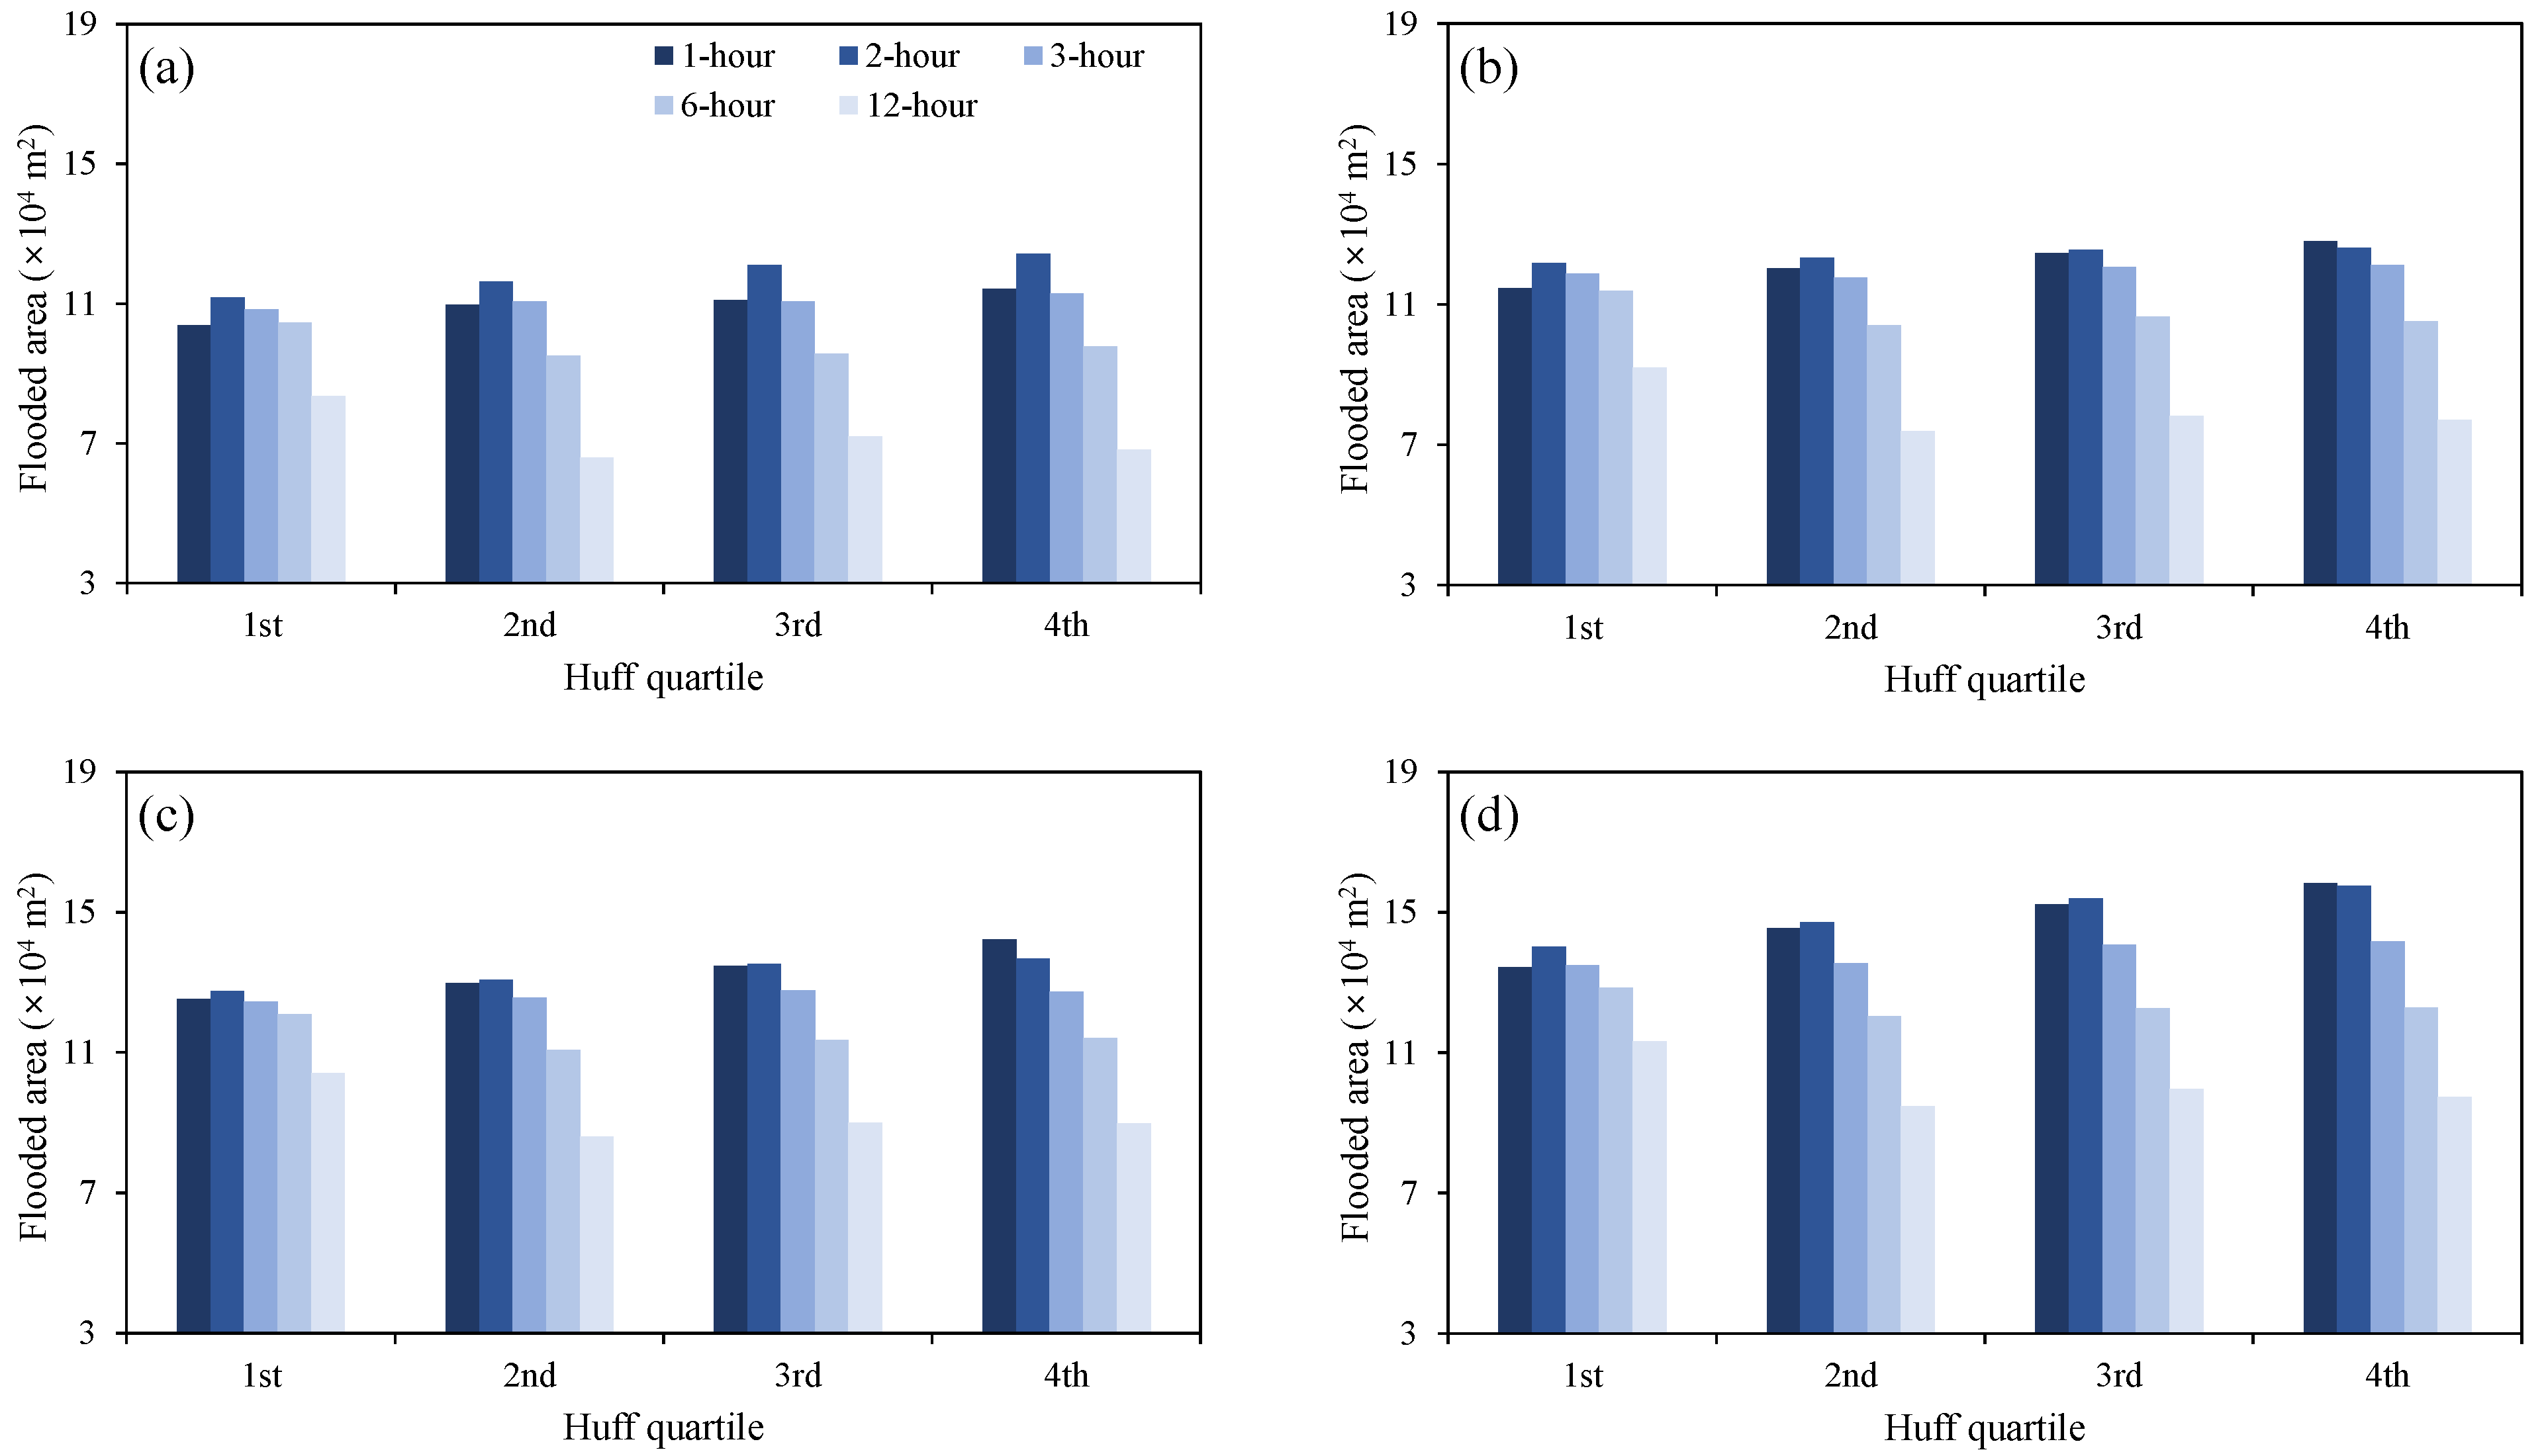
Figure 5 presents the variation in the inundated area with the rainfall duration (1–12 h), return period (50–500-year), and distribution (Huff 1st–4th quartile). Overall, inundated areas ranged from 6.6 × 10⁴ to 15.8 × 10⁴ m2, equivalent to 6.3–15.1% of the study area, and increased with the return period. In all cases, inundation generally decreased with increasing rainfall duration, although differences were observed among rainfall distributions. For short durations (1–3 h), larger inundated areas were observed under the Huff third- and fourth-quartile distributions, where peak rainfall occurred in the latter part of the storm. For longer durations (6–12 h), inundation increased under the Huff first-quartile distribution, in which peak rainfall occurred in the early stage. The maximum inundated area was generally produced by the 1 h duration, fourth-quartile rainfall distribution, with the exception of the 50-year return period event, where the maximum inundation occurred under the 2 h duration, fourth-quartile distribution.

3.2. Stability Assessment

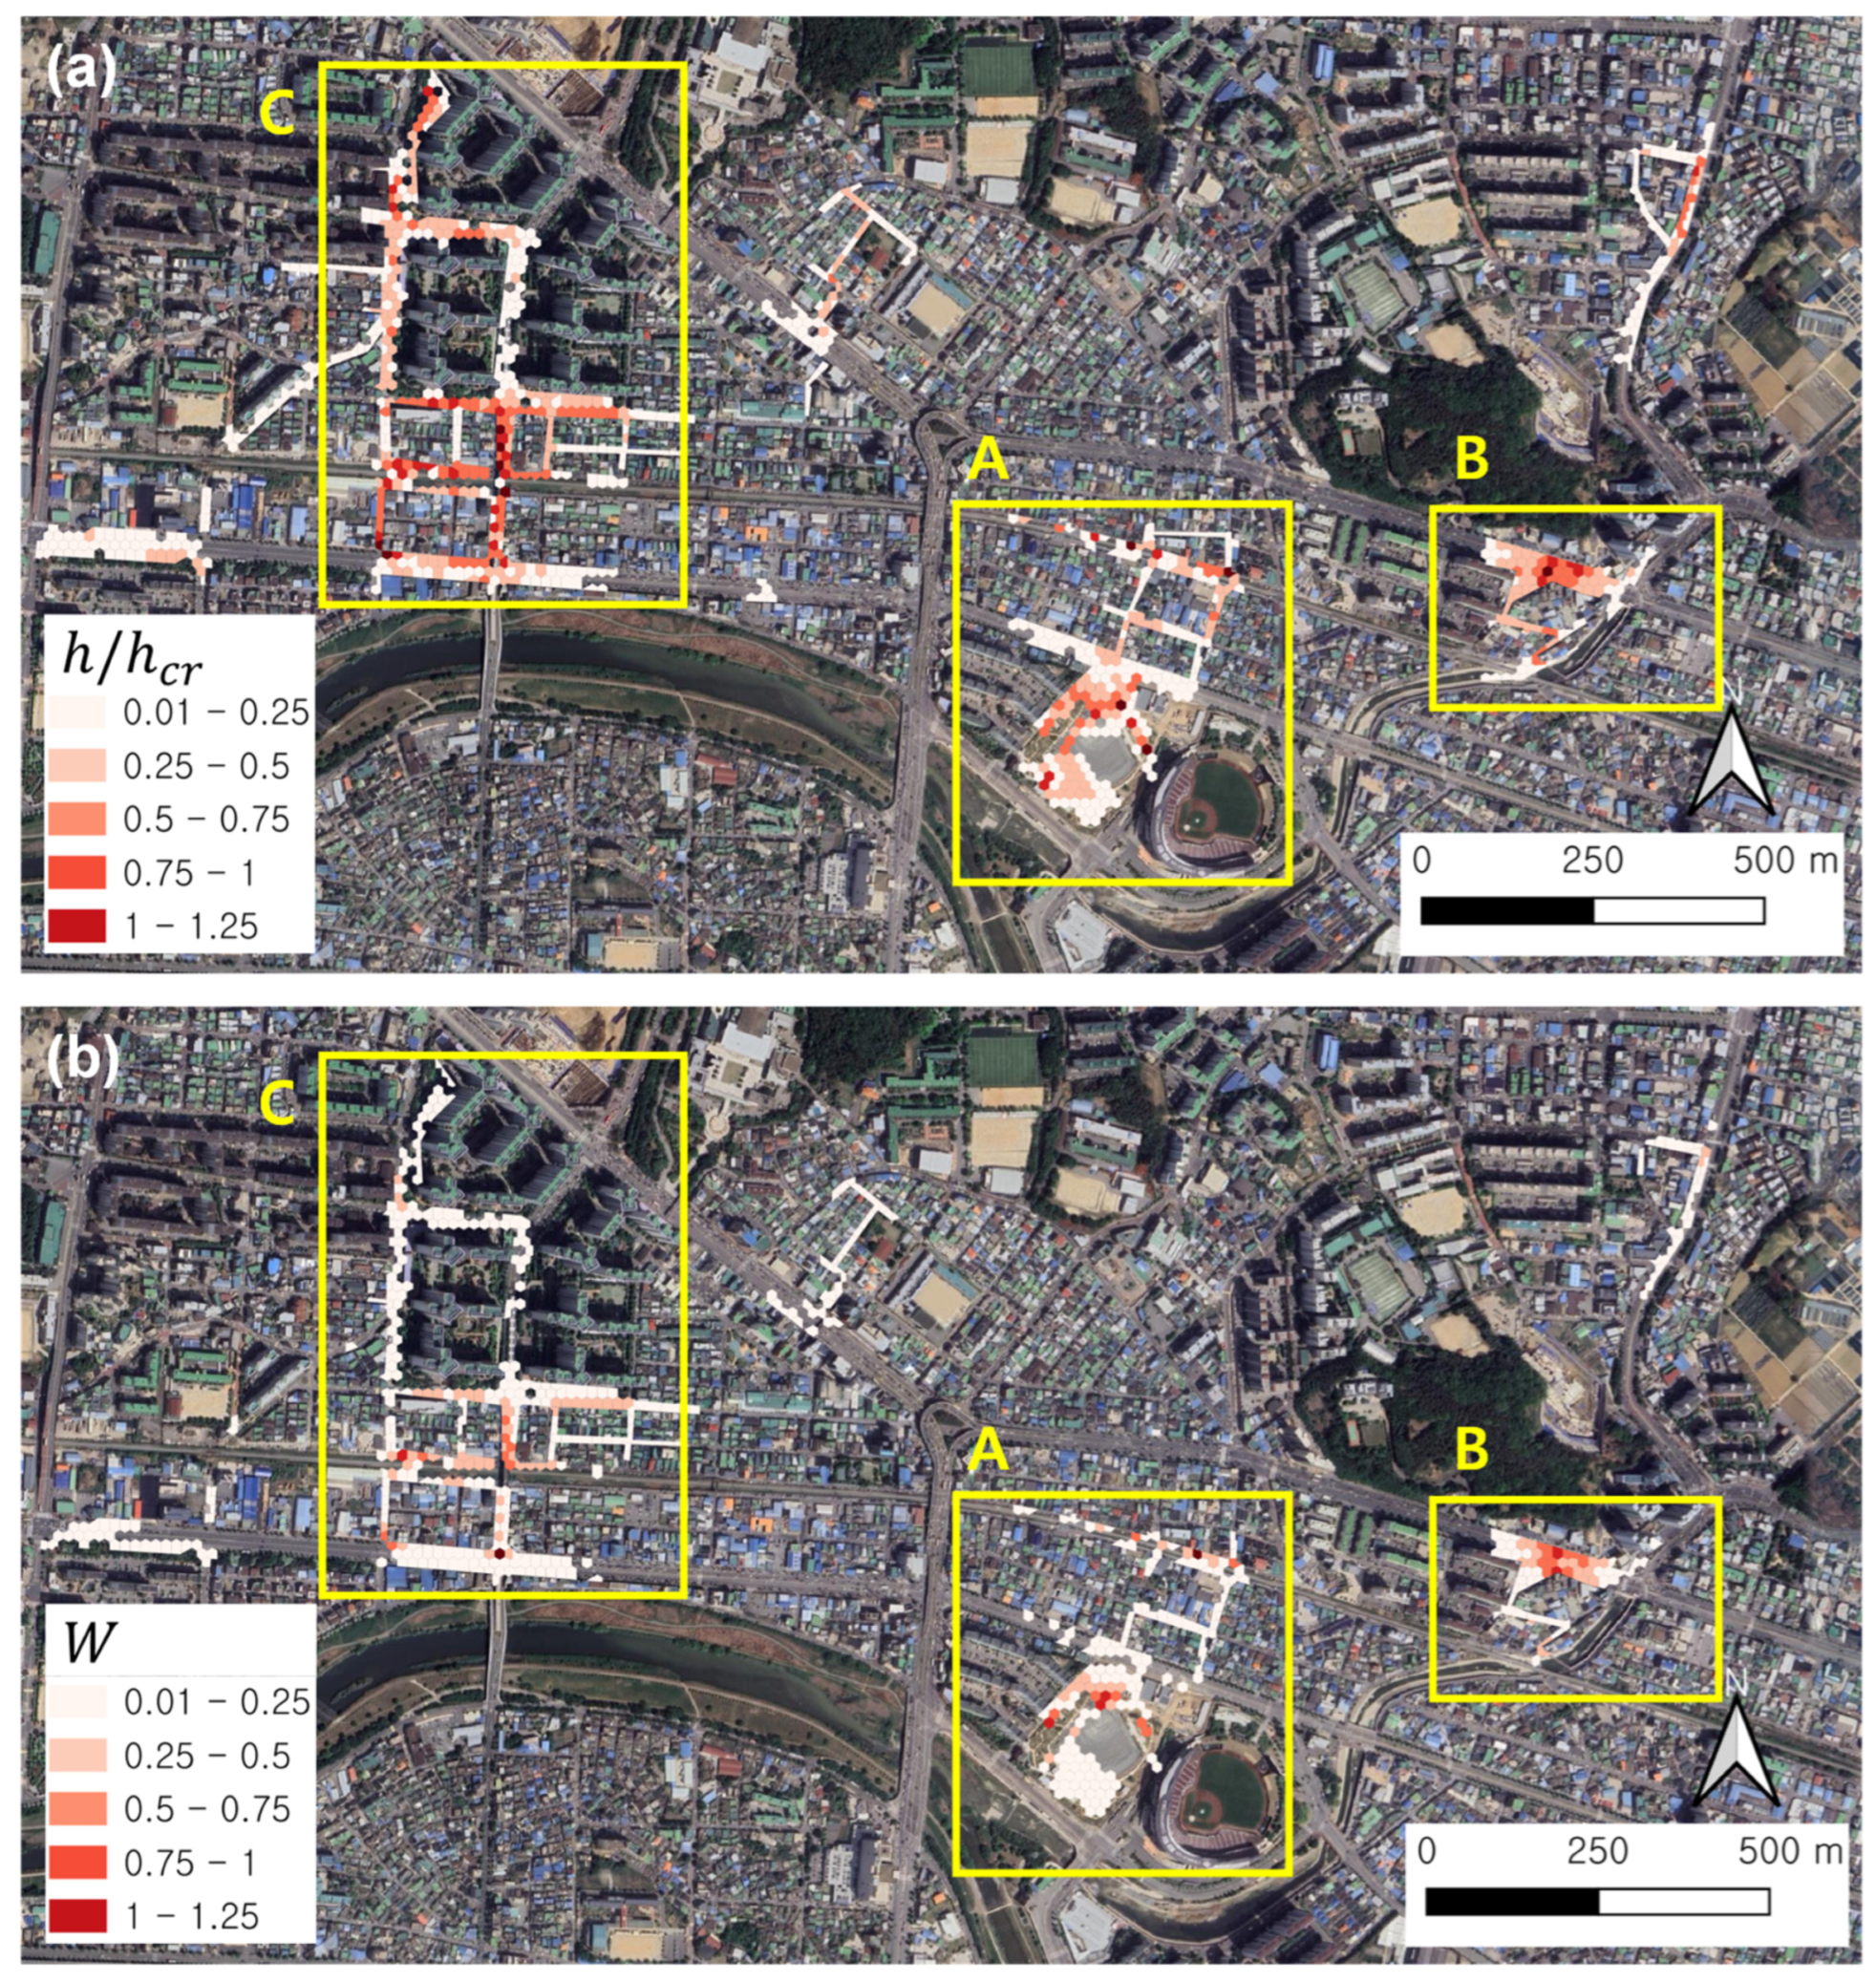
Pedestrian safety was assessed using W and h c r (Equations (5) and (6)) derived from the inundation simulation results. Figure 6 illustrates the outcomes for the 500-year return period with a 1 h duration and fourth-quartile rainfall distribution, which produced the largest inundated area among all cases. Areas classified as non-walkable ( W > 1 and h / h c r > 1 ) are shown in dark red. Both indicators identified relatively high risks in Sections A (stadium), B (intersection), and C (apartment complex), but the extent of non-walkable areas varied between the indicators. The non-walkable area for h / h c r (3014.8 m2) was larger than that for W (2452.8 m2), indicating that the choice of indicator substantially affected the results. Specifically, in Section A (stadium), non-walkable areas under h / h c r were larger than those under W . In Section B (intersection), W did not identify non-walkable zones, whereas h / h c r classified the same cells as non-walkable. In Section C (apartment complex), the non-walkable area derived from h / h c r was also larger than that from W . These results demonstrate that different safety indicators yield divergent spatial assessments under the same inundation conditions.
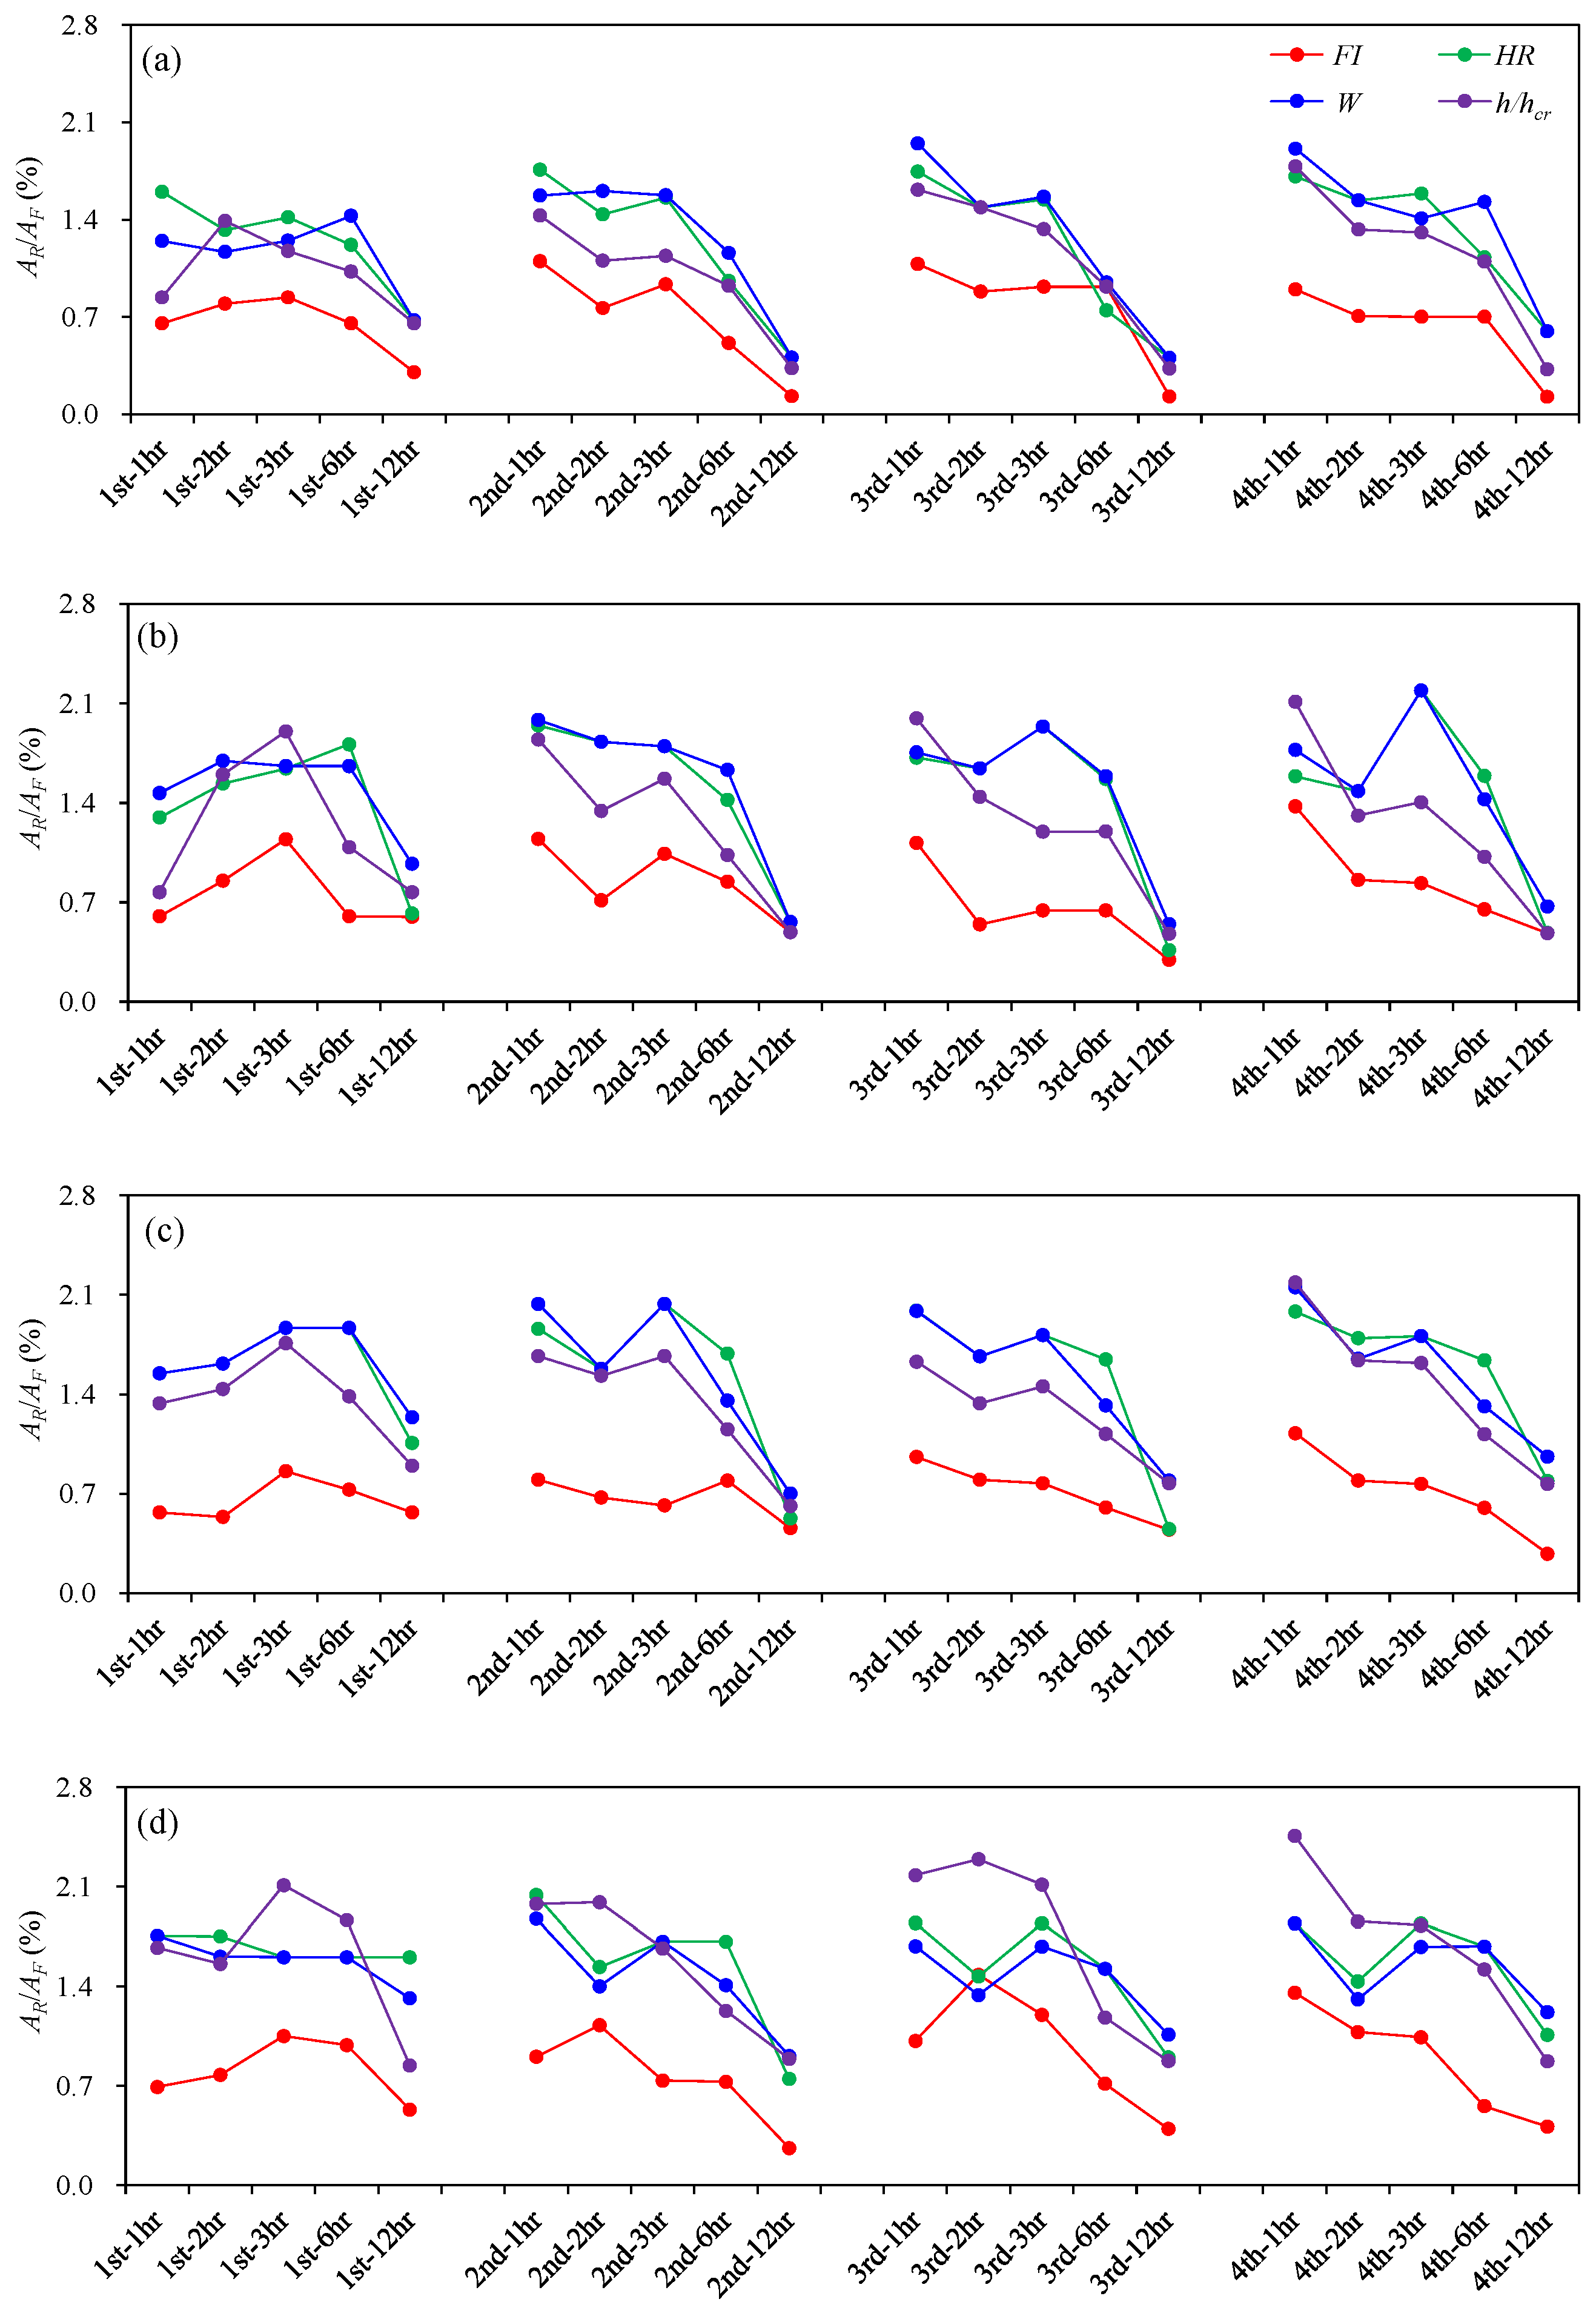
Figure 7 presents the ratio of non-walkable area ( A R ) to the total flooded area ( A F ) across all rainfall scenarios using the four indicators (Equations (1) and (4)–(6)). Depending on the safety indicator and rainfall scenario, 0.13–2.46% of the flooded area was classified as non-walkable. Among the indicators, F I consistently produced the smallest non-walkable areas, while H R , W , and h / h c r yielded larger and variable values depending on rainfall patterns. When averaged across rainfall durations to emphasize the effect of rainfall distribution, h / h c r produced the largest non-walkable areas under the fourth-quartile distribution for all return periods. F I showed maximum values under the third quartile for the 50- and 200-year events but under the fourth quartile for the 100- and 500-year events. Similarly, W and H R yielded maximum values under the fourth quartile for most return periods, except for the 100-year event, where the second quartile dominated. To examine the effect of rainfall duration, the quartile distributions were averaged. The maximum non-walkable areas generally occurred under 1 h storms, while H R occasionally produced maxima under 3 h storms for certain return periods. Overall, these results indicate that shorter storm durations and later-peaking rainfall distributions tend to increase non-walkable areas, although the magnitude of the response varies with the choice of safety indicator.

3.3. Flood Risk Score

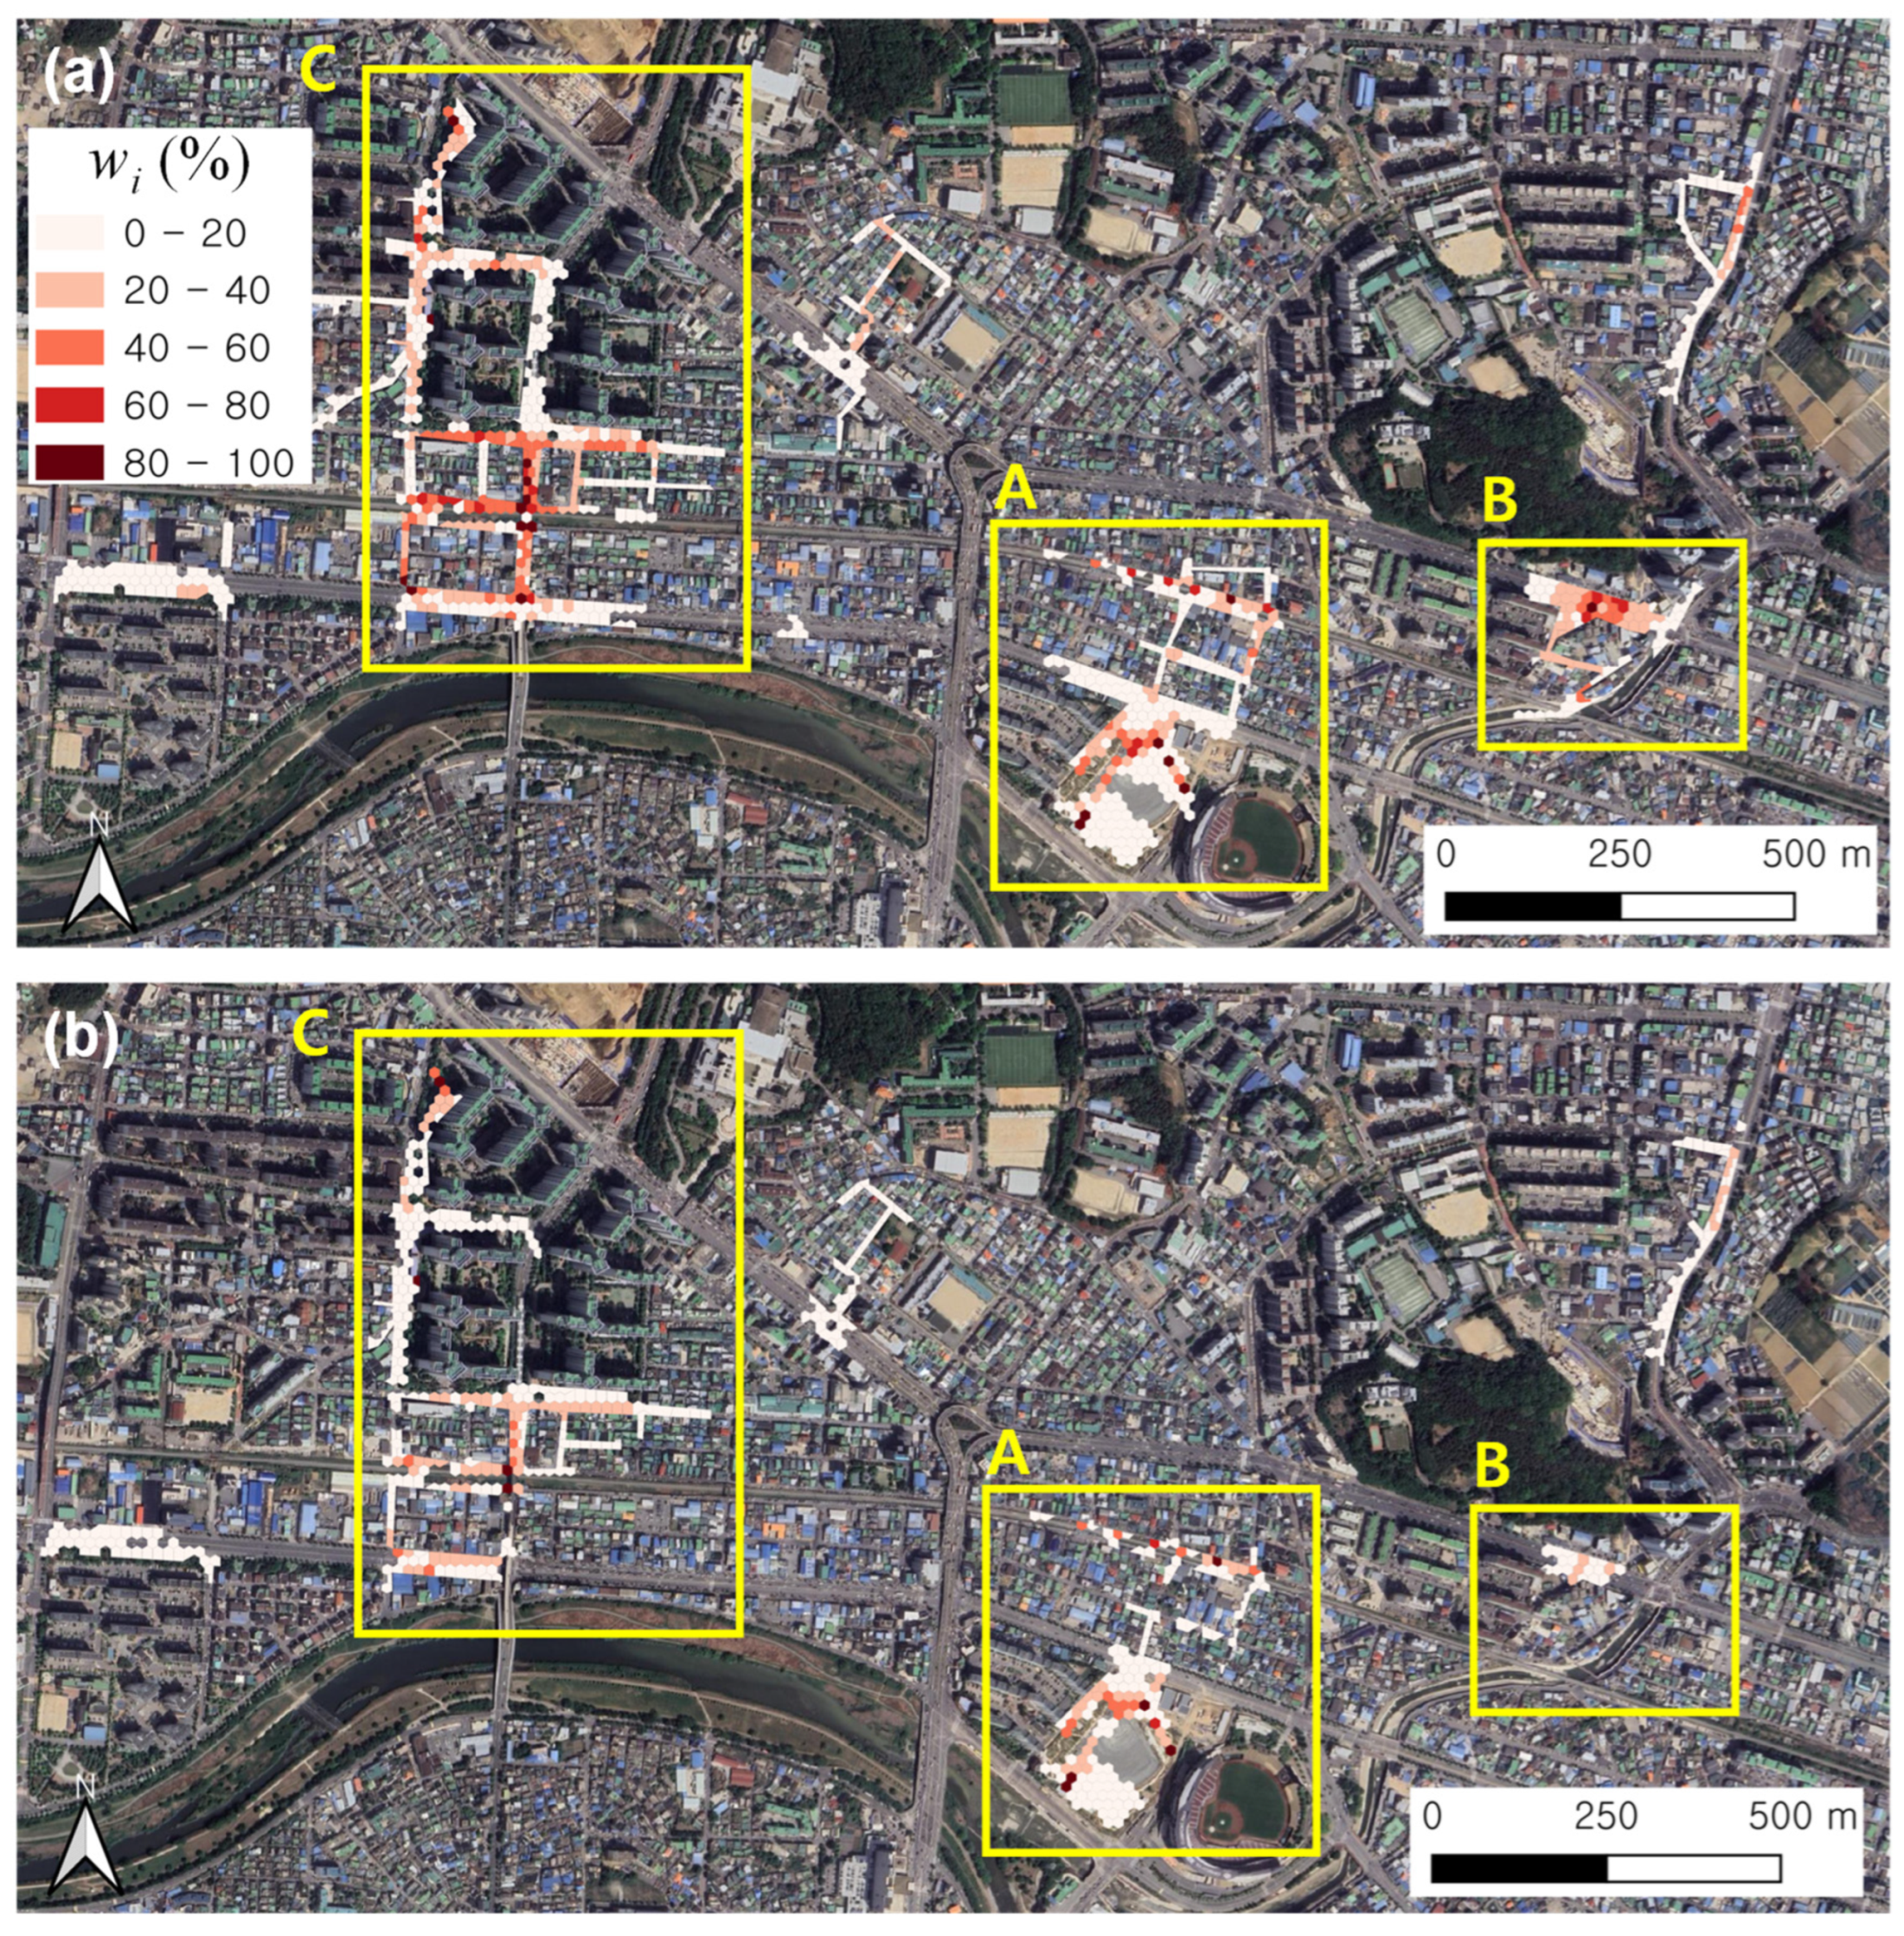
To reduce the uncertainty arising from the choice of safety indicators, the integrated instability index ( w i ) was calculated using Equation (10). Figure 8 presents the spatial distribution of w i for the 500-year, third-quartile rainfall event with different durations. Overall, the results indicate that pedestrian risk generally decreased as the rainfall duration increased from 1 h to 12 h. In particular, the risk was markedly reduced in Section B, whereas the intersection in Section C remained a high-risk zone, where w i exceeded 80%.
Figure 9 illustrates the risk scores calculated using Equation (11) across different rainfall scenarios. By applying w i , the variability in the safety assessment results was reduced, and a more systematic pattern emerged. The maximum risk scores increased with the return period, with values ranging from 15.6% to 18.9% across the rainfall patterns. The highest risk scores were consistently observed under the fourth-quartile distribution for each return period. With respect to rainfall duration, the maximum risk scores were generally found for 1 h or 2 h storms, except for the first-quartile scenarios of the 200- and 500-year return periods, which showed the maximum for a 3 h duration. These results are consistent with the patterns shown in Figure 5, where 2 h storms produced relatively larger flooded areas. This relationship suggests that greater inundation extents are generally associated with higher pedestrian risk, as risk scores also account for the combined effects of flow depth and velocity.
Although the domain-level risk scores (15.6–18.9%) represent moderate values, they correspond to the area-weighted mean of relative pedestrian instability across flooded cells, rather than the proportion of cells where complete walking failure occurs. Thus, they describe the overall exposure of pedestrians to unstable conditions, including discomfort and mobility disruption, rather than immediate physical collapse. Localized zones, such as the street in Section C shown in Figure 8, exhibited w i values exceeding 0.8, indicating clusters that were nearly non-walkable even when the domain-averaged risk level remained relatively low. This suggests that the ensemble-based approach not only yields stable hazard patterns across rainfall scenarios but also reveals local hotspots of pedestrian risk that would be overlooked if only domain-averaged values are considered.

4. Discussion

4.1. Relationship Between Rainfall Patterns and Pedestrian Safety

The inundation analyses revealed that both the rainfall duration and temporal distribution exert significant influences on the extent of flooding (see Figure 5). For short-duration storms (1–3 h), the inundated area was most pronounced under the Huff third- and fourth-quartile distributions, reflecting the impact of late-peaking rainfall that intensifies sewer system surcharge once capacity has already been exceeded. In contrast, for longer durations (6–12 h), the extended distribution of rainfall alleviated peak loading of the sewer system during sustained rainfall. Under these conditions, the first-quartile distribution produced larger inundated areas because early peaks triggered surcharge conditions that were maintained throughout the event. These findings highlight the dual role of storm duration and peak timing. In short, concentrated storms, inundation intensifies when the peak occurs later, whereas in longer storms, flooding is more sensitive to early peaks.
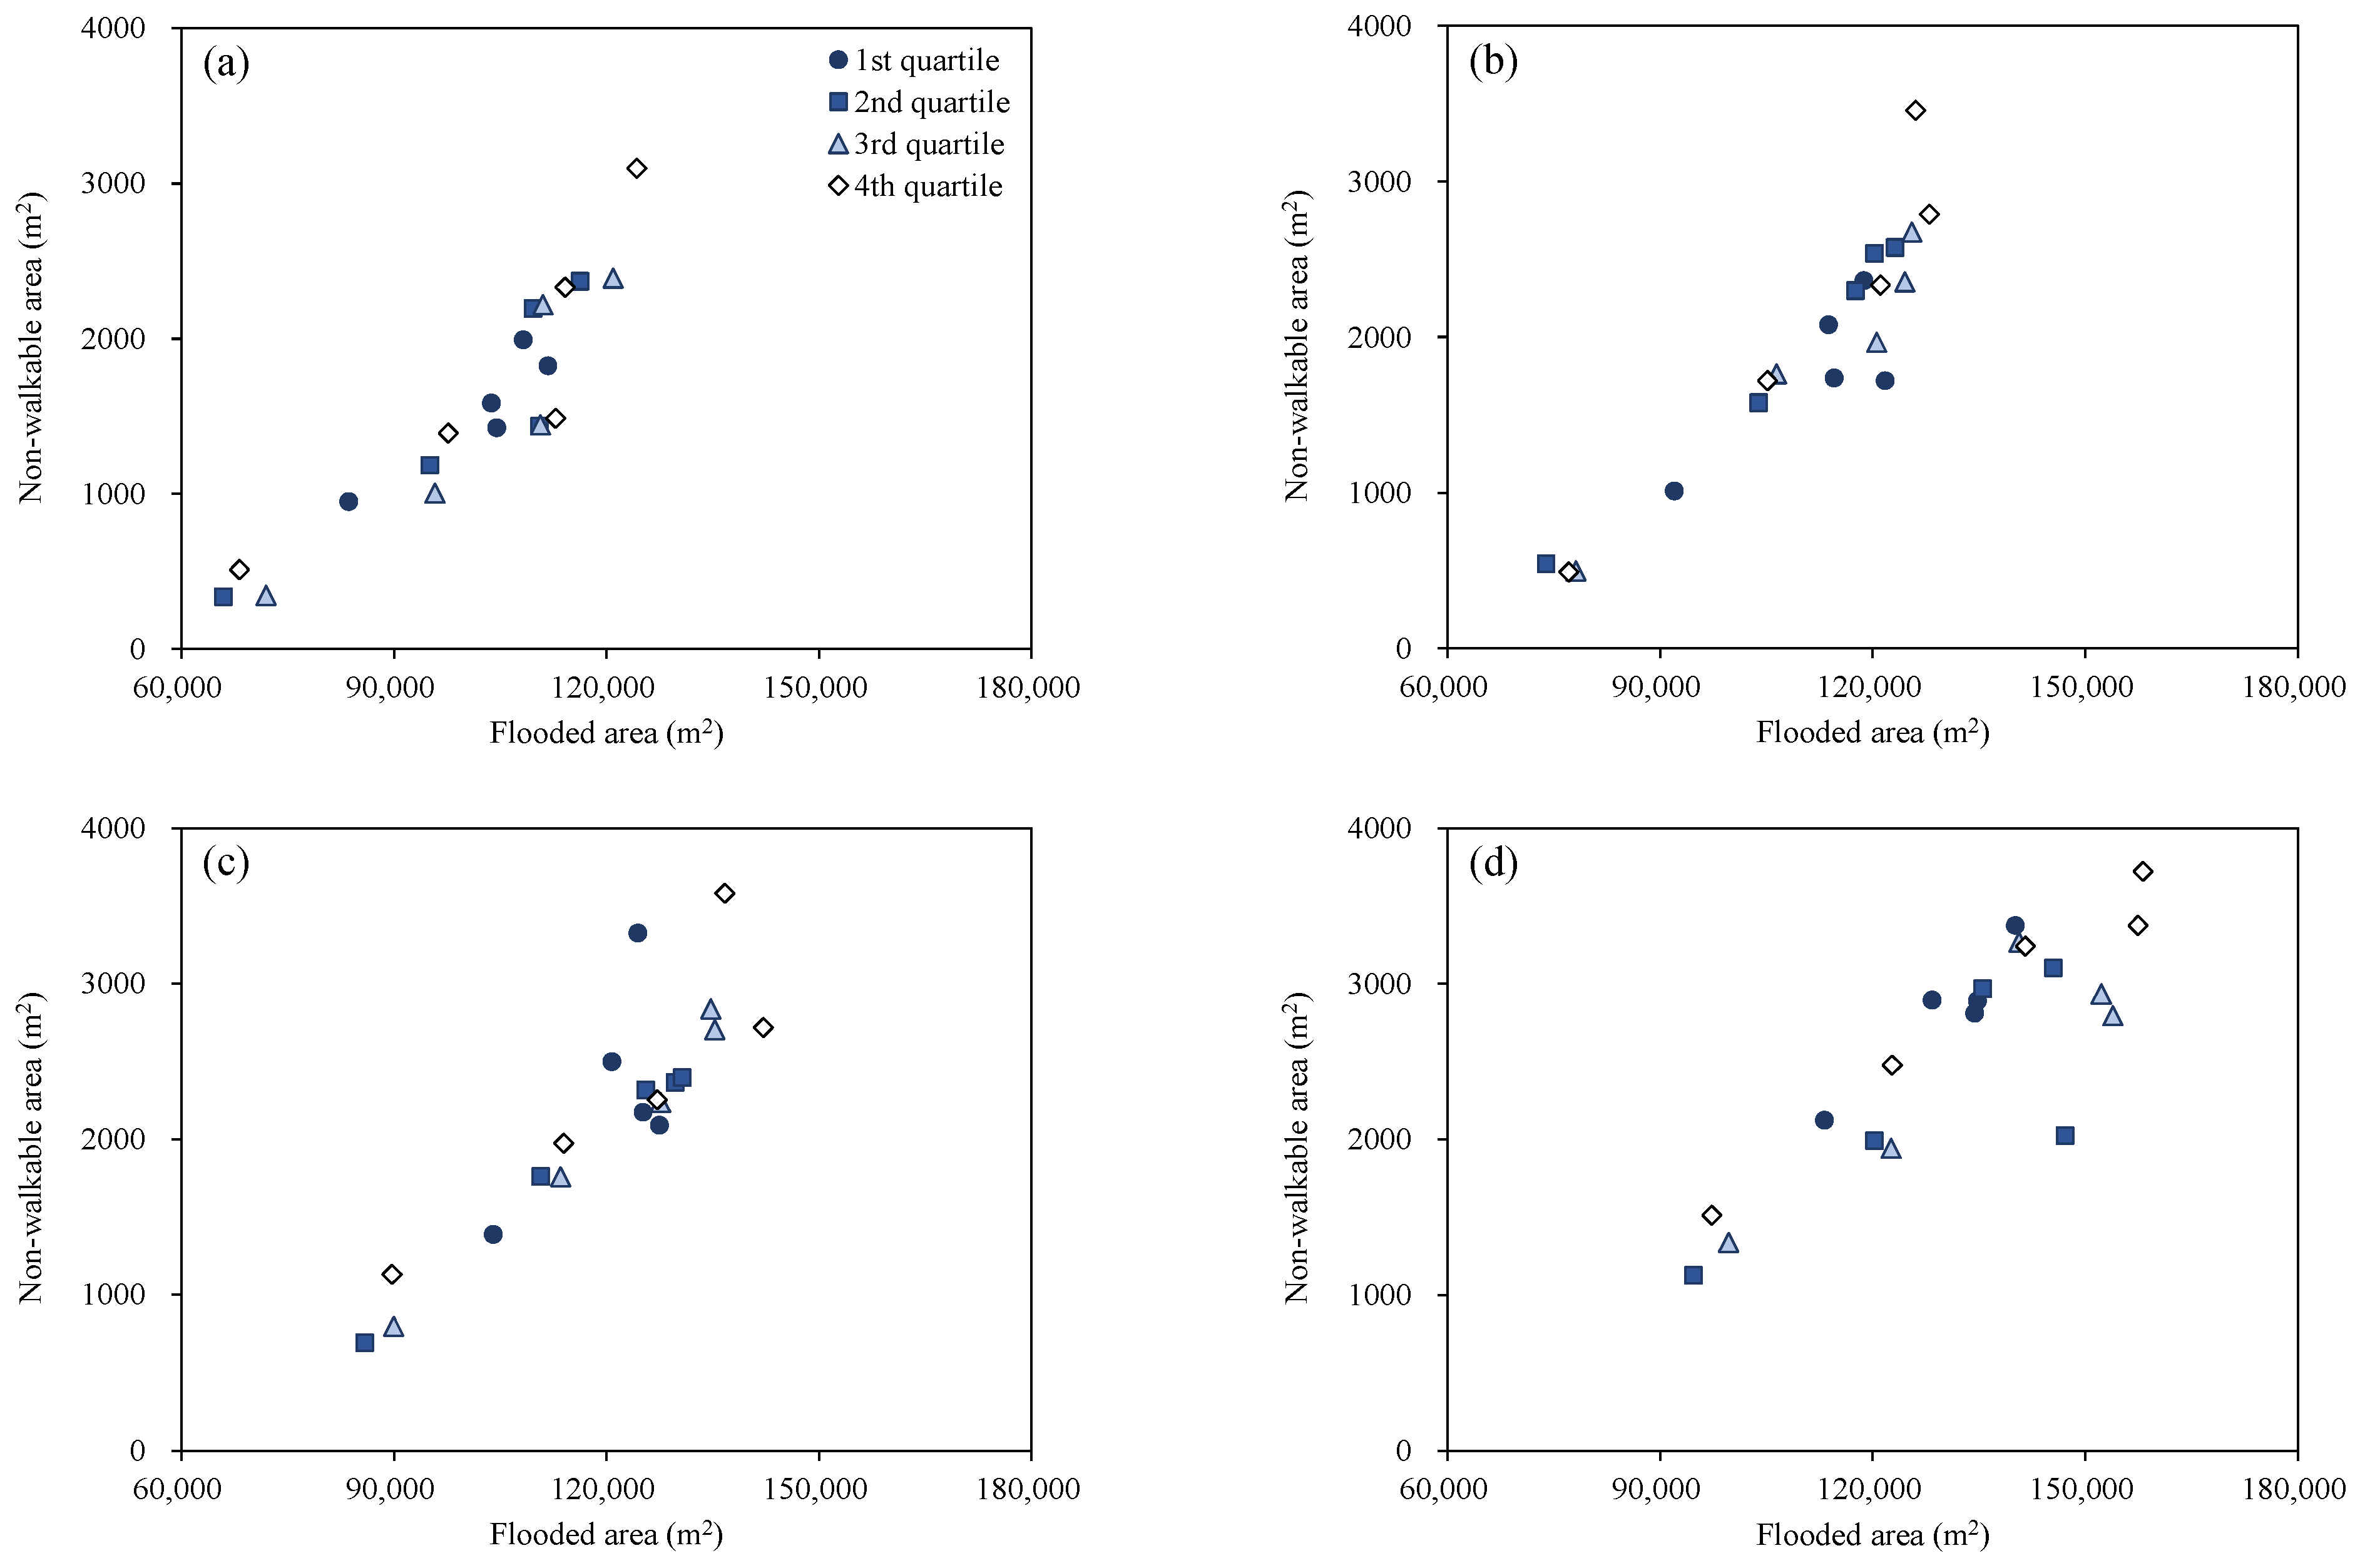
The occurrence of flooded areas directly affects pedestrian safety, and variations in rainfall distribution and duration consequently influence the extent of non-walkable areas. Figure 10 illustrates the relationship between the flooded area and non-walkable area, where the latter was defined as the area with w i exceeding 0.75, as calculated by Equation (11). Across all rainfall distributions, a linear relationship was observed between the flooded area and non-walkable area. Accordingly, under short-duration storms, non-walkable areas expanded under the Huff third and fourth quartiles, while for long-duration storms, the first quartile produced greater non-walkable areas. In particular, under the 1 h, fourth-quartile rainfall scenario, the non-walkable area was maximized across all return periods except for the 200-year storm, which showed maxima for 2 h, fourth-quartile rainfall, indicating that short, intense storms substantially increase pedestrian risk zones. These results suggest that to mitigate urban flood risk, strategies such as detention facilities or additional pumping capacity are required to alleviate sewer system overload during short-duration, high-intensity rainfall events.

4.2. Uncertainty from Safety Index Selection

Citizen evacuation planning relies heavily on pedestrian safety assessments under storm events, and these outcomes are influenced not only by rainfall patterns but also by the selection of safety indicators. As shown in Figure 7, the non-walkable area estimates varied considerably with the choice of indicator ( F I , H R , W , and h c r ), introducing substantial uncertainty into the safety evaluation. Such variability may lead to underestimation or overestimation of hazardous zones, thereby delaying evacuation decisions or leading to the misallocation of protective resources.
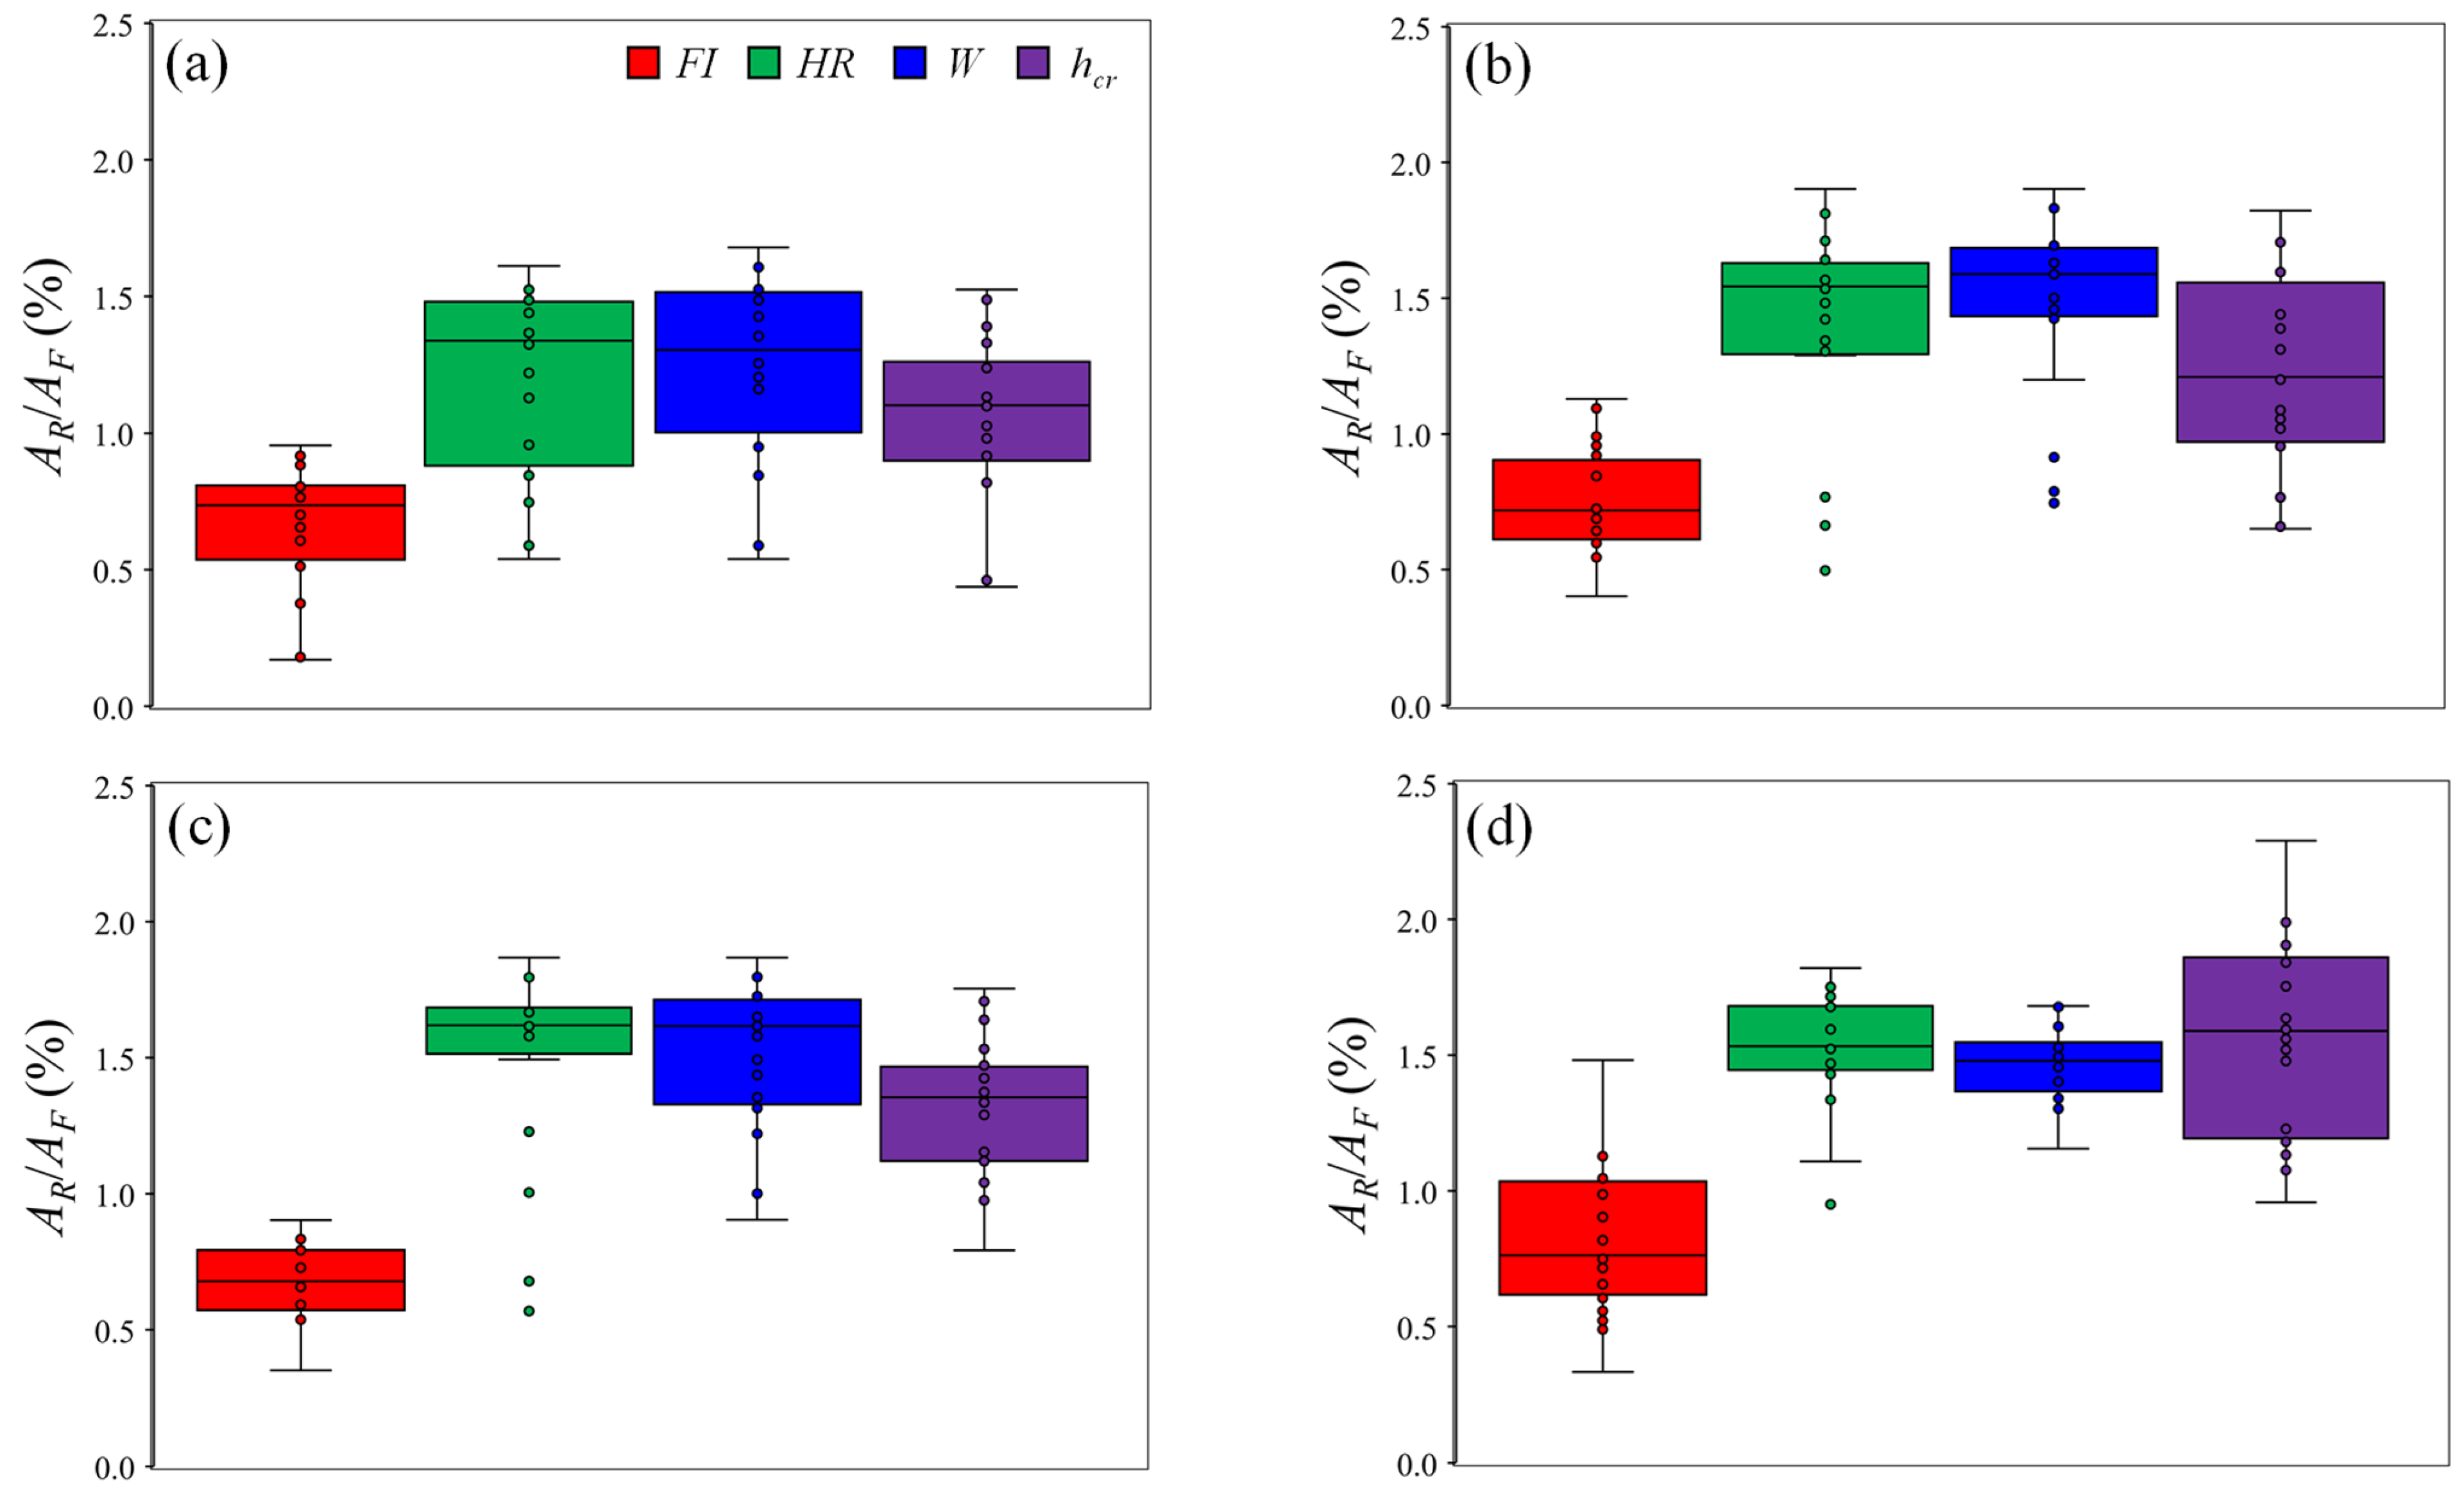
Figure 11 presents the safety assessment distributions corresponding to the determination of the safety indicators under variations in Huff’s quartile and rainfall duration. As the return period increased, the discrepancies caused by the rainfall distribution and duration tended to diminish. However, inter-indicator variability remained significant. H R and W generally yielded consistent estimates, while F I systematically underestimated non-walkable areas. This difference arises because F I is derived from flood intensity as an empirical criterion based on limited prototype experiments [14,32], whereas H R , W , and h c r are grounded in force-balance formulations and calibrated against extensive datasets from human model and prototype experiments [8,13,16]. Accordingly, H R , W , and h c r provide more conservative and robust thresholds, aligning with broader experimental evidence. At the same time, there have been criticisms of the experimental conditions, particularly the limited representation of body size, sex, and age among the test subjects, which increases uncertainty [16]. Therefore, it is difficult to determine which of the indicators reviewed in this study provides the most realistic criterion for pedestrian safety. These findings underscore the necessity of integrating multiple safety indices to mitigate indicator-dependent uncertainty. Approaches such as ensemble-average aggregation (Equation (11)) may offer a more reliable representation of pedestrian risk, reducing sensitivity to any single criterion and thereby supporting more robust evacuation planning.

5. Conclusions

In this study, inundation analyses were conducted for a highly urbanized catchment to examine the impacts of rainfall scenarios on flooded areas. A weighting factor approach was further introduced to enhance the reliability of pedestrian safety assessments. The main conclusions are as follows:
  • The extent of urban inundation varied with both the rainfall duration and timing of peak rainfall. Under short-duration storms (1–3 h), the largest flooded areas occurred with the Huff third- and fourth-quartile distributions, whereas for long-duration storms (6–12 h), the Huff first and second quartiles produced the largest inundation.
  • Short-duration storms triggered early sewer system overloading, and when peak rainfall occurred in the latter stage, surcharge conditions were prolonged, leading to larger inundated areas. Conversely, long-duration storms distributed rainfall more evenly and generally alleviated sewer loads, although early-peaking storms still induced surcharge and expanded inundation.
  • Pedestrian safety assessment outcomes exhibited substantial variability depending on the choice of safety indicator. F I , based on flood intensity, systematically underestimated non-walkable areas compared with H R , W , and h c r , which are force-balance-based indicators.
  • Applying the integrated instability index that was the ensemble-average of the four safety indices reduced indicator-dependent uncertainty and revealed consistent patterns of pedestrian risk across rainfall scenarios. The most hazardous condition for pedestrians was identified as the 1 h duration, fourth-quartile storm among the scenarios considered.
Overall, the integrated instability index approach enabled more robust and reliable pedestrian safety evaluations. The results emphasize that short-duration storms with late-peaking rainfall pose the greatest threat to pedestrians in highly urbanized areas. Therefore, urban flood risk reduction requires measures such as increased storage, LID practices, and pumping station reinforcement to alleviate sewer system overloads. Although the present framework provides a consistent basis for evaluating pedestrian flood exposure, further calibration using observed instability or accident records will be essential to establish quantitative risk thresholds. Future studies should further refine safety assessments by integrating spatial rainfall variability and broader demographic data on pedestrian stability.

Author Contributions

Conceptualization, I.P. and D.L.; methodology, I.P. and D.L.; software, D.L.; validation, I.P., J.S., and D.S.R.; formal analysis, I.P. and D.L.; investigation, I.P.; resources, I.P. and D.L.; data curation, I.P. and D.L.; writing—original draft preparation, I.P. and J.S.; writing—review and editing, J.S. and D.S.R.; visualization, I.P. and D.L.; supervision, D.S.R.; project administration, D.S.R.; funding acquisition, D.S.R. All authors have read and agreed to the published version of the manuscript.

Funding

This research was supported by KICT Research Program (Project no. 20250284–001).

Data Availability Statement

The original contributions presented in this study are included in the article. Further inquiries can be directed to the corresponding author.

Acknowledgments

The research for this paper was carried out under the KICT Research Program (Project no. 20250284–001, Development of Digital Urban Flood Control Technology for the Realization of Flood Safety City) funded by the Ministry of Science and ICT.

Conflicts of Interest

The authors declare no conflicts of interest.

References

  1. United Nations Office for Disaster Risk Reduction (UNDRR). GAR 2025 Hazards: Floods. 2025. Available online: https://www.undrr.org/gar/gar2025/hazard-exploration/floods (accessed on 29 August 2025).
  2. Musolino, G.; Ahmadian, R.; Xia, J.; Falconer, R.A. Mapping the danger to life in flash flood events adopting a mechanics based methodology and planning evacuation routes. J. Flood Risk Manag. 2020, 13, e12627. [Google Scholar] [CrossRef]
  3. Di Mauro, M.; De Bruijn, K.M.; Meloni, M. Quantitative methods for estimating flood fatalities: Towards the introduction of loss-of-life estimation in the assessment of flood risk. Nat. Hazards 2012, 63, 1083–1113. [Google Scholar] [CrossRef]
  4. Guo, X.; Wang, W.; Fang, X.; Gong, Y.; Li, J.; Wang, M.; Li, X. Analysis of self-rescue possibilities for pedestrians in the aftermath of destabilization during a flood event. Water 2024, 16, 1218. [Google Scholar] [CrossRef]
  5. Abt, S.R.; Wittler, R.J.; Taylor, A.; Love, D.J. Human stability in a high flood hazard zone. J. Am. Water Resour. Assoc. 1989, 25, 881–890. [Google Scholar] [CrossRef]
  6. Russo, B.; Gómez, M.; Macchione, F. Pedestrian hazard criteria for flooded urban areas. Nat. Hazards 2013, 69, 251–265. [Google Scholar] [CrossRef]
  7. Martínez-Gomariz, E.; Gómez, M.; Russo, B. Experimental study of the stability of pedestrians exposed to urban pluvial flooding. Nat. Hazards 2016, 82, 1259–1278. [Google Scholar] [CrossRef]
  8. Xia, J.; Falconer, R.A.; Wang, Y.; Xiao, X. New criterion for the stability of a human body in floodwaters. J. Hydraul. Res. 2014, 52, 93–104. [Google Scholar] [CrossRef]
  9. Postacchini, M.; Bernardini, G.; D’Orazio, M.; Quagliarini, E. Human stability during floods: Experimental tests on a physical model simulating human body. Saf. Sci. 2021, 137, 105153. [Google Scholar] [CrossRef]
  10. Zhu, Z.; Zhang, Y.; Gou, L.; Peng, D.; Pang, B. On the physical vulnerability of pedestrians in urban flooding: Experimental study of the hydrodynamic instability of a human body model in floodwater. Urban Clim. 2023, 48, 101420. [Google Scholar] [CrossRef]
  11. Kim, M.; Park, J.; Lee, I.; Park, I. Pedestrian stability assessment and applicability analysis based on human model experiments in inundated flows. J. Korea Water Resour. Assoc. 2025, 58, 459–468. [Google Scholar]
  12. Arrighi, C.; Oumeraci, H.; Catelli, F. Hydrodynamics of pedestrians’ instability in floodwaters. Hydrol. Earth Syst. Sci. 2017, 21, 515–531. [Google Scholar] [CrossRef]
  13. Lazzarin, T.; Viero, D.P.; Molinari, D.; Ballio, F.; Defina, A. Flood damage functions based on a single physics- and data-based impact parameter that jointly accounts for water depth and velocity. J. Hydrol. 2022, 607, 127485. [Google Scholar] [CrossRef]
  14. Department of the Environment; Food and Rural Affairs (DEFRA); Environment Agency (EA). Flood Risks to People (Phase 2): Methodology; DEFRA: London, UK, 2006. [Google Scholar]
  15. Cox, R.J.; Shand, T.D.; Blacka, M.J. Australian Rainfall & Runoff Revision Project 10: Appropriate Safety Criteria for People. Stage 1 Report P10/S1/006; Engineers Australia: Barton, ACT, Australia, 2010; ISBN 978-0-85825-945-4. [Google Scholar]
  16. Kvočka, D.; Falconer, R.A.; Bray, M. Flood hazard assessment for extreme flood events. Nat. Hazards 2016, 84, 1569–1599. [Google Scholar] [CrossRef]
  17. Tingsanchali, T.; Promping, T. Comprehensive Assessment of Flood Hazard, Vulnerability, and Flood Risk at the Household Level in a Municipality Area: A Case Study of Nan Province, Thailand. Water 2022, 14, 161. [Google Scholar] [CrossRef]
  18. Dong, B.; Xia, J.; Wang, X. Comprehensive flood risk assessment in highly developed urban areas. J. Hydrol. 2025, 648, 132391. [Google Scholar] [CrossRef]
  19. Li, Y.; Peng, S.; Xu, J.; Xu, T.; Gao, J. Hydrodynamic model-based flood risk of coastal urban road network induced by storm surge during typhoon. Sustain. Cities Soc. 2025, 121, 106250. [Google Scholar] [CrossRef]
  20. Li, Q.; Xia, J.; Dong, B.; Liu, Y.; Wang, X. Risk assessment of individuals exposed to urban floods. Int. J. Disaster Risk Reduct. 2023, 88, 103599. [Google Scholar] [CrossRef]
  21. Lee, Y.H.; Keum, H.J.; Han, K.Y.; Hong, W.H. A hierarchical flood shelter location model for walking evacuation planning. Environ. Hazards 2021, 21, 432–455. [Google Scholar] [CrossRef]
  22. Corzo Perez, G.A.; Sanchez Tapiero, D.I.; Contreras Martínez, M.A.; Zevenbergen, C. Development of a hazard risk map for assessing pedestrian risk in urban flash floods: A case study in Cúcuta, Colombia. River 2024, 3, 8–23. [Google Scholar] [CrossRef]
  23. Evans, B.; Lam, A.; West, C.; Ahmadian, R.; Djordjević, S.; Chen, A.; Pregnolato, M. A combined stability function to quantify flood risks to pedestrians and vehicle occupants. Sci. Total Environ. 2024, 908, 168237. [Google Scholar] [CrossRef]
  24. Shin, J.; Rhee, D.S.; Park, I. Analysis of inundation flow characteristics and risk assessment in a subway model using flow simulations. Appl. Sci. 2024, 14, 8096. [Google Scholar] [CrossRef]
  25. Sidek, L.M.; Chua, L.H.C.; Azizi, A.S.M.; Basri, H.; Jaafar, A.S.; Moon, W.C. Application of PCSWMM for the 1-D and 1-D–2-D Modeling of Urban Flooding in Damansara Catchment, Malaysia. Appl. Sci. 2021, 11, 9300. [Google Scholar] [CrossRef]
  26. Manchikatla, S.K.; Umamahesh, N.V. Simulation of flood hazard, prioritization of critical sub-catchments, and resilience study in an urban setting using PCSWMM: A case study. Water Policy 2022, 24, 1247–1268. [Google Scholar] [CrossRef]
  27. Bibi, T.S.; Kara, K.G.; Bedada, H.J.; Bededa, R.D. Application of PCSWMM for assessing the impacts of urbanization and climate changes on the efficiency of stormwater drainage systems in managing urban flooding in Robe town, Ethiopia. J. Hydrol. Reg. Stud. 2023, 45, 101291. [Google Scholar] [CrossRef]
  28. Liu, F.; Ren, C.; Chen, Y. Flood risk investigation of pedestrians and vehicles in a mountainous city using a coupled coastal ocean and stormwater management model. J. Flood Risk Manag. 2023, 17, e12979. [Google Scholar] [CrossRef]
  29. Arrighi, C.; Pregnolato, M.; Dawson, R.J.; Castelli, F. Preparedness against mobility disruption by floods. Sci. Total Environ. 2019, 654, 1010–1022. [Google Scholar] [CrossRef]
  30. Huff, F.A. Time Distribution of Rainfall in Heavy Storms. Water Resour. Res. 1967, 3, 1007–1019. [Google Scholar] [CrossRef]
  31. Korean Ministry of Land, Transport and Maritime Affairs (MLTM). The Master Plan for the Yeongsan River (Upstream); 11-1611425-000017-01; MLTM: Sejong City, Republic of Korea, 2011. [Google Scholar]
  32. RESCDAM. The Use of Physical Models in Dam-Break Flood Analysis; Final Report; Helsinki University of Technology: Helsinki, Finland, 2000. [Google Scholar]
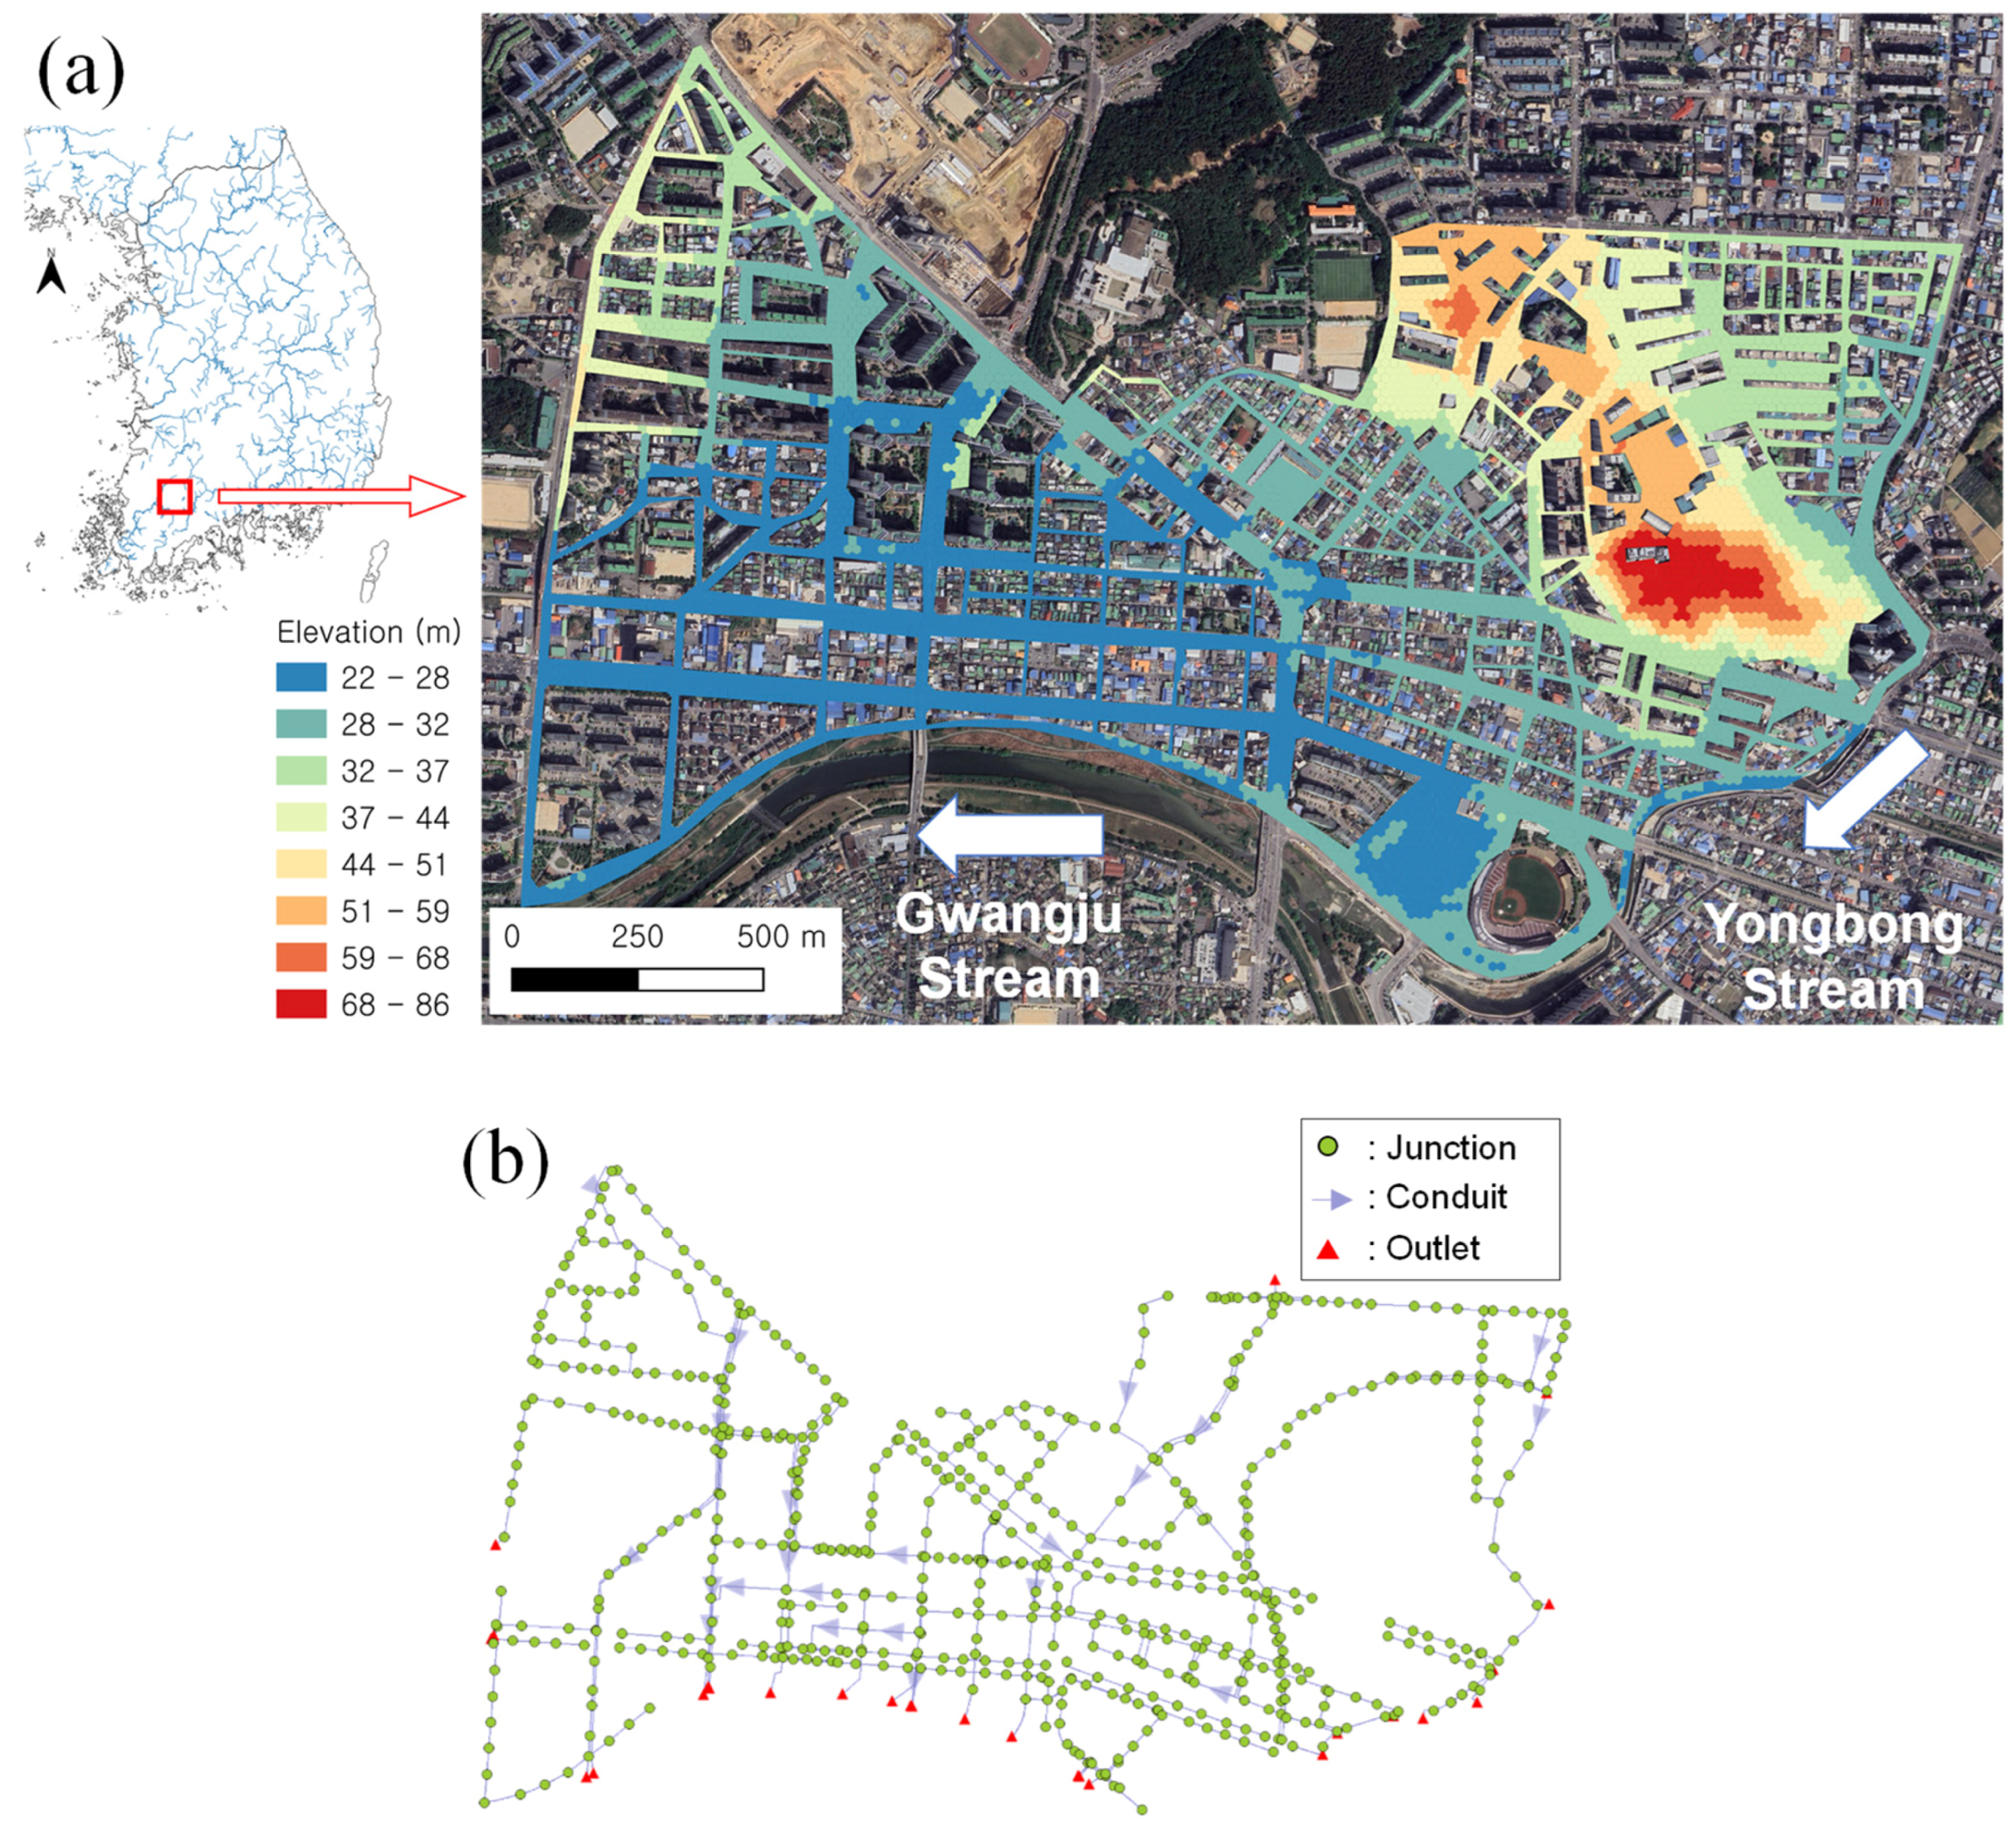
Figure 1. Overview of study area and model configuration: (a) study area and 2D computational mesh; (b) 1D storm sewer network model.
Water 17 03322 g001
Figure 2. Comparison of observed inundation depths from photographs and simulated results for flood events: (a) 2020 storm event; (b) 2025 storm event.
Water 17 03322 g002
Figure 3. Time series of 6 h rainfall hyetographs classified by rainfall duration and Huff quartile: (a) 1st quartile; (b) 2nd quartile; (c) 3rd quartile; (d) 4th quartile.
Water 17 03322 g003
Figure 4. Comparisons of inundation maps of 500-year rainfall with 3rd quartile according to rainfall duration: (a) 1 h; (b) 12 h.
Water 17 03322 g004
Figure 5. Comparisons of inundation areas according to rainfall patterns: (a) 50-year; (b) 100-year; (c) 200-year; (d) 500-year.
Water 17 03322 g005
Figure 6. Comparison of pedestrian safety outcomes for 500-year (1 h, 4th quartile) event across different safety criteria: (a) h/hcr; (b) W.
Water 17 03322 g006
Figure 7. Comparisons of safety assessment results according to rainfall patterns: (a) 50-year; (b) 100-year; (c) 200-year; (d) 500-year.
Water 17 03322 g007
Figure 8. Pedestrian safety assessment results using the weighted-averaging safety criteria for a 500-year event with 3rd-quartile rainfall: (a) 1 h; (b) 12 h.
Water 17 03322 g008
Figure 9. Comparisons of risk scores corresponding to the return period.
Water 17 03322 g009
Figure 10. Relationship between flooded area and risk score corresponding to rainfall distribution: (a) 50-year; (b) 100-year; (c) 200-year; (d) 500-year.
Water 17 03322 g010
Figure 11. Uncertainty comparisons according to flood risk assessment criteria: (a) 50-year; (b) 100-year; (c) 200-year; (d) 500-year.
Water 17 03322 g011
Table 1. Coefficients of empirical formulas for assessing toppling and sliding instabilities.
Critical Velocity
(m/s)
α β a 1 b 1 a 2 b 2
U c s 9.6840.1090.6330.3671.015 × 10−3−4.937 × 10⁻³
U c t 6.3040.3830.7350.265
Table 2. Parameters for determining rainfall intensity.
ParametersReturn Period (Year)
50100200500
a2600.52822.43042.13356.7
b0.73600.73330.73010.7295
Disclaimer/Publisher’s Note: The statements, opinions and data contained in all publications are solely those of the individual author(s) and contributor(s) and not of MDPI and/or the editor(s). MDPI and/or the editor(s) disclaim responsibility for any injury to people or property resulting from any ideas, methods, instructions or products referred to in the content.