Article

Numerical Simulation of Groundwater Regulation in Arid Oasis Regions: A Case Study of the Shihezi Irrigation District, Xinjiang

1
College of Water Conservancy & Architectural Engineering, Shihezi University, Shihezi 832003, China
2
Key Laboratory of Cold and Arid Regions Eco-Hydraulic Engineering of Xinjiang Production & Construction Corps, Shihezi 832003, China
3
Key Laboratory of Modern Water-Saving Irrigation of Xinjiang Production & Construction Group, Shihezi 832003, China
4
Water Resources Bureau of Xinjiang Production and Construction Corps, Urumqi 830002, China
*
Author to whom correspondence should be addressed.
Water 2025, 17(22), 3232; https://doi.org/10.3390/w17223232
Submission received: 22 September 2025 / Revised: 5 November 2025 / Accepted: 10 November 2025 / Published: 12 November 2025
(This article belongs to the Special Issue Advances in Ecohydrology in Arid Inland River Basins, 2nd Edition)

Abstract

The optimal groundwater level is critical for maintaining the coordinated and healthy development of the ecological–agricultural production system in arid oasis regions. This study comprehensively considered factors such as ecological safety, soil salinization prevention and control, and ground subsidence constraints to determine the optimal groundwater level in a region. GIS technology and Visual MODFLOW Flex 6.1 software were used to construct a three-dimensional groundwater numerical model, and regional comprehensive evaluation values were applied to simulate and predict the spatiotemporal evolution of groundwater levels under different regulation schemes. Results indicated the following: (1) There were significant spatial differences in the study area. The optimal groundwater depths in agricultural and engineering/living areas were 2–4 and 3–4 m, respectively, as determined using methods such as capillary rise height and total sum of middle layers. (2) In long-term (≥10a) regulation, areas with a reduced regional comprehensive evaluation value > 0.20 exhibited the highest groundwater recharge rate (17.10%), while those with a reduced regional comprehensive evaluation value > 0.32 showed the best coverage of optimal groundwater levels. The opposite trend was observed in short-term regulation. (3) Considering both groundwater recharge and optimal groundwater level regulation, the Y2 scheme demonstrated the best regulation effect. The findings of this study can provide theoretical references for the multi-objective optimization management of water resources in arid oasis regions.

1. Introduction

In arid regions, oases occupy less than 10% of the total area yet concentrate 95% of the regional population and over 90% of the total economic output. Characterized by the intertwined coexistence of artificial and natural ecosystems, oases exhibit frequent surface water–groundwater transformations [1]. As river water allocation to oases decreases, groundwater has become the primary source for oasis crop irrigation and serves as a fundamental and decisive factor in sustaining the oasis ecosystem [2,3,4]. As a typical composite system shaped by the interplay of water resources, ecology, and economy in arid regions, the oasis area exhibits pronounced ecological coupling effects in its groundwater hydrological processes. Under arid climatic conditions, groundwater is one of the most important natural resources [5,6]. The groundwater system fulfills several critical functions, including sustaining ecological water requirements for oasis vegetation, regulating soil water–salt dynamics, and supporting socioeconomic and agricultural water demands [7,8,9,10,11,12]. It is the pivotal resource constraining socioeconomic development in arid oasis ecosystems. Groundwater table fluctuations profoundly influence vegetation growth, population structure, and biodiversity in these regions [13,14,15]. Therefore, maintaining an optimal groundwater level is a crucial environmental determinant for oasis ecosystem health [16,17,18,19,20]. However, excessive groundwater exploitation in some areas has resulted in a cascade of ecological and environmental issues, including persistent groundwater depletion and land subsidence [21,22,23,24,25,26,27,28,29,30,31]. Thus, sustaining appropriate groundwater levels is imperative for achieving coordinated development among water resources, ecological preservation, and socioeconomic progress in arid oasis regions. As a representative arid oasis, the Shihezi Irrigation District in Xinjiang exhibits an annual groundwater extraction rate of 13,670 × 104 m3/a, which far exceeds its surface water diversion volume of 6663 × 104 m3/a [32], and surface water is mainly sourced from the Manas River basin, and is introduced into the irrigation area through the Hongshanzui water diversion hub using channels. Since the implementation of stringent water resource management policies in 2012, localized groundwater recovery has occurred. Nevertheless, new challenges have emerged, such as basement inundation and secondary soil salinization. Therefore, the accurate determination and scientific regulation of optimal groundwater levels are urgent research priorities for ensuring both ecological security and sustainable socioeconomic development in the Shihezi Irrigation District.
With advancements in science and technology, numerical simulations have become crucial tools for studying groundwater level regulation and control [33,34]. Software programs such as Visual MODFLOW, FEFLOW, GMS, and MIKESHE have been widely used in groundwater level regulation and control research. The main approach to groundwater level regulation and control follows a logical sequence: “regulation and control plan → simulation calculation → effect analysis → feedback adjustment” [35]. Guo, H. et al. [36] implemented joint groundwater–surface water regulation and control in the Tarim River Basin using artificial ecological replenishment. Shi, J. et al. [37] systematically investigated regional groundwater level regulation and control through a three-in-one regulation and control plan of “extraction optimization → water conservation and efficiency improvement → artificial replenishment.” Shang, H. et al. [38] adjusted the spatial and temporal layout of groundwater extraction and combined it with numerical simulations to regulate and control water levels in the arid oasis areas of Northwest China. Hao, Y. et al. [39] studied the restoration effect of groundwater in Minqin oasis through a digital groundwater depth model under the watershed groundwater restoration policy, revealing the spatiotemporal dynamic process of groundwater. In 1962, local researchers proposed the concept of “critical groundwater depth” [40], further boosting research on suitable groundwater levels. Zhang, C. [41] and Cui, Y. et al. [42] separately studied the relationship between plant growth and groundwater depth, proposing that the ecological water level is a crucial factor in preventing land desertification and plant death. Liu, W. [43] and Zhao, S. [44] analyzed plant root thickness, capillary rise height, and phreatic evaporation depth to determine the ecological water level threshold in the study area. Goedhart et al. [45] observed that in semi-arid regions, as the groundwater table drops within a certain range, the coverage of shallow-rooted grassland vegetation decreases, while that of deep-rooted shrubs remains unchanged. This phenomenon is attributed to the ability of deep-rooted vegetation to absorb and utilize groundwater or soil water from greater depths [46]. Cheng, Y. et al. [47] and Wang, W. et al. [48] employed Gaussian models to analyze the characteristics of groundwater depth and vegetation, determining the suitable ecological groundwater depth. Internationally, research on groundwater level regulation and control typically relies on a multifactor coupling analysis of vegetation, soil, and groundwater systems. Ali, R. et al. [49] employed the LEACHC model to establish the quantitative relationship between groundwater table depth and soil salinization. Horton, J. et al. [50] explored the physiological responses of various plants under varying groundwater depths. Benyamini et al. [51] studied the relationship between conductivity and groundwater level, analyzing and obtaining suitable water levels for the effective prevention of soil salinization. These studies highlighted the importance of suitable groundwater levels. However, their focus was on small-scale research, with investigations on suitable regional-scale groundwater level regulation and control being limited.
To address challenges such as how to scientifically regulate groundwater levels to promote coordinated development between the socioeconomic system and the ecological environment, this study focused on the Shihezi Irrigation District in Xinjiang, a typical arid oasis in Northwest China, as the study area. It comprehensively considers constraints such as the ecological vegetation system safety, soil salinization prevention and control, and land subsidence to determine a suitable groundwater level for the irrigation district. A three-dimensional (3D) groundwater numerical model was constructed using ArcGIS 10.6 and Visual MODFLOW Flex 6.1 software, combining the hydrogeological conditions of the study area with groundwater level monitoring data. A numerical simulation was performed to predict the dynamic evolution of the groundwater levels under different development and utilization scenarios. A comparative analysis was conducted to determine the optimal groundwater level regulation scheme, which provides a theoretical basis for the sustainable use of groundwater in arid oasis areas.

2. Materials and Methods

2.1. Overview of the Study Area

The Shihezi Irrigation District is situated in a hydrogeologically significant transition zone encompassing the middle section of the northern piedmont of the Tianshan Mountains, the southern margin of the Junggar Basin, and the eastern alluvial plain of the Manas River Basin (Figure 1 [52]). This region exhibits characteristic features of a continental arid climate, with markedly disproportionate annual evaporation (1535.4 mm) and precipitation (213.7 mm) values, representing a classic arid oasis irrigation system in Northwest China. The area displays a distinct southeast-to-northwest topographic gradient, featuring sequential geomorphological transitions from mountainous terrain through piedmont slopes to alluvial–lacustrine plains and ultimately desert landscapes [38], forming a well-defined zonal pattern that significantly influences groundwater recharge, flow dynamics, and discharge processes within the aquifer system itself.
The aquifer system in the study area predominantly consists of Quaternary alluvial–proluvial deposits, forming a multilayered hydrogeological unit with complex heterogeneity. The unconfined aquifer exhibits a thickness of approximately 50 m and is characterized by alternating sequences of sand, silty clay, gravel, and cobble layers, reflecting the dynamic depositional environment of the alluvial-fan system. The lithological composition demonstrates significant vertical and lateral variations in hydraulic properties, with coarse-grained sediments (gravel and sand) serving as primary aquifers and fine-grained layers (clay and silty clay) acting as local aquitards, creating a semi-connected groundwater flow system typical of piedmont alluvial plains.
The groundwater system is primarily recharged through multiple pathways, such as snowmelt percolation, riverine infiltration, irrigation canal seepage, and lateral inflow from piedmont areas, whereas discharge occurs mainly via anthropogenic abstraction, lateral outflow, and spring discharge. According to the calculation of water balance method, demonstrating a positive water balance that partially mitigated the previous groundwater level decline. Notwithstanding this equilibrium state, potentiometric surfaces remain at relatively depressed levels throughout the aquifer system, suggesting that the region is experiencing ongoing water resource stress.

2.2. Determination Method of Suitable Groundwater Level

2.2.1. Water Level Threshold for Preventing Soil Salinization

In arid oasis areas, the evaporation from the phreatic zone is high, and the shallow depth of groundwater leads to secondary soil salinization. Concurrently, soil pores become filled with water, preventing the entry of oxygen, resulting in prolonged hypoxia of the roots and the production of harmful substances such as alcohol, which can damage the roots. Accordingly, the capillary rise height method was adopted to determine the suitable upper limit of the groundwater level in the study area. When the groundwater depth is less than the maximum capillary rise height, the water content in the plant root layer is high, which hinders the absorption of water and nutrients by plants to some extent. To ensure a continuous soil-water supply to plant roots, the suitable upper limit of the groundwater level represents the minimum depth for normal plant growth. The sum of the plant root thickness, safe superelevation, and maximum capillary height was considered the upper-limit depth of the groundwater level [53]:
H L = H C + H g + ,
where HL represents the upper-limit buried depth of the groundwater level (m), HC represents the maximum capillary rise height (m), Hg represents the thickness of the plant root layer (m), and represents the safe superelevation, typically set as 0.2 m.

2.2.2. Suitable Groundwater Level Threshold for Industrial Production Areas

The rise in the groundwater level has had varying degrees of impact on basement buildings in the urban part of the study area. Cable trenches, fire wells, valve wells, and underground pipe trenches within factories such as Tianye Gas Transportation Company, Tianshan Aluminum, and Daquan Silicon were the most affected. Their foundation burial depth was generally between 3 and 3.5 m. The coal unloading trenches of Tianye Gas Transportation Company and Tianhe Thermoelectric Company are located 10–11 m from the natural ground [32].

2.2.3. Water Level Threshold for Preventing Vegetation Degradation

Considering the supply of groundwater to vegetation, when the phreatic limit evaporation depth is reached, vegetation will no longer receive water supply from groundwater. Therefore, the phreatic limit evaporation depth is used as a threshold to prevent the degradation of groundwater levels and serves as the lower-limit threshold of the ecological water level for groundwater [54], calculated as follows:
H d = H e ,
where Hd is the water level required to prevent vegetation degradation (m) and He is the limit evaporation depth of phreatic water (m).

2.2.4. Burial Depth of Water Level for Preventing Ground Subsidence

Long-term overexploitation of groundwater leads to a decline in the groundwater level, a decrease in the pore water pressure in the soil, and an increase in the effective stress between soil particles, which in turn causes compression and consolidation of the soil layer, ultimately leading to land subsidence. The main cause of land subsidence is the reduction in the bearing capacity of building foundations, resulting in the damage and subsidence of buildings. The critical water table depth for calculating land subsidence using the layered summation method [55].

2.3. Regional Evaluation and Density Analysis

Regional evaluation was conducted based on groundwater regulation principles to determine groundwater depth and well density as evaluation indicators. Through well-cluster regulation, groundwater in the irrigation area was maintained at an appropriate level. The evaluation area was divided based on the observed well water level depth data. Kernel density analysis in ArcGIS Spatial Analyst Tools was utilized to derive the well cluster density range. The well density was selected as the calculation standard, and subsequent normalization was achieved using the well density indicator under the kernel density processing. The study area was divided into a 50 × 40 fishnet grid, and a fishnet map was obtained by connecting the associated well cluster points.

2.4. Numerical Simulation Method

This study employed the Visual MODFLOW Flex 6.1 software for groundwater numerical simulations. The software enables three-dimensional numerical generalization of complex hydrogeological conditions and quantifies the dynamic evolution of groundwater levels and solute transport processes via model computations [56]. The specific modeling workflow was as follows: first, with the spatial scope of the study area as the boundary, a conceptual model characterizing the core hydrological processes of the groundwater system was constructed by integrating the area’s hydrogeological structural features and boundary condition. Subsequently, the conceptual model was converted into a numerical model, where spatial discretization of the grid was performed to determine resolution, and source-sink term parameters and initial boundary conditions were set based on survey data and long-term monitoring record, the model was subjected to temporal discretization to divide the calculation periods, and the measured groundwater level data were compared with the simulated values. Key parameters were iteratively adjusted for model calibration. Once the fitting accuracy met the research requirements, the model was executed for simulation and calculation.

3. Construction of the Numerical Model

3.1. Conceptual Model of Hydrogeological Conditions

3.1.1. Generalization of the Aquifer Structure

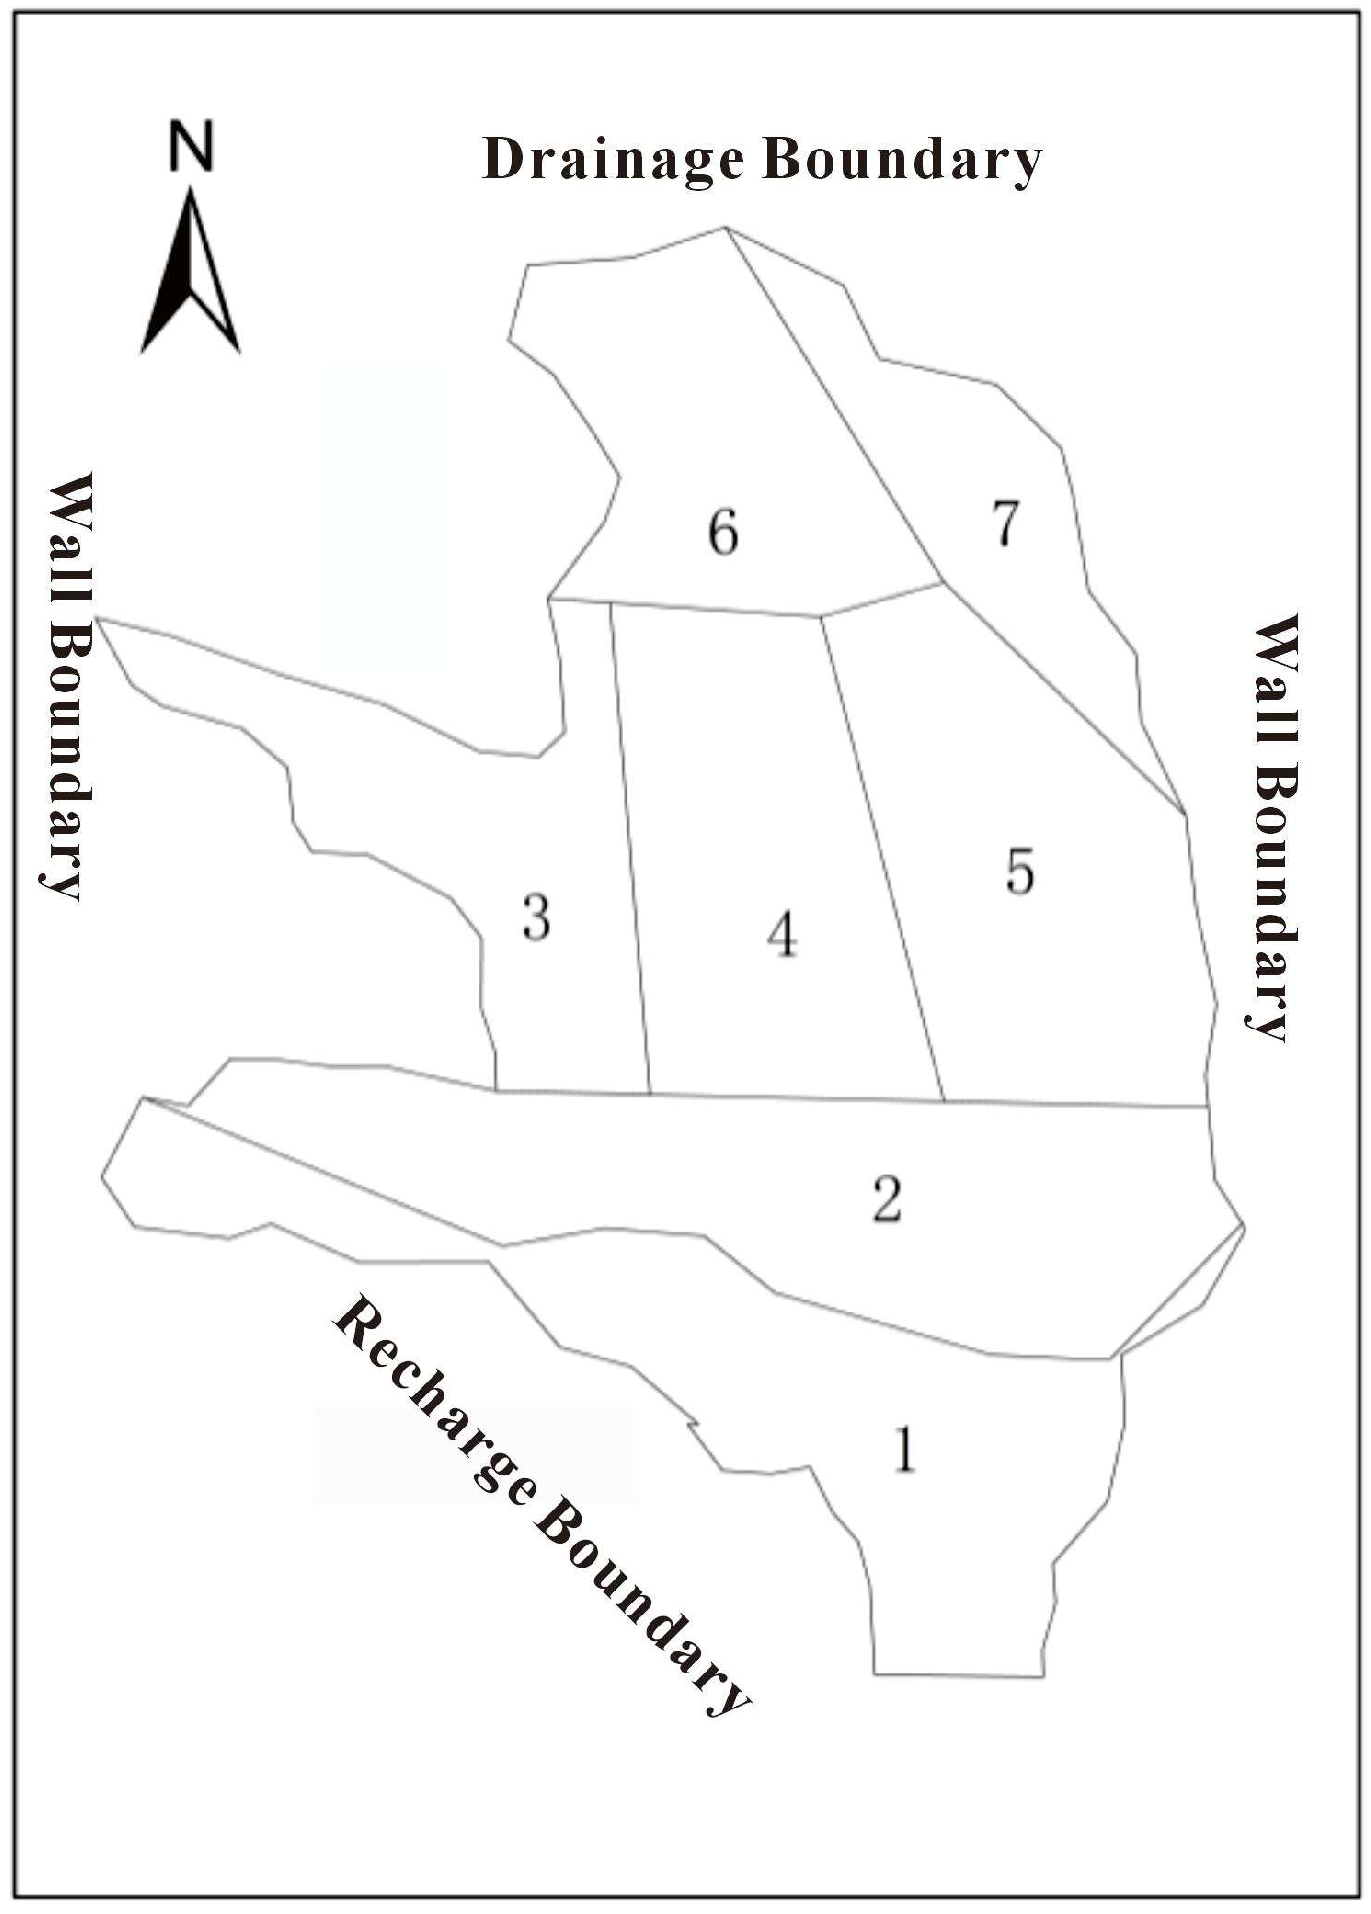
The altitude of the irrigation area is high in the south and low in the north, with outcrops distributed across alluvial–proluvial fans of varying sizes and ages. The aquifer is primarily composed of Quaternary alluvial–proluvial deposits, and its groundwater is mainly composed of Quaternary loose phreatic water and confined water systems. The aquifer medium is primarily composed of Quaternary alluvial–proluvial deposits [57]. The lithological structure mainly consisted of coarse sand, gravel, pebbles, silt, and clay. The aquifer was of excellent quality and had a thickness of 40–80 m. The lithological structure of the phreatic aquifer is also complex. The lithological structure of the piedmont-inclined plain is mainly composed of pebbles and gravel, which form the phreatic aquifer. In the alluvial–proluvial plain, the lithological particles became finer, with coarse sand and silty clay layers interlaced to form an interbedded structure of aquifer–weakly permeable layers. The lithology of the lacustrine plain consists of gravel, sand, and clay layers that form a confined aquifer. According to the regional hydrogeological conditions and stratigraphic lithology, the aquifer was divided horizontally into seven zones (Figure 2) and vertically into eight layers.

3.1.2. Boundary Conditions

Due to the fact that the main water exchange with the external environment occurs through the unconfined aquifer, the free water surface (water table) is used as the upper boundary of the saturated zone in the model. The strata beneath the aquifer consist mainly of silt, clay, mudstone, and sandstone, which have very low permeability and yield minimal water; thus, they are effectively considered as impermeable. Accordingly, a no-flow boundary condition is applied as the base of the model to represent the lower boundary.
The terrain in the study area slopes from higher elevations in the south to lower elevations in the, and the configuration of groundwater contour lines reflects this gradient. Based on these characteristics, the lateral boundaries of the model domain are treated as Class II (flux-type) boundary conditions. Specifically, the northwest and southeast boundaries coincide with groundwater divides and are implemented as no-flow boundaries (zero-flux). In the relatively low-lying northeastern part of the irrigation area, groundwater discharges as springs where the foothills transition to the plains. Taking into account the permeable soil conditions in this zone, the northeast boundary is represented as an outflow (discharge) boundary in the model, with an estimated flux of 6086.69 × 104 m3/a based on analytical calculations. Conversely, the southwestern boundary which lies at a higher elevation along the mid-northern slope of the Tianshan Mountains, is defined as a recharge boundary. The mountainous area to the southwest is primarily recharged by glacier melt and rainfall infiltration, and the shallow lithology there is dominated by gravel and sand. Accordingly, the inflow across the southwest boundary is calculated to be 12,600.39 × 104 m3/a using Darcy’s law. (Details of these flux calculations and parameter values are provided in Supplementary Materials).
The vertical groundwater source and sink terms in the model include processes such as pumping (artificial extraction), evaporation, canal seepage, reservoir infiltration, field infiltration (irrigation return flow), and direct rainfall recharge. Among these, evaporation and rainfall recharge are only considered when the groundwater table is shallower than 6 m and are neglected when the water table exceeds 6 m depth [58]. Owing to intensive groundwater exploitation in the Shihezi Irrigation District, the water table in most areas has dropped below 6 m, although a small portion of the area is still shallow enough to receive some recharge from rainfall. Therefore, the main vertical flow components considered in the model are canal seepage, reservoir infiltration, field infiltration, evaporation, and pumping withdrawals.
Recharge from the irrigation canal system is estimated based on the water conveyance capacity of each canal and the canal system’s water loss (infiltration) coefficient, together with its water utilization coefficient. In the model, seepage from the surface canal network is accounted for in the water balance calculations, extending down to the smallest agricultural canals.
For irrigated fields, the infiltration rate is determined by first estimating the amount of irrigation water applied based on the cropping pattern and irrigation practices and then applying a field infiltration coefficient to that volume. The reservoir infiltration rate is estimated by considering the geological properties and storage capacity of the dam foundation, combined with a seepage recharge coefficient. Artificial groundwater extraction is incorporated by specifying monthly pumping volumes for each well (as a time series) and assigning these values to the corresponding well locations in the model.
Several MODFLOW packages were utilized to simulate the above components. The Recharge (RCH) package was used to simulate areal recharge to the aquifer from rainfall, and field percolation. The River (RIV) package was employed to simulate river-aquifer interactions, with exchange fluxes governed by riverbed hydraulic conductivity and the head gradient between the river and aquifer. In addition, infiltration from the canal seepage was simulated using the RIV package. The Lake (LAK) package was used to simulate groundwater replenishment via reservoir infiltration. Groundwater pumping was represented using the Well (WEL) package by assigning specified pumping rates to the corresponding well cells. Lateral groundwater inflow and outflow along the model boundaries were implemented as specified flux boundary conditions. Evaporation losses (plant uptake and direct evaporation) were simulated with the EVT package, which calculates the volumetric water flux by multiplying the specified evaporation rate by the area of each model cell.
Parameter selection for the water balance calculations took into account the spatial variability of soil lithology across the irrigation area. The southern portion of the area is characterized by predominantly coarse to deposits (gravel and pebble beds), whereas toward the north the stratigraphy transitions to alternating layers of silt, silty clay, and fine sand, with occasional thin interbeds of sandy gravel and medium-to-coarse sand. Given these soil properties, and long-term irrigation practices, the soils in the region can be broadly classified as silty clay and sandy soil. The irrigation canal network consists of four levels of channels (main, branch, hopper, and agricultural), and the channel seepage coefficient was assigned according to the soil structure of each channel level. Using the above information, the necessary parameters for the water balance calculations were determined. Additionally, the reference work Xinjiang Groundwater Resources (a comprehensive provincial survey report) provided predetermined parameter ranges for the hydrological and stratigraphic units in the study area. Operational data, including groundwater extraction volumes and reservoir releases, were obtained from the “Implementation Table of Groundwater Supply Plan of Shihezi City, the Eighth Division” provided by the regional water conservancy bureau.

3.1.3. Groundwater Recharge and Discharge Items

The groundwater recharge items in the study area include snowmelt infiltration, rainfall infiltration, river channel infiltration, canal seepage, field infiltration, reservoir infiltration, and lateral recharge at the piedmont and outside the area. Part of the snowmelt infiltration flows into the river channel as runoff, contributing to river channel recharge. Meanwhile, another portion infiltrates the aquifer and is considered lateral recharge at the piedmont and outside the study area. The main discharge items include spring overflow, phreatic evaporation, artificial extraction, and lateral discharge at the piedmont and outside the study area.

3.2. Mathematical Model of Groundwater

The software Visual MODFLOW Flex 6.1 used in this study employs the finite difference method (numerical method) to solve equations. Compared to other models, it has clear physical concepts, intuitive and easy-to-understand operation, and good accuracy in solving groundwater flow problems [59].
Based on the hydrogeological conceptual model, groundwater flow in the study area was conceptualized as a 3D unsteady-flow mathematical model of unconfined groundwater with heterogeneous isotropy [60]:
μ H t = x K h H x + y K h H y + z K h H z + W x , y , z               H x , y , z , t | t = 0 = H 0 x , y , z                                                                                                               K H n | Γ 2 = q 2 x , y , z , t                                                                                                                                       ,
where H represents the groundwater level (m); K denotes the permeability coefficient of the aquifer (m/day); h denotes the distance from the impermeable floor of the phreatic aquifer to the phreatic free water surface (m); W represents the source–sink term of the aquifer (m/day), with inflow being positive and outflow being negative; μ is the specific yield of the phreatic aquifer; and x, y, z, and t represent the spatial and temporal coordinates within the study area, respectively.

3.3. Spatiotemporal Discretization of Model

A grid subdivision approach was adopted in terms of space. The plane was subdivided into 100 × 100 square grids, with each grid covering an area of 597.28 × 752.90 m2. The simulated calculation area covered 1687.96 km2. In the vertical direction, the elevation of the Quaternary basement was determined from the geological conditions of the irrigation area and groundwater flow-field conditions. The boundary of the Shihezi Irrigation District was used for cropping, and a 3D grid view of the model was constructed, resulting in 28,448 effective units.
The recognition rate of the model was periodically evaluated from January 2016 to December 2016, and the model validation phase spanned from January 2017 to December 2017. During model operation, the recognition rate was evaluated annually, divided into 12 stress periods, with each month representing one stress period and a time step of 6 days.

3.4. Hydrogeological Parameter Zoning

Based on the hydrogeological conditions and topography of the study area, and by combining previous research results and experience [61], the study area was divided into seven zones horizontally and eight layers vertically. The vertical stratigraphic structure and lithology vary in each zone; therefore, vertical zoning and assignment were performed for different zones according to their stratigraphic structure and lithological distribution. The initial parameters were assigned according to the different lithologies, and the final parameter values for the different lithologies were determined (Table 1). The main parameters included the permeability coefficient K and specific yield μ.

3.5. Model Identification and Validation

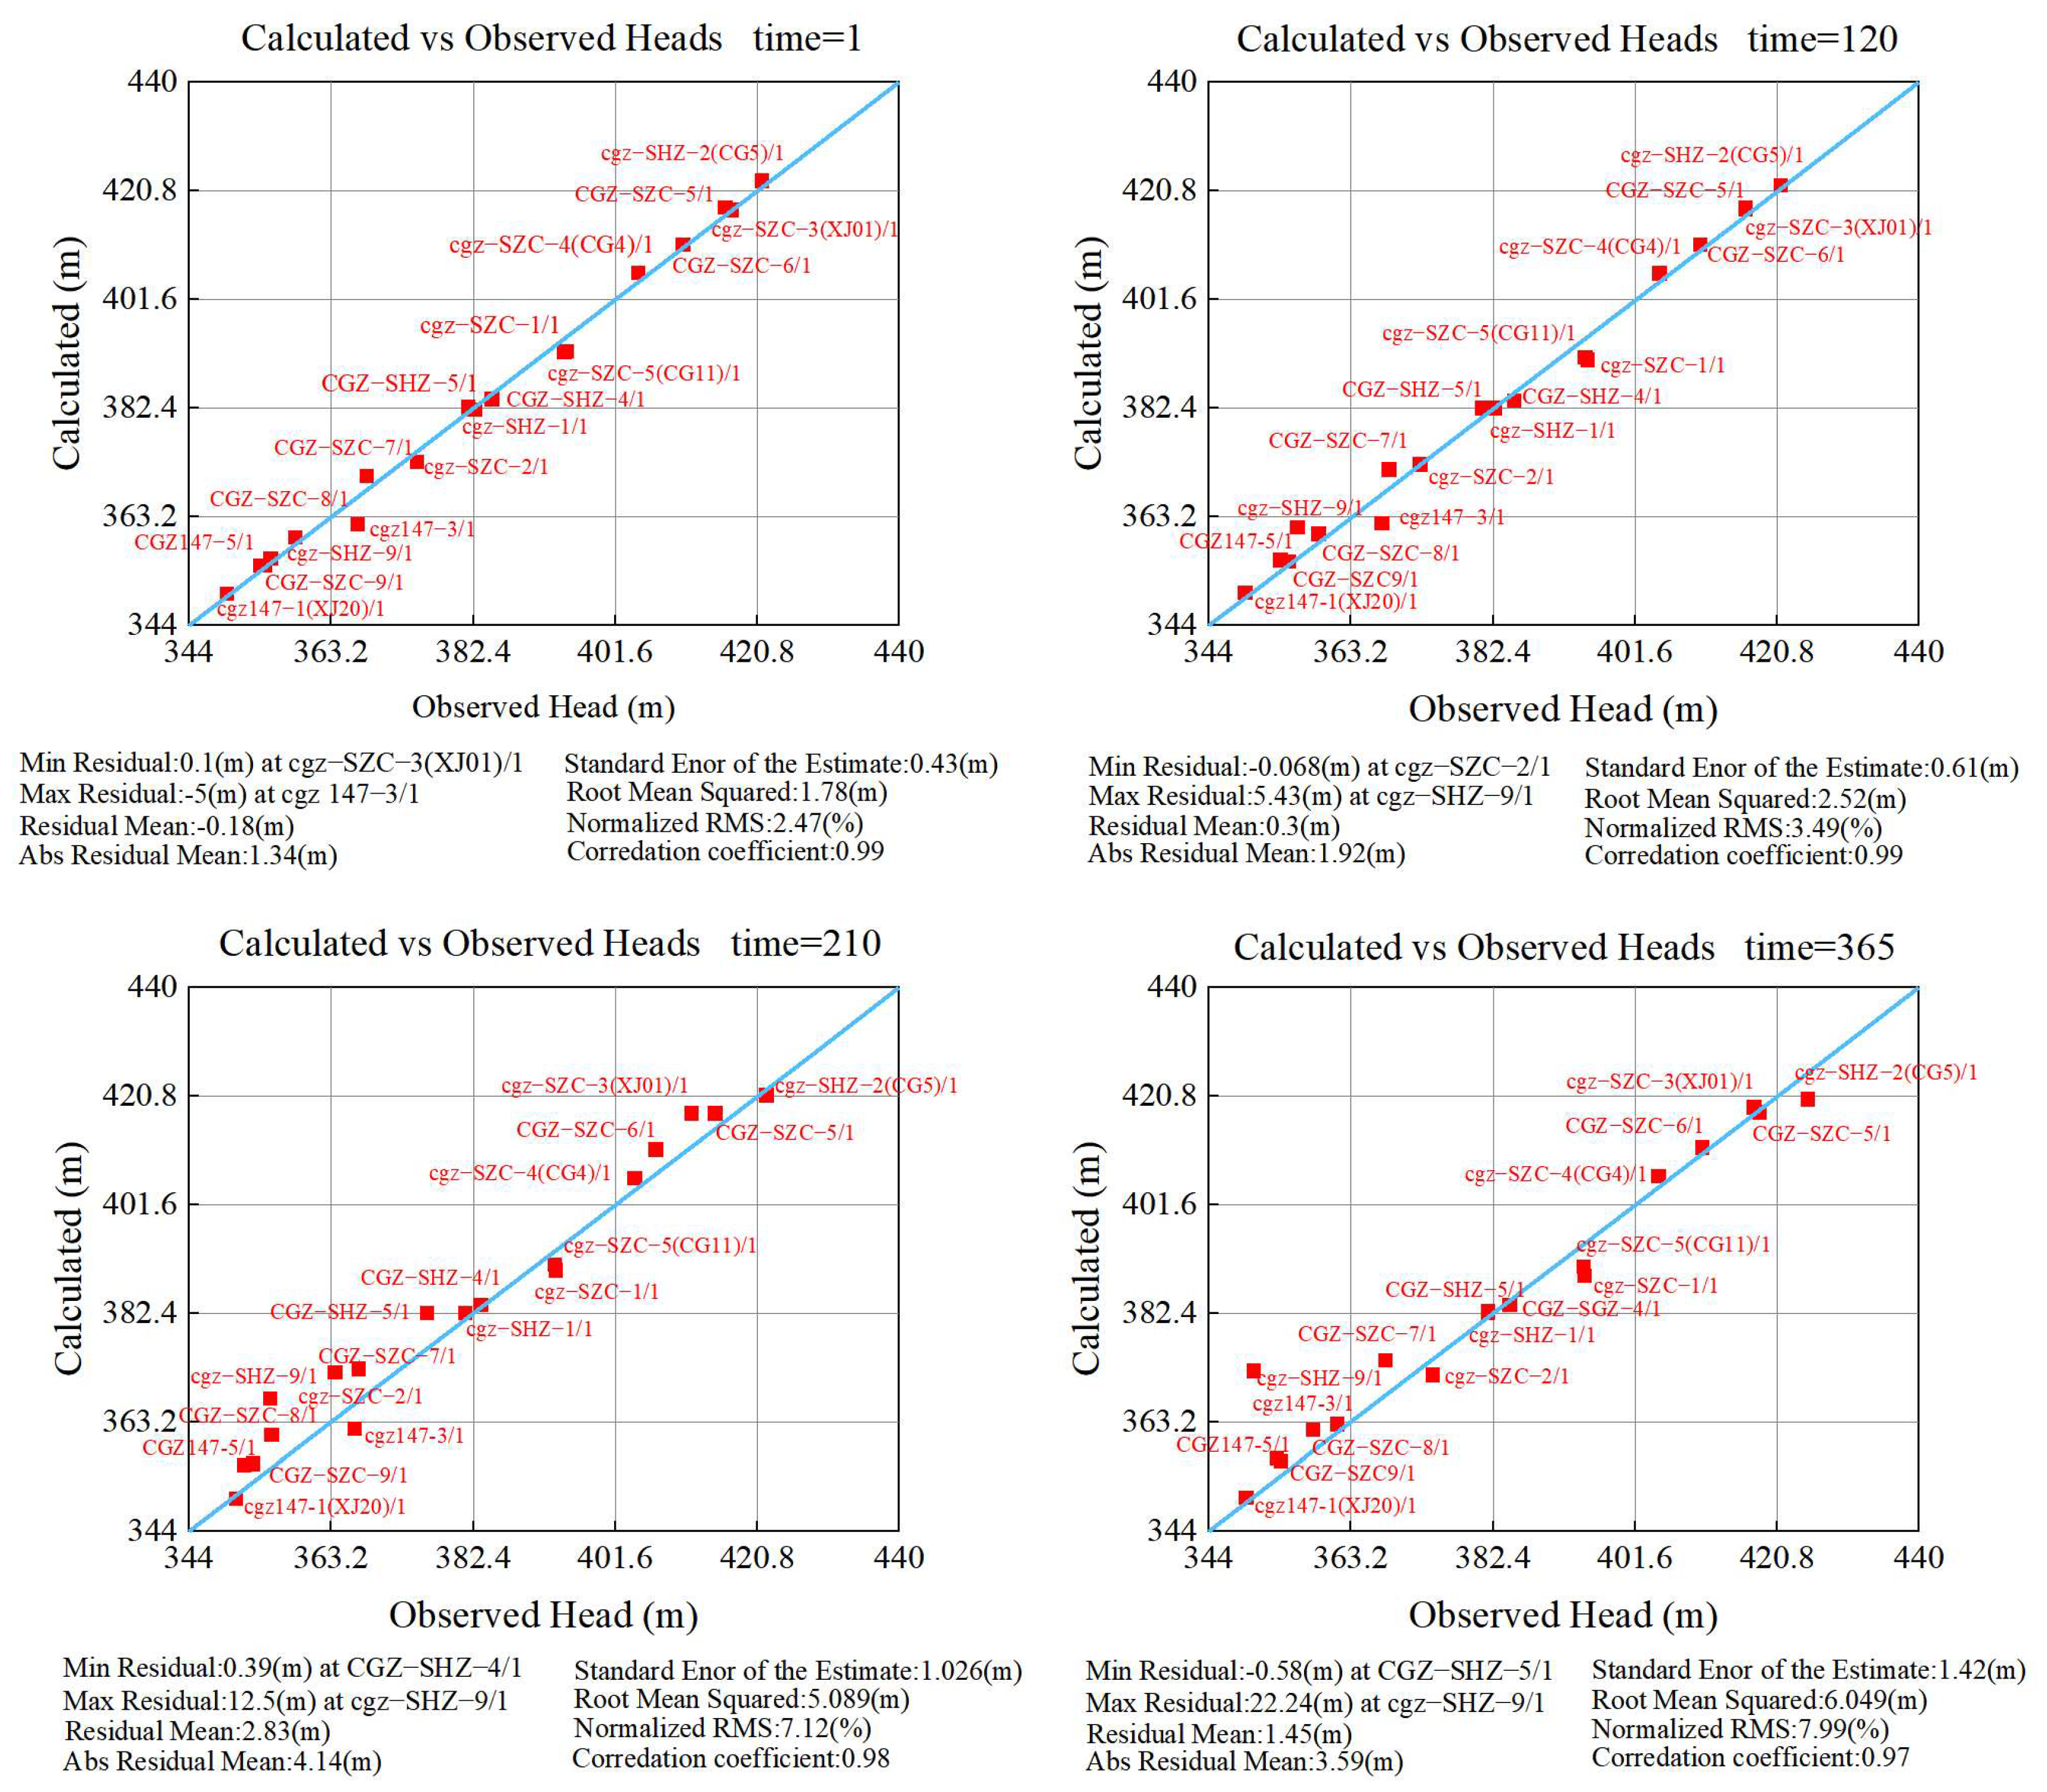
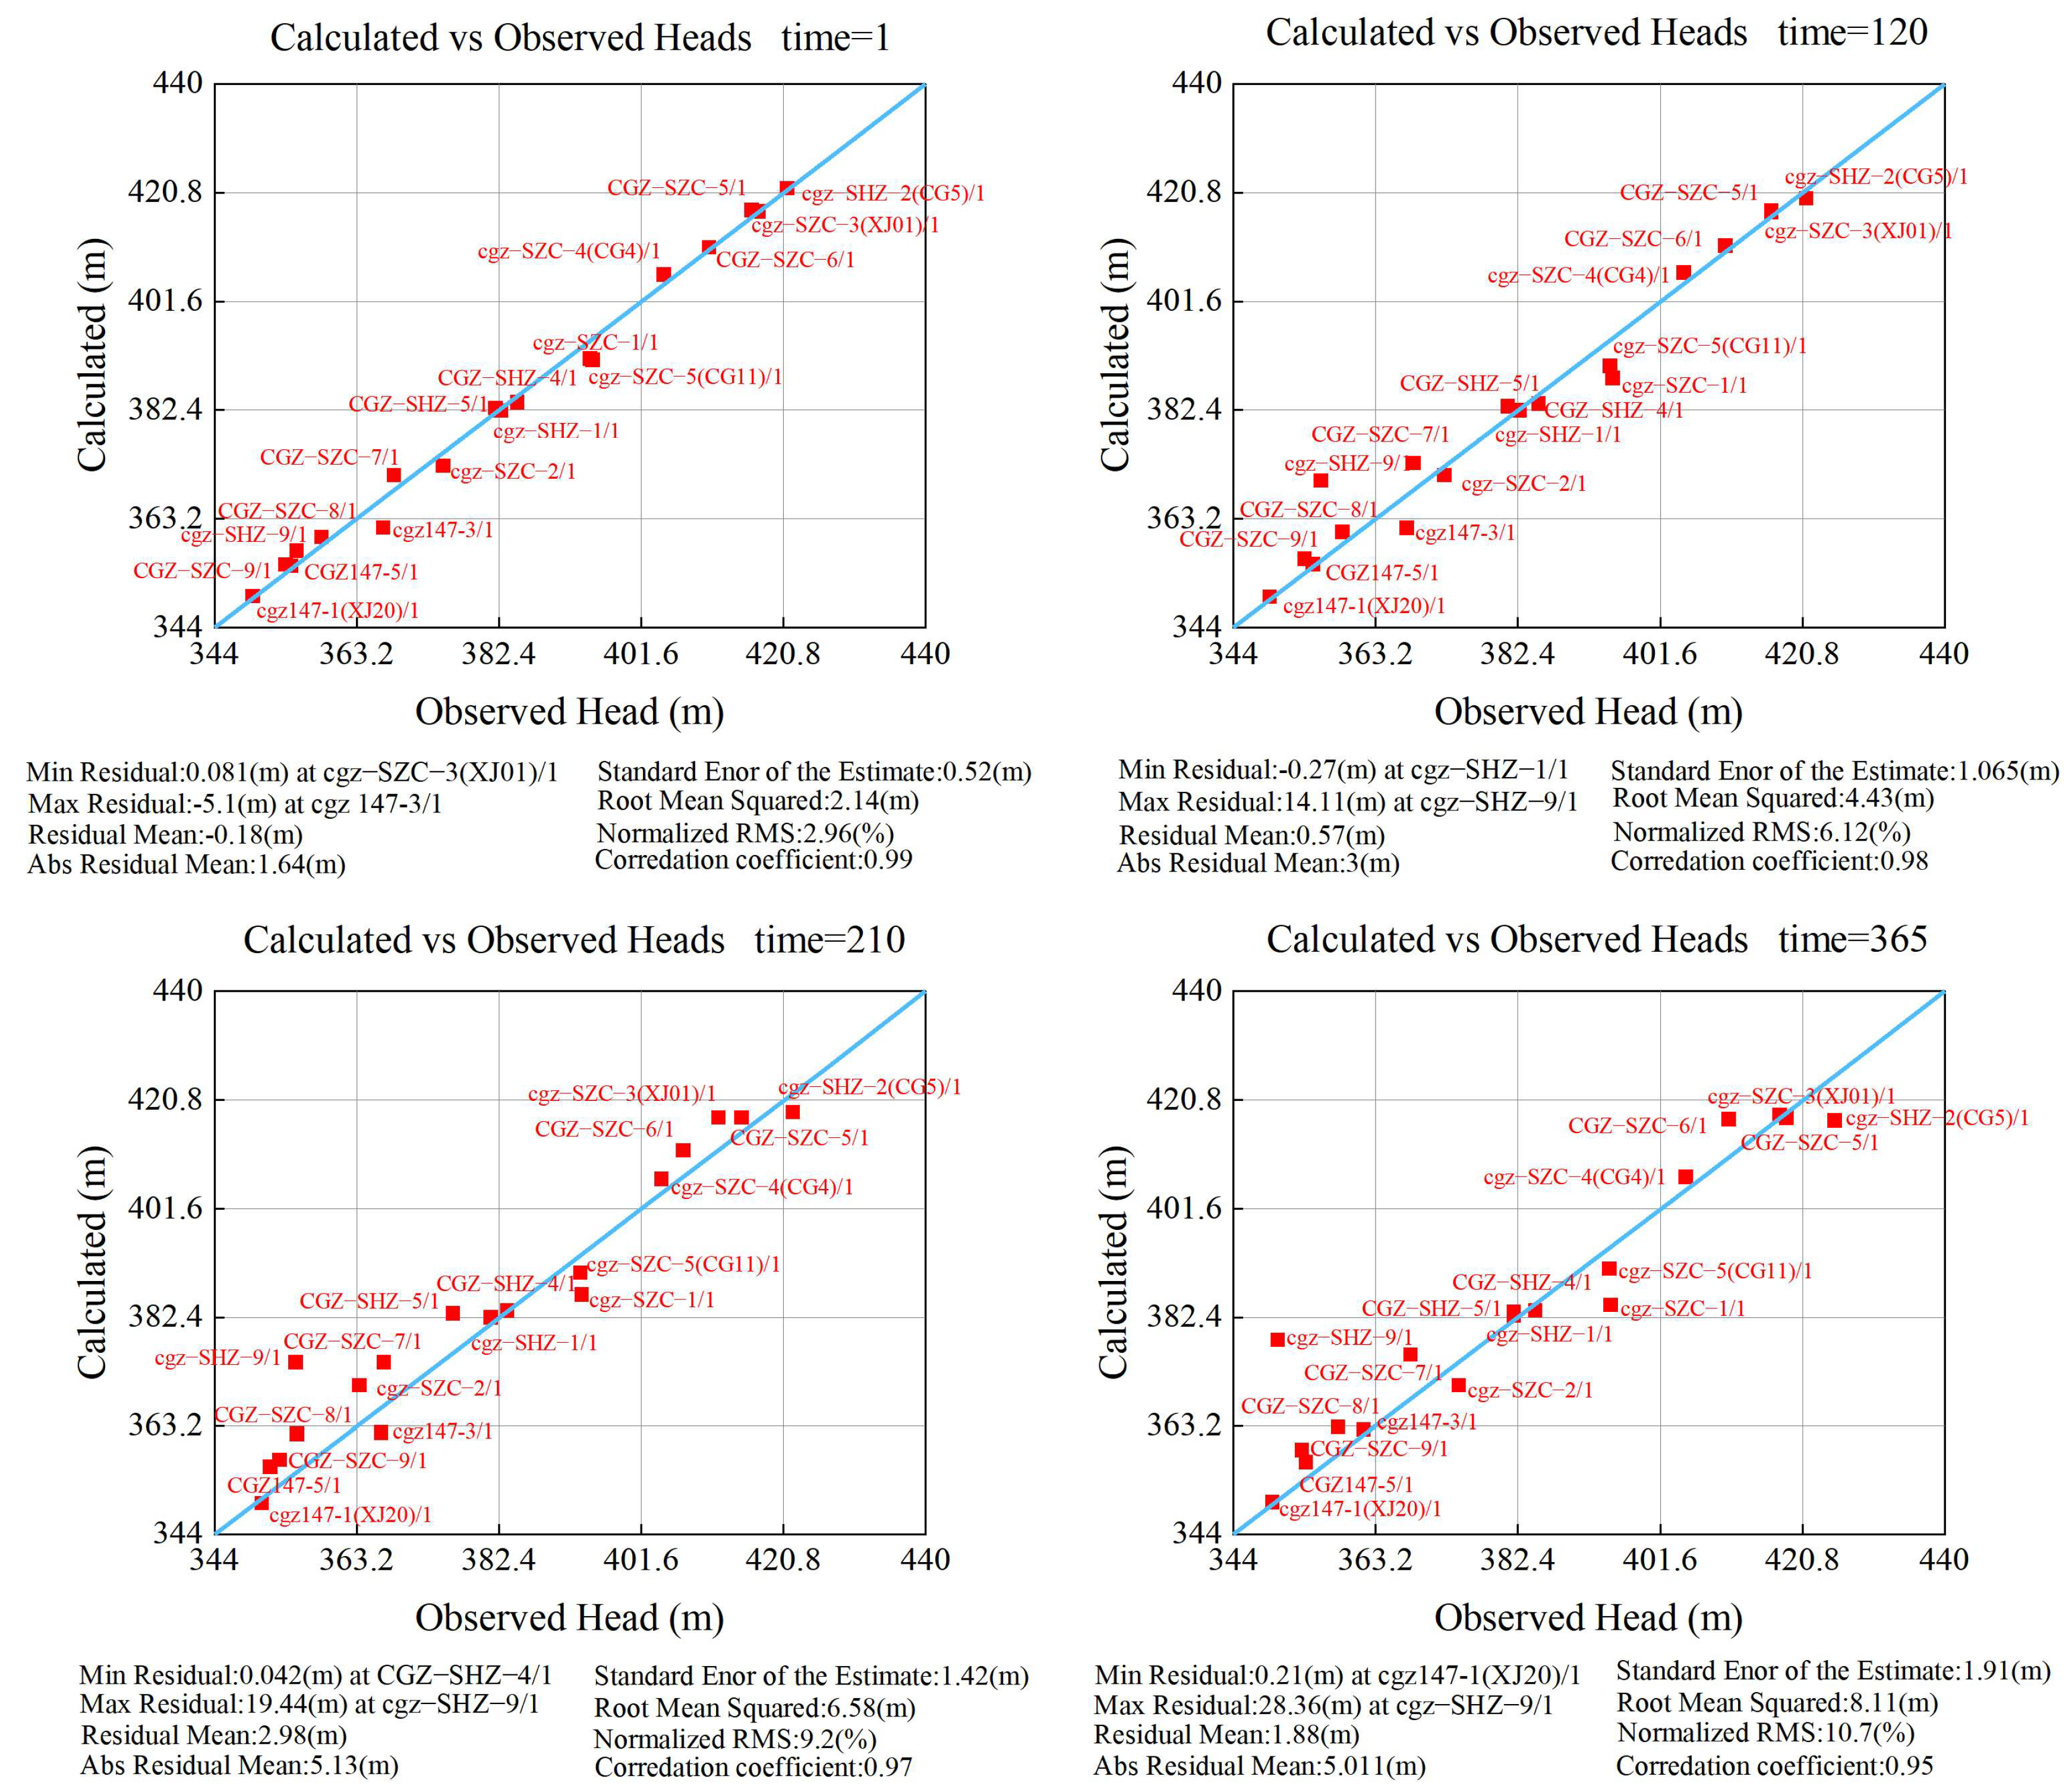
The locations of 22 observation wells (Figure 1) are primarily distributed in the central part of the irrigation area. Based on the data measured from the observation wells in 2016, the hydrogeological parameters for different lithologies were determined through model calibration (Table 1). The measured groundwater level data from observation wells in 2016 were used to calibrate the model, and the normalized root mean square error (NRMS) and average correlation coefficient (R) of groundwater levels at observation wells on the 1st, 120th, 210th, and 365th days of the year were calculated (Table 2). The average NRMS was 5.27% and the average R was 0.98. Groundwater level data measured from observation wells in 2017 were used to validate the model. The average NRMS of groundwater levels on the 1st, 120th, 210th, and 365th days of the year was 7.25%, with an average of 0.97 (Table 3). During the calibration period, all R values were >0.97, with an average of 0.98. During the validation period, all R values were >0.95, with an average of 0.97. A comparison of the simulated and measured groundwater levels during the validation period revealed that the measured and simulated values of the groundwater numerical simulation model exhibited a high degree of correlation and fit during both the calibration and validation periods (Figure 3 and Figure 4). The fitting effect of the model was good, indicating that the constructed groundwater numerical simulation model can be used for the dynamic prediction of groundwater levels in this study area.

3.6. Simulation Plan

The entropy weight method was selected to determine the weights of the evaluation indicators. The weight was related to the variability of the indicator. The more information an indicator contains, the greater its weight. Moreover, its role in the comprehensive evaluation is more pronounced [62]. The calculated weight of the groundwater depth was 0.18, and that of the well density indicator was 0.82. This quantitative weighting scheme ensured that the evaluation properly accounted for the relative importance of each parameter in characterizing groundwater conditions. The formula is as follows:
z i = j = 1 m w j Y i j ,
where the weight of index j and is the standardized value of the -th index in the -th evaluation area.
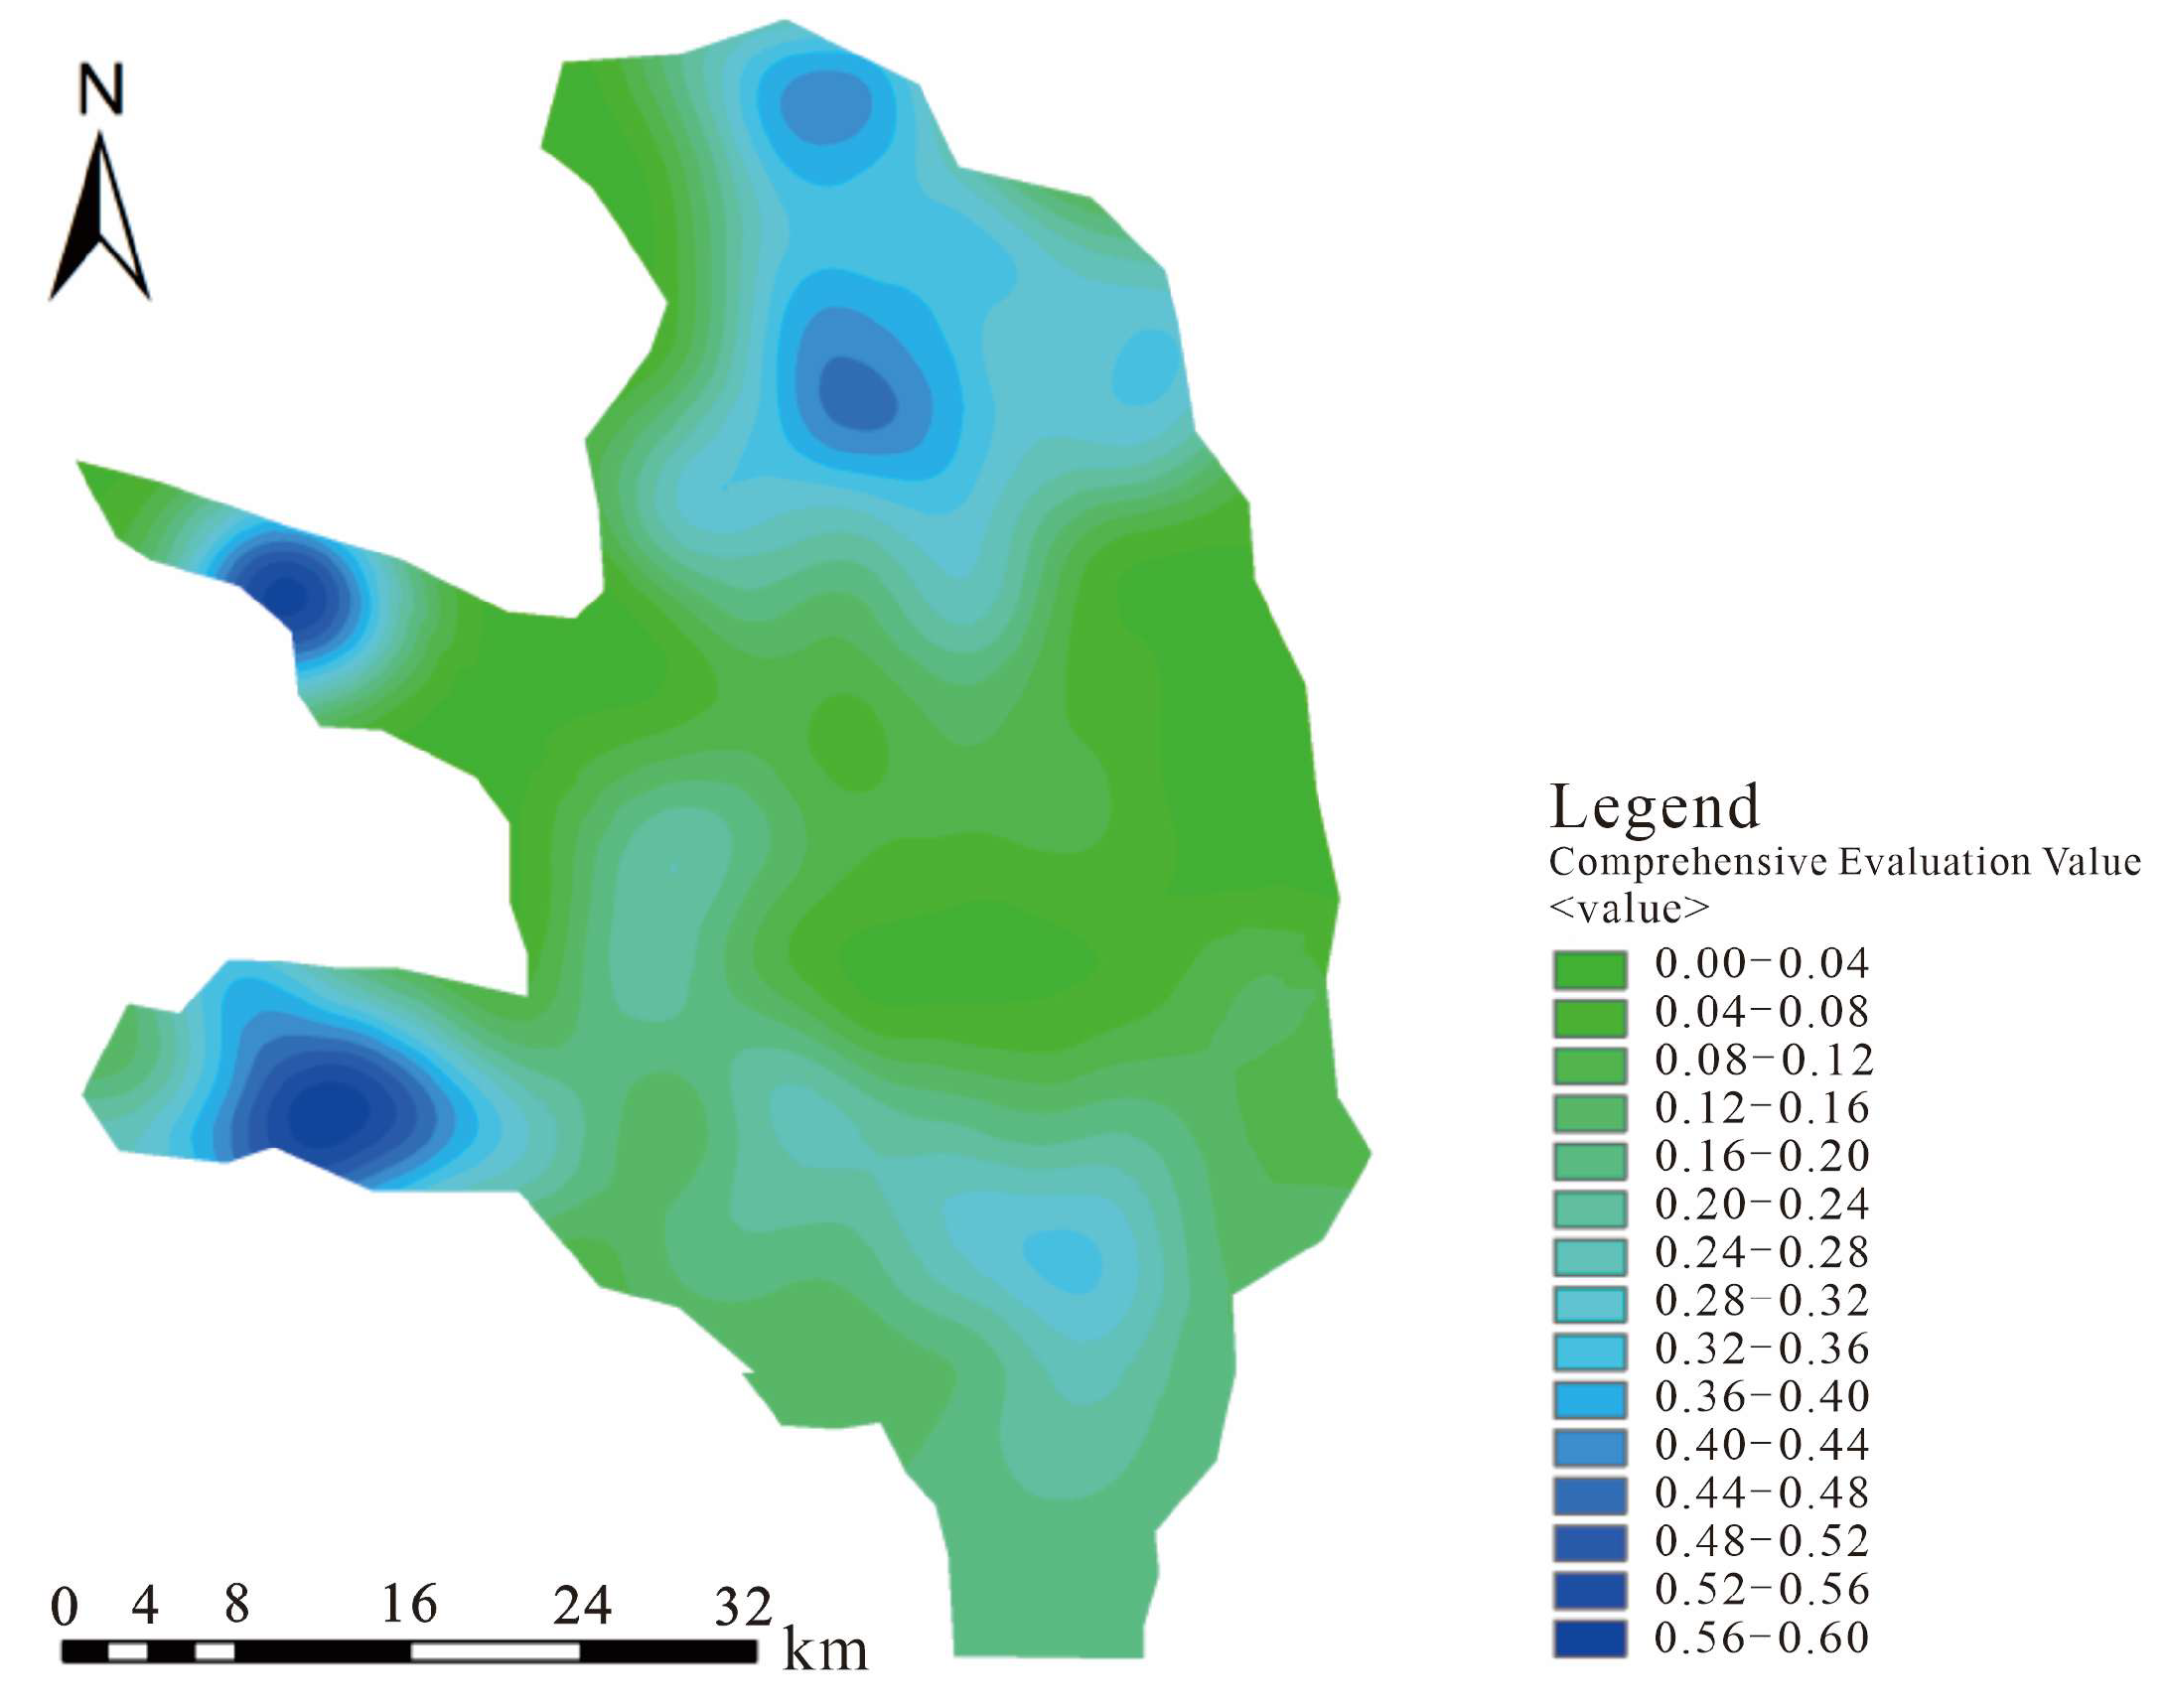
The comprehensive evaluation value (z) for each area was determined using ArcGIS raster calculation (Figure 5).
The regional evaluation aimed to identify priority areas requiring groundwater regulation, where both assessment indicators, namely, groundwater depth and well density, displayed positive correlations with the evaluation outcomes. Higher composite evaluation values indicate greater regulatory requirements within specific zones. To quantitatively assess groundwater level variations under different management strategies and enable a comparative analysis of hydrological responses to the implemented measures while demonstrating the effectiveness of targeted groundwater management interventions, two distinct regulatory scenarios (X and Y) are established:
Scenario X: Current annual mining output recharge condition. In 2016, the exploitable groundwater volume was 1.4922 × 10⁸ m3, and the water level observation data at the beginning of 2016 were set as the initial conditions for the water level simulation.
Scenario Y: Mining is performed in different proportions based on the different evaluation values of the regions. The higher the evaluation value of a region, the greater the reduction in the mining volume, serving as a guideline for groundwater extraction limits. The mining volume was determined according to the groundwater supply plan of the Eighth Division of Shihezi City. The exploitable groundwater volume in 2025 was 1.163 × 10⁸ m3, with a reduction of 0.329 × 10⁸ m3, and the exploitable groundwater volume in 2030 was 1.010 × 10⁸ m3, with a reduction of 0.482 × 10⁸ m3, respectively.
Scenario Y includes three water-reduction schemes:
Y1: Areas with a reduced regional comprehensive evaluation value > 0.20, covering 1031 wells.
Y2: Areas with a reduced regional comprehensive evaluation value > 0.32, covering 541 wells.
Y3: Water reduction was performed uniformly across the entire area, covering 1244 wells.
The evaluation value z is divided into six intervals, based on which the regulation of water extraction reduction is performed. The reduced water volume and reduction proportion for the three schemes within these intervals are listed in Table 4 and Table 5. Because the comprehensive evaluation value limits a certain regulation area, schemes Y1 and Y2 can only cover some of the wells in the study area. Compared with Scheme Y2, Scheme Y1 reduces the groundwater extraction volume over a larger area, whereas Scheme Y3, as the control group, applies water volume reduction in a uniform proportion across the entire area.

4. Results

4.1. Threshold of Suitable Groundwater Level in Shihezi Irrigation District

4.1.1. Upper Threshold of Groundwater Level

The irrigation area is primarily composed of silty loam soil, with plant root thicknesses ranging from 0.2 to 0.5 m. Taking 0.5 m as the root layer thickness and referring to previous studies, the capillary rise height under different degrees of mineralization was compiled [63] (Table 6 [64]). Based on these calculations, the upper limit of groundwater depth in the irrigation area to prevent soil salinization was 2–2.3 m.
Considering ecological protection, production safety, and economic and technical rationality, the appropriate upper threshold for the groundwater level in the industrial production area was determined to be 3 m, balancing infrastructure protection with sustainable water management objectives.

4.1.2. Lower Threshold of Groundwater Level

The maximum evaporation depth of groundwater is influenced by the lithological conditions. The irrigation area is dominated by silty-loam soil. Based on previous research on the maximum evaporation depth of groundwater in different soil types [65], the lower threshold for preventing vegetation degradation was determined to be 4–4.5 m.
The critical water table depth for calculating land subsidence using the layered summation method [58] was determined to be 4 m, which is the lower threshold for preventing land subsidence in construction projects and living and production areas.
Based on the above, it was determined that the suitable groundwater level for agricultural areas in the study area is 2–4 m; the suitable groundwater level for construction and living production areas is 3–4 m.

4.2. Comparative Analysis of Groundwater Level Evolution Trends Under Different Scenarios

The model was run under different scenarios and schemes to predict changes in groundwater levels in the irrigation area in 2025 and 2030. By analyzing the changes in groundwater levels in the irrigation area in different years, insights were obtained.
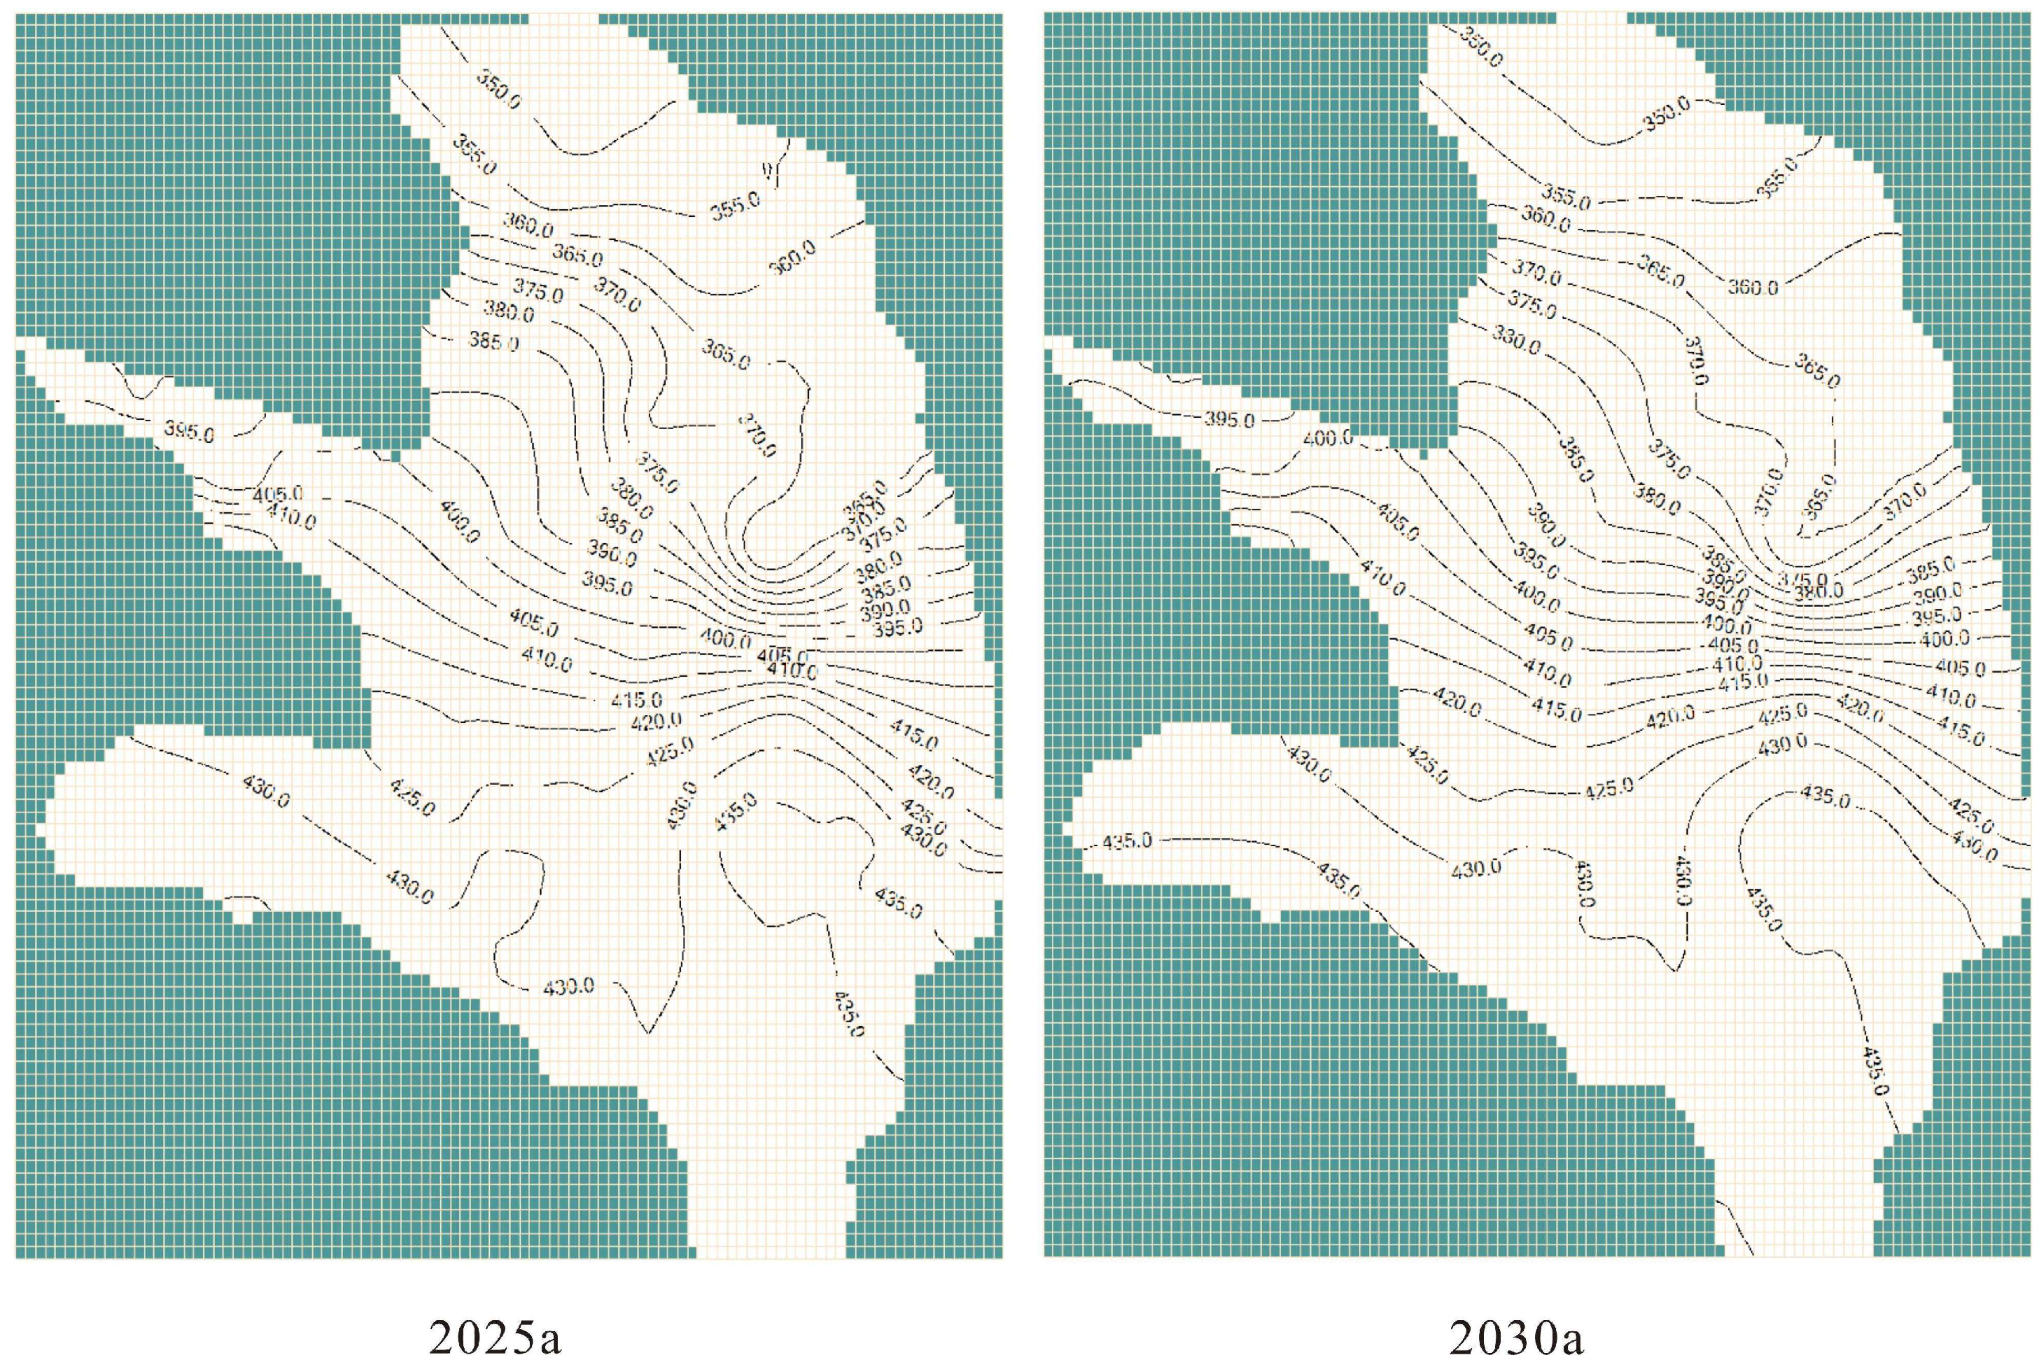
Under Scenario X, the groundwater level changes in the irrigation area for 2025 and 2030 were obtained (Figure 6). In 2025 and 2030, the overall groundwater level in the Shihezi Irrigation District showed a slow upward trend. The areas where the water level increased were mainly located around the Jiahezi Reservoir in the central part of the irrigation area. Compared with the current year (2016), the groundwater level in 2025 varied from −3.845 to 18.358 m, with an average groundwater level rebound rate of 0.238 m/a; the groundwater level change in 2030 ranged from −6.637 to 4.148 m, with an average groundwater level rebound rate of 0.067 m/a.
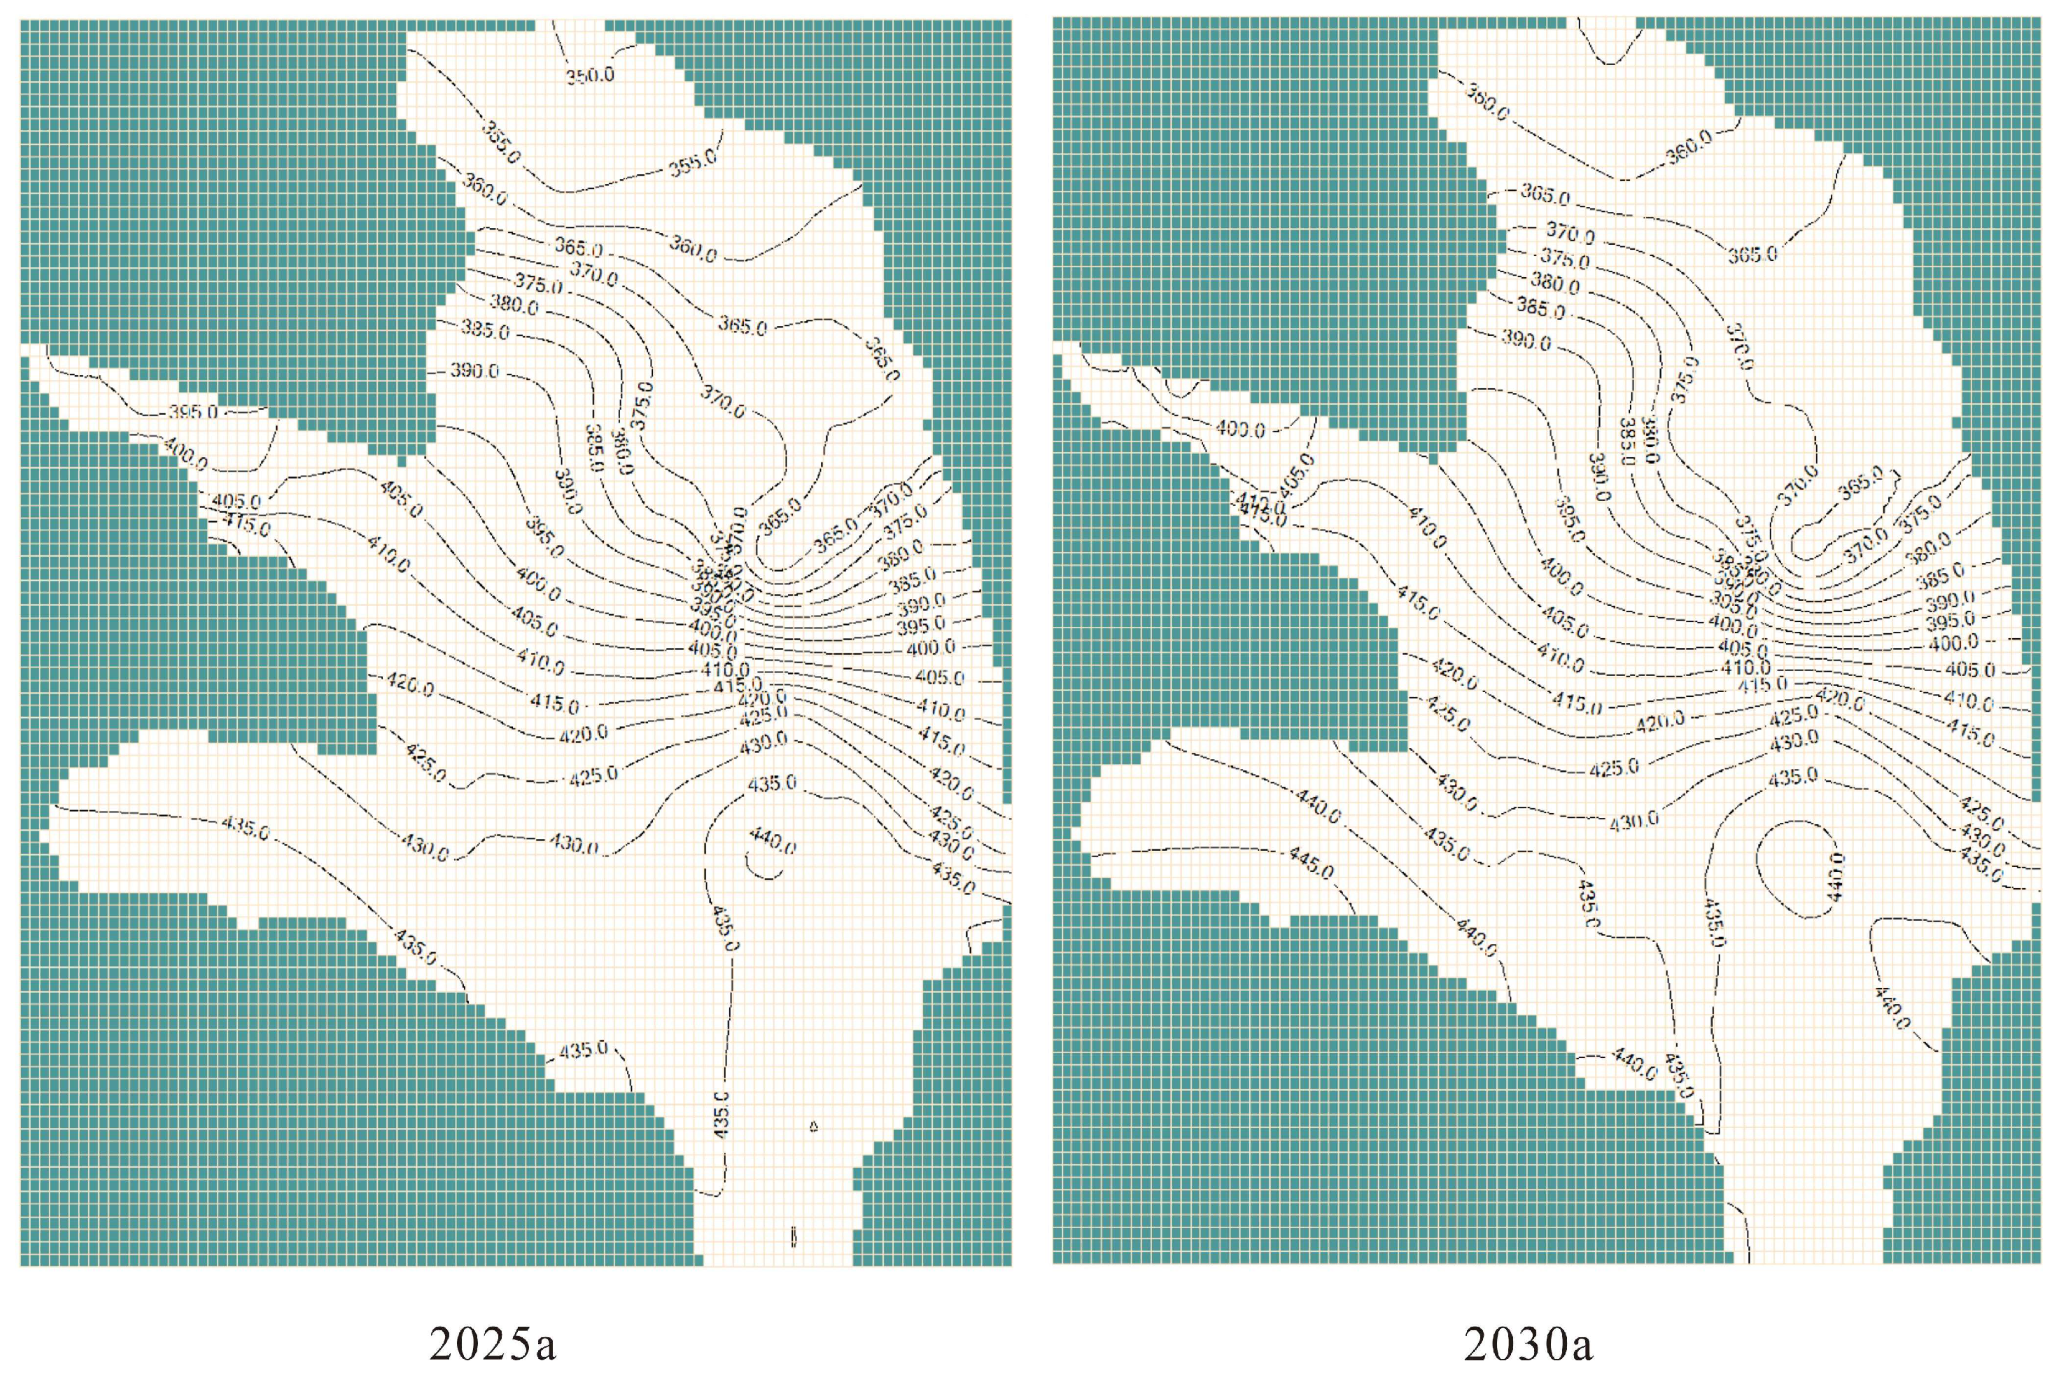
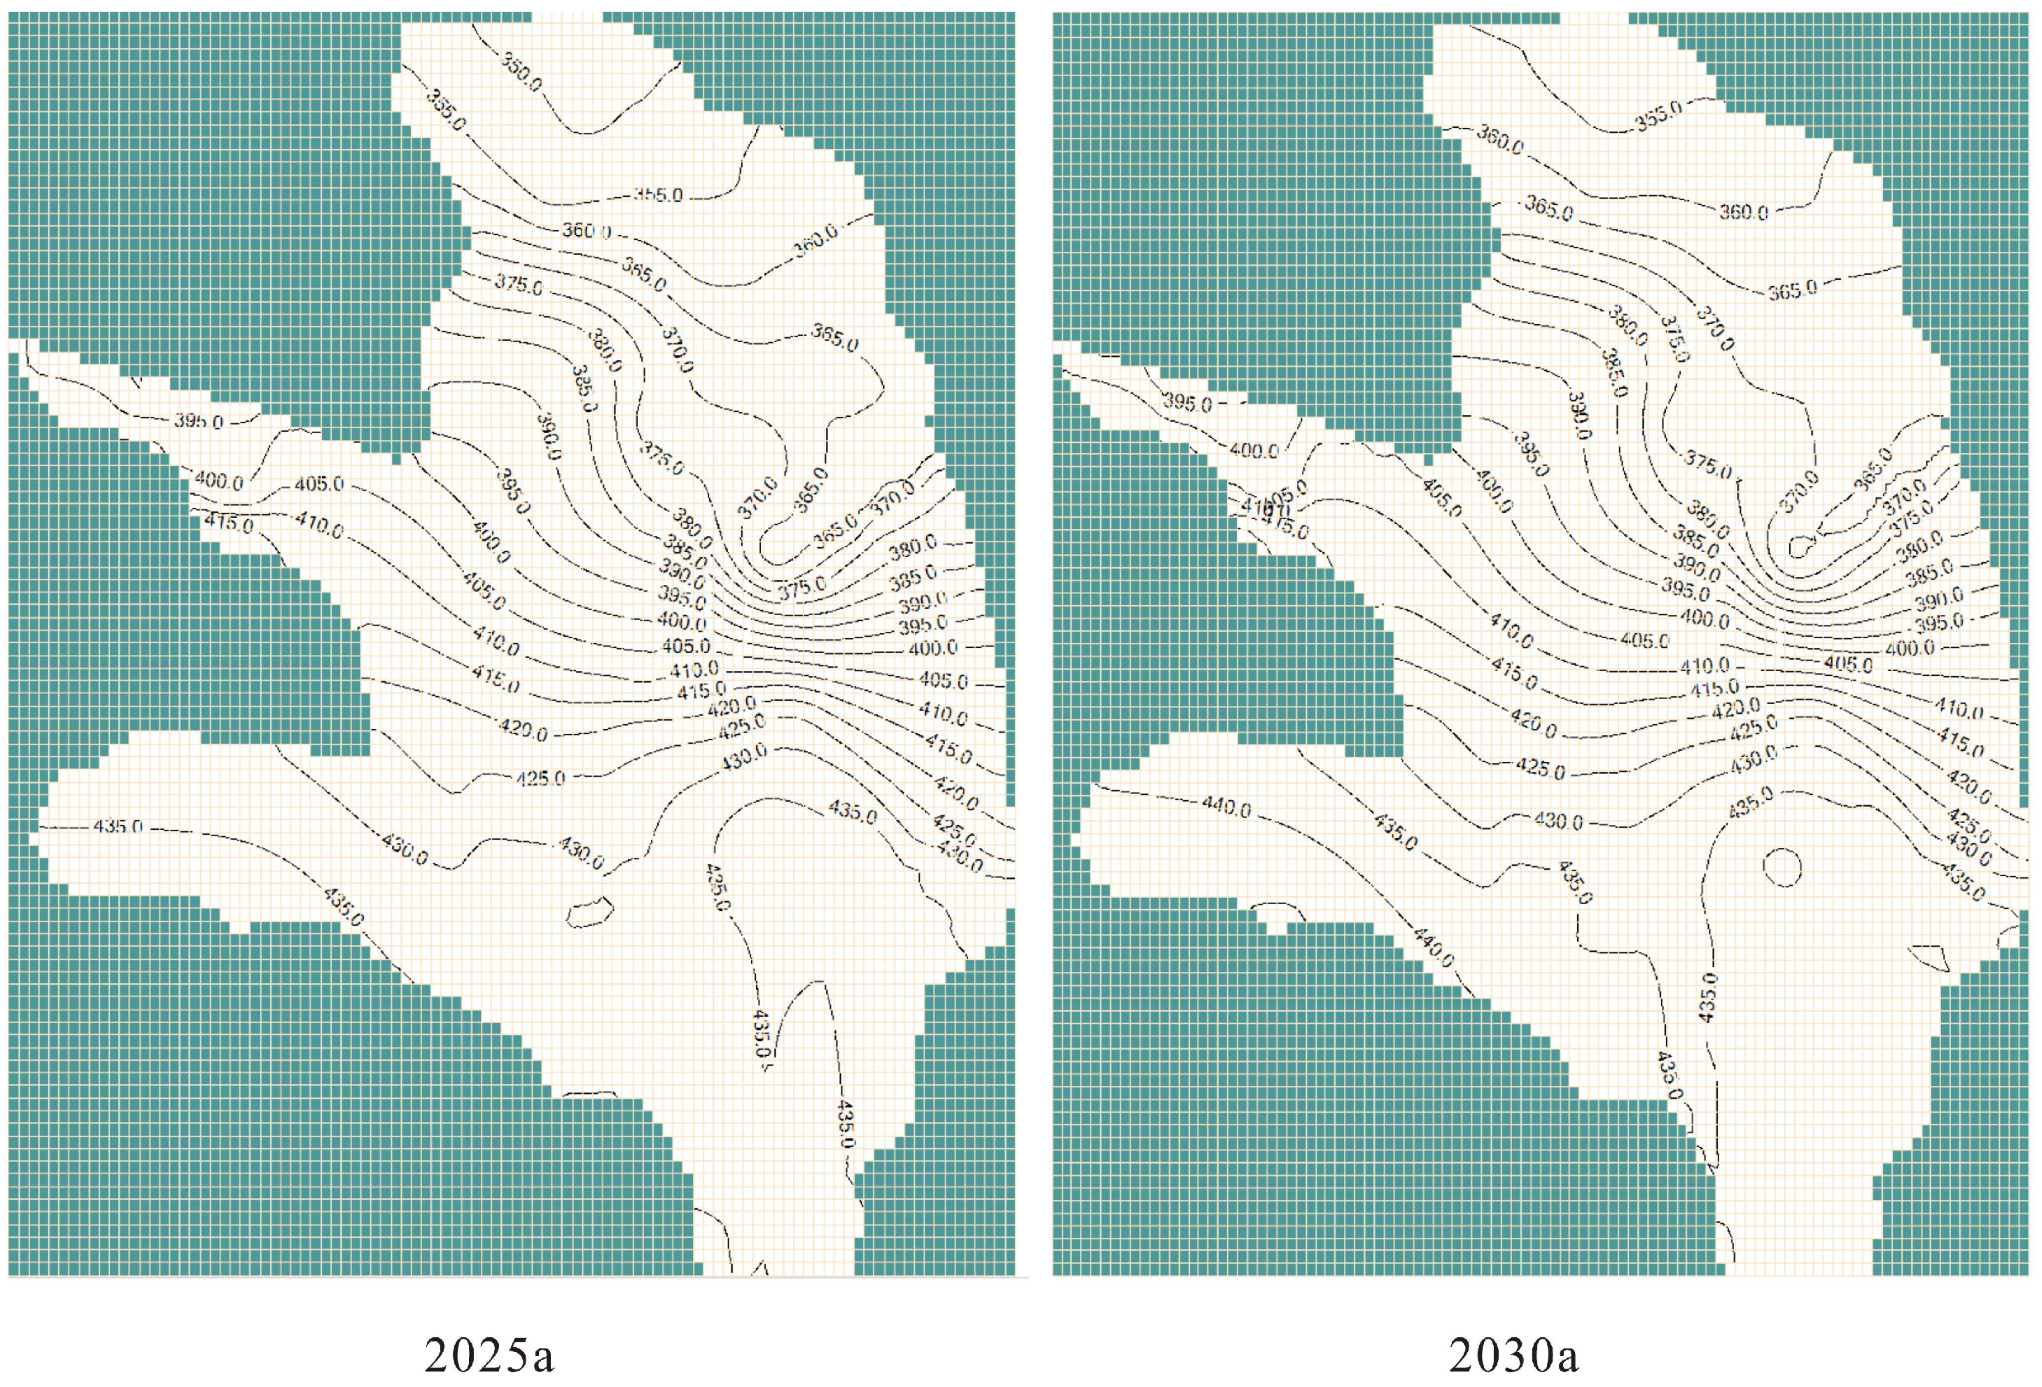
Under Scenario Y, three schemes (Y1, Y2, and Y3) were set based on the comprehensive evaluation value z and different water reduction conditions. The simulation results of groundwater levels for the different schemes are presented in Figure 7, Figure 8 and Figure 9. Because of the reduction in groundwater mining output, the groundwater levels in all three schemes typically exhibited an upward trend. In Scheme Y1 (Figure 7), the northwest region rebounded significantly from 2025 to 2030. Compared with the current year, the variation in groundwater level in 2025 is 2.591–12.904 m, and the average groundwater level recovery rate is 0.443 m/a; In 2030, the groundwater level changes from −2.675 to 9.173 m, and the average groundwater level recovery rate is 0.536 m/a. During the same period, the northern region rebounded significantly in the Y2 scheme (Figure 8). Compared with 2016, the change in water level in 2025 was −0.891 to 13.456 m, with an average groundwater level rebound rate of 0.502 m/a; the variation range of groundwater levels in 2030 ranged from −1.763 to 9.681 m, with an average water level rebound rate of 0.380 m/a. Under scheme Y3 (Figure 9), the variation range of groundwater levels in the irrigation area in 2025 was 0.299–11.903 m, with an average groundwater level rebound rate of 0.448 m/a; the variation range of groundwater levels in 2030 ranged from −0.769 to 7.414 m, with an average water level rebound rate of 0.400 m/a.
The overall rebound in scenario y is more significant than that in scenario x, and the regional downward trend is contained. The higher the comprehensive evaluation value in the north, west, and south, the higher the recovery rate of groundwater level is better than that in the central and eastern regions. Under the condition of the same total water reduction, the Y3 scheme adopted uniform water reduction (as the control group of Y1 and Y2), which had a large adjustment area, small water level change range, and little impact. Y1 and Y2 adopted different proportions of water reduction to adjust the groundwater level, and the results showed that the effect of water level recovery was better in the area where the evaluation value was higher than 0.20.

4.3. Comparative Analysis of Suitable Groundwater Level Coverage Under Different Scenarios

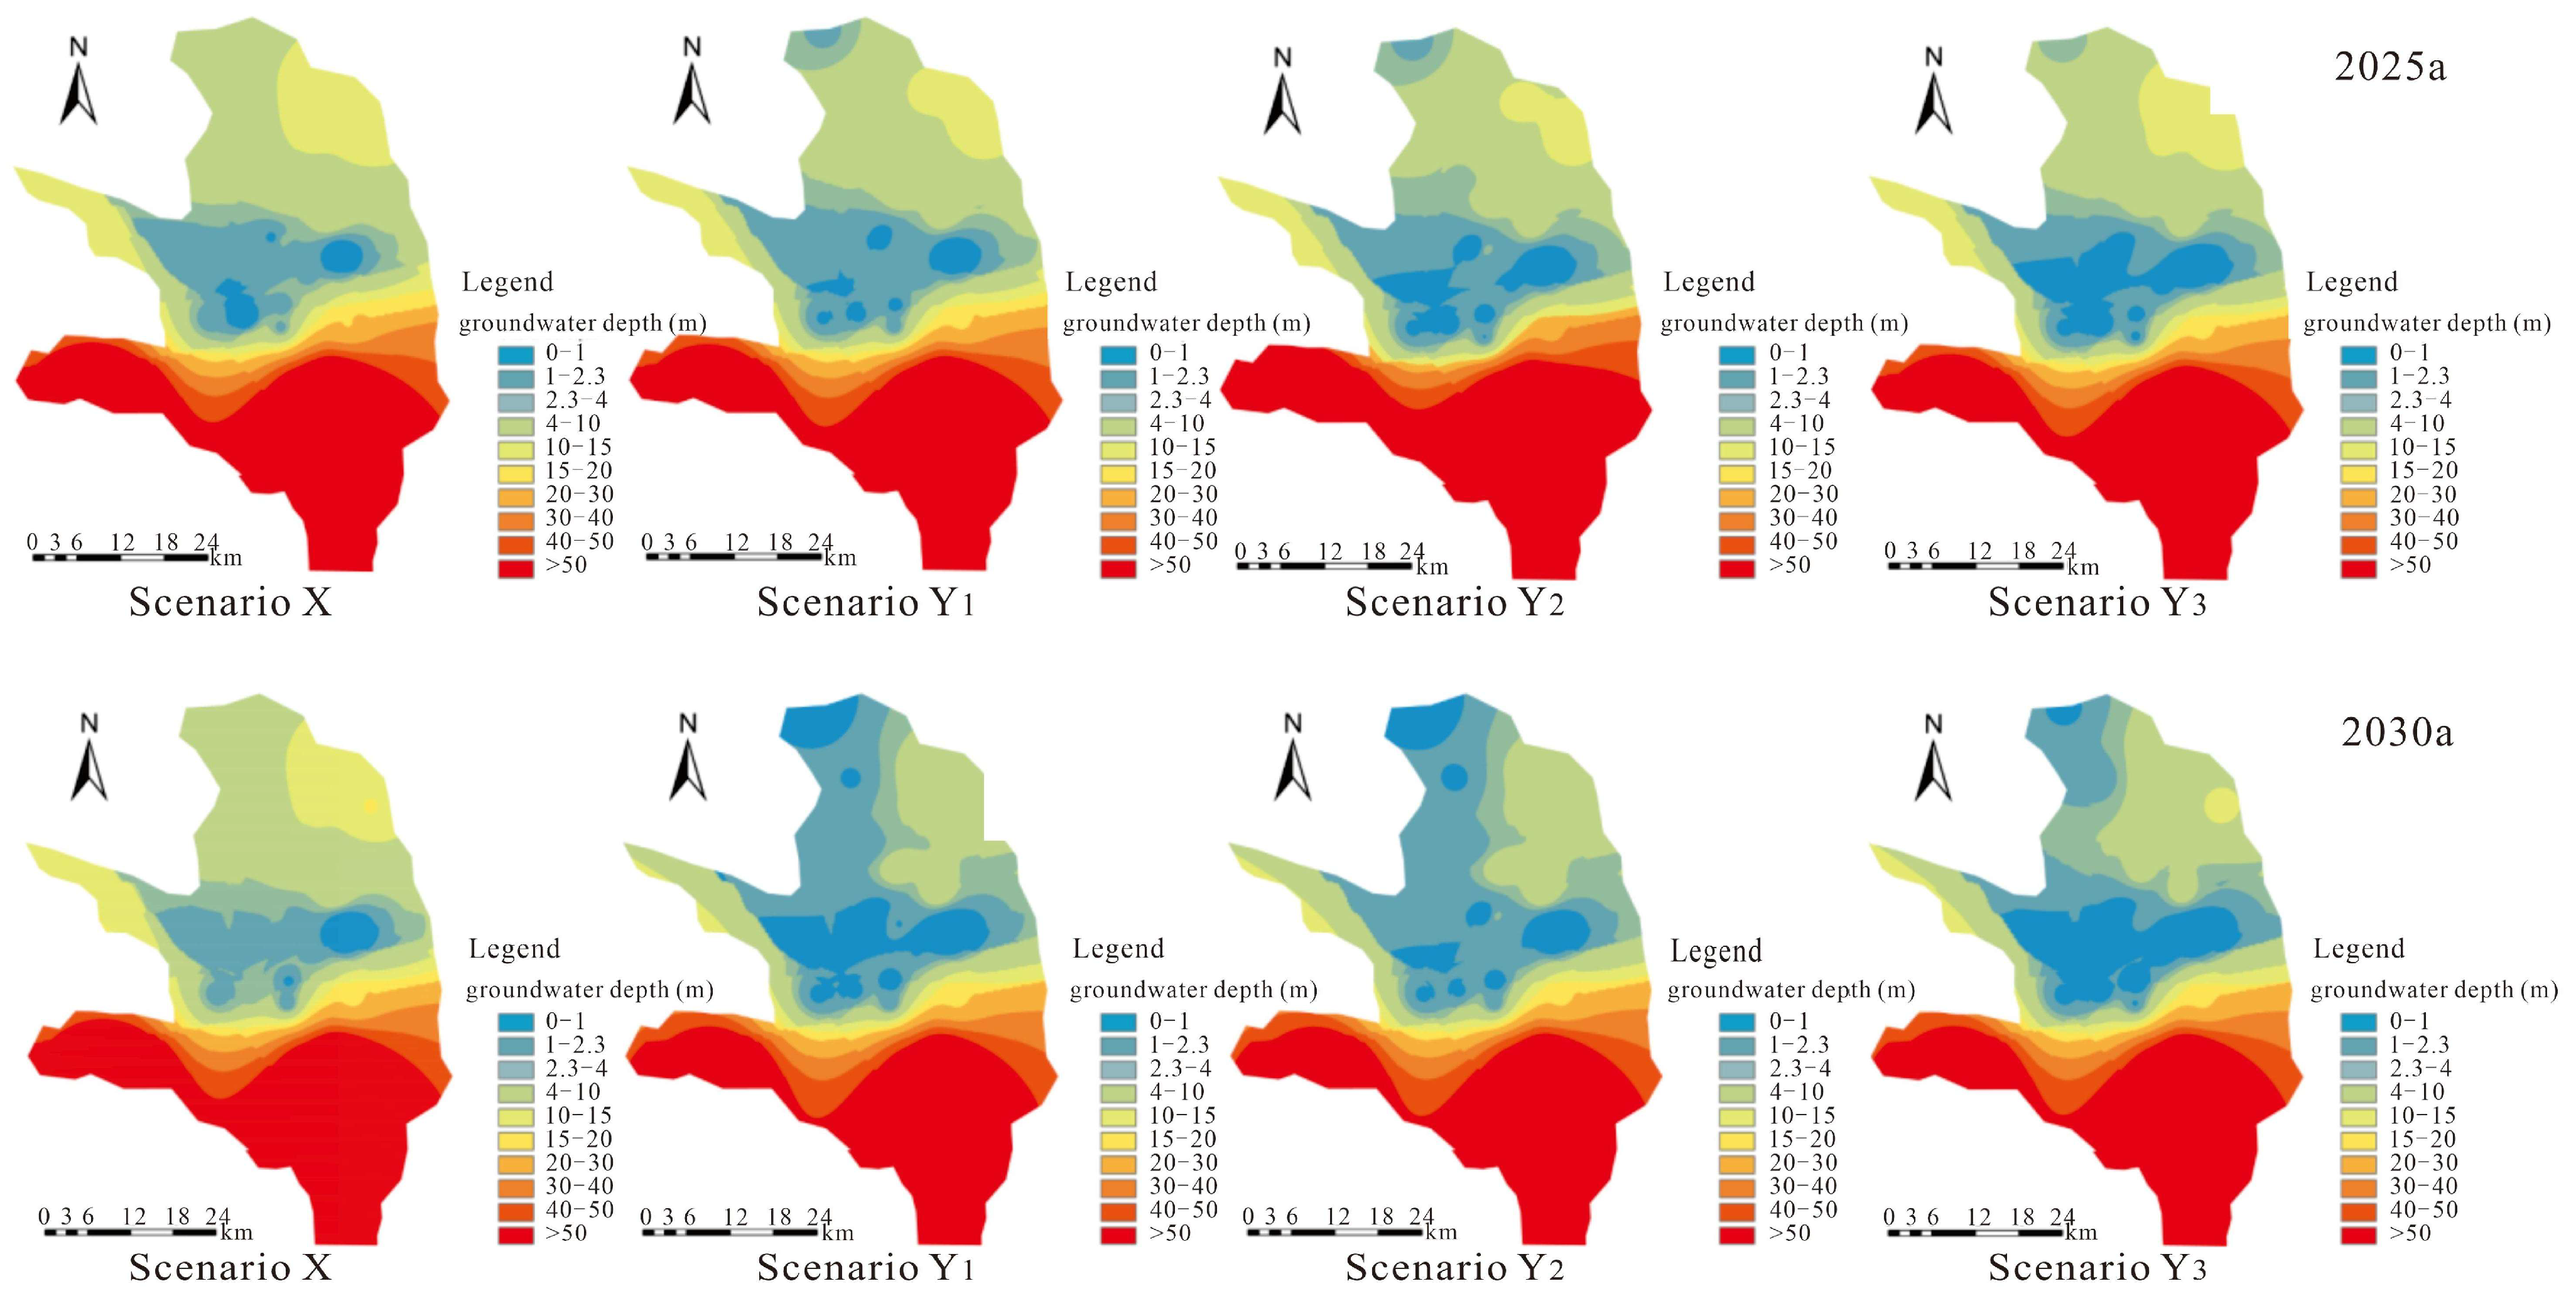
Interpolation distribution maps of groundwater depth in the irrigation area for 2025 and 2030 under scenarios X and Y were generated by using GIS (Figure 10). In scenario X, the average groundwater depth in 2025 and 2030 was 22.14 m and 21.81 m, respectively. In scenario Y, the average groundwater depth in 2025 for schemes Y1, Y2, and Y3 was 20.76 m, 20.23 m, and 20.72 m, respectively, representing increases of 6.23%, 8.63%, and 6.41% compared with scenario X. For 2030, the corresponding values for Y1, Y2, and Y3 were 18.08 m, 18.33 m, and 18.72 m, with increases of 17.10%, 15.95%, and 14.17% relative to scenario X. Comparative analysis showed that reduced water volume in scenario Y led to elevated groundwater levels in the irrigation area, mitigating the downward trend. Specifically, in 2025, Y2 resulted in a greater increase in groundwater level than Y1, whereas Y1 had a wider coverage of suitable groundwater levels. In 2030, this pattern was reversed: Y1 induced a larger level increase, whereas Y2 exhibited a broader range of suitable levels.

5. Discussion

5.1. Analysis of the Advantages of Different Regulatory Schemes

The results showed that using Visual MODFLOW to predict the groundwater regulation effect under different water reduction schemes was significant. Under Scenario X, the water level recovery rate dropped from 0.238 m/a to 0.067 m/a, reflecting the “quasi-equilibrium” trend of the groundwater system under the current measures. The recharge of groundwater in the arid irrigation area mainly depended on irrigation backflow and lateral flow; as the water level rose, the hydraulic gradient-driven recharge weakened, the recharge growth lagged behind the reduction in mining, and the marginal benefit decreased over time. This showed that the current overexploitation control measures could not maintain a long-term sustainable rise in the water level and needed to optimize the regulation. The vertical supply around the Jiahezi Reservoir can be improved by adjusting the operation of the reservoir.
Compared with scenario X, scenario Y had a more favorable effect on the rise in the groundwater level. During the same period, the lowest water level rise rate in scenario Y was much higher than that in scenario X (2030: 0.380 m/a > 0.067 m/a; 2025: 0.448 m/a > 0.238 m/a). It was confirmed that reducing the intensity of groundwater extraction led to significant changes in the water level, and the reduction in extraction intensity was the dominant factor in changing the “recharge-extraction balance” of the groundwater system. The good recovery rate of high-value areas under Scenario Y further confirmed the positive correlation between restoration intensity and recovery rate, which was in line with the highly sensitive law of groundwater level to mining changes in arid areas. The agriculture in the study area was mainly irrigation-based, and for the northwest arid area, groundwater was the core water source for agriculture and ecology.
The comparison between schemes Y1, Y2 (target regulation), and Y3 (unified regulation) reflected the influence of the regulation mode on the spatial heterogeneity of horizontal evolution. As a control group, Y3 had a lower regulation advantage than scheme Y2 in the short term (0.448 m/a < 0.502 m/a), while in the long term (≥10 a), scheme Y1 had a more significant regulation advantage on water level (0.536 m/a > 0.400 m/a). The targeted regulation of Y1 and Y2 matched the intensity of reduction with regional characteristics, avoided resource waste, and met the requirements of complex irrigation area management. The unified regulation ignored spatial differences, and the overall effect was not significant.

5.2. Influence of Different Schemes on the Appropriate Groundwater Level Coverage

The observed differences in groundwater level dynamics between Schemes Y1 and Y2 reflected the inherent spatiotemporal variability of groundwater systems, where short-term and long-term regulatory effects were frequently linked to factors such as aquifer storage capacity, recharge-discharge processes, and hydraulic conductivity; over the short-term horizon (2025), Scheme Y2’s superior performance in elevating groundwater levels could be attributed to its more intensive initial water reduction measures, which rapidly reduced groundwater abstraction rates and thereby facilitated accelerated groundwater level recovery—a phenomenon that was consistent with the immediate response of shallow aquifers to changes in anthropogenic stress. Prior research had established that the optimal groundwater level range for agricultural zones was 2–4 m, whereas the optimal range for construction, domestic, and industrial areas was 3–4 m, and comparative analysis demonstrated that Scheme Y1 achieved broader coverage of optimal groundwater levels, while in the long term, Scheme Y2 outperformed both Schemes Y1 and Y3 in terms of the extent of such optimal groundwater level coverage. The sustained, moderate water reduction implemented under Scheme Y1 might enable gradual recharge of deep aquifers, which typically exhibited slower response kinetics but contributed more substantially to long-term groundwater level stability, in contrast to the high-intensity regulation deployed during Scheme Y2’s initial phase, which might result in diminishing marginal returns of regulatory benefits as the aquifer approached a new state of equilibrium.

6. Conclusions

Based on an in-depth analysis of groundwater level data and topographic and hydrogeological data from observation wells in the Shihezi Irrigation District, this study developed a 3D groundwater flow numerical model based on the water balance method. Following the regional evaluation, three schemes were established according to different comprehensive evaluation value areas and water-reduction levels to predict groundwater levels and regulate groundwater level suitability in the irrigation district. The following conclusions were drawn:
(1)
Considering the prevention of vegetation degradation, the groundwater table depth for preventing land subsidence, and the safe water level that does not cause soil salinization and ensures the safety of construction projects and living and production areas, the suitable groundwater table depth in the agricultural area of the study area is 2–4 m, and the suitable groundwater table depth in the construction projects and living and production areas is 3–4 m.
(2)
Under different proportions of water reduction, areas with a comprehensive evaluation value > 0.2 (Y1) have a significant effect on regulating the recovery of groundwater levels, effectively curbing the downward trend of groundwater levels. From a long-term perspective, their regulation of the increase in water levels is better than that of areas with a comprehensive evaluation value > 0.32 (Y2).
(3)
Under the same water-reduction amount, the water-reduction schemes based on regional evaluation values (Y1 and Y2) can achieve more precise regulation and recovery of groundwater levels compared to the uniform proportional reduction scheme for an entire region (Y3). From a long-term perspective, a region with a comprehensive evaluation value > 0.32 (Y2) achieves a wider coverage of suitable water levels while regulating with fewer wells.

Supplementary Materials

The following supporting information can be downloaded at: https://www.mdpi.com/article/10.3390/w17223232/s1, Figure S1. Groundwater depth distribution in Shihezi Irrigation District in 2016; Table S1. Values of precipitation infiltration coefficient α in the study area; Table S2. Calculation results of precipitation infiltration recharge; Table S3. Correction coefficient of canal system leakage; Table S4. Anti-seepage correction coefficient (γ) table; Table S5. Irrigation channel construction in the study area; Table S6. Shihezi irrigation canal water use coefficient ƞ; Table S7. Calculation table of leakage supply of canal system; Table S8. Leakage supply of Dounong Canal system in Shihezi Irrigation District; Table S9. Calculation table of irrigation infiltration recharge in Shihezi Irrigation District; Table S10. Recharge coefficient of reservoir leakage α 1 ; Table S11. Calculation table of reservoir leakage and supply in Shihezi Irrigation area; Table S12. Calculation table of river infiltration recharge; Table S13. Aquifer permeability coefficient (K); Table S14. Calculation table of piedmont and outlying lateral supply; Table S15. phreatic evaporation coefficient C; Table S16. Correction coefficient C1 of vegetation state under vegetation cover in the middle part of the northern foot of Tianshan Mountains; Table S17. Calculation table of phreatic evaporation in Shihezi Irrigation Area; Table S18. Groundwater exploitation of regiments in the study area in 2016; Table S19. Calculation table of piedmont and outlying lateral supply; Table S20. Calculation of water balance results.

Author Contributions

Conceptualization, J.Z. and Y.X.; methodology, J.Z., Y.X. and W.W.; validation, J.Z., Y.Z. and X.L.; formal analysis, X.L., Q.L. and J.Z.; investigation, J.Z. and Y.X.; resources, G.Y., X.L. and Y.Z.; data curation, J.Z., Q.L., Y.Z. and W.W.; writing—original draft preparation, J.Z. and Y.X.; writing—review and editing, G.Y., Y.X. and J.Z.; visualization, X.L., Y.X. and G.Y.; supervision, G.Y.; project administration, G.Y. and Y.X.; funding acquisition, G.Y. All authors have read and agreed to the published version of the manuscript.

Funding

This research was supported by Science and Technology Program of XPCC (2025AB031, 2024DA043, 2023TSYCCX0114, 2023AB059); Project of Shihezi (2023NY01); Major Science and Technology Program of Xinjiang Uygur Autonomous Region (2024A03006-5).

Data Availability Statement

The original contributions presented in this study are included in the article. Further inquiries can be directed to the corresponding author.

Conflicts of Interest

The authors declare no conflicts of interest.

References

  1. Zhao, W.; Chang, X. The impact of hydrological process changes in the Hexi Corridor on NDVI in the transition zone between desert and oasis. Chin. Sci. Earth Sci. 2014, 44, 1561–1571. [Google Scholar] [CrossRef]
  2. Liu, M.; Jiang, Y.; Xu, X.; Huang, Q.; Huo, Z.; Huang, G. Long-term groundwater dynamics affected by intense agricultural activities in oasis areas of arid inland river basins, Northwest China. Agric. Water Manag. 2018, 203, 37–52. [Google Scholar] [CrossRef]
  3. Yin, X.; Feng, Q.; Zheng, X.; Wu, X.; Zhu, M.; Sun, F.; Li, Y. Assessing the impacts of irrigated agriculture on hydrological regimes in an oasis-desert system. J. Hydrol. 2021, 594, 125976. [Google Scholar] [CrossRef]
  4. Li, H.; Lu, Y.; Zheng, C.; Zhang, X.; Zhuo, B.; Wu, J. Seasonal and inter-annual variability of groundwater and their responses to climate change and human activities in arid and desert areas: A case study in Yaoba Oasis, Northwest China. Water 2020, 12, 303. [Google Scholar] [CrossRef]
  5. Arulbalaji, P.; Padmalal, D.; Sreelash, K. GIS and AHP techniques based delineation of groundwater potential zones: A case study from southern Western Ghats, India. Sci. Rep. 2019, 9, 2082. [Google Scholar] [CrossRef]
  6. Wu, W.Y.; Lo, M.H.; Wada, Y.; Famiglietti, J.S.; Reager, J.T.; Yeh, P.J.F.; Ducharne, A.; Yang, Z.L. Divergent effects of climate change on future groundwater availability in key mid-latitude aquifers. Nat. Commun. 2020, 11, 3710. [Google Scholar] [CrossRef]
  7. Zhang, Y.; Kang, W.; Zhao, W. Research progress on the adaptation mechanisms and stable state transition of groundwater-dependent vegetation in drylands. Adv. Earth Sci. 2025, 40, 243–254. [Google Scholar] [CrossRef]
  8. Long, R.; Zhang, J.; Yu, K.; Gu, X.; Li, Y.; Dong, J.; Su, X.; Zhu, J. Groundwater evolution and its ecological effects in the Kongque River Basin, Xinjiang. Hydrogeol. Eng. Geol. 2023, 50, 41–50. [Google Scholar] [CrossRef]
  9. Chang, F.J.; Huang, C.W.; Cheng, S.T.; Chang, L.C. Conservation of groundwater from over-exploitation—Scientific analyses for groundwater resources management. Sci. Total Environ. 2017, 598, 828–838. [Google Scholar] [CrossRef]
  10. Kuang, X.; Liu, J.; Scanlon, B.R.; Jiao, J.J.; Jasechko, S.; Lancia, M.; Biskaborn, B.K.; Wada, Y.; Li, H.; Zeng, Z.; et al. The changing nature of groundwater in the global water cycle. Science 2024, 383, eadf0630. [Google Scholar] [CrossRef]
  11. Tazhiyev, S.; Murtazin, Y.; Rakhimova, V.; Rakhmetov, I.; Adenova, D.; Koshpanova, K.; Sotnikov, Y.; Abdizhael, M.; Akylbayeva, A.; Yerezhep, D. Applied Hydrogeological Assessment and GIS-Based Modeling of Transboundary Aquifers in the Shu River Basin. Water 2025, 17, 2476. [Google Scholar] [CrossRef]
  12. Siebert, S.; Burke, J.; Faures, J.M.; Frenken, K.; Hoogeveen, J.; Döll, P.; Portmann, F.T. Groundwater use for irrigation–a global inventory. Hydrol. Earth Syst. Sci. 2010, 14, 1863–1880. [Google Scholar] [CrossRef]
  13. Jin, X. Quantitative relationship between the desert vegetation and groundwater depth in Ejina Oasis the Heihe River Basin. Geosci. Front. 2010, 17, 181–186. [Google Scholar]
  14. Jiao, P.; Hu, S.J. Estimation of Evapotranspiration in the Desert–Oasis Transition Zone Using the Water Balance Method and Groundwater Level Fluctuation Method—Taking the Haloxylon ammodendron Forest at the Edge of the Gurbantunggut Desert as an Example. Water 2023, 15, 1210. [Google Scholar] [CrossRef]
  15. Guo, X.; Liu, Q.; Li, W.; Zhang, H.; Xiong, H.; Wang, C.; Chen, L. Groundwater imbalance and its feedback relationship with land use in the West Liaohe Plain. Hydrogeol. Eng. Geol. 2024, 51, 77–87. [Google Scholar] [CrossRef]
  16. Doble, R.; Simmons, C.; Jolly, I.; Walker, G. Spatial relationships between vegetation cover and irrigation-induced groundwater discharge on a semi-arid floodplain, Australia. J. Hydrol. 2006, 329, 75–97. [Google Scholar] [CrossRef]
  17. Rossatto, D.R.; Silva, L.C.R.; Villalobos-Vega, R.; Sternberg, L.D.; Franco, A.C. Depth of water uptake in woody plants relates to groundwater level and vegetation structure along a topographic gradient in a neotropical savanna. Environ. Exp. Bot. 2012, 77, 259–266. [Google Scholar] [CrossRef]
  18. Yan, J.; Chen, X.; Luo, G.; Guo, Q. Temporal and spatial variability response of groundwater level to land use/land cover change in oases of arid areas. Chin. Sci. Bull. 2006, 51 (Suppl. S1), 51–59. [Google Scholar] [CrossRef]
  19. Cochard, H.; Cruiziat, P.; Tyree, M.T. Use of positive pressures to establish vulnerability curves: Further support for the air-seeding hypothesis and implications for pressure-volume analysis. Plant Physiol. 1992, 100, 205–209. [Google Scholar] [CrossRef]
  20. Li, X.; Zheng, Y.; Sun, Z.; Tian, Y.; Zheng, C.; Liu, J.; Liu, S.; Xu, Z. An integrated ecohydrological modeling approach to exploring the dynamic interaction between groundwater and phreatophytes. Ecol. Model. 2017, 356, 127–140. [Google Scholar] [CrossRef]
  21. Salameh, E. Over-exploitation of groundwater resources and their environmental and socio-economic implications: The case of Jordan. Water Int. 2008, 33, 55–68. [Google Scholar] [CrossRef]
  22. Aeschbach-Hertig, W.; Gleeson, T. Regional strategies for the accelerating global problem of groundwater depletion. Nat. Geosci. 2012, 5, 853–861. [Google Scholar] [CrossRef]
  23. Shao, J.; Bai, G.; Liu, C.; Zhang, C.; Cui, Y. Problems and countermeasures of groundwater management in China: Concurrentlytalking about groundwater dual-control managemen. Hydrogeol. Eng. Geol. 2023, 50, 1–9. [Google Scholar] [CrossRef]
  24. Shi, J.; Wang, Z.; Zhang, Z.; Fei, Y.; Li, Y.; Zhang, F.E.; Chen, J.; Qian, Y. Assessment of deep groundwater over-exploitation in the North China Plain. Geosci. Front. 2011, 2, 593–598. [Google Scholar] [CrossRef]
  25. Alfarrah, N.; Walraevens, K. Groundwater overexploitation and seawater intrusion in coastal areas of arid and semi-arid regions. Water 2018, 10, 143. [Google Scholar] [CrossRef]
  26. Shen, X.; Cao, W.; Ankaer, ·A.; Wang, C.; Xu, A. Discussion on the Comprehensive treatment model of typical groundwater Over-extraction areas in Xinjiang—Take Wusu City groundwater Over-exploitation area as an Example. Ground Water 2024, 46, 101–104+267. [Google Scholar] [CrossRef]
  27. Jasechko, S.; Seybold, H.; Perrone, D.; Fan, Y.; Shamsudduha, M.; Taylor, R.G.; Fallatah, O.; Kirchner, J.W. Rapid groundwater decline and some cases of recovery in aquifers globally. Nature 2024, 625, 715–721. [Google Scholar] [CrossRef]
  28. Wei, H.; Zhao, S.; Liu, J.; Zhang, L. Benefit Evaluation of Comprehensive Treatment of Groundwater Overexploitation. J. North China Univ. Water Resour. Electr. Power (Nat. Sci. Ed.) 2024, 45, 51–59. [Google Scholar] [CrossRef]
  29. Jia, X.; O’Connor, D.; Hou, D.; Jin, Y.; Li, G.; Zheng, C.; Ok, Y.; Tsang, D.C.; Luo, J. Groundwater depletion and contamination: Spatial distribution of groundwater resources sustainability in China. Sci. Total Environ. 2019, 672, 551–562. [Google Scholar] [CrossRef]
  30. Wang, X.; Shao, J.; Cui, Y.; Zhang, Q. Application of a Surrogate Model for a Groundwater Numerical Simulation Model for Determination of the Annual Control Index of the Groundwater Table in China. Sustainability 2020, 12, 5752. [Google Scholar] [CrossRef]
  31. Huang, F.; Wang, G.H.; Yang, Y.Y.; Wang, C.B. Overexploitation status of groundwater and induced geological hazards in China. Nat. Hazards 2014, 73, 727–741. [Google Scholar] [CrossRef]
  32. Huang, X. Study on the Appropriate Control of Groundwater Level in Shihezi City. Master’s Thesis, Xinjiang Agricultural University, Urumqi, China, 2021. [Google Scholar]
  33. Kim, N.W.; Chung, I.M.; Won, Y.S.; Arnold, J.G. Development and application of the integrated SWAT–MODFLOW model. J. Hydrol. 2008, 356, 1–16. [Google Scholar] [CrossRef]
  34. Lozano Hernández, B.L.; Marín Celestino, A.E.; Martínez Cruz, D.A.; Ramos Leal, J.A.; Hernández Pérez, E.; García Pazos, J.; Almanza Tovar, O.G. A systematic review of the current state of numerical groundwater modeling in American Countries: Challenges and future research. Hydrology 2024, 11, 179. [Google Scholar] [CrossRef]
  35. Zhai, J.; Liu, K.; Zhao, Y.; Dong, Y.; Wang, L.; Jiang, S. Advances in Regulation Method and Model of Ecological Groundwater Level in Arid Oasis Regions. J. China Hydrol. 2021, 41, 1–7. [Google Scholar] [CrossRef]
  36. Guo, H.; Xu, H.; Ling, H. Study of Ecological Water Transfer Mode and Ecological Compensation Scheme of the Tarim River Basin in Dry Years. J. Nat. Resour. 2017, 32, 1705–1717. [Google Scholar] [CrossRef]
  37. Shi, J.; Li, G.; Liang, X.; Cheng, Z.; Shao, J.; Song, X. Evolution Mechanism and Control of Groundwater in the North China Plain. Acta Geosci. Sin. 2014, 35, 527–534. [Google Scholar] [CrossRef]
  38. Shang, H.; Wang, W.; Duan, L.; Huo, C. Regulation and Simulation Analysis of Groundwater Based on Ecological Water Level in the Northern Foot of Tianshan Mountains. Res. Soil Water Conserv. 2014, 21, 144–147. [Google Scholar] [CrossRef]
  39. Hao, Y.; Xie, Y.; Ma, J.; Zhang, W. The critical role of local policy effects in arid watershed groundwater resources sustainability: A case study in the Minqin oasis, China. Sci. Total Environ. 2017, 601, 1084–1096. [Google Scholar] [CrossRef]
  40. Li, M.; Ning, L.; Lu, T. Determination and the Control of Critical Groundwater Table in Soil Salinization Area. J. Irrig. Drain. 2015, 34, 46–50. [Google Scholar] [CrossRef]
  41. Zhang, C.; Shao, J.; Li, C.; Cui, Y. A Study on the Ecological Groundwater Table in the North China Plain. Jilin Univ. (Earth Sci. Ed.). 2003, 323–326+330. [Google Scholar] [CrossRef]
  42. Cui, Y.; Shao, J.; Han, S. Ecological Environment Adjustment by Groundwater in Northwest China. Earth Sci. Front. 2001, 8, 191–196. [Google Scholar] [CrossRef]
  43. Liu, W. Research on the Optimal Allocation of Water Resources Based on the Ecological Water Level of Groundwater. Master’s Thesis, North China University of Water Resources and Electric Power, Zhengzhou, China, 2016. [Google Scholar]
  44. Zhao, S. Study on the Regulation Scheme of Groundwater Exploitation in the Sanjiang Plain Based on the Appropriate Groundwater Level. Master’s Thesis, Jilin University, Jilin, China, 2023. [Google Scholar]
  45. Goedhart, C.M.; Pataki, D.E. Ecosystem effects of groundwater depth in Owens Valley, California. Ecohydrology 2011, 4, 458–468. [Google Scholar] [CrossRef]
  46. Fan, Y.; Miguez-Macho, G.; Jobbágy, E.G.; Jackson, R.B.; Otero-Casal, C. Hydrologic regulation of plant rooting depth. Proc. Natl. Acad. Sci. USA 2017, 114, 10572–10577. [Google Scholar] [CrossRef] [PubMed]
  47. Cheng, Y.; Chen, L.; Yin, J.; Bai, Z.; Zhao, W. Depth Interval Study of Vegetation Ecological Groundwater in the Water Source Area at Manaz River Valley. Environ. Sci. Technol. 2018, 41, 26–33. [Google Scholar] [CrossRef]
  48. Wang, W.; Su, X.; Wang, X. Evaluation of Vegetation Ecological Risk under Groundwater Exploitation: A Case Study of the Wulan Nao’er Area in Ordos. J. Jilin Univ. (Earth Sci. Ed.) 2010, 40, 1344–1352. [Google Scholar] [CrossRef]
  49. Ali, R.; Elliott, R.L.; Ayars, J.E.; Stevens, E.W. Soil salinity modeling over shallow water tables. II: Application of LEACHC. J. Irrig. Drain. Eng. 2000, 126, 234–242. [Google Scholar] [CrossRef]
  50. Horton, J.L.; Hart, K.S.C. Physiological Response to Groundwater Depth Varies among Species and with River Flow Regulation. Ecol. Appl. 2001, 11, 1046–1059. [Google Scholar] [CrossRef]
  51. Benyamini, Y.; Mirlas, V.; Marish, S.; Gottesman, M.; Fizik, E.; Agassi, M. A survey of soil salinity and groundwater level control systems in irrigated fields in the Jezre’el Valley, Israel. Agric. Water Manag. 2005, 76, 181–194. [Google Scholar] [CrossRef]
  52. Wang, W.; Tian, H.; Yang, G.; Liu, B.; Pan, Y.; Ding, G.; Xu, X.; Dan, Y.; Cui, M.; Gao, Y. Dynamic variation of groundwater level and its influencing factors in typical oasis irrigated areas in Northwest China. Open Geosci. 2023, 15, 20220493. [Google Scholar] [CrossRef]
  53. Zhao, H. Study on Ecological Groundwater Level and the Amount of Regulation in Plain Region of Western Jilin Province. Ph.D. Thesis, China University of Geosciences (Beijing), Beijing, China, 2012. [Google Scholar]
  54. Lu, X. Analysis of the Sustainable Development and Utilization Scheme of Groundwater in the Songhua River-Naoli River Basin of the Sanjiang Plain. Master’s Thesis, Jilin University, Jilin, China, 2020. [Google Scholar]
  55. GB50007-2011; Ministry of Housing and Urban-Rural Development of the People’s Republic of China. Code for Design of Building Foundation. China Academy of Building Research: Beijing, China, 2011.
  56. Mahmoud, M.S. Planning for groundwater management using visual MODFLOW model and multi-criteria decision analysis, West–West Minya, Egypt. Appl. Water Sci. 2023, 13, 72. [Google Scholar] [CrossRef]
  57. Dong, X.; Deng, M. Xinjiang Groundwater Resources Xinjiang; Xinjiang Science and Technology Press: Urumqi, China, 2005. [Google Scholar]
  58. Wang, Y.; Ding, J.; Lv, H.; Song, C.; Zhou, C.; Liu, Z.; Lu, Y. Estimating Shallow Groundwater Evaporation Based on Surface Evaporation and Ambient Air Temperature. J. Irrig. Drain. 2022, 41, 69–74. [Google Scholar]
  59. Li, X.; He, X.; Yang, G.; Zhao, L.; Chen, S.; Wang, C.; Chen, J.; Yang, M. Study of groundwater using visual MODFLOW in the Manas River Basin, China. Water Policy. 2016, 18, 1139–1154. [Google Scholar] [CrossRef]
  60. Peng, H.; Wang, Z.; Luo, Y.; Yuan, Y.; Wang, W. Evaluation of Exploitable Groundwater Resources in the Buha River Basin Based on Groundwater Numerical Simulation. Geoscience 2023, 37, 943–953. [Google Scholar] [CrossRef]
  61. Zhang, Y. Study on the Influence of the Regulation of Plain Reservoirs in the Manas River Basin on the Dynamic Changes of the Groundwater Level. Master’s Thesis, Shihezi University, Shihezi, China, 2018. [Google Scholar]
  62. Li, X.; Liu, X. Comparative Analysis of Weight Assignment Methods for Land Evaluation Indicators. J. Gansu Agric. Univ. 2012, 47, 129–133. [Google Scholar] [CrossRef]
  63. He, X.; Ye, M.; Zhang, X.; Chen, W.; Li, J. Groundwater dynamic forecasting in Hongyashan district based on regional evaluation of regulatory suitability. Trans. Chin. Soc. Agric. Eng. 2018, 34, 179–186. [Google Scholar] [CrossRef]
  64. Zhao, S.; Liu, L.; Wang, X.; Li, S.; Zhu, S.; Zhang, Q.; Wang, Z. Confirming on Critical Depth of Groundwater Level in Hetao Irrigation Area and Discussion on It’s Significance. Rock Miner. Anal. 2008, 27, 108–112. [Google Scholar] [CrossRef]
  65. Fan, Z.; Chen, Y.; Ma, Y.; Li, H.; Alishir, K.; Abdi, M. Determination of Suitable Ecological Groundwater Depth in Arid Areas in Northwest Part of China. Land Resour. Environ. 2008, 22, 1–5. [Google Scholar] [CrossRef]
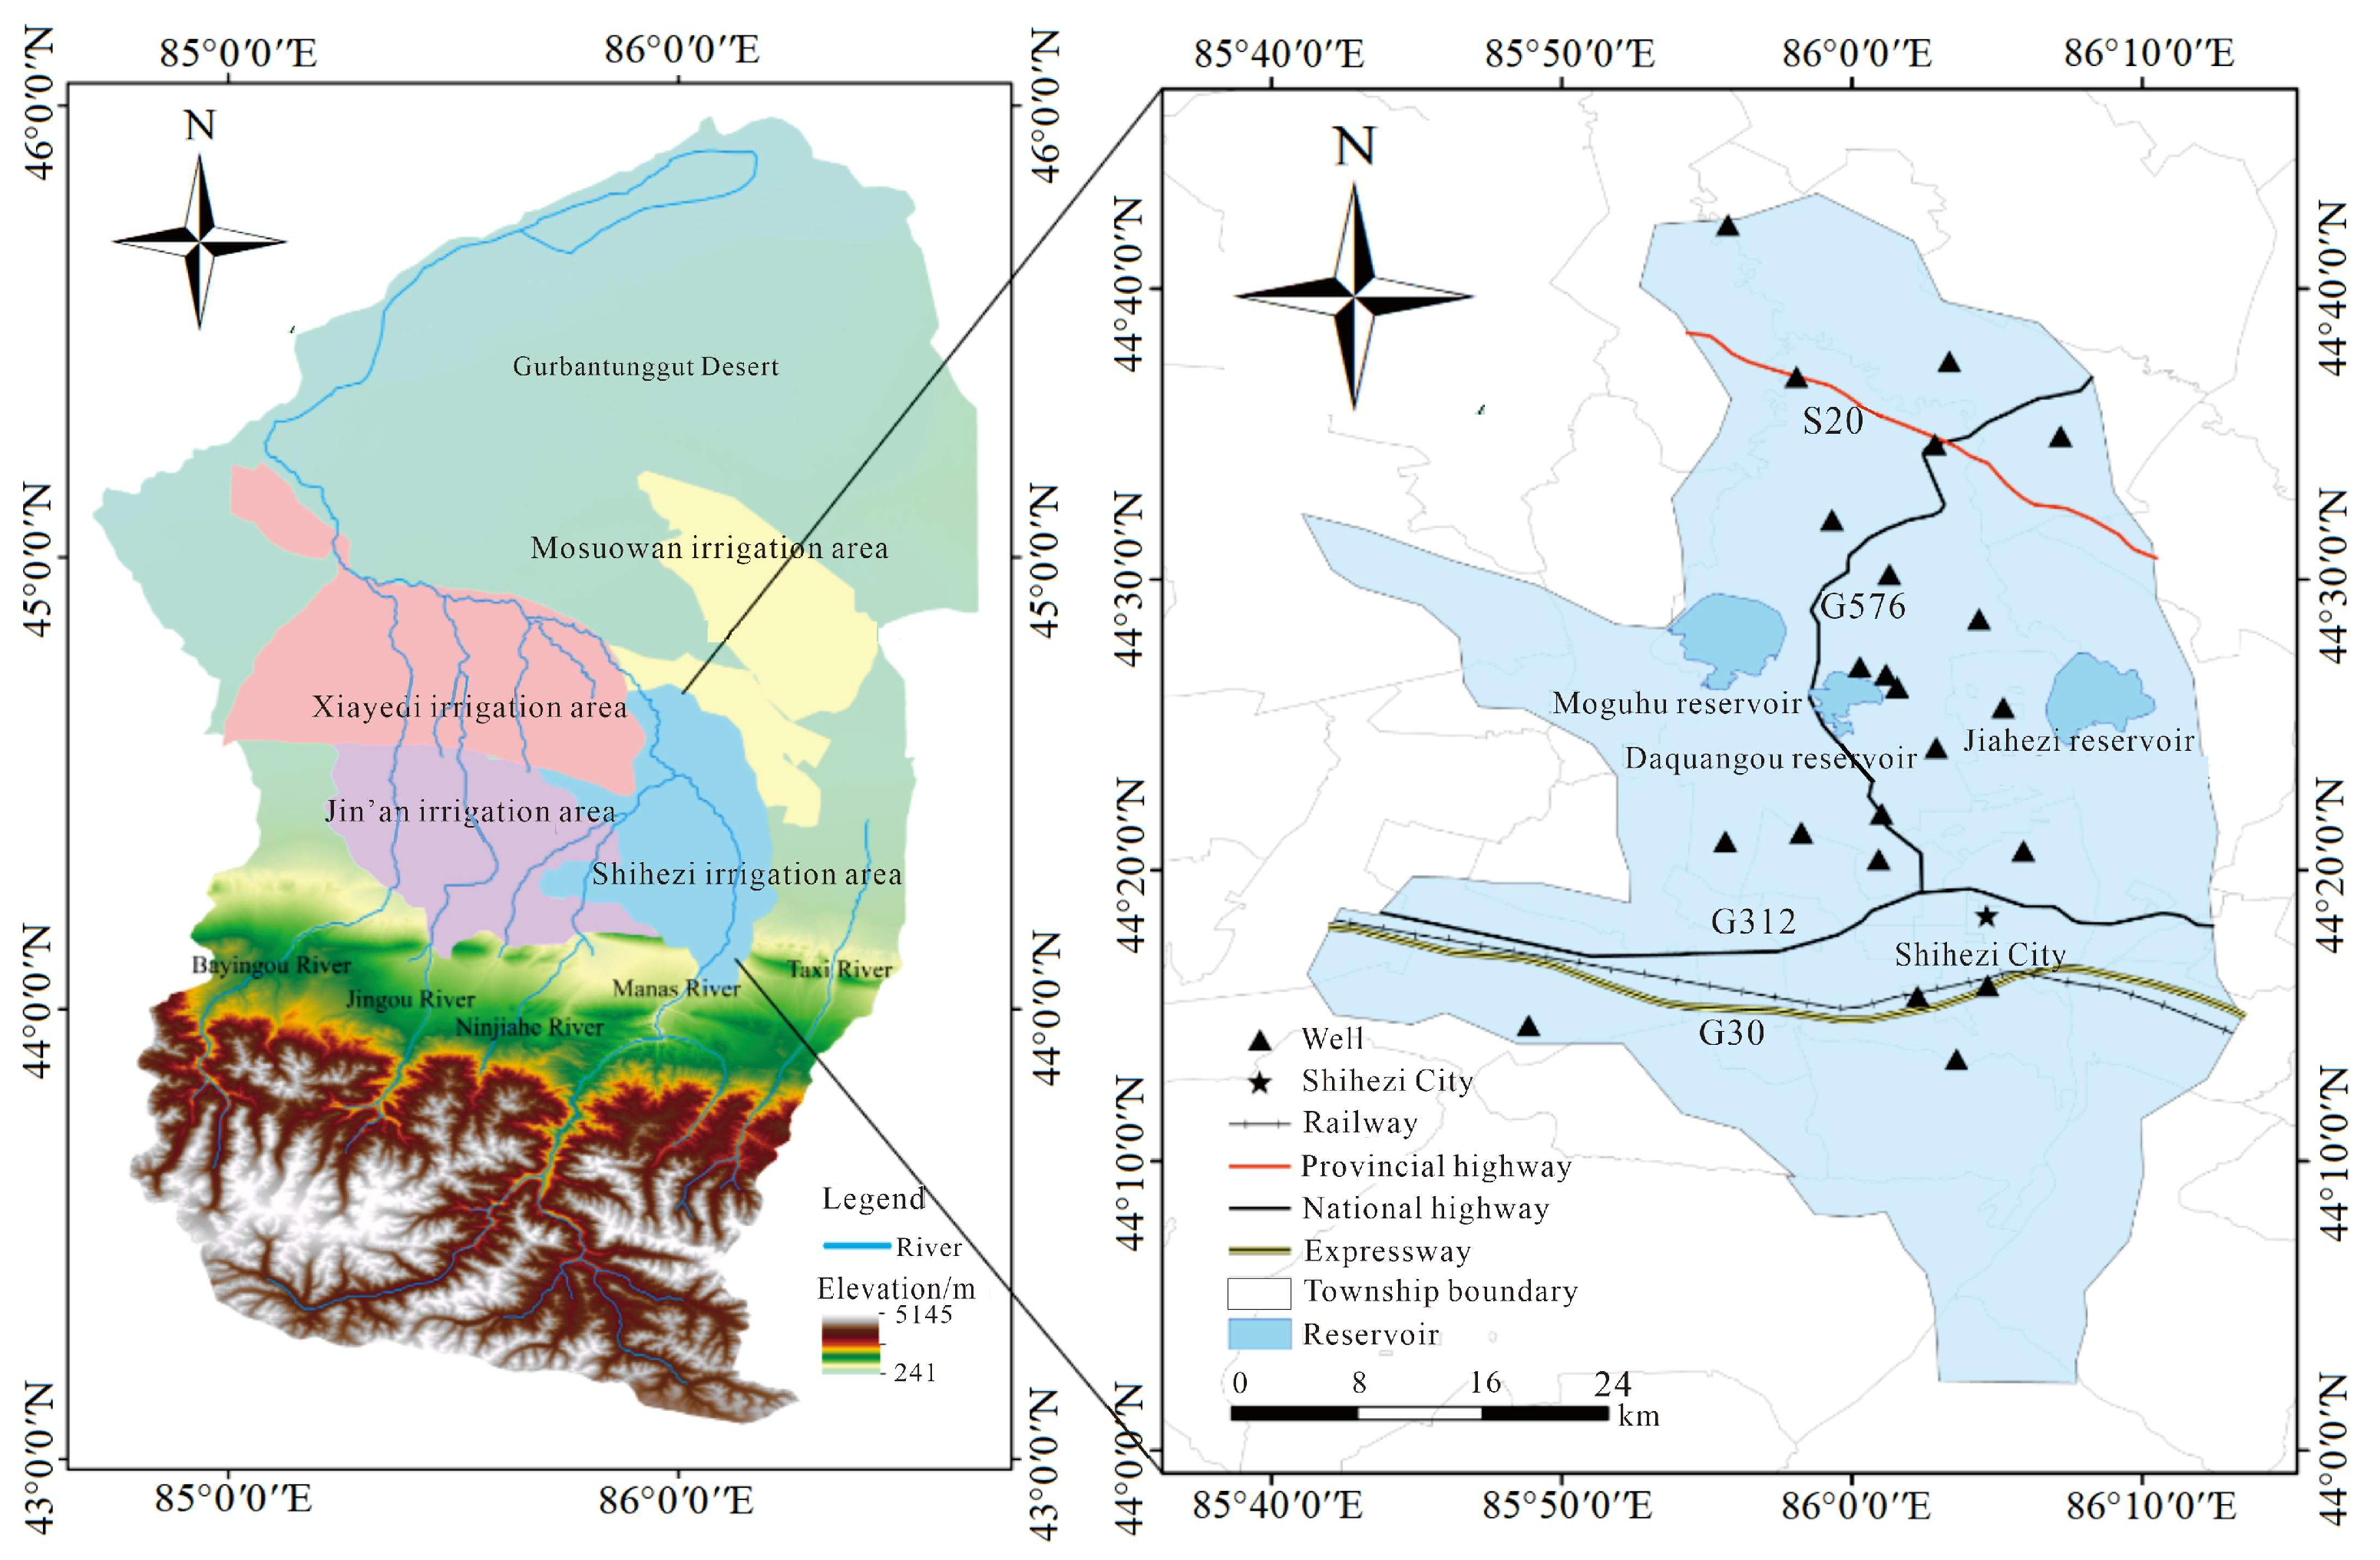
Figure 1. Geographical location map of the study area.
Water 17 03232 g001
Figure 2. Partition diagram of the hydrogeological parameters.
Water 17 03232 g002
Figure 3. Relationship between the simulated and measured groundwater levels in regular observation wells. Notes: CGZ−SZC−8/1, cgz−SHZ−9/1, CGZ147−5/1, etc. in the figure represent the monitoring well numbers, where SZC represents Shizhongchang and SHZ represents Shihezi.
Water 17 03232 g003
Figure 4. Relationship between the simulated and measured values of the groundwater level of the observation wells during the verification period. Notes: CGZ−SZC−8/1, cgz−SHZ−9/1, CGZ147−5/1, etc. in the figure represent the monitoring well numbers, where SZC represents Shizhongchang and SHZ represents Shihezi.
Water 17 03232 g004
Figure 5. Distribution of the comprehensive evaluation values in the evaluation area.
Water 17 03232 g005
Figure 6. Groundwater levels at the end of 2025 and 2030 under Scenario X.
Water 17 03232 g006
Figure 7. Groundwater levels at the end of 2025 and 2030 under the control of scheme Y1.
Water 17 03232 g007
Figure 8. Groundwater levels at the end of 2025 and 2030 under the control of scheme Y2.
Water 17 03232 g008
Figure 9. Groundwater levels at the end of 2025 and 2030 under the control of scheme Y3.
Water 17 03232 g009
Figure 10. Groundwater depth chart under different scenarios.
Water 17 03232 g010
Table 1. Hydrogeological parameters of the model.
Rock and Soil TypesPermeability Coefficient (m/d)Specific Yield (%)
Gravel and pebble10023
Sand and gravel7025
Yazhong sand1528
Clay0.0083
Subclay0.053.5
Sandstone8016
Fine sand325
Medium-coarse sand4028
Fine sand powder0.88
Medium-fine sand155.5
Table 2. Calibration period model fitting error statistics.
Time (Day)ARM (m)SEE (m)RMS (m)NRMS (%)R
11.340.431.782.470.99
1201.920.612.523.490.99
2104.411.035.097.120.98
3653.591.426.057.990.97
Average2.820.873.865.270.98
Notes: ARM stands for Absolute Residual Mean; SEE stands for Standard Enor of the Estimate; RMS stands for Root Mean Square; NRMS stands for Normalized Root Mean Square; R expressing correlation coefficient.
Table 3. Validation period model fitting error statistics.
Time (Day)ARM (m)SEE (m)RMS (m)NRMS (%)R
11.640.522.142.960.99
1203.001.074.436.120.98
2105.131.426.589.20.97
3655.011.918.1110.70.95
Average3.701.236.327.250.97
Notes: ARM stands for Absolute Residual Mean; SEE stands for Standard Enor of the Estimate; RMS stands for Root Mean Square; NRMS stands for Normalized Root Mean Square; R expressing correlation coefficient.
Table 4. Reduction ratio and water meter in each section under the 2025 plan.
Appraisal of Value
(z)
Number of WellsY1Y2Y3
Reduction Ratio (%)Reduction in Water (108 m3)Reduction Ratio (%)Reduction in Water (108 m3)Reduction Ratio (%)Reduction in Water (108 m3)
>0.52571000.0471000.0520.220.015
0.48–0.5242800.028850.0330.220.011
0.40–0.48162600.081700.1040.220.043
0.32–0.40280400.093550.1410.220.074
0.2–0.32490200.0810.220.130
<0.22130.220.056
Total12440.220.3290.220.3290.220.329
Table 5. Reduction ratio and water meter in each section under the 2030 plan.
Appraisal of Value
(z)
Number of WellsY1Y2Y3
Reduction Ratio (%)Reduction in Water (108 m3)Reduction Ratio (%)Reduction in Water (108 m3)Reduction Ratio (%)Reduction in Water (108 m3)
>0.52571000.0691000.0760.320.022
0.48–0.5242800.041850.0480.320.016
0.40–0.48162600.118700.1520.320.063
0.32–0.40280400.135550.2060.320.108
0.2–0.32490200.1190.320.190
<0.22130.320.083
Total12440.320.4820.320.4820.320.482
Table 6. Capillary rise heights under different degrees of mineralization.
Silt LoamDegree of Mineralization (g·L−1)
<55–15
Capillary rise height (m)1.31.6
Disclaimer/Publisher’s Note: The statements, opinions and data contained in all publications are solely those of the individual author(s) and contributor(s) and not of MDPI and/or the editor(s). MDPI and/or the editor(s) disclaim responsibility for any injury to people or property resulting from any ideas, methods, instructions or products referred to in the content.