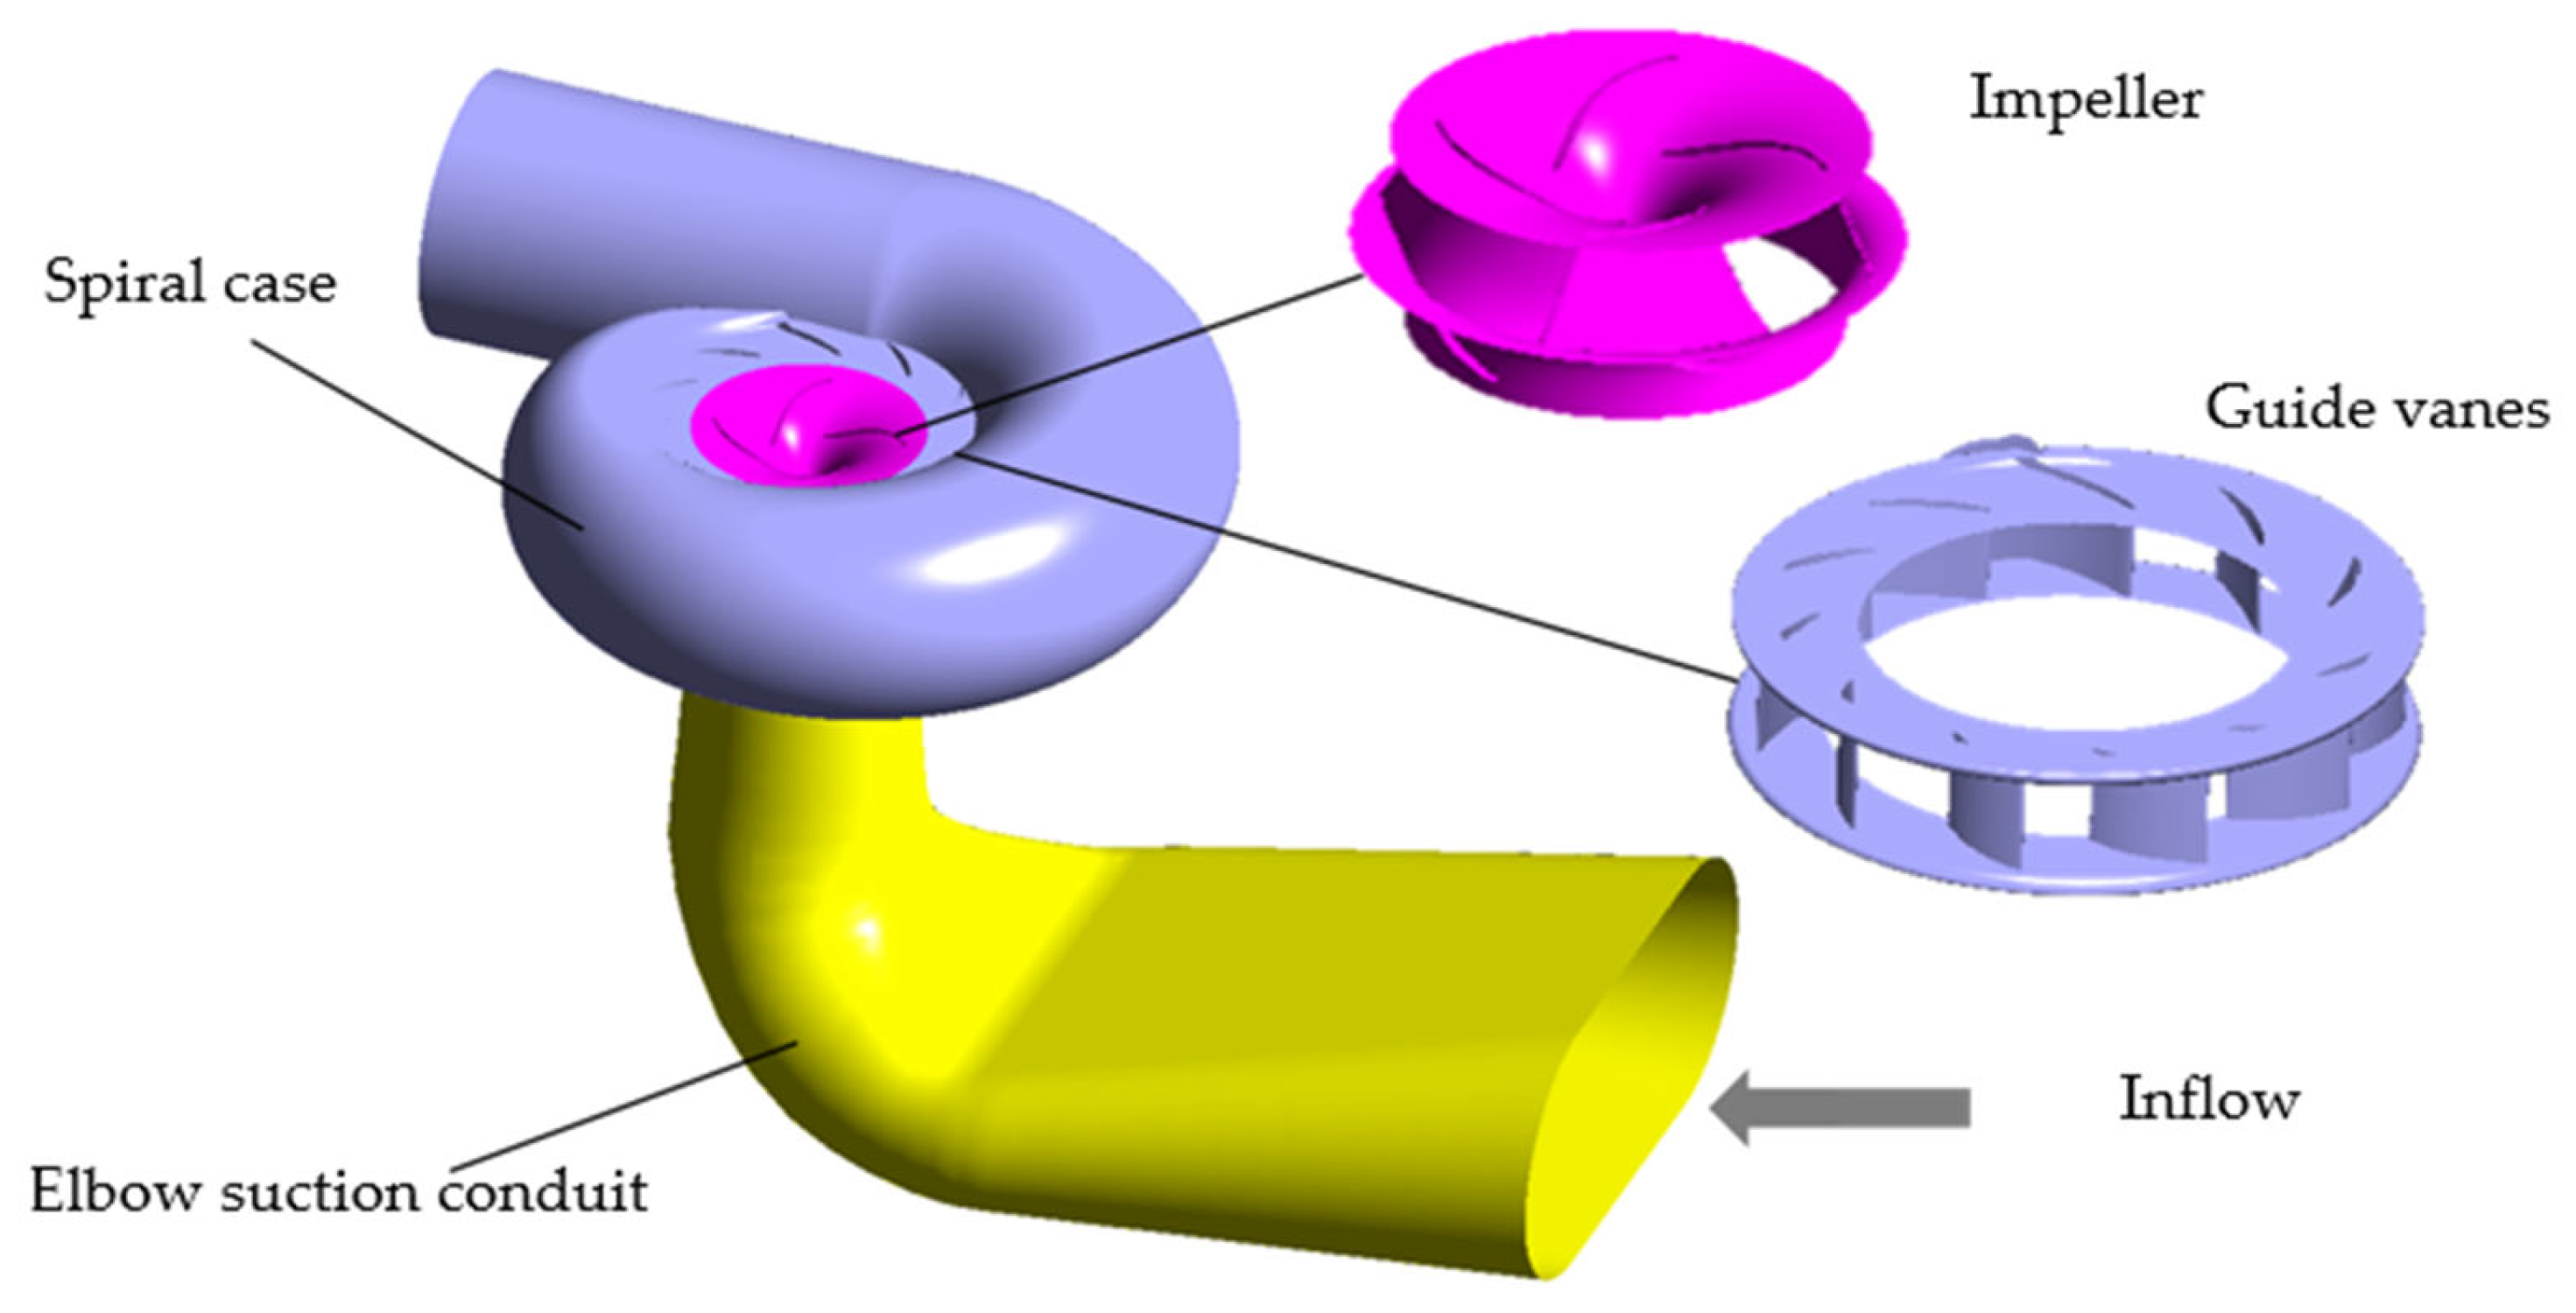
2.1. Basic Parameters
This study focuses on a model mixed flow pump (MFP) with the operating head
Hr 10.50 m and the flow rate
Qr 0.488 m
3/s. The rated rotation speed
nr is 1000 r/min. The specific speed
nq, which is the most common similarity parameter of pumps [
25] was defined as follows:
Mixed-flow pumps typically operate within a specific speed range of 300–600, categorizing the pump studied in this paper as a medium-to-high specific speed mixed-flow pump. To facilitate a direct comparison with other mixed-flow pumps of similar specific speeds, the pump performance is routinely interpreted in terms of dimensionless parameters. Therefore, define the head coefficient
ψ, the flow rate coefficient
φ, and the initial cavitation coefficient
σi as follows
where
Rls equals to half of the
Dls, the radius of runner at low pressure side.
ωr is the rotation angular speed, and
g represents gravitational acceleration. The net positive suction head required (
NPSHi), that is an intrinsic characteristic of the pump impeller, can be determined either through calculation or experimental measurement. The rated values of dimensionless coefficients
ψ and
φ, as well as the operation parameters of the mixed flow pump are presented in
Table 1.
2.3. Numerical Simulation
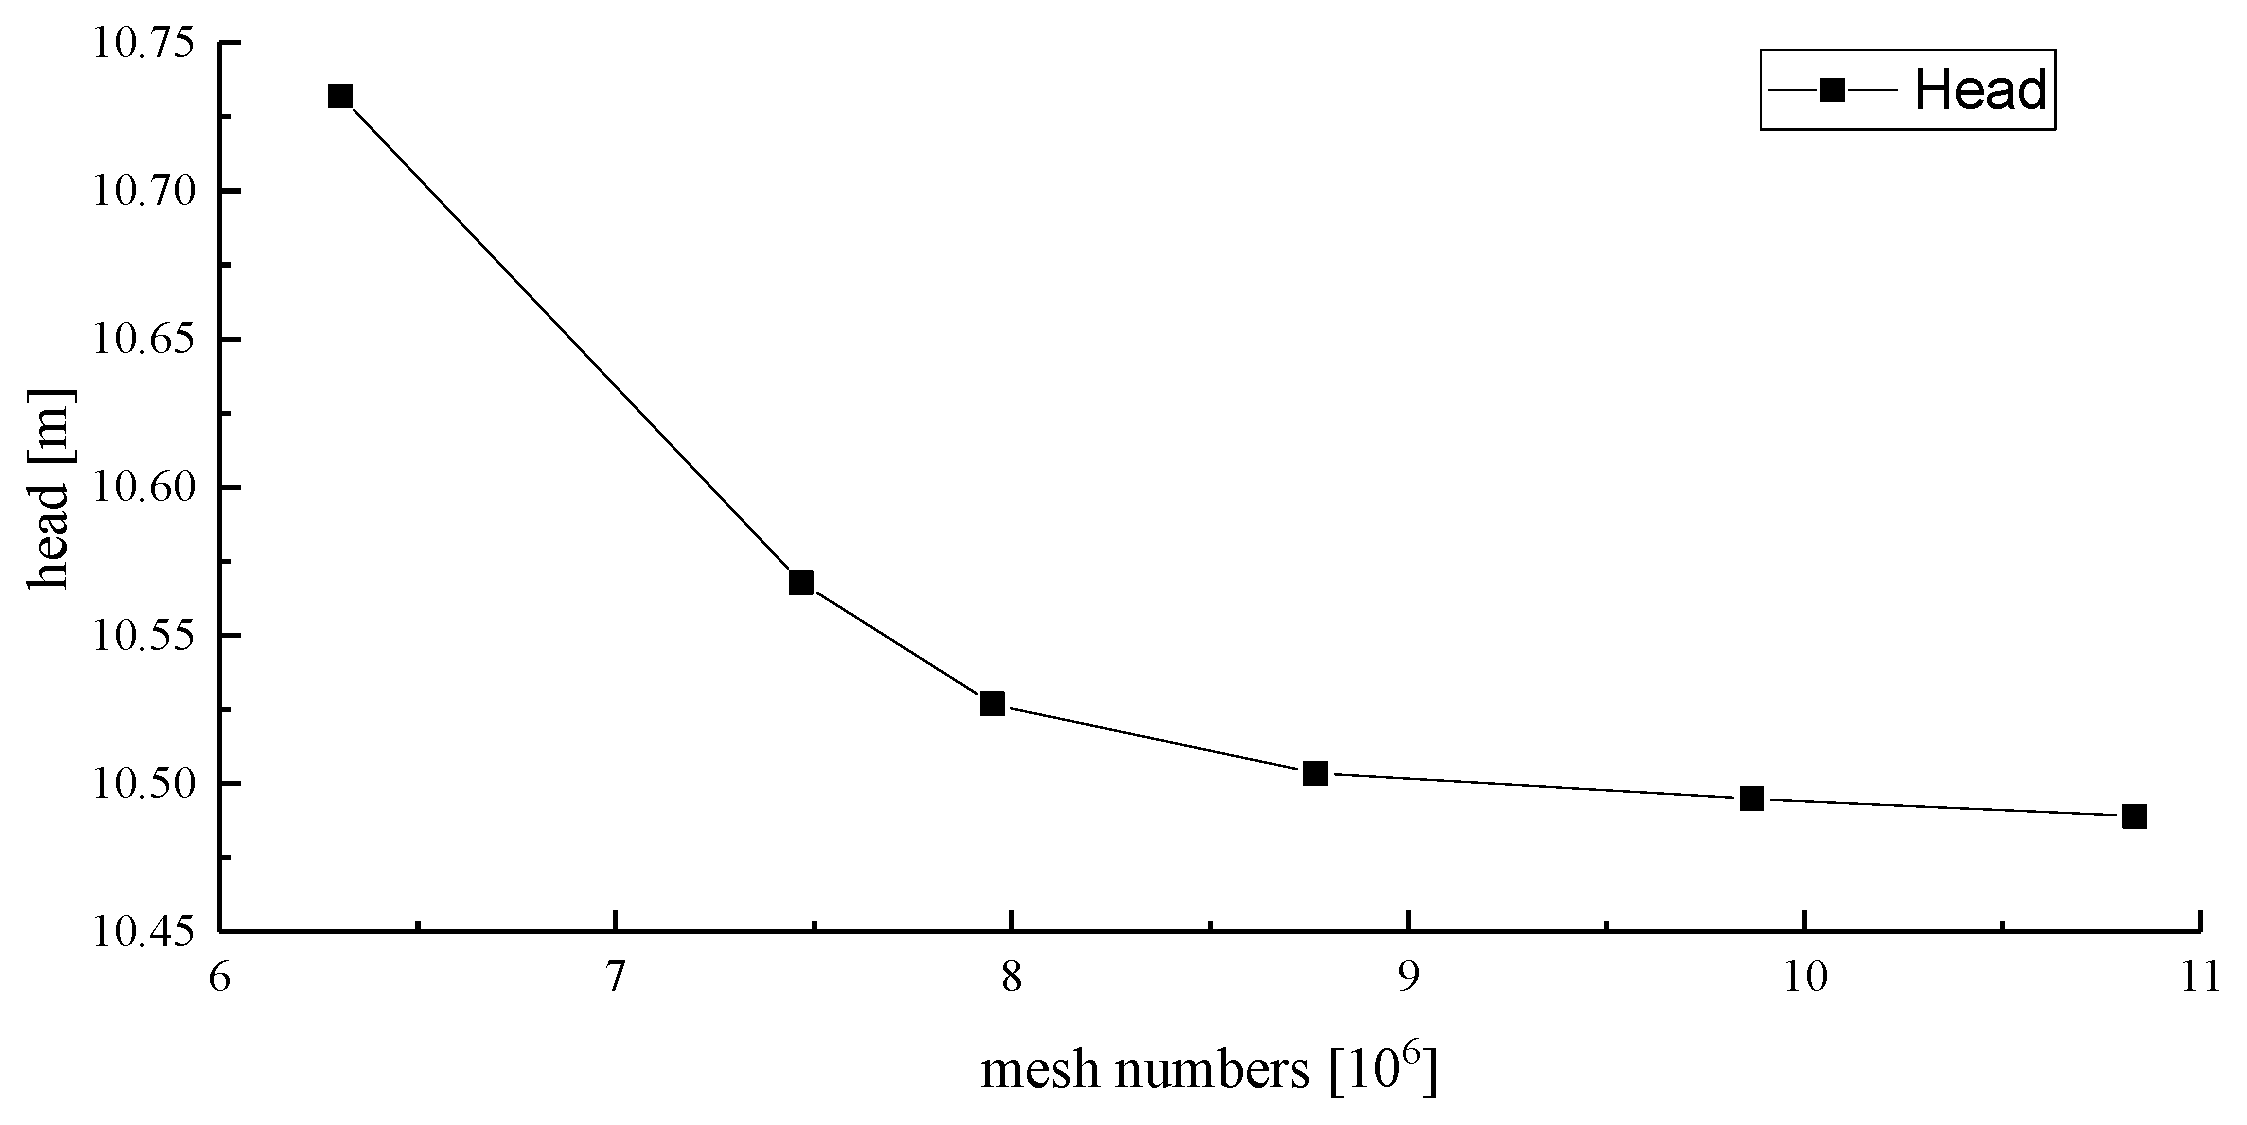
Because grid density and quality exert a decisive influence on both accuracy and computational overhead [
26], a rigorous grid-independence study was performed following the procedure illustrated in
Figure 2. When the element count exceeded 9.86 × 10
6, the predicted head varied by <0.1% relative to the next finer level; this mesh balanced against available computational resources, and was therefore adopted as the criterion for finalizing the component-wise mesh densities summarized in
Table 2.
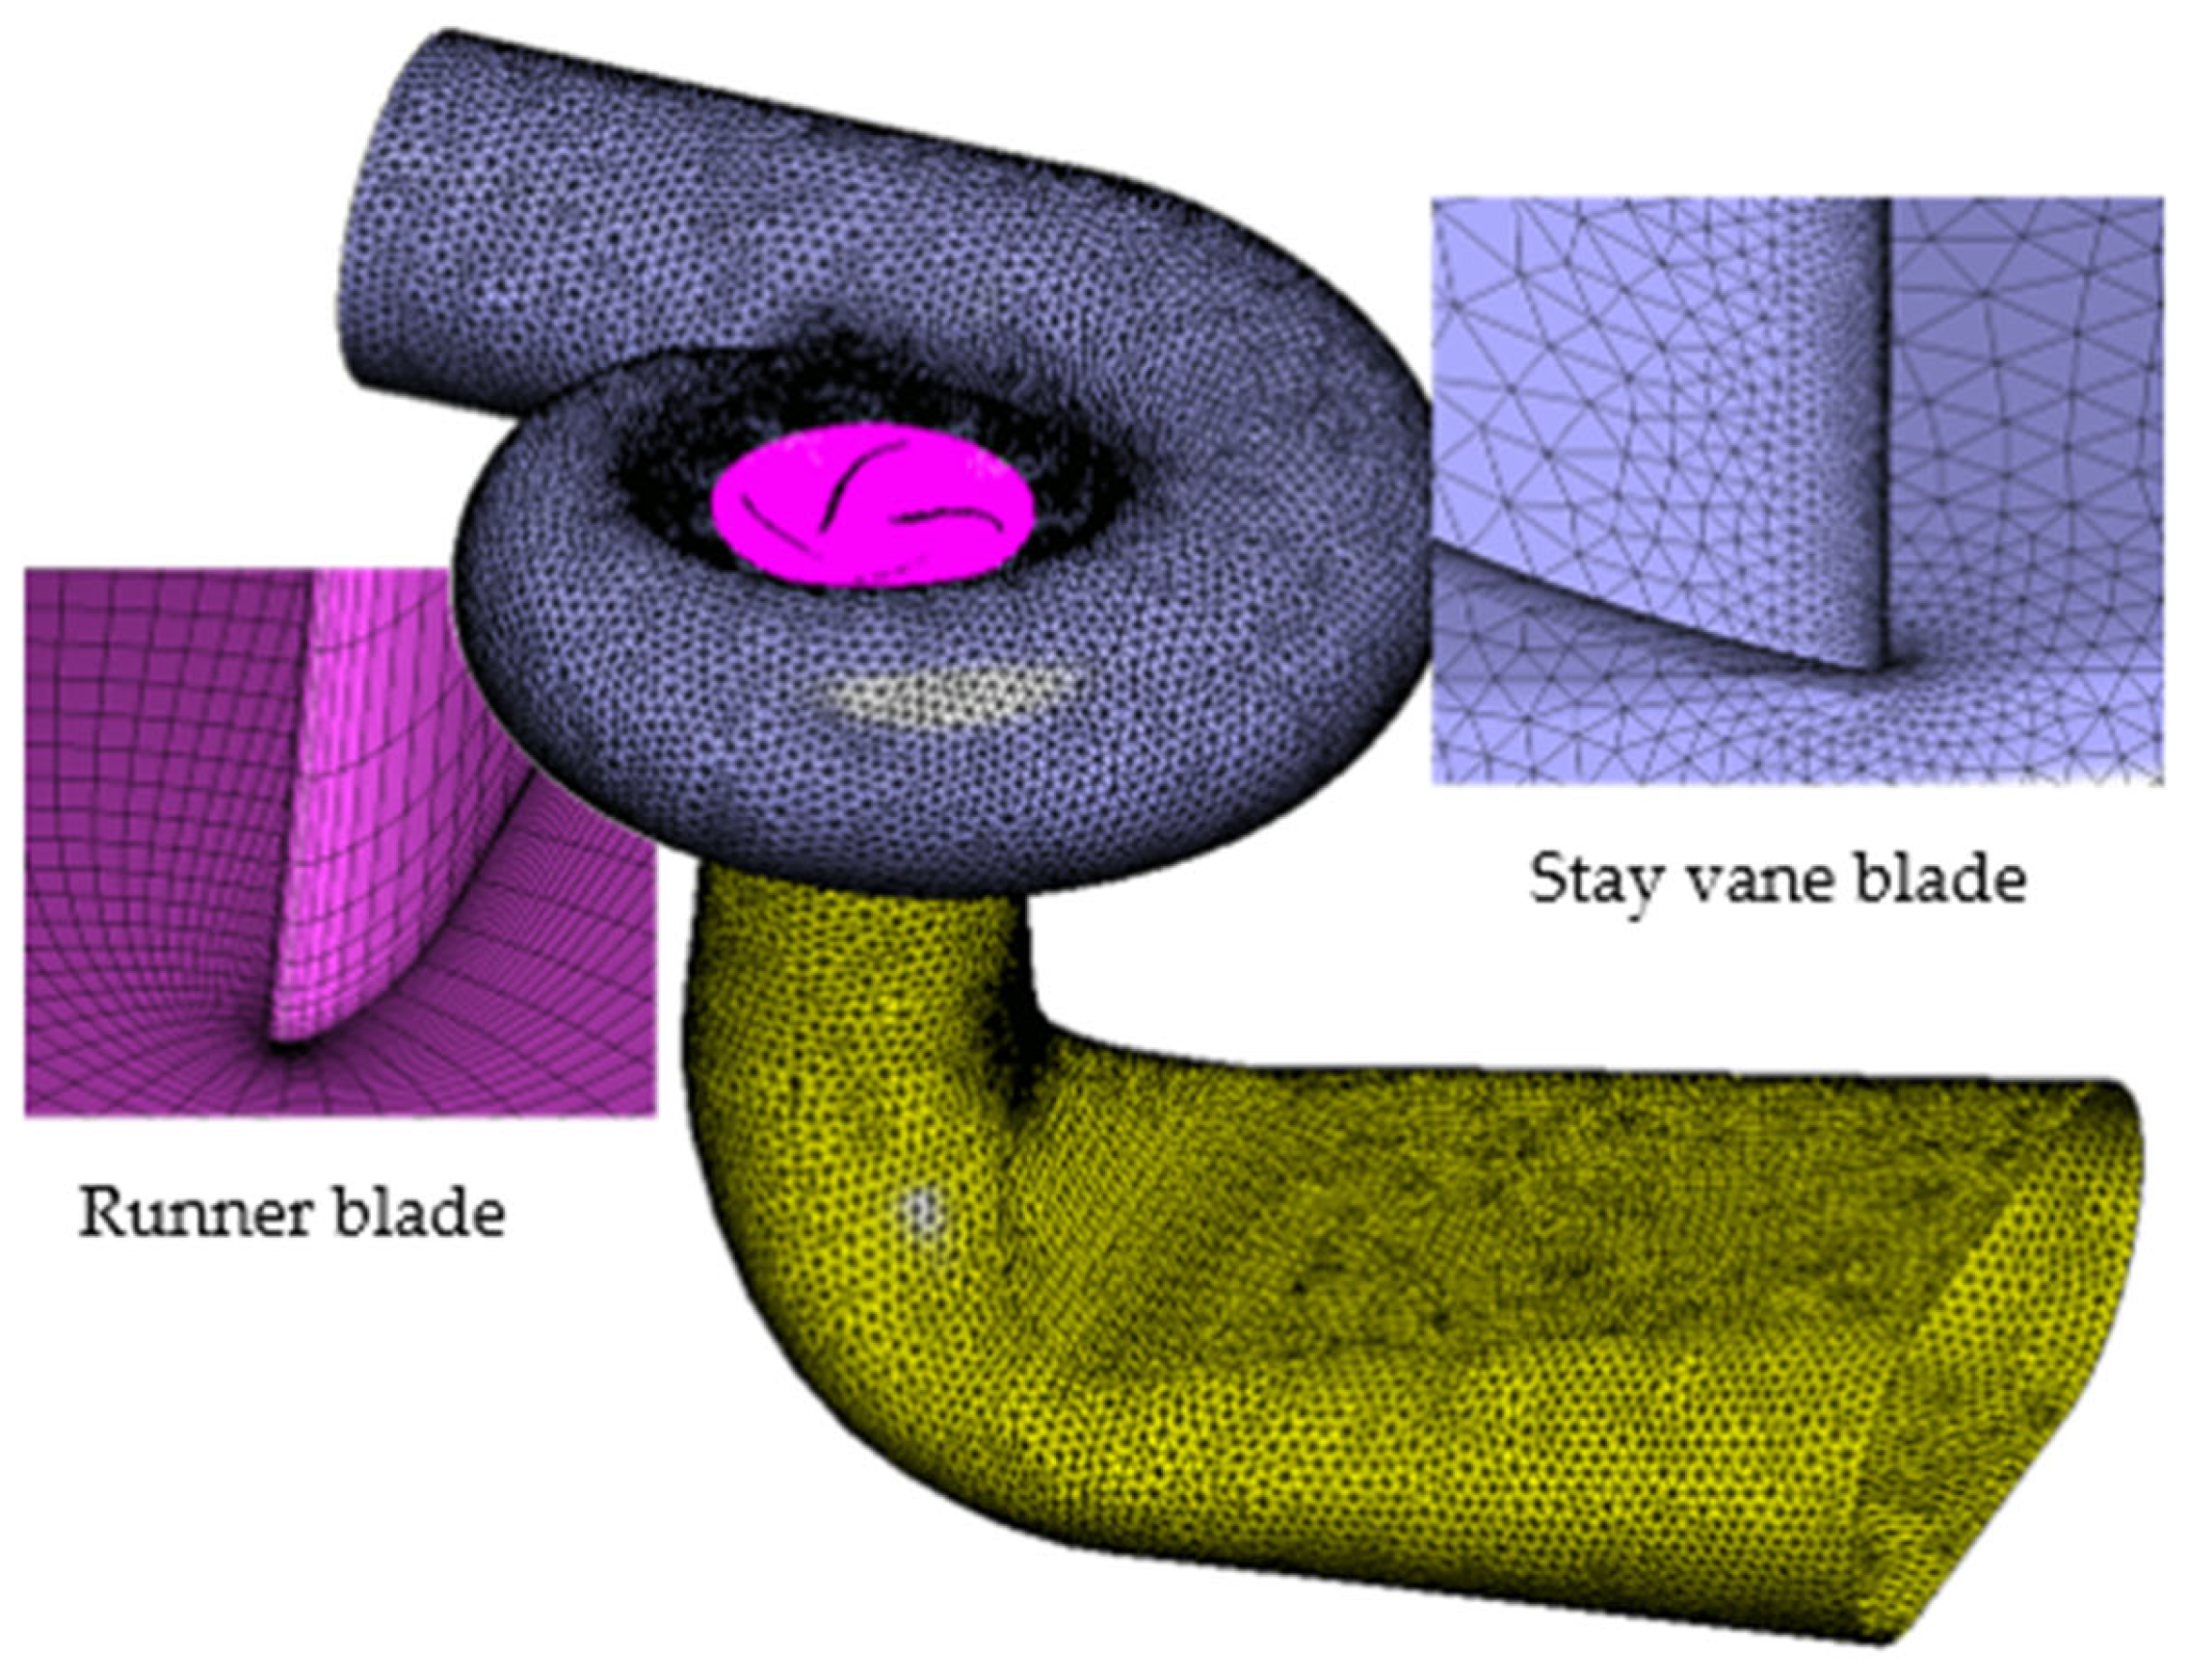
There are about 2.2 million mesh elements in the elbow suction conduits calculation domain, while the element number of the impeller domain was also about 2.2 million. Total mesh elements of guide vane and spiral case were 5.4 million, as shown in
Table 2.
In the simulation, the turbulence model was set as the RNG k-ε model. Although more advanced models such as SAS-SST or LES offer higher fidelity for transient separations, the RNG k-ε model has been widely validated for steady-state simulation of swirling and recirculating flows in curved conduits [
27,
28], while offering a balance between accuracy and computational cost for engineering analysis. “High resolution” was chosen as the solution control parameter. Maximum iteration number was 500. A convergence criterion of 1 × 10
−5 was set to achieve a balance between the calculation accuracy and time.
Considering that the Reynolds number at the rated operating point is approximately 7 × 10
6, wall functions are invoked in the low-Reynolds-number near-wall region to bridge the physical variables on the wall with those in the turbulent core. A non-dimensional parameter
y+ is introduced and defined as follows.
In which y represents the normal distance from the grid node to the wall (unit: m), uτ is the friction velocity (unit: m/s), and τw is the wall shear stress (unit: Pa). Physically, y+ can be interpreted as a local Reynolds number of the eddy located at y, thereby reflecting the variation in viscous influence with wall distance. When the first grid node is positioned within the logarithmic layer, the simulation accuracy for near-wall flow characteristics is significantly improved.
Accordingly, systematic mesh examination and successive refinement were carried out until the near-wall average
y+ values fulfilled the computational accuracy requirement for the turbulence model employed. The resultant wall
y+ values for the runner, spiral case, and suction-conduit components are reported in
Table 2; a schematic illustration of the computational grid adopted in the present CFD simulations is provided in
Figure 3.
To ensure consistency between the numerical calculations and the model tests, the working fluid was water, maintained at a constant reference temperature
Tref of 298.15 K under isothermal conditions. The elbow suction conduits inlet boundary was set with the mass flow rate condition. For the design condition as shown in
Table 1, the mass flow rate was set as equal to the value of
Qr with a medium turbulence intensity (5%). The static pressure condition was given at the spiral case outlet. For all the simulation conditions the static pressure was set as 0 Pa.
A general grid interface (GGI) was set between the rotating domain and the static domain. The rotor–stator interface was in the “Frozen Rotor” type. Other boundaries such as the blades, the guide vanes and wall of elbow suction conduits were all set as no-slip.
Steady-state simulations were carried out in order to predict the pump characters in varies mass flow rate.
2.4. Experimental Validation
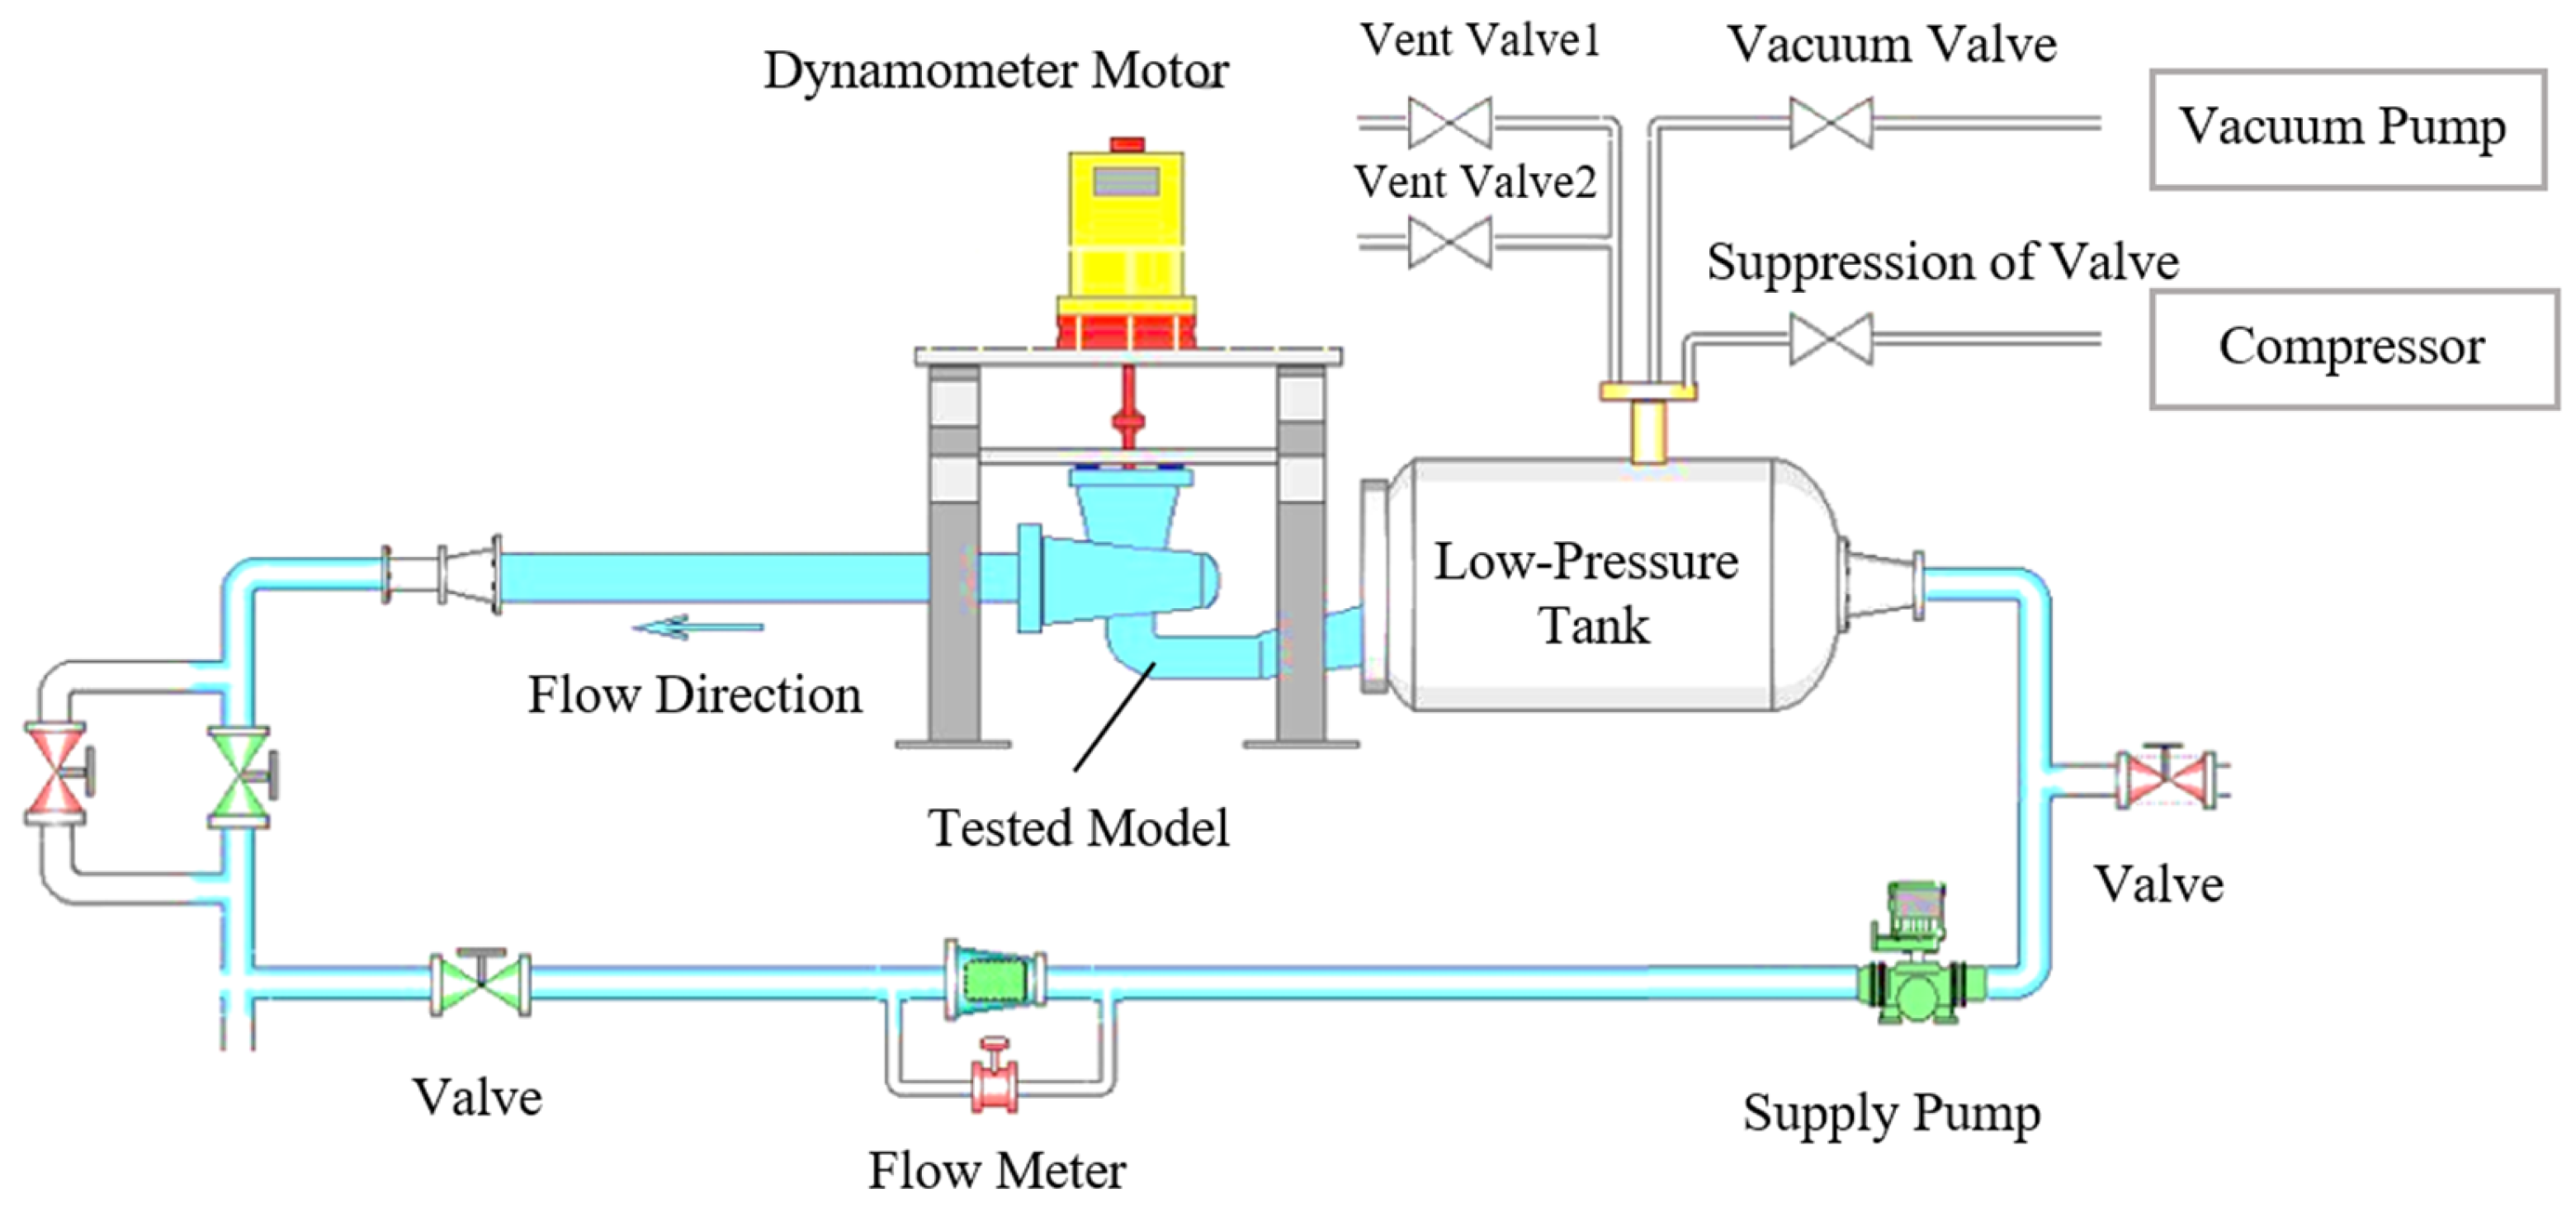
An experimental test was carried out on test-stand VI of State Key Laboratory of Hydro-power Equipment, with the purpose of verifying the current grid and numerical method.
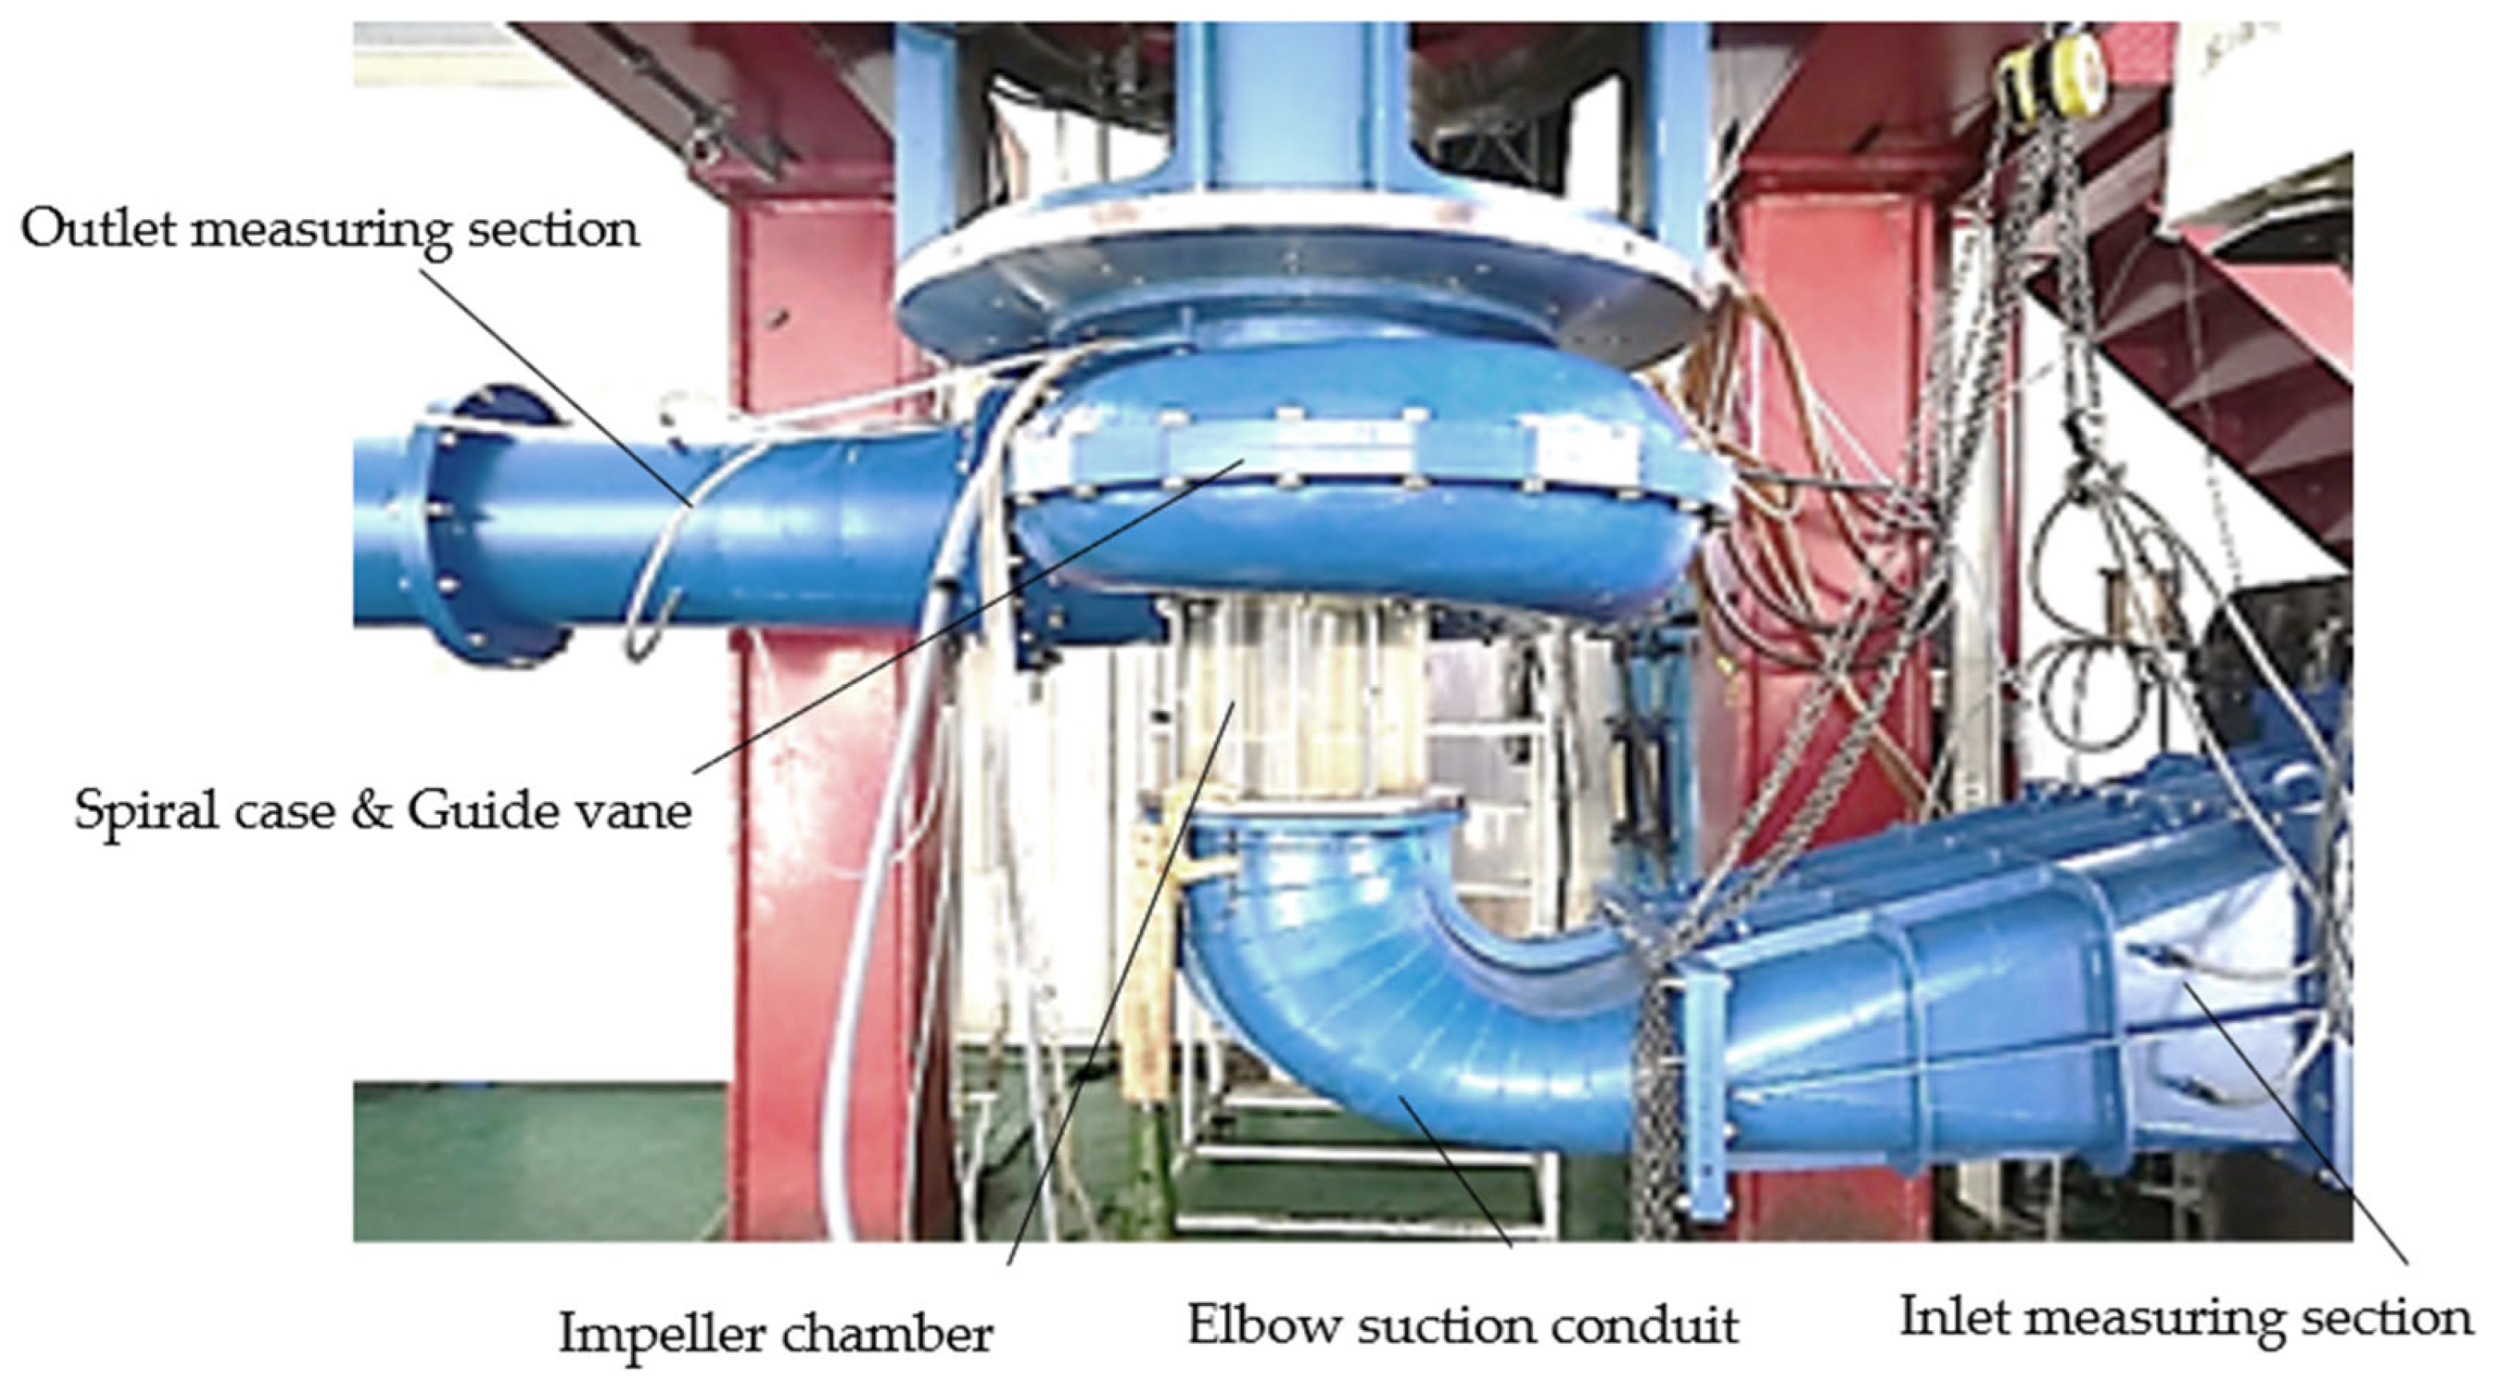
A schematic map of a hydraulic machinery test stand is shown in
Figure 4. Total test uncertainty of the experiment on the test-stand VI was ±0.3%. The pump model test method meets the requirements of IEC60193 [
29].
By means of the compressor, the tailrace pressure and thus the system cavitation coefficient could be continuously regulated. A booster pump was installed to overcome the intrinsic head loss of the loop, while a throttling valve was employed to modify the system resistance and thereby shift the operating point. Under constant rotational speed of the test pump, its characteristic curve remains unchanged; closing the valve increases the system damping, moving the intersection of the system flowrate-head curve and the pump curve toward lower flow rates. Consequently, the measured operating condition migrates to the low-flow region of the mixed-flow pump flowrate–head characteristic curve.
Hydraulic performance is calculated by measuring pressure, flow rate, and shaft power. The flow rate was tested using the flow meter, while the head was obtained by ac-quiring the pressure difference between the inlet and outlet measuring sections, which were located on the elbow suction conduit and the outlet pipe of the spiral case, respectively, as shown in
Figure 5.
The shaft power was tested by the dynamometer motor. The efficiency
η was obtained using products among the fluid density
ρ, the acceleration of gravity
g the flow rate
Q as well as the pump head
H, and dividing by the shaft power
P [
4], as in Equation (7):
In typical CFD computations, neither the mechanical losses including bearing friction, packing seal friction acting on the main shaft nor the disc-friction losses are taken into account. Consequently, the numerically predicted efficiency
η tends to be higher than the experimentally measured values. Accordingly, an empirical correction Formula (8) is applied, whereby the efficiency inclusive of mechanical losses is obtained as the product of the raw CFD result and a correction factor. The correction formula reads as follows [
4].
where
C1 and
C2 are empirical constants with values of 0.07 and 0.0365, respectively.
The cavitation performance of the mixed-flow pump was evaluated experimentally by progressively lowering the system pressure from a high to a low level, until the initial occurrence of cavitation (either blade cavitation or flow separation) was observed in the model runner. The corresponding system cavitation coefficient at this critical point was recorded as the incipient cavitation coefficient σi for the given flow rate condition.
The head efficiency as well as the initial cavitation coefficient of the rated point of this pump with both simulated and experimental results are shown in
Table 3.
The absolute deviations of both the head coefficient and the efficiency coefficient amount to 0.04; representing relative differences of 1.2% and 3.1%, respectively, when normalized by the experimental values. Following empirical correction, the numerical simulation results at rated conditions showed only a 1.2% overprediction in efficiency compared to experimental measurements.
The observed discrepancies arise from multiple sources: numerical modeling assumptions; unresolved boundary layer details due to mesh constraints; simplified representation of shaft seal and bearing losses; and measurement instrument tolerances. Despite these deviations, the overall uncertainty in the simulation results is within acceptable limits, meeting the required analysis accuracy. Therefore, the current computational model can be utilized for further research and design optimization efforts. To enhance the analysis accuracy, local velocity field validation via Particle Image Velocimetry (PIV) could be used in future work to further verify the consistency of flow structure representations.
Comparison of the pump performance over the entire flow range between both simulated and experimental results are shown in
Figure 6.
Both of the numerically predicted and experimentally measured head–discharge characteristics across the operational range of the mixed-flow pump are presented in
Figure 6a. In the vicinity of the rated steady-state operating region, the simulation agrees closely with the measurements; however, as the working point departs from the design condition and approaches the hump zone, secondary flows and the evolution of vortex structures markedly increase flow complexity and the difficulty of capturing the internal flow field, resulting in larger discrepancies between computation and experiment.
Figure 6b presents the corresponding comparison for the efficiency–discharge characteristics. Across the entire operating envelope, the predicted trends of both head coefficient and efficiency. The deviation remains small near the rated condition, whereas it grows as the operating condition moves away from the rated value. That demonstrates consistent trends with the head–discharge characteristics.
The incipient cavitation performance near the rated condition is examined in
Figure 6c, revealing good correlation between numerical predictions and experimental observations, lending confidence to the predictive capability of the present numerical approach.
The simulated values demonstrated strong agreement with the test results over the investigated operational range of the mixed-flow pump. The maximum discrepancies in head coefficient and efficiency occurred at the maximum flow rate condition, reaching 0.09 and 2.86%, respectively, and were within a reasonable range. Despite these variations, the numerical simulations prove sufficiently reliable for comprehensive evaluation and accurate analysis of the flow characteristics.
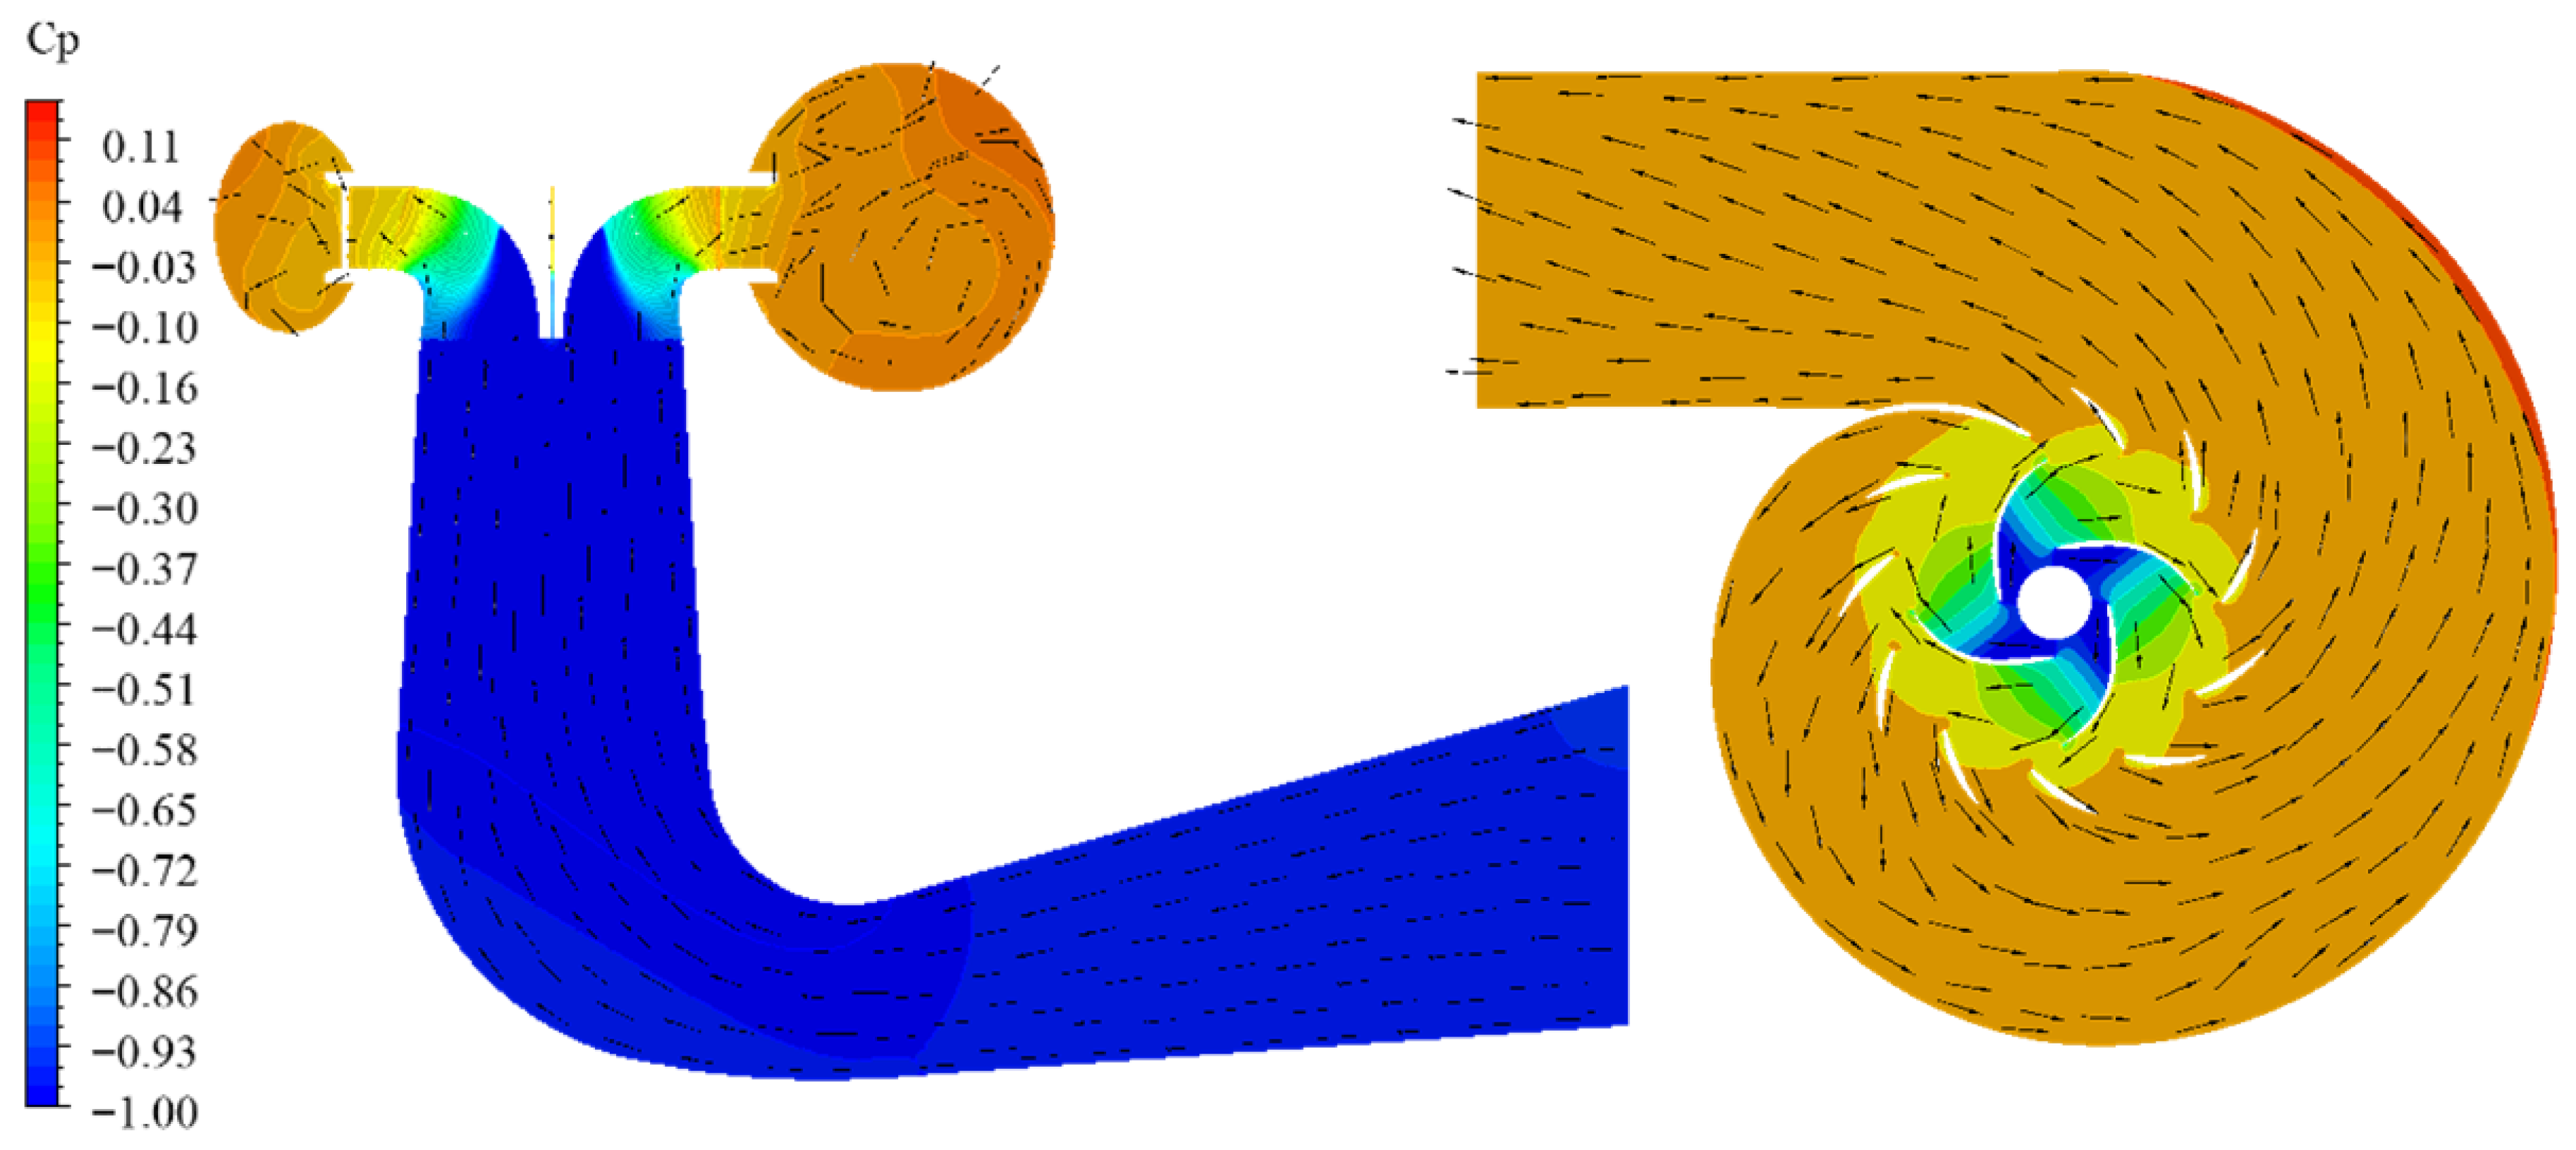
Flow regime of the mixed flow pump was taken into consideration. The static-pressure distribution and relative-velocity vector fields on the meridional (mid-stream) symmetry plane as well as the mid-span layer of the mixed-flow pump are presented in
Figure 7, where the dimensionless pressure coefficient
Cp is defined as follows.
where
p is static pressure, and
pref presents the reference pressure at the spiral case flow-out boundary.
As illustrated, both within the elbow suction conduit and throughout the impeller passages the pressure gradient remains comparatively uniform and the flow appears smooth and well-behaved.
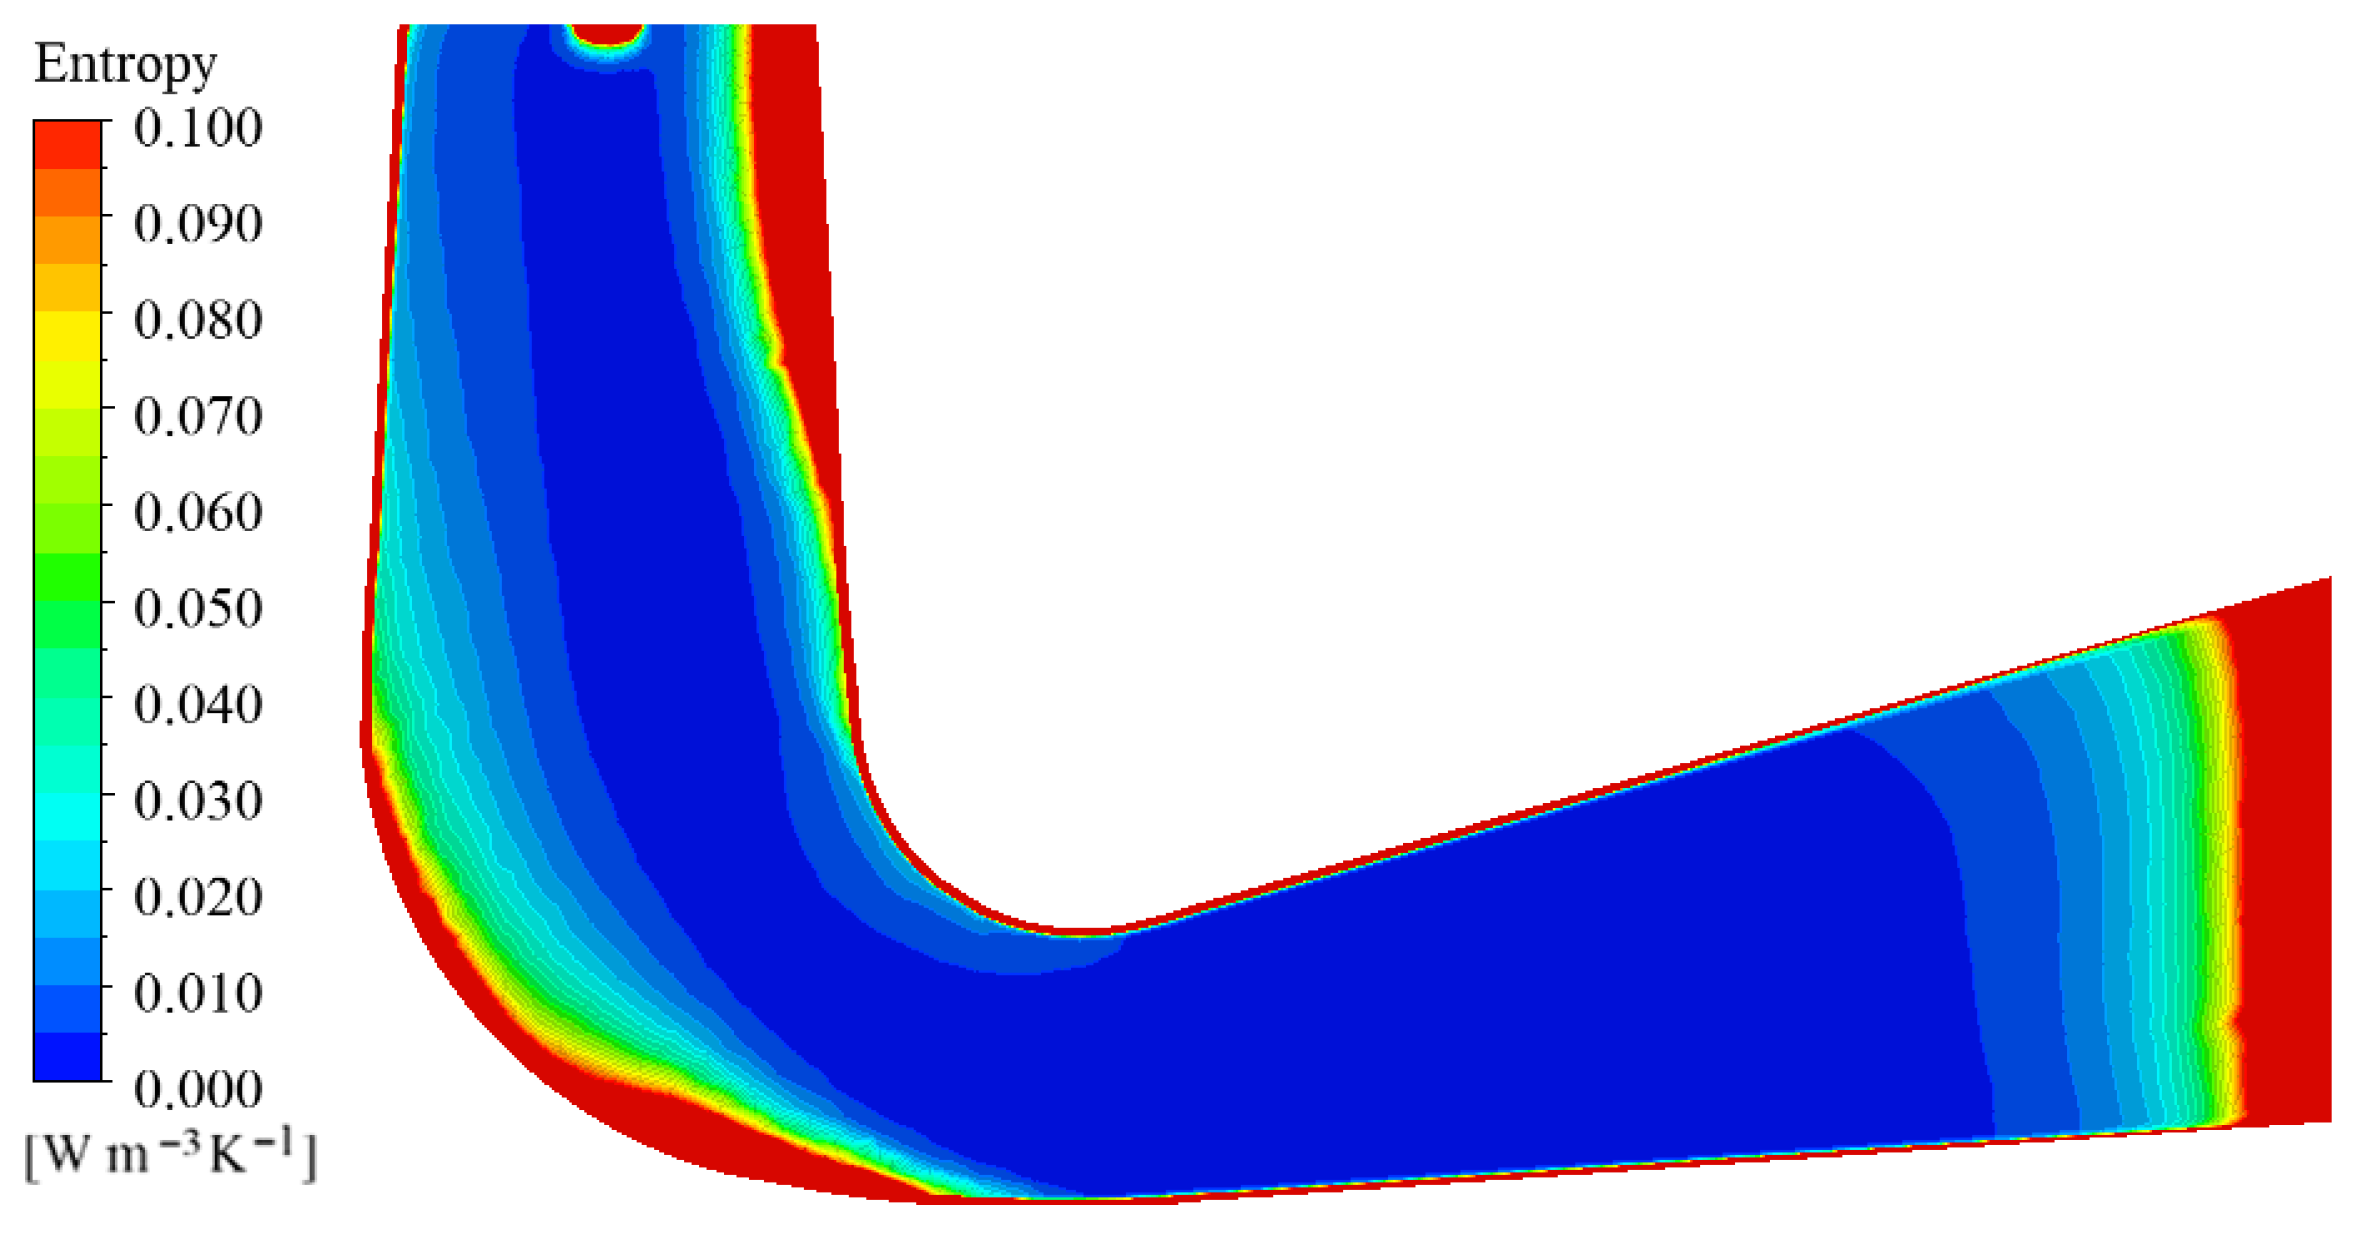
Consequently, the precise locations at which energy dissipation occur are extremely difficult to identify and, in turn, the prospect of further improving pump efficiency is markedly constrained. Hence, a more effective methodology is required to quantitatively diagnose the sources of passage losses and to guide subsequent optimization. To further improve the quantitative accuracy of turbulence dissipation, advanced measurement techniques such as synchrotron X-ray PIV can be employed in future work. These methods could offer unprecedented insight into transient vortical and cavitation dynamics.
