Article

Entropy-Generation-Based Optimization of Elbow Suction Conduit for Mixed-Flow Pumps

by
Na Yan
1,2,*,
Xianzhu Wei
2,3,
Xiaohang Wang
3,
Guolong Fu
1,2 and
Rui Zhang
3
1
State Key Laboratory of Hydro-Power Equipment, Harbin Research Institute of Large Electric Machinery Company Limited, Harbin 150040, China
2
Harbin Power National Hydraulic Power Equipment Engineering Technology Research Center, Harbin 150040, China
3
Harbin Electric Machinery Company Limited, Harbin 150040, China
*
Author to whom correspondence should be addressed.
Water 2025, 17(22), 3223; https://doi.org/10.3390/w17223223
Submission received: 20 September 2025 / Revised: 4 November 2025 / Accepted: 6 November 2025 / Published: 11 November 2025
(This article belongs to the Special Issue Hydraulics and Hydrodynamics in Fluid Machinery, 2nd Edition)

Abstract

The elbow suction conduit plays a decisive role in determining inflow conditions, thereby influencing a pump’s efficiency and cavitation characteristics. The complex three-dimensional swirling and separating flow makes pinpointing the sources and mechanisms of energy dissipation challenging. This study aims to accurately diagnose the sources of hydraulic losses within the elbow suction conduit and conduct effective geometric optimization to enhance overall pump performance. Entropy production theory was integrated with three-dimensional Reynolds-averaged Navier-Stokes simulations to quantitatively analyze the irreversible energy dissipation in different parts of the conduit. Results reveal that energy dissipation is predominantly concentrated at the inlet section, wall surfaces, outer curvature of the bend, and the inner conical diffuser. Key geometric parameters were systematically optimized. Compared to the baseline design, the optimized configuration not only reduced entropy generation induced by wall shear and turbulent fluctuations but also improved the spatio-temporal uniformity of the outflow. Consequently, this translated directly into enhanced overall pump performance: the optimized design shows a 0.34% increase in efficiency and a 3.6% reduction in the inception cavitation coefficient at the rated condition, leading to lower energy consumption and enhanced operational reliability. The effectiveness of entropy production analysis for the hydraulic optimization of pumps was demonstrated.

1. Introduction

Mixed-flow pumps, characterized by their high-flow capacity and medium-to-high head characteristics, are widely used in agricultural irrigation, industrial drainage, wastewater treatment, and nuclear power plant cooling systems [1,2,3]. The inlet conduit, as a critical component of mixed-flow pumps, serves to deliver fluid to the impeller, while the relatively low flow velocities in inlet conduits result in significantly lower hydraulic losses compared to those in impellers and discharge chambers [4]. Nevertheless, the flow patterns and conditions within the inlet conduit substantially influence impeller flow characteristics. Suboptimal inflow conditions not only increase internal losses but also degrade cavitation performance of the pump [5,6]. The effectiveness of active cavitation control methods, such as acoustic–hemical synergy, further demonstrates the critical role of inlet conditions in cavitation dynamics [7]. Experimental studies have demonstrated that minor variations at the inlet can induce significant changes in pressure fluctuations and noise generation in the pump [8,9].
The elbow suction conduit is the configuration most commonly adopted in large pumping stations in China. Due to spatial constraints or compact layout requirements, elbow suction conduits must redirect water flow (from horizontal to vertical entry into the pump casing) within a confined space. The large-scale curved structure significantly increases difficulties in design, positioning, and construction [10]. Additionally, the small bend radius tends to induce flow separation, vortex formation, and air entrainment, resulting in reduced pump efficiency and increased vibration and noise [11,12]. For decades, the engineering practice of elbow suction conduit design has relied heavily on empirical knowledge. The smoothness of the cross-sectional area versus conduit length distribution was the criteria when judging the acceptability of a design, and reference ranges for principal geometric parameters was recommended [13,14]. In addition, the relatively minor contribution of inlet conduit losses to overall pump system losses has resulted in limited research attention.
Advances in numerical simulation techniques based on flow mechanisms now offer a quantitative means of evaluating velocity distributions, pressure evolution and hydraulic losses within elbow conduits.
Shi et al. employed parametric modeling methods to optimize transition curves of an elbow conduit, without altering control dimensions, resulting in reducing conduit losses while improving outlet velocity uniformity [15]. Huang et al. conducted comparative analyses of conduits with two different heights and bend radii under a range of operating conditions, demonstrating that bend profile exerts a significant influence on the turning flow [16]. Suppressing separation within the bend was found to extend the high-efficiency operating range of the pump. Pei Ji combined numerical simulation with neural network analysis to explore the sensitivity of conduit geometry to the pump efficiency, rapidly identifying optimal geometric configurations from large design spaces [17]. Significant reductions in conduit losses and overall efficiency improvements were achieved.
Experimental investigations have provided complementary data. Lu et al. isolated elbow conduits from the complete pump assembly and measured the loss characteristics of several geometric variants [18]. Liu et al. performed stereoscopic PIV to obtain fully three-dimensional velocity fields, establishing an experimental database for inflow diagnosis and design optimizations [19]. Zhang et al. combined CFD and physical model tests to quantify the influence of floor-ramp angle and bend radius on hydraulic loss and internal flow structure, providing guidance for civil engineering considerations [20].
As continuous geometric optimization has reduced elbow conduit losses and improved pump efficiency, the flow regime inside modern elbow conduits is generally smooth and conventional flow regime analysis has become less effective for further improvements [21]. Continued advancements are impeded by the difficulty of visualizing, locating, and quantifying remaining flow energy dissipation (FED) mechanisms [22]. The Second Law of Thermodynamics (SLT) has therefore attracted increasing attention for its ability to identify irreversible energy transitions, and has been applied to quantify and localize losses in various hydraulic machines.
Wang et al. employed entropy-generation theory to map the loss-distribution characteristics of a mixed-flow turbine at its best efficiency point [23]. Chen et al. investigated the entropy production within a two-stage storage pump over a broad operating range; this revealed that under partial-load conditions, flow separation driven by high tangential velocity contributes most to energy dissipation, whereas at overload conditions, wall friction and fluid–wall impacts were the primary dissipative mechanisms [24]. To the best of the authors’ knowledge, however, the application of entropy-generation analysis to optimize elbow suction conduits in mixed-flow pumps has rarely been reported.
This study focuses on a medium-to-high specific-speed mixed-flow pump. Numerical simulations were first validated against flow-head characteristics and cavitation performance test data across the operating range.
To achieve further efficiency gains, entropy-generation theory was applied to precisely locate energy dissipation within the elbow suction conduit under design conditions. Targeted geometric modifications, such as increasing the inlet width, raising the inlet height, reducing the pre-bend contraction angle and enlarging the outlet cone angle, were then implemented. The geometric parameter effects on loss characteristics, outlet velocity uniformity, mean outflow angle, and turbulent intensity were evaluated systematically.
This study integrates combined entropy generation analysis with geometric optimization for elbow suction conduits to address the inefficiencies associated with complex flow geometries in pump applications, offering a novel solution for enhancing energy efficiency and reducing operational costs.
The optimized design demonstrates improved pump performance across multiple operating conditions, providing technical foundations for expanding high-efficiency ranges and enhancing operational stability in pumping stations.

2. Research Object and Numerical-Experimental Validation

2.1. Basic Parameters

This study focuses on a model mixed flow pump (MFP) with the operating head Hr 10.50 m and the flow rate Qr 0.488 m3/s. The rated rotation speed nr is 1000 r/min. The specific speed nq, which is the most common similarity parameter of pumps [25] was defined as follows:
n q = 3.65 n Q r H r 3 / 4
Mixed-flow pumps typically operate within a specific speed range of 300–600, categorizing the pump studied in this paper as a medium-to-high specific speed mixed-flow pump. To facilitate a direct comparison with other mixed-flow pumps of similar specific speeds, the pump performance is routinely interpreted in terms of dimensionless parameters. Therefore, define the head coefficient ψ, the flow rate coefficient φ, and the initial cavitation coefficient σi as follows
ψ = g H ω r 2 R l s 2
φ = Q ω r R l s 3
σ i = N P S H i H
where Rls equals to half of the Dls, the radius of runner at low pressure side. ωr is the rotation angular speed, and g represents gravitational acceleration. The net positive suction head required (NPSHi), that is an intrinsic characteristic of the pump impeller, can be determined either through calculation or experimental measurement. The rated values of dimensionless coefficients ψ and φ, as well as the operation parameters of the mixed flow pump are presented in Table 1.

2.2. Modeling of the MFP

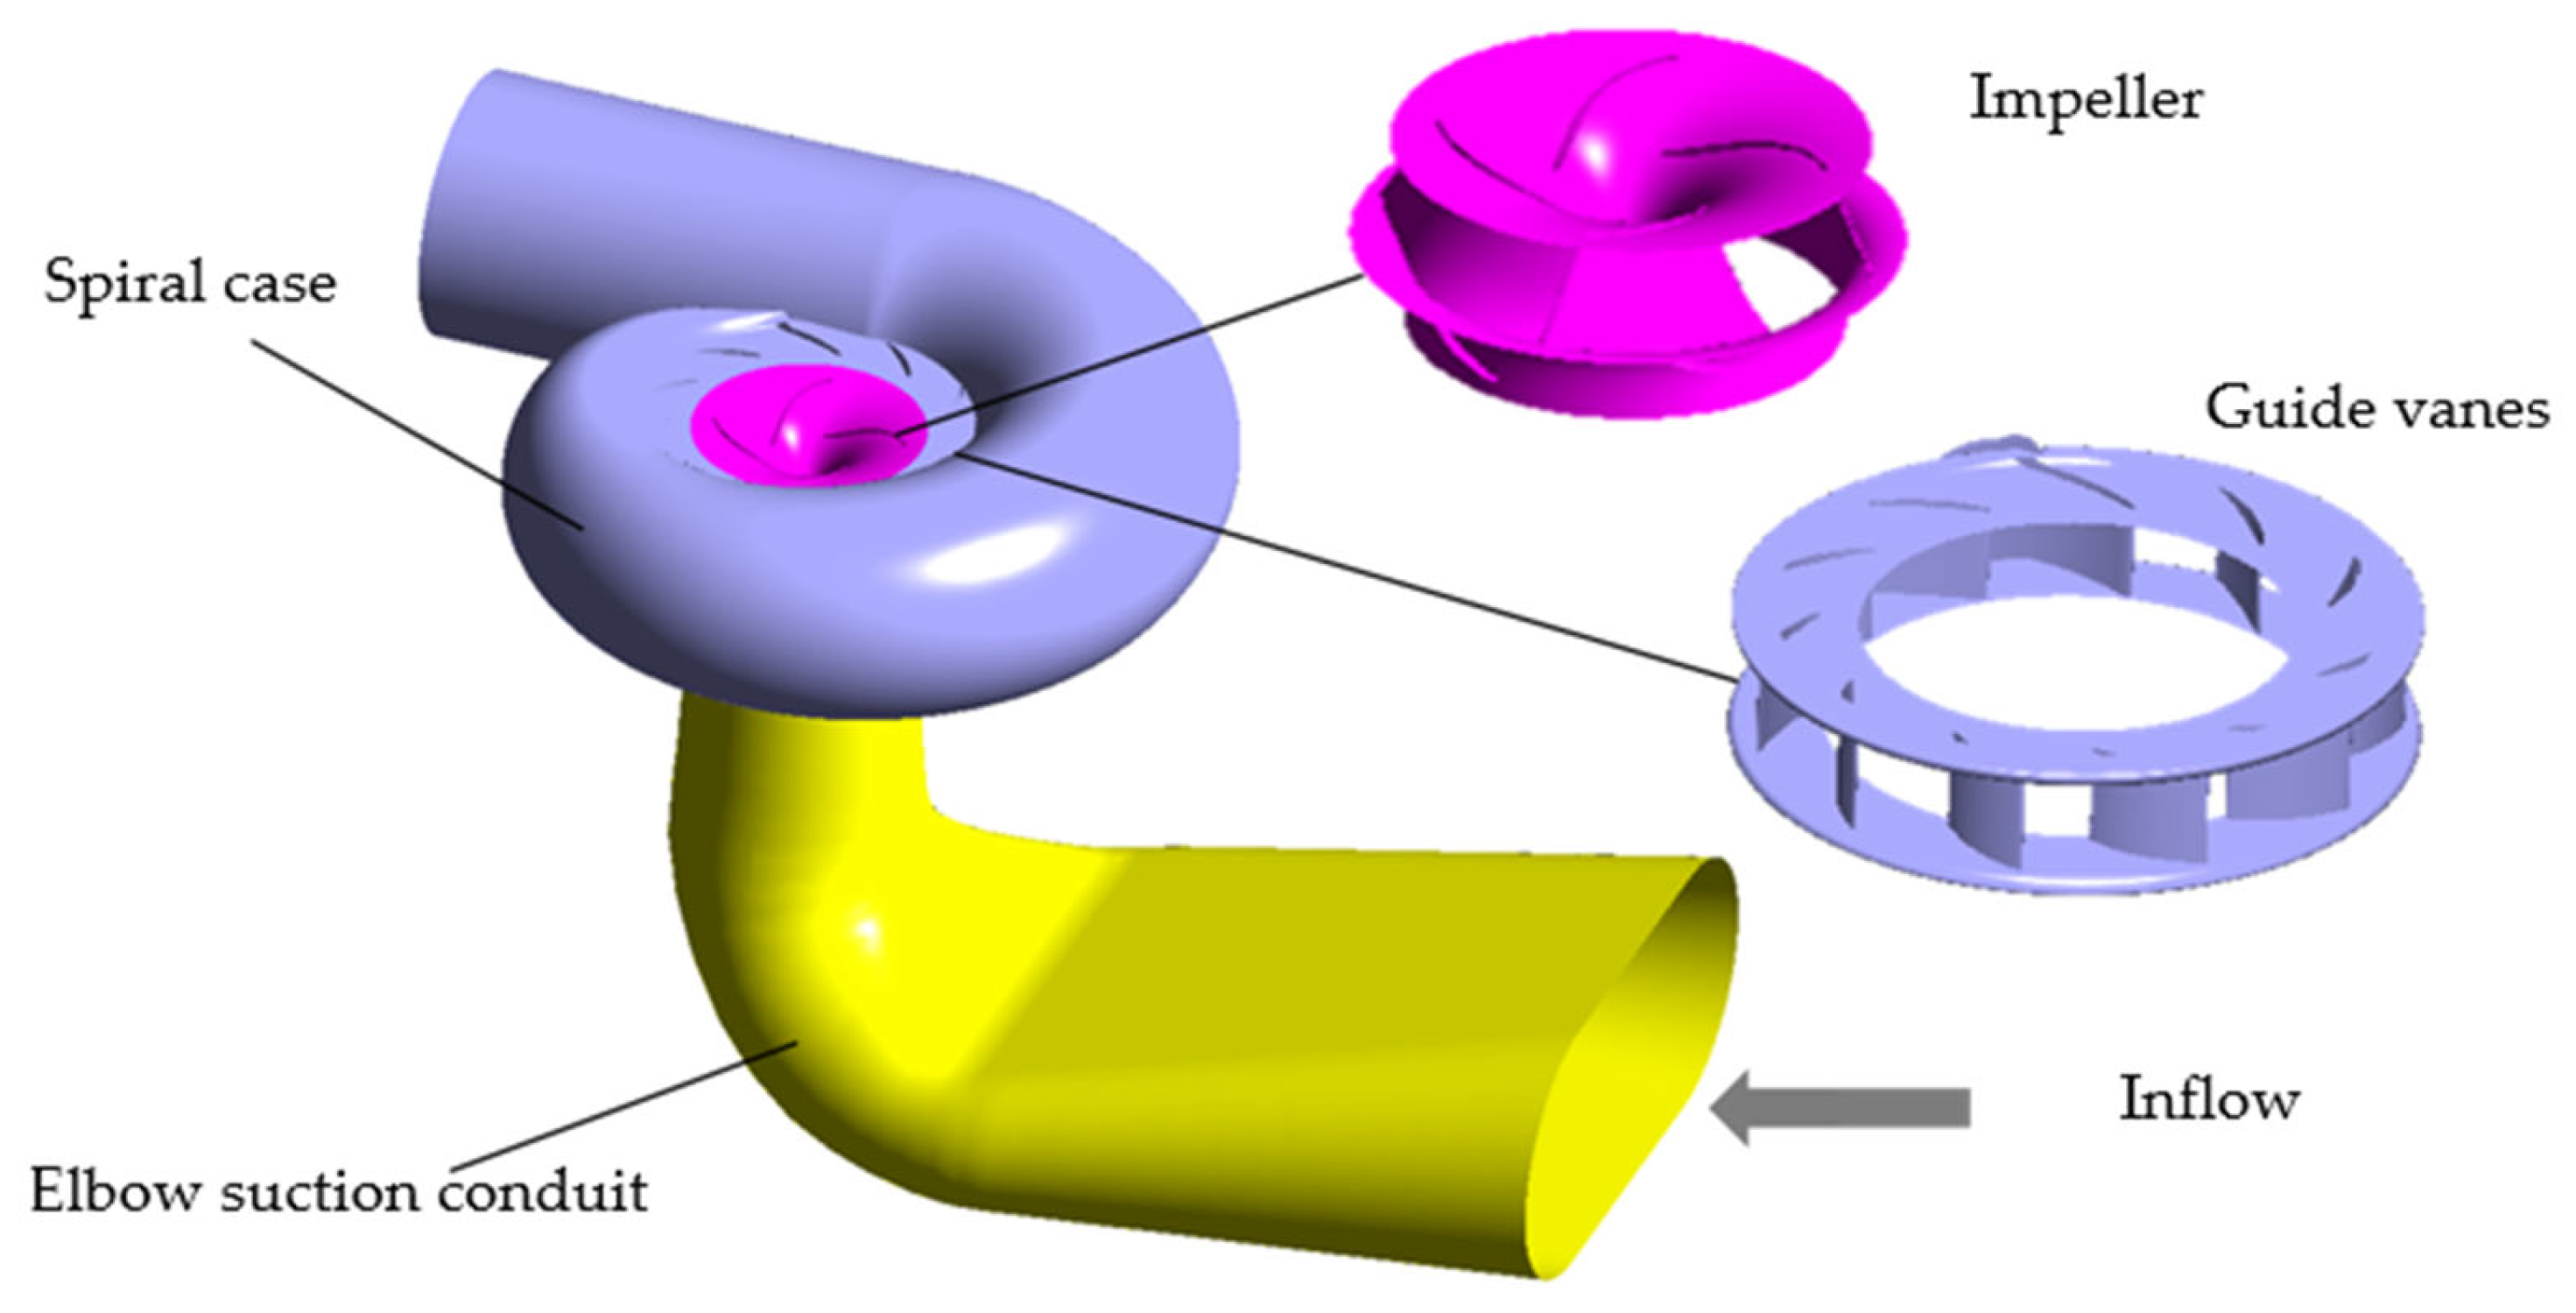
To facilitate the subsequent grid generation and calculation setup, the specific speed mixed flow pump studied in this paper is composed of three parts: the elbow suction conduits, the impeller and the spiral case with 11 guide vanes. The flow domain of the MFP is shown in Figure 1.
With the help of the blades belonging to the rotating impeller, the fluid was transported from the elbow suction conduits inlet to the outlet of the spiral case. Total energy difference between the inlet and outlet is the head of the MFP.

2.3. Numerical Simulation

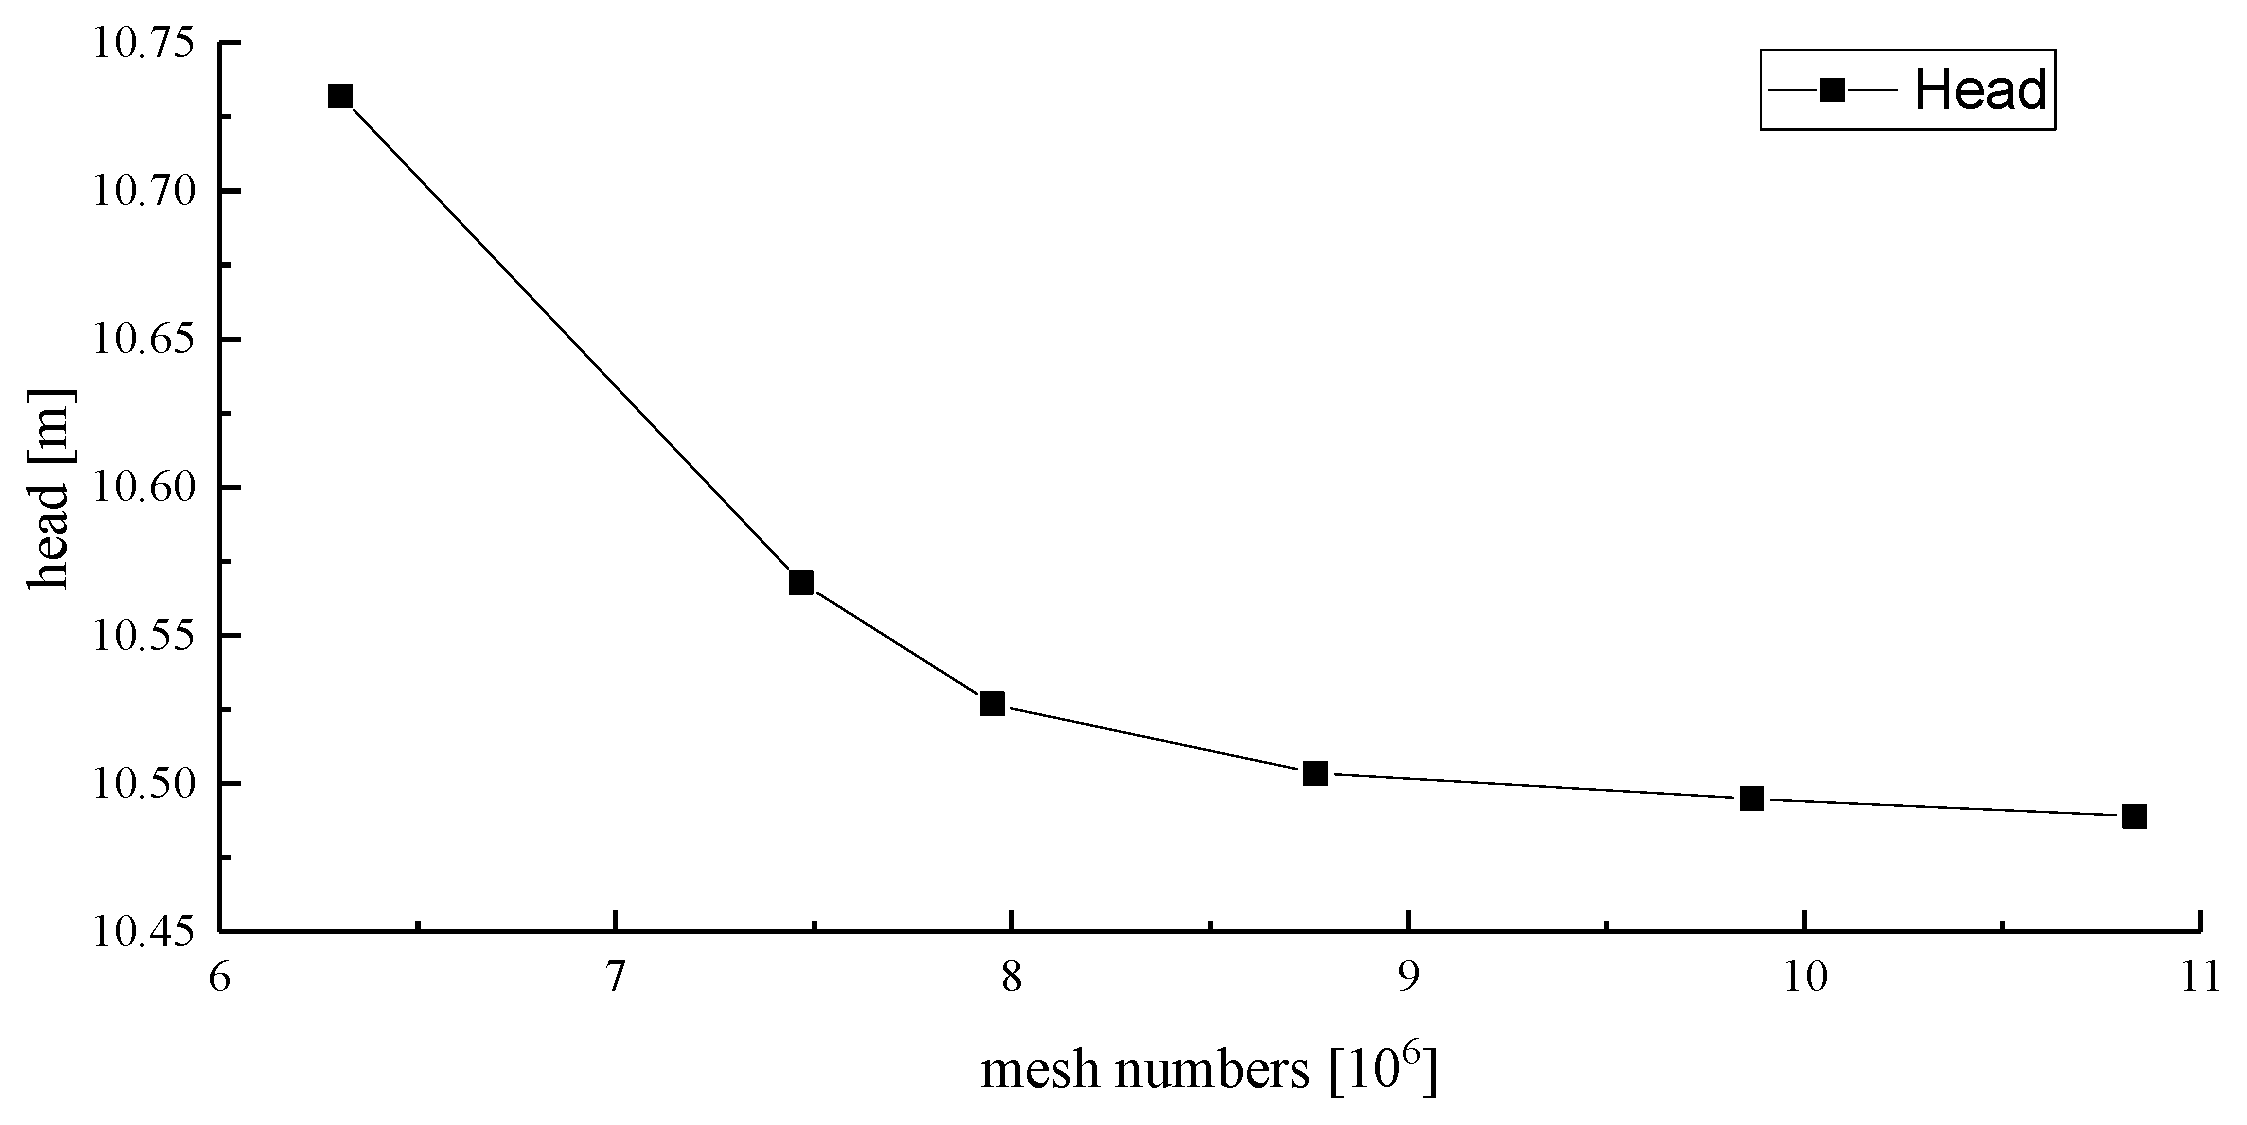
Because grid density and quality exert a decisive influence on both accuracy and computational overhead [26], a rigorous grid-independence study was performed following the procedure illustrated in Figure 2. When the element count exceeded 9.86 × 10⁶, the predicted head varied by <0.1% relative to the next finer level; this mesh balanced against available computational resources, and was therefore adopted as the criterion for finalizing the component-wise mesh densities summarized in Table 2.
There are about 2.2 million mesh elements in the elbow suction conduits calculation domain, while the element number of the impeller domain was also about 2.2 million. Total mesh elements of guide vane and spiral case were 5.4 million, as shown in Table 2.
In the simulation, the turbulence model was set as the RNG k-ε model. Although more advanced models such as SAS-SST or LES offer higher fidelity for transient separations, the RNG k-ε model has been widely validated for steady-state simulation of swirling and recirculating flows in curved conduits [27,28], while offering a balance between accuracy and computational cost for engineering analysis. “High resolution” was chosen as the solution control parameter. Maximum iteration number was 500. A convergence criterion of 1 × 10⁻⁵ was set to achieve a balance between the calculation accuracy and time.
Considering that the Reynolds number at the rated operating point is approximately 7 × 10⁶, wall functions are invoked in the low-Reynolds-number near-wall region to bridge the physical variables on the wall with those in the turbulent core. A non-dimensional parameter y+ is introduced and defined as follows.
y + = ρ y u τ μ
u τ = τ w ρ
In which y represents the normal distance from the grid node to the wall (unit: m), uτ is the friction velocity (unit: m/s), and τw is the wall shear stress (unit: Pa). Physically, y+ can be interpreted as a local Reynolds number of the eddy located at y, thereby reflecting the variation in viscous influence with wall distance. When the first grid node is positioned within the logarithmic layer, the simulation accuracy for near-wall flow characteristics is significantly improved.
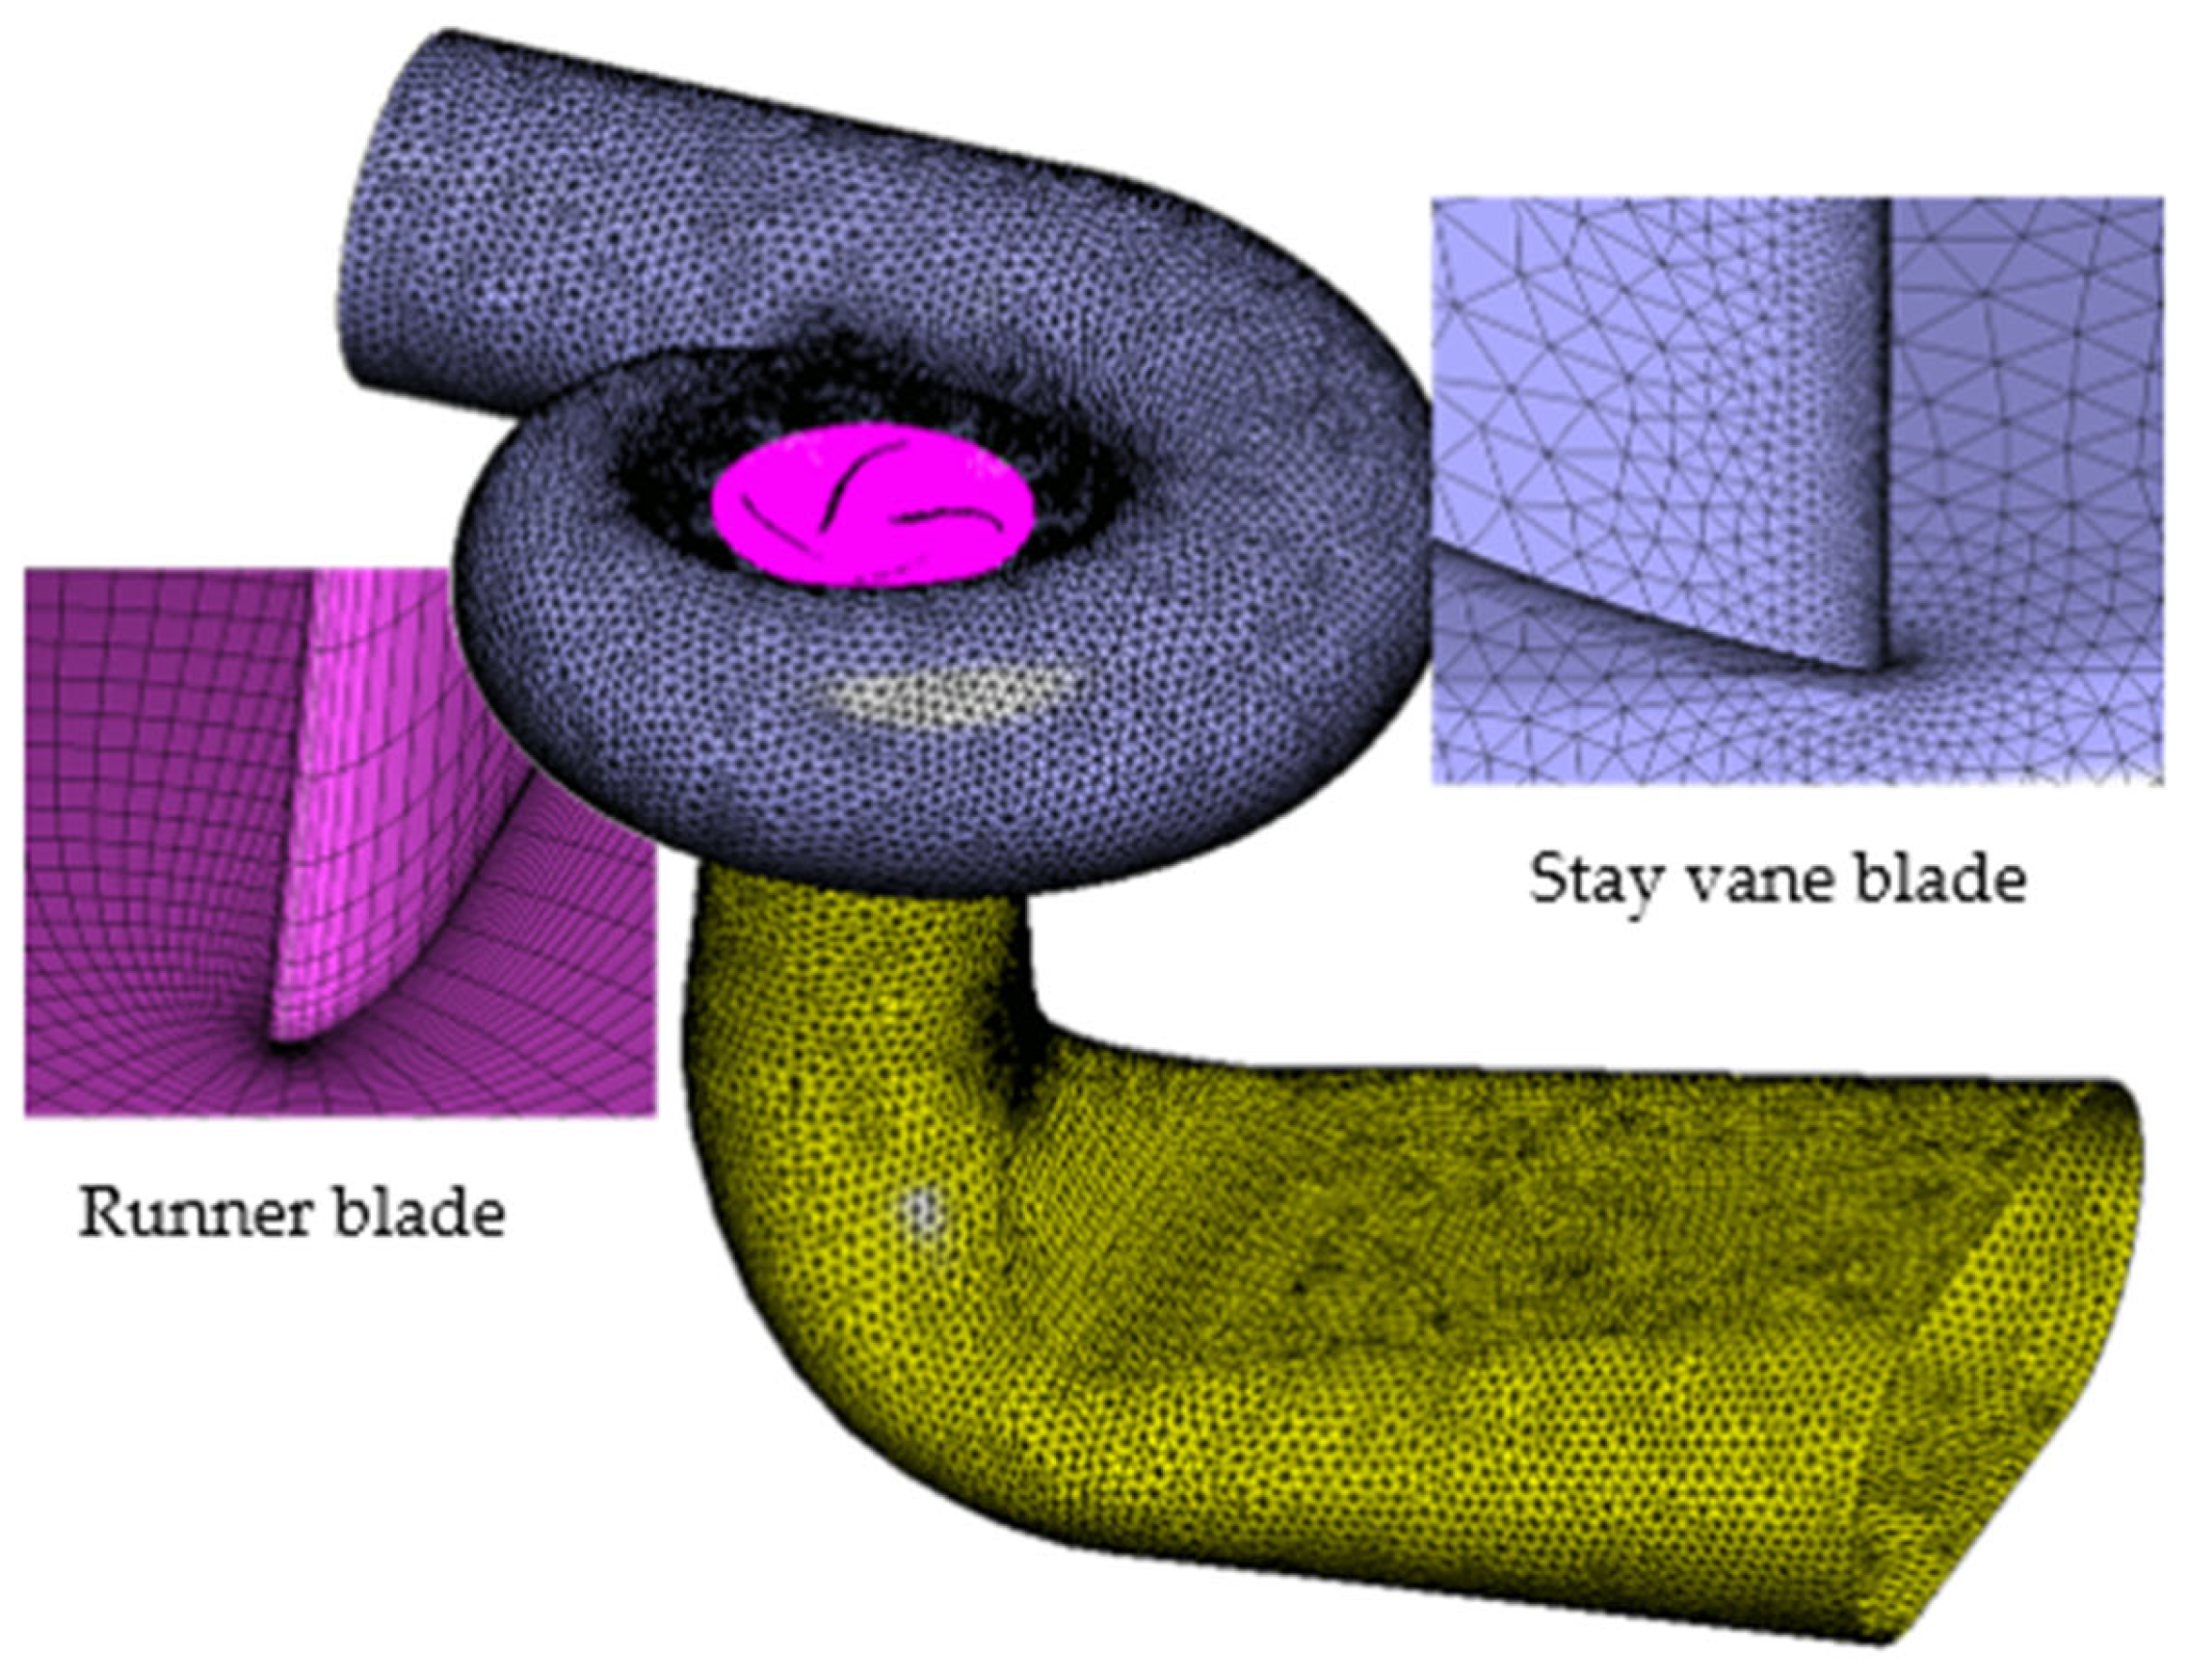
Accordingly, systematic mesh examination and successive refinement were carried out until the near-wall average y+ values fulfilled the computational accuracy requirement for the turbulence model employed. The resultant wall y+ values for the runner, spiral case, and suction-conduit components are reported in Table 2; a schematic illustration of the computational grid adopted in the present CFD simulations is provided in Figure 3.
To ensure consistency between the numerical calculations and the model tests, the working fluid was water, maintained at a constant reference temperature Tref of 298.15 K under isothermal conditions. The elbow suction conduits inlet boundary was set with the mass flow rate condition. For the design condition as shown in Table 1, the mass flow rate was set as equal to the value of Qr with a medium turbulence intensity (5%). The static pressure condition was given at the spiral case outlet. For all the simulation conditions the static pressure was set as 0 Pa.
A general grid interface (GGI) was set between the rotating domain and the static domain. The rotor–stator interface was in the “Frozen Rotor” type. Other boundaries such as the blades, the guide vanes and wall of elbow suction conduits were all set as no-slip.
Steady-state simulations were carried out in order to predict the pump characters in varies mass flow rate.

2.4. Experimental Validation

An experimental test was carried out on test-stand VI of State Key Laboratory of Hydro-power Equipment, with the purpose of verifying the current grid and numerical method.
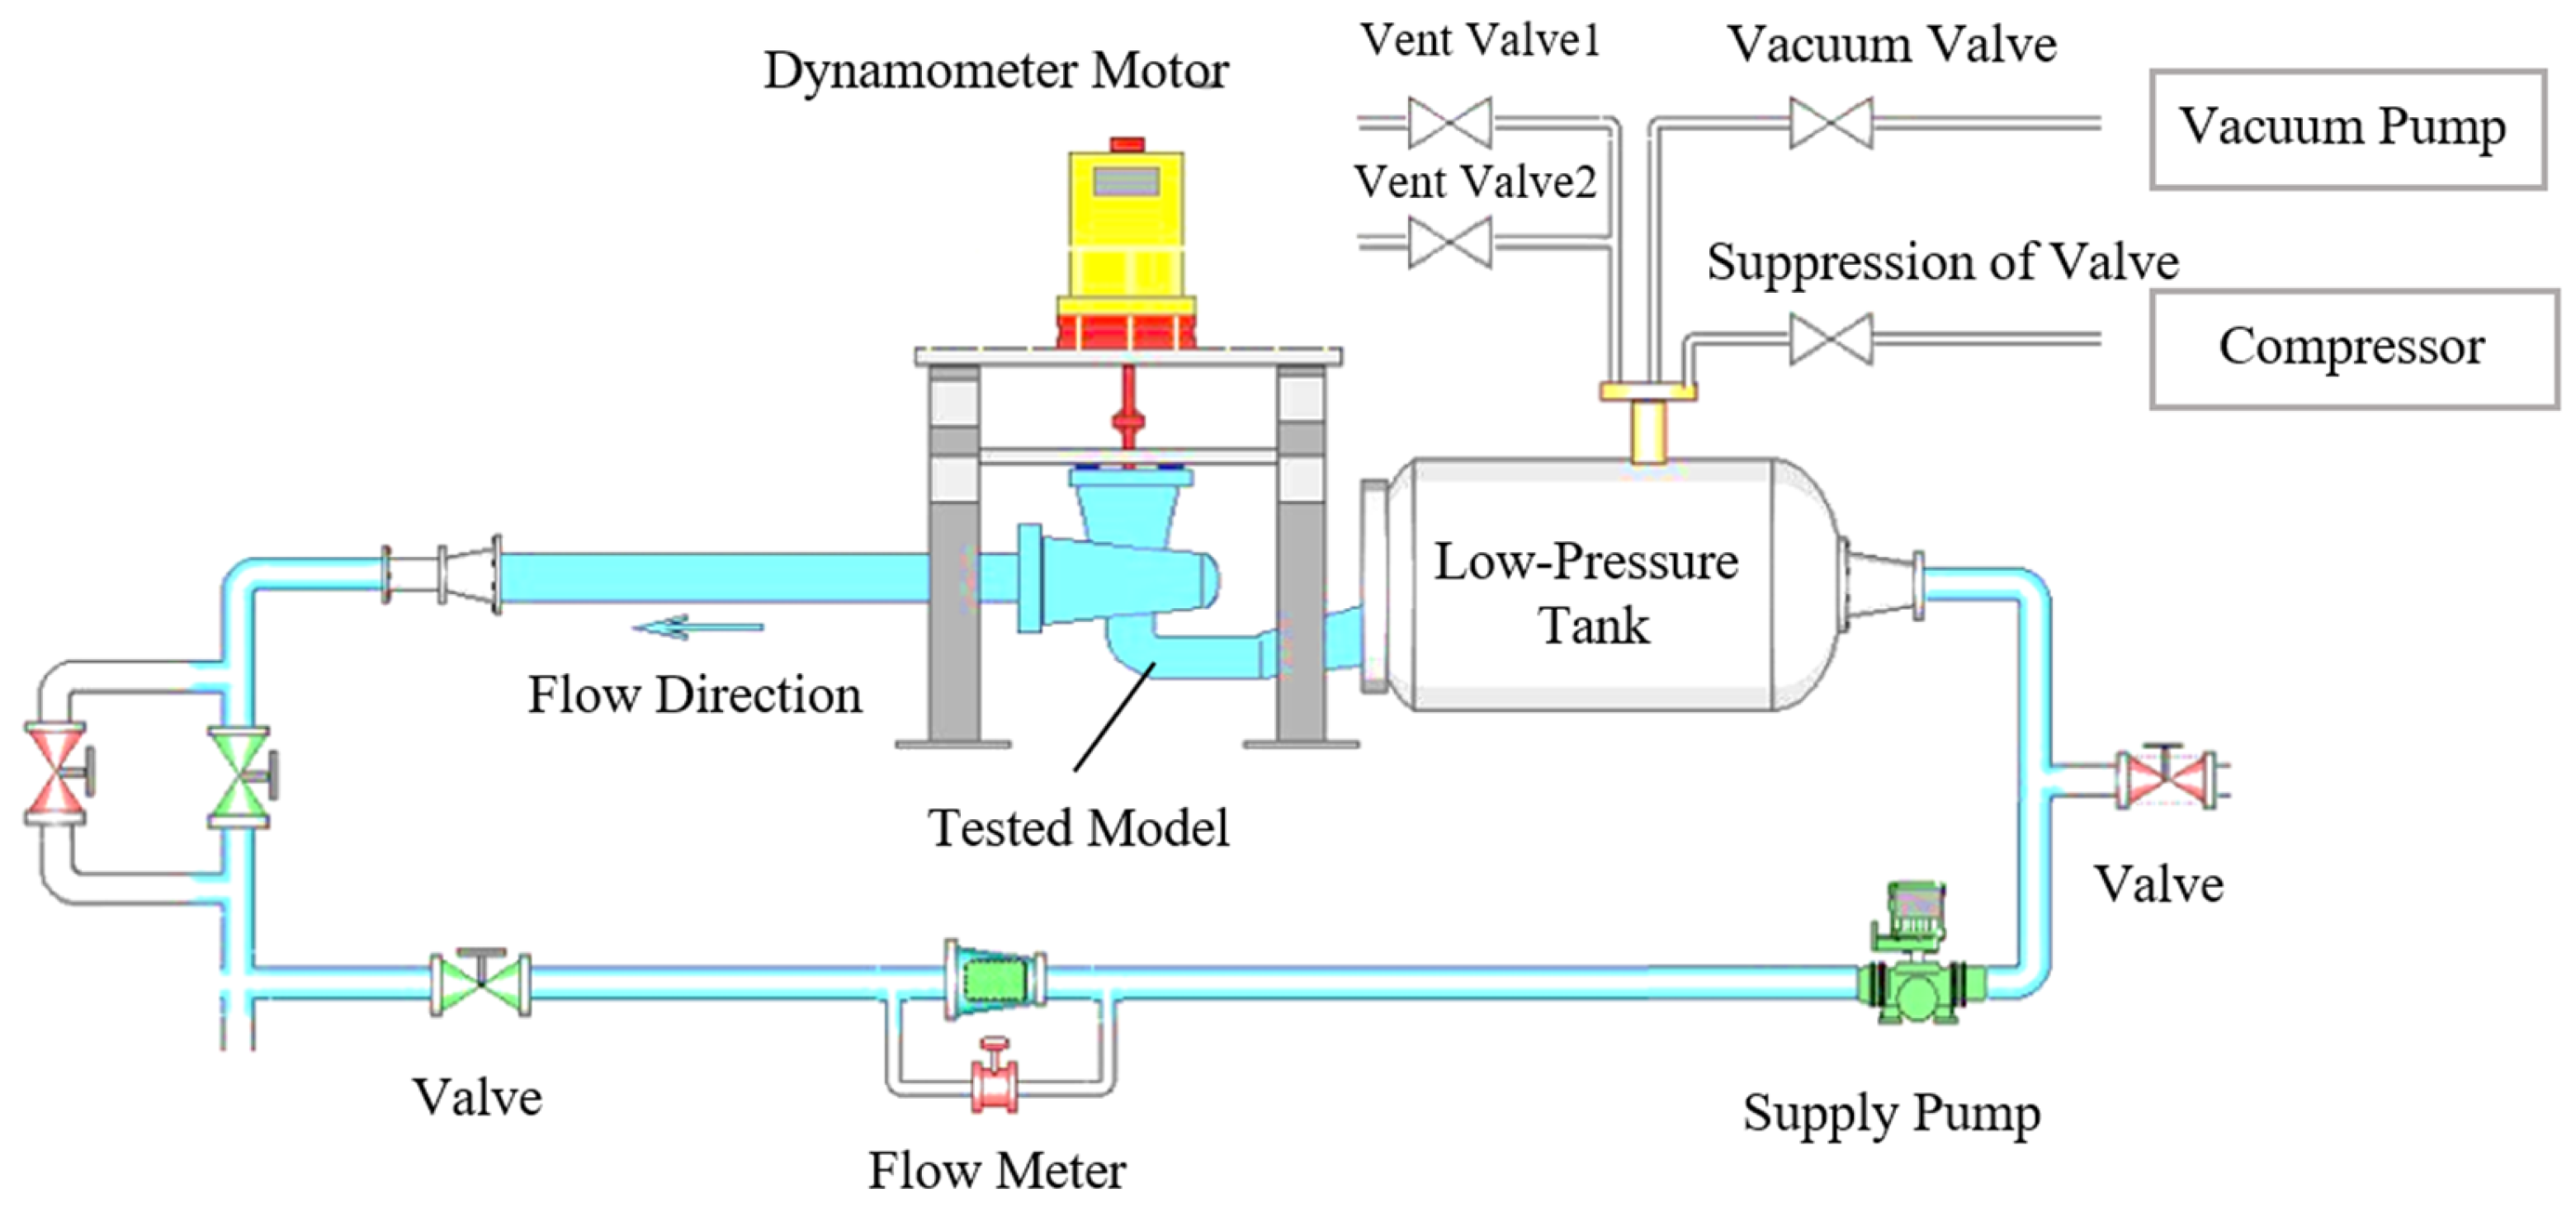
A schematic map of a hydraulic machinery test stand is shown in Figure 4. Total test uncertainty of the experiment on the test-stand VI was ±0.3%. The pump model test method meets the requirements of IEC60193 [29].
By means of the compressor, the tailrace pressure and thus the system cavitation coefficient could be continuously regulated. A booster pump was installed to overcome the intrinsic head loss of the loop, while a throttling valve was employed to modify the system resistance and thereby shift the operating point. Under constant rotational speed of the test pump, its characteristic curve remains unchanged; closing the valve increases the system damping, moving the intersection of the system flowrate-head curve and the pump curve toward lower flow rates. Consequently, the measured operating condition migrates to the low-flow region of the mixed-flow pump flowrate–head characteristic curve.
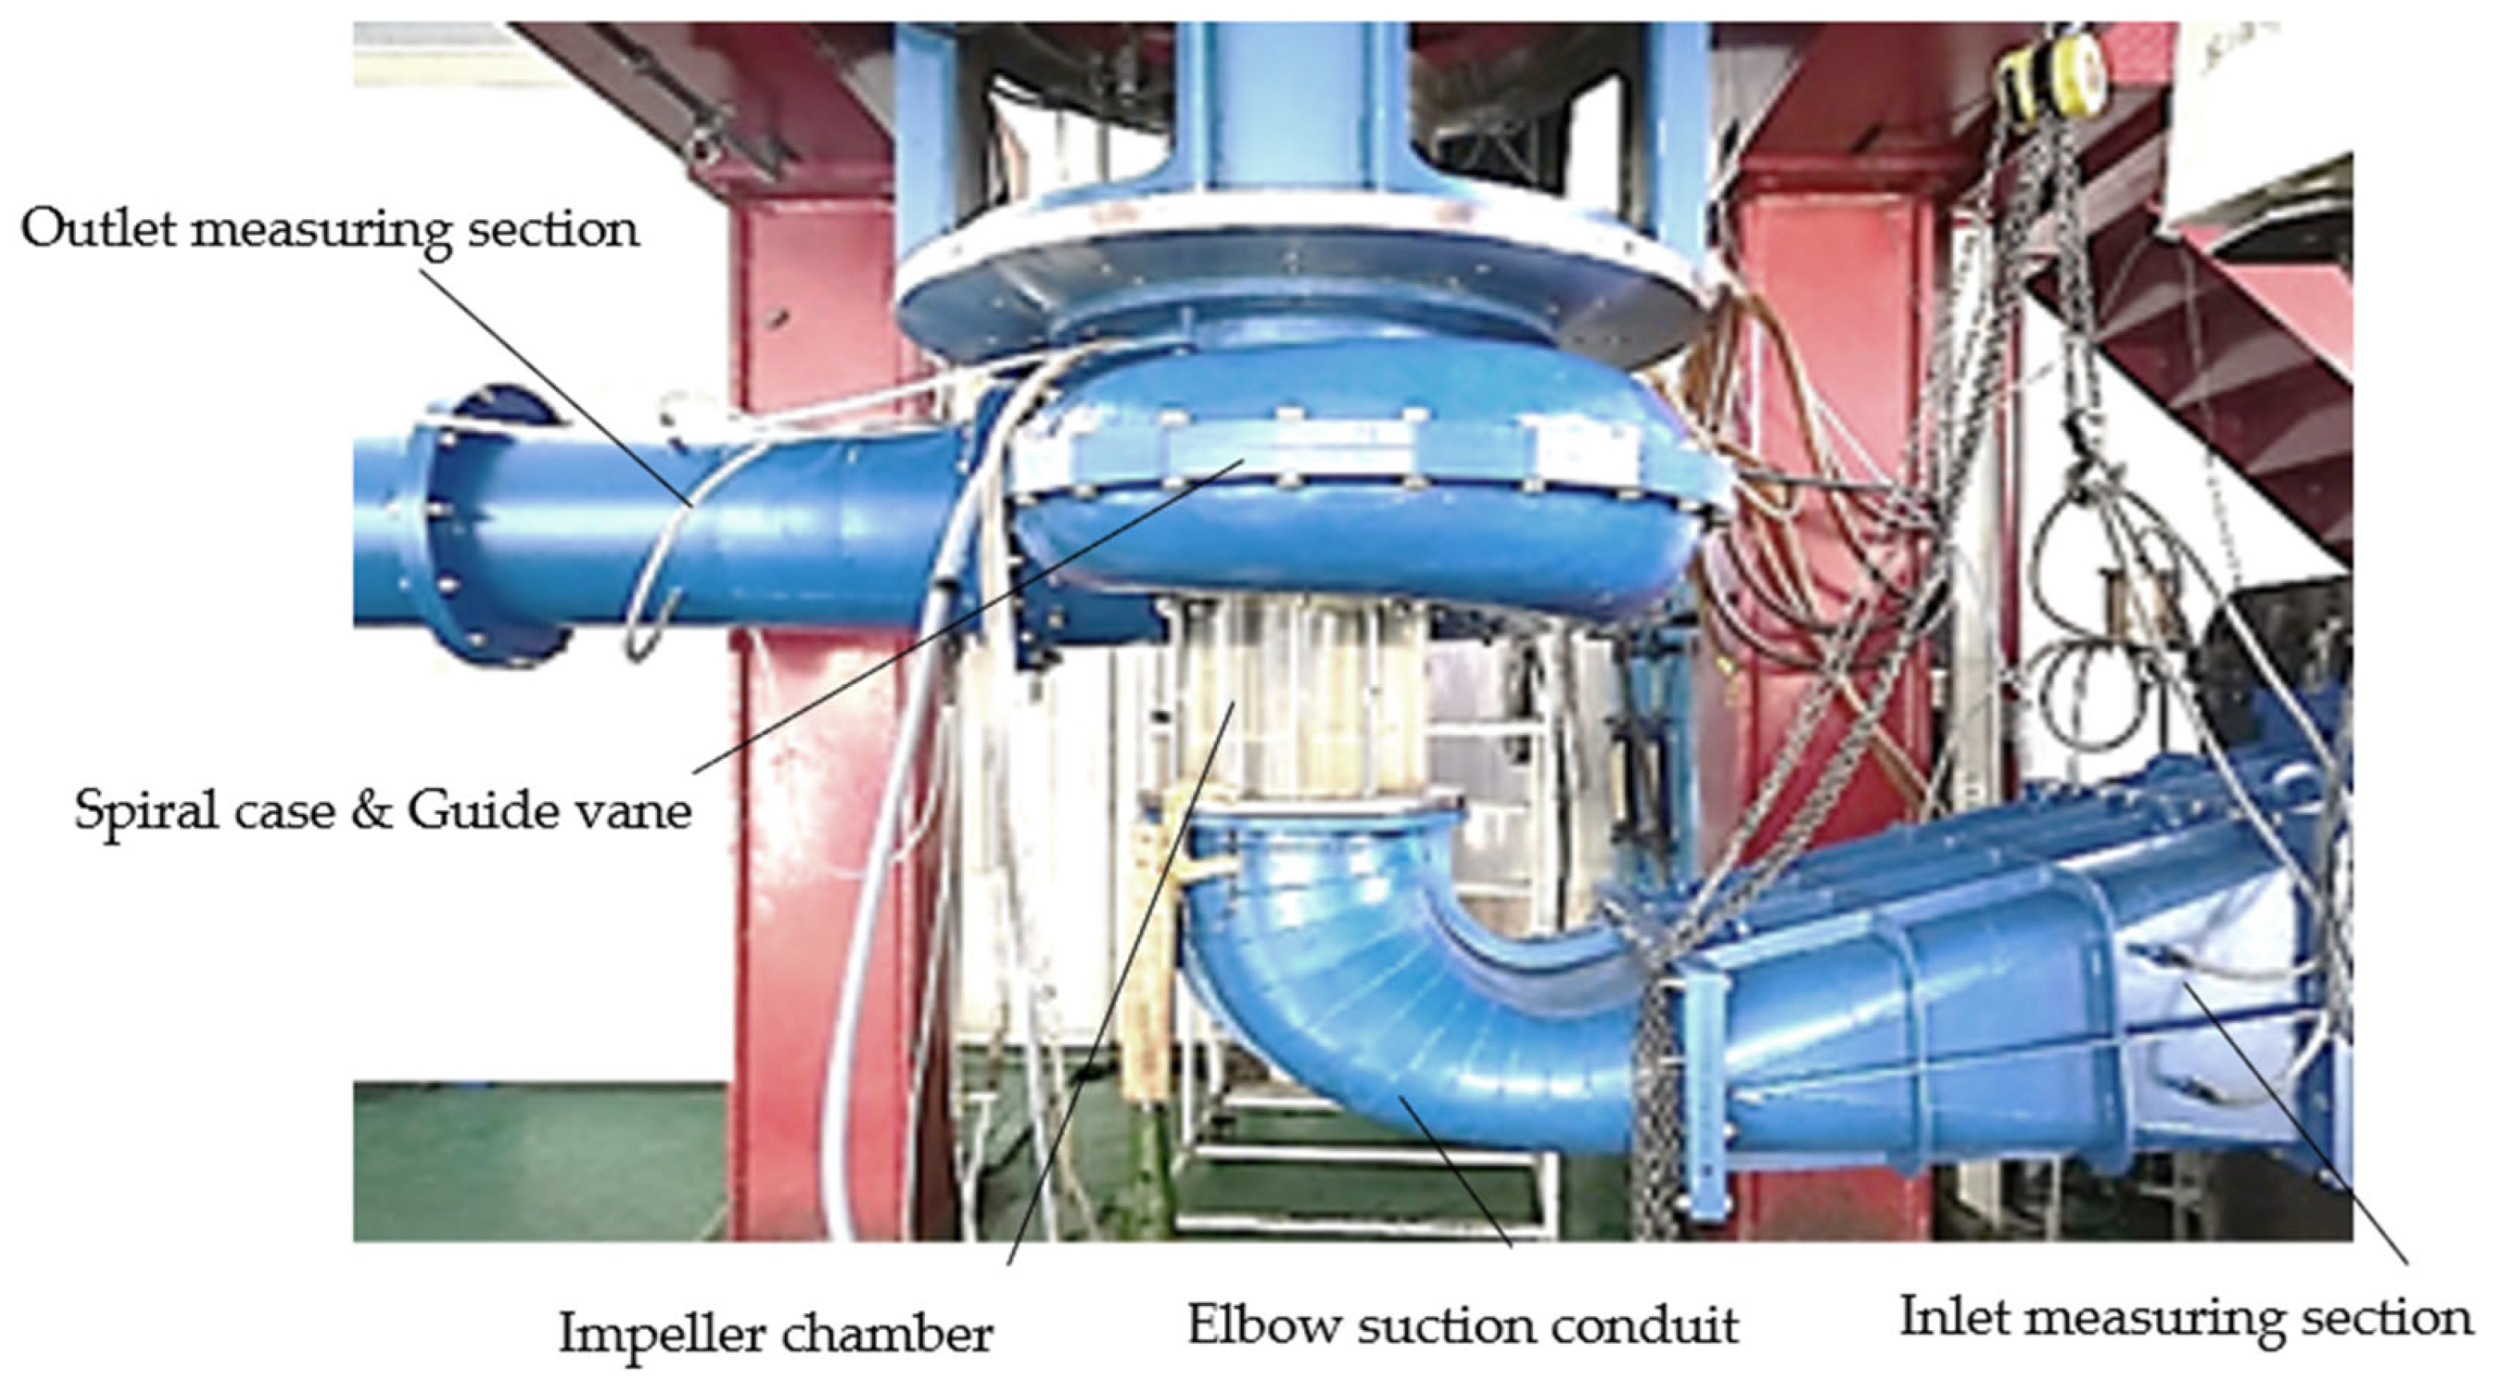
Hydraulic performance is calculated by measuring pressure, flow rate, and shaft power. The flow rate was tested using the flow meter, while the head was obtained by ac-quiring the pressure difference between the inlet and outlet measuring sections, which were located on the elbow suction conduit and the outlet pipe of the spiral case, respectively, as shown in Figure 5.
The shaft power was tested by the dynamometer motor. The efficiency η was obtained using products among the fluid density ρ, the acceleration of gravity g the flow rate Q as well as the pump head H, and dividing by the shaft power P [4], as in Equation (7):
η = ρ g Q H / P
In typical CFD computations, neither the mechanical losses including bearing friction, packing seal friction acting on the main shaft nor the disc-friction losses are taken into account. Consequently, the numerically predicted efficiency η tends to be higher than the experimentally measured values. Accordingly, an empirical correction Formula (8) is applied, whereby the efficiency inclusive of mechanical losses is obtained as the product of the raw CFD result and a correction factor. The correction formula reads as follows [4].
η m = 1 C 1 1 ( C 2 n q ) ( 7 / 6 )
η * = η η m
where C1 and C2 are empirical constants with values of 0.07 and 0.0365, respectively.
The cavitation performance of the mixed-flow pump was evaluated experimentally by progressively lowering the system pressure from a high to a low level, until the initial occurrence of cavitation (either blade cavitation or flow separation) was observed in the model runner. The corresponding system cavitation coefficient at this critical point was recorded as the incipient cavitation coefficient σi for the given flow rate condition.
The head efficiency as well as the initial cavitation coefficient of the rated point of this pump with both simulated and experimental results are shown in Table 3.
The absolute deviations of both the head coefficient and the efficiency coefficient amount to 0.04; representing relative differences of 1.2% and 3.1%, respectively, when normalized by the experimental values. Following empirical correction, the numerical simulation results at rated conditions showed only a 1.2% overprediction in efficiency compared to experimental measurements.
The observed discrepancies arise from multiple sources: numerical modeling assumptions; unresolved boundary layer details due to mesh constraints; simplified representation of shaft seal and bearing losses; and measurement instrument tolerances. Despite these deviations, the overall uncertainty in the simulation results is within acceptable limits, meeting the required analysis accuracy. Therefore, the current computational model can be utilized for further research and design optimization efforts. To enhance the analysis accuracy, local velocity field validation via Particle Image Velocimetry (PIV) could be used in future work to further verify the consistency of flow structure representations.
Comparison of the pump performance over the entire flow range between both simulated and experimental results are shown in Figure 6.
Both of the numerically predicted and experimentally measured head–discharge characteristics across the operational range of the mixed-flow pump are presented in Figure 6a. In the vicinity of the rated steady-state operating region, the simulation agrees closely with the measurements; however, as the working point departs from the design condition and approaches the hump zone, secondary flows and the evolution of vortex structures markedly increase flow complexity and the difficulty of capturing the internal flow field, resulting in larger discrepancies between computation and experiment.
Figure 6b presents the corresponding comparison for the efficiency–discharge characteristics. Across the entire operating envelope, the predicted trends of both head coefficient and efficiency. The deviation remains small near the rated condition, whereas it grows as the operating condition moves away from the rated value. That demonstrates consistent trends with the head–discharge characteristics.
The incipient cavitation performance near the rated condition is examined in Figure 6c, revealing good correlation between numerical predictions and experimental observations, lending confidence to the predictive capability of the present numerical approach.
The simulated values demonstrated strong agreement with the test results over the investigated operational range of the mixed-flow pump. The maximum discrepancies in head coefficient and efficiency occurred at the maximum flow rate condition, reaching 0.09 and 2.86%, respectively, and were within a reasonable range. Despite these variations, the numerical simulations prove sufficiently reliable for comprehensive evaluation and accurate analysis of the flow characteristics.
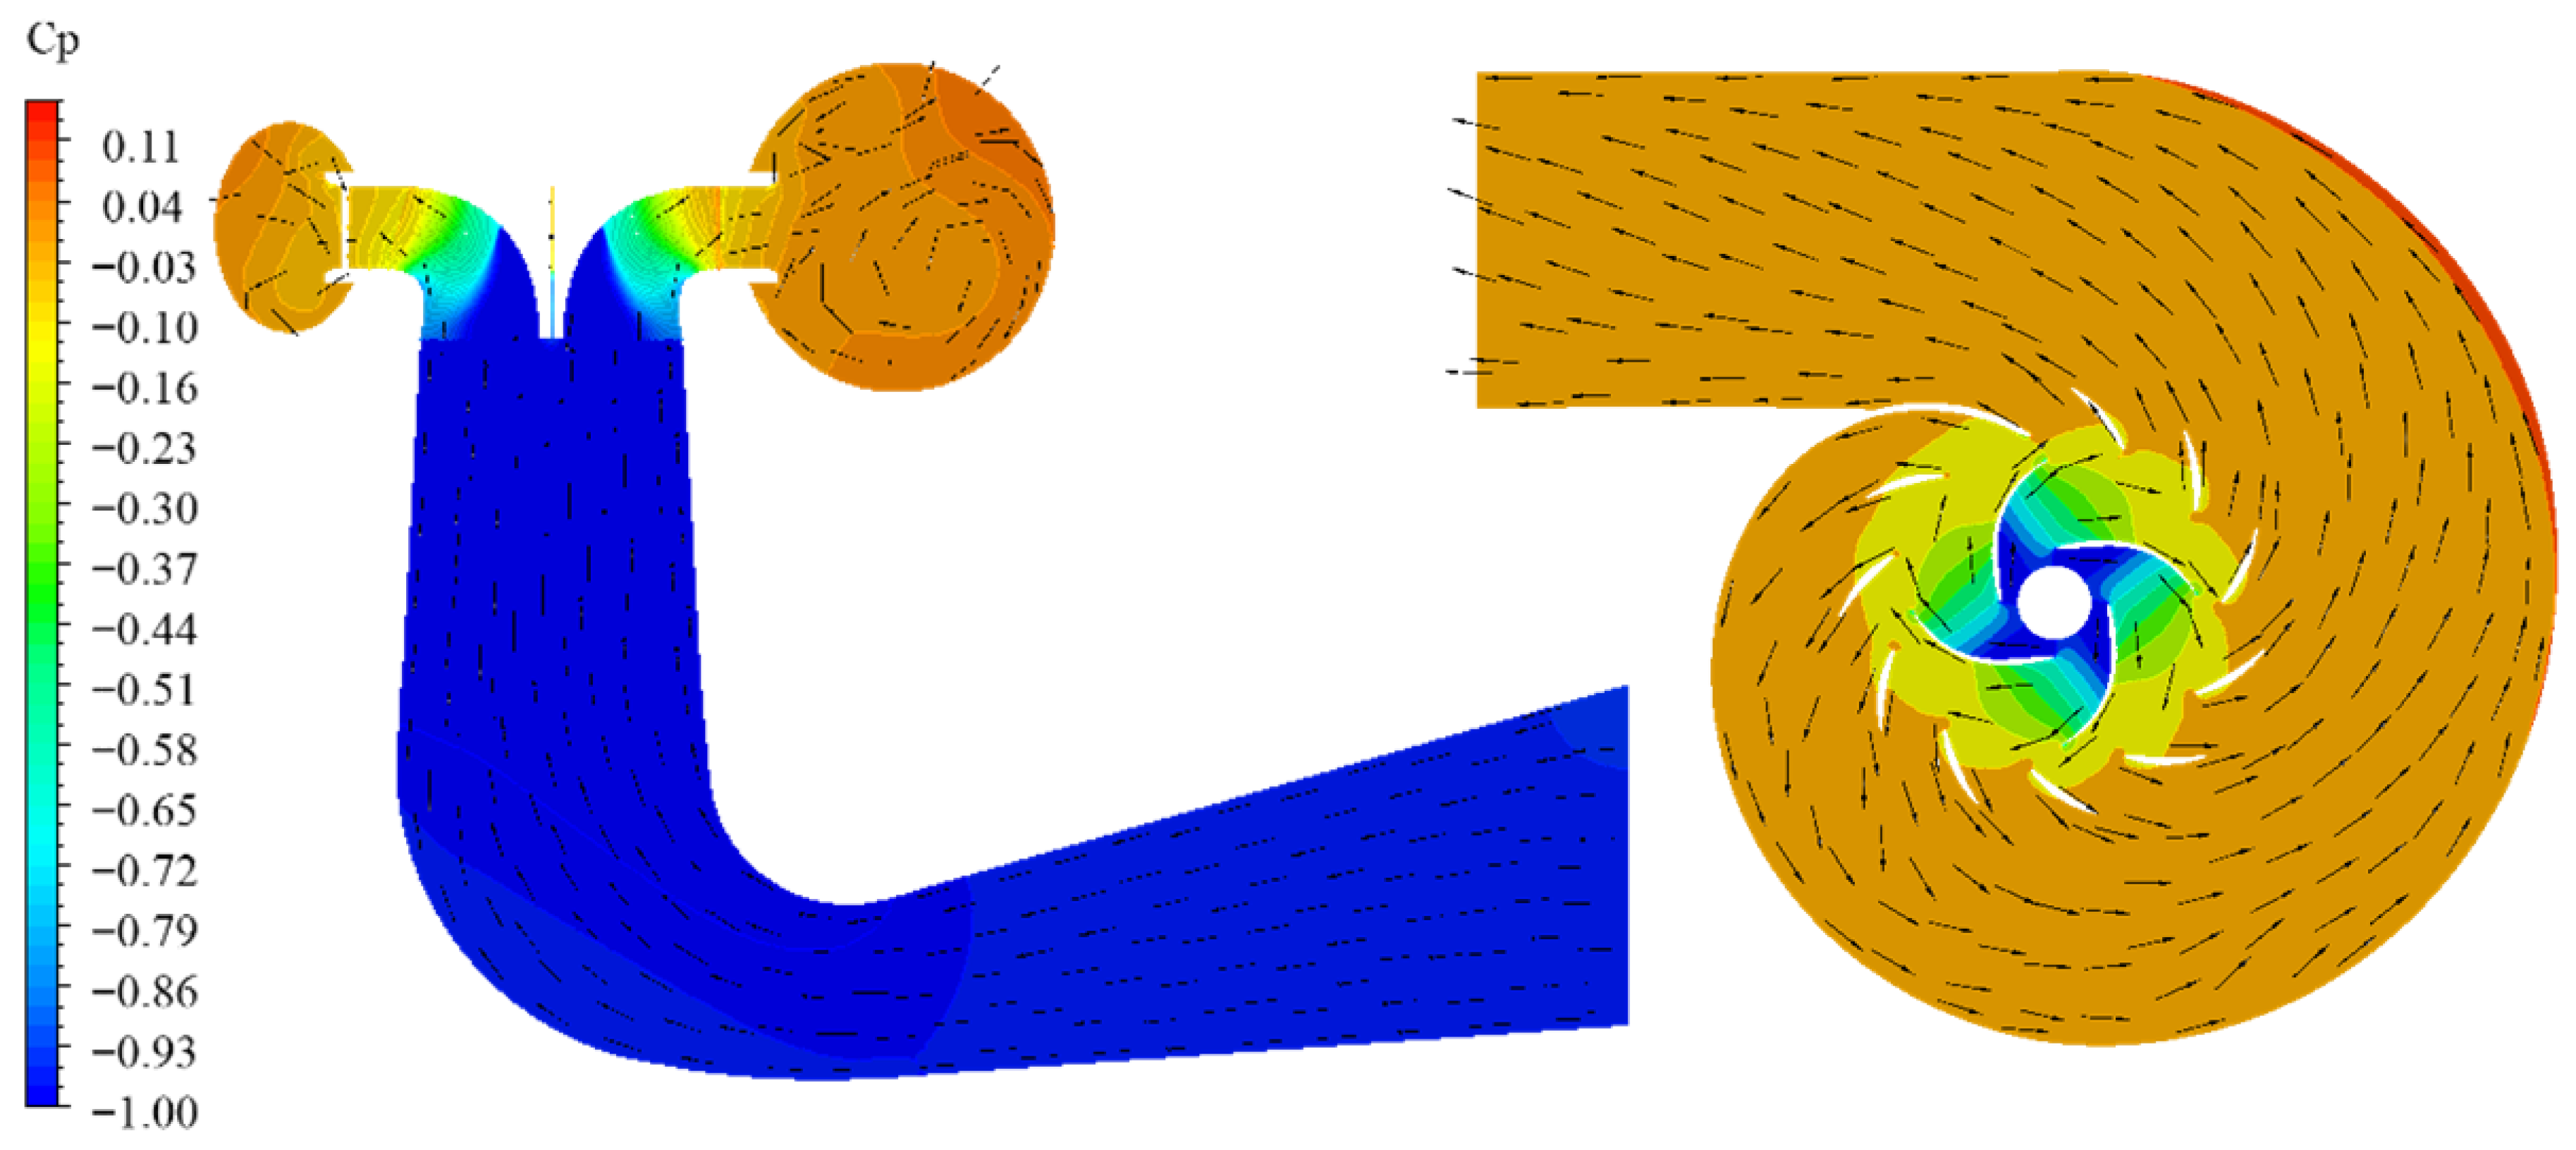
Flow regime of the mixed flow pump was taken into consideration. The static-pressure distribution and relative-velocity vector fields on the meridional (mid-stream) symmetry plane as well as the mid-span layer of the mixed-flow pump are presented in Figure 7, where the dimensionless pressure coefficient Cp is defined as follows.
C p = p p r e f ρ g H
where p is static pressure, and pref presents the reference pressure at the spiral case flow-out boundary.
As illustrated, both within the elbow suction conduit and throughout the impeller passages the pressure gradient remains comparatively uniform and the flow appears smooth and well-behaved.
Consequently, the precise locations at which energy dissipation occur are extremely difficult to identify and, in turn, the prospect of further improving pump efficiency is markedly constrained. Hence, a more effective methodology is required to quantitatively diagnose the sources of passage losses and to guide subsequent optimization. To further improve the quantitative accuracy of turbulence dissipation, advanced measurement techniques such as synchrotron X-ray PIV can be employed in future work. These methods could offer unprecedented insight into transient vortical and cavitation dynamics.
3. Entropy Generation Calculation and High FED Visualization

3.1. Calculation of the Entropy Generation

According to the Second Law of Thermodynamics, entropy generation inevitably accompanies all real fluid flow systems. When thermal conduction (heat transfer between fluid layers) is neglected, the entropy production in pump systems originates solely from viscous dissipation [30,31]. For laminar flow, the volumetric entropy generation rate is given by (11):
S ˙ D = 2 μ T v x x 2 + v y y 2 + v z z 2 + μ T [ v x y + v y x 2 + v x z + v z x 2 + v z y + v y z 2 ]
where S ˙ D is the specific entropy; μ is the dynamic viscosity (unit: Pa·s), and T is the thermodynamic temperature (unit: K).
For turbulent flow, the Reynolds-averaged Navier–Stokes (RANS) framework allows decomposition of the velocity field into mean and fluctuating components. Consequently, the volumetric entropy generation rate can be decomposed into two distinct components: the averaged term ( S ˙ D ¯ ), and the fluctuating term ( S ˙ D ).
The averaged term (mean-flow entropy generation), evaluated directly from RANS solution, is written as Equation (12).
S ˙ D ¯ = 2 μ T v x ¯ x 2 + v y ¯ y 2 + v z ¯ z 2 + μ T [ v x ¯ y + v y ¯ x 2 + v x ¯ z + v z ¯ x 2 + v z ¯ y + v y ¯ z 2 ]
The fluctuating term (fluctuation-induced entropy generation) is written as Equation (13).
S ˙ D = 2 μ T v x x 2 + v y y 2 + v z z 2 + μ T [ v x y + v y x 2 + v x z + v z x 2 + v z y + v y z 2 ]
S D = S D ¯ + S D
The averaged term can be evaluated directly from the resolved mean velocity gradients. The fluctuating contribution, however, requires model-specific treatment; following Kock & Herwig [30], the entropy generation rate induced by velocity fluctuations is approximated using the turbulent kinetic energy dissipation rate ε, as Equation (15).
S ˙ D = ρ ε T
This indirect method is widely adopted in RANS-based entropy analysis of turbulent flows and provides a physically consistent estimate of turbulence-related irreversibility.
In rotating hydraulic machinery, the velocity gradients in the extensive near-wall regions are extremely large, and viscous effects dominate in boundary layers [31]. The standard volumetric entropy generation terms may not adequately resolve the intense dissipation near solid boundaries, especially when mesh resolution is limited. To explicitly capture this effect, a surface-based wall entropy generation rate is introduced [32]. The wall-induced entropy generation rate is expressed as Equation (16).
S ˙ w = τ · v T
where τ is the wall shear stress (unit: Pa) and v is the velocity at the first near-wall grid node (unit: m/s). This term represents the frictional dissipation at the solid-fluid interface and is integrated over the wetted surface to obtain the total wall contribution.
Consequently, the total entropy generation can be obtained by summing the volume integral of local entropy generation rates and the surface integral of wall entropy generation rates as shown in Equation (17).
S ˙ T o t a l = S ˙ D ¯ + S ˙ D + S ˙ w = V S ˙ D ¯ d V + V S ˙ D d V + A S ˙ w d A
This three-component decomposition has been successfully applied in recent studies on pump hydraulics, diffusers, and curved ducts [22,27], enabling a mechanistic identification of loss sources: S ˙ D ¯ expresses core flow and separation losses, S ˙ D is turbulence-induced dissipation and S ˙ w means boundary-layer friction.
Under steady-state flow conditions, all kinetic and potential energy losses are converted into internal energy increases. The corresponding head loss can therefore be expressed in terms of the total entropy generation as follows [22]:
H = T · S ˙ T o t a l m g ˙
where m ˙ represents mass flow rate (unit: kg/s).

3.2. High-FED Visualization and Location

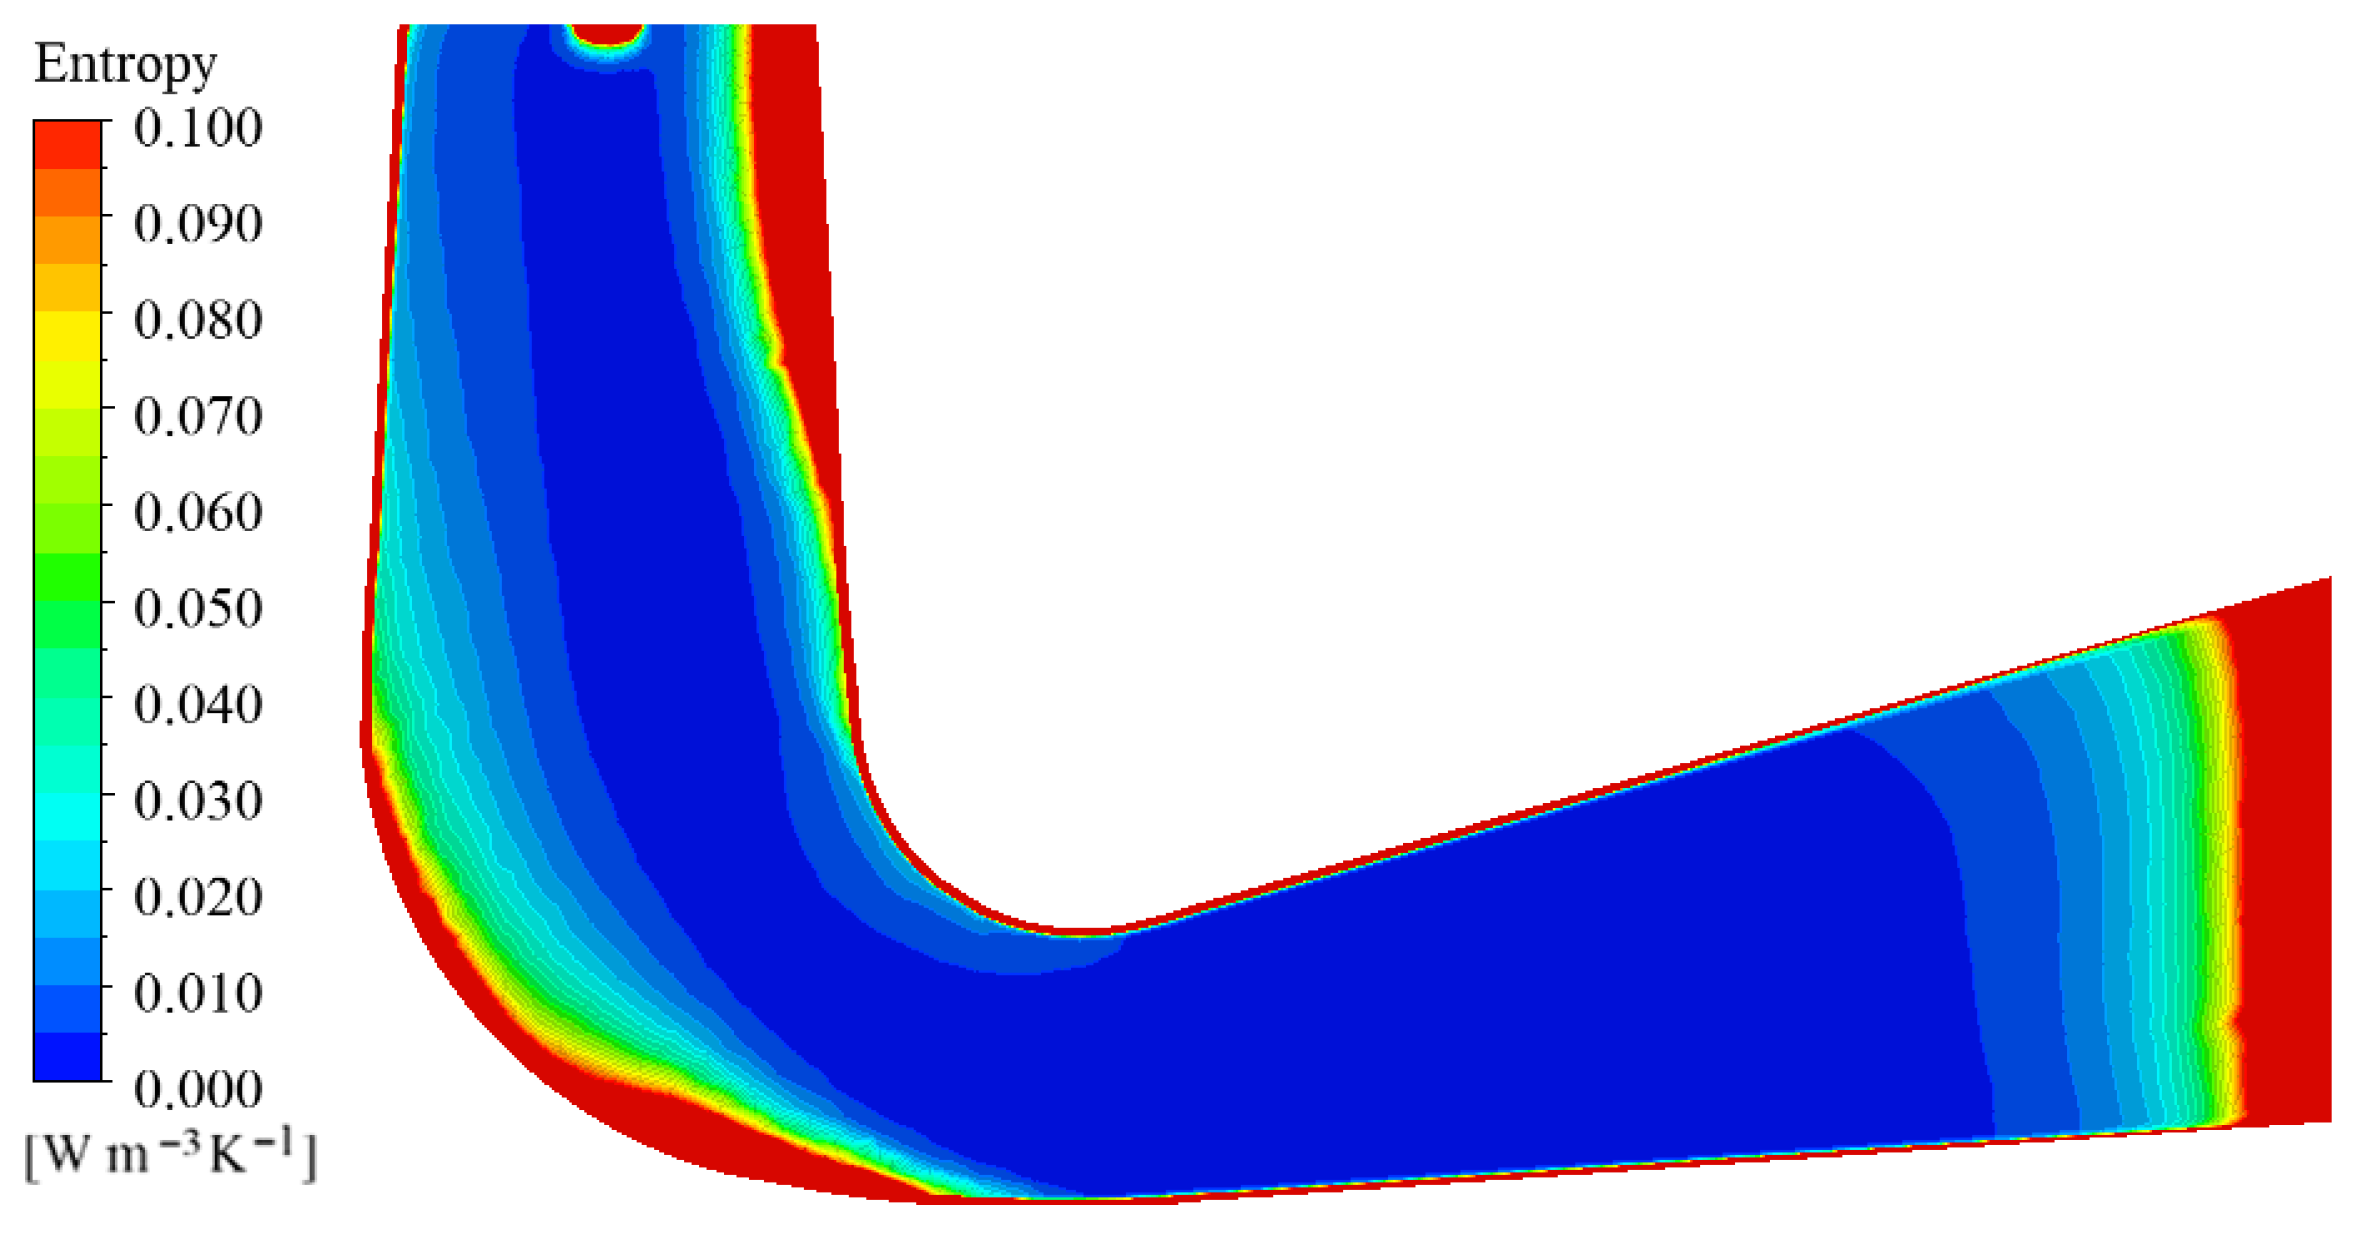
Based on the analysis in Section 3.1, the entropy production rate distribution on the meridional plane of the pump elbow suction conduit is presented in Figure 8.
Analysis of the entropy production contours reveals primary zones of high entropy generation rate: (i) inlet contraction of the elbow suction conduit, (ii) wall shear of the conduit, (iii) outer curvature of the elbow bend, and (iv) the inner conical surface. These regions exhibit significant flow-induced dissipation (FED), indicating strong velocity fluctuations and flow non-uniformity. Research suggests that a well-designed pump performance is highly sensitive to inflow conditions. Thus, velocity fluctuations in the elbow suction conduit directly affect the inflow characteristics and energy conversion efficiency of the impeller.

4. Geometric Optimization and Characteristic Analysis

Guided by the entropy-generation map, the geometric parameters of the elbow suction conduit were systematically optimized. Numerical simulations under rated operating conditions were performed for each variant to characterize the flow, quantify the influence of geometry on conduit performance, and thereby provide a technical foundation for enhancing flow stability and improving the inlet conditions of the impeller.

4.1. Optimization Schemes and Entropy Change

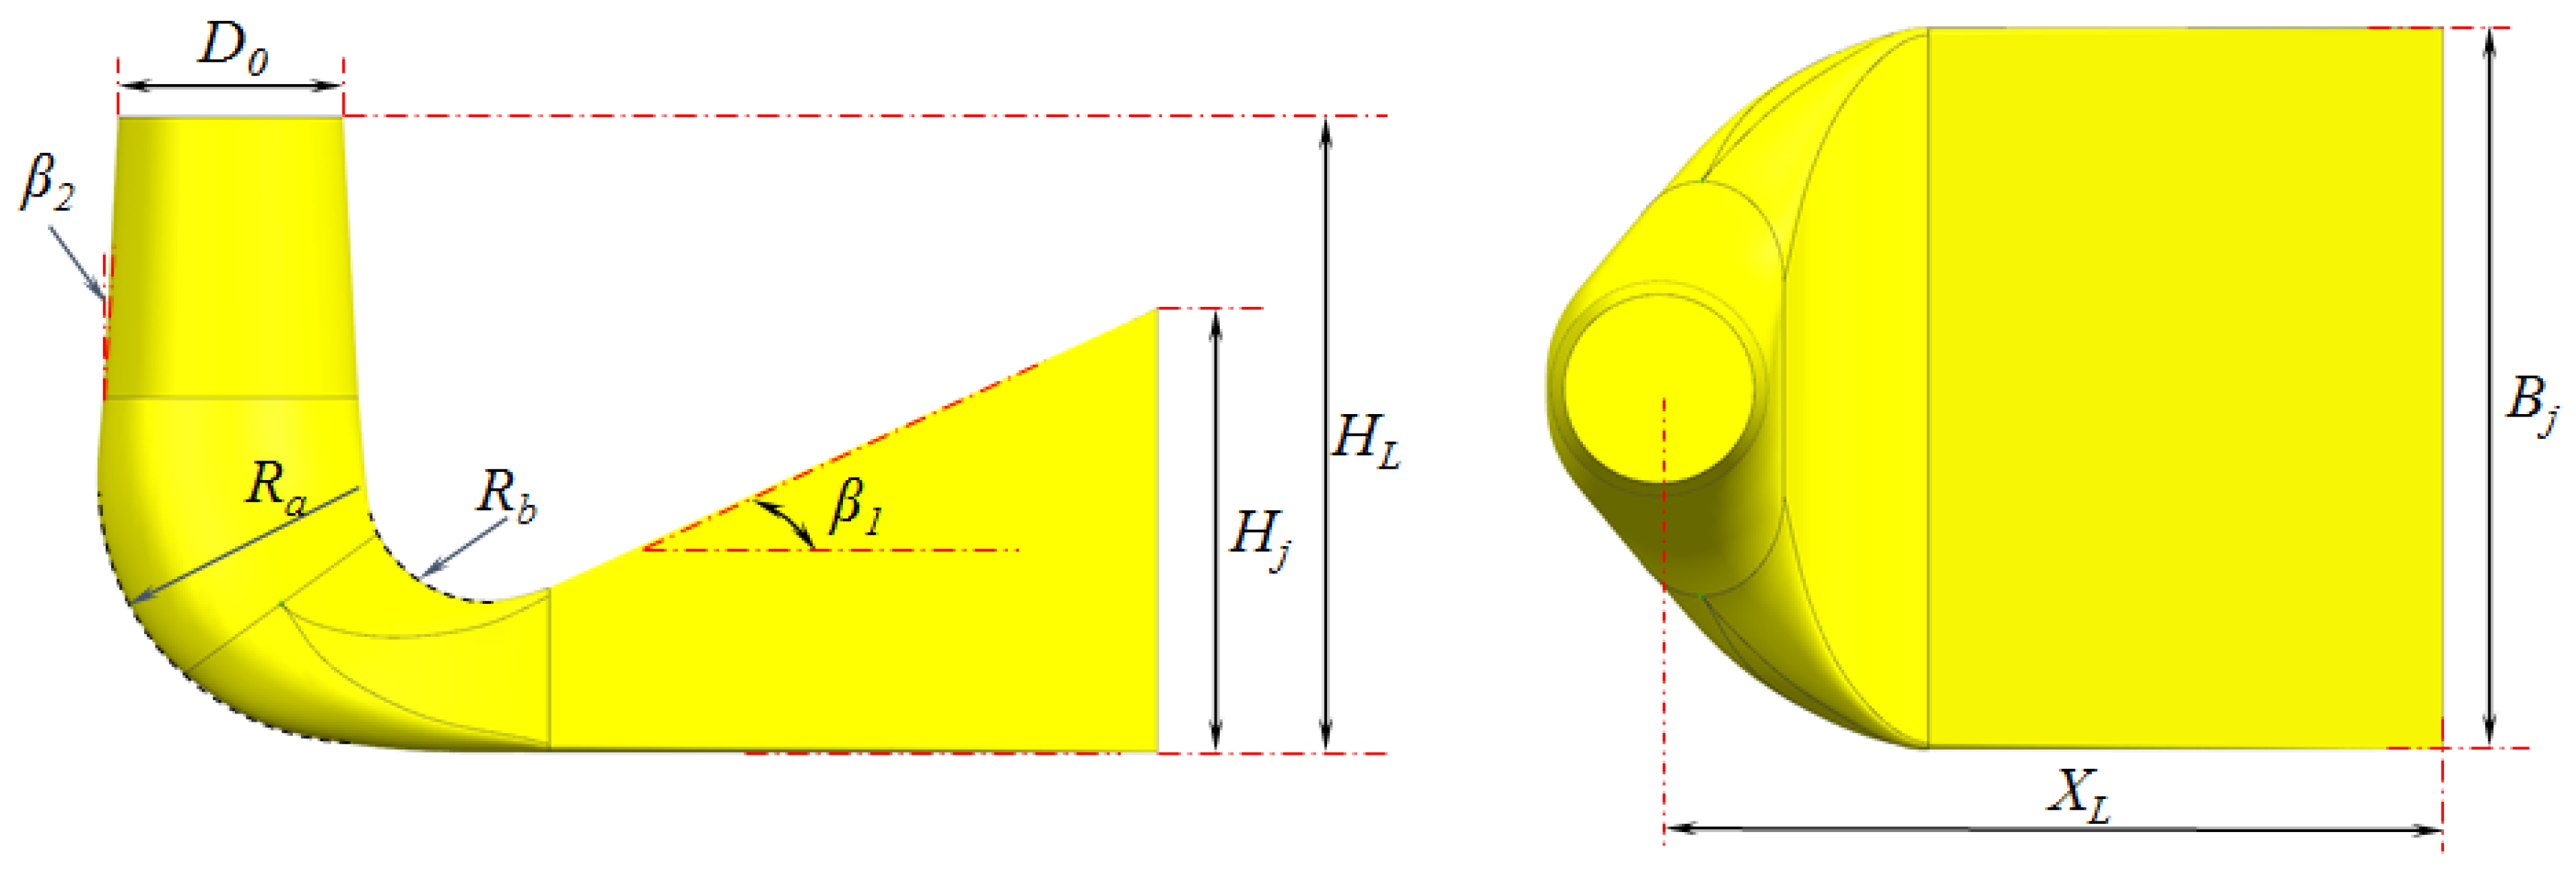
The geometric parameters make great contributions to the character of the elbow suction conduit, defined in Figure 9, in which D0 is the outlet diameter of the elbow suction conduit and is identical to the impeller inlet diameter Dls; Hj and Bj denote the inlet-section height and width, respectively; Ra and Rb are the radii of the outer and inner elbow contours; β1 is the inlet channel contraction angle (roof inclination), and β2 is the outlet taper angle. To facilitate comparison, the passage floor was maintained horizontal in all schemes, and both the floor elevation relative to the outlet section (HL) and the passage length (XL) were held constant.
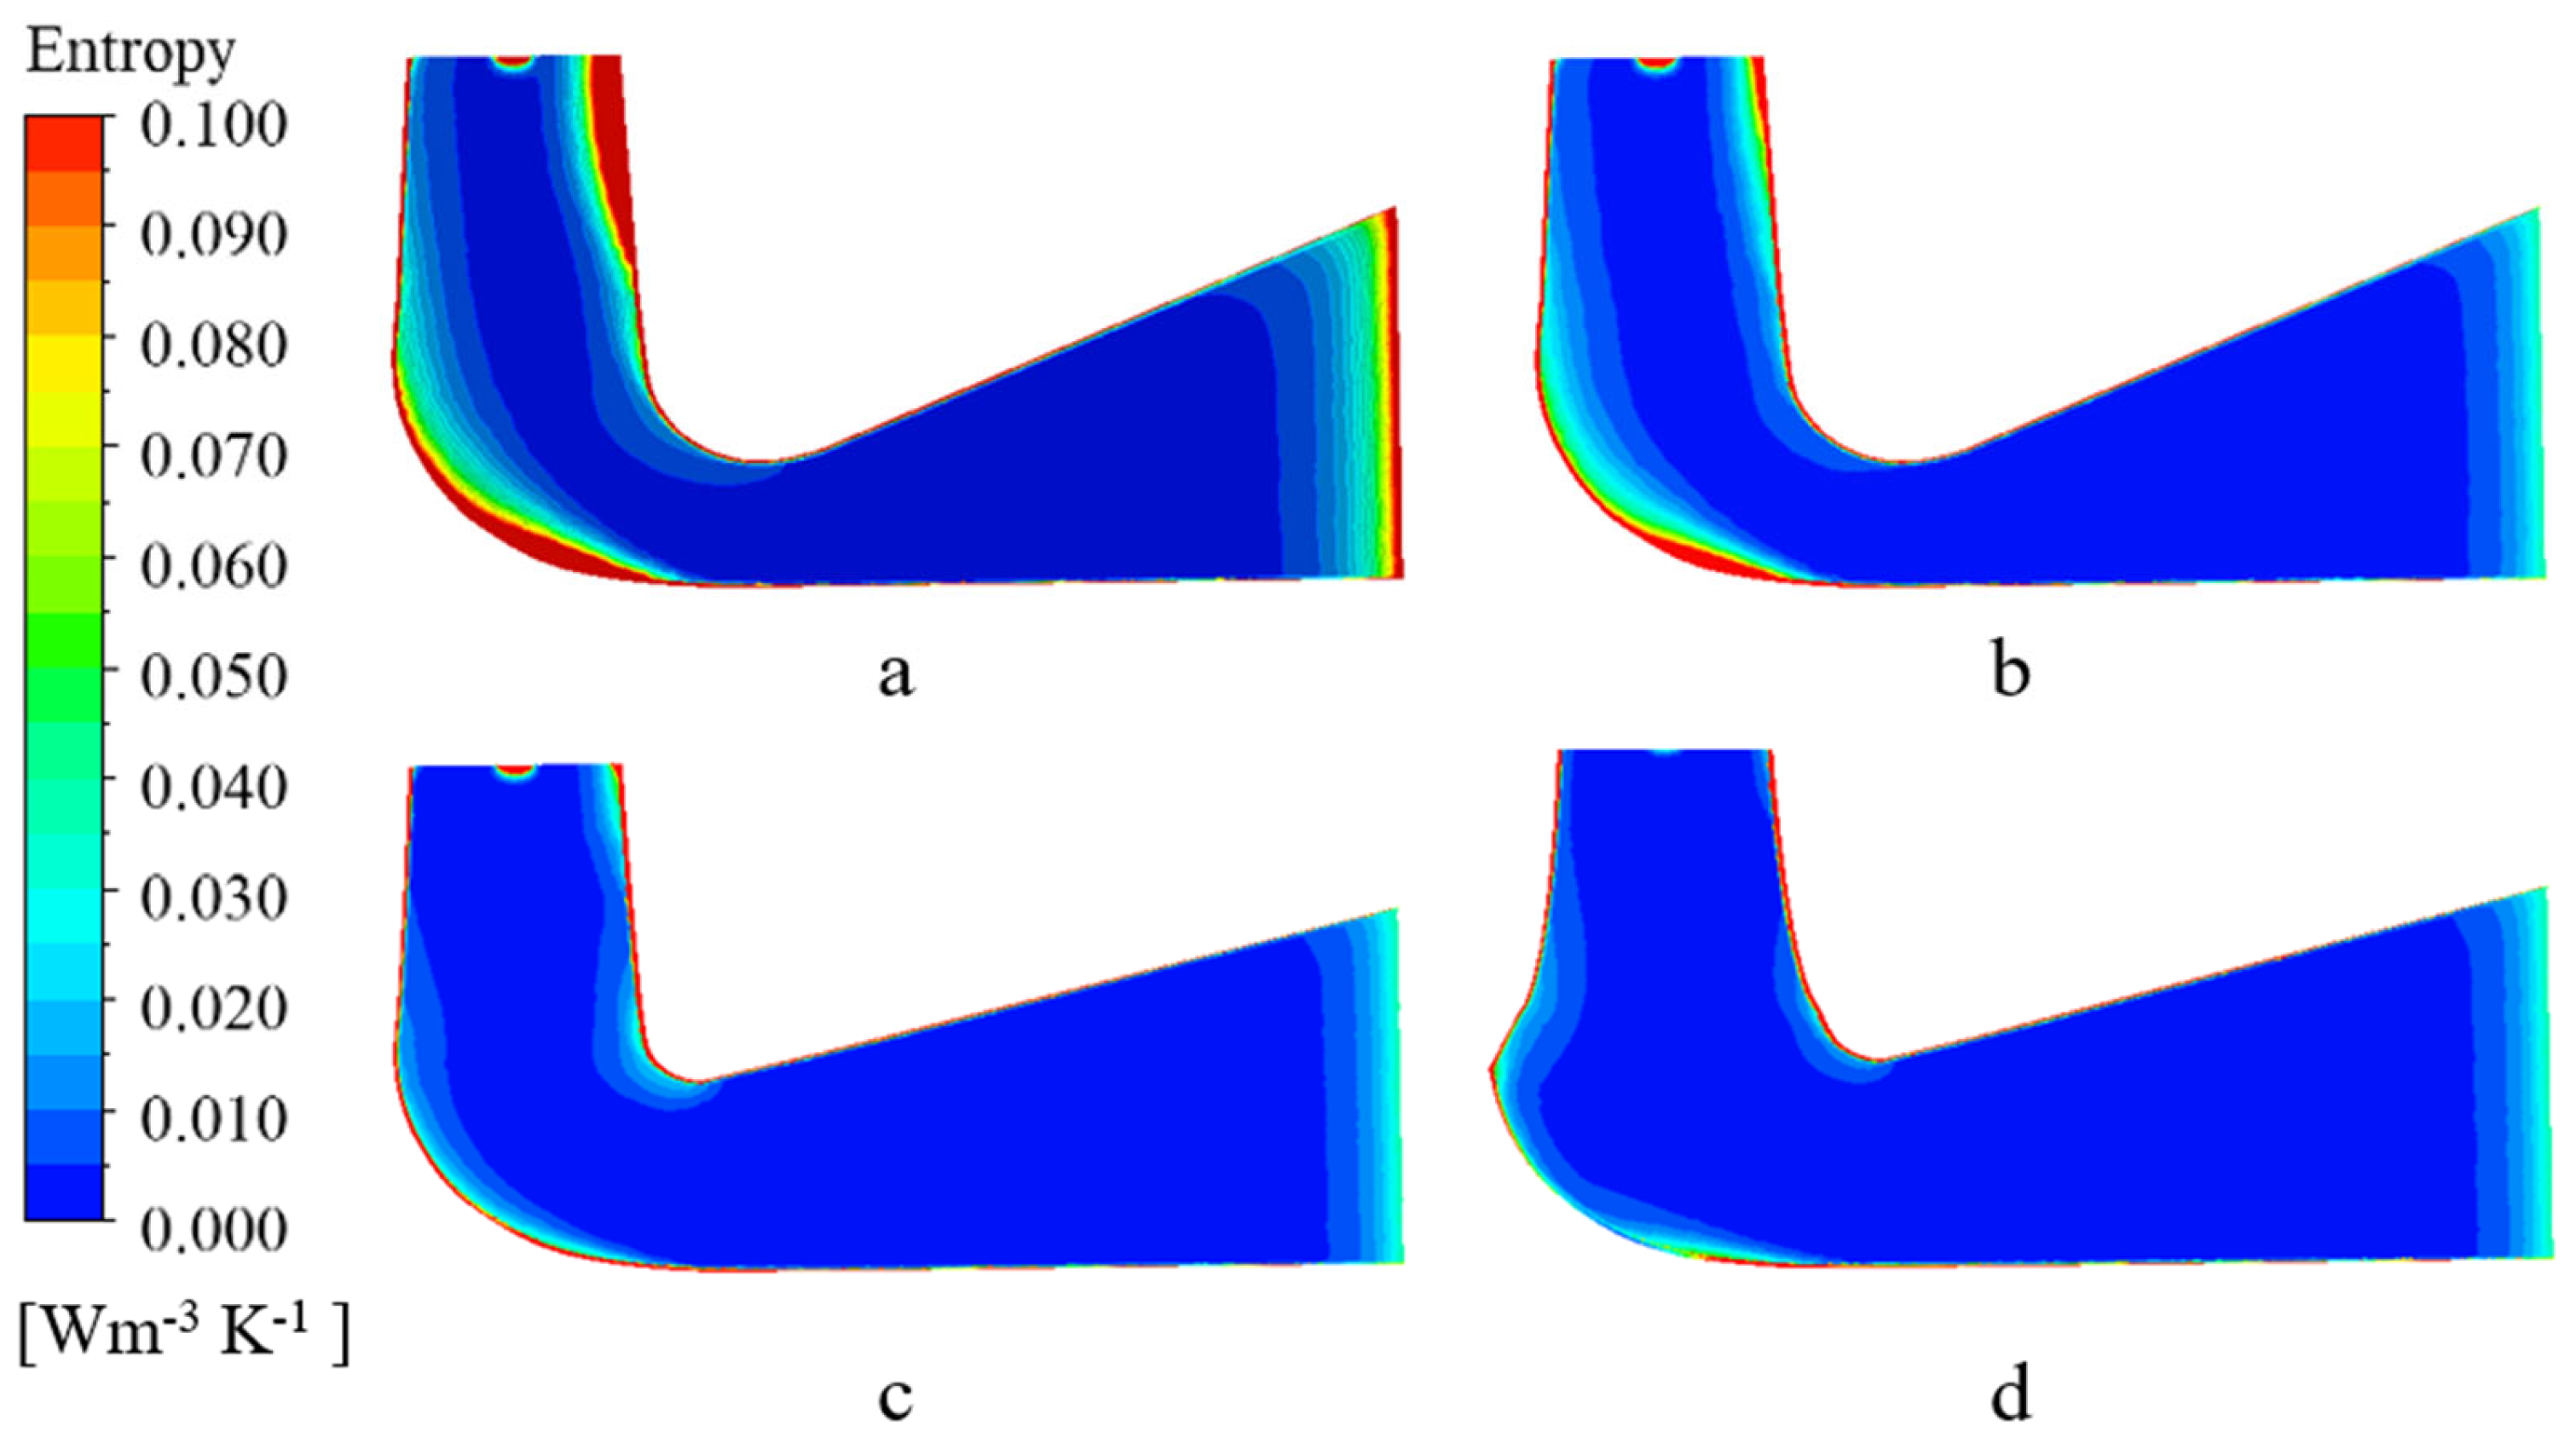
With the purpose of optimizing the elbow suction conduit character gradually, the key geometric parameters were modified in incremental steps. Four progressive modifications were implemented: Scheme (a) changed the inlet cross-section from elliptical to rectangular while simultaneously increasing the inlet height Hj. Scheme (b) enlarged inlet width Bj. Scheme (c) reduced roof inclination β1 as well as inner bend radius Rb. Scheme (d) increased the outlet taper angle β2.
Figure 10 presents the entropy generation fields on the meridional plane for each variant. Compared with the original elbow suction conduit, schemes (a) to (d) all exhibit a marked reduction in global entropy generation. Progressing from scheme (a) to (d), the energy dissipation at the four high FED locations illustrated in 3.2 decreases monotonically.
Table 4 summarizes the geometric variations in each scheme together with the equivalent head losses derived from turbulent fluctuation entropy dissipation and wall entropy generation at the rated operating point.
The results reveal that wall-induced losses dominate the overall energy dissipation for all the schemes within the elbow suction conduit. Systematically enlarging the inlet width and height, while reducing the pre-bend contraction angle, increases the inlet area, contributing to reducing the flow velocity and attenuating impingement of the incoming flow onto the bend, thereby diminishing wall-induced and turbulent fluctuation caused losses. In addition, expanding the outlet cone angle from 3° to 6° intensifies the terminal contraction, enhancing flow stability at the conduit exit.

4.2. Flow Characteristics Analysis

To quantitatively evaluate the optimization effects of the elbow suction conduit, comparative analyses were conducted in terms of head loss, outlet flow angle, velocity uniformity, and turbulence intensity for detailed comparison.

4.2.1. Hydraulic Loss

The loss of the elbow suction conduit obtained from pressure drop method (PDM) is shown by Equation (19).
Δ h = E i n E o u t
where Ein represents the total pressure head at the conduit inlet, and Eout denotes the total pressure head at the conduit outlet. As mentioned before, the head loss can also be expressed in terms of the total entropy generation as Equation (18).
The hydraulic losses of the four schemes elbow suction conduit were calculated with both of the two methods and are subsequently compiled and compared in Table 5 and Figure 11.
As illustrated, all optimized schemes (a–d) demonstrate reduced head losses compared to the baseline configuration under rated conditions, with progressively decreasing losses from scheme (a) to (d). Both pressure-based and entropy production methods show converging results as losses diminish, indicating improved consistency between the two calculation approaches at lower dissipation levels.
To research the optimization beyond the rated point, the head losses induced by turbulent dissipation and wall effects over the entire pump operating range were evaluated for schemes (a) to (d).
The results are shown in Figure 12a,b. At any given flow rate, the losses decrease progressively from scheme (a) to scheme (d), with scheme (d) exhibiting the smallest loss values.

4.2.2. Velocity Non-Uniform Coefficient of Outlet

The velocity non-uniformity coefficient quantifies the spatial uniformity of the out-flow; a lower value denotes better flow velocity distribution and uniformity. It is defined as (20)
ξ = 1 Q A ( u U ¯ ) 2 d A = 1 Q A | u U ¯ | d A
where A denotes the cross-sectional area at the selected outlet plane of the elbow suction conduit, u signifies the node axial velocity on that plane, and U ¯ represents the area-averaged axial velocity over the reference plane [5].
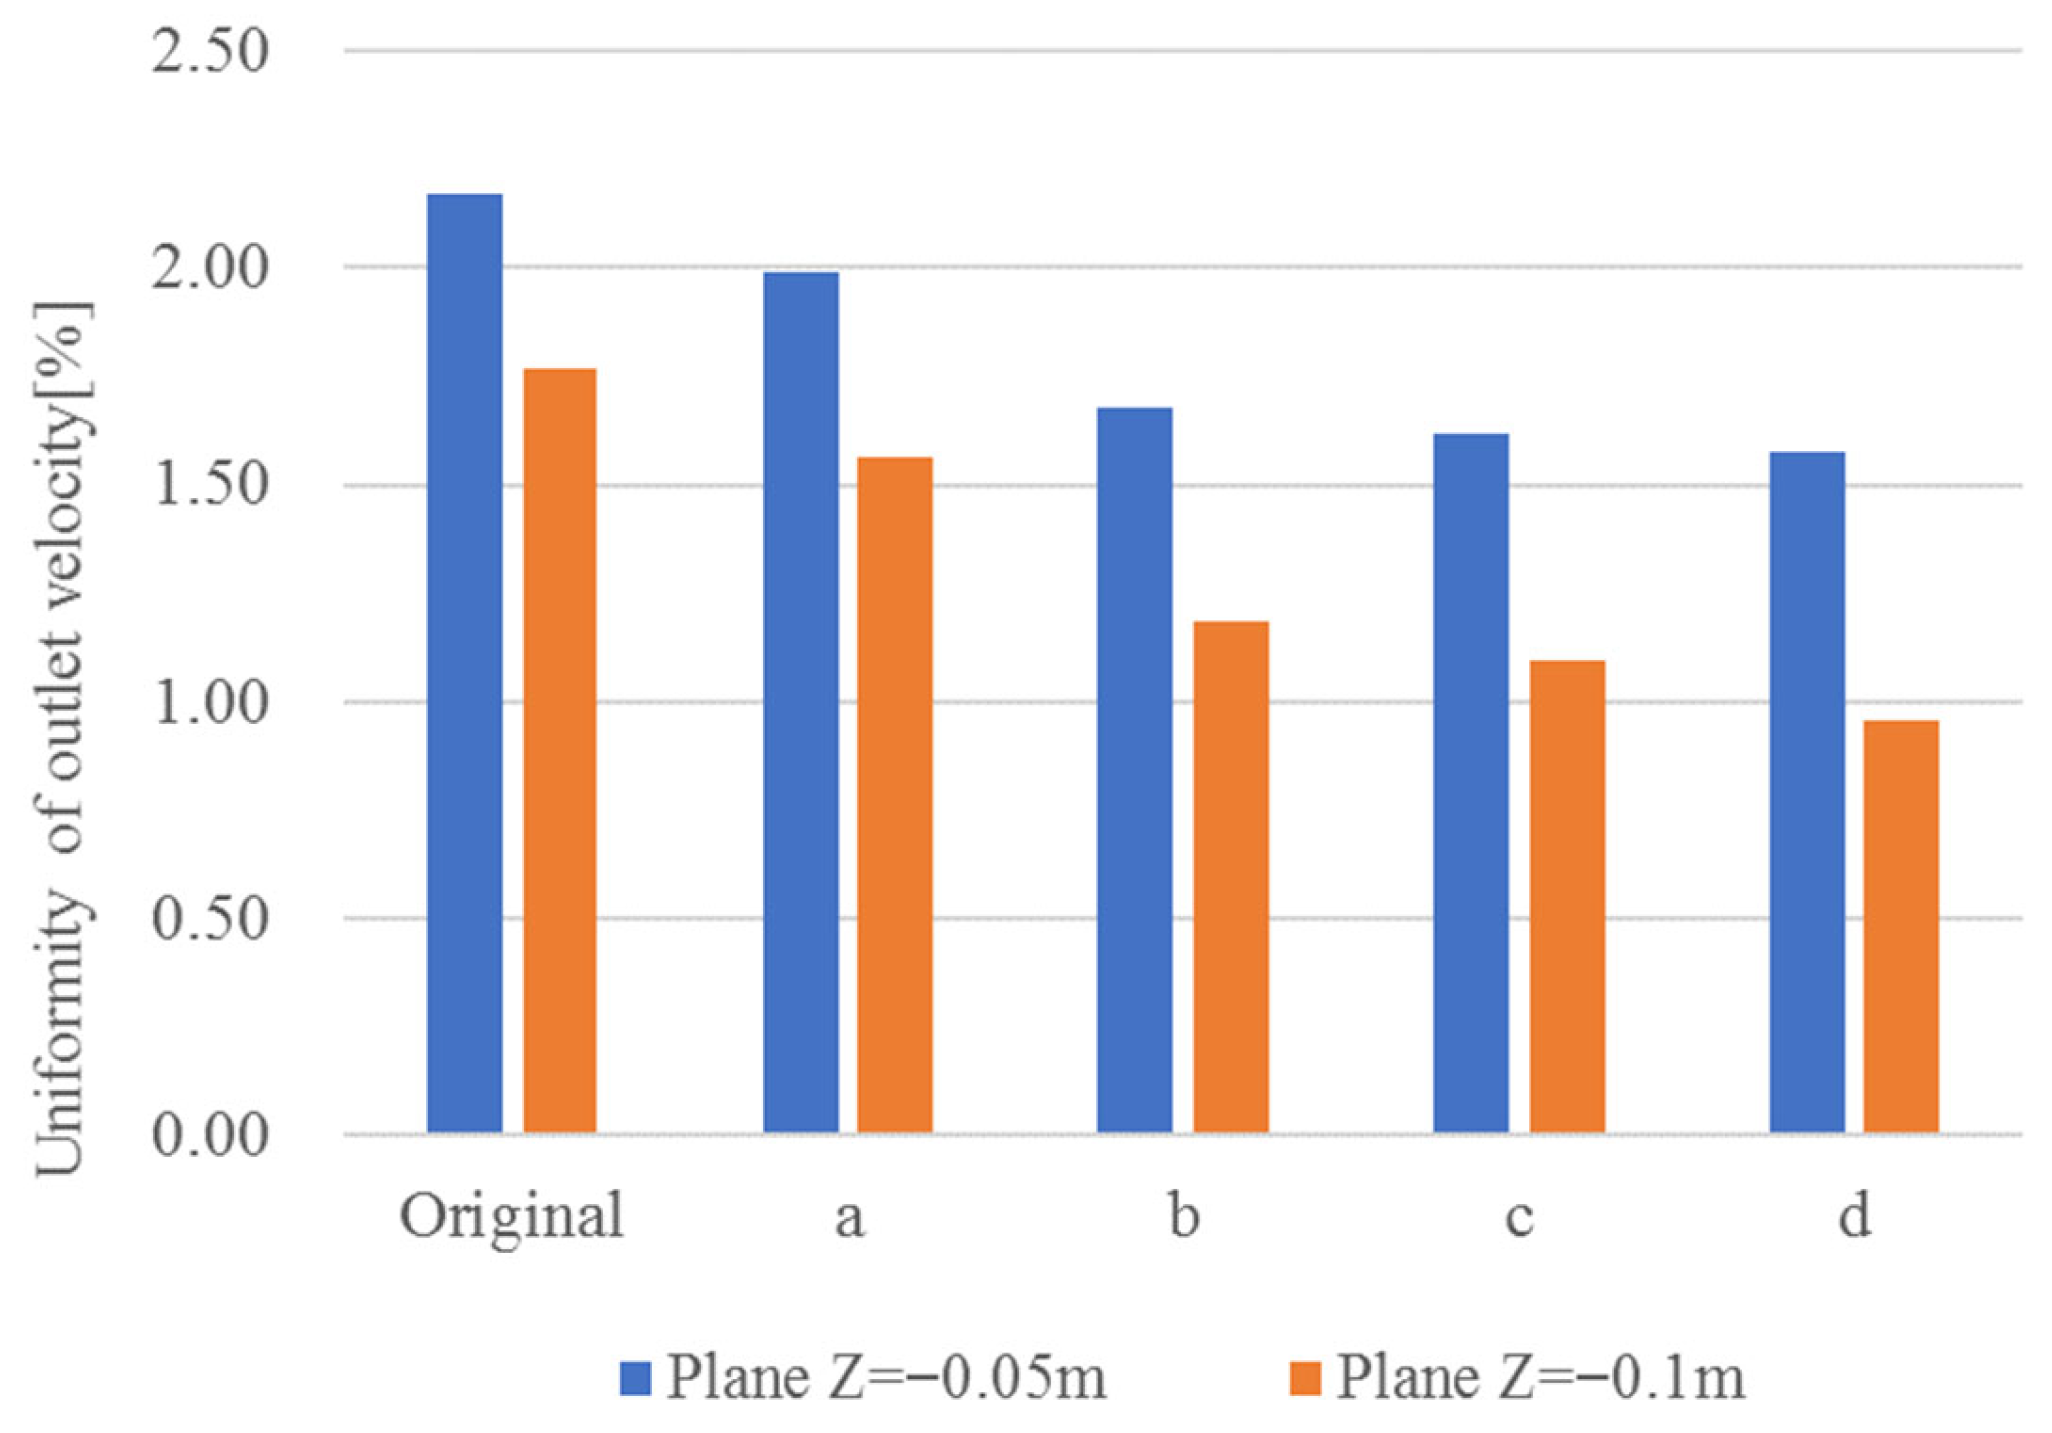
Considering the rotational effects near the impeller inlet, two reference planes were established at 0.05 m and 0.1 m upstream of the outlet section (located at z = −0.05 m and z = −0.10 m, respectively). To exclude the influence of the boundary layer, only nodes within 95% of the local diameter are considered in the calculation.
The outlet velocity non-uniformity coefficients of all conduit schemes at the design point are shown in Figure 13. Compared with the plane at z = −0.05 m, all schemes exhibit improved uniformity at z = −0.10 m. Across both reference planes the non-uniformity decreases monotonically from scheme (a) to (d), indicating progressively more uniform magnitude and direction of the velocity vectors and hence superior inflow conditions for the impeller were obtained.
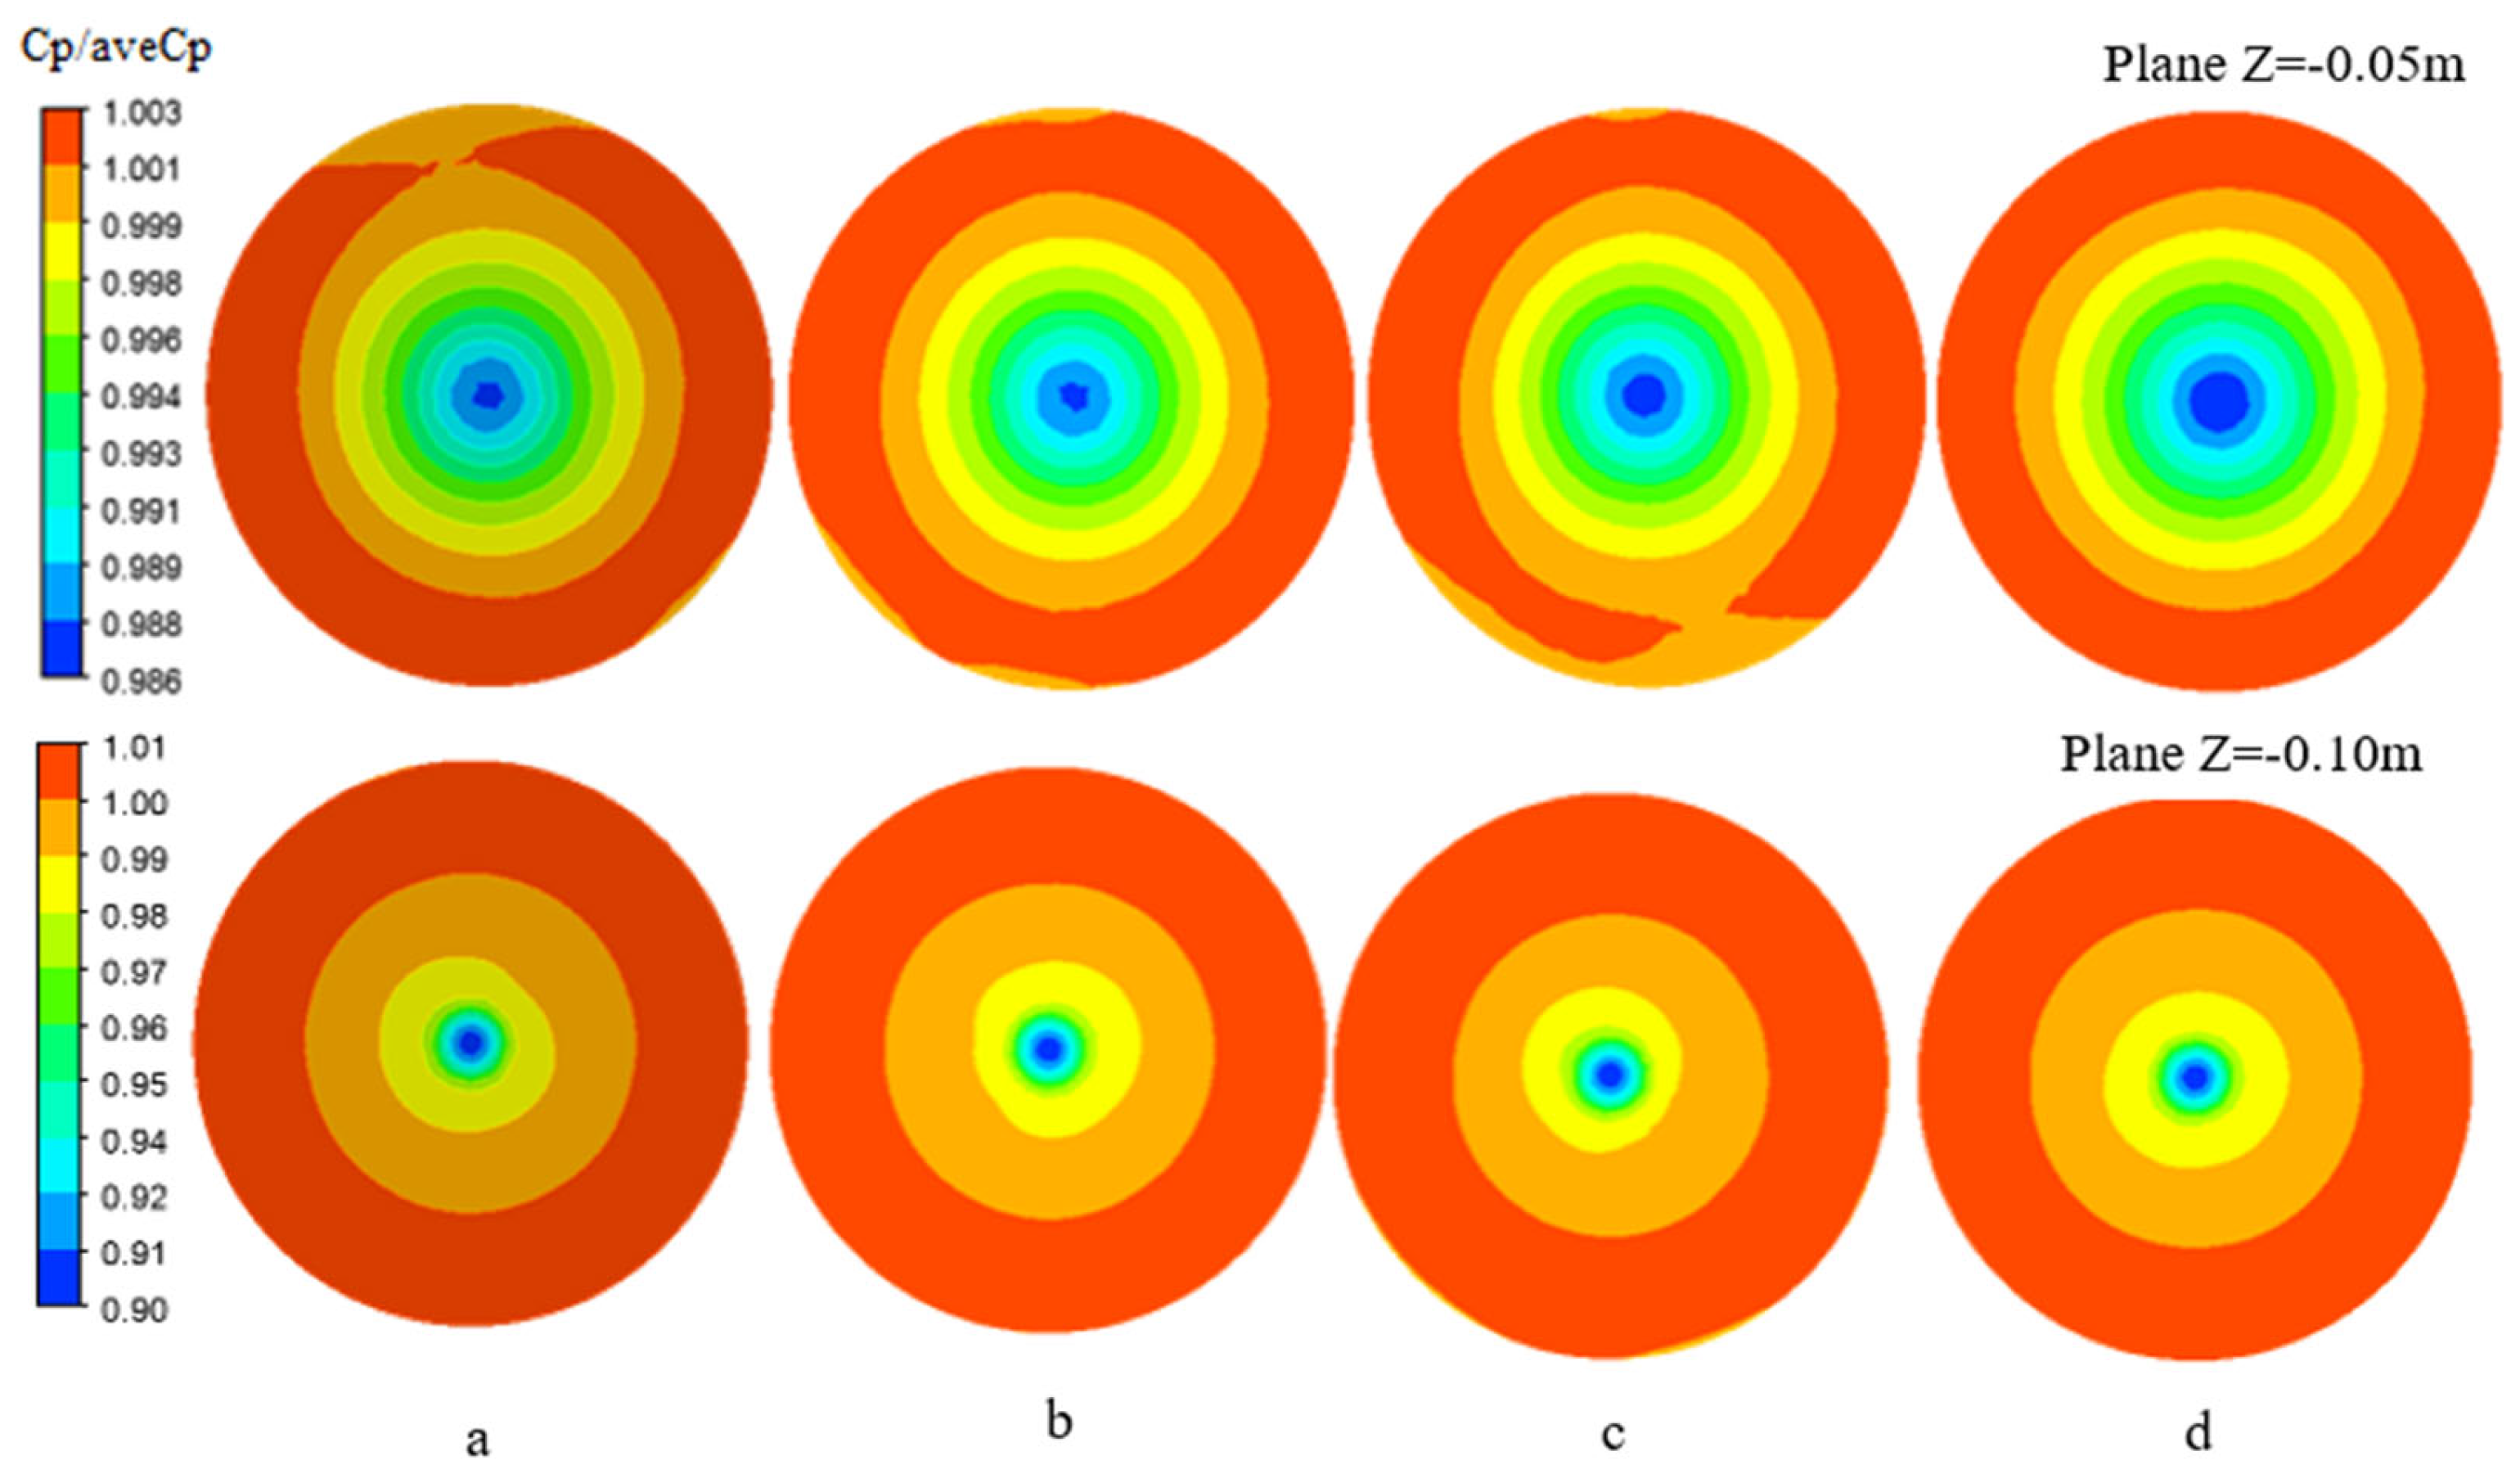
Relative-pressure contours on the two reference planes across the conduit scheme are shown in Figure 14, in which aveCp denotes the plane-averaged pressure. In every scheme the relative pressure increases radially from the center to the periphery. The low-pressure core occupies a small area, whereas the high-pressure outer zone is dominant. From scheme (a) to (d) the magnitude of the high-pressure zone decreases and the iso-pressure lines become increasingly circular, demonstrating a smoother pressure distribution approaching the mean value.

4.2.3. Average Flow Angle of Outlet

For vertical inflow, the impeller inlet circulation is zero, allowing the intrinsic characteristics of the impeller to be isolated. The mean out-flow angle of the elbow suction conduit is calculated from Equation (21).
θ p = 1 A A ( 90 arctan ( u t i u a i ) ) d A
where uti and uai are the radial and axial velocity components of node on the outlet plane, respectively.
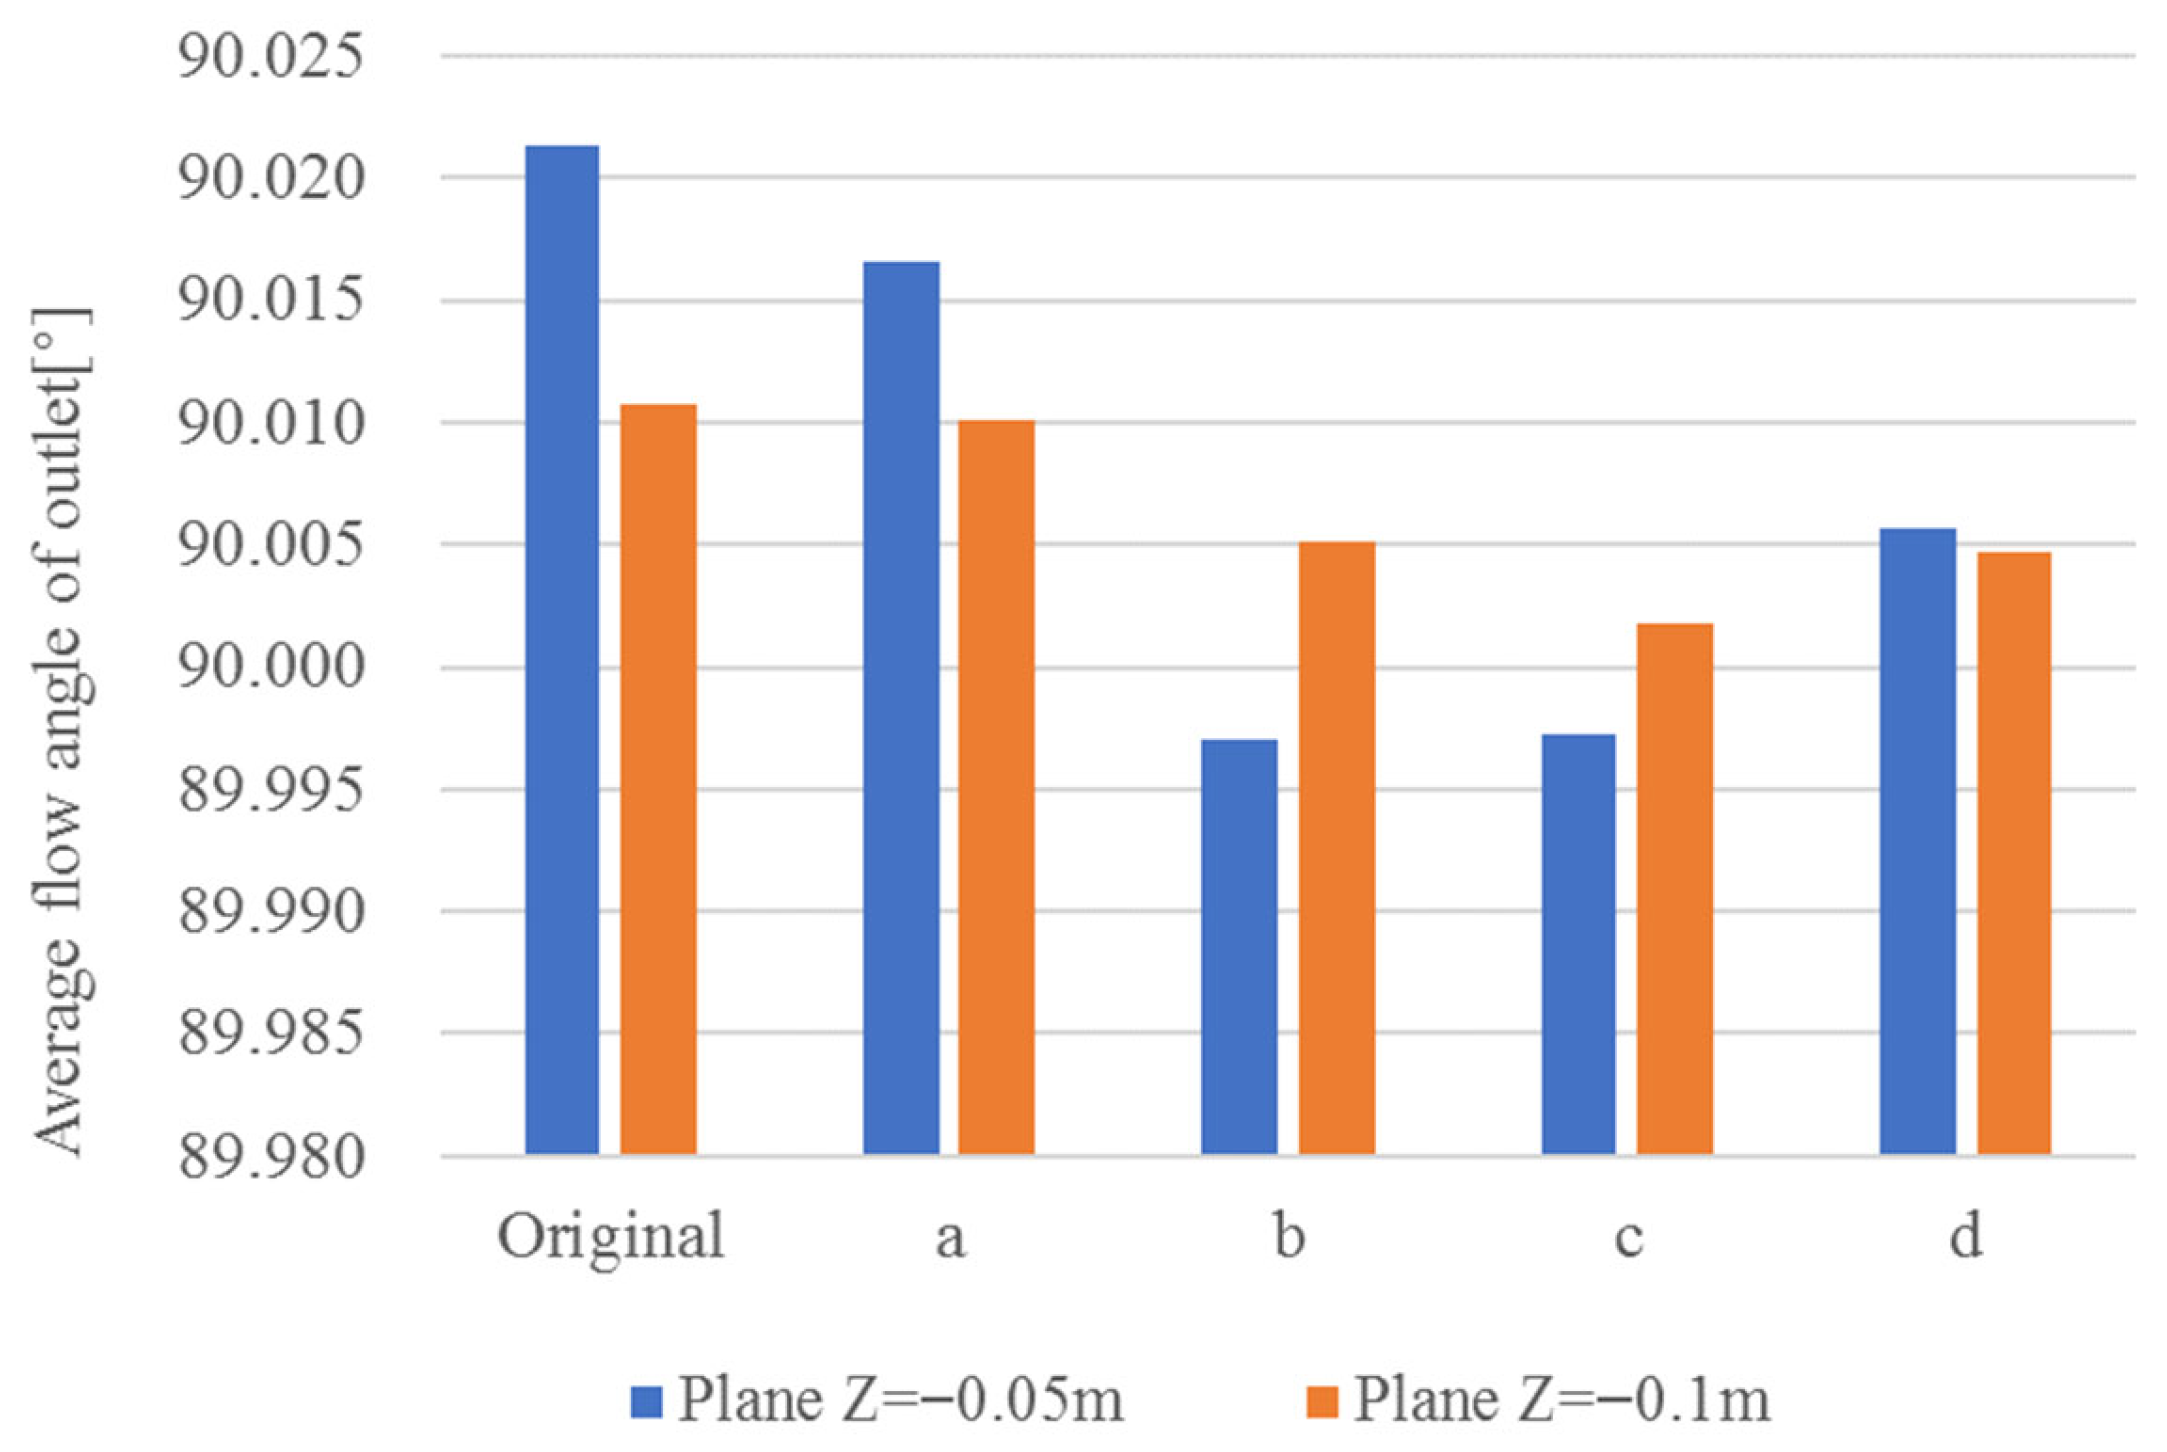
Owing to the sufficiently long straight diffuser downstream of the elbow suction conduit, the mean out-flow angles of all schemes are near 90° (±0.02°), showing minimal variation between schemes at both measurement planes (z = −0.1 m and −0.05 m), as illustrated in Figure 15. Thus, differences among the schemes in terms of average out-flow angle are negligible.

4.2.4. Turbulence Intensity at Outlet

Turbulence intensity I quantifies the temporal instability of the flow and is defined [33] as Equation (22) to (24):
I = u U
u = 1 3 ( u x 2 + u y 2 + u z 2 ) = 2 3 k
U = U ¯ x 2 + U ¯ y 2 + U ¯ z 2
where the symbols ux, uy, and uz denote the fluctuating velocity components along the mutually orthogonal x, y, and z directions, respectively. The spatially averaged root-mean-square (RMS) of the fluctuating velocities reflect the overall intensity of the three-dimensional turbulent motion. U signifies the magnitude of the mean flow velocity vector.
Consequently, the turbulence intensity can be presented as follows:
I = 2 k / 3 / U ¯
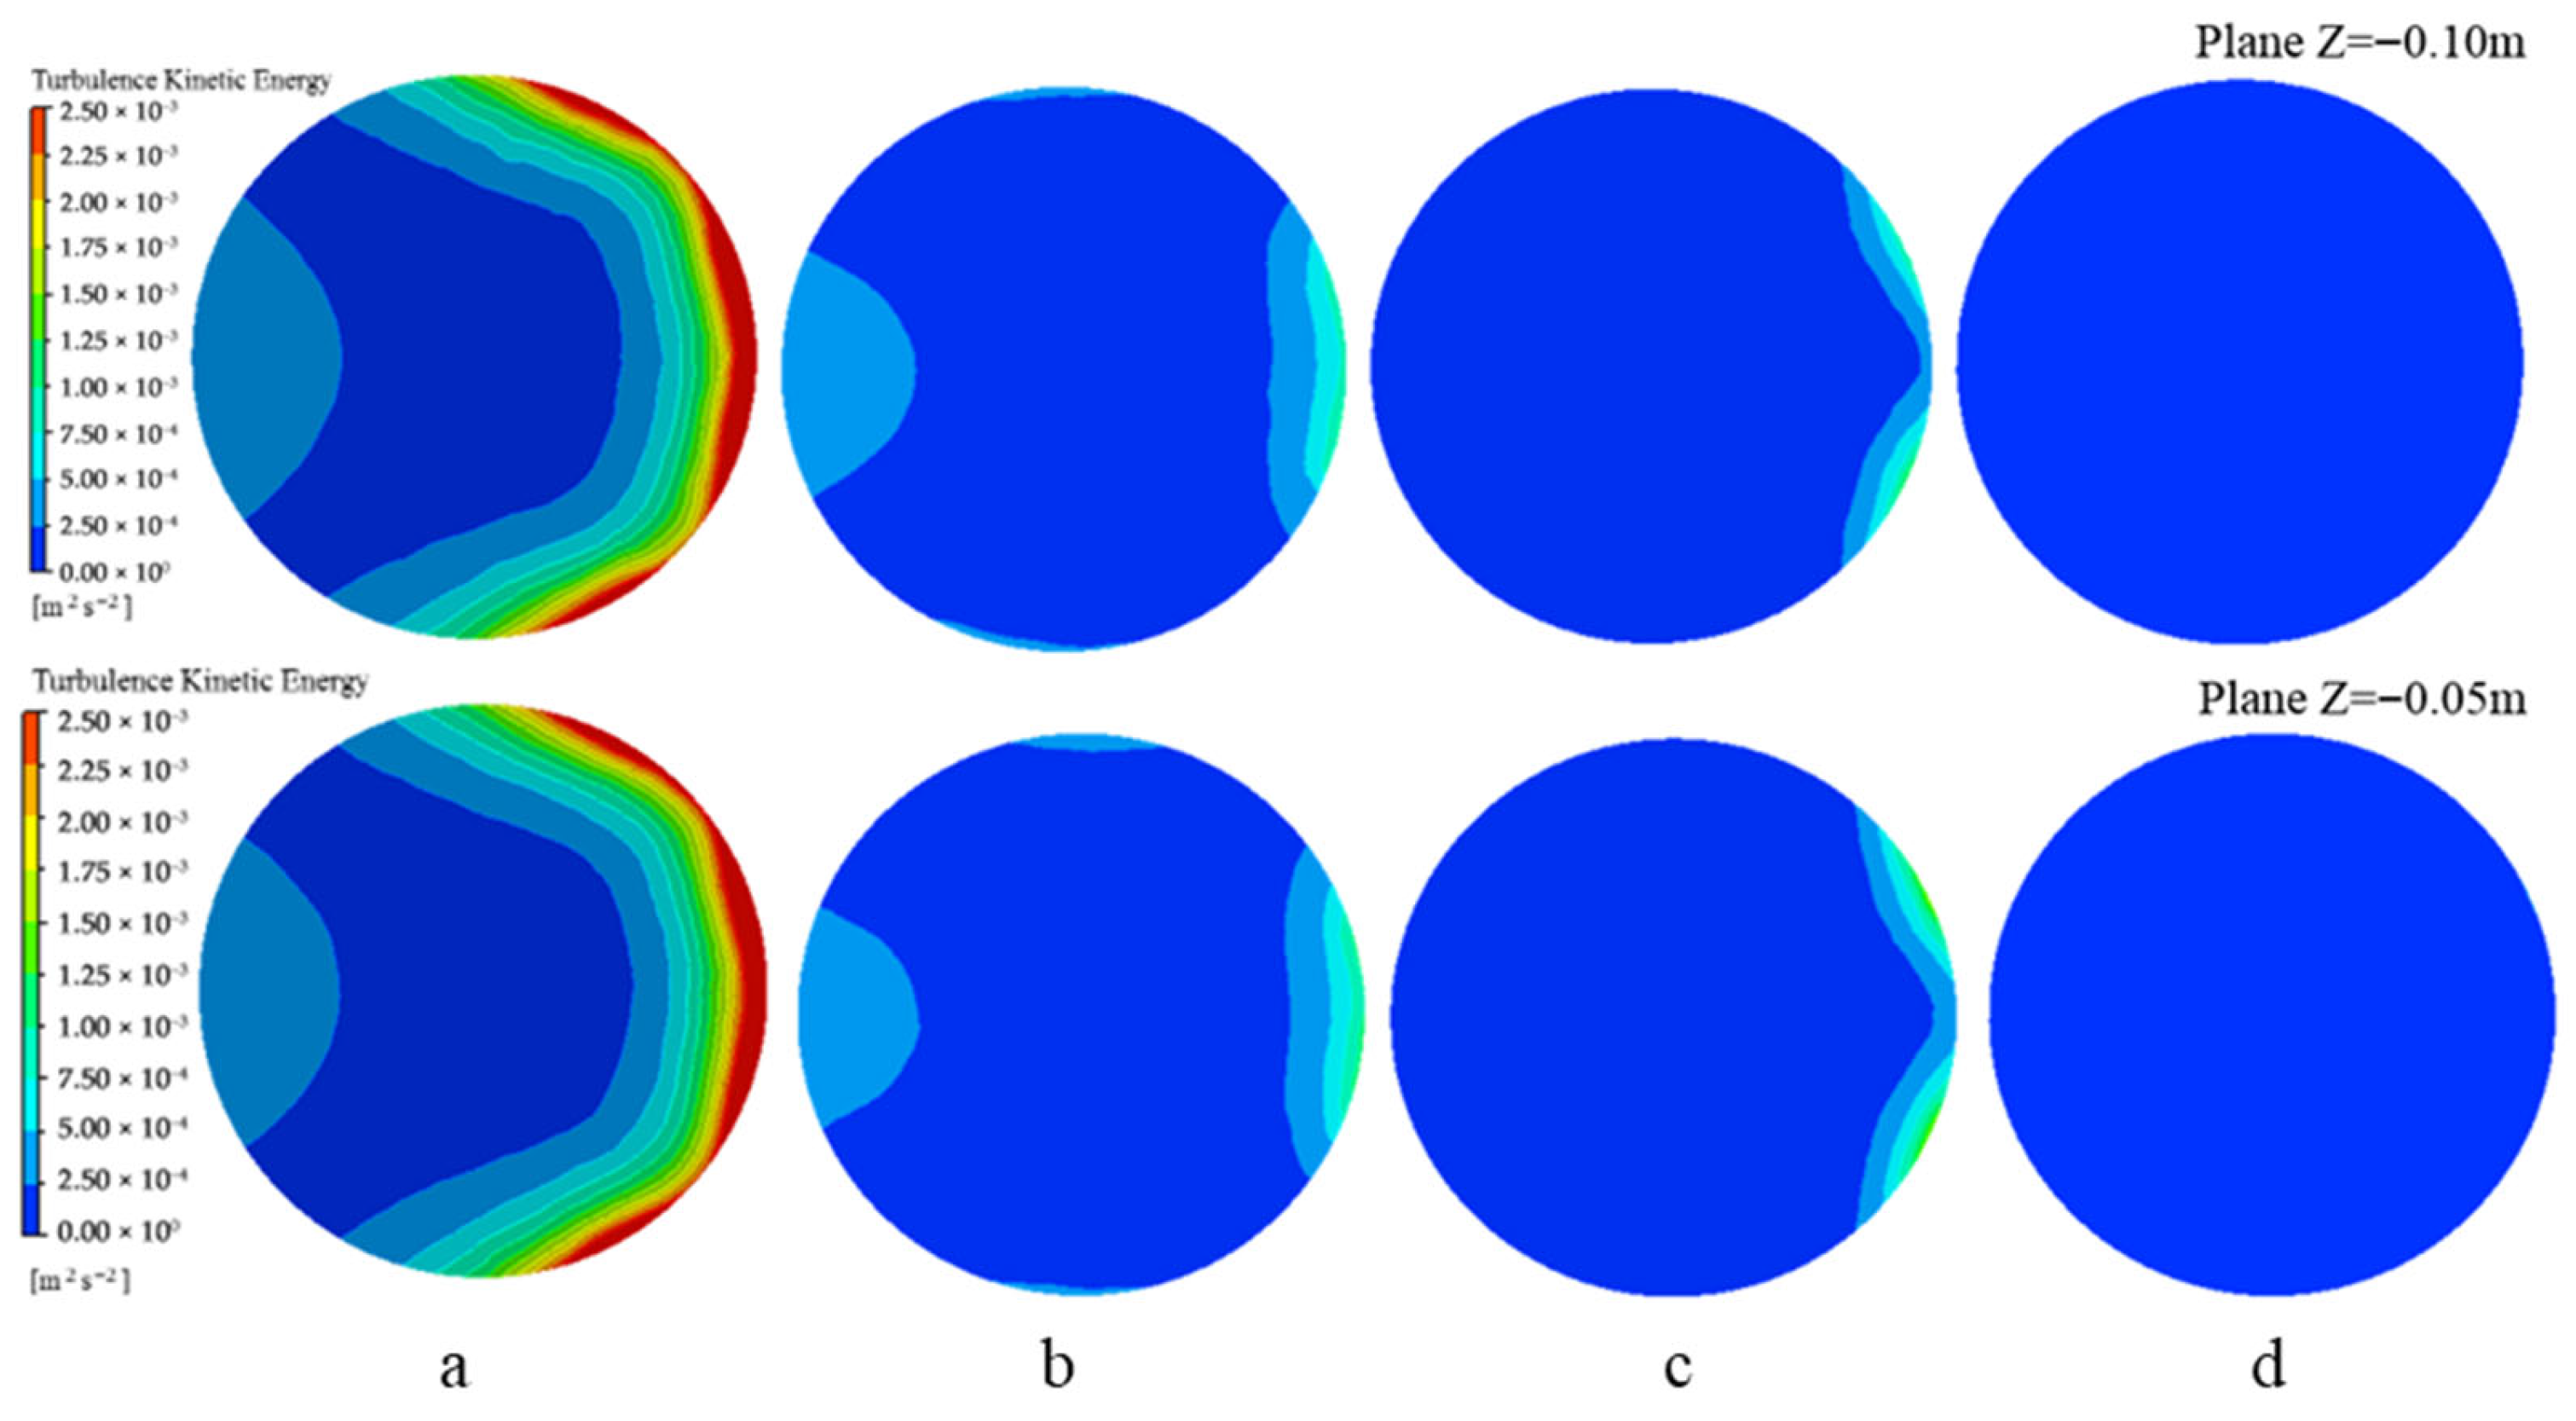
Turbulence intensity of outlet plane across conduit scheme (a) to scheme (d) is listed in Table 6. Contours of turbulence kinetic energy are shown in Figure 16. As demonstrated, the turbulence intensity at the outlet section decreases systematically from scheme (a) to scheme (d), indicating progressively improved temporal uniformity and flow stability of the out-flow across all investigated schemes.
Analysis of the internal flow in the elbow suction conduit demonstrates that the optimization significantly enhances the uniformity of velocity distribution and reduces turbulence intensity, while exerting minimal influence on the average flow direction. The principal advantage of this improvement lies in the mitigation of unsteady flow structures upstream of the impeller.

4.2.5. Performance Comparison

Full-passage numerical simulation was conducted for scheme (d), that was the optimal configuration identified from previous analyses and compared against the baseline design. Characteristic quantitative comparison of the mixed flow pump on the rated point is summarized in Table 7:
Under the design operating condition, the head coefficient is increased by approximately 0.45%, the efficiency is improved by 0.34%, and the inception cavitation coefficient is reduced by about 3.6%. Similarly, in Venturi-type devices, combined suppression strategies have been shown to reduce the cavitation coefficient by up to 10% [7], supporting the optimization potential of this study.
Simulated head performance, efficiency and incipient cavitation characteristics over the entire operating range are compared in Figure 17.
Thanks to the loss reduction in the elbow suction conduit and the improved inflow uniformity, matching of the flow between adjacent components is markedly enhanced. When scheme (d) is adopted, the overall efficiency of the mixed-flow pump unit is elevated across a broad flow range; in particular, the efficiency of the best efficiency point rose by 0.23%.
Under high-flow-rate conditions, the elbow suction conduit (d) exerts strong flow-guiding effects, the incipient cavitation coefficient remains virtually the same before and after optimization as a result. In contrast, for the low-flow-rate points to the left of the design flow, scheme (d) yields a lower incipient cavitation coefficient. At the operating point with a flow coefficient of 0.8, σi is reduced from 2.73 to 2.58. This improvement is attributed to the superior flow-control capability of the optimized elbow suction conduit geometry, which ensures a more uniform entry of the flow into the impeller over a wider range of flow rates.

5. Conclusions

Entropy-generation analysis was employed to quantify and localize energy dissipation within the elbow suction conduit of a mixed-flow pump (nq ≈ 433). The following principal findings are drawn:
(1)
Four dominant loss loci were identified: (i) the inlet contraction region, (ii) the entire wetted surface of the elbow suction conduit, (iii) the outer curvature of the 90° bend, and (iv) the inner conical surface. Among these, wall-induced entropy production accounts for the largest share of the overall irreversible loss.
(2)
A stepwise geometric optimization sequence, guided by the spatial–temporal distribution of local entropy generation, demonstrates that: (i) enlargement of the inlet height and width attenuates impingement on the bend and suppresses secondary kinetic energy; (ii) a reduction in the pre-bend contraction angle mitigates adverse pressure gradients and flow separation; (iii) an increase in the outlet cone angle from 3° to 6° intensifies the terminal contraction, enhancing velocity uniformity and flow stability at the conduit exit, which is also the at the impeller entry plane.
(3)
Besides the direct reduction in hydraulic losses, the optimization aimed at minimizing energy dissipation also exerts a positive influence on the uniformity of the velocity distribution and on the suppression of turbulent fluctuations at the outlet of the elbow suction conduit. These improvements, in turn, yield a more uniform and stable entry of the fluid into the mixed flow pump impeller, ultimately enhancing both the overall efficiency and the high-efficiency operating range of the mixed flow pump while simultaneously lowering its incipient cavitation coefficient. The terminal configuration (Scheme d) delivered a reduction from 0.0387 m to 0.0214 m in conduit head loss, decreased the outlet velocity non-uniformity and showed a decline in the turbulence intensity relative to the baseline geometry. These hydraulic gains translate directly into a 0.34% elevation in pump efficiency at the design point and a 3.6% reduction in the incipient-cavitation coefficient σi. Improvements are preserved across the entire operating envelope.
The current study focuses on demonstrating the effectiveness of geometric optimizations, such as increasing inlet width and reducing the pre-bend contraction angle. Understanding the mechanisms behind these improvements is equally critical. Future work will aim to provide deeper mechanistic insights by integrating entropy generation contours with detailed flow analyses or adding advanced modal decomposition techniques like Dynamic Mode Decomposition [34] to make a quantitative assessment of how specific modifications suppress detached vortices or reduce turbulent kinetic energy dissipation. To further enhance the overall performance of the design, integration of multi-objective optimization algorithms (e.g., NSGA-II) with entropy generation analysis will be explored, targeting simultaneous improvements in efficiency, cavitation performance, and off-design stability, thereby providing more optimized designs for future engineering applications.
Complementing this design-oriented direction, high-resolution experimental techniques—such as X-ray PIV or ultrafast tomographic PIV—could be employed to visualize the transient dynamics within entropy generation hotspots, enabling real-time diagnosis and control of flow separation. These combined efforts aim to advance beyond conventional CFD-experiment validation toward more intelligent and adaptive hydraulic systems.

Author Contributions

Conceptualization, N.Y. and X.W. (Xianzhu Wei); methodology, X.W. (Xianzhu Wei); software, X.W. (Xiaohang Wang); validation, N.Y., X.W. (Xianzhu Wei) and X.W. (Xiaohang Wang); formal analysis, G.F.; investigation, R.Z.; resources, X.W. (Xiaohang Wang); data curation, N.Y.; writing—original draft preparation, N.Y.; writing—review and editing, X.W. (Xianzhu Wei); visualization, X.W. (Xiaohang Wang); supervision, X.W. (Xiaohang Wang); project administration, G.F.; funding acquisition, R.Z. All authors have read and agreed to the published version of the manuscript.

Funding

This research received no external funding.

Data Availability Statement

The original contributions presented in this study are included in the article. Further inquiries can be directed to the corresponding author.

Conflicts of Interest

Authors Na Yan, Xianzhu Wei, Xiaohang Wang, Guolong Fu, and Rui Zhang were employed by the Harbin Research Institute of Large Electric Machinery Company Limited, Harbin Power National Hydraulic Power Equipment Engineering Technology Research Center and Harbin Electric Machinery Company Limited. The remaining authors declare that the research was conducted in the absence of any commercial or financial relationships that could be construed as a potential conflict of interest.

References

  1. Zhu, D.; Xiao, R.F.; Yao, Z.F.; Yang, W.; Liu, W.C. Optimization design for reducing the axial force of a vanned mixed-flow pump. Eng. Appl. Comput. Fluid Mech. 2020, 14, 882–896. [Google Scholar]
  2. Wang, M.C.; Li, Y.J.; Yuan, J.P.; Yuan, S.Q. Effects of different vortex designs on optimization results of mixed-flow pump. Eng. Appl. Comput. Fluid Mech. 2022, 16, 36–57. [Google Scholar] [CrossRef]
  3. Osman, F.K.; Zhang, J.; Lai, T.; Kwarteng, A.A. Effects of Turbulence Models on Flow Characteristics of a Vertical Fire Pump. J. Appl. Fluid Mech. 2022, 15, 1661–1674. [Google Scholar] [CrossRef]
  4. Guan, X.F. Theory and Design of Modern Pump; China Space Navigation Press: Beijing, China, 2011; pp. 347–351. [Google Scholar]
  5. Zhang, G.; Zhi, Y.F.; Zhu, R.S.; Lin, B.; Fu, Q. Research on Optimum Design of Inlet Channel of Seawater Circulating Pump in Nuclear Power Plant. J. Xihua Univ. (Nat. Sci. Ed.) 2024, 43, 80–88. [Google Scholar]
  6. Zhang, H.Y.; Meng, F.; Cao, L.; Li, Y.J.; Wang, X.K. The Influence of a Pumping Chamber on Hydraulic Losses in a Mixed-Flow Pump. Process 2022, 10, 407. [Google Scholar] [CrossRef]
  7. Ge, M.M.; Sun, C.Y.; Zhang, G.J.; Coutier-Delgosha, O.; Fan, D.X. Combined suppression effects on hydrodynamic cavitation performance in Venturi-type reactor for process intensification. Ultrason. Sonochem. 2022, 86, 106035. [Google Scholar] [CrossRef] [PubMed]
  8. Bing, H.; Cao, S.L. Experimental Study of the Influence of Flow Passage Subtle Variation on Mixed-flow Pump Performance. Chin. J. Mech. Eng. 2014, 27, 615–621. [Google Scholar] [CrossRef]
  9. Lipej, A. Flow conditions influence on the instability of a pump characteristic. J. Appl. Fluid Mech. 2021, 14, 1249–1255. [Google Scholar] [CrossRef]
  10. Tian, Y.T.; Jing, Q.X.; Peng, K.; Wan, C.; Luo, S.; Chen, H.; Fu, X.Q. CFD Optimization Study of Intake Channel of Pumping Station. Agric. Eng. 2024, 14, 92–99. [Google Scholar]
  11. Zhang, L.B.; Luo, Y.; Shen, Z.H.; Ye, X.X.; Li, Z.H. Optimization Design of the Elbow Inlet Channel of a Pipeline Pump Based on the SCSO-BP Neural Network. Water 2024, 16, 74. [Google Scholar] [CrossRef]
  12. Yousaf, B.; Manzoor, T.; Qaisrani, M.A.; Khan, I.; Sahar, M.S.U.; Tahir, W. Investigation of influence of elbow on pump inlet flow behaviour in cavitating flow. Eng. Fail. Anal. 2022, 137, 106420. [Google Scholar] [CrossRef]
  13. Cheng, L.; Liu, C.; Xue, J.; Zhou, J.R.; Tang, F.P. Hydraulic performance study on the flow of elbow-inlet passage by numerical simulation of CFD. J. Basic Sci. Eng. 2008, 16, 891–899. [Google Scholar]
  14. Xin, H.R.; Liu, J.; Dong, L.; Tang, Z.J.; Xu, L.; Lu, G.L. Discussion of feasibility of standardization for the elbow inlet conduit in large and medium pumping station. S. N. Water Transf. Water Sci. Technol. 2014, 12, 210–213. [Google Scholar]
  15. Shi, W.; Li, Y.J.; Deng, D.S.; Yuan, S.Q.; Liu, J. Optimum hydraulic design and model test for elbow inlet passage. J. Fluid Mach. 2009, 37, 19–22. [Google Scholar]
  16. Huang, J.W.; Liu, C.; Yan, T.X.; Zha, Z.L.; Ye, P. Numerical simulation analysis on influence of inlet flow-passage on performance of pump device. Water Resour. Hydropower Eng. 2018, 49, 110–119. [Google Scholar]
  17. Pei, J.; Gan, X.C.; Wang, W.J.; Yuan, S.Q.; Tang, Y.J. Hydraulic optimization on inlet pipe of vertical inline pump based on artificial neural network. Trans. Chin. Soc. Agric. Mach. 2018, 49, 130–137. [Google Scholar]
  18. Lu, L.G.; Zhu, J.; Leng, Y.; Wu, K.P. Study on method for model test of flow pattern in suction box of pumping station. Drain. Irrig. Mach. 2005, 23, 17–19. [Google Scholar]
  19. Liu, Y.; Wang, F.J.; Xiao, R.F.; Zhang, Z.M. Research on PIV measurement method of elbow-shaped inlet channel of pumping station. In Proceedings of the 2011 Academic Annual Meeting of China Water Conservancy Society, Beijing, China, 11–12 October 2011; pp. 189–191. [Google Scholar]
  20. Zhang, C.; Li, Y.J.; Jiang, H.Y.; Yuan, J.P. Numerical simulation and experiment of optimum hydraulic design for elbow inlet passage. J. Drain. Irrig. Mach. Eng. 2016, 34, 860–866. [Google Scholar]
  21. Tao, R.; Wang, Z.W. Comparative numerical studies for the flow energy dissipation features in a pump-turbine in pump mode and turbine mode. J. Energy Storage 2021, 41, 102835. [Google Scholar] [CrossRef]
  22. Chen, T.P.; Wei, X.Z.; Bie, R.S.; Zhang, T.; Liu, Y.X. A numerical study on the energy dissipation mechanisms of a two-stage vertical pump as turbine using entropy generation theory. J. Appl. Fluid Mech. 2024, 17, 159–175. [Google Scholar] [CrossRef]
  23. Wang, H.J.; Chen, L.X.; Gong, R.Z.; Xiang, G.M.; Wei, X.Z. Application of entropy production theory in flow analysis of hydraulic turbines. In Proceedings of the 19th China Symposium on Hydropower Equipment, Dalian, China, 21–23 November 2013; pp. 21–28. [Google Scholar]
  24. Chen, T.P.; Wei, X.Z.; Bie, R.S.; Li, Y.; Xu, B.; Wang, W.B.; Liu, Y.X. Analysis of flow energy dissipation of a two-stage storage pump based on entropy generation theory. Energy Sci. Eng. 2024, 12, 4512–4531. [Google Scholar] [CrossRef]
  25. Zhu, D.; Tao, R.; Xiao, R.F. Anti-Cavitation Design of the Symmetric Leading-Edge Shape of Mixed-Flow Pump Impeller Blades. Symmetry 2019, 11, 46. [Google Scholar] [CrossRef]
  26. Zhang, L.; Wang, D.Y.; Yang, G.; Pan, Q.; Shi, W.D.; Zhao, R.J. Optimization of Hydraulic Efficiency and Internal Flow Characteristics of a Multi-Stage Pump Using RBF Neural Network. Water 2024, 16, 1488. [Google Scholar] [CrossRef]
  27. Meng, F.; Li, Y.; Chen, J. Investigation of energy losses induced by non-uniform inflow in a coastal axial-flow pump. J. Mar. Sci. Eng. 2022, 10, 1283. [Google Scholar] [CrossRef]
  28. Yang, F.; Li, Z.; Hu, W.; Liu, C.; Jiang, D.; Liu, D.; Nasr, A. Analysis of flow loss characteristics of slanted axial-flow pump device based on entropy production theory. R. Soc. Open Sci. 2022, 9, 211208. [Google Scholar] [CrossRef] [PubMed]
  29. IEC 60193:2019; Hydraulic Turbines, Storage Pumps and Pump-Turbines—Model Acceptance Tests. International Electrotechnical Commission: Geneva, Switzerland, 2019.
  30. Kock, F.; Herwig, H. Local entropy production in turbulent shear flows: A high-Reynolds number model with wall functions. Int. J. Heat Mass Transf. 2004, 47, 2205–2215. [Google Scholar] [CrossRef]
  31. Pei, J.; Meng, F.; Li, Y.; Yuan, S.; Chen, J. Effects of distance between impeller and guide vane on losses in a low head pump by entropy production analysis. Adv. Mech. Eng. 2016, 8, 1–11. [Google Scholar] [CrossRef]
  32. Li, D.Y.; Wang, H.J.; Qin, Y.L.; Han, L.; Wei, X.Z.; Qin, D.Q. Entropy production analysis of hysteresis characteristic of a pump turbine model. Energy Convers. Manag. 2017, 149, 175–191. [Google Scholar] [CrossRef]
  33. Borm, O.; Balassa, B.; Kau, H.-P. Comparison of different numerical approaches at the centrifugal compressor RADIVER. In Proceedings of the 20th ISABE Conference, Gothenburg, Sweden, 12–16 September 2011. ISABE-2011-1242. [Google Scholar]
  34. Ge, M.M.; Manikkam, P.; Ghowwein, J.; Subramnian, K.R.; Coutier-Delgosha, O.; Zhang, G.J. Dynamic mode decomposition to classify cavitating flow regimes induced by thermodynamic effects. Energy 2022, 254, 124426. [Google Scholar] [CrossRef]
Figure 1. Three-dimensional diagram of the MFP.
Water 17 03223 g001
Figure 2. Verification of mesh independence in the fluid domain.
Water 17 03223 g002
Figure 3. Meshing of computational domain.
Water 17 03223 g003
Figure 4. Hydraulic machinery test stand.
Water 17 03223 g004
Figure 5. Model device on hydraulic test stand.
Water 17 03223 g005
Figure 6. Calculation and test performance of the MPF. (a) Head performance curves; (b) Efficiency performance curves; (c) Cavitation performance curves.
Water 17 03223 g006
Figure 7. Contour of Cp and vectors of relative velocity.
Water 17 03223 g007
Figure 8. Entropy production rate on meridional plane.
Water 17 03223 g008
Figure 9. Geometric parameters of the MFP.
Water 17 03223 g009
Figure 10. Entropy production rate of conduit schemes.
Water 17 03223 g010
Figure 11. Head loss at the rated operating point.
Water 17 03223 g011
Figure 12. Head loss over the entire operating range. (a) Hydraulic loss induced by turbulent dissipation; (b) Hydraulic loss induced by wall-effect.
Water 17 03223 g012
Figure 13. Outlet velocity non-uniformity.
Water 17 03223 g013
Figure 14. Contours of relative pressure.
Water 17 03223 g014
Figure 15. Average flow angle of outlet.
Water 17 03223 g015
Figure 16. Outlet turbulence kinetic energy.
Water 17 03223 g016
Figure 17. Comparison of s pump characteristics. (a) Head performance curves; (b) Efficiency performance curves; (c) Cavitation performance curves.
Water 17 03223 g017
Table 1. Basic parameters.
ParameterSymbolValueUnit
Design headHr10.50m
Design flow rateQr0.488m3/s
Rotation speednr1000r/min
Runner diameterDls0.34m
Runner blade numberZr4-
Stay vane blade numberZs11-
Rated rotation angular speedωr104.7rad/s
Rated head coefficientψr0.329-
Rated flow rate coefficientφr0.949-
Specific speednq437.1-
Table 2. Grid Details.
ComponentGRID Node NumberGrid Element Numbery+ Mean
Spiral case1,757,4645,413,48928.33
Runner2,353,7202,226,80819.65
Elbow Suction conduits693,4622,227,35718.87
Table 3. Hydraulic performance of rated point.
ParameterExperiment ResultCFD ResultDifference, %
φr0.9490.949-
ψr0.3290.3251.2%
σir1.301.263.1%
ηr0.8970.909-
Table 4. Source of conduit loss across the schemes.
CasesParametersResults
Bj/D0Hj/D0β1β2Ra/D0Rb/D0Etro 1Wal 2
--°°--10−2 m10−2 m
Original2.721.3016.123.12.461.061.412.46
a2.721.9824.753.12.461.061.262.34
b3.821.9824.753.12.461.060.951.96
c3.821.9815.743.12.460.520.901.87
d3.821.9815.746.02.450.560.671.47
Notes: 1 Etro denotes turbulent entropy generation equivalent head loss. 2 Wall denotes wall entropy generation equivalent head loss.
Table 5. Head loss at the rated operating point.
CasesEntropy Generation Theory [m]PDM [m]Difference [10−2 m]
Original0.03870.03630.24
a0.03600.03250.34
b0.02910.02710.20
c0.02770.02760.01
d0.02140.02130.01
Table 6. Turbulence intensity at outlet.
CasesPlane Z = −0.05 m, 10−3Plane Z = −0.1 m, 10−3
Original3.883.93
a3.693.77
b2.122.20
c1.791.77
d1.591.66
Table 7. Hydraulic characteristic quantitative comparison on rated point.
ParameterOriginalOptimizedDifference, %
φr0.9490.949-
ψr0.3250.3270.45%
σir1.261.213.6%
ηr0.9090.912-
Disclaimer/Publisher’s Note: The statements, opinions and data contained in all publications are solely those of the individual author(s) and contributor(s) and not of MDPI and/or the editor(s). MDPI and/or the editor(s) disclaim responsibility for any injury to people or property resulting from any ideas, methods, instructions or products referred to in the content.