Article

Effects of Polyculture Patterns in Ponds on Water Quality and Intestinal Flora of Penaeus monodon

by
Xueliang Sun
1,2,3,
Zhenzhen Fang
2,3,
Hong Yu
4,
Honghao Zhao
2,3,
Yuanyuan Yang
2,3,
Falin Zhou
5,
Yongjun Guo
2,3,
Chengxun Chen
2,3,
Lin Zhao
1,* and
Yunchen Tian
6,*
1
Environment College, Tianjin University, 135 Yaguan Road, Haihe Education Park, Tianjin 300350, China
2
Fisheries College, Tianjin Agricultural University, 22 Jinjing Road, Tianjin 300384, China
3
Tianjin Key Laboratory of Aqua-Ecology and Aquaculture, College of Fisheries, Tianjin Agricultural University, 22 Jinjing Road, Tianjin 300384, China
4
Tianjin Fisheries Research Institute, No. 442, Jiefang South Road, Hexi District, Tianjin 300221, China
5
Institute of South China Sea Oceanography, Chinese Academy of Sciences, 164 Xingang West Road, Haizhu District, Guangzhou 510301, China
6
Computer and Information Engineering College, Tianjin Agricultural University, 22 Jinjing Road, Tianjin 300384, China
*
Authors to whom correspondence should be addressed.
Water 2025, 17(22), 3194; https://doi.org/10.3390/w17223194 (registering DOI)
Submission received: 21 September 2025 / Revised: 18 October 2025 / Accepted: 27 October 2025 / Published: 8 November 2025

Abstract

Shrimp aquaculture ponds are dynamic ecosystems in which water quality and microbial interactions play a central role in animal health. This study aimed to investigate the relationship between the intestinal microbiota of Penaeus monodon and the microbial community of polyculture pond water. Shrimp and water samples were collected from polyculture ponds at four time points during the rearing period. Water-quality parameters were measured, and microbial community structures were analyzed by high-throughput 16S rRNA sequencing. Statistical analyses, including one-way ANOVA, revealed significant variations in water-quality parameters and microbial diversity among sampling stages (p < 0.05). Water quality indicators showed progressive changes from July to September, with pH decreasing from 8.1 to 7.5 but remaining within a suitable range. Nitrogen compounds, including ammonia, nitrite, and nitrate, increased steadily, with total nitrogen rising from 0.71 to 1.86 mg·L−1, while phosphate and total phosphorus reached 0.31 and 0.36 mg·L−1, respectively, exceeding thresholds commonly associated with algal bloom risk. Microbial community profiling using Illumina MiSeq sequencing revealed 166 OTUs shared between shrimp intestine and pond water, while both habitats contained more than 350 OTUs overall. Alpha diversity analysis showed higher microbial richness in water than in shrimp intestines, dominated by unclassified taxa, whereas shrimp guts were enriched in specific genera such as Vibrio. Cluster analysis indicated partial overlap but distinct grouping of gut and water microbiota, with the PMB intestinal community diverging most strongly. These findings highlight a close link between water quality and microbial composition, emphasizing the importance of pond management for maintaining ecological stability and shrimp health.

1. Introduction

Shrimp aquaculture is one of the fastest growing and most valuable sectors of global seafood production, contributing significantly to food security, livelihoods, and international trade. While the Litopenaeus vannamei is the most widely cultivated species, the Penaeus monodon remain of high economic importance in Asia due to their large size, preferred taste, and premium market value [1,2]. Global production of farmed shrimp now exceeds five million metric tons annually, with P. monodon contributing around 0.6–0.7 million tons in recent years, underscoring the continued relevance of these species [1,3]. Ensuring sustainable production requires improved understanding of pond ecosystem processes, particularly the microbial communities that regulate water quality and influence shrimp health.
Aquaculture ponds are complex ecosystems in which microorganisms perform essential ecological functions. Bacteria, archaea, algae, and fungi mediate nutrient cycling, organic matter degradation, and detoxification of nitrogenous wastes such as ammonia and nitrite [4,5]. Beneficial bacteria in biofloc or recirculating aquaculture systems have been shown to assimilate excess nitrogen, convert waste into microbial biomass, and stabilize pond water parameters [6]. Such processes directly support shrimp survival and growth [7]. Conversely, imbalances in microbial communities can lead to water quality deterioration, phytoplankton crashes, or proliferation of pathogenic taxa, thereby increasing disease risk [8].
The shrimp gut microbiota has emerged as a critical determinant of host nutrition, immunity, and overall performance. Studies using high-throughput 16S rRNA gene sequencing have shown that healthy shrimp guts are dominated by Proteobacteria, with additional representation of Firmicutes, Bacteroidetes, and Actinobacteria [9,10]. These communities aid digestion, produce vitamins and enzymes, and enhance immune function [11]. Dysbiosis, or imbalance of the gut microbiota, is associated with major shrimp diseases including acute hepatopancreatic necrosis disease (AHPND), white feces syndrome, and white spot disease [2,12]. Chang et al. [13] demonstrated that Vibrio infection disrupts the gut microbiome of shrimp, reducing bacterial diversity and increasing the relative abundance of pathogenic taxa. Similarly, viral infections such as white spot syndrome virus (WSSV) alter gut microbiota composition and reduce beneficial taxa [14]. Collectively, these findings indicate that gut microbial balance is closely linked to shrimp disease resistance and production outcomes.
Environmental factors strongly influence shrimp gut microbiota. Salinity, temperature, diet, and stocking density have all been reported to shape gut bacterial communities [7,15]. Hou et al. [16] found that salinity significantly alters gut microbiome structure, with high salinity enriching Vibrionaceae and cyanobacteria in P. monodon intestines. Developmental stage is another driver: Cicala et al. [17] observed predictable shifts in gut community composition from larval to adult stages of P. monodon. Host genetic factors also contribute, with selective breeding lines of shrimp showing distinct gut microbial profiles [18]. These findings highlight the plasticity of the shrimp gut microbiome and the potential to harness it for health management.
Manipulating shrimp microbiomes has become an emerging strategy for improving culture outcomes. Probiotics, prebiotics, and synbiotics introduced via feed or water have been shown to modulate gut communities, enhance immunity, and improve feed efficiency [19]. Lin et al. [20] reported that probiotic and herbal treatments significantly shifted gut microbiota over time, increasing the abundance of beneficial bacteria. Meta-analyses confirm that microbiome-based interventions can reduce pathogen load and improve shrimp performance across multiple culture systems [19,21]. Furthermore, the microbiome itself has been proposed as a determinant of aquaculture productivity, with specific bacterial taxa correlating with growth performance [22].
Beyond the host, interactions between gut and environmental microbiota are increasingly recognized as critical to shrimp aquaculture. Zhou et al. [23] reported distinct but interconnected microbial communities in shrimp intestines, pond water, and sediments, suggesting reciprocal exchanges. Li et al. [24] documented strong correlations between environmental microbial dynamics and shrimp gut community assembly in greenhouse farming systems. Similarly, Wang et al. [25] recently showed that gut, water, and sediment microbiota are interrelated, with environmental conditions influencing gut colonization and vice versa. Such studies underscore the need to consider host–environment microbial interactions in aquaculture management.
Despite these advances, little is known about the gut–water microbiota relationship in P. monodon, particularly under polyculture pond systems. Polyculture practices, where shrimp are co-reared with fish or other aquatic organisms, create complex microbial milieus that may affect both water quality and host microbiota. To date, few studies have explicitly examined gut and water microbial communities concurrently in P. monodon under polyculture. Addressing this gap is essential for understanding microbial ecology in traditional pond systems and for developing microbiome-based strategies to improve shrimp health and sustainability. Therefore, the present study aims to characterize bacterial communities in the intestines of P. monodon and in pond water across multiple culture stages in polyculture ponds, and to evaluate the degree of overlap, correlation, and temporal dynamics between these microbiomes. By integrating host and environmental microbiome data, this research provides new insights into the microbial ecology of P. monodon aquaculture and informs ecosystem-based approaches for sustainable shrimp production.

2. Materials and Methods

2.1. Materials

2.1.1. Sample

Water and shrimp samples were collected from polyculture ponds located in Jingwu Town, Xiqing District, Tianjin, China. The ponds were stocked with “Nanhai No.1” spotted prawn (Penaeus monodon) and koi (Cyprinus carpio).
Each pond had a surface area of approximately 800 m−2 and an average water depth of 1.8 m, with a 10% weekly water exchange rate and continuous aeration to maintain water quality.
P. monodon were stocked at a density of 20 individuals·m−2, and C. carpio were stocked at 1.5 individuals·m−2. Shrimp were fed a commercial pelleted diet containing 38% crude protein at a rate of 5% of body weight per day, divided into two feedings (08:00 and 18:00).
All ponds were managed under standard intensive aquaculture practices used in the Tianjin region.

2.1.2. Experimental Supplies and Instruments

The main laboratory equipment included a Thermo Fisher Sorvall ST16R high-speed refrigerated centrifuge (Waltham, MA, USA), vacuum grinder, filter extractor, micropipette, electronic balance, 0.22 µm filter membranes, centrifuge tubes, and 0.9% sterile saline. All instruments and consumables were sterilized before use to avoid contamination.

2.2. Methods

The culture experiment began on 20 July 2018, and lasted for about two months. Four sampling points were arranged to represent different time intervals throughout the rearing process. Shrimp and water samples were collected simultaneously on July 20 (PMA/SH1), August 3 (PMB/SH2), August 18 (PMC/SH3), and September 2 (PMD/SH4). Here, PMA, PMB, PMC, and PMD represent shrimp samples, while SH1, SH2, SH3, and SH4 correspond to the water samples collected at the same time from the same ponds. The sampling intervals were approximately 15 days, ensuring that the data captured the continuous changes in both shrimp and water microbiota throughout the culture cycle.
At each sampling, shrimp were randomly netted from multiple points within each pond, and water samples (500 mL each) were collected at a depth of 30–40 cm from the same positions. Each sampling event included three biological replicates (n = 3 ponds), and each pond was treated as an independent experimental unit. All samples were transported to the laboratory on ice and processed within 6 h after collection.

2.2.1. Extraction of Intestinal Bacteria from P. monodon

The “Nanhai No.1” spotted shrimp was oxygenated and transported to the laboratory, and 20 shrimp were collected and disinfected in a sterile environment. The back of the spotted shrimp was cut with sterilizing scissors, and the intact intestinal tract of the shrimp was picked up with tweezers and put into a centrifuge tube, adding 1 mL sterile normal saline and then transferred to a vacuum grinder for full grinding. All the samples were divided into three parts. The samples were placed in a bench centrifuge with an electronic balance. The homogenates were centrifuged at 2000× g for 10 min at 4 °C. This process was repeated until the supernatant was clear. The final supernatant was then collected by centrifugation at 5000× g for 15 min at 4 °C, and the pellet was stored at −80 °C for DNA extraction.

2.2.2. Extraction of Bacteria from Water Samples of Mixed Culture Pond

The water samples of mixed culture koi and prawn ponds in Jingwu Town of Xiqing were collected (5 moffshore and 0.5 m away from the water surface), and the bacteria were extracted on the filter membrane using a vacuum filter and divided into three parts into a centrifuge tube. The bacteriological samples on the filter membrane were rinsed and coated cleanly into the centrifuge tube using a pipette to absorb sterile normal saline. The samples were also centrifuged and deposited at −80 °C for DNA extraction.

2.2.3. Extraction, PCR Amplification and Purification of Total DNA of the Sample and Sequence Determination

Take the samples of P. monodon and water, respectively, and extract the total DNA genome of the samples according to the product instructions of the kit (Universal Genomic DNA Extraction Kit, No. 9765, TAKARA, Shiga, Japan). The total DNA genome was electrophoretic in 0.8% agarose gel to detect the quality of its extraction, and then the total DNA genome was quantified by ultraviolet spectrophotometer. The corresponding primers were designed according to the conserved regions in the 16SrRNA target sequence. The bacterial 16S rRNA gene V3–V4 region was amplified using the universal primers 341F (5′-CCTACGGGNGGCWGCAG-3′) and 806R (5′-GGACTACHVGGGTATCTAAT-3′), amplified in a 50 µL system. After the amplification products were quantified, the DNA concentration was adjusted to 25 ng/µL, all samples were mixed in equal proportions, and the library was constructed and sequenced using Illumina MiSeq sequencing platform (Illumina Inc., San Diego, CA, USA) (entrusted to Innoson Biotechnology Co., Ltd., Shenzhen, China).

2.2.4. Water Quality Index Testing

During each sampling phase, pH, dissolved oxygen, and salinity were recorded on-site using a calibrated multi-parameter probe. Total nitrogen (TN) was determined using alkaline potassium persulfate digestion-UV spectrophotometry, which converts all nitrogen-containing compounds in the water sample into nitrates through high-temperature and high-pressure digestion before measurement. Ammonia nitrogen (NH3-N) was determined using Nessler’s reagent spectrophotometry, which utilizes the principle that ammonia forms a colored complex with specific reagents. Nitrite nitrogen (NO2-N) was determined using N-(1-naphthyl)-ethylenediamine spectrophotometry, which is diazotized with p-aminobenzenesulfonamide and then coupled to form a purple-red dye. Nitrate nitrogen (NO3-N) was determined indirectly by reducing it to nitrite using a cadmium column reduction method. Total phosphorus (TP) and total phosphate are determined using ammonium molybdate spectrophotometry (molybdenum antimony method). High-temperature digestion using an oxidizing agent such as potassium persulfate converts all forms of phosphorus into orthophosphate, which is then followed by color development to produce phosphomolybdenum blue. The determination of active phosphate (i.e., orthophosphate) follows the same principle, but without the digestion step. The color development reaction is performed directly on the filtered water sample. Each parameter is measured three times at each stage.

2.2.5. Data Processing

The overall experiment began on 20 July 2018, and ended in late September 2018. Although the fieldwork was conducted several years ago, all raw sequencing and environmental data were carefully preserved and reanalyzed in 2024 using updated bioinformatics pipelines and statistical methods to provide new insights into microbial community dynamics under polyculture conditions.
High-throughput sequencing was performed using a paired-end platform for total DNA fragments. The raw paired-end sequences in FASTQ format were merged and quality-filtered using the sliding window method. The software FLASH (v1.2.7) was used to pair and assemble reads based on overlapping regions. Sample-specific barcodes were used to assign sequences to their corresponding samples, and high-quality clean tags were obtained after strict quality control filtering.
The QIIME (v1.8.0) pipeline was employed for sequence analysis, and USEARCH (v2.236) was used to identify and remove chimeric sequences. Sequences with ≥97% similarity were clustered into operational taxonomic units (OTUs). Representative sequences of each OTU were taxonomically classified to the species level using the Ribosomal Database Project (RDP) classifier.
A rarefaction curve was generated to assess sequencing depth. Alpha diversity indices (Chao1, ACE, Shannon, and Simpson) were calculated to evaluate species richness and diversity. Venn diagrams were constructed using the Venn Diagram online tool, and bar charts were generated using Origin 2022 (v9.9).
Water-quality parameters were expressed as mean ± standard deviation (SD). Differences among sampling stages (SH1-SH4) were analyzed using one-way analysis of variance (ANOVA) followed by Duncan’s multiple range test at a significance level of p < 0.05. Pearson correlation analysis was applied to evaluate the relationships between intestinal OTU richness and nutrient concentrations (total nitrogen and total phosphorus). All statistical analyses were conducted using SPSS 25.0 (V25.0.0).

3. Results

3.1. Water Quality Index Data

The water-quality indicators of aquaculture ponds (Table 1) showed clear temporal variations across the four sampling stages (SH1–SH4) from July to September. The pH gradually decreased from 8.1 ± 0.02 to 7.5 ± 0.02 (p < 0.05), remaining within the suitable range for aquatic animals. Concentrations of ammonia nitrogen (NH3-N), nitrite nitrogen (NO2-N), and nitrate nitrogen (NO3-N) increased progressively during the culture period, though all remained below acute toxic levels. Total nitrogen (TN) increased significantly from 0.71 ± 0.02 mg·L−1 to 1.86±0.02mg·L−1 (p < 0.05).
Similarly, phosphate (PO43−-P) and total phosphorus (TP) concentrations rose steadily, reaching 0.27 ± 0.06 mg·L−1 and 0.34 ± 0.07 mg·L−1 in SH3, and 0.31 ± 0.03 mg·L−1 and 0.36 ± 0.02 mg·L−1 in SH4, respectively. These increases were statistically significant (p < 0.05). The observed phosphorus levels approach or exceed the recommended management target for aquaculture ponds (TP ≤ 0.30 mg·L−1) proposed by the Global Aquaculture Alliance, suggesting a heightened risk of eutrophication and algal blooms during the late culture stages.

3.2. High-Throughput Sequencing Data

After obtaining the original sequence data of the shrimp and water samples by Illumina high-throughput sequencing, and referring to the analysis content of FastQ, the sequence quality control results of the samples were statistically shown in Table 2. It was revealed that the valid sequences of each sample ranged from 79,681 to 89,203, and their average length was stable at 253 bp. Among them, the sequences within the range of effective sequence length reached about 90% of the total number of effective sequences.
Table 2 also lists the proportion of base Q20 and Q30 with sample sequencing mass greater than 20 and 30. The closer the percentage of these two groups is to 100%, the more the quality of sequencing meets the quality control standards. The proportion of Q20 and Q30 in all samples reached more than 99.12% and 98.24%, indicating that the sequencing was in full compliance with the quality control standards, which laid a reliable foundation for subsequent experimental data.

3.3. OTU Cluster Analysis

3.3.1. OTU Clustering and Annotation Analysis

Based on the clustering analysis at the 97% similarity level, the number of bacterial OTUs in shrimp intestines ranged from 638 to 1119, whereas those in pond water ranged from 812 to 1071 (Table 3). The PMB group exhibited the highest intestinal OTU richness (1119), while the PMC group showed the lowest (638). For water samples, the OTU counts were the highest in SH2 (1071) and lowest in SH1 (812) and SH4 (821).
These results indicate that the intestinal microbial community of P. monodon underwent dynamic succession throughout the culture period. The high OTU richness observed in the PMB stage corresponded to the period of moderate nutrient enrichment in pond water (TN = 1.34 mg·L−1; TP = 0.15 mg·L−1), which may have promoted microbial proliferation and increased community diversity. In contrast, during the PMC stage, when nutrient levels further increased (TN = 1.53 mg·L−1; TP = 0.31 mg·L−1), eutrophic conditions likely resulted in algal overgrowth and reduced dissolved oxygen, thereby suppressing intestinal microbial diversity.
Overall, the temporal variation in OTU richness suggests a close ecological linkage between the shrimp intestinal microbiota and pond-water bacterial communities, reflecting their co-regulation under changing environmental nutrient conditions.

3.3.2. Analysis of OTU Petal Diagram and Wayne Diagram

To further compare the similarities and differences between the intestinal and aquatic microbial communities of P. monodon, a petal diagram (Figure 1) was used to illustrate OTU distribution among groups. The analysis revealed that 166 OTUs were shared between shrimp intestinal and pond-water microbiota, while each group also contained unique OTUs. The PMB group exhibited the highest number of unique intestinal OTUs, followed by PMA, whereas PMC and PMD contained fewer unique taxa, indicating a gradual stabilization of the intestinal community as the shrimp matured.
In comparison, the number of unique OTUs in pond-water samples (SH1–SH4) remained relatively stable, averaging around 50 per group, with SH1 and SH2 showing slightly higher values. This pattern suggests that both shrimp intestines and pond water harbored highly dynamic but interconnected microbial populations during the early and mid-culture stages.
Further analysis using the Venn (Wynn) diagram confirmed strong overlaps between paired shrimp–water samples: 383 (PMA-SH1), 386 (PMB-SH2), 395 (PMC-SH3), and 352 (PMD-SH4) shared OTUs were detected. These results collectively demonstrate a close ecological interaction between the intestinal microbiota of P. monodon and the bacterial communities in pond water, reflecting synchronized microbial responses to environmental changes.

3.4. Analysis of Flora Structure and Abundance

3.4.1. Microflora Structure Under Phyla Classification Level

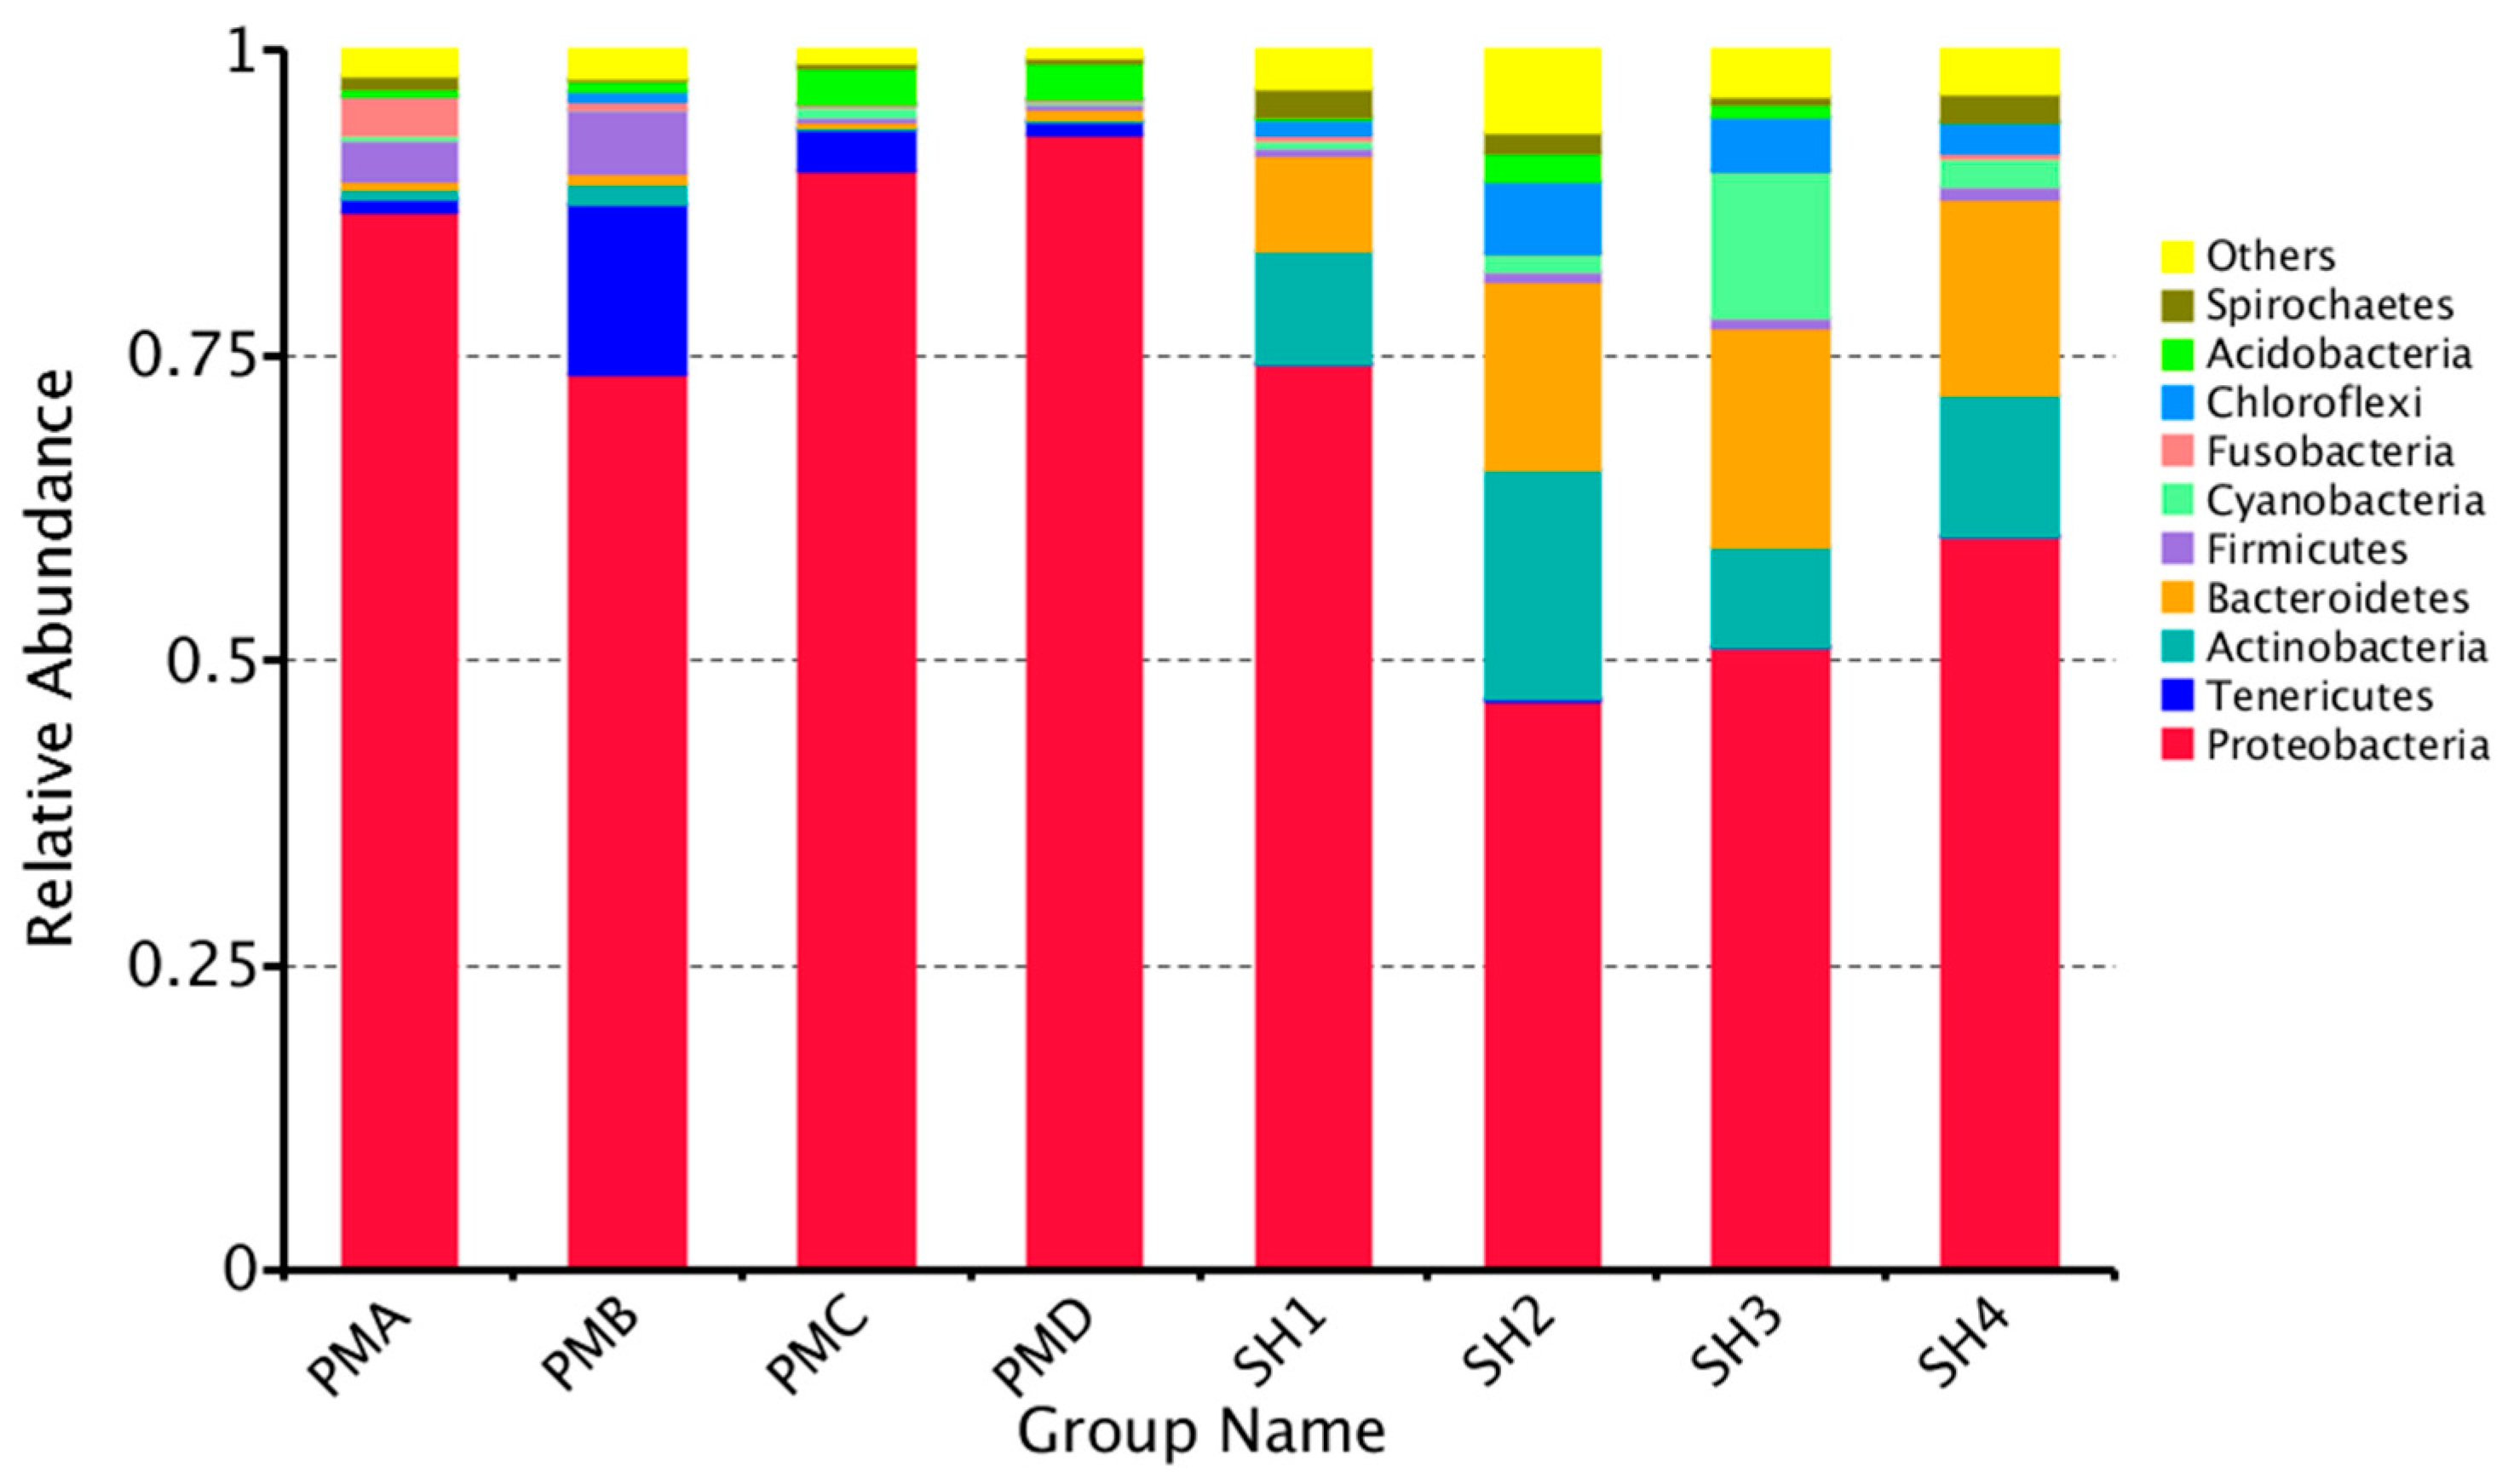
At the phylum level, a total of 44 bacterial phyla were detected in the intestines of P. monodon and 27 phyla in the surrounding pond water, with 19 phyla shared between the two habitats. The relative abundance of the ten most dominant phyla across the eight sample groups is illustrated in Figure 2. Proteobacteria was the overwhelmingly dominant phylum in both intestinal and water samples, accounting for up to 93.03% in PMD and 74.31% in SH1. In the intestinal microbiota, the next most abundant phyla were Tenericutes, Firmicutes, and Acidobacteria; notably, Tenericutes and Firmicutes were particularly enriched in PMB, reaching 13.89% and 5.29%, respectively.
In contrast, the aquatic bacterial communities were dominated by Actinobacteria, Bacteroidetes, and Chloroflexi, and their relative abundances were more evenly distributed among groups compared with the intestine. Unlike the gut, where Proteobacteria exhibited near-monopolistic dominance at later stages, the water column maintained a broader phylum-level diversity without a single taxon prevailing.
Taken together, these patterns indicate a host-filtered, Proteobacteria-enriched community in the shrimp intestine versus a more even, environmentally driven assemblage in pond water, reflecting distinct selection pressures in the gut niche and the external rearing environment.

3.4.2. Flora Structure at the Order Classification Level

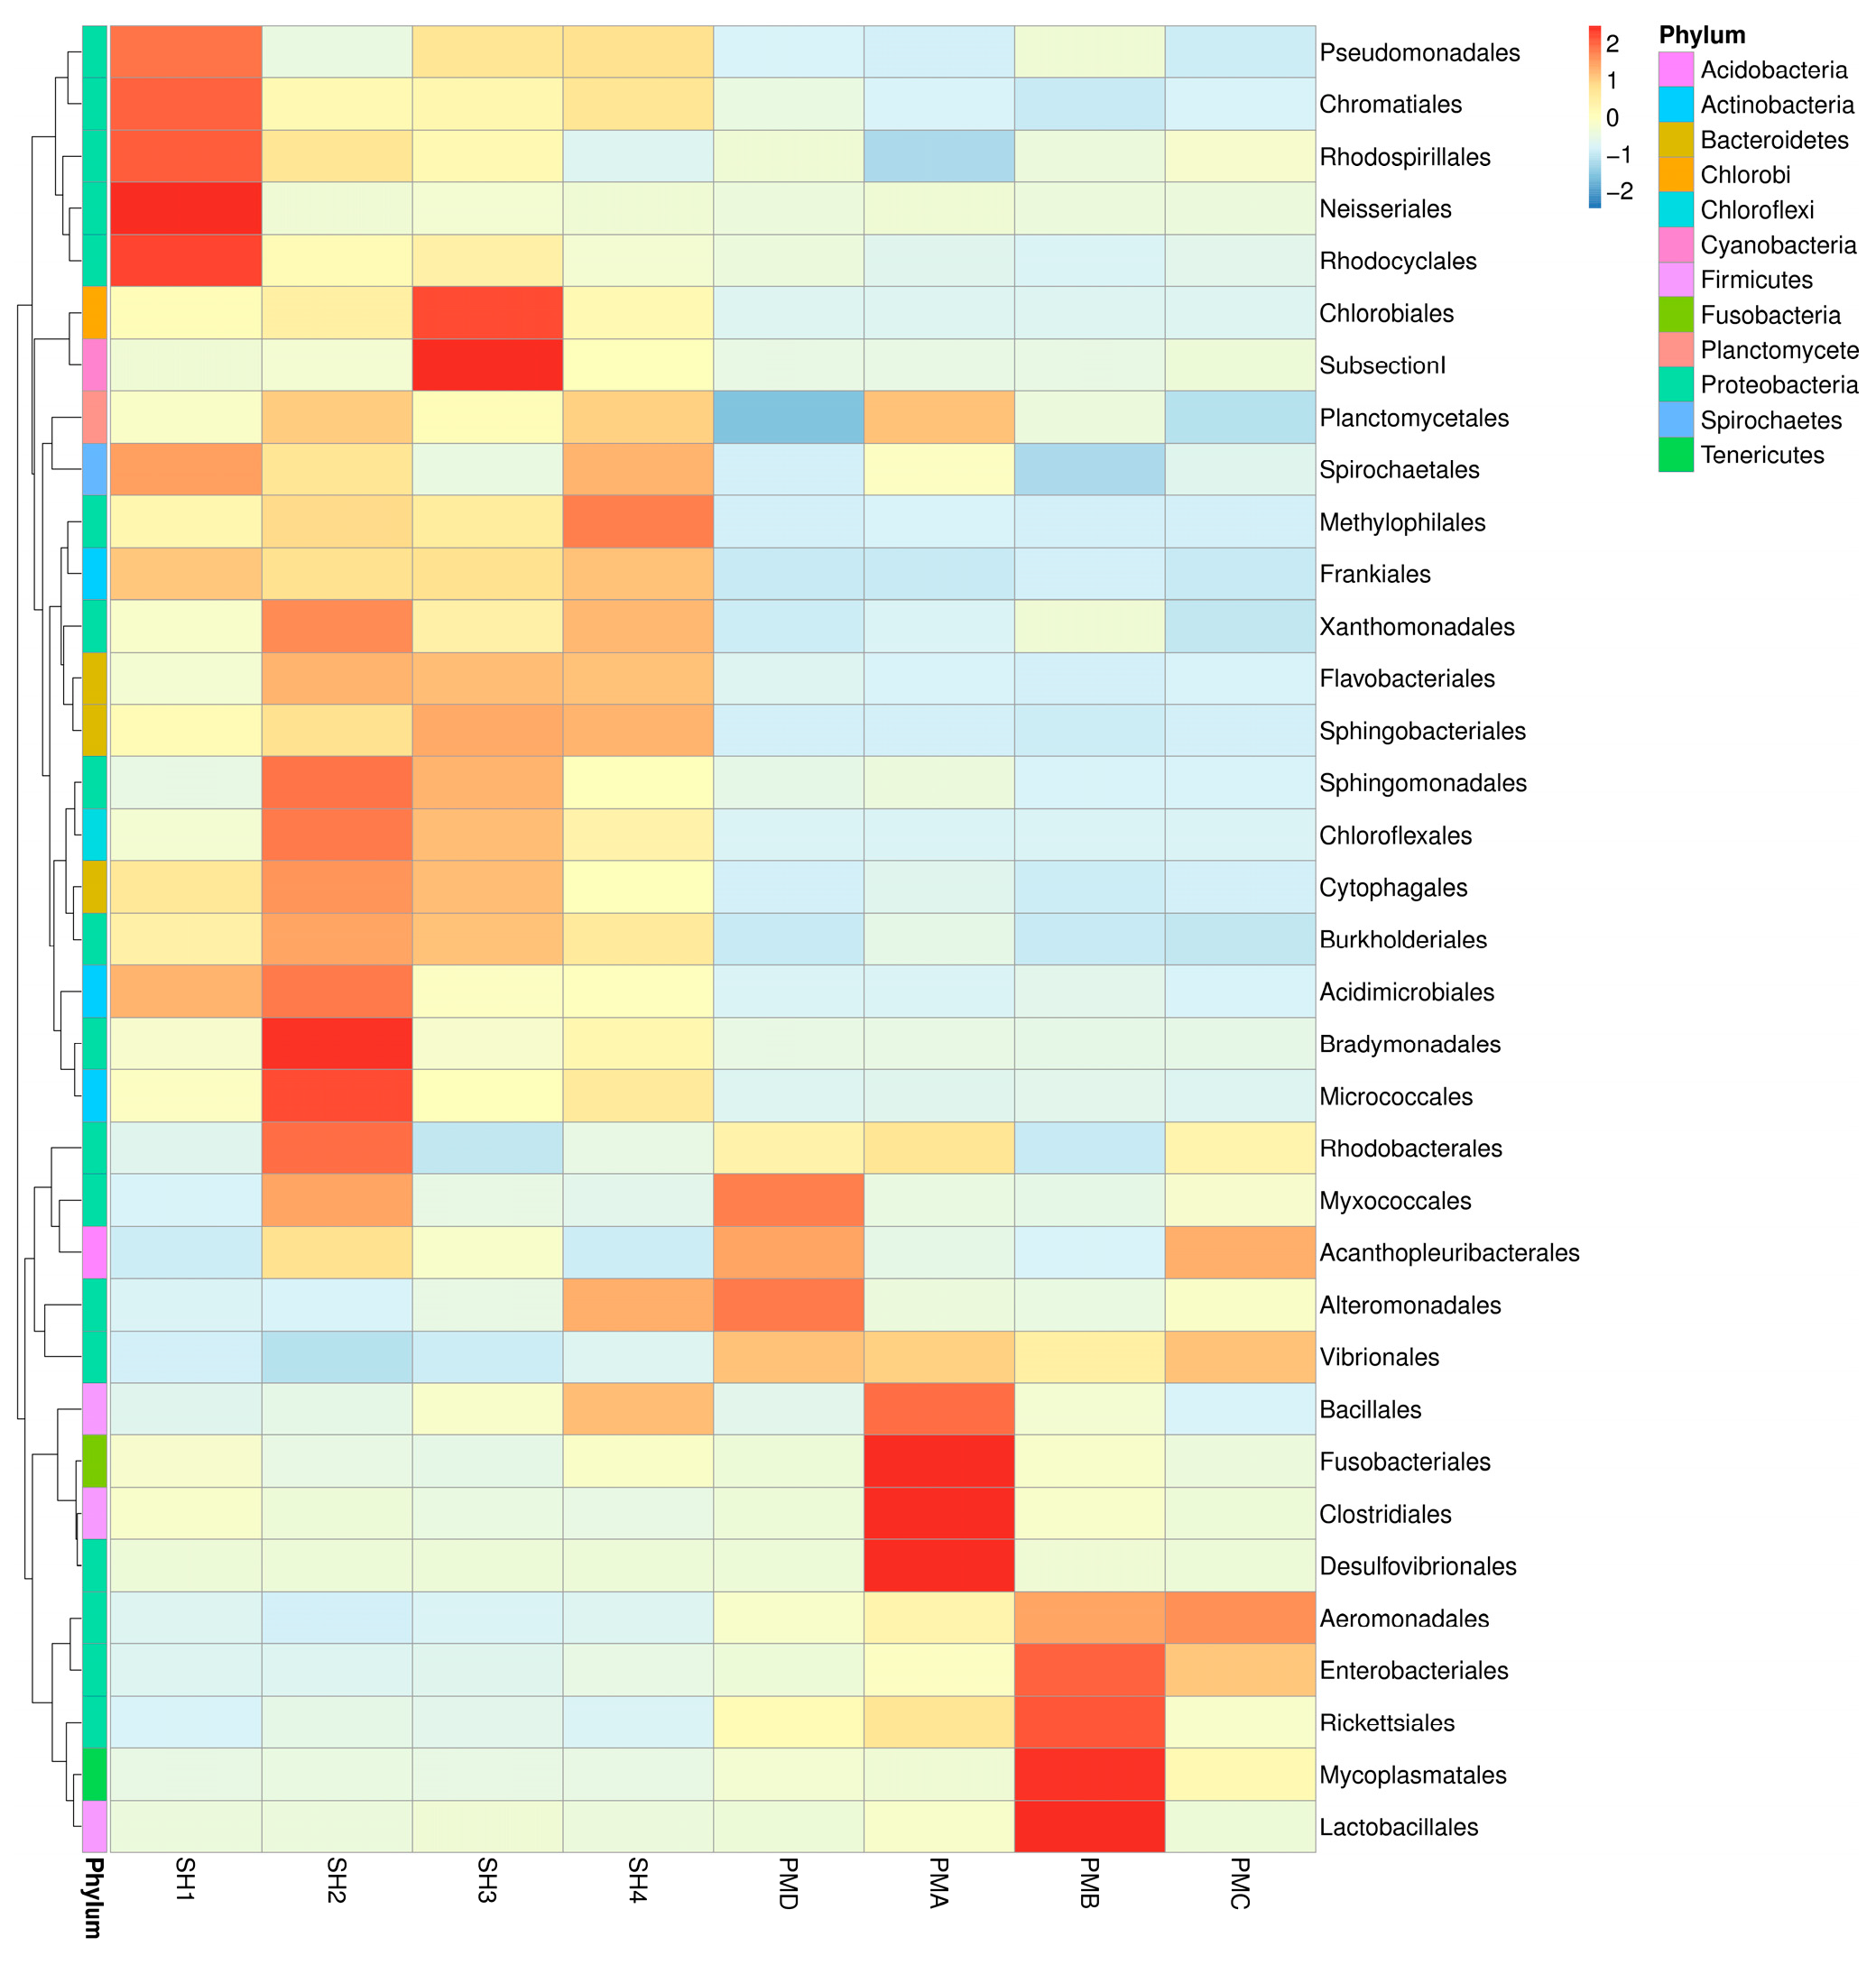
A heat map was used to visualize the variation in microbial abundance, where color intensity represents the relative abundance of bacterial taxa (Figure 3). Differences in color distribution indicate similarities or distinctions in microbial composition among sample groups.
At the order level, the heat map revealed marked differences between the intestinal and aquatic microbial communities of P. monodon, with the two clusters clearly separated. In the intestinal samples, the color pattern of Vibrionales was relatively uniform, suggesting consistent abundance among groups, while several taxa exhibited group-specific enrichment. For example, Fusobacteriales, Clostridiales, and Desulfovibrionales were enriched in PMA, whereas Lactobacillales and Mycoplasmatales were clustered in PMB, indicating temporal shifts in dominant taxa during intestinal development.
In contrast, the aquatic samples displayed more even color distributions across most bacterial orders. Notably, SH2 showed a distinct clustering pattern, while Pseudomonadales and Neisseriales were most abundant in SH1, indicating a higher relative abundance of these taxa in early-stage pond water. No prominent clustering similarity was observed between the shrimp intestinal and pond-water groups, reflecting distinct microbial community structures shaped by internal and environmental conditions.

3.4.3. Microflora Structure at Genus Classification Level

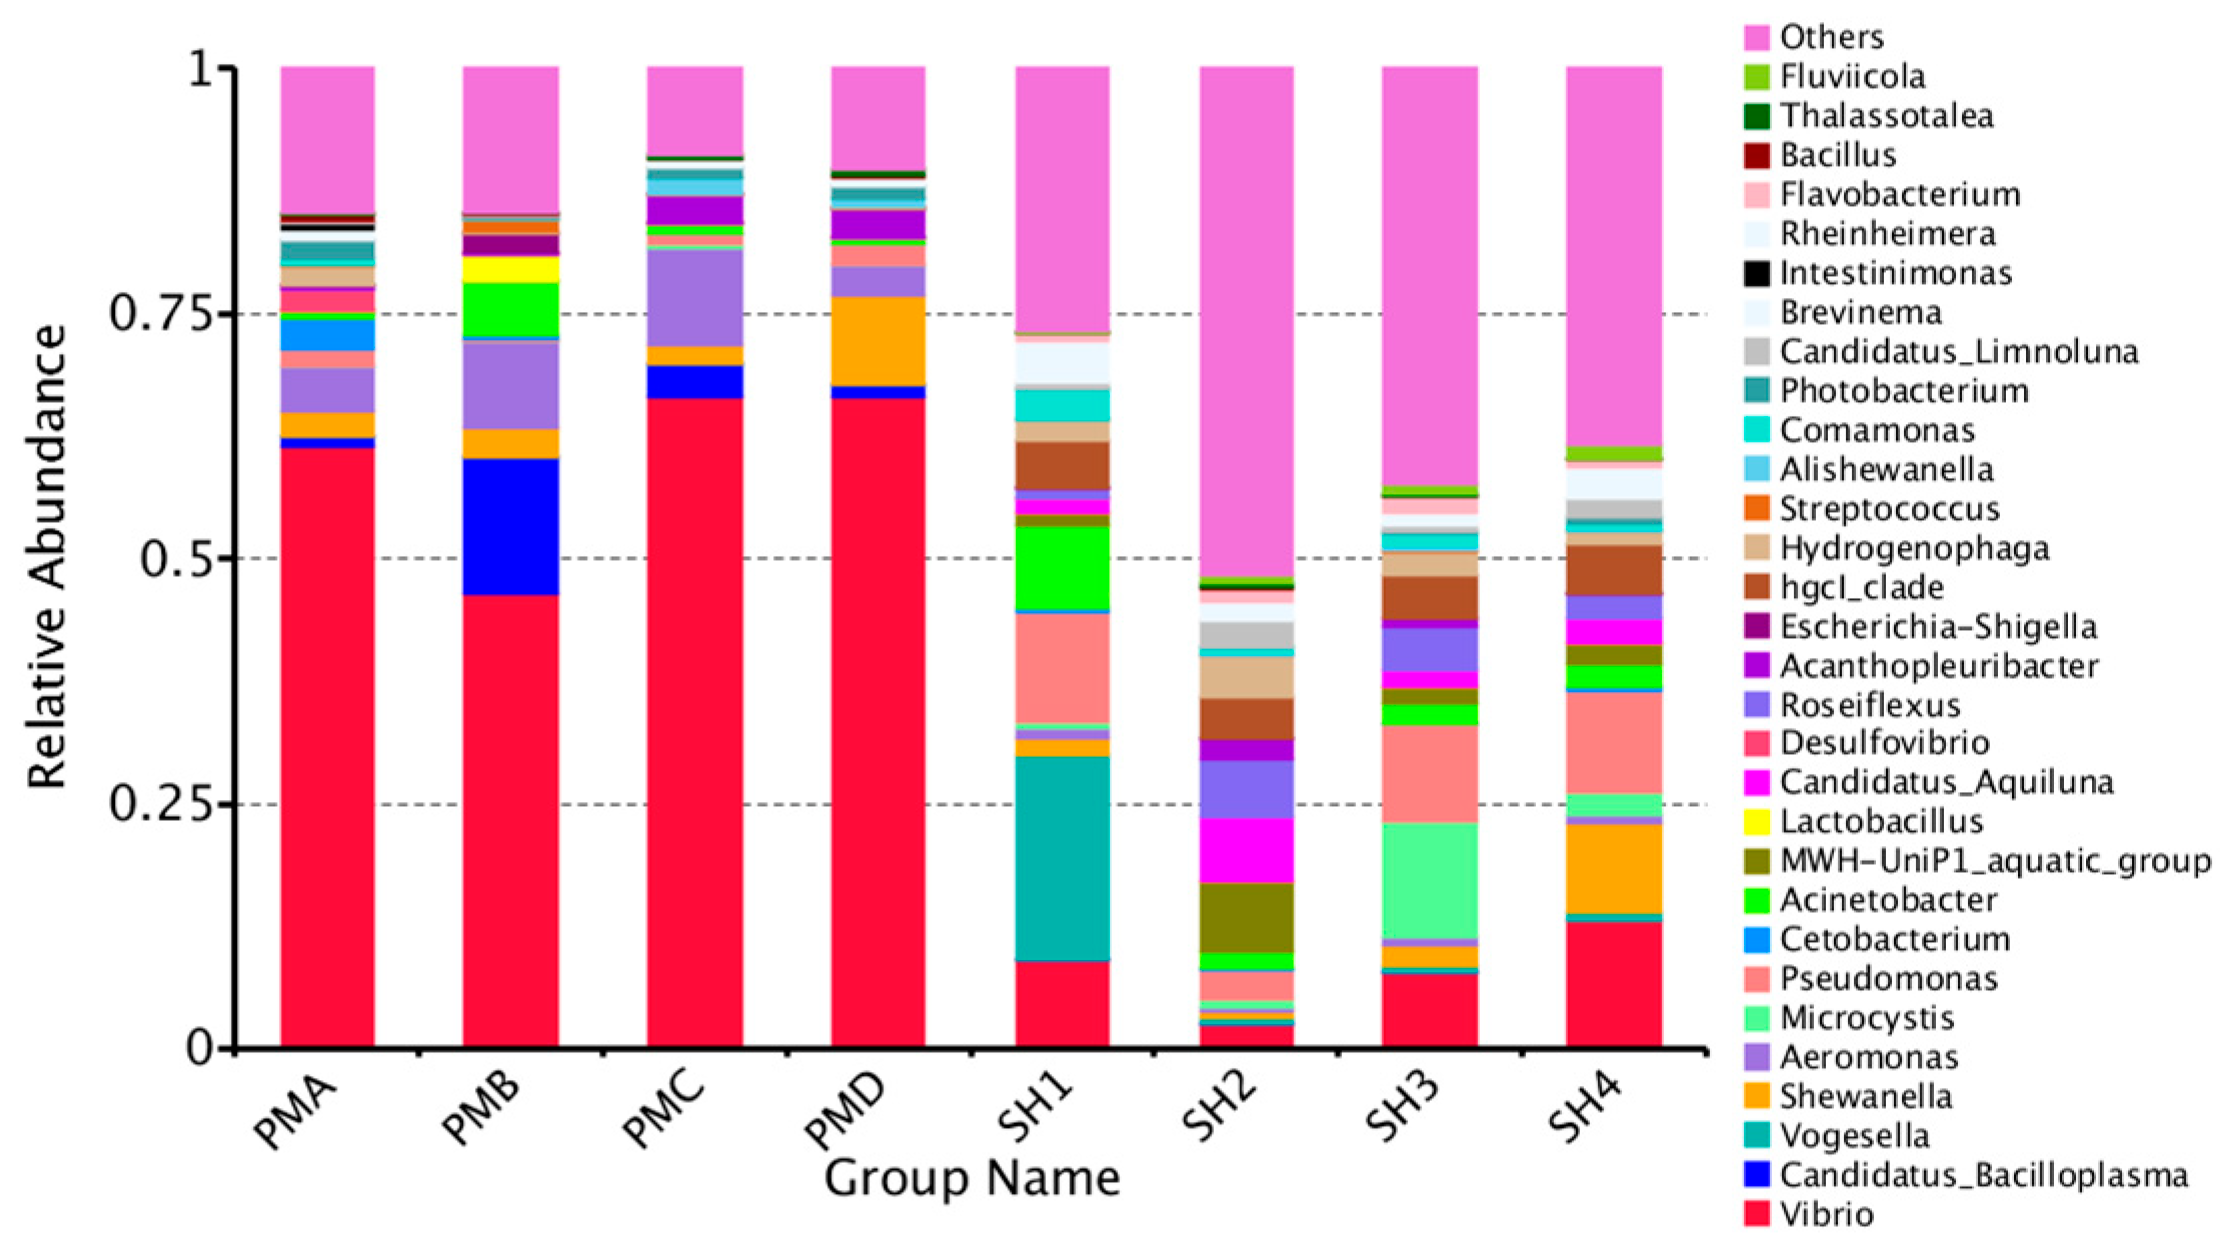
At the genus level, the relative abundance and distribution of dominant bacterial genera in each sample are presented in Figure 4. Compared with the phylum-level patterns, the composition and relative abundance of dominant genera differed markedly between intestinal and pond-water microbiota. The most striking difference was observed in Vibrio and an unclassified bacterial genus, which together constituted the major components of both communities.
In the shrimp intestinal samples, Vibrio was predominant, accounting for 61.48%, 46.51%, 66.48%, and 66.52% in PMA-PMD, respectively (Table 4). In contrast, its proportion in pond water was much lower, at only 9.04%, 2.45%, 7.83%, and 13.15% in SH1–SH4. Conversely, the unclassified bacterial genus showed the opposite trend, representing 45.25%, 82.92%, 63.03%, and 58.62% of the water samples, but only 24.70%, 21.63%, 15.75%, and 17.21% of the intestinal samples.
Besides these two main taxa, Shewanella was consistently detected in both habitats with relatively uniform distribution, ranging from 2.54% to 9.10% in shrimp intestines and 0.59% to 9.07% in pond water. Among the remaining intestinal genera, Candidatus Bacilloplasma showed a distinct temporal peak in PMB (13.87%), suggesting an association with the mid-stage of shrimp development. Aeromonas and Pseudomonas were also present throughout all intestinal samples with relatively stable abundances.
In pond water, the most abundant genus was Vogesella, which reached 20.92% in SH1, followed by Microcystis in SH3. Other genera such as Pseudomonas and Acinetobacter also accounted for notable proportions and were evenly distributed across sampling stages. Interestingly, the overall abundance of dominant genera was lowest in SH2, corresponding to the most active phase of shrimp intestinal microbiota. This inverse pattern suggests that fluctuations in shrimp gut microbial activity may exert a regulatory influence on the bacterial composition of the surrounding water, supporting a close ecological linkage between intestinal and aquatic microbiota in the same culture system.

3.5. Analysis of Flora Diversity and Similarity

3.5.1. Alpha Diversity Index Analysis

Alpha diversity analysis reflects the richness and diversity of microbial communities. The goods_coverage index of all samples exceeded 0.994, indicating high sequencing coverage and sufficient sequencing depth for reliable bacterial diversity assessment.
The Chao1 and ACE indices represent community richness, with higher values indicating greater species abundance, while the Shannon and Simpson indices reflect community diversity, where higher values denote more even and diverse communities.
As shown in Table 5, the Shannon and Simpson indices of the pond-water samples were significantly higher than those of the shrimp intestinal samples, suggesting that the bacterial communities in pond water exhibited greater species diversity. Similarly, the Chao1 and ACE indices—except for the abnormally high values observed in PMB and SH2—also indicated higher microbial richness in pond-water samples than in shrimp intestines.
Overall, these results demonstrate that the aquatic microbial community maintained a more complex and diverse structure, while the intestinal microbiota of P. monodon exhibited lower diversity and richness, consistent with selective colonization and host-specific microbial filtering within the shrimp gut.

3.5.2. Alpha Diversity Curve Analysis

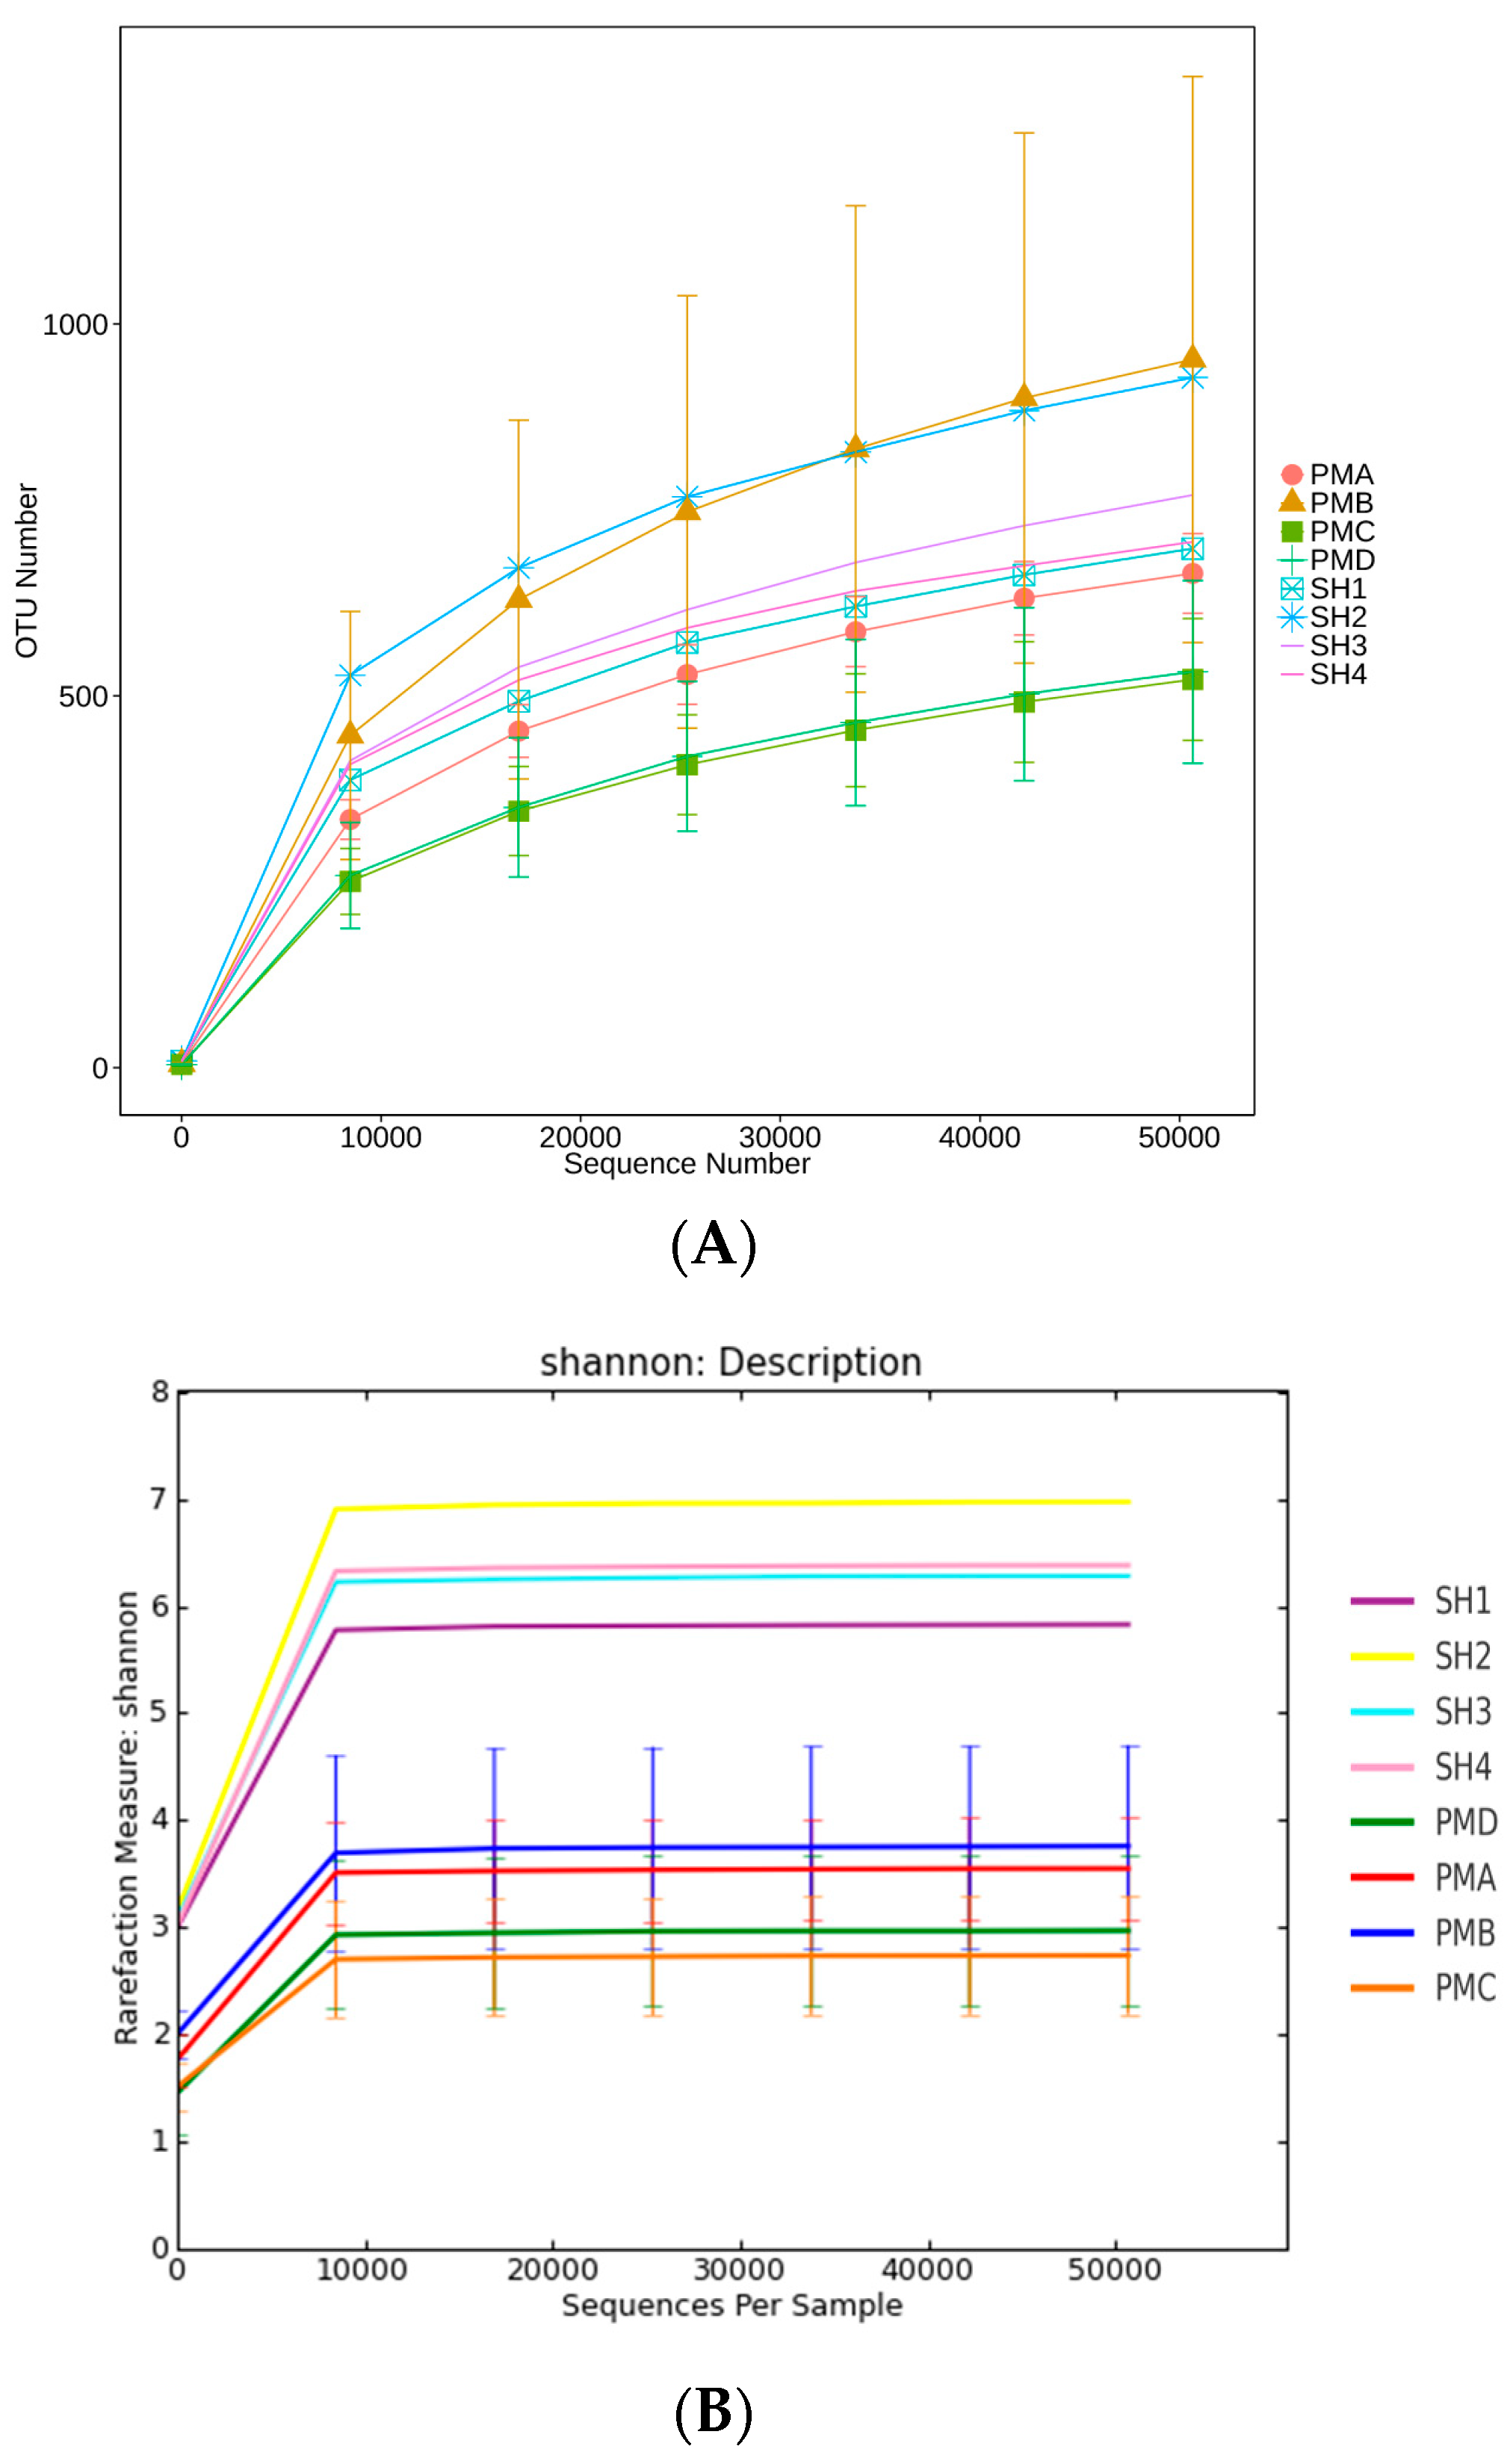
The rarefaction curve was plotted based on OTUs clustered at 97% similarity (Figure 5A). When the sequence number exceeded 40,000, the curves for all samples gradually approached a plateau, indicating that the sequencing depth was sufficient and the number of newly detected OTUs tended to stabilize. Further increases in sequencing reads would yield only a few additional OTUs, suggesting that the sequencing effort adequately captured the majority of bacterial diversity within the samples.
Similarly, the Shannon diversity curve (Figure 5B) reached a stable phase when the sequence count exceeded 10,000, demonstrating that the sequencing data were abundant enough to represent the vast majority of microbial information in each sample.
Collectively, these results confirm that the sequencing depth and data quality were both sufficient for comprehensive analysis of bacterial community diversity, and additional sequencing would not significantly alter the observed diversity patterns.

3.5.3. Species Similarity Analysis

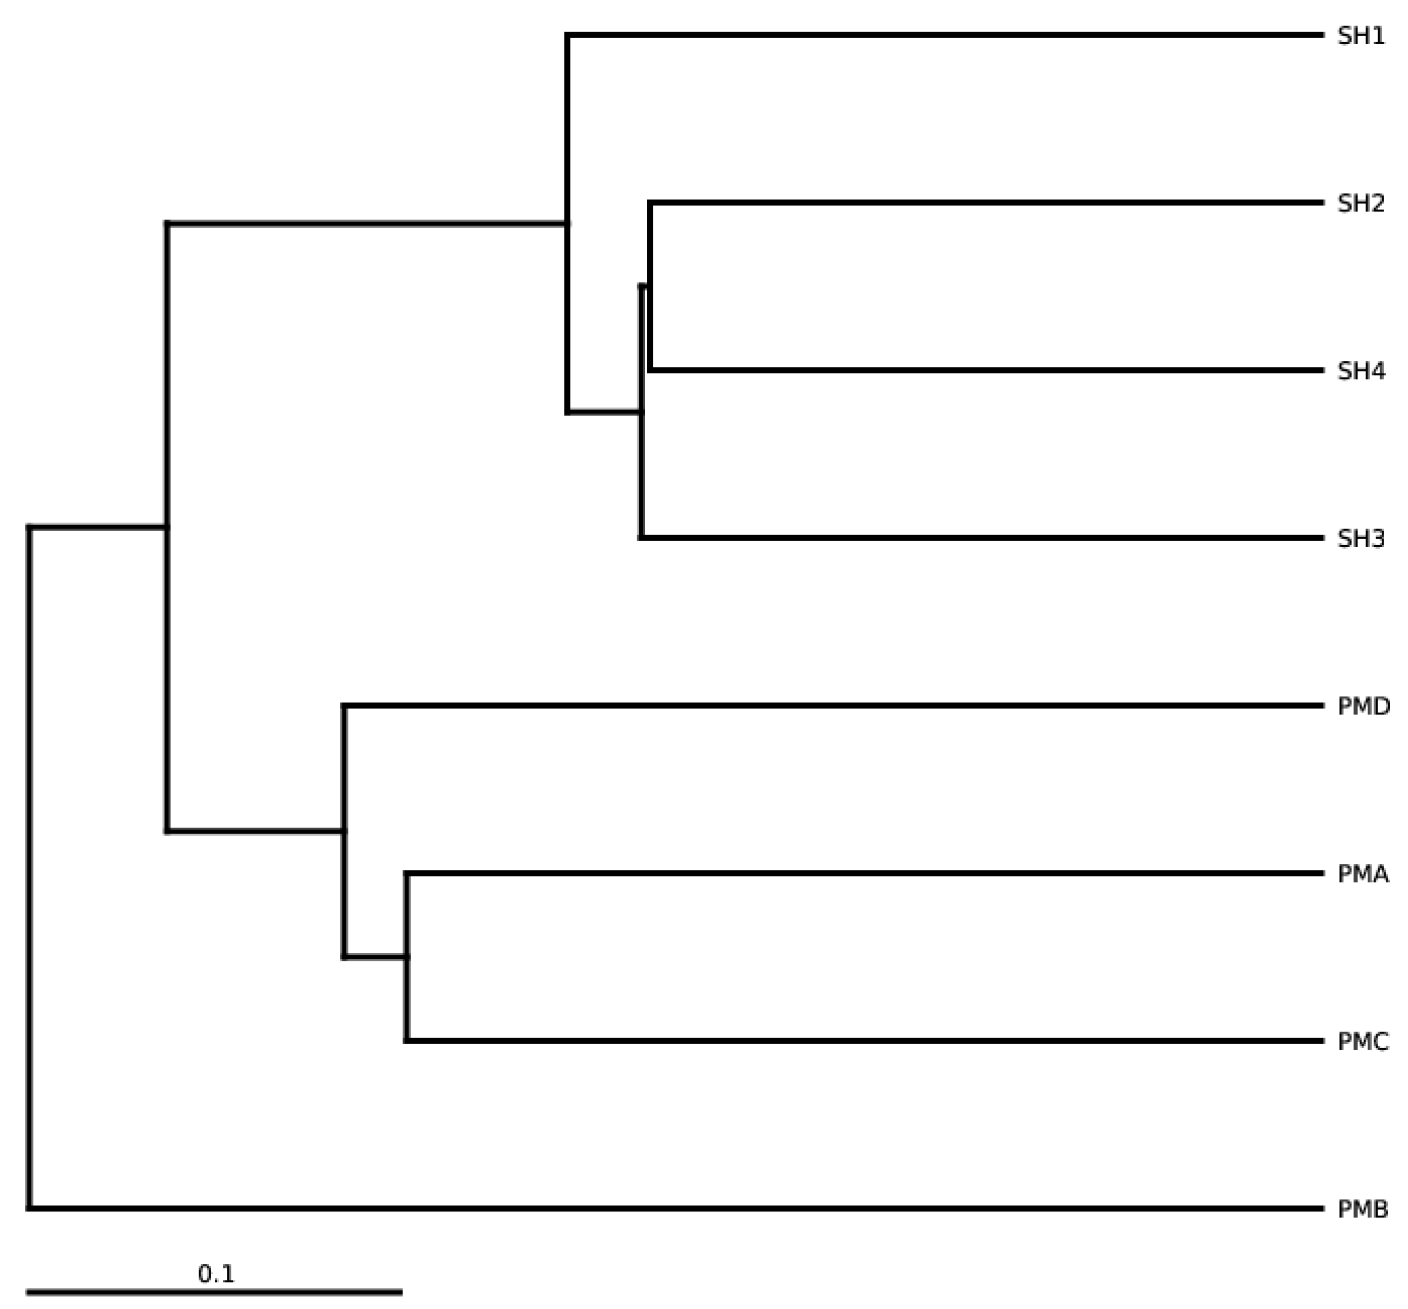
Based on the unweighted UniFrac distance matrix among multiple communities, an unweighted hierarchical clustering tree (Figure 6) was constructed to illustrate the phylogenetic relationships among samples. The clustering results revealed that the PMB intestinal group branched earliest and showed clear separation from all other groups, indicating a distinct microbial community structure during this stage. Subsequently, the pond-water samples clustered together and separated from the remaining three intestinal groups of P. monodon.
These patterns suggest that although the intestinal and aquatic microbial communities shared certain phylogenetic similarities, notable compositional differences remained between the two habitats. Among all samples, SH2 and SH4 as well as PMA and PMC exhibited the closest branch relationships, reflecting the highest degree of species similarity within their respective environments.

4. Discussion

4.1. Water Quality Index Data Analysis

From July to September, nutrient accumulation in the ponds became increasingly pronounced, despite the pH remaining within 7.5–8.1, a range considered acceptable for shrimp culture. The elevated concentrations of nitrogen and phosphorus suggest an increasing risk of eutrophication. Previous studies have established thresholds of total phosphorus (TP) for eutrophication control. For instance, Qi et al. propose target values of soluble reactive phosphorus < 0.05 mg·L−1, and others have reported TP thresholds around 0.03–0.05 mg·L−1 in similar waterbodies [26]. Some studies using stress–response approaches have derived TP thresholds as low as 0.039 mg·L−1 in fluvial systems [27].
In our study, the measured TP in the late stage exceeded these benchmarks, reinforcing concerns about eutrophic onset. High nitrogen and phosphorus levels can exacerbate dissolved oxygen (DO) fluctuations through enhanced primary productivity followed by increased organic matter decomposition. Wani et al. highlight that excess nutrients from aquaculture systems lead to algal blooms, which upon decay consume DO and impair water quality [28].
In pond systems, such DO depletion may stress P. monodon, reduce growth performance, and create favorable conditions for opportunistic or pathogenic bacteria (e.g., Vibrio spp.). Moreover, elevated nitrogen can shift microbial community composition, as demonstrated in coastal aquaculture zones where high N loading altered bacterial functional responses [29].
Compared with prior studies in intensive shrimp culture, our findings align with reports that nutrient accumulation leads to deteriorating water quality and disease risk in the later culture period. To mitigate these risks, management strategies such as sediment remediation, probiotics addition, and optimized feed regimes are recommended to enhance water self-purification and stabilize ecosystem dynamics.

4.2. OTU Cluster Analysis of Prawn Gut and Its Aquaculture Water Body

At the OTU level, the intestinal and water-associated microbial communities of P. monodon showed clear clustering separation. Previous studies have demonstrated that the gut microbiota of shrimp is significantly different from the microbial assemblages of pond water, often forming distinct clusters in ordination analyses [30]. The rearing water generally harbors a more complex and diverse microbiota, whereas the intestinal community undergoes host-driven selection and colonization, leading to relatively lower diversity [30]. For example, comparisons between indoor and outdoor pond systems revealed that water samples displayed higher microbial richness and diversity than gut samples [30].
However, differences in OTU numbers among developmental stages (e.g., 1119 in the PMB group and 638 in the PMC group) may not only reflect changes in intestinal microbial activity but are also closely linked to environmental nutrient dynamics. During the SH2 stage, elevated TN and TP levels likely promoted microbial proliferation in pond water, as also reported in Litopenaeus vannamei systems under nutrient enrichment [31]. This increased environmental microbial pressure can enhance the colonization potential of exogenous taxa, leading to higher intestinal OTU richness during more dynamic stages (e.g., PMB), whereas reduced diversity in the PMC stage may indicate environmental stabilization. Similar correlations between water nutrient status and shrimp intestinal microbial diversity have been observed in greenhouse farming systems, where NH3-N+, TN, and TP significantly influence gut microbial composition [32]. Furthermore, physiological studies of shrimp under nitrogen and phosphorus stress revealed oxidative stress and altered immune responses, confirming that excessive nutrient loading can indirectly affect host-microbe interactions [33].
Nevertheless, the gut and water microbiota are not completely independent and share a number of common OTUs. Several dominant bacterial genera are consistently detected in both habitats, suggesting that the rearing water contributes to the intestinal community as a potential source of colonists [34,35]. Studies of early developmental stages of P. monodon confirmed that the gut and water shared several major genera across time, though some groups remained unique to either the intestine or water [35]. This indicates that the pond environment strongly shapes the composition of intestinal microbes, but host filtering ensures that only a subset of environmental taxa can successfully colonize the gut [35]. Overall, while gut and water samples tend to cluster separately at the OTU level, the presence of shared OTUs highlights microbial exchange between the host and its environment [35]. This close relationship emphasizes the importance of maintaining nutrient balance and microbial stability: a healthy and balanced pond microbiome provides beneficial microbial sources for shrimp, whereas eutrophication or environmental dysbiosis can destabilize the intestinal community and impair shrimp health [36].

4.3. Analysis and Discussion on the Structure of Intestinal Flora of Penaeus Prawn and Its Aquaculture Water

In this study, high-throughput sequencing on the Illumina platform was employed to characterize the microbial communities in the intestines of P. monodon and in its rearing water. The results revealed a clear ecological linkage between the intestinal microbiota and the surrounding pond environment. Nutrient enrichment, reflected by elevated nitrogen and phosphorus concentrations, not only increased the risk of algal blooms but also triggered cascading effects on microbial community dynamics. The accumulation of organic matter and eutrophic conditions likely enhanced bacterial proliferation and altered the taxonomic structure of both waterborne and intestinal communities, facilitating microbial exchange between habitats and reshaping their ecological interactions.
A number of common bacterial genera were detected in both intestinal and water samples from the polyculture pond (Table 3), including Vibrio, Shewanella, Aeromonas, Pseudomonas, and Actinobacteria, which ranked among the top ten in relative abundance, as well as other shared taxa such as Hydrogenophaga, Photobacterium, and Brevinema. These genera comprise both commensal and potentially pathogenic members, among which Vibrio was the most abundant and ecologically significant.
Bacteria of the genus Vibrio play a dual role in the shrimp gut, acting as both commensals and opportunistic pathogens. Under normal conditions, Vibrio constitutes a natural and often abundant component of the intestinal microbiota. This striking enrichment strongly suggests that the shrimp intestinal environment exerts a powerful selective pressure, favoring the colonization and proliferation of specific Vibrio strains. This host-driven selection could be attributed to the unique nutritional landscape [37], the anaerobic conditions of the hindgut [38], or a state of immune tolerance established between the host and its commensal microbiota [39]. Consequently, the pond water serves as a source pool, but the final community structure is sculpted by host-specific factors. This contrast supports the view that while the rearing water provides a microbial source pool, the shrimp intestine selectively favors Vibrio colonization through specific ecological and physiological filters. Similar host-mediated selection has been reported in other crustaceans, where environmental strains establish commensal populations only under favorable host conditions [40].
However, under adverse environmental conditions or when host immunity is compromised, commensal Vibrio can shift into an opportunistic pathogen. Many shrimp diseases including acute hepatopancreatic necrosis disease (AHPND) and white spot syndrome virus (WSSV) are associated with drastic increases in intestinal Vibrio abundance [41]. During such dysbiosis, Vibrio can dominate over 90% of total bacterial reads, while beneficial taxa disappear, disrupting intestinal homeostasis and promoting disease onset. Environmental stressors such as low salinity, nutrient accumulation, and hypoxia further stimulate Vibrio proliferation and virulence expression [42].
Conversely, adequate levels of beneficial commensals and host immune regulation can suppress Vibrio pathogenicity. Shrimp rely on antimicrobial peptides and innate immune mechanisms to maintain microbial balance; for instance, crustin peptides in Litopenaeus vannamei inhibit Vibrio parahaemolyticus colonization, and gene silencing experiments have shown that the absence of these peptides results in excessive Vibrio growth and disease development [43]. Furthermore, competitive interactions within the gut microbiota also help constrain Vibrio expansion-lactic acid bacteria and Bacillus spp. produce inhibitory metabolites or occupy ecological niches that limit pathogen establishment [44].
Collectively, these results demonstrate that Vibrio is both a resident and conditionally pathogenic taxon: beneficial under balanced environmental and immune states, yet capable of dominating the gut ecosystem and driving disease outbreaks when ecological stability is disrupted. The strong difference in Vibrio abundance between intestinal (61.48–66.52%) and water (2.45–13.15%) samples underscores that environmental input alone cannot explain its dominance; rather, host selection, nutrient dynamics, and microbial competition together determine the final community composition. Maintaining pond water quality and intestinal homeostasis is therefore crucial to mitigate Vibrio-associated risks in shrimp aquaculture.

4.4. Analysis of Microbial Diversity in Prawn Intestine and Its Aquaculture Water

The alpha diversity of the shrimp gut microbiota was strongly influenced by host developmental stage and environmental conditions. During normal growth, intestinal diversity generally increased with age [45]. Longitudinal studies demonstrated that the gut community undergoes dynamic establishment in early life stages, followed by a gradual increase in richness and stability as shrimp matured [46]. For example, the intestinal microbiota of black tiger shrimp exhibited higher richness and diversity in adults compared to juveniles, consistent with a more resilient and stable gut ecosystem [47].
Conversely, environmental stressors or disease outbreaks can sharply reduce gut diversity [48]. Sudden changes in salinity or temperature lead to significant declines in richness and diversity indices [49]. Under salinity stress, shrimp exhibited fewer microbial taxa and reduced Shannon diversity, coinciding with overgrowth of potential pathogens [50]. Similarly, diseased shrimp displayed markedly lower diversity compared to healthy individuals. In AHPND cases, the Shannon index of infected shrimp dropped by more than 50% relative to controls, indicating severe dominance by a single group (Vibrio) [51]. Reduced diversity disrupts gut ecological stability, diminishes functional redundancy, and weakens host resilience against pathogens and environmental fluctuations [52].
In contrast, more diverse microbiota confer functional breadth and stability, enabling suppression of opportunistic bacteria and providing comprehensive metabolic support for the host [53]. Thus, maintaining higher gut microbial diversity is widely regarded as a cornerstone of shrimp health and disease resistance. From a farming perspective, avoiding sudden environmental changes and applying probiotics or prebiotics to sustain community diversity are practical strategies to stabilize shrimp gut ecosystems [54]. In summary, the alpha diversity of P. monodon intestinal microbiota increases during host development, but declines under environmental stress or disease. Maintaining diversity and stability is critical for host resilience and aquaculture sustainability.

4.5. Limitations and Future Directions

This study was limited to a two-month culture period (July–September), which did not include overwintering or temperature-stress phases that could affect microbial dynamics. The experiment also focused on P. monodon within a polyculture system but did not assess the potential microbial interactions with other species such as koi or carp, which may influence nutrient cycling and microbial structure. Future work should extend sampling to cover seasonal variations, quantify functional microbial pathways using metagenomics or metabolomics, and experimentally verify host–microbiota–environment interactions under controlled nutrient and stress gradients. This will provide a deeper understanding of microbial resilience mechanisms and inform strategies for ecological regulation and sustainable shrimp aquaculture.

5. Conclusions

This study demonstrated that the intestinal microbiota of P. monodon and the bacterial communities in polyculture pond water are closely linked yet distinct. Water quality parameters showed gradual changes across the culture cycle, with increasing nitrogen and phosphorus compounds indicating a higher risk of eutrophication in later stages. High-throughput sequencing revealed more than 350 OTUs in both gut and water samples, with 166 OTUs shared, reflecting both environmental seeding and host selection. Water samples exhibited higher richness and complexity, while shrimp intestines were dominated by specific taxa such as Vibrio, which play both commensal and opportunistic roles depending on environmental and host conditions. Alpha diversity patterns indicated that gut microbial diversity peaked during active growth stages and declined under stress or potential dysbiosis. Together, these findings underscore the ecological importance of gut–water microbial interactions in aquaculture systems. Effective pond management, including the maintenance of stable water quality and microbial balance, is therefore essential for sustaining shrimp health, reducing the risk of opportunistic pathogen outbreaks, and promoting the sustainable development of P. monodon culture.

Author Contributions

Conceptualization, methodology, and writing—original draft preparation, X.S. and Z.F.; investigation, H.Y.; formal analysis, H.Z. and Y.Y.; visualization, data curation and project administration, F.Z., Y.G. and C.C.; writing—review and editing, validation, resources, supervision and funding acquisition, L.Z. and Y.T. All authors have read and agreed to the published version of the manuscript.

Funding

This study was funded by the Supported by China Agriculture Research System (CARS-47), Tianjin Marine Aquaculture Industry Technology System Innovation Team Development Project (ITTMRS2021000), Tianjin Science and Technology Plan Project (19YFZCSN00430) and Tianjin Higher Education Basic Research Funding (2021DZ006).

Institutional Review Board Statement

The animal study protocol was approved by the accordance with National Standard of the People’s Republic of China: Laboratory animal—Guideline for ethical review of animal welfare (GB/T 35892-2018) [55] on 6 February 2020.

Data Availability Statement

The original contributions presented in this study are included in the article. Further inquiries can be directed to the corresponding authors.

Acknowledgments

We thank all the students who participated in the field work and laboratory analysis.

Conflicts of Interest

The authors declare no conflicts of interest.

References

  1. Naylor, R.L.; Hardy, R.W.; Buschmann, A.H.; Bush, S.R.; Cao, L.; Klinger, D.H.; Little, D.C.; Lubchenco, J.; Shumway, S.E.; Troell, M. A 20-year retrospective review of global aquaculture. Nature 2021, 591, 551–563. [Google Scholar] [CrossRef]
  2. Zeng, S.; He, J.; Huang, Z. The intestine microbiota of shrimp and its impact on cultivation. Appl. Microbiol. Biotechnol. 2024, 108, 362. [Google Scholar] [CrossRef]
  3. Asmild, M.; Hukom, V.; Nielsen, R.; Nielsen, M. Is economies of scale driving the development in shrimp farming from Penaeus monodon to Litopenaeus vannamei? The case of Indonesia. Aquaculture 2024, 579, 740178. [Google Scholar] [CrossRef]
  4. Emmanuel, A.; Wei, Y.; Ramzan, M.N.; Yang, W.; Zheng, Z. Dynamics of Bacterial Communities and Their Relationship with Nutrients in a Full-Scale Shrimp Recirculating Aquaculture System in Brackish Water. Animals 2025, 15, 1400. [Google Scholar] [CrossRef]
  5. Zoqratt, M.Z.H.M.; Eng, W.W.H.; Thai, B.T.; Austin, C.M.; Gan, H.M. Microbiome Analysis of Pacific White Shrimp Gut and Rearing Water from Malaysia and Vietnam. PeerJ 2018, 6, e5826. [Google Scholar] [CrossRef]
  6. Abakari, G.; Wu, X.; He, X.; Fan, L.; Luo, G. Bacteria in Biofloc Technology Aquaculture Systems: Roles and Mediating Factors. Rev. Aquac. 2022, 14, 1260–1284. [Google Scholar] [CrossRef]
  7. Holt, C.C.; Bass, D.; Stentiford, G.D.; van der Giezen, M. Understanding the Role of the Shrimp Gut Microbiome in Aquaculture. J. Invertebr. Pathol. 2021, 186, 107387. [Google Scholar] [CrossRef] [PubMed]
  8. Fan, J.; Chen, L.; Mai, G.; Zhang, H.; Yang, J.; Deng, D.; Ma, Y. Dynamics of the gut microbiota in developmental stages of Litopenaeus vannamei reveal its association with body weight. Sci. Rep. 2019, 9, 5182. [Google Scholar] [CrossRef]
  9. Imaizumi, K.; Sakamoto, R.; Inoue, Y.; Yamada, T.; Wada, M. Analysis of Microbiota in the Stomach and Midgut of Two Penaeid Shrimps during Probiotic Feeding. Sci. Rep. 2021, 11, 9936. [Google Scholar] [CrossRef] [PubMed]
  10. Cardona, E.; Gueguen, Y.; Magré, K.; Lorgeoux, B.; Piquemal, D.; Pierrat, F.; Noguier, F.; Saulnier, D. Bacterial Community Characterization of Water and Intestine of the Shrimp Litopenaeus stylirostris in a Biofloc System. BMC Microbiol. 2016, 16, 157. [Google Scholar] [CrossRef]
  11. Angthong, P.; Uengwetwanit, T.; Uawisetwathana, U.; Chaitongsakul, P.; Karoonuthaisiri, N. Investigating Host–Gut Microbial Relationship in Penaeus monodon upon Exposure to Vibrio harveyi. Aquaculture 2023, 567, 739252. [Google Scholar] [CrossRef]
  12. Cornejo-Granados, F.; Lopez-Zavala, A.A.; Gallardo-Becerra, L.; Poot-Hernández, A.C.; Sánchez-Flores, A. Host genome drives the microbiota enrichment of beneficial microbes in shrimp: Exploring the hologenome perspective. Anim. Microbiome 2025, 7, 50. [Google Scholar] [CrossRef] [PubMed]
  13. Chang, Y.T.; Ko, H.T.; Wu, P.L.; Kumar, R.; Wang, H.C.; Lu, H.P. Gut microbiota of Pacific white shrimp (Litopenaeus vannamei) exhibits distinct responses to pathogenic and non-pathogenic Vibrio parahaemolyticus. Microbiol Spectr. 2023, 11, e0118023. [Google Scholar] [CrossRef] [PubMed]
  14. Liu, Q.; Gao, Y.; Wang, C.; Zeng, Y.; Lai, Z. Proportions of Pacific white shrimp, Litopenaeus vannamei, gut microbiota from ambient microbiota increased with aquaculture process. J. World Aquac. Soc. 2023, 54, 982–993. [Google Scholar] [CrossRef]
  15. Khanjani, M.H.; Khanjani, M.; Mozanzadeh, M.; Gisbert, E.; Hoseinifar, S. Probiotics, prebiotics, and synbiotics in shrimp aquaculture: Their effects on growth performance, immune responses, and gut microbiome. Aquac. Rep. 2024, 38, 102362. [Google Scholar] [CrossRef]
  16. Hou, D.; Huang, Z.; Zeng, S.; Liu, J.; Wei, D.; Yan, Q. Intestine Bacterial Community Composition of Shrimp Varies under Low- and High-Salinity Culture Conditions. Front. Microbiol. 2020, 11, 589164. [Google Scholar] [CrossRef]
  17. Cicala, F.; Lago-Lestón, A.; Gomez-Gil, B.; Escobedo-Bonilla, C.M.; Martínez-Porchas, M.; Rojas, R. Gut microbiota shifts in the giant tiger shrimp, Penaeus monodon, during the postlarvae, juvenile, and adult stages. Aquac. Int. 2020, 28, 1421–1433. [Google Scholar] [CrossRef]
  18. Raza, B.; Zheng, Z.; Zhu, J.; Yang, W. A Review: Microbes and Their Effect on Growth Performance of Litopenaeus vannamei (White Leg Shrimps) during Culture in Biofloc Technology System. Microorganisms 2024, 12, 1013. [Google Scholar] [CrossRef]
  19. Shan, X.Y.; Li, K.Y.; Stadler, P.; Borbor, M.; Reyes, G.; Solórzano, R.; Chamorro, E.; Bayot, B.; Cordero, O.X. Microbiome determinants of productivity in aquaculture of whiteleg shrimp. Appl Environ. Microbiol. 2025, 91, e02420-24. [Google Scholar] [CrossRef]
  20. Lin, X.Y.; Shih, Y.J.; Zhang, X.J.; Cai, Y.S.; Zhou, X.W.; Chen, J.S. Perspective on intestinal microbiota temporal changes of herbal additives treated shrimp in a natural aquaculture setting. Front. Mar. Sci. 2024, 11, 1332585. [Google Scholar] [CrossRef]
  21. Jatuyosporn, T.; Wongpanya, R.; Boonchuen, P.; Rungrassamee, W.; Karoonuthaisiri, N. White Spot Syndrome Virus Impact on the Expression of Vago and Gut Microbiome of the Black Tiger Shrimp (Penaeus monodon). Sci Rep. 2023, 13, 27906. [Google Scholar] [CrossRef] [PubMed]
  22. Huang, Z.; Zeng, S.; Xiong, J. Microecological Koch’s postulates reveal that intestinal microbiota dysbiosis contributes to shrimp white feces syndrome. Microbiome 2022, 8, 32. [Google Scholar] [CrossRef]
  23. Zhou, Z.; Huang, Z.; Zhang, Y.; Chen, X.; Zeng, S. Postlarval Shrimp-Associated Microbiota and Underlying Ecological Processes over AHPND Progression. Microorganisms 2025, 13, 720. [Google Scholar] [CrossRef]
  24. Li, M.; Chen, Y.; Luo, X.; Guo, L.; Zhang, J.; Wang, Q.; Xu, Z. Profile of the Gut Microbiota of Pacific White Shrimp under Industrial Indoor Farming System. Appl. Microbiol. Biotechnol. 2024, 108, 225–239. [Google Scholar] [CrossRef]
  25. Wang, Y.; Wang, X.; Gai, C.; Zhang, J.; Li, Y. WSSV Infection in the Gut Microbiota of the Black Tiger Shrimp Penaeus monodon. Fishes 2025, 10, 440. [Google Scholar] [CrossRef]
  26. Qi, J.; Deng, L.; Song, Y.; Qi, W.; Hu, C. Nutrient Thresholds Required to Control Eutrophication: Does It Work for Natural Alkaline Lakes? Water 2022, 14, 2674. [Google Scholar] [CrossRef]
  27. Wu, F.; Fang, Y.; Feng, M.; Xie, Z.; Zhu, L.; Feng, J. Developing Ecological Thresholds for Nitrogen and Phosphorus in the Haihe River Basin in China. Int. J. Environ. Res. Public Health 2022, 19, 16951. [Google Scholar] [CrossRef]
  28. Wani, A.K.; Akhtar, N.; Mir, T.U.; Rahayu, F.; Suhara, C.; Anjli, A.; Chopra, C.; Singh, R.; Prakash, A.; El Messaoudi, N.; et al. Eco-friendly and safe alternatives for the valorization of shrimp farming waste. Environ. Sci. Pollut. Res. 2024, 31, 38960–38989. [Google Scholar] [CrossRef] [PubMed]
  29. Lo, L.S.H.; Xu, Z.; Lee, S.S.; Lau, W.K.; Qiu, J.W.; Liu, H.; Qian, P.Y.; Cheng, J. How elevated nitrogen load affects bacterial community structure and nitrogen cycling services in coastal water. Front Microbiol. 2022, 13, 1062029. [Google Scholar] [CrossRef] [PubMed]
  30. Wu, L.; Shi, X.; Wang, J.; Zheng, X.; Qian, X.; Xie, S.; Tang, J. Elevated water nutrient levels promote co-occurrence of sediment microbiota in white-leg shrimp (Litopenaeus vannamei) culture ponds. Aquac. Rep. 2025, 45, 103121. [Google Scholar] [CrossRef]
  31. Li, H.; Gu, S.; Wang, L.; Shi, W.; Jiang, Q.; Wan, X. Dynamic Changes of Environment and Gut Microbial Community of Litopenaeus vannamei in Greenhouse Farming and Potential Mechanism of Gut Microbial Community Construction. Fishes 2024, 9, 155. [Google Scholar] [CrossRef]
  32. Zhao, Q.; Wei, C.; Dou, J.; Sun, Y.; Zeng, Q.; Bao, Z. Molecular and Physiological Responses of Litopenaeus vannamei to Nitrogen and Phosphorus Stress. Antioxidants 2025, 14, 194. [Google Scholar] [CrossRef] [PubMed]
  33. Duan, Y.; Huang, J.; Wang, Y.; Zhang, J. Characterization of Bacterial Community in Intestinal and Rearing Water of Penaeus monodon Differing Growth Performances in Outdoor and Indoor Ponds. Aquac. Res. 2020, 51, 4376–4387. [Google Scholar] [CrossRef]
  34. Angthong, P.; Uengwetwanit, T.; Arayamethakorn, S.; Chaitongsakul, P.; Karoonuthaisiri, N.; Rungrassamee, W. Bacterial Analysis in the Early Developmental Stages of the Black Tiger Shrimp (Penaeus monodon). Sci. Rep. 2020, 10, 4896. [Google Scholar] [CrossRef]
  35. Garibay-Valdez, E.; Martínez-Córdova, L.R.; López-Torres, M.A.; Almendariz-Tapia, F.J.; Martínez-Porchas, M.; Calderón, K. The Implication of Metabolically Active Vibrio spp. in the Digestive Tract of Litopenaeus vannamei for Its Post-Larval Development. Sci. Rep. 2020, 10, 11428. [Google Scholar] [CrossRef]
  36. Kawasaki, M.; Lo, T.H.W.; Lazzarotto, V.; Briggs, M.; Smullen, R.P.; Barnes, A.C. Biodiversity of the Intestinal Microbiota of Black Tiger Prawn (Penaeus monodon) Increases with Age and Is Only Transiently Impacted by Major Ingredient Replacement in the Diet. Aquac. Rep. 2022, 22, 100948. [Google Scholar] [CrossRef]
  37. Thomas, R.; Fukamizo, T.; Suginta, W. Bioeconomic Production of High-Quality Chitobiose from Chitin Food Wastes Using an In-House Chitinase from Vibrio campbellii. Bioresour. Bioprocess. 2022, 9, 86. [Google Scholar] [CrossRef]
  38. Gao, N.; Shu, Y.; Wang, Y.; Liu, J.; Zhang, M. Acute Ammonia Causes Pathogenic Dysbiosis of Shrimp Gut Biofilms. Int. J. Mol. Sci. 2024, 25, 2614. [Google Scholar] [CrossRef]
  39. Xiong, J.-B.; Sha, H.-N.; Chen, J. Updated Roles of the Gut Microbiota in Exploring Shrimp Etiology, Polymicrobial Pathogens, and Disease Incidence. Zool. Res. 2024, 45, 910–923. [Google Scholar] [CrossRef]
  40. Lv, X.; Li, S.; Yu, Y.; Zhang, X.; Li, F. Crustin Defense against Vibrio parahaemolyticus Infection by Regulating Intestinal Microbial Balance in Litopenaeus vannamei. Mar. Drugs 2023, 21, 130. [Google Scholar] [CrossRef] [PubMed]
  41. Chang, Y.-T.; Huang, W.-T.; Wu, P.-L.; Kumar, R.; Wang, H.-C.; Lu, H.-P. Low Salinity Stress Increases the Risk of Vibrio parahaemolyticus Infection and Gut Microbiota Dysbiosis in Pacific White Shrimp. BMC Microbiol. 2024, 24, 275. [Google Scholar] [CrossRef]
  42. Mat Deris, Z.; Iehata, S.; Gan, H.M.; Ikhwanuddin, M.; Najiah, M.; Asaduzzaman, M. Understanding the Effects of Salinity and Vibrio harveyi on the Gut Microbiota Profiles of Litopenaeus vannamei. Front. Mar. Sci. 2022, 9, 974217. [Google Scholar] [CrossRef]
  43. Shi, C.E.; Xia, M.; Li, R.; Mu, C.; Zhang, L.; Liu, L.; Wang, C. Vibrio alginolyticus infection induces coupled changes of bacterial community and metabolic phenotype in the gut of swimming crab. Aquaculture 2019, 499, 251–259. [Google Scholar] [CrossRef]
  44. Thompson, J.; Weaver, M.A.; Lupatsch, I.; Shields, R.J.; Plummer, S.; Coates, C.J.; Rowley, A.F. Antagonistic activity of lactic acid bacteria against pathogenic vibrios and their potential use as probiotics in shrimp (Penaeus vannamei) culture. Front. Mar. Sci. 2022, 9, 807989. [Google Scholar] [CrossRef]
  45. Zhang, X.; Li, X.; Lu, J.; Qiu, Q.; Chen, J.; Xiong, J. Quantifying the importance of external and internal sources to the gut microbiota in juvenile and adult shrimp. Aquaculture 2021, 531, 735910. [Google Scholar] [CrossRef]
  46. Wang, Y.; Wang, K.; Huang, L.; Dong, P.; Hou, D.; Chen, H.; Lu, Z.; Zhang, D. Fine-scale succession patterns and assembly mechanisms of bacterial community of Litopenaeus vannamei larvae across the developmental cycle. Microbiome 2020, 8, 106. [Google Scholar] [CrossRef]
  47. Hembrom, P.S.; Deepthi, M.; Kannoth, S.; Reeja, N.; Antony, G.; Grace, T. Amplicon sequencing reveals growth-associated microbial communities in black tiger shrimp (Penaeus monodon). Microb. Pathog. 2025, 205, 107636. [Google Scholar] [CrossRef]
  48. Zeng, S.; Zhang, J.; Xu, J. Warming-Driven Migration of Enterotypes Mediates Host Health and Disease Statuses in Ectotherm Litopenaeus vannamei. Commun. Biol. 2025, 8, 455. [Google Scholar] [CrossRef] [PubMed]
  49. Sha, H.; Lu, J.; Chen, J.; Xiong, J.B. Rationally designed probiotics prevent shrimp white feces syndrome via the probiotics–gut microbiome–immunity axis. npj Biofilms Microbiomes 2024, 10, 40. [Google Scholar] [CrossRef] [PubMed]
  50. Zhu, X.Y.; Xing, Y.F.; Zheng, X.T.; Huang, J.H.; Qin, J.; Zhang, J.S. The effects of thermal stress on the morphology, physiological functions, gut microbiota, and metabolism of Penaeus vannamei under seawater and low-salinity conditions. Aquaculture 2025, 612, 743188. [Google Scholar] [CrossRef]
  51. Dong, P.; Guo, H.; Wang, Y.; Wang, R.; Chen, H.; Zhao, Y.; Zhang, D. Gastrointestinal microbiota imbalance is triggered by the enrichment of Vibrio in subadult Litopenaeus vannamei with acute hepatopancreatic necrosis disease. Aquaculture 2021, 533, 736199. [Google Scholar] [CrossRef]
  52. Xiong, J.; Zhu, J.; Dai, W.; Dong, C.; Qiu, Q.; Li, C. Integrating gut microbiota immaturity and disease-discriminatory taxa to diagnose the initiation and severity of shrimp disease. Environ. Microbiol. 2017, 19, 1490–1501. [Google Scholar] [CrossRef]
  53. Zhang, S.; Sun, X. Core gut microbiota of shrimp function as a regulator to maintain immune homeostasis in response to WSSV infection. Microbiol. Spectr. 2022, 10, e02465-21. [Google Scholar] [CrossRef] [PubMed]
  54. Li, E.; Xu, C.; Wang, X.; Wang, S.; Zhao, Q.; Zhang, M.; Chen, L. Gut Microbiota and its Modulation for Healthy Farming of Pacific White Shrimp Litopenaeus vannamei. Rev. Fish. Sci. Aquac. 2018, 26, 381–399. [Google Scholar] [CrossRef]
  55. GB/T 35892-2018; Laboratory animal–Guideline for ethical review of animal welfare. General Administration of Quality Supervision, Inspection and Quarantine of the People’s Republic of China. Standardization Administration of the People’s Republic of China: Beijing, China, 2018.
Figure 1. OTU distribution and shared community analysis based on petal and Venn diagrams.
Water 17 03194 g001
Figure 2. Histogram of the relative abundance of top 10 species at the phylum level.
Water 17 03194 g002
Figure 3. Clustering heat map of species abundance at order level.
Water 17 03194 g003
Figure 4. Histogram of relative abundance of top 30 species at the genus level.
Water 17 03194 g004
Figure 5. Analysis of dilution curve (A) and Shannon curve (B).
Water 17 03194 g005
Figure 6. Unweighted species evolutionary tree.
Water 17 03194 g006
Table 1. Water quality index data.
Sampling PhasepHNH3-N
(mg·L−1)
NO2-N
(mg·L−1)
NO3-N
(mg·L−1)
PO43−-P
(mg·L−1)
TN (mg·L−1)TP (mg·L−1)
SH18.1 ± 0.02 a0.11 ± 0.01 d0.01 ± 0.02 a0.51 ± 0.02 c0.05 ± 0.012 c0.71 ± 0.02 d0.08 ± 0.05 c
SH27.8 ± 0.01 b0.25 ± 0.01 c0.02 ± 0.02 a0.75 ± 0.03 b0.11 ± 0.02 b1.34 ± 0.02 c0.15 ± 0.02 b
SH37.6 ± 0.04 bc0.33 ± 0.02 b0.02 ± 0.01 a1.18 ± 0.01 a0.27 ± 0.06 a1.53 ± 0.02 b0.31 ± 0.03 a
SH47.5 ± 0.02 c0.51 ± 0.02 a0.04 ± 0.02 a1.22 ± 0.02 a0.34 ± 0.07 a1.86 ± 0.02 a0.36 ± 0.02 a
Note: Different superscript letters (a–d) within the same row indicate significant differences among sampling stages (p < 0.05).
Table 2. Statistical table of sample sequence.
Sample NamesValid SequenceAvg Len (nt)Q20Q30GC%Effective%
PMA84,06725399.1298.2352.9088.77
PMB85,09325399.2998.5852.3289.15
PMC84,92225399.3498.6552.9492.32
PMD84,45625399.3098.5953.1090.51
SH189,20325399.3498.6053.8091.43
SH284,36525399.3498.6153.5794.68
SH387,80825399.3198.5853.4993.27
SH479,68125399.3198.5753.3390.74
Table 3. Statistical table of OTUs clustering and annotation.
Sample NamesTotal_tagTaxon_TagUnique_TagOTU_num
PMA81,85380,7781069784
PMB75,18273,77514071119
PMC79,88279,326555638
PMD81,85781,259596651
SH183,17380,5542617812
SH281,58379,31722661071
SH383,68881,5462142881
SH473,98371,7252258821
Table 4. The proportion of the top ten dominant bacteria genera in the gut of Penaeus monodon and cultured water.
ClassificationPMAPMBPMCPMDSH1SH2SH3SH4
Vibrio genus
Candidatus_Bacilloplasma
61.48%46.51%66.48%66.52%9.04%2.45%7.83%13.15%
Candidatus0.99%13.87%3.38%1.19%0.00%0.01%0.00%0.00%
Vogesella0.01%0.00%0.00%0.00%20.92%0.66%0.67%0.72%
Shewanella2.54%2.88%1.99%9.10%1.71%0.59%1.96%9.07%
Aeromonas spp.4.61%8.87%9.76%3.12%1.09%0.42%0.95%1.02%
Microcystis0.03%0.02%0.51%0.03%0.69%0.93%11.76%2.21%
Pseudomonas1.65%0.32%1.01%2.09%11.21%3.05%10.04%10.43%
Cetobacterium sporomonas3.27%0.44%0.16%0.20%0.36%0.03%0.01%0.46%
Acinetobacter Actinomyces0.70%5.46%0.94%0.54%8.39%1.71%2.11%2.17%
Others24.70%21.63%15.75%17.21%45.25%82.92%63.03%58.62%
Table 5. Analysis of Alpha diversity index.
Sample GroupShannonSimpsonchao1ACEGoods_Coverage
PMA3.5490.674784.482829.3190.996
PMB3.7580.7441192.5091226.5360.994
PMC2.7380.577691.362694.1260.997
PMD2.970.625687.119709.2960.997
SH15.8250.94915.686900.2210.996
SH26.9710.9811114.6671133.2180.996
SH36.2790.9671060.0111036.4740.995
SH46.3780.971801.375830.5850.997
Disclaimer/Publisher’s Note: The statements, opinions and data contained in all publications are solely those of the individual author(s) and contributor(s) and not of MDPI and/or the editor(s). MDPI and/or the editor(s) disclaim responsibility for any injury to people or property resulting from any ideas, methods, instructions or products referred to in the content.