Article

Quantifying the Impact of Significant Wave Height on Mariculture Productivity: An Empirical Study in the Bohai and Yellow Seas

1
Shandong Key Laboratory of Marine Ecological Restoration, Shandong Marine Resource and Environment Research Institute, Yantai 264006, China
2
Observation and Research Station of Laizhou Bay Marine Ecosystem, MNR, Yantai 264006, China
3
The 54th Research Institution of CETC, Shijiazhuang 050081, China
*
Authors to whom correspondence should be addressed.
Water 2025, 17(21), 3165; https://doi.org/10.3390/w17213165
Submission received: 15 October 2025 / Revised: 30 October 2025 / Accepted: 1 November 2025 / Published: 5 November 2025
(This article belongs to the Section Water, Agriculture and Aquaculture)

Abstract

Accurately understanding the impact of Significant Wave Height (SWH) on mariculture productivity is crucial for developing a sustainable blue economy and mitigating the effects of increasing marine extreme events under climate change. However, a significant research gap exists in macroscale empirical tools capable of quantifying the complex, non-linear, and spatially non-stationary relationships between SWH and mariculture yield. Addressing this, our study focused on the Bohai and Yellow Seas, a critical mariculture region in China. We developed five novel SWH indices (LSDI, MSDI, HSDI, RSI, NDSI) to statistically link SWH with the Unit Area Yield (UAY) using buoy-calibrated ERA5 reanalysis data and regional fishery statistics. Geographically Weighted Regression (GWR) was further employed to uncover the spatial heterogeneity of this relationship. Results demonstrated that the Normalized Difference SWH Index (NDSI) most effectively captured the SWH-UAY relationship (r = 0.61, R2 = 0.37), as its non-linear form integrates the positive effects of low SWH conditions and the negative effects of high SWH conditions. GWR analysis revealed significant spatial non-stationarity, with the SWH impact on yield being stronger in the eastern and southern open waters of the Yellow Sea and weaker in the northern semi-enclosed Bohai Sea. The index framework and spatial analysis method developed in this study provide a transferable tool for quantifying the impact of physical oceanographic processes on mariculture productivity at a macro scale, which can offer a scientific basis for climate-resilient mariculture zoning and adaptive management.

1. Introduction

Ocean waves at the air–sea interface play a dual role as both influencers and mediators of momentum, energy, heat, and gas exchanges [1], making them critical research subjects in marine environmental science and aquaculture. Recent advances in ocean observation technologies and mariculture expansion have highlighted the ecological and economic significance of wave characteristics, particularly the significant wave height (SWH), which serves as a key parameter in defining “offshore aquaculture” and “exposed aquaculture” systems [2]. Under global climate change, coastal regions increasingly face extreme wave events [3], potentially altering site suitability for aquaculture operations in emerging climate scenarios [4].
Wave impacts on mariculture operate through multiple mechanisms. Marine dynamic processes such as waves, currents, and storm surges impose mechanical stress on aquaculture infrastructure, with high-intensity waves potentially damaging containment systems while escalating capital investments and operational costs [5,6]. Consequently, structural design loads and marine spatial planning frameworks typically incorporate extreme SWH values to ensure resilience against hydrodynamic impacts [7,8]. Simultaneously, wave-induced Stokes drift and turbulent energy dissipation enhance upper-ocean mixing [9], modifying thermal and salinity stratification while influencing nutrient cycling (nitrogen, carbon, and phosphate), dissolved oxygen distribution, and pollutant dispersion [10]. These alterations affect environmental carrying capacity and self-purification processes, ultimately shaping aquaculture productivity.
Direct biological impacts of wave exposure manifest through wave-modulated behavioral and physiological responses in marine organisms, such as altering the prevalence of virulent disease infections [11]. Experimental evidence demonstrates reduced seagrass survival under combined high-wave exposure and nutrient loading, with declines in growth metrics including internode abundance, elongation rates, and appearance frequencies [12]. Field observations from Jambiani village, Tanzania, reveal inverse correlations between seaweed production and wave intensity in cross-sectional studies [13], though spatial limitations constrain broader generalizations. Intense waves and currents may induce stress responses in mariculture crops; for instance, strong wave exposure significantly reduces byssal thread production in Mytilus edulis [14]. Overall, hydrodynamic processes can impact various physiological parameters of mariculture crops, including feeding, respiration, and excretion rates [15]. Moderate hydrodynamic conditions optimize nutrient supply, whereas extreme flows increase energy expenditure, retarding growth and reproduction [4].
Given these multidimensional impacts, wave parameters are essential in aquaculture yield and profit estimation. Contemporary bioeconomic models integrate environmental variables, such as water temperature, surface currents, and wave height, to project operational costs and profits for mussel, kelp, and finfish aquaculture [8]. However, current research prioritizes theoretical projections over empirical validation, creating quantification challenges in assessing SWH–productivity relationships.
SWH analysis requires the integration of multimodal data. While buoy measurements and satellite remote sensing provide complementary spatial–temporal coverage, resolution limitations persist: neither can simultaneously achieve high spatial–temporal resolution and broad spatial–temporal coverage [7]. Emerging solutions include the incorporation of GNSS reflectometry altimetry with reanalysis/hindcast models [16,17], though coastal accuracy remains constrained. Further data correction and testing are necessary. As wave height, bathymetry, and current velocity determine site suitability and species selection [2], understanding SWH patterns in critical regions like the Bohai and Yellow Seas becomes imperative for sustainable mariculture planning.
Current research assessing the impact of SWH on mariculture yield exhibits several gaps. These include the lack of an integrated perspective that combines physical drivers and socioeconomic effects, insufficient spatiotemporal characterization of SWH, and limited exploration of multifactorial SWH impacts on unit area yield (UAY), particularly through spatially explicit, long-term empirical studies. To bridge these gaps, this investigation focuses on the Bohai and Yellow Seas, a critical mariculture region in China. The objectives of this study are threefold: (1) to identify and evaluate the most effective statistical index for quantifying the macroscopic, non-linear relationship between the wave climate (represented by SWH) and mariculture productivity (UAY); (2) to characterize the spatial non-stationarity and underlying patterns of the SWH-UAY relationship across the regional seascape; and (3) to demonstrate the potential of the developed methodological framework for informing climate-resilient mariculture management and zoning. Therefore, we analyze buoy-calibrated SWH data and propose five index factors to quantify the relationship between SWH and UAY. By establishing a mechanistic framework that links physical processes to socioeconomic outcomes, our work provides a scientific basis for environmental management in aquaculture, mariculture planning, and adaptation to climate change.

2. Materials and Methods

2.1. Study Area

The investigation focused on the coastal waters surrounding the Shandong Peninsula (Figure 1), encompassing the Bohai and Yellow Seas (34°–42° N, 117°–124° E). Mariculture zones were delineated according to provincial marine spatial planning, as indicated by shaded areas in Figure 1.

2.2. Data Sources and Processing

This study employed the ERA5 reanalysis dataset from the European Centre for Medium-Range Weather Forecasts (ECMWF), widely validated for its accuracy in marine studies [18,19]. We utilized hourly SWH data (0.25° spatial resolution) spanning 2000–2023.
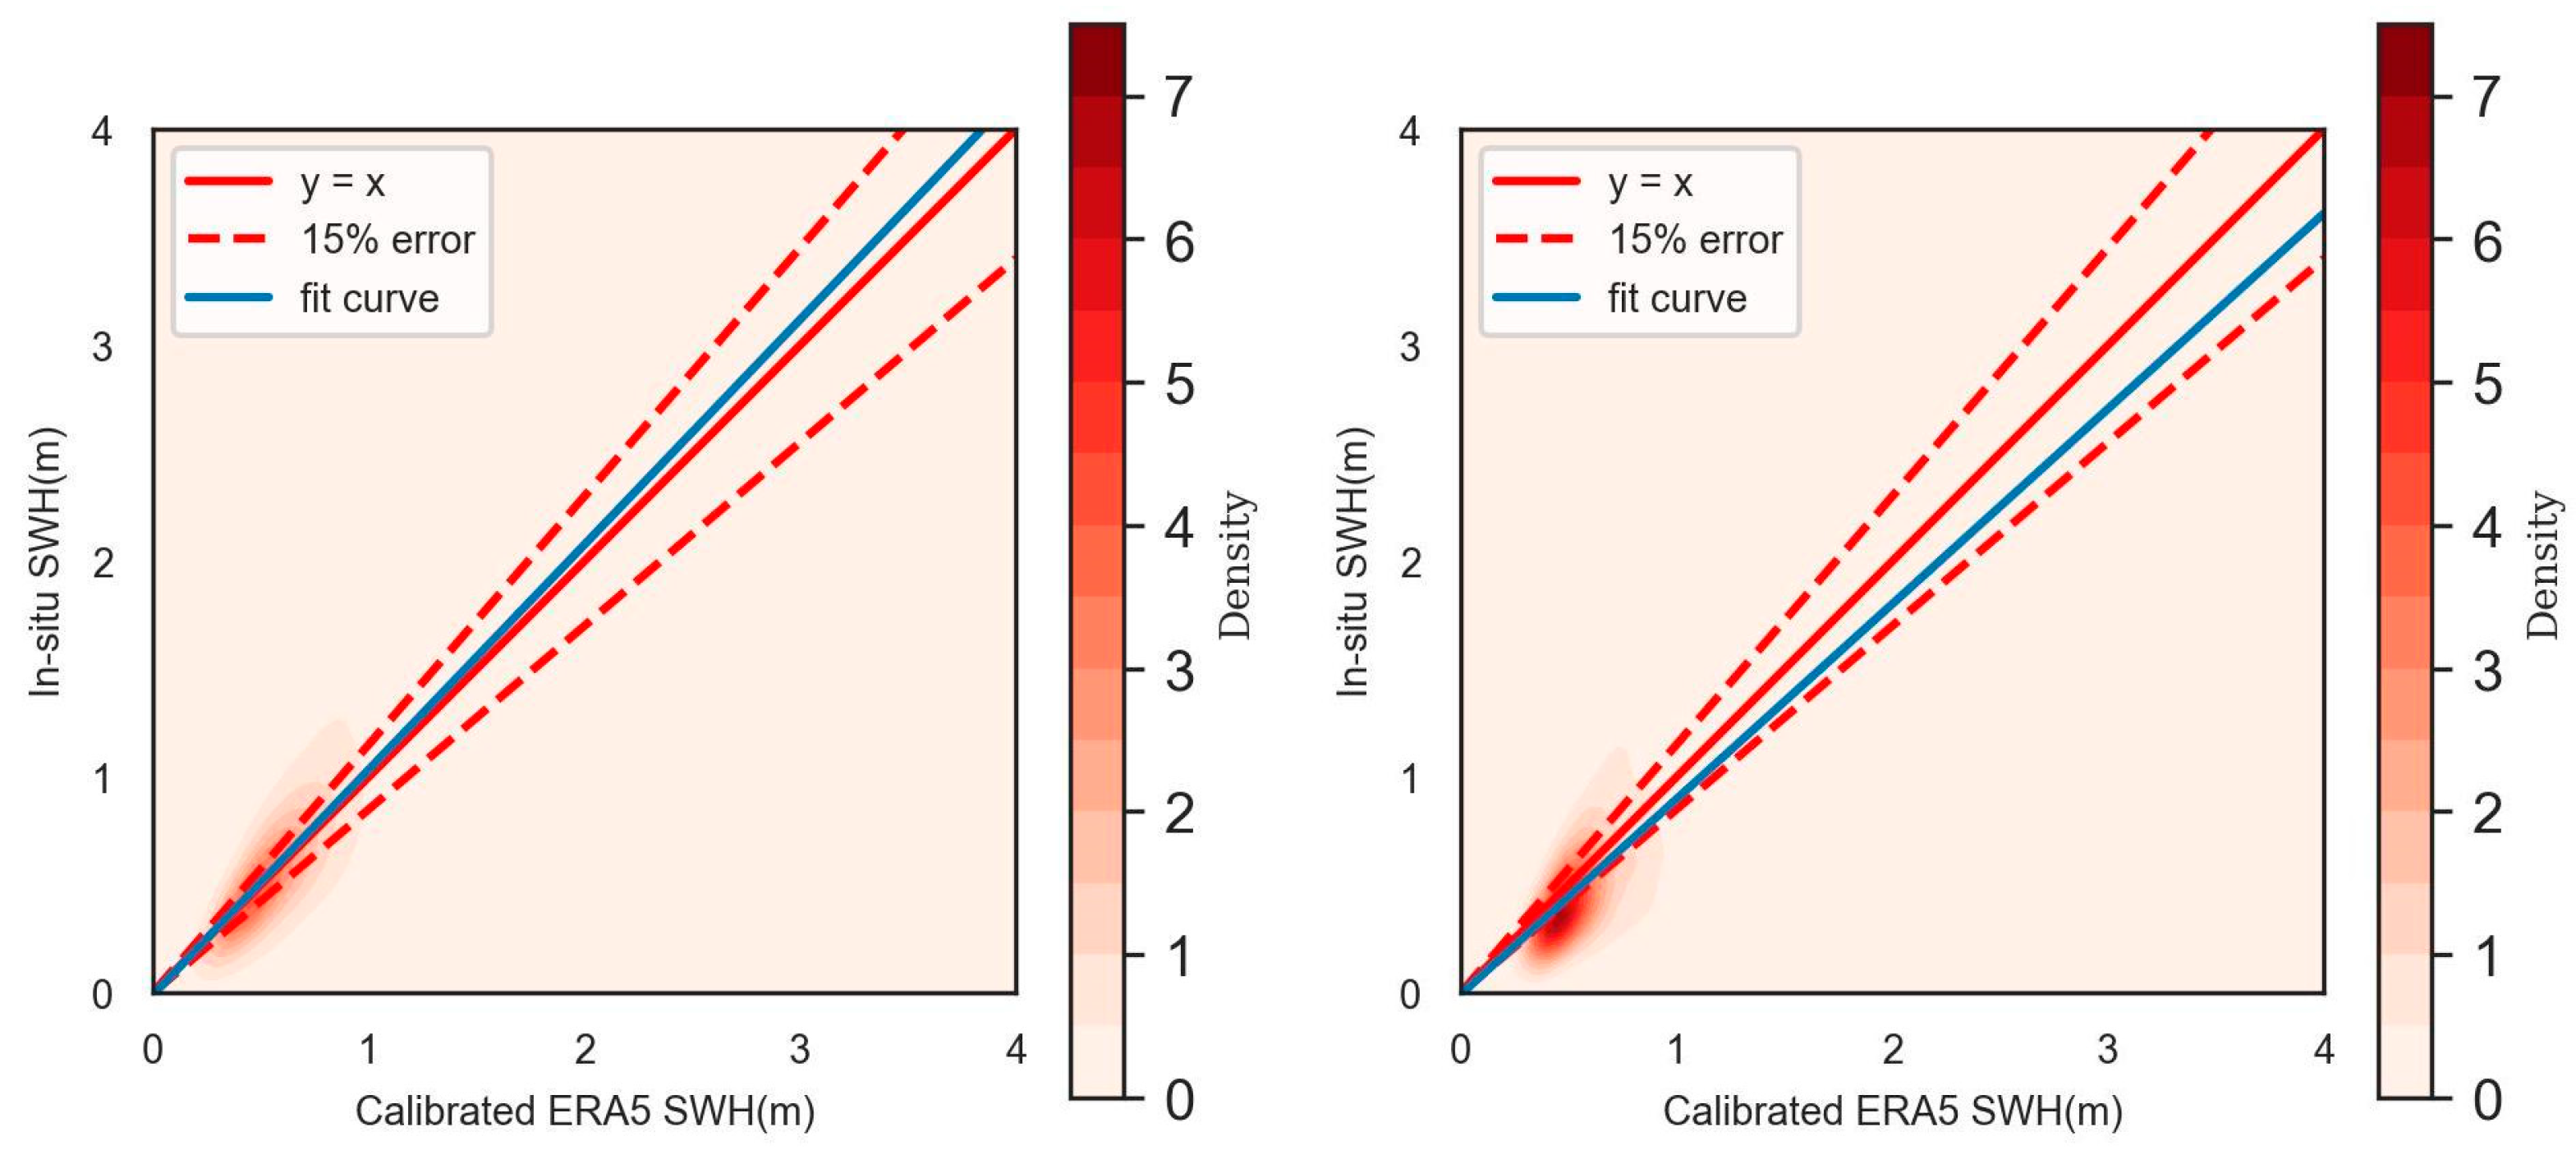
To enhance nearshore accuracy, ERA5 data were calibrated using hourly observations from two oceanic stations (indicated by triangular markers in Figure 1) over the period 2000–2023 sourced from the National Marine Data Center (https://mds.nmdis.org.cn/, accessed on 31 October 2025). Prior to calibration, a rigorous quality control protocol was implemented to remove physically implausible extremes, values that remained unchanged for ≥4 h, and outliers exceeding three standard deviations. Subsequent validation was conducted using two buoy datasets (indicated by circular markers in Figure 1) from the Oceanographic Data Center, Chinese Academy of Sciences (https://msdc.qdio.ac.cn/, accessed on 31 October 2025). Buoy B1_Weihai spans 1 January–31 October 2020, whereas buoy B2_Dongying covers 14 May–31 October 2020; both series are hourly. After quality control, 25,167 matched samples were retained for calibration and 3697 for validation. The calibration of the ERA5 SWH data was performed using a linear regression model, which is a scale-and-shift transformation. This linear transformation method utilizes a scale factor and a bias offset to map the ERA5 values onto the measurement scale of the buoy data, under the assumption that the error structure follows a linear hypothesis. It has been widely applied in the correction of various ocean remote sensing parameters [20].
Following the established methodology [19], we evaluated the accuracy of SWH using four statistical metrics: root mean square error (RMSE), scatter index (SI), Pearson correlation coefficient (Pearson’s r), and bias. The results are summarized in Table 1. Since Pearson’s r measures the strength of a linear relationship and is invariant under linear transformations, its value remained unchanged after calibration. The calibrated SWH data demonstrated improved regional applicability in Figure 2.
Annual mariculture production data (2017–2022) were sourced from authoritative reports published by the Shandong Provincial Bureau of Statistics and the Department of Agriculture and Rural Affairs. In this study, mariculture is operationally defined as aquaculture activities conducted seaward of the low tide line, aligning with official classification standards. UAY was derived by dividing total annual production by the corresponding mariculture area reported in these statistical records.

2.3. Methods

2.3.1. Geographically Weighted Regression (GWR)

The GWR framework accounts for spatial non-stationarity through location-specific parameter estimation:
y i = β 0 ( u i , v i ) + k β k ( u i , v i ) x i k + ε i
where (ui, vi) is the geographic coordinates of observation i, βk is spatially varying regression coefficients, and ϵ is the residual. We employed the golden section search algorithm to optimize the bandwidth selection, using the corrected Akaike Information Criterion (AIC) as the objective function. The bandwidth search was constrained to a range of 2–6 nearest neighbors, with the lower bound ensuring sufficient local observations for parameter estimation and the upper bound preventing the model from degenerating into a global regression. Model quality was assessed using several metrics, including residual sum of squares (RSSs), adjusted R2, AIC, and Bayesian information criterion (BIC).

2.3.2. Development of SWH Indices

This study employed government-designated marine functional planning zones as the analytical units for assessing the impact of SWH on mariculture (shaded areas in Figure 1). Although these zones did not precisely delineate mariculture boundaries, they encompass nearly all legitimate mariculture activities, excluding illegal operations. Spatial adjacency ensured effective assessment of regional correlations. For each zone and year, all hourly SWH data within the spatial extent of the zone were aggregated. Since mariculture yield data are reported annually, a dimensionality reduction in the grid-scale SWH time series was necessary. We characterized the annual wave climate of each zone by estimating the probability density function (PDF) of the hourly SWH values, which provides a smoother and more comprehensive representation of the data distribution compared to simple statistical metrics (e.g., mean or extreme values) or histograms.
To isolate the interannual yield variations driven by SWH from inherent long-term productivity trends (e.g., technological improvements or species changes), the raw UAY time series for each analytical unit were detrended. This was achieved by fitting a linear regression model of UAY against time. A first-order model was selected as it provides a parsimonious and robust estimate of the predominant technological trend, avoiding overfitting. The resultant residuals (after removal of the long-term trend) were interpreted as the yield anomalies primarily driven by interannual environmental variability (such as SWH) and were used in all subsequent analyses. Additionally, to enhance data reliability, outliers were identified and removed based on Tukey’s criterion.
To quantitatively establish the relationship between the wave climate and detrended UAY, we developed five indices based on the annual SWH PDF: Low SWH Density Index (LSDI), Middle SWH Density Index (MSDI), High SWH Density Index (HSDI), Ratio SWH Index (RSI), and Normalized Difference SWH Index (NDSI). These indices were designed to capture the relative prevalence of different wave energy regimes. Following the guidelines of previous studies about aquaculture site classification and the requirements of actual offshore aquaculture facilities and aquaculture activities [21,22], which categorize wave exposure for aquaculture suitability, the thresholds for low (or calm), medium, and high (or energetic) conditions were set at 0.5 m and 2.0 m, respectively.
The definitions of the five indices were as follows:
L S D I = 0 0.5 f ( h ) d h
M S D I = 0.5 2 f ( h ) d h
H S D I = 2 + f ( h ) d h
R S I = L S D I H S D I
N D S I = ( L S D I H S D I ) ( L S D I + H S D I )
where f(h) represents the PDF of SWH.

3. Results

3.1. Spatiotemporal Patterns of SWH in the Bohai and Yellow Seas

The multi-year averaged SWH from 2000 to 2023 (288 months) revealed distinct spatial gradients. In the Bohai Sea, SWH exhibited a dome-shaped pattern, with higher values in the central area and lower values around the periphery [23]. The climatological SWH in the Yellow Sea was relatively higher and followed a northwest–southeast orientation, likely associated with prevailing wind directions and large-scale ocean circulation [17]. This spatial disparity arose from differential wave growth and energy dissipation mechanisms: unimpeded growth in open waters versus nearshore refraction and diffraction effects in shallow coastal zones.
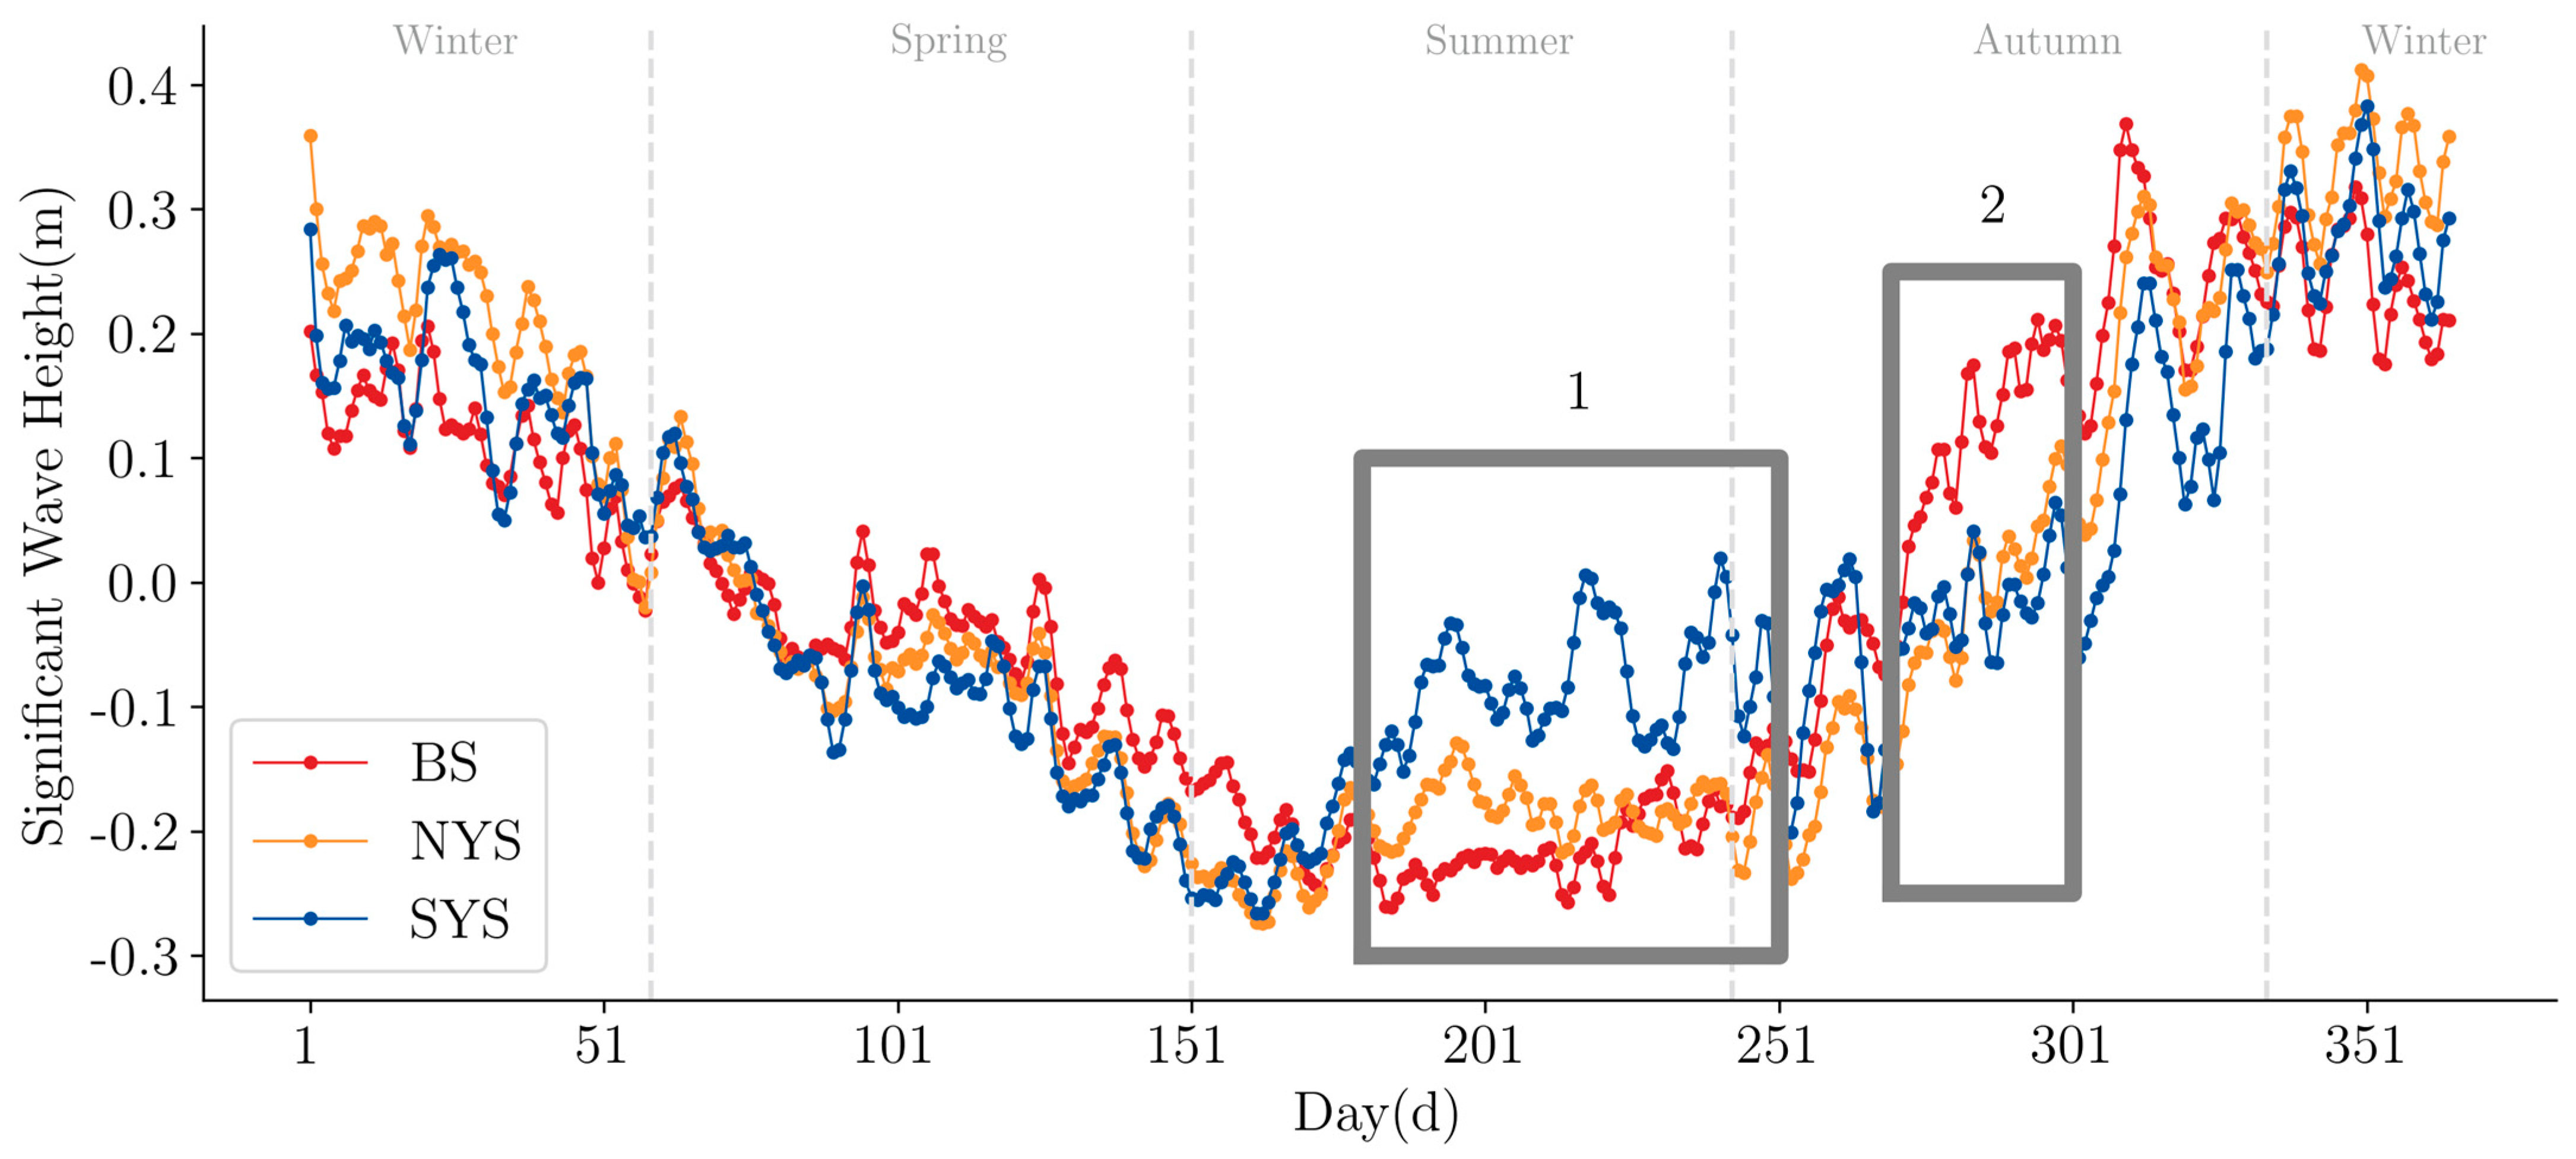
Statistical analysis of seasonal wave height anomalies (mean ± standard deviation) in the three subregions showed the following: in winter, Bohai Sea (BS): 0.15 ± 0.08 m, Northern Yellow Sea (NYS): 0.25 ± 0.10 m, Southern Yellow Sea (SYS): 0.19 ± 0.08 m; in summer, BS: −0.21 ± 0.03 m, NYS: −0.19 ± 0.03 m, SYS: 0.12 ± 0.08 m. In winter, the order of seasonal wave height anomalies was NYS > SYS > BS, while in summer, it was SYS > NYS > BS. During winter, subregion NYS was closer to the Siberian High, experiencing stronger monsoonal forcing and more active circulation. This region was also influenced by the northward Yellow Sea Warm Current and surrounding coastal currents [24], which contributed to its higher seasonal wave height anomalies compared to subregion SYS.
Overall, the northern and southern Yellow Sea regions showed more similar variability, while the BS, influenced by its geographical location, exhibited greater differences from others. These differences were mainly observed during two specific periods (Figure 3): Period 1 (180–250 d) and Period 2 (270–300 d). During Period 1, the BS had significantly higher SWH than the Yellow Sea regions, while Period 2 showed the southern Yellow Sea had higher SWH than other areas. In other periods, no significant differences in SWH were observed among the regions. Seasonally, these differences primarily occurred during the summer monsoon season and its transitional periods. During this time, the southern regions entered the summer monsoon season earlier than the northern regions, and the BS was influenced by northerly winds earlier in autumn [25].

3.2. SWH–Aquaculture Productivity Relationships

This study sequentially evaluated the relationships between the aforementioned indices and UAY (Figure 4). These indices exhibited varying capacities to indicate the influence of wave climate on productivity (Table 2).
The proposed indices exhibited distinct relationships with UAY (Figure 4). Firstly, LSDI demonstrated a positive association with UAY (Pearson’s r = 0.47), while HSDI exhibited a negative association (Pearson’s r = −0.51). Notably, although MSDI displayed a marginally negative correlation with UAY, this relationship was not statistically significant (p > 0.05, Table 2), suggesting that moderate wave conditions may represent a transitional “wave window” with ambiguous effects on yield. RSI can amplify the dynamic range between low- and high-wave regimes; however, its sensitivity to local fluctuations resulted in the widest 95% confidence interval among all indices (Figure 4), suggesting potential risks associated with overamplification of details. In contrast, NDSI achieved optimal performance, with the highest Pearson correlation (r = 0.61) and explained variance (R2 = 0.37). This non-linear transformation simultaneously accounts for low- and high-wave states while constraining outputs to a normalized range (−1 to 1). This normalization avoids issues associated with excessively large or small data values. Model selection criteria, including minimized AIC, BIC, and RSS, consistently identified NDSI as the most robust indicator of SWH-UAY interactions (Table 2).
Although all indices except MSDI exhibited statistically significant associations with UAY at the aggregate level (p < 0.05), subregional analyses at municipal resolutions or specific time analyses did not always meet the 0.05 significance threshold. This discrepancy primarily arose from insufficient sample sizes for individual cities or years, where limited observational data may amplify stochastic fluctuations and increase error margins. Furthermore, geographical location may act as a confounding factor, leading to spatial variations in the relationship. In some regions, the effect size may be insufficient to achieve statistical significance. Subsequent sections will explore these geographical differences using GWR to further elucidate the mechanisms underlying these variations.

3.3. GWR Analysis

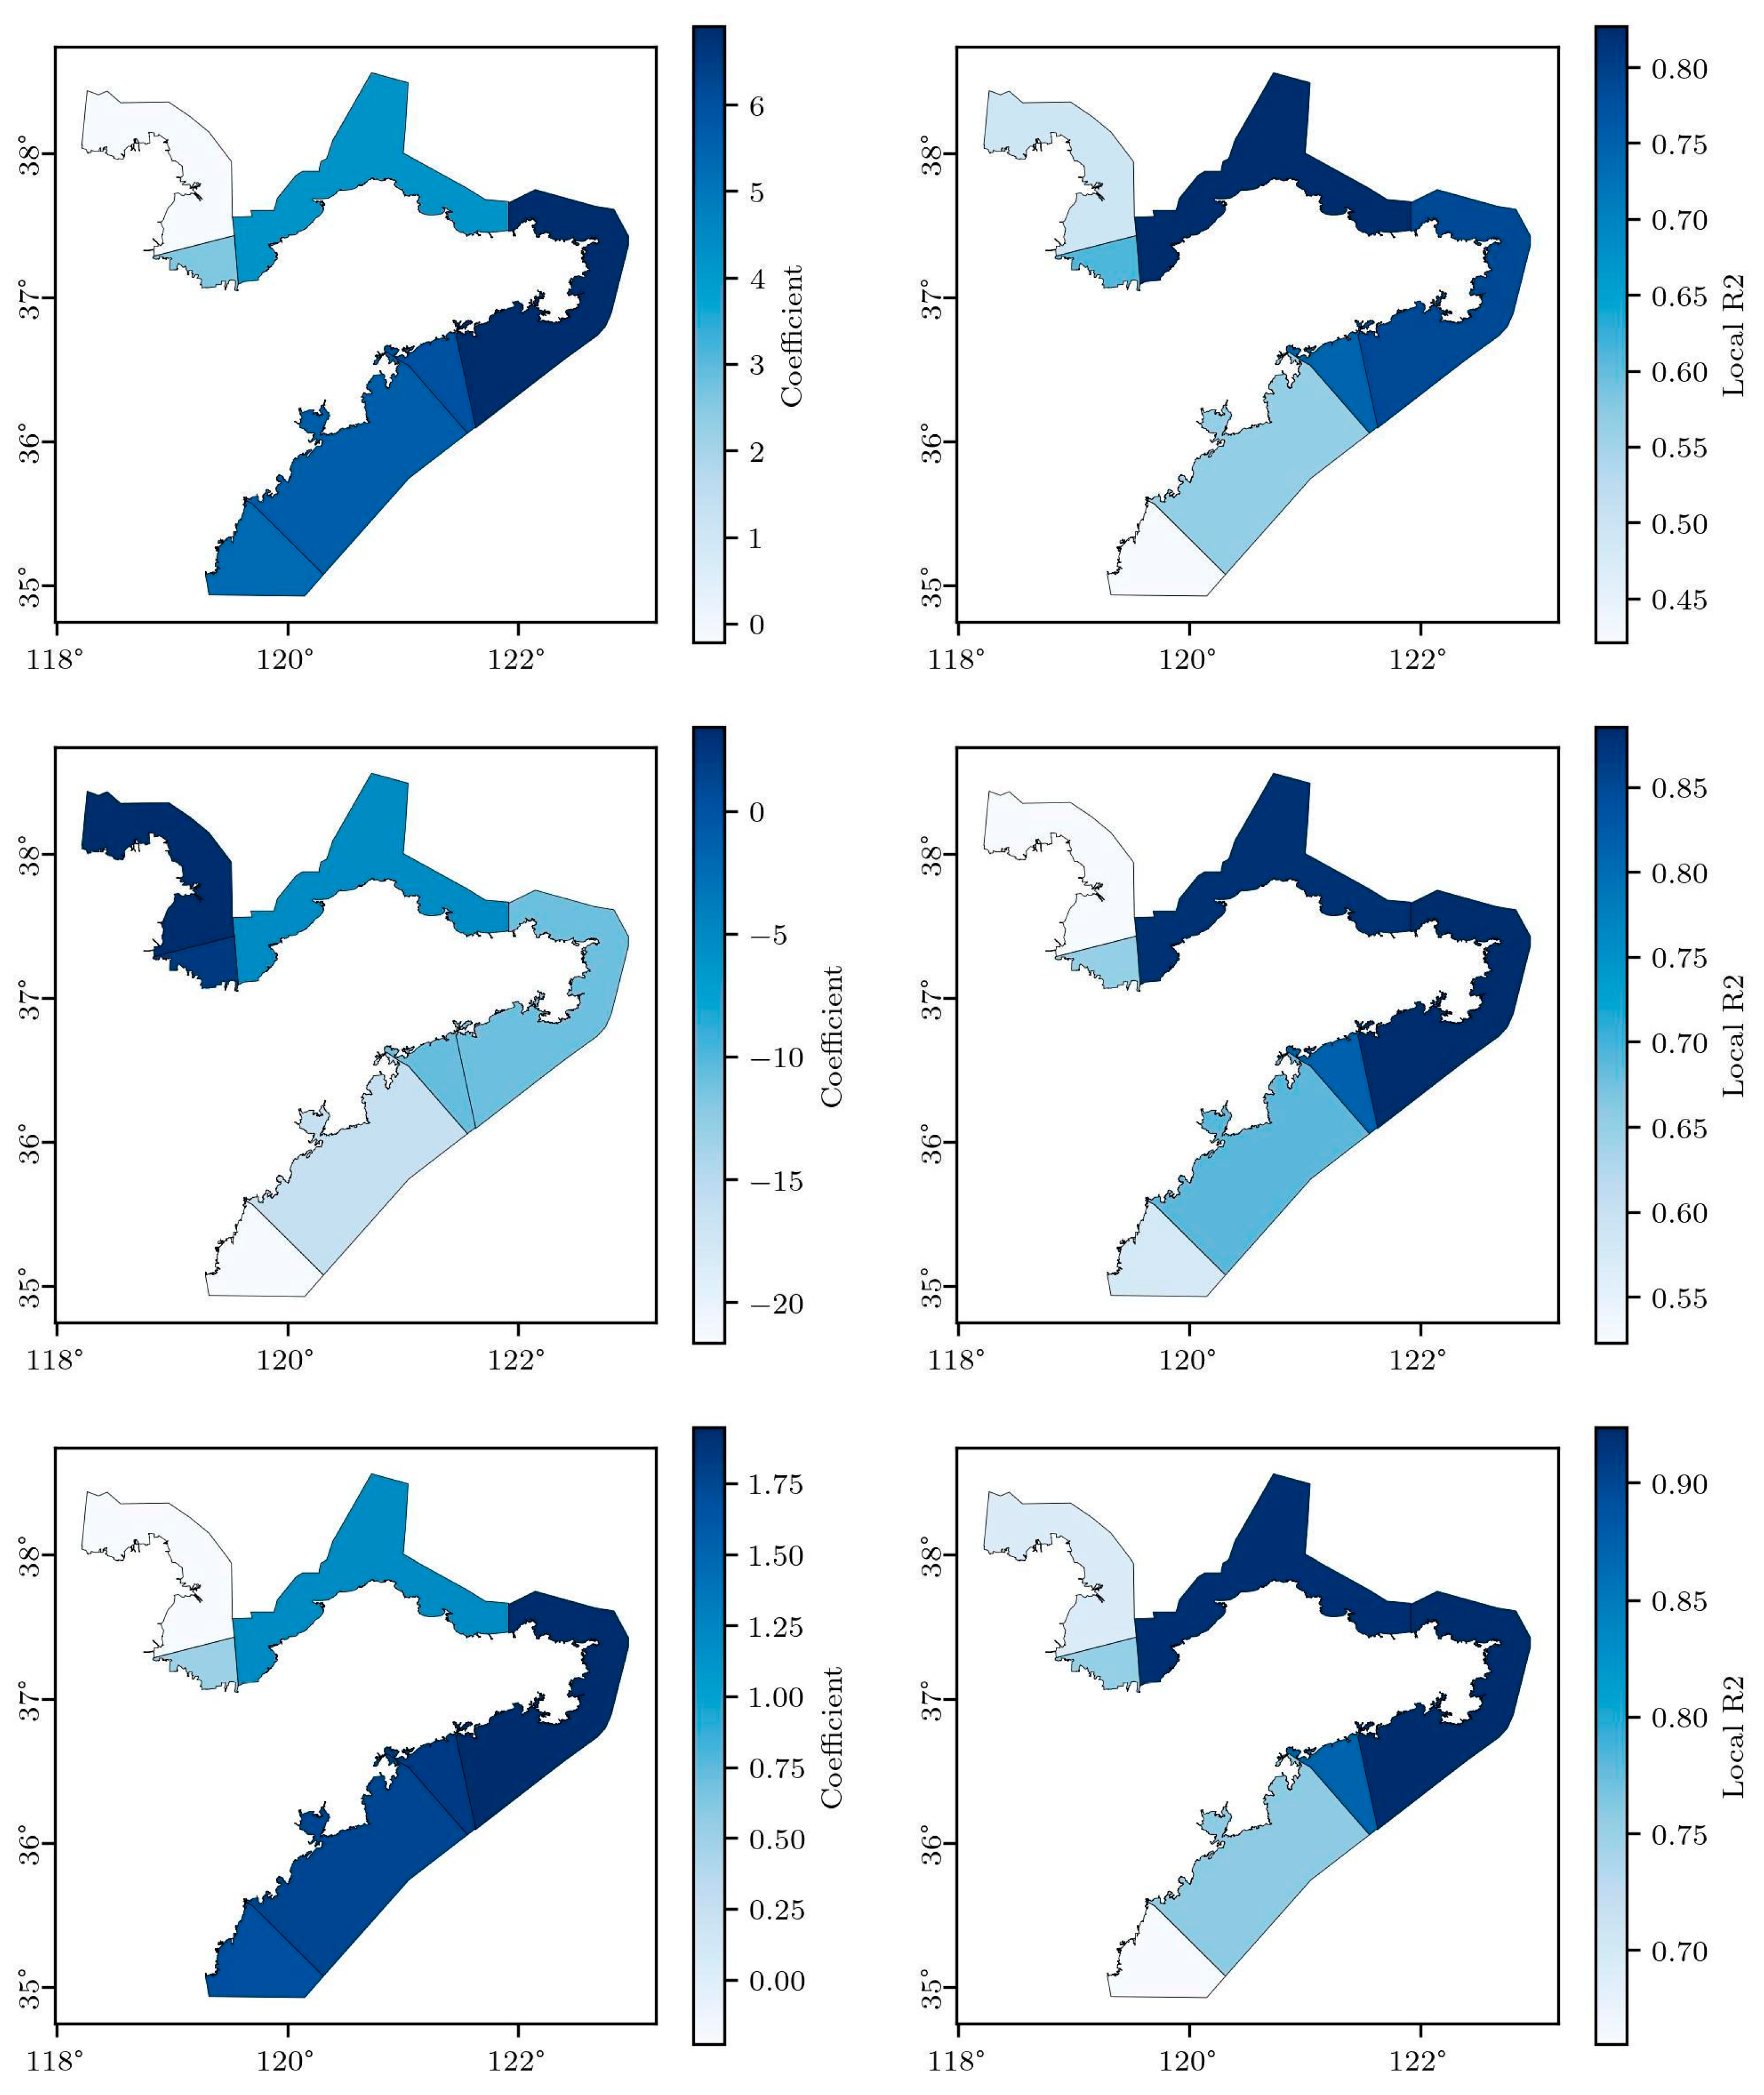
GWR effectively explored the spatial heterogeneity in variable relationships (Figure 5). Comparative analysis between global regression (GR) and GWR models demonstrated the superior performance of the latter. For the NDSI-UAY relationship (lower subplot in Figure 5), GWR reduced the RSS by 86.7%, from 14.38 to 1.91, while increasing the adjusted R2 from 0.35 to 0.48. Model selection criteria further confirmed this improvement, with AIC decreasing from 102.65 to 33.95 and BIC decreasing from 105.87 to 32.80, respectively. These results indicated that GWR provided a more precise fit to the data and better explained the variability of the dependent variable.
The GWR coefficients reflected the strength of each factor’s impact on UAY, with their distribution ranges aligning with theoretical expectations. Specifically, the GWR coefficients for LSDI ranged from −0.22 to 6.91, with a mean of 4.34 (compared to the GR coefficient of 7.49); for HSDI, the range was −21.66 to 3.42, with a mean of −8.44 (compared to the GR coefficient of −14.12); and for NDSI, the range was −0.23 to 1.95, with a mean of 1.24 (compared to the GR coefficient of 2.15). These results suggested an inherent consistency between the patterns revealed by the two modeling approaches, with GWR capturing spatial variations in parameters more effectively.
Negative indicator (HSDI) exhibited inverse spatial distributions compared to positive indicators (LSDI and NDSI). All coefficients displayed spatial clustering (Figure 5). For positive indicators, higher values were concentrated in the eastern and southern regions, while lower values appeared in symmetrical positions. Conversely, negative indicators displayed an opposite distribution. The local R2 also showed a broadly consistent distribution across models, with relatively lower values observed on the western side of the peninsula in all three models, although these remained higher than those of the GR model.

4. Discussion

The integration of wave climate dynamics with mariculture productivity offered novel insights into how environmental variability influenced coastal livelihoods. Through quantitative analysis, this study preliminarily explored the relationship between physical oceanography and socioeconomic vulnerability. The proposed SWH-derived indices (LSDI, MSDI, HSDI, RSI, NDSI) effectively captured the nuanced relationship between SWH and UAY. The dominance of NDSI in explaining UAY variability underscored the importance of non-linear interactions between low- and high-wave energy regimes. By normalizing values, NDSI mitigated the overamplification of transient anomalies. This lends support to studies emphasizing threshold-dependent responses of aquaculture systems to environmental stressors, where moderate wave energy may enhance water exchange and nutrient supply, while extremes induce physical damage [26].
The negative correlation between HSDI and UAY accentuated the vulnerability of mariculture infrastructure to high-energy wave events, which typically implied higher costs for mariculture operations, consistent with previous studies [8]. Conversely, the positive association of LSDI with UAY suggested that calm conditions favored growth cycles. However, the lack of significance in the relationship of MSDI-UAY suggested the possible existence of a “wave window”. Within this window, moderate wave conditions may represent a transitional state between high- and low-wave energy regimes, resulting in complex and potentially conflicting impacts on productivity. This concept aligns with the broader ecological framework of the Intermediate Disturbance Hypothesis (IDH), which proposes that moderate environmental variability can enhance diversity and productivity by preventing competitive exclusion and maintaining community heterogeneity [27,28]. For instance, studies on macroalgal communities have shown the highest species diversity under intermediate wave-induced disturbance [27], while molecular evidence in acidified marine systems also supports peak genetic and taxonomic diversity under intermediate pH fluctuations [29].
From a management perspective, it implies that mariculture sites might not simply benefit from the calmest conditions but rather from an optimal range where wave energy sufficiently promotes water exchange and nutrient replenishment without causing destructive stress. In addition, a study in the Netherlands Antilles showed that intermediate wave exposure corresponded to the highest juvenile density [30]. This finding suggested that in complex ecological contexts, the effects of intermediate wave exposure may be subtle and overshadowed by other factors. However, the “wave window” hypothesis requires further empirical validation through controlled experiments or finer-scale observational studies that isolate the effect of moderate waves from confounding factors. Future research should refine wave height data and control for other factors influencing productivity to systematically validate the existence of this “wave window.” Studies on mariculture area planning have previously established appropriate intervals for wave elements, recognizing the differential impacts of high and low-wave conditions [6,31]. Overall, the mechanisms underlying these indices confirmed existing research findings: moderate sea conditions favor the growth and reproduction of mariculture species, likely due to stable water quality and optimized feed distribution in low-wave environments [10]. Conversely, the negative correlation between UAY and high SWH suggested that strong wave environments negatively impact mariculture efficiency, potentially due to increased biological stress and potential physical damage to mariculture facilities [6,13,32].
The stark improvement in model performance with GWR over GR underscored the spatial non-stationarity of SWH-UAY relationships. The reduced RSS and enhanced R2 in NDSI models demonstrate that the SWH-UAY relationship exhibited spatial heterogeneity. This non-stationarity manifests in two primary ways. First, the coefficients show marked differences in their spatial distribution, varying in a southeast–northwest pattern around the Shandong Peninsula. Second, the magnitude of the coefficients also varies, with smaller absolute values in the northern part of the peninsula, indicating weaker SWH impacts on yield changes, and larger absolute values in the eastern and southern regions. This suggests that open seas (the Yellow Sea) are more sensitive to SWH changes, while semi-enclosed seas (the Bohai Sea) are less affected.
Higher SWH may reflect intensified hydrodynamic processes, implying potential linkages between marine dynamics and mariculture productivity. The intensified hydrodynamic conditions can enhance energy and material exchanges, potentially promoting nutrient mixing and phytoplankton growth, thereby providing richer food sources for mariculture species. Additionally, stronger water exchange may help improve water quality in mariculture areas by reducing excess nutrients and pollutants. Previous studies have reported that locations with stronger water exchange, often found in more open waters, tend to offer higher nutrient availability and greater carrying capacity [2,33], and are more effective in mitigating mariculture-related pollution and parasite loads [31,34]. This is consistent with our finding that dynamic hydrodynamics is an important factor for healthy mariculture environments.
The utilization of government-designated marine functional planning zones as the analytical units, while ensuring policy relevance and encompassing the vast majority of legitimate mariculture activities, introduces certain limitations in interpreting the results. Although spatial adjacency helps in assessing regional correlations, the zones themselves are not homogeneous entities. They may encompass a variety of mariculture practices (e.g., offshore cages, nearshore raft farming, and intertidal bottom sowing) with potentially different spatial distributions and densities. This intra-zone variability means that the aggregated SWH data for a zone represents an average wave climate, which may not precisely reflect the conditions experienced by specific, high-density mariculture patches located in more sheltered or more exposed sub-areas. Consequently, our model might underestimate the impact of SWH on concentrated farming areas while overestimating it for sparsely distributed ones. This aggregation effect could lead to an underestimation of the true correlation between wave climate and mariculture yield at a finer spatial scale. Future studies employing higher-resolution spatial units, such as individual boundaries derived from remote sensing, could help elucidate these micro-scale relationships.
Furthermore, the variation in dominant mariculture species across the study area is another critical factor. Different species and their associated cultivation practices likely exhibit distinct tolerances to wave action. According to official statistics, the western areas (Dongying, Weifang) are dominated by bottom-seeded shellfish and shrimp, while the eastern areas (Yantai, Weihai, Qingdao, Rizhao) feature a more diversified structure of shellfish, macroalgae, and finfish. Species such as shellfish and macroalgae, often farmed on suspended longlines, may demonstrate greater resilience to wave energy due to the flexibility of the infrastructure and the organisms themselves [35]. This differential vulnerability is a plausible explanation for the spatial variation in SWH impacts. However, as species-specific data were not incorporated as a variable in this study, the observed correlation at the zonal level likely represents a composite effect averaged across the dominant species within each zone. Therefore, our findings should be interpreted as reflecting the overall sensitivity of the regional mariculture system to wave climate.

5. Conclusions

This study demonstrates that significant wave height (SWH) acts as a critical dual factor in the Bohai–Yellow Sea system, simultaneously serving as a physical driver and a socioeconomic regulator of mariculture productivity. By developing a novel set of indices, we quantitatively established that calm wave conditions (SWH < 0.5 m) generally enhance unit area yield (UAY), whereas high-energy events (SWH > 2.0 m) exert detrimental impacts. The superior performance of the Normalized Difference SWH Index (NDSI) underscores the importance of non-linear interactions between different wave regimes. Furthermore, the application of Geographically Weighted Regression (GWR) revealed significant spatial non-stationarity in these relationships, with stronger effects observed in the open waters of the Yellow Sea compared to the semi-enclosed Bohai Sea, which means that management strategies should be tailored. For example, regions where the HSDI or NDSI coefficients are elevated function as high-sensitivity zones (most notably the eastern and southern sectors of the Yellow Sea) in which mariculture yield fluctuates markedly with wave climate. Within these areas, spatial planning should enforce stricter standards for wave-resistant infrastructure design. Concurrently, prioritizing the culture of inherently wave-tolerant taxa (e.g., flexible macroalgae) over more susceptible species would reduce biological risk and increase the overall stability and resilience of the production system.
However, data limitations—specifically, reliance on mariculture planning zones rather than exact farm locations—introduce statistical biases and potential ecological fallacies, as unregulated farming activities and microhabitat variability may decouple grid-scale SWH from site-specific wave exposure. The limitations of data resolution and scope need to be addressed in future research:
1. High-resolution data integration: In situ measurements can be combined with remote sensing to refine socioeconomic assessments of oceanographic processes. For instance, training a computer vision model using high-resolution satellite imagery can yield more accurate spatial distribution information for mariculture [36], thereby reducing large-scale identification biases. 2. Multivariate modeling: Wave, current, temperature, and biogeochemical data can be coupled to disentangle environmental impacts on aquaculture. 3. Extended temporal analysis: Long-term observations and climate projections can be coupled to assess multidecadal trends. 4. Species diversity weighting: Mariculture taxonomic composition can be incorporated as an explicit variable to enable fine-scale assessment.
In conclusion, this work moves beyond qualitative assessments by providing a quantitative, spatially explicit framework to inform sustainable mariculture strategies. By recognizing waves as both a nurturer and a disruptor, stakeholders and planners can better optimize site selection, design wave-resistant infrastructure, and implement adaptive management to balance productivity and risk in the face of increasing marine extremes.

Author Contributions

Conceptualization, Z.Y. and J.W.; methodology, N.Y., K.H. and J.W.; software, K.H. and X.C.; validation, X.C. and G.S.; formal analysis, G.S.; investigation, N.Y. and J.Z.; resources, H.Q.; data curation, H.Q.; writing—original draft preparation, Z.Y. and J.W.; writing—review and editing, Z.Y. and N.Y.; visualization, Y.Y.; supervision, Y.Y.; project administration, M.Z. and Y.Y.; funding acquisition, M.Z. All authors have read and agreed to the published version of the manuscript.

Funding

This research was funded by Technology Innovation Program of Laoshan Laboratory (No. LSKJ202203803), National Natural Science Foundation of China (Grant numbers: 42176221), Shandong Provincial Natural Science Foundation (Grant numbers: ZR2023MD039), and Yantai Key Laboratory of Quality Safety Control and Deep Processing of Seafood Products Open Fund (Grant numbers: QSCDP202307).

Data Availability Statement

The original contributions presented in the study are included in the article; further inquiries can be directed to the corresponding author.

Acknowledgments

We acknowledge the data provided by the National Marine Data Center (https://mds.nmdis.org.cn/, accessed on 31 October 2025), Oceanographic Data Center, Chinese Academy of Sciences (https://msdc.qdio.ac.cn, accessed on 31 October 2025) and the European Centre for Medium-Range Weather Forecasts (ECMWF) through the Copernicus Climate Change Service (https://cds.climate.copernicus.eu/, accessed on 31 October 2025).

Conflicts of Interest

Author Xiaoyu Chang was employed by the company the 54th Research Institution of CETC. The remaining authors declare that the research was conducted in the absence of any commercial or financial relationships that could be construed as a potential conflict of interest.

References

  1. Husain, N.T.; Hara, T.; Sullivan, P.P. Wind Turbulence over Misaligned Surface Waves and Air–Sea Momentum Flux. Part I: Waves Following and Opposing Wind. J. Phys. Oceanogr. 2022, 52, 119–139. [Google Scholar] [CrossRef]
  2. Buck, B.H.; Bjelland, H.V.; Bockus, A.; Chambers, M.; Costa-Pierce, B.A.; Dewhurst, T.; Ferreira, J.G.; Føre, H.M.; Fredriksson, D.W.; Goseberg, N.; et al. Resolving the term “offshore aquaculture” by decoupling “exposed” and “distance from the coast”. Front. Aquac. 2024, 3, 1428056. [Google Scholar] [CrossRef]
  3. Almar, R.; Ranasinghe, R.; Bergsma, E.W.J.; Diaz, H.; Melet, A.; Papa, F.; Vousdoukas, M.; Athanasiou, P.; Dada, O.; Almeida, L.P.; et al. A global analysis of extreme coastal water levels with implications for potential coastal overtopping. Nat. Commun. 2021, 12, 3775. [Google Scholar] [CrossRef] [PubMed]
  4. Free, C.M.; Cabral, R.B.; Froehlich, H.E.; Battista, W.; Ojea, E.; O’Reilly, E.; Palardy, J.E.; García Molinos, J.; Siegel, K.J.; Arnason, R.; et al. Expanding ocean food production under climate change. Nature 2022, 605, 490–496. [Google Scholar] [CrossRef] [PubMed]
  5. Karathanasi, F.E.; Soukissian, T.H.; Hayes, D.R. Wave Analysis for Offshore Aquaculture Projects: A Case Study for the Eastern Mediterranean Sea. Climate 2022, 10, 2. [Google Scholar] [CrossRef]
  6. Mirera, D.O.; Salim, A.; Kendi, J. Hydrodynamics of nearshore coastal waters: Implications for marine cage farming in Kenya. West. Indian Ocean. J. Mar. Sci. 2023, 22, 25–41. [Google Scholar] [CrossRef]
  7. Morim, J.; Wahl, T.; Vitousek, S.; Santamaria-Aguilar, S.; Young, I.; Hemer, M. Understanding uncertainties in contemporary and future extreme wave events for broad-scale impact and adaptation planning. Sci. Adv. 2023, 9, eade3170. [Google Scholar] [CrossRef]
  8. Lester, S.E.; Stevens, J.M.; Gentry, R.R.; Kappel, C.V.; Bell, T.W.; Costello, C.J.; Gaines, S.D.; Kiefer, D.A.; Maue, C.C.; Rensel, J.E.; et al. Marine spatial planning makes room for offshore aquaculture in crowded coastal waters. Nat. Commun. 2018, 9, 945. [Google Scholar] [CrossRef]
  9. Hong, J.-S.; Moon, J.-H.; Kim, T. Effect of Breaking Waves on Near-Surface Mixing in an Ocean-Wave Coupling System under Calm Wind Conditions. J. Mar. Sci. Eng. 2020, 8, 540. [Google Scholar] [CrossRef]
  10. Gordon, S.E.; Wingfield, M.; Smallhorn-West, P.F.; Malimali, S.a.; Halafihi, T.i.; Schoeman, D.S.; Southgate, P.C. Spatio-Temporal Variation in Growth Performance and Condition of the Winged Pearl Oyster Pteria penguin. Front. Mar. Sci. 2021, 8, 618910. [Google Scholar] [CrossRef]
  11. McKeown, D.A.; Schroeder, J.L.; Stevens, K.; Peters, A.F.; Sáez, C.A.; Park, J.; Rothman, M.D.; Bolton, J.J.; Brown, M.T.; Schroeder, D.C. Phaeoviral Infections Are Present in Macrocystis, Ecklonia and Undaria (Laminariales) and Are Influenced by Wave Exposure in Ectocarpales. Viruses 2018, 10, 410. [Google Scholar] [CrossRef]
  12. La Nafie, Y.A.; de los Santos, C.B.; Brun, F.G.; van Katwijk, M.M.; Bouma, T.J. Waves and high nutrient loads jointly decrease survival and separately affect morphological and biomechanical properties in the seagrass Zostera noltii. Limnol. Oceanogr. 2012, 57, 1664–1672. [Google Scholar] [CrossRef]
  13. Rijja, M.; Buriyo, A. IMPLICATIONS OF CLIMATE CHANGE INDUCED COPING AND ADAPTATION STRATEGIES ON SEAWEED PRODUCTION IN TANZANIA: A CASE OF JAMBIANI VILLAGE, UNGUJA ISLAND. Int. J. Res.-GRANTHAALAYAH 2020, 7, 47–66. [Google Scholar] [CrossRef]
  14. Moeser, G.; Leba, H.; Carrington, E. Seasonal influence of wave action on thread production in Mytilus edulis. J. Exp. Biol. 2006, 209, 881–890. [Google Scholar] [CrossRef] [PubMed]
  15. Lumor, L.; Wang, Z.; Zhao, Z.; Yang, C.; Li, J.; Deng, Y. Growth in pearl oysters: A review of genetic and environmental influences. Aquac. Res. 2019, 51, 18–28. [Google Scholar] [CrossRef]
  16. Xu, T.; Wang, N.; He, Y.; Li, Y.; Meng, X.; Gao, F.; Lopez-Baeza, E. GNSS Reflectometry-Based Ocean Altimetry: State of the Art and Future Trends. Remote Sens. 2024, 16, 1754. [Google Scholar] [CrossRef]
  17. Li, D.; Feng, J.; Zhu, Y.; Staneva, J.; Qi, J.; Behrens, A.; Lee, D.; Min, S.-K.; Yin, B. Dynamical Projections of the Mean and Extreme Wave Climate in the Bohai Sea, Yellow Sea and East China Sea. Front. Mar. Sci. 2022, 9, 844113. [Google Scholar] [CrossRef]
  18. Fanti, V.; Ferreira, Ó.; Kümmerer, V.; Loureiro, C. Improved estimates of extreme wave conditions in coastal areas from calibrated global reanalyses. Commun. Earth Environ. 2023, 4, 151. [Google Scholar] [CrossRef]
  19. Wang, J.; Wang, Y. Evaluation of the ERA5 Significant Wave Height against NDBC Buoy Data from 1979 to 2019. Mar. Geod. 2022, 45, 151–165. [Google Scholar] [CrossRef]
  20. Liang, G.; Yang, J.; Wang, J. Accuracy Evaluation of CFOSAT SWIM L2 Products Based on NDBC Buoy and Jason-3 Altimeter Data. Remote Sens. 2021, 13, 887. [Google Scholar] [CrossRef]
  21. ICES. Report of the Working Group on Marine Shellfish Culture (WGMASC); ICES CM 2011/SSGHIE:08; ICES: La Trinité-sur-Mer, France, 2011; p. 92. [Google Scholar]
  22. Zhao, Y.; Guan, C.; Bi, C.; Liu, H.; Cui, Y. Experimental Investigations on Hydrodynamic Responses of a Semi-Submersible Offshore Fish Farm in Waves. J. Mar. Sci. Eng. 2019, 7, 238. [Google Scholar] [CrossRef]
  23. Bian, C.; Jiang, W.; Pohlmann, T.; Sündermann, J. Hydrography-Physical Description of the Bohai Sea. J. Coast. Res. 2016, 74, 1–12. [Google Scholar] [CrossRef]
  24. Xu, X.; Gao, J.; Shi, Y.; Wu, X.; Lv, J.; Zhang, S.; Liu, S.; Liu, T.; Yang, G. Cross-Front Transport Triggered by Winter Storms Around the Shandong Peninsula, China. Front. Mar. Sci. 2022, 9, 975504. [Google Scholar] [CrossRef]
  25. Yuan, D.; Hsueh, Y. Dynamics of the cross-shelf circulation in the Yellow and East China Seas in winter. Deep.-Sea Res. Part Ii-Top. Stud. Oceanogr. 2010, 57, 1745–1761. [Google Scholar] [CrossRef]
  26. Zhen-Zhen, C.; Jian, Z.; Miao-Feng, Y.; Yong-Qing, L.; Hui-Dong, Z.; Dong-Lian, L.; Shuang-Cheng, J.; Tuan-Yu, G.; Sheng-Hua, Z. Vertical distribution and pollution assessment of TN, TP, and TOC in the sediment cores of cage farming areas in Dongshan Bay of southeast China. Front. Environ. Sci. 2023, 11, 1216868. [Google Scholar] [CrossRef]
  27. England, P.; Phillips, J.; Waring, J.; Symonds, G.; Babcock, R. Modelling wave-induced disturbance in highly biodiverse marine macroalgal communities: Support for the intermediate disturbance hypothesis. Mar. Freshw. Res. 2008, 59, 515–520. [Google Scholar] [CrossRef]
  28. Soto, I.; Muller-Karger, F.; Hallock, P.; Hu, C. Sea Surface Temperature Variability in the Florida Keys and Its Relationship to Coral Cover. J. Mar. Biol. 2011, 2011, 981723. [Google Scholar] [CrossRef]
  29. González-Delgado, S.; Pérez-Portela, R.; Hernández, J.C. Molecular evidence for the intermediate disturbance hypothesis in an acidified marine system. Hydrobiologia 2025, 852, 4341–4352. [Google Scholar] [CrossRef]
  30. Engelen, A.H.; Åberg, P.; Olsen, J.L.; Stam, W.T.; Breeman, A.M. Effects of wave exposure and depth on biomass, density and fertility of the fucoid seaweed Sargassum polyceratium (Phaeophyta, Sargassaceae). Eur. J. Phycol. 2005, 40, 149–158. [Google Scholar] [CrossRef]
  31. Froehlich, H.E.; Smith, A.; Gentry, R.R.; Halpern, B.S. Offshore Aquaculture: I Know It When I See It. Front. Mar. Sci. 2017, 4, 154. [Google Scholar] [CrossRef]
  32. Sühring, N.; Chambers, C.; Koenigk, T.; Kruschke, T.; Einarsson, N.; Ogilvie, A.E.J. Effects of storms on fisheries and aquaculture: An Icelandic case study on climate change adaptation. Arct. Antarct. Alp. Res. 2023, 55, 2269689. [Google Scholar] [CrossRef]
  33. Welch, A.W.; Knapp, A.N.; El Tourky, S.; Daughtery, Z.; Hitchcock, G.L.; Benetti, D.D. The nutrient footprint of a submerged-cage offshore aquaculture facility located in the tropical Caribbean. J. World Aquac. Soc. 2019, 50, 299–316. [Google Scholar] [CrossRef]
  34. Brenner, M.; Buchholz, C.; Heemken, O.; Buck, B.H.; Koehler, A. Health and growth performance of the blue mussel (Mytilus edulis L.) from two hanging cultivation sites in the German Bight: A nearshore—Offshore comparison. Aquac. Int. 2012, 20, 751–778. [Google Scholar] [CrossRef]
  35. Wang, X.; Xie, J.; Luo, Y.; Wang, X.; Guo, G.; You, X. Experimental Investigation of the Hydrodynamic Characteristics of Longline Aquaculture Facilities under Current and Wave Conditions. Fishes 2023, 8, 204. [Google Scholar] [CrossRef]
  36. Quaade, S.; Vallebueno, A.; Alcabes, O.D.N.; Rodolfa, K.T.; Ho, D.E. Remote sensing and computer vision for marine aquaculture. Sci. Adv. 2024, 10, eadn4944. [Google Scholar] [CrossRef]
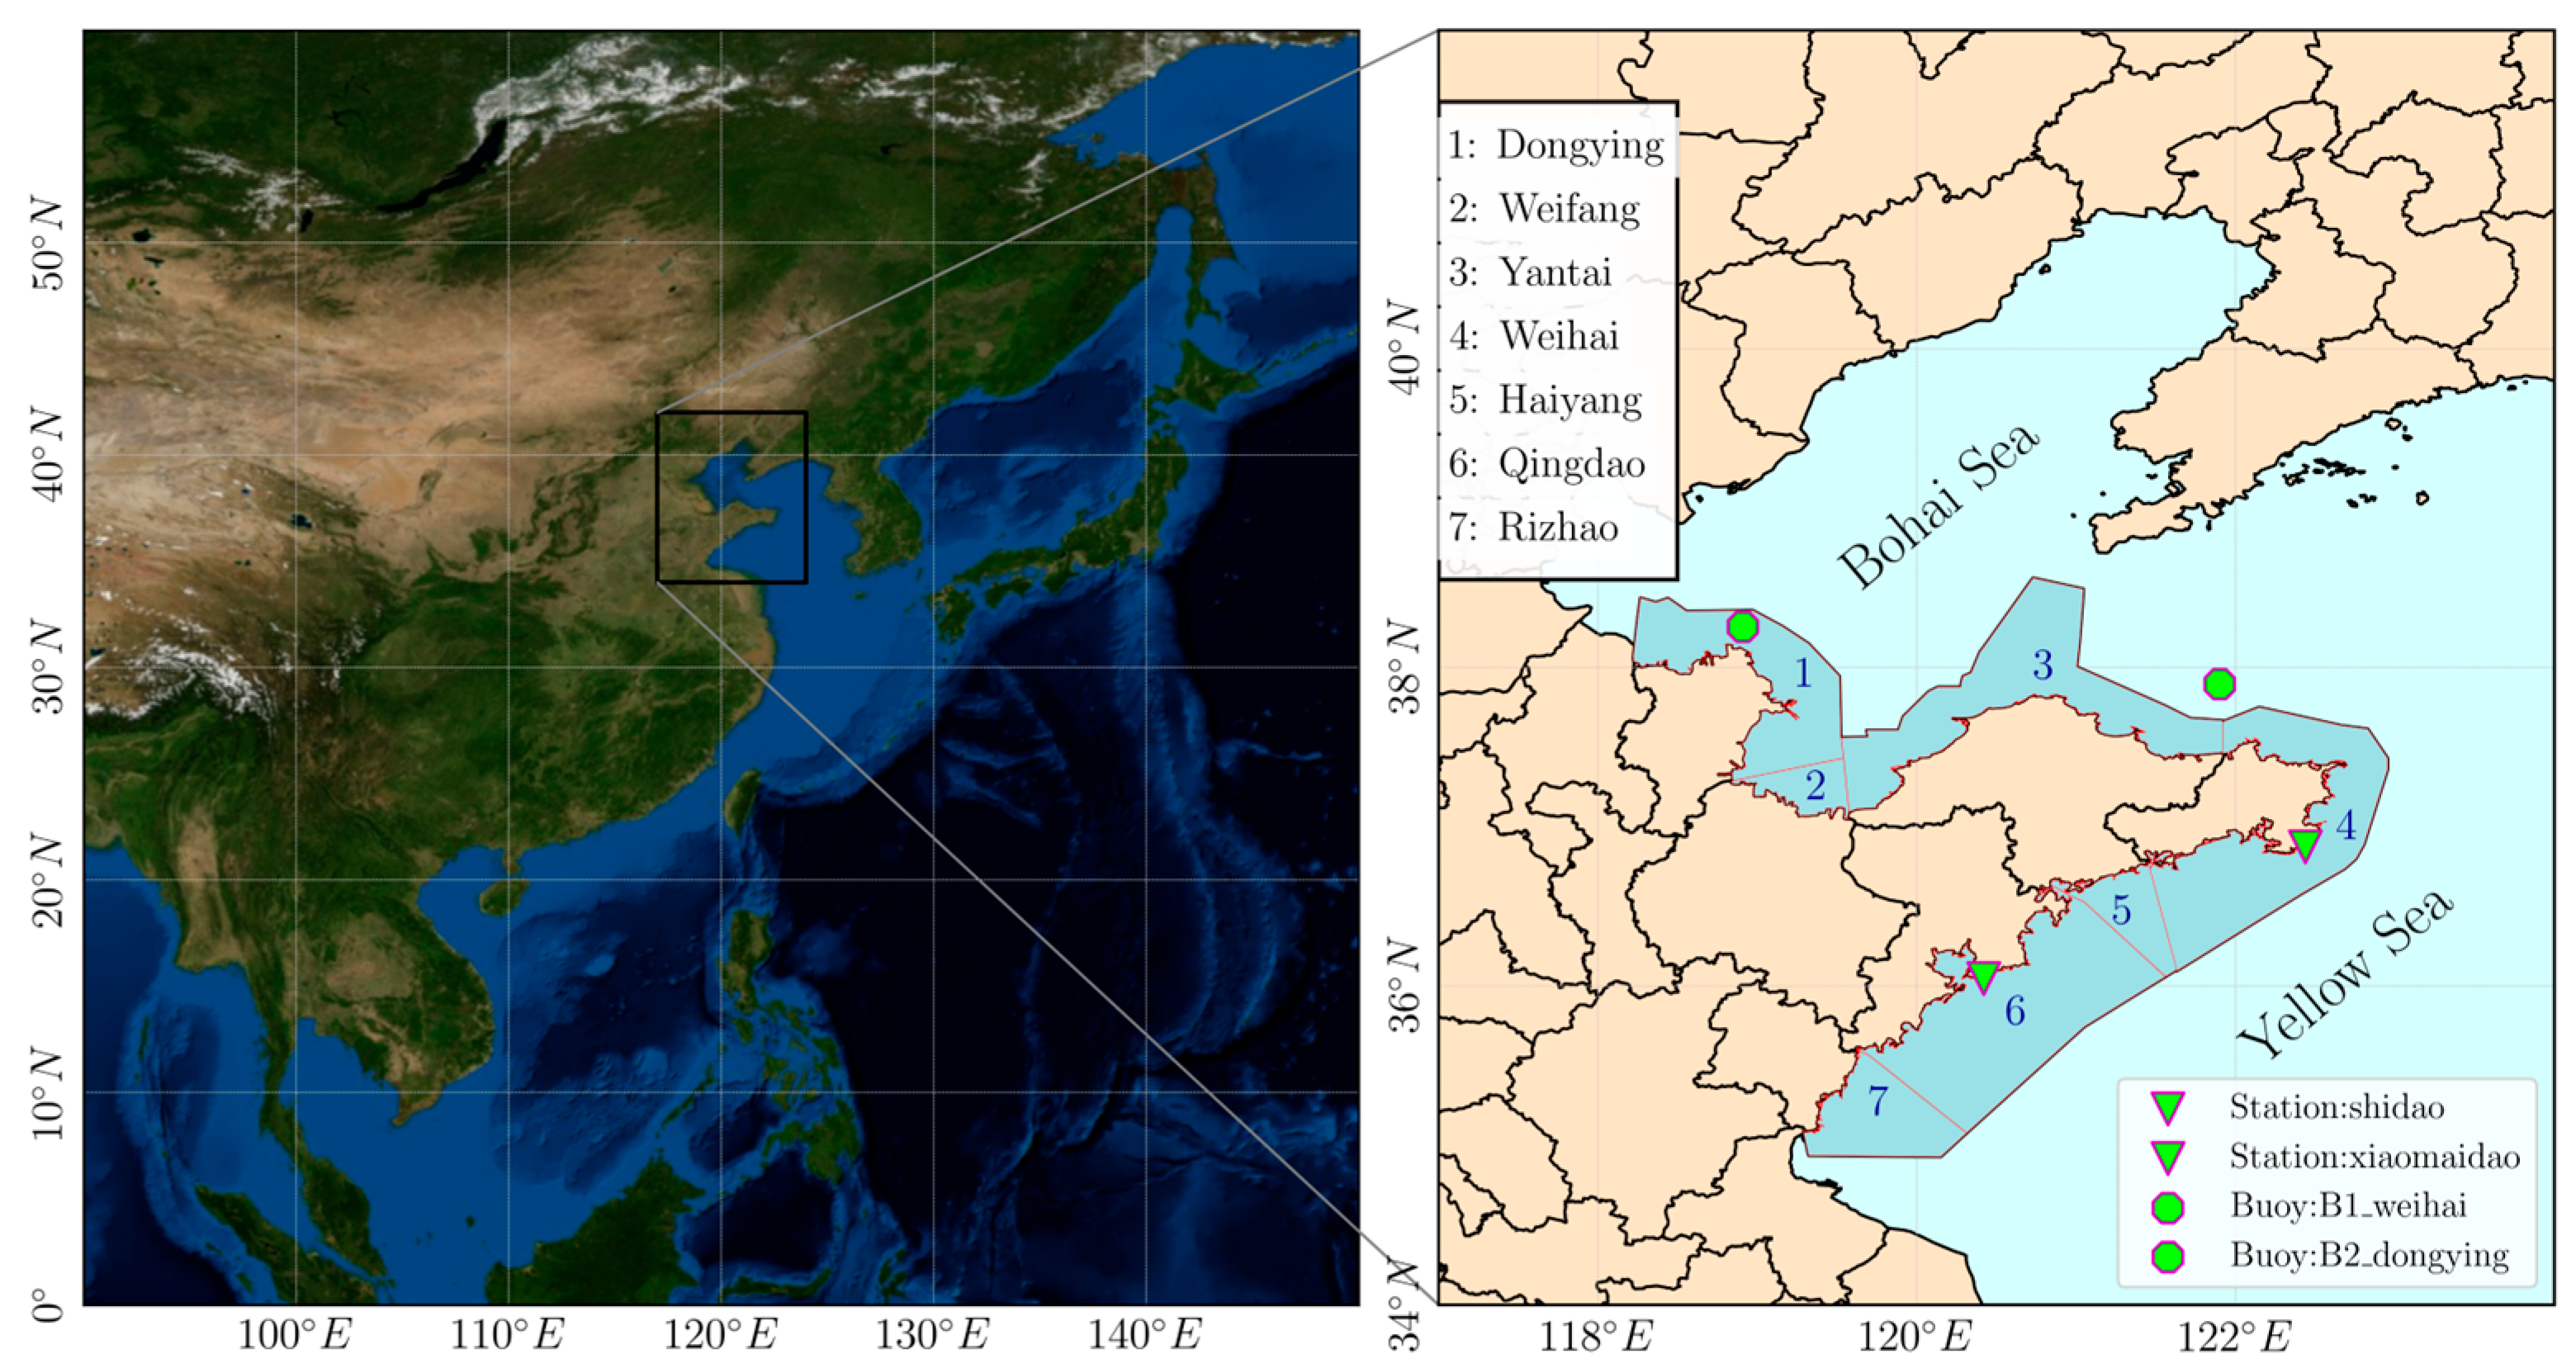
Figure 1. Geographical overview of the study area (the Bohai and Yellow Seas) and spatial distribution of buoy or oceanic stations. Shaded regions denote primary mariculture activity zones.
Water 17 03165 g001
Figure 2. Validation of ERA5 reanalysis against in situ wave measurements: (left) station B1_weihai and (right) station B2_dongying.
Water 17 03165 g002
Figure 3. Annualized seasonal SWH patterns by subregion. The two highlighted periods (Period 1: 180–250 d; Period 2: 270–300 d) correspond to the phases during which SWH exhibited the greatest mutual divergence.
Water 17 03165 g003
Figure 4. Relationships between five indices and detrended UAY. Solid lines: global regression; dashed lines: city-level fits. Shaded regions denote 95% confidence intervals of global regression.
Water 17 03165 g004
Figure 5. Mean regression coefficients (left column) and local R2 (right column) from GWR for (top) LSDI, (middle) HSDI, and (bottom) NDSI.
Water 17 03165 g005
Table 1. Summary Statistics of SWH at Observation Stations and ERA5.
TypeStationMean/mPearson’s rRMSE/mSI/mBias/m
In situ observationsShidao0.84----
Xiaomaidao0.81----
B1_weihai0.75----
B2_dongying0.56----
ERA5 before calibrationShidao0.860.800.210.250.02
Xiaomaidao0.750.700.210.27−0.05
B1_weihai0.680.760.230.31−0.06
B2_dongying0.630.780.200.330.07
ERA5 after calibrationShidao0.860.800.200.240.03
Xiaomaidao0.780.700.200.25−0.03
B1_weihai0.730.760.210.29−0.02
B2_dongying0.560.780.180.34−0.01
Table 2. Performance metrics of regression models based on SWH-derived indices.
IndexPearson’s r 1F-Statistic 1R2Adjusted R2AICBICRSS
LSDI0.47 **4.99 *0.220.20110.42113.6517.75
MSDI−0.20.730.040.01118.2121.4321.9
HSDI−0.51 **6.21 **0.260.24108.47111.716.83
RSI0.48 **5.09 *0.230.20110.26113.4817.67
NDSI0.61 **10.25 **0.370.35102.65105.8714.38
Notes: 1 In Pearson’s r and F-statistic, ** indicates p < 0.01, * indicates p < 0.05, and the absence of a mark indicates failure to pass the significance test.
Disclaimer/Publisher’s Note: The statements, opinions and data contained in all publications are solely those of the individual author(s) and contributor(s) and not of MDPI and/or the editor(s). MDPI and/or the editor(s) disclaim responsibility for any injury to people or property resulting from any ideas, methods, instructions or products referred to in the content.