Abstract
Water resources are fundamental to human survival, as well as critical to the sustainable progress of the economy and society. This study selects representative indicators and employs the TOPSIS model to evaluate the water resources carrying capacity (WRCC) in the Chang–Zhu–Tan region (2006–2022). Based on this, kernel density estimation and Moran’s I are applied to analyze the spatiotemporal distribution and evolution trends of WRCC. Additionally, the Lorenz curve, Gini coefficient, and imbalance index are utilized to examine the alignment between WRCC and socio-economic growth. Finally, a system dynamics model is used to simulate WRCC and matching dynamics under different scenarios. The findings reveal the following: (1) The overall WRCC is favorable but exhibits a declining temporal trend, with widening inter-district disparities and strong spatial agglomeration. (2) The match between WRCC and economic development is unbalanced, though alignment has gradually improved over time. (3) The WRCC varies across different scenarios. In current development scenario, WRCC declines significantly. In economic priority development and industrial restructuring scenarios, this reduction is slowed. Specifically, in water resource policy control scenario, WRCC can be enhanced. Aside from the industrial restructuring scenario, all other scenarios contribute to improving the coordination between WRCC and economic development.
1. Introduction
Water serves as a fundamental resource for maintaining ecosystem integrity, sustaining human existence, and facilitating socioeconomic growth. In recent years, driven by global climate change and human activities, the prevalence of water scarcity, water pollution, and hydrological disasters has posed significant threats to both production and daily life. Consequently, the capacity of water resources to enable future social growth has increasingly become a focal concern among various sectors of society. Against this context, the study of the spatiotemporal patterns of water resources carrying capacity (WRCC) and its alignment with economic development becomes both vital and critical. WRCC is regarded as an effective indicator for assessing the ability of water resources to support human society development. Currently, two primary interpretations of the concept of WRCC are identified: one refers to the maximum support capacity of water resources for regional economic and social development [1], while the other denotes the overall coordination of economic, social, and environmental systems within the water resource framework [2].
In December 2021, the Hunan Province Water Resources Allocation and Water Supply Plan for the 14th Five-Year Plan Period, was announced by the Hunan Provincial Department of Water Resources. The mandate for full implementation of the development philosophy “determining urban expansion, land use, population growth, and industrial development based on water availability” and the water management approach “prioritizing water conservation, achieving spatial balance, implementing systematic governance, and leveraging both market and government forces” was established, with water resources designated as the primary rigid constraint. As an economic and social unit comprising multiple administrative districts, urban agglomerations are strategic focal points for regional coordinated development and new-type urbanization. Studying at the scale of urban agglomeration facilitates optimized allocation and sharing mechanisms of water resource allocation and distribution within areas. The Chang–Zhu–Tan urban agglomeration, as China’s fourth nationally authorized metropolitan area, is significantly dependent on the Xiangjiang River Basin for economic activities. Rapid urbanization and economic expansion have exacerbated water resource supply-demand conflicts, water shortages, and unequal spatiotemporal water distribution, thereby severely constraining sustainable regional development. Thus, in-depth research on urban agglomerations’ WRCC and its alignment with economic development is urgently needed, not only for rational regional water allocation and optimizing industrial/population distribution but also for promoting high-quality development in Hunan Province and ensuring national water security from a strategic perspective.
Some scholars have extensively explored the spatiotemporal patterns of WRCC and its correlation with economic development. Current research mainly focuses on three areas: evaluation methods for WRCC [3,4], spatiotemporal patterns and influencing factors [5], and the relationship between water resource use and economic development [6]. In the assessment of WRCC, Wang et al. constructed an analytical framework integrating system dynamics modeling with an improved fuzzy comprehensive evaluation method for Changchun City, China, to simulate and assess the evolution trends of WRCC under different development scenarios [7]; Yan and Xu applied a comprehensive evaluation model combined with forecasting techniques to conduct quantitative analysis of historical trends and future potential regarding WRCC in Jiangsu Province [8]; Lv et al. evaluated the WRCC of Heilongjiang Province in China, employing an improved TOPSIS model. They advocated raising carrying capacity by optimizing water resource allocation and strengthening ecological conservation [9]. In the spatiotemporal patterns and influencing factors, Wang et al. analyzed the spatial distribution of WRCC across Chinese provinces using a spatial Durbin model [3]; Zhou et al. examined the spatiotemporal carrying capacity of water environments during urban evolution via an integrated system dynamics-cellular automata model [10]; Cheng et al. employed a cloud model to analyze spatiotemporal evolution in WRCC across Heilongjiang’s cities, concluding that influencing factors vary across scales [11]; Yang et al. used geographic detector analysis to identify intrinsic drivers of Yulin City’s spatiotemporal changes in carrying capacity [12]. In the relationship between water resource utilization and economic development, Zuo et al. analyzed the coordination between water resource utilization efficiency and socioeconomic development in the region, and found a significant correlation between water use levels and economic development stages, with variations across provinces. They emphasized the need to optimize water use structures and promote water efficiency to support sustainable development [13]; Zhao et al. studied the macro-level relationship between water resource usage and economic growth in China using national data. Empirical data demonstrated a classic Kuznets curve pattern: water consumption initially grows then drops as economic levels rise, with the inflection point happening after a specified stage of economic development. This indicates that economic expansion ultimately drives improvements in water resource utilization efficiency and a reduction in consumption levels [14].
A rich theoretical foundation and practical insights for this paper are provided by the aforementioned research, although several aspects warrant further exploration. Current research is largely concentrated on national or provincial dimensions, with less emphasis devoted to densely populated, highly industrialized, and fast-rising urban agglomerations. Furthermore, existing fuzzy comprehensive evaluation methods fail to accurately capture the discrepancies between actual and ideal WRCC. Additionally, current WRCC analyses primarily focus on spatial similarity and aggregation characteristics [5], with insufficient discussion of regional disparities. Moreover, there is a deficiency in the analysis of temporal evolution within regions, and multi-scenario predictive modeling assessing the interplay between WRCC and economic development has not been conducted.
Driven by China’s “Rise of Central China” strategy, the Chang–Zhu–Tan region has experienced rapid economic growth, industrialization, and urbanization in recent years. This has led to a sharp increase in water demand, posing severe challenges to water resource management and carrying capacity. Based on this, the TOPSIS model is introduced to measure the WRCC of the Chang–Zhu–Tan urban agglomeration from 2006 to 2022 by constructing a comprehensive indicator system and determining indicator weights using the entropy method. Next, kernel density estimation and Moran’s I statistic are employed to analyze the spatiotemporal distribution and evolutionary trends of WRCC in this region. This approach facilitates the exploration of spatial heterogeneity within the area, thereby filling the limitations of existing research in interregional differences and temporal dynamics. Subsequently, the Lorenz curve, Gini coefficient, and imbalance index are used to investigate the matching degree between WRCC and socioeconomic growth. Based on this, conduct an in-depth analysis of the spatial heterogeneity of the alignment between WRCC and economic development. Finally, a system dynamics (SD) model is employed to forecast the evolution trends of WRCC and its matching degree with economic development under different scenarios. The aforementioned study contributes to playing the key role of water resources in balancing socio-economic growth and offers a basis for major decisions such as industrial layout, water-saving reforms, and pollution control in the Chang–Zhu–Tan urban agglomeration. Meanwhile, as a national pilot demonstration zone for ecological civilization, references for studies on the relationship between the dynamic evolution of WRCC and economic development in other urban agglomerations are expected to be drawn from the Chang–Zhu–Tan region.
2. Materials and Methods
2.1. Study Area and Data Sources
The Chang–Zhu–Tan urban agglomeration contains Changsha, Zhuzhou, and Xiangtan. Located in central-eastern Hunan Province (Figure 1), this urban agglomeration stands as the core driver of the province’s economic growth and serves as one of the key engines for Central China’s rise and demonstrates leadership in institutional innovation, industrial transformation and upgrading, ecological development, and coordinated regional development. Situated within a subtropical monsoon climate zone, the area experiences abundant rainfall, exceeding 1300 mm annually. The Xiangjiang River flows northward through Zhuzhou, Xiangtan, and Changsha, spanning roughly 50 km east–west and 90 km north–south across, with a total area of roughly 4500 km2. Although water resources are abundant, water quality in certain river sections is degraded by industrial wastewater, domestic sewage, and agricultural non-point source pollution. In 2024, the annual total phosphorus concentration at the Xiangjiang River’s confluence with Dongting Lake increased by 20.4% compared to the previous year. As Hunan Province’s most densely populated region, the Chang–Zhu–Tan urban agglomeration hosted a population exceeding 14 million by the end of 2024. The local economy centers on manufacturing, services, and agriculture, with ongoing industrial optimization continuously increasing the service sector’s share. In 2024, the agglomeration achieved a Gross Domestic Product (GDP) of approximately ¥2212.8 billion, representing 42% of Hunan Province’s total GDP. Despite this overall economic strength, significant disparities between urban and rural areas within the agglomeration are observed.
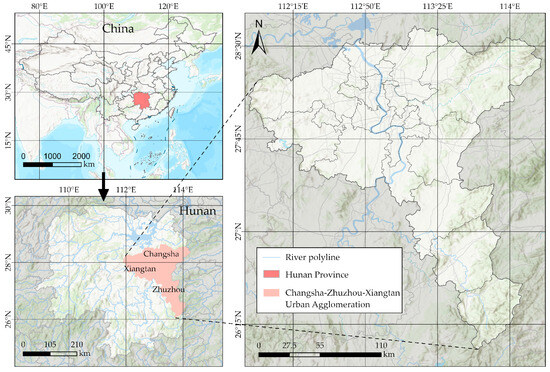
Figure 1.
Geographical location of the Chang–Zhu–Tan urban agglomeration.
The data for this study are sourced from various statistical materials from 2006 to 2022, including the Hunan Provincial Statistical Yearbooks, the statistical yearbooks and water resources bulletins of Changsha, Zhuzhou, and Xiangtan, as well as the Statistical Bulletin on National Economic and Social Development from various districts and counties. Considering the availability of data and the reliability of research results, the interpolation method is employed in this study to fill in some missing values, and 6256 observations from 23 cities are obtained.
2.2. Methods
2.2.1. Entropy Value Method
To ensure the objectivity and scientificity of the results, the entropy weight approach is applied to determine indicator weights for precisely analyzing the relative importance of each WRCC indicator. The particular steps are as follows. First, based on regional characteristics and data availability, indicators are selected from the economic subsystem, population subsystem, water resource subsystem, and environmental subsystem [15]. A comprehensive indicator system is thereby constructed for the WRCC of the Chang–Zhu–Tan urban agglomeration (Table 1).

Table 1.
Comprehensive WRCC index.
Secondly, to eliminate the dimensions of each indicator and unify their variation ranges, the indicator data undergo dimensionless processing prior to calculation. Positive and negative indicators are normalized to their extremes using the following equations [16]:
where denotes the value of the jth indicator in the ith year; and represent the minimum and maximum values of the jth indicator, respectively.
Finally, calculate the information entropy of indicator j to obtain the weight of indicator j:
where represents the feature weight for indicator j.
2.2.2. TOPSIS Model
To analyze the WRCC of the Chang–Zhu–Tan urban agglomeration from 2006 to 2022, the TOPSIS model is utilized. First, process the normalized data matrix using indicator weights from the entropy technique, then estimate the relative proximity to ideal solutions for the annual rankings [17,18]:
where represents the calculation result of the TOPSIS model, with a value range of 0 to 1; the closer the value is to 1, the better the WRCC; and denote the optimal solution and the worst solution, respectively. The calculation formulas for and are as follows:
2.2.3. Kernel Density
To systematically assess the evolution trends of WRCC in the Chang–Zhu–Tan region, kernel density estimation, based on TOPSIS model, is employed to expose the temporal dynamics within the region. Kernel density estimation is a nonparametric estimation approach that estimates the density throughout the entire data space using sample points. The method’s expression is [5]:
where represents the density estimate; denotes the number of sample observations; represents an independent and identically distributed observation (sample point); denotes the point where the density is estimated; and is the bandwidth, a parameter controlling the smoothness of the estimate. The choice of directly determines the level of smoothing; is the kernel function, typically chosen as a Gaussian kernel. The kernel function’s expression is given as follows:
2.2.4. Moran’s I
To examine spatial correlation characteristics of WRCC in the Chang–Zhu–Tan urban agglomeration, spatial autocorrelation analysis is conducted utilizing the global Moran’s I () and local Moran’s I () indices based on TOPSIS model results [19]. The calculation formulas for and are as follows:
where n denotes the total number of spatial units; and represent the attribute values of the ith and jth spatial units, respectively; signifies the mean of attributes across all spatial units; and represents the spatial weight value. When is greater than 0, the data exhibit positive spatial autocorrelation, with larger values indicating stronger spatial association. When is less than 0, the data exhibit negative spatial autocorrelation, with smaller values indicating greater spatial dispersion. When equals 0, the spatial pattern is random. When is greater than 0 and is greater than 0, the region has a high level of economic development, while surrounding areas have a high level of development. When is greater than 0 and is less than 0, the region has a low level of economic development, while surrounding areas have a low level of development. When is less than 0 and is greater than 0, the region has a low level of economic development, while surrounding areas have a high level of development. When is less than 0 and is less than 0, the region has a high level of economic development, while surrounding areas have a high level of development.
2.2.5. Lorenz Curve and Gini Coefficient
To explore the relationship between WRCC and socioeconomic development in the Chang–Zhu–Tan urban agglomeration, the Lorenz curve and Gini coefficient are employed to measure the alignment of these two domains. First, the raw data for the two matching factors are sorted in ascending order, and the cumulative percentage for each factor is determined. This matching relationship is then shown on a Lorenz curve (Figure 2). The degree of variation between the curve and the 45-degree line provides a qualitative investigation of the mismatch between the elements. Next, the Gini coefficient is utilized to quantitatively determine the degree of matching between the factors. The calculation formula is as follows:
where denotes the area enclosed by curve and the line y = x in Figure 2; denotes the area enclosed by curve , the x-axis and x = 1; denotes the Gini coefficient, and is between [0, 1].
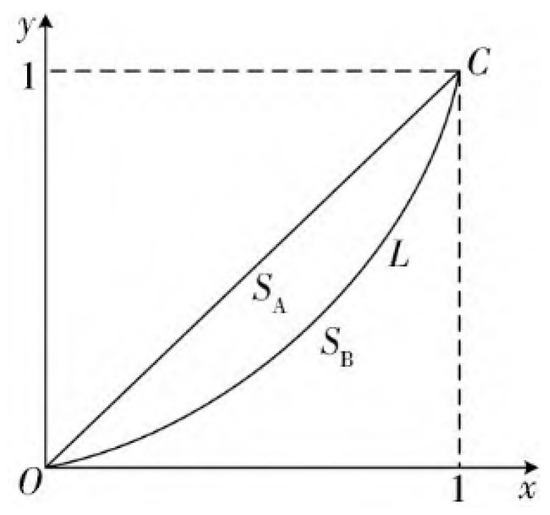
Figure 2.
Lorentz curve.
Since the quantitative relationship between water resources and socioeconomic development factors is not continuous, the trapezoidal area method is employed to calculate the Gini coefficient, expressed as [20]:
where and represent the quantity and cumulative percentage of water resources factors for the first i prefecture-level cities, respectively; and represent the quantity and cumulative percentage of socioeconomic development factors for the first i prefecture-level cities, respectively; n denotes the total number of prefecture-level cities. The Gini coefficient matching grades are classified as shown in Table 2.
Table 2.
Gini coefficient matching grade classification.
2.2.6. Inequality Index
To reveal the balanced and imbalance in the coupling process between water resources and economic development among different cities within the Chang–Zhu–Tan urban agglomeration, the water resources-economic development imbalance index, which has been constructed in existing studies [21], is adopted in this paper. This indicator illustrates regional differences in the matching of water resources with socioeconomic characteristics. The computation formula is as follows:
where is the imbalance index; is the number of regions; denotes the proportion of WRCC in a region; denotes the proportion of economic development factors; is the sum of the distances between a point and the diagonal.
2.2.7. SD Model
To explore the changes in WRCC and its alignment with economic development under various future scenarios, a SD model is developed. Utilizing four subsystems—population, economy, water resources, and environment—the model is employed to simulate and forecast the WRCC of the region for multiple scenarios from 2026 to 2035. The build process is as follows: First, data from 2011 to 2016 is designated as the model training dataset, while data from 2017 to 2022 is used as the model validation dataset. Next, based on the development objectives outlined in the Chang–Zhu–Tan Metropolitan Area Development Plan and the Chang–Zhu–Tan Regional Integration Development Outline, four simulation scenarios are constructed. Finally, parameters for each scenario are input into the SD model to project the WRCC of the urban agglomeration from 2023 to 2035. The four simulation scenarios are defined as follows:
Current Development Scenario
The scenario sets a reference trajectory for the Chang–Zhu–Tan urban agglomeration by extrapolating historical data using established SD model parameters, without external adjustments to individual indicators. It serves as the foundation for comparative analysis versus subsequent regulatory scenarios. The estimate assumes the agglomeration will largely continue to follow recent historical trends in population dynamics, economic growth, industrial structure, and water resource consumption. Under this scenario, population growth, urbanization, economic expansion, and associated resource–environmental stresses evolve in accordance with the model’s inherent growth trajectories.
Economic Priority Development Scenario
The scenario prioritizes fast economic growth and population concentration, anticipating that regional economic prosperity will draw considerable population inflows, further strengthening the urbanization process. Under this trajectory, continuing infrastructure improvements and rising living standards lead to an annual increase in population density of 3~5 people per km2 and a 2~3% annual rise in the urbanization rate, accompanied by domestic water quota increase of 120~150 L. Industrial expansion and increased investment drive rapid growth in the tertiary sector, increasing tertiary industry share by 2~3% annually, while GDP per capita expands by 8~10% annually. Water efficiency improvements lag behind economic growth, with water consumption per 10,000 CNY GDP reducing by only 2~4% annually. Consequently, heightened water demand intensifies pressure on groundwater resources, raising the groundwater extraction rate by 1~3% annually, while increased wastewater discharge strains treatment capacity, leading the wastewater treatment rate to fall by 0.5~1% yearly.
Industrial Restructuring Scenario
The scenario highlights the cultivation of emerging industries and enhancements in resource usage efficiency, predicting a green revolution powered by industrial structure optimization and technological advancement. It claims that an increase in highly educated young populations and heightened public water conservation awareness will contribute to a slight reduction in domestic water quota by 100~120 L, even as annual urbanization rate grow by 3~4%. This trend is marked by expansion in high-value-added emerging industries accompanied by a fall in the industrial sector’s share. The predicted economic outcome is yearly GDP per capita growth of 6~8% and a 2~3% annual rise in the tertiary industry share. Concurrently, the industrial water quota declines by 3~5% yearly, and the promotion of water-saving technologies leads to a 2~3% annual improvement in water resource utilization rate and a 2~4% annual reduction in groundwater extraction rate. Furthermore, industrial restructuring diminishes the agricultural sector’s share, resulting in a 2~4% annual decline in agricultural fertilizer application.
Water Resource Policy Control Scenario
The scenario prioritizes proactive policy intervention to manage water resources, forecasting that the urban agglomeration will restrain its development trajectory through stringent water use controls and environmental governance measures. Under this scenario, uncontrolled urban expansion is curbed, and the application of tiered water pricing reduces the annual growth in population density by 1~2 people per km2, but domestic water quota decreases modestly by 180~200 L. Water-intensive businesses suffer considerable limitations, leading to a 5~8% yearly reduction in industrial water quotas and a corresponding 8~10% annual decline in water consumption per 10,000 CNY GDP. Policy-driven efforts rigorously limit groundwater extraction, resulting in a 4~5% yearly increase in water resource utilization rate and a 5~10% annual drop in groundwater extraction rate. Enhanced wastewater treatment technologies contribute to a reduction in agricultural non-point source pollution, driving wastewater treatment rate higher by 2~3% yearly, and also lead to a 3~5% annual decrease in agricultural fertilizer application rate.
3. Results
3.1. Spatio-Temporal Evolution of WRCC in the Chang–Zhu–Tan Urban Agglomeration
3.1.1. Spatial Pattern Analysis of WRCC
The WRCC of the Chang–Zhu–Tan urban agglomeration is analyzed using the TOPSIS model (Figure 3). The results indicate that the overall performance of the urban cluster is relatively sound with little volatility. However, large discrepancies in WRCC are observed among different districts and counties. Specifically, higher WRCC levels are displayed by major urban districts such as Furong District and Yuhua District, while significantly lower levels are demonstrated by places including Xiangtan County, Ningxiang City, Liuyang City, and Lukou District. The gap is driven by the severe constraints imposed on high-water-consumption and high-pollution industries by central districts. Industry reorganization and upgrading have been pushed by these constraints, effectively reducing industrial water use and wastewater discharge—both of which significantly boost WRCC. This effect is particularly evident in economically developed locations, where industrial transformation maximizes urban water resource capacity. Conversely, a continued reliance on conventional industries is observed in some outlying counties and districts, alongside insufficient development in their resource utilization efficiency. Additionally, lower resource utilization efficiency for outlying urban areas compared to central districts may result from differences in regional water resource management strategies—such as water distribution regulations and water price mechanisms.
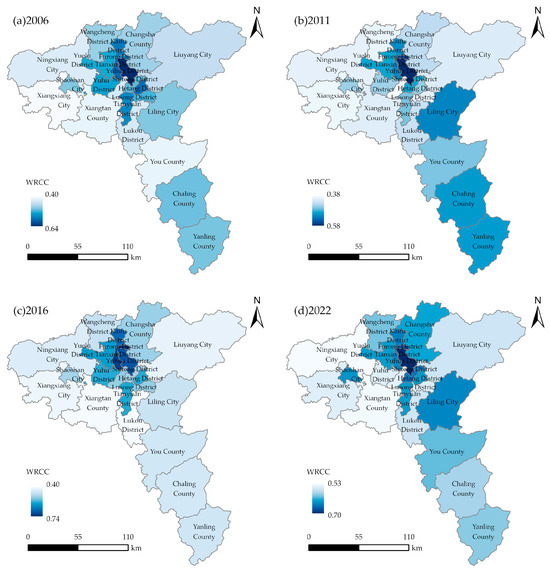
Figure 3.
Spatial distribution and changes in WRCC of the Chang–Zhu–Tan urban agglomeration.
Using the preceding results as a foundation, Moran’s I is employed to assess the spatial autocorrelation of the Chang–Zhu–Tan urban agglomeration’s WRCC. As indicated in Table 3, global Moran’s I remain statistically significant throughout the study period, revealing a considerable positive spatial correlation in the region’s WRCC. Furthermore, the index declined from 0.296 to 0.258, suggesting a steady reduction in spatial reliance. It is demonstrated that places with high and poor WRCC tend to be geographically close, thereby supporting measures such as increased interregional water infrastructure development or enhanced basin-wide management systems. These steps would enable more centralized planning and coordinated allocation of water resources across the region, potentially assisting in the dissolution of administrative impediments. Such efforts could lead to optimized water resource allocation and improved conditions being realized in areas with lesser WRCC.
Table 3.
Global Moran’s I for WRCC.
The local Moran’s I (Figure 4) similarly reveals that most districts and counties belong to the “high–high” or “low–low” categories, demonstrating a distinct spatial positive correlation. Among these districts, relatively high WRCC values are possessed by Furong, Yuhua, Kaifu, Tianxin, and Yuelu, which also form stable clusters of high values through regional synergy. In contrast, Wangcheng District and Changsha County lag behind, and enhancements in water use efficiency and management standards are needed by learning from successful experiences. As a national pilot for comprehensive agricultural water pricing reform, Changsha County pioneered the “Reward for Conservation, Surcharge for Overuse” mechanism, utilizing economic incentives to guide farmers toward water-saving practices. Additionally, the modernization of 12 medium-sized irrigation districts was advanced within the county through government special bonds, resulting in their efficiency transformation from “low-to-high” to “high-to-high” classifications. Industrial restructuring and transformation are actively pursued in Shaoshan City, with vigorous development directed towards low-water-consumption industries such as tourism and cultural industries. Compared to other districts and counties in Xiangtan City that are characterized by high-pollution, water-intensive industries, Shaoshan has emerged as a high-water-resources-carrying-capacity zone, demonstrating strategic foresight in sustainable resource management. reliant on high-pollution, high-water-consumption industrial development. Although WRCC exhibits spatial clustering, the characteristics of this clustering differ over time, suggesting that water resource protection and development strategies across different districts and counties are continually evolving and being adjusted.
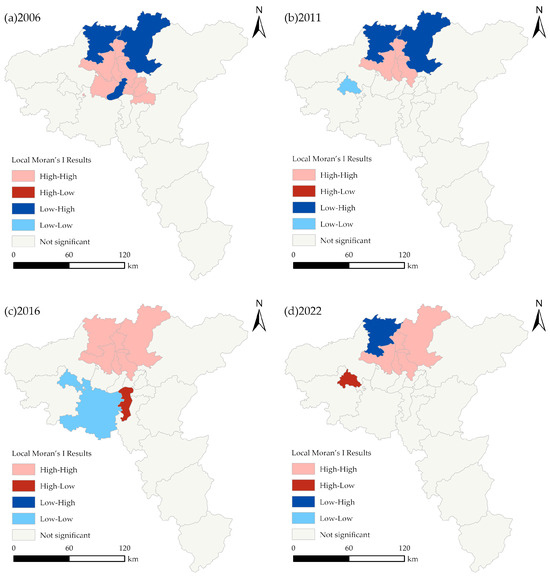
Figure 4.
Local Moran’s I index types for WRCC in the Chang–Zhu–Tan urban agglomeration.
3.1.2. Temporal Evolution of WRCC
Based on the assessment results from the TOPSIS model, the dynamic evolution characteristics of the WRCC within the Chang–Zhu–Tan urban agglomeration (Figure 5) were revealed by applying kernel density estimation with a Gaussian kernel function. The results indicate that, within the sampling period, the distribution of WRCC exhibits three primary trends:
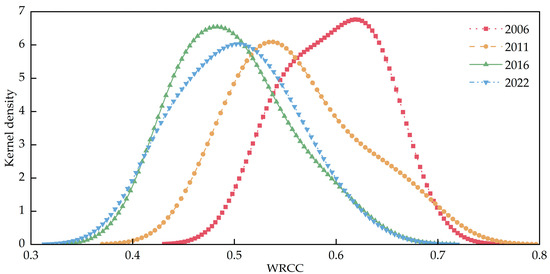
Figure 5.
WRCC kernel density curve.
Distribution location: The peak of the kernel density curve shifted leftward during the sample period, indicating the WRCC of the Chang–Zhu–Tan urban agglomeration decline generally. This decline is likely attributable to rapid urbanization and industrialization, which have driven a sustained increase in water demand and posed significant pressures on water resource supply.
Distribution shape: The peak heights of the nuclear density curve exhibit an alternating pattern of high and low oscillations, with a trend of the falling main peak heights and a narrowing of curve widths towards the end of the sample period. This indicates that the disparities in WRCC among counties and districts within the Chang–Zhu–Tan urban agglomeration are widening. It is inferred that during different stages of economic development, regional mismatches tend to amplify; however, due to the central urban area’s advantages in industrial upgrading, technical innovation, and infrastructure development, technological spillovers, financial support, and management experience sharing may increase WRCC and narrow these geographical gaps in surrounding regions.
Distribution spread: Within the sample period, the kernel density curve exhibits a right-tailed extension, indicating that the presence of a few counties within the region possess significantly higher WRCC compared to others, and the gap of WRCC between these high-performing counties and the regional average is seen to be widening. This pattern reflects the uneven development within the Chang–Zhu–Tan urban agglomeration. Some counties and districts may have pioneered economic structural transformation and upgrading, resulting in a notable increase in water resource utilization efficiency. In contrast, traditional and resource-intensive development models are still depended upon in other counties and districts, which are characterized by low water resource efficiency.
3.2. Matching Degree Between WRCC and Economic Development in the Chang–Zhu–Tan Urban Agglomeration
The calculated Gini coefficients (Table 4) based on the aforementioned methodology and the Lorenz curve (Figure 6) depicting the temporal evolution of the matching degree between WRCC and economic development in the Chang–Zhu–Tan urban agglomeration. As illustrated in Table 4 and Figure 6, a relatively high level of imbalance is indicated by the Lorenz curve notably diverging from the line of equality, with the average Gini coefficient reaching 0.43. Additionally, a transition is revealed over time: the Lorenz curve gradually approaches the diagonal, and the Gini coefficient is seen to decline from 0.64 in 2006 to 0.23 in 2022, corresponding to a transition from “huge gap” to “fair” classification. This trend suggests that the region’s early development was characterized by a significant imbalance between WRCC and economic development. During initial development stages, rapid economic growth drove an accelerated consumption of water resources, exceeding the natural renewal and supply potential of local water sources, thus resulting in a mismatch between WRCC and economic development. At a certain stage of economic development, cross-regional cooperation is fostered. Efficiency improvements in surrounding areas are driven by developed counties and districts through technology transfers and financial support, creating a resource-sharing framework that is designed to mitigate the effects of imbalanced development in individual regions. Simultaneously, economies of scale are leveraged to reduce the unit costs of centralized water supply and sewage treatment, thereby alleviating water scarcity issues that are caused by water quality problems.
Table 4.
Gini of WRCC on economic development.
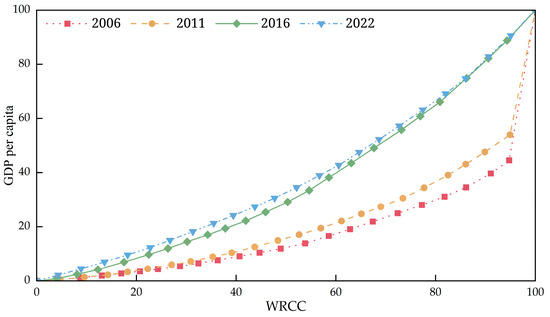
Figure 6.
Lorenz curve of WRCC on economic factors.
Based on the overall evolution trend of alignment between WRCC and economic development, spatial variations in matching levels within the Chang–Zhu–Tan urban agglomeration (Table 5) are then analyzed using the imbalance index and diagonal distance.
Table 5.
WRCC and economic development imbalance index.
- From the perspective of the imbalance index, there are significant spatial disparities in the alignment between WRCC and economic development within the Chang–Zhu–Tan urban agglomeration. Yuhua District (I = 0.194) is significantly higher than the regional average (I = 0.030). Furthermore, Shifeng District (I = 0.039), Liling City (I = 0.034), and Yanling County (I = 0.033) also exceed the regional average, indicating relatively low coordination between WRCC and economic development in these areas.
- From the Euclidean distance measure, most districts and counties are demonstrated to exhibit positive diagonal distances, revealing that WRCC can support local economic development. In contrast, negative diagonal distances are displayed by Yuhua District (d = −3.391), Yuetang District (d = −0.270) and Changsha County (d = −0.207), indicating their economic development has approached or slightly exceeded the WRCC threshold.
It is revealed by the findings that when compared to economic development, investment in water resource conservation and ecological construction in Yuhua District has been relatively insufficient. Concurrently, rising living standards serve to increase domestic water demand, thereby intensifying the mismatch between economic growth and WRCC. As legacy industrial bases, Yuetang District and Changsha County face challenges in rapidly transitioning from extensive water usage patterns, with high water consumption per unit of output value, combined with substantial wastewater, exhaust emissions, and solid waste during production processes, leading to severe water pollution and further reduce available water resources, thereby exacerbating the imbalance.
3.3. Predictive Study on WRCC and Its Alignment with Economic Development in the Chang–Zhu–Tan Urban Agglomeration
3.3.1. Model Building and Validity Testing
By leveraging the proposed WRCC assessment indicator system—comprising four subsystems (population, economy, water resources, and environment)—a WRCC prediction model for the Chang–Zhu–Tan urban agglomeration (Figure 7) is constructed using Vensim PLE system dynamics simulation software. This model facilitates the simulation of interactions among the subsystems and their dynamic evolution over time.
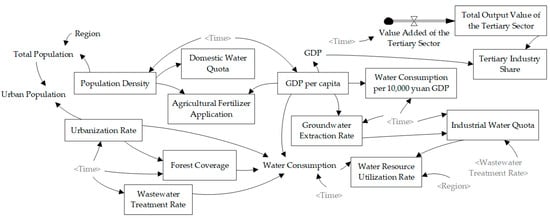
Figure 7.
WRCC prediction model.
Following construction (Figure 7), the accuracy and feasibility of the SD model are validated using the mean absolute percentage error (MAPE) for goodness-of-fit assessment. Error analysis results (Table 6) reveal that MAPE values for representative indicators of all subsystems remain below 6%, with specific values including: 2.19% for urbanization rate, 5.01% for per capita GDP, 5.62% for water resource utilization rate, and 5.57% for sewage treatment rate. Strong agreement between simulation outcomes and historical values [22,23] is demonstrated, confirming the model effectively captures true interactions among internal variables. This validation establishes a reliable foundation for subsequent scenario forecasting and policy simulation.
Table 6.
Validity test results.
3.3.2. Prediction of WRCC for the Chang–Zhu–Tan Urban Agglomeration
The WRCC for the Chang–Zhu–Tan urban agglomeration (2026–2035) (Figure 8) is determined through systematic analysis of expected outcomes for each indicator, with a focus on elucidating evolving features across various scenarios by incorporating WRCC status classification standards (Table 7).

Figure 8.
Predicted WRCC results for each scenario.
Table 7.
Classification of WRCC status.
In Scenario 1 (current development scenario), a significant decline in WRCC is projected, with a transition observed from weak load capacity to an overload state. This outcome is linked to the continuation of current development patterns, where population growth and industrial expansion are anticipated to drive increasing domestic and industrial water demand. However, the existing wastewater treatment capacity is insufficient to support water resource recycling, thereby intensifying pressure on the ecological environment.
In Scenario 2 (economic priority development scenario), the annual decline in WRCC is observed as slower than in Scenario 1, with the state transitioning from critical to overload. Indicating that progress in infrastructure improvements and water management technologies driven by economic growth are inadequate to counterbalance the negative impacts of rapid population concentration and the disproportion of water-intensive industries.
In Scenario 3 (industrial restructuring scenario), the slowest annual decline in WRCC is observed, with the status maintained at a critical level. This indicates that the decline can be effectively mitigated by vigorous promotion of industrial structure transformation towards emerging and tertiary industries, combined with high water-consuming industries, and promoted public water conservation awareness.
In Scenario 4 (Water resource policy control scenario), a consistent annual increase in WRCC is evidenced, with the status transitioning from criticality to weak load capacity. The effectiveness of strict water resource management and control policies in improving WRCC is thus validated. For instance, implementation of a tiered water pricing system and improvement of an over-quota progressive price increase mechanism are explicitly proposed by the Hunan Province 14th Five-Year Plan for Water Resource Allocation and Water Supply. Unreasonable water demand in urban domestic use and industrial production has been effectively curbed through these measures. Meanwhile, access and expansion of water-intensive industries are placed under a more stringent approval framework, and water-saving technological transformation is encouraged for enterprises under the Measures for the Management of Water Conservation in Hunan Province. Consequently, excessive extraction of both surface water and groundwater has been significantly reduced. Collectively, alleviation of the problem of excessive water use and gradual enhancement of water resource management capabilities are demonstrated as outcomes of these initiatives.
3.3.3. Predicting the Alignment Between WRCC and Economic Development in the Chang–Zhu–Tan Urban Agglomeration
Methodologically, Lorenz curves (Figure 9) are plotted based on the calculated cumulative percentages of WRCC and economic factors across different scenarios for the Chang–Zhu–Tan urban agglomeration. Corresponding Gini coefficients (Table 8) are then calculated to assess the alignment between WRCC and economic development. As illustrated in Figure 9, significant deviation of the Lorenz curves from the diagonal line of the coordinate axes was observed, with Scenario 3 exhibiting a substantially greater deviation than the other scenarios. Moreover, the Gini coefficients for the remaining three scenarios are observed to remain at consistently low levels, falling below the historical average. This indicates that, exclusive of the industrial restructuring scenario, coordination between WRCC and economic development is enhanced across the other scenarios. This enhancement is attributable to policy refinements and technological optimizations, which are considered to advance coordinated development. Under Scenario 3, however, significant short-term shifts in water demand structures result in imbalance between WRCC and economic activities, an instability induced by these structural changes.
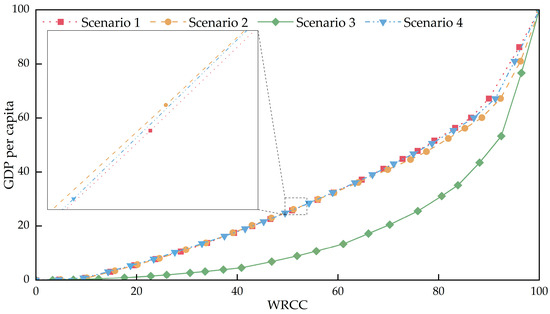
Figure 9.
Lorenz curve of WRCC on economic development in various situations.
Table 8.
Gini of WRCC on economic development in various situations.
4. Discussion
The study of WRCC within the Chang–Zhu–Tan urban agglomeration is conducted utilizing sustainable development indicators. Methods including TOPSIS, kernel density estimation, and Moran’s I index are employed for spatiotemporal analysis of distribution and evolution. Matching qualities with socioeconomic progress are assessed through the application of Lorenz curves, Gini coefficients, and an inequality index. The interactions between socioeconomic activity and water systems are modeled using a SD model, with WRCC and alignment trends forecasted under various scenarios. The findings indicate that the overall WRCC remains acceptable; however, deficiencies have emerged over time, characterized by a declining WRCC and widening regional disparities. Furthermore, a positive spatial correlation is exhibited by the WRCC. While alignment between WRCC and economic development has improved overall, significant regional disparities are observed to persist. Distinct trends in WRCC across different scenarios are revealed by the SD modeling. WRCC is enhanced under the water resource policy control scenario, whereas it is not under the industrial restructuring scenario. The alignment between WRCC and economic development is improved by the other three scenarios. Provision of a theoretical basis for understanding the complex relationship between water resources and socioeconomic factors in the Chang–Zhu–Tan urban agglomeration is achieved by the findings above. Employment of multiple methodologies overcomes limitations of previous WRCC research that often adopted narrow analytical perspectives. The breakthrough of the constructed SD model through static constraints of traditional models enables more effective prediction of complex and dynamic scenarios. Provision of new insights and methodological references for research in related fields is thereby achieved.
Based on the analysis of the evolution trend of WRCC and its matching with economic development in the Chang–Zhu–Tan urban agglomeration, the following suggestions are put forward:
Strengthen the comprehensive management of water resources: Implement water resource management assessment. Led by the Department of Water Resources of Hunan Province, formulate the overall goals for water resource utilization and aquatic ecological governance, decompose the indicators to all districts and counties, and conduct annual assessments; promote the capitalization of water resources, implement a tiered water pricing system for water-intensive enterprises, and charge three times the benchmark water price for water consumption exceeding the quota; launch a sewage treatment campaign, improve the operation and maintenance standards of sewage treatment plant facilities, complete the renovation of old pipelines, and achieve basically full coverage of urban domestic sewage collection pipelines by 2035.
Enhance regional coordinated development: Formulate industrial transfer plans by the Chang–Zhu–Tan Integration Development Leading Group, and support them with a tax revenue sharing policy (the transfer-out regions and undertaking regions share enterprise tax revenue at a ratio of 3:7); encourage talent sharing among Changsha, Zhuzhou, and Xiangtan, provide living subsidies for talents employed across regions, and promote the flow of technical talents to surrounding districts and counties.
Raise public awareness of water conservation: Launch a nationwide water conservation campaign. During the “China Water Week” in March every year, organize water conservation-themed publicity activities to reach communities, schools, and enterprises, and display public welfare advertisements on water conservation in public transportation and building billboards; promote water-saving appliances, collaborate with the water appliance industry and e-commerce platforms, and provide subsidies for residents who purchase water-saving home appliances.
In addition, despite achieving certain results, the study reveals several limitations that require further attention in future work. (1) The evaluation index system for WRCC remains incomplete. Current indicator systems primarily utilize factors from conventional data sources, failing to incorporate all factors that influence the alignment between WRCC and economic development. Particularly for the Chang–Zhu–Tan urban agglomeration, further refinement is needed in evaluation indicators addressing water scarcity issues (e.g., water quality-type shortages). (2) Data collection proved challenging. The study depends on statistical yearbooks and prior research, but the scarcity of county-level data and discontinuous data across years hinder progress in research on WRCC. Future studies could leverage remote sensing and geographic information systems technologies to access more diverse and accurate datasets. (3) The scope of the study is confined solely to the Chang–Zhu–Tan urban agglomeration, with comparative analysis with similar agglomerations being omitted. For a broader-scope study of common characteristics and unique differences in the alignment between WRCC and economic development, the framework would need to be expanded to include the Middle Yangtze River urban agglomeration, the Chengdu urban agglomeration, and the Pearl River Delta urban agglomeration.
Future research focused on the impact of water conservancy projects on the WRCC of the Chang–Zhu–Tan urban agglomeration, particularly examining how site selection differences exacerbate or mitigate water resource inequities across different regions, is warranted. The evaluation of the effectiveness of existing water resource management policies—such as water conservation measures and inter-regional water diversion projects—to determine their success in enhancing alignment between water resources and economic development is essential. The incorporation of comparative analyses across urban agglomerations to explore variations in the intensity of similar influencing factors across different regions and their underlying causes is also recommended.
Author Contributions
X.L. designed the research protocol, supervised and revised the manuscript; X.Y. conducted the research, completed data management and analysis, and drafted and revised the paper. All authors have read and agreed to the published version of the manuscript.
Funding
This research was funded by the General Project of Hunan Provincial Department of Education, China, grant number S202510534164.
Data Availability Statement
The original contributions presented in this study are included in the article. Further inquiries can be directed to the corresponding author.
Conflicts of Interest
The authors declare no conflicts of interest.
References
- Yang, G.; Dong, Z.C.; Feng, S.N.; Li, B.; Sun, Y.R.; Chen, M.F. Early warning of water resource carrying status in Nanjing City based on coordinated development index. J. Clean. Prod. 2021, 284, 124696. [Google Scholar] [CrossRef]
- Wu, C.; Jiang, A.D.; Zheng, W.L. Study on the measures for optimizing China’s provincial territorial space based on the perspective of resource and environmental carrying capacity in the new situation. Sustainability 2022, 14, 13754. [Google Scholar] [CrossRef]
- Wang, Y.X.; Wang, Y.; Su, X.L.; Qi, L.; Lin, M. Evaluation of the comprehensive carrying capacity of interprovincial water resources in China and the spatial effect. J. Hydrol. 2019, 575, 794–809. [Google Scholar] [CrossRef]
- Lu, L.N.; Lei, Y.L.; Wu, T.; Chen, K.Y. Evaluating water resources carrying capacity: The empirical analysis of Hubei Province, China 2008–2020. Ecol. Indic. 2022, 144, 109454. [Google Scholar] [CrossRef]
- Jiang, H.Y.; He, G. Analysis of spatial and temporal evolution of regional water resources carrying capacity and influencing factors—Anhui Province as an example. Sustainability 2023, 15, 11255. [Google Scholar] [CrossRef]
- Zhang, Y.; Khan, S.U.; Swallow, B.; Liu, W.X.; Zhao, M.J. Coupling coordination analysis of China’s water resources utilization efficiency and economic development level. J. Clean. Prod. 2022, 373, 133874. [Google Scholar] [CrossRef]
- Wang, G.; Xiao, C.L.; Qi, Z.W.; Meng, F.N.; Liang, X.J. Development tendency analysis for the water resource carrying capacity based on system dynamics model and the improved fuzzy comprehensive evaluation method in the Changchun city, China. Ecol. Indic. 2021, 122, 107232. [Google Scholar] [CrossRef]
- Yan, B.; Xu, Y. Evaluation and prediction of water resources carrying capacity in Jiangsu Province, China. Water Policy 2022, 24, 324–344. [Google Scholar] [CrossRef]
- Lv, B.; Liu, C.R.; Li, T.X.; Meng, F.X.; Fu, Q.; Ji, Y.; Hou, R.J. Evaluation of the water resource carrying capacity in Heilongjiang, eastern China, based on the improved TOPSIS model. Ecol. Indic. 2023, 150, 110208. [Google Scholar] [CrossRef]
- Zhou, X.Y.; Lei, K.; Meng, W.; Khu, S.T.; Zhao, J.; Wang, M.N.; Yang, J.F. Space–time approach to water environment carrying capacity calculation. J. Clean. Prod. 2017, 149, 302–312. [Google Scholar] [CrossRef]
- Cheng, K.; Fu, Q.; Meng, J.; Li, T.X.; Pei, W. Analysis of the spatial variation and identification of factors affecting the water resources carrying capacity based on the cloud model. Water Resour. Manag. 2018, 32, 2767–2781. [Google Scholar] [CrossRef]
- Yang, L.; Pan, Z.W.; Li, H.; Wang, D.J.; Wang, J.; Wu, C.C.; Wu, X.J. Study on the spatiotemporal evolution and driving factors of water resource carrying capacity in typical arid regions. Water 2024, 16, 2142. [Google Scholar] [CrossRef]
- Zuo, Q.T.; Zhang, Z.Z.; Ma, J.X. Relationship between water resource utilization level and socio-economic development in the Yellow River Basin. China Popul. Resour. Environ. 2021, 31, 29–38. (In Chinese). Available online: https://www.cprepublishing.cn/thesisDetails#10.12062/cpre.20210107 (accessed on 28 October 2025).
- Zhao, X.L.; Fan, X.H.; Liang, J.C. Kuznets type relationship between water use and economic growth in China. J. Clean. Prod. 2017, 168, 1091–1100. [Google Scholar] [CrossRef]
- Yu, Y.; Mou, Q.; Min, X.F.; Zhao, Y.; Li, Z.L. Study on water resource carrying capacity simulation in megacities based on entropy-weighted TOPSIS-SD model. Yangtze River 2024, 55, 148–156+175. (In Chinese). Available online: https://link.cnki.net/doi/10.16232/j.cnki.1001-4179.2024.12.020 (accessed on 28 October 2025).
- Song, Q.R.; Wang, Z.C.; Wu, T.H. Risk analysis and assessment of water resource carrying capacity based on weighted gray model with improved entropy weighting method in the central plains region of China. Ecol. Indic. 2024, 160, 111907. [Google Scholar] [CrossRef]
- Li, Q.; Liu, Z.; Yang, Y.; Wang, X. Evaluation of water resources carrying capacity in Tarim River Basin under game theory combination weights. Ecol. Indic. 2023, 154, 110609. [Google Scholar] [CrossRef]
- Zhou, T.; Lin, T.; Cheng, R.L.; Wang, G.Q.; Jiang, B. An integrated approach for spatio-temporal assessment and attribution of water resources carrying capacity: Incorporating AHP, TOPSIS, and lorenz asymmetry coefficient methods. J. Hydrol. 2025, 650, 132536. [Google Scholar] [CrossRef]
- Liu, Y.; Quan, Q.; Wang, F.; Wang, C.; Meng, Z. Evaluation and space-temporal evolution analysis of comprehensive carrying capacity in Chengdu urban agglomeration. In Proceedings of the International Conference on Management Science and Engineering Management 2018, Melbourne, VIC, Australia, 1–4 August 2018; Springer International Publishing: Cham, Switzerland, 2018; pp. 1205–1221. [Google Scholar] [CrossRef]
- Yan, B.; Yuan, Z.; Luo, Q.; Li, J.Q.; Zhai, X.J.; Zhang, X.; Zhang, L.G. The matching degree of water resources and social economy-ecology-energy in the Yangtze River economic belt. J. Coast. Res. 2020, 104, 535–540. [Google Scholar] [CrossRef]
- Chen, Y.Z.; Lu, H.W.; Li, J.; Yang, Y.Y.; Xia, J. Multi-criteria decision making and fairness evaluation of water ecological carrying capacity for inter-regional green development. Environ. Sci. Pollut. Res. 2021, 28, 6470–6490. [Google Scholar] [CrossRef]
- Liu, B.; Qin, X.S.; Zhang, F.L. System-dynamics-based scenario simulation and prediction of water carrying capacity for China. Sustain. Cities Soc. 2022, 82, 103912. [Google Scholar] [CrossRef]
- Wang, Z.Y.; Fu, X.T. Scheme simulation and predictive analysis of water environment carrying capacity in Shanxi Province based on system dynamics and DPSIR model. Ecol. Indic. 2023, 154, 110862. [Google Scholar] [CrossRef]


Disclaimer/Publisher’s Note: The statements, opinions and data contained in all publications are solely those of the individual author(s) and contributor(s) and not of MDPI and/or the editor(s). MDPI and/or the editor(s) disclaim responsibility for any injury to people or property resulting from any ideas, methods, instructions or products referred to in the content. |
© 2025 by the authors. Licensee MDPI, Basel, Switzerland. This article is an open access article distributed under the terms and conditions of the Creative Commons Attribution (CC BY) license (https://creativecommons.org/licenses/by/4.0/).